Embed Size (px)
Citation preview

Trinity UniversityDigital Commons @ Trinity
School of Business Faculty Research School of Business
Spring 2008
Evidence on the Audit Risk Model: Do AuditorsIncrease Audit Fees in the Presence of InternalControl Deficiencies?Chris E. Hogan
Michael S. WilkinsTrinity University, [email protected]
Follow this and additional works at: https://digitalcommons.trinity.edu/busadmin_faculty
Part of the Business Commons
This Article is brought to you for free and open access by the School of Business at Digital Commons @ Trinity. It has been accepted for inclusion inSchool of Business Faculty Research by an authorized administrator of Digital Commons @ Trinity. For more information, please [email protected].
Repository CitationHogan, C.E., & Wilkins, M.S. (2008). Evidence on the audit risk model: Do auditors increase audit fees in the presence of internalcontrol deficiencies? Contemporary Accounting Research, 25(1), 219-242. doi: 10.1506/car.25.1.9
Contemporary Accounting Research
Vol. 25 No. 1 (Spring 2008) pp. 219–42 © CAAA
doi:10.1506/car.25.1.9
Evidence on the Audit Risk Model: Do Auditors Increase Audit Fees in the Presence of Internal
Control Deficiencies?*
CHRIS E. HOGAN,
Michigan State University
MICHAEL S. WILKINS,
Texas A&M University
1. Introduction
Internal controls over financial reporting (ICOFR) should provide reasonableassurance about the reliability of financial statements by setting in place policiesand procedures related to maintaining accounting records, authorizations, andsafeguarding of assets.
1
For such controls to be effective, they should ensure, to thegreatest extent possible, that material financial statement misstatements either can-not occur within a given functional area or will be detected and corrected by manage-ment before financial reports are issued. If ICOFR cannot provide this assurance, itis widely assumed that financial reporting quality will suffer. This assumptionunderlies many of the provisions of the Sarbanes-Oxley Act (SOX) of 2002,including the requirement that managers attest to the effectiveness of ICOFR.
Although it may seem reasonable to assume that internal control deficienciesand “bad accounting” go hand in hand, we contend that strong internal controls arenot necessary for reporting to be in compliance with generally accepted accountingprinciples (GAAP). Stated differently, financial reports are not generated in a vac-uum; rather they are a joint product of management and an independent auditor.The audit risk model — which provides a framework for evaluating the relation-ship between overall audit risk, inherent risk, control risk, and detection risk —proposes that even when internal control deficiencies (ICD) are identified, auditorscan still provide an unqualified opinion by increasing their substantive testing.More formally, when either inherent risk or control risk increases, auditors canreduce detection risk by increasing substantive testing (in order to maintain a desiredlevel of overall audit risk). Our purpose in this paper is to determine whether theaudit risk model is descriptive of what occurs in practice. In other words, does therelationship between fees and ICDs suggest that audit firms exert more effort intheir audits of firms that subsequently disclose internal control deficiencies?
* Accepted by Michael Willenborg. We gratefully acknowledge the helpful comments and sugges-tions of two anonymous reviewers, Hemang Desai, Neil Fargher, Steve Fortin, Audrey Gramling,Brian Mayhew, Linda Myers, Mark Nigrini, Tom Omer, Jaime Schmidt, Senyo Tse, Michael vanBreda, workshop participants at Indiana University, Michigan State University, Texas A&M Uni-versity, Texas Tech University, and the University of Houston, and participants at the 2005 Haskell& White Corporate Governance Seminar, the 2005 Canadian Academic Accounting AssociationConference, and the 2005 American Accounting Association Annual Meeting for helpful com-ments and suggestions.
220 Contemporary Accounting Research
CAR
Vol. 25 No. 1 (Spring 2008)
Prior studies examining the relationship between risk factors and auditor effortfind mixed evidence on whether auditors’ behavior is actually consistent with theaudit risk model. Studies such as Mock and Wright 1993, Mock and Wright 1999,and Bedard 1989 use data from the working papers of actual audit engagementsand examine the association between client risks and variations in audit plans. Theoverall conclusion of this research is that audit plans in practice are not stronglyrisk-adjusted; however, many of these studies are limited to small sample sizes andevidence from one audit firm. Studies examining the sensitivity of audit hours oraudit fees to various risk factors do find evidence of a relationship between auditeffort and inherent risk, but no evidence that audit effort is sensitive to reliance oninternal controls (Felix, Gramling, and Maletta 2001; Hackenbrack and Knechel1997; O’Keefe, Simunic, and Stein 1994). It is worth noting that these studies alluse data from time periods prior to the most recent round of high-profile accountingscandals, and prior to the Sarbanes-Oxley Act of 2002. It is possible, therefore, thatthese events have increased auditors’ sensitivity to control risk. In addition, whereasthe above studies rely on data from one particular audit firm, a benefit of using theSOX disclosures to examine audit fees and internal control weaknesses is that wecan provide a comparison of the response across various measures of audit quality.
We examine audit fees in the fiscal year prior to disclosure of internal controldeficiencies for a sample of firms that disclosed deficiencies between November2003 and November 2004, and for a comparison sample that did not report controldeficiencies. Our approach differs from studies examining the increase in auditfees as a result of SOX section 404 disclosures (Raghunandan and Rama 2006) inthat we use the SOX section 302 disclosures and audit fees in prior periods in aneffort to measure the auditor’s response to increased control risk rather than incre-mental audit fees resulting from the documentation and testing efforts related toSOX section 404.
Our tests indicate that, after controlling for various factors known to affectaudit fees (including measures of inherent risk and information risk), audit fees inthe fiscal year preceding the year in which the internal control problem was disclosedare significantly higher for ICD firms. The fee effect is economically significant aswell, because the average firm pays an additional 35 percent in audit fees wheninternal control deficiencies are present. Finally, we show that audit fees areincreasing in the severity of the underlying internal control problems. Thus, auditfirms do seem to increase their fees when control deficiencies exist, particularly incases where the problems are the most severe. To the extent that audit fees proxyfor audit effort — which has been found to be the case in studies with data avail-able for both auditor labor hours and audit fees (Bell, Landsman, and Shackleford2001; Bedard and Johnstone 2006) — our results suggest that auditors increasetheir effort in the presence of increased control risk. However, we cannot rule outthe alternative explanation that the fee increase is due primarily to a risk premiumassociated with ICD firms.
We provide additional insights into the differences in auditors’ responses tocontrol risk across various partitions of audit quality. We find that audit fees aresignificantly higher for ICD client firms, whether or not they hire a Big 4 auditor,
Evidence on the Audit Risk Model 221
CAR
Vol. 25 No. 1 (Spring 2008)
although the incremental fee for clients of Big 4 auditors is significantly higherthan the incremental fee for clients of non–Big 4 auditors. In addition, audit feesare significantly higher for ICD firms that are in the initial or second year with anaudit firm, relative to ICD firms that have been with their auditors for more thantwo years. Finally, the incremental fee is highest for ICD client firms that previ-ously had Arthur Andersen as an auditor in 2000 or 2001. All of these findingssuggest that auditor responses to increased control risk vary on the basis of auditortype and tenure.
Our findings are important in light of recent research documenting that firmsreporting internal control weaknesses have lower accruals quality (Ashbaugh-Skaife, Collins, Kinney, and LaFond 2007 [ACKL]; Doyle, Ge, and McVay 2007)[DGM]. One interpretation of the lower accruals quality findings relative to theaudit process is that auditors may not be detecting and /or correcting the lowerearnings quality that potentially results from poor internal controls. An alternativeexplanation is that auditors do recognize the increased control risk and extend theirefforts appropriately, and that the documented accruals are at least in part a mani-festation of higher levels of information risk (e.g., Francis, LaFond, Olsson, andSchipper 2005).
2
We include abnormal accruals in our fee model as a measure ofinformation risk and find that audit fees increase significantly with abnormalaccruals. Although we cannot draw any conclusions on overall audit quality, ourresults at least suggest that auditors are sensitive to both increased control risk andincreased inherent and/or information risk, and respond by increasing audit fees.
The remainder of the paper is structured as follows. In the next section wediscuss background information related to the audit risk model, internal controlrequirements and disclosures, as well as SOX sections 302 and 404. We then detailour sample selection procedure and present descriptive statistics. In the remainingsections we present our empirical results and discuss our conclusions.
2. Background
The audit risk model
The audit risk model, discussed in
Statement on Auditing Standards
(
SAS
)
No. 47
(American Institute of Certified Public Accountants [AICPA] 1983), is stated asfollows:
Audit Risk
�
Inherent Risk
�
Control Risk
�
Detection Risk
.
Both inherent risk and control risk are documented by the auditor on the basis ofan assessment of the client. In order to maintain overall audit risk at an acceptablelevel in the face of high inherent risk and /or control risk, auditors must reducedetection risk. Detection risk is reduced by increasing substantive testing. Auditingstandards specifically provide for additional substantive testing when auditors con-clude that internal controls cannot be relied on (see
SAS No. 55
[AICPA 1989] and
SAS No. 78
[AICPA 1996]).Prior studies focusing on audit programs have found mixed results with
respect to whether auditors actually increase substantive testing when risk factors
222 Contemporary Accounting Research
CAR
Vol. 25 No. 1 (Spring 2008)
are present. Mock and Wright (1999) focus on accounts receivable data fromactual audit engagements and do not find much evidence of an association betweenclient risks and audit plans (most of the risk factors relate to inherent risk, but theauthors do include a numerical measure of control risk). Mock and Wright (1999)document some evidence of variation in the nature of testing, but not the extent oftesting, across time in response to changes in risk factors. Their overall conclusionis that in practice, audit plans are not strongly risk-adjusted. These conclusions areconsistent with those of earlier studies using data from actual audit engagements(e.g., Bedard 1989; Mock and Wright 1993).
O’Keefe et al. (1994) use data from one audit firm and document that bothaudit hours and the mix of labor are sensitive to client size, complexity, leverage,and inherent risk. Interestingly, they do not find evidence of an associationbetween audit hours or mix of labor inputs and reliance on internal controls, sug-gesting that audit effort varies with changes in inherent risk but not control risk.Similarly, Hackenbrack and Knechel (1997) and Felix et al. (2001) do not find arelationship between audit effort and control reliance.
The evidence from previous research is mixed with respect to the relationshipbetween audit effort and inherent risk, and there is very little evidence that auditeffort is sensitive to changes in control risk. However, there are several reasonswhy we might expect things to be different in the current audit and regulatory envi-ronment. The accounting scandals at large publicly traded firms (e.g., Enron andWorldcom), the demise of Arthur Andersen, and the passage of the Sarbanes-OxleyAct of 2002 would all be expected to increase auditors’ sensitivity to the risk ofmaterial financial statement errors and irregularities. For all of these reasons, webelieve it is important to revisit the issue of auditors’ responses to internal controldeficiencies.
Internal control deficiency disclosures and related research
Two sections of the Sarbanes-Oxley Act relate specifically to internal control. SOXsection 302, which was finalized and implemented on August 29, 2002, requiresmanagement to certify in quarterly and annual reports that disclosure control pro-cesses and procedures have been designed and implemented, to conclude on theeffectiveness of disclosure controls, and to disclose any material changes to inter-nal control over financial reporting during the quarter (this last requirement was amodification of the original SOX section 302 rule and became effective August 14,2003). SOX section 404 requires management of publicly traded companies toreport on the effectiveness of ICOFR on an annual basis.
3
In addition, section 404requires external auditors to audit and report on the effectiveness of ICOFR,including management’s assessment process. SOX section 404 became effectivefor fiscal years ending on or after November 15, 2004 for accelerated filers. TheSarbanes-Oxley disclosures allow us to identify a broad sample of clients withhigh control risk, and thereby allow us to examine the sensitivity of audit fees tothe severity of control deficiencies.
Raghunandan and Rama (2006) and Hoitash, Hoitash, and Bedard (2005) doc-ument significantly higher audit fees for a sample of accelerated filers for the fiscal
Evidence on the Audit Risk Model 223
CAR
Vol. 25 No. 1 (Spring 2008)
2004 audit relative to the fiscal 2003 audit both for firms disclosing material weak-nesses under SOX section 404 and for firms that do not disclose weaknesses. Thisresult would be expected, given the incremental testing and documentation neces-sary to prepare the SOX section 404 reports. These studies also find that audit feesare significantly higher in fiscal 2004 for firms disclosing material weaknesses.
Another stream of research that has emerged as a result of the Sarbanes-Oxleyinternal control disclosures examines the characteristics of firms reporting controldeficiencies. Both ACKL and DGM provide evidence that accruals quality is lowerfor firms disclosing control deficiencies. As discussed earlier, there are at least twopotential explanations for these findings. One possibility is that poor internal controlsresult in poor accruals quality, and auditors are either not detecting or not correct-ing potential errors or misstatements. In this scenario, it is less likely that auditplans are materially risk-adjusted. Another possibility is that auditors do recognizethe increased control risk and attempt to adjust their procedures accordingly toincrease the likelihood of detecting potential errors or misstatements, which is therelationship of interest in this paper.
3. Sample and descriptive statistics
Sample characteristics
We initially collected a sample of firms highlighted by Compliance Week as dis-closing internal control weaknesses and/or significant deficiencies. ComplianceWeek searches disclosures made in 10Q and 10K filings, 8-K filings, and prospec-tuses, and distributes the information monthly. The disclosures during our timeperiod are from the SOX section 302 certifications or 8-K disclosures rather thanbeing “early adopters” of SOX section 404, although certainly many of the defi-ciencies were detected during the SOX section 404 testing phase.
4
We do not usethe SOX section 404 disclosures because the audit fees during the 2004 and 2005time period primarily would reflect documentation and remediation efforts (asshown by Raghunandan and Rama 2006 and Hoitash et al. 2005) rather thanincreased substantive testing. Thus, we use financial data and audit fees from theperiod prior to the SOX section 302 disclosure. A maintained assumption in ourapproach is that the internal control deficiency existed in the fiscal year prior to thedisclosure under SOX section 302, which seems likely given our reading of thedisclosures.
5
Many firms state that their independent auditors notified managementof the deficiency in conjunction with the prior period audit (also see the GlassLewis & Co. 2005 report).
6
For the period between November 1, 2003 and November 30, 2004, Compli-ance Week lists a total of 529 new disclosures or material updates. Of these 529disclosures, a total of 452 are from firms that are covered by the COMPUSTATdatabase. After eliminating cases where firms disclosed updates to an originalinternal control disclosure, the available sample includes a total of 410 uniquefirms. The disclosure firms come from a broad range of industries. Only five two-digit Standard Industrial Classification (SIC) code industries comprise more than 5percent of the total observations, with the greatest concentration coming from SIC
224 Contemporary Accounting Research
CAR
Vol. 25 No. 1 (Spring 2008)
code 73 (Business Services, 18 percent of observations) and SIC code 36 (Electronicand Other Electrical Equipment and Components, Except Computer Equipment,11 percent of observations). The average number of disclosures per month fromthe set of 410 unique firms is 31.53, with the minimum number being 11 inNovember 2003 and the maximum being 102 in November 2004. The number ofdisclosures generally increased each month over this time period as companiesperformed their SOX section 404 testing. Sample disclosures are included inAppendix 1.
To assess the relationship between internal control problems and audit fees forour sample firms, we benchmark against a set of control firms that are not includedin Compliance Week’s list of companies disclosing significant deficiencies ormaterial weaknesses. We match each sample observation with all same-two-digitindustry observations for the fiscal year preceding the internal control disclosure.To be included in our final sample, both the sample firms and their correspondingindustry firms must have sufficient data from COMPUSTAT and Audit Analyticsto estimate our multivariate models.
7
After incorporating all of these data restric-tions and removing sample and control observations with two-digit SIC codesbetween 60 and 69, our final sample is reduced from 410 ICD observations to 284ICD observations having 6,451 matched industry observations.
8
We only allow thematched firms to be included once per year rather than multiple times per year as amatch for several firms. Data for approximately 62 percent of these observationsare drawn from 2003, with 26 percent and 12 percent coming from 2002 and 2004,respectively, where the 2004 observations are firms with fiscal year-ends in 2004(e.g., June 30) that report a deficiency prior to November 30, 2004.
Basic financial data
Table 1 presents descriptive statistics for both the ICD firms and the industry com-parison firms. Panel A focuses on financial statement data and shows that ICDfirms are significantly smaller, less profitable, and less liquid than their industrycounterparts and also have lower cash flow from operations. For example, ICDfirms have a median return on assets (ROA) of 0.020 (mean of
�
0.096), comparedwith 0.041 (mean of
�
0.046) for industry match firms. Similarly, the median quickratio for sample firms is 1.179 (mean of 1.847), compared with 1.512 (2.599) forindustry match firms. These findings are consistent with performance and size dif-ferences documented in Ashbaugh-Skaife, Collins, and Kinney 2007 and Doyle,Ge, and McVay 2007, and suggest that firms disclosing internal control problemsdo seem to be “worse off” than other firms in their respective industries.
We calculate the absolute value of performance-adjusted abnormal accruals(
ABSAAC
), as defined by ACKL.
9
It is measured as the difference between thefirm-specific residual from our accruals model, (1), below, and the median firm-specific residual associated with peer firms in the same corresponding two-digitSIC/ROA decile in year
t
�
1:
TotalAccruals/lag1asset
�
�
0
�
�
1
(1/
lag1asset
)
�
�
2
(
�
REV/lag1asset
�
�
AR/lag1asset
)
�
�
3
PPE/lag1asset
�
�
(1).
Evidence on the Audit Risk Model 225
CAR
Vol. 25 No. 1 (Spring 2008)
In this specification,
TotalAccruals
is COMPUSTAT data item #123 in year
t
minus COMPUSTAT data item #308 in year
t
,
lag1asset
is COMPUSTAT dataitem #6 in year
t
�
1,
�
REV
is the change in COMPUSTAT data item #12 fromyear
t
�
1 to year
t
,
�
AR
is the change in COMPUSTAT data item #2 from year
t
�
1 to year
t
, and
PPE
is COMPUSTAT data item #8 in year
t
. The model is esti-mated separately for each two-digit SIC code/year combination.
10
We also includethe five-year variance of
ROA
(
ROAVAR
) as an additional risk proxy.
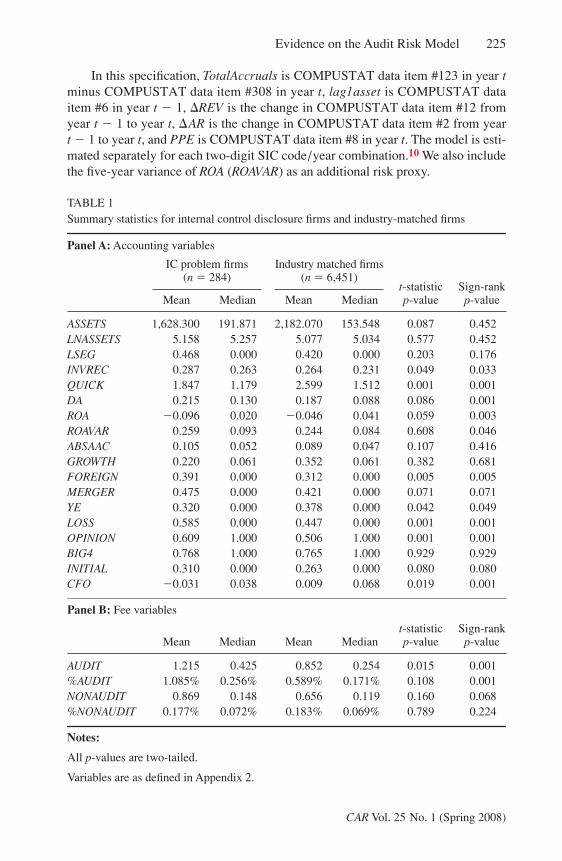
TABLE 1
Summary statistics for internal control disclosure firms and industry-matched firms
Panel A:
Accounting variables
ASSETS
1,628.300 191.871 2,182.070 153.548 0.087 0.452
LNASSETS
5.158 5.257 5.077 5.034 0.577 0.452
LSEG
0.468 0.000 0.420 0.000 0.203 0.176
INVREC
0.287 0.263 0.264 0.231 0.049 0.033
QUICK
1.847 1.179 2.599 1.512 0.001 0.001
DA
0.215 0.130 0.187 0.088 0.086 0.001
ROA
�
0.096 0.020
�
0.046 0.041 0.059 0.003
ROAVAR
0.259 0.093 0.244 0.084 0.608 0.046
ABSAAC
0.105 0.052 0.089 0.047 0.107 0.416
GROWTH
0.220 0.061 0.352 0.061 0.382 0.681
FOREIGN
0.391 0.000 0.312 0.000 0.005 0.005
MERGER
0.475 0.000 0.421 0.000 0.071 0.071
YE
0.320 0.000 0.378 0.000 0.042 0.049
LOSS
0.585 0.000 0.447 0.000 0.001 0.001
OPINION
0.609 1.000 0.506 1.000 0.001 0.001
BIG4
0.768 1.000 0.765 1.000 0.929 0.929
INITIAL
0.310 0.000 0.263 0.000 0.080 0.080
CFO
�
0.031 0.038 0.009 0.068 0.019 0.001
Panel B:
Fee variables
AUDIT
1.215 0.425 0.852 0.254 0.015 0.001
%AUDIT
1.085% 0.256% 0.589% 0.171% 0.108 0.001
NONAUDIT
0.869 0.148 0.656 0.119 0.160 0.068
%NONAUDIT
0.177% 0.072% 0.183% 0.069% 0.789 0.224
Notes:
All
p-values are two-tailed.
Variables are as defined in Appendix 2.
IC problem firms(n � 284)
Industry matched firms(n � 6,451)
t-statisticp-value
Sign-rankp-valueMean Median Mean Median
Mean Median Mean Mediant-statisticp-value
Sign-rankp-value
226 Contemporary Accounting Research
CAR Vol. 25 No. 1 (Spring 2008)
Table 1 shows, consistent with ACKL, that ICD firms have higher values ofABSAAC than control firms. Our mean values of 0.105 and 0.089, respectively, arealmost identical to those reported by ACKL (0.107 and 0.093). The five-year ROAvariance for ICD firms (mean of 0.259, median of 0.093) is also higher than it isfor industry match firms (mean of 0.244, median of 0.084). Although only theparametric test shows a significant difference for ABSAAC and only the nonpara-metric test shows a significant difference for ROAVAR, our findings are generallyconsistent with ACKL and DGM and suggest that internal control weakness firmsare likely to have higher levels of inherent and/or information risk.
Audit fees
In panel B of Table 1 we present a univariate analysis of audit and nonaudit feedata. As with our other variables, the fee data come from the year preceding theICD disclosure in order to minimize the likelihood that the relationships we doobserve might be attributable to ICD documentation or remediation efforts. Themean audit fee (AUDIT) of over $1.2 million for internal control problem firms issignificantly larger (p � 0.015) than the mean of $852,000 for the industry matchfirms, and the median of $425,000 for internal control problem firms is signifi-cantly larger (p � 0.001) than the industry median of $254,000. It is important tonote that these relationships hold even though panel A of Table 1 shows that inter-nal control problem firms in general are smaller than their industry counterparts.To further illustrate the difference between audit fees among these two sets offirms, we also calculate the audit fee as a percentage of total client assets(%AUDIT ). The mean value of %AUDIT for internal control problem firms isalmost double that of the industry match firms, and the median value is signifi-cantly higher as well (median of 0.256 percent versus 0.171 percent). In contrast tothe relationships for audit fees, no consistent significant differences are observedfor either total nonaudit fees (NONAUDIT) or nonaudit fees as a percentage oftotal assets (%NONAUDIT). Overall, these data suggest that auditors increase theirfees — on both a relative and absolute basis — in audits of firms with internal con-trol problems. However, no consistent significant differences are observed withrespect to nonaudit work.
Severity of internal control problems
Material weaknesses versus significant deficiencies
Disclosures of internal control problems made under SOX section 302 vary bytype of problem and severity. To the extent that the severity or type of problem alsoaffects audit fees, it is important to examine various subgroups of the sample firms.One of the most important distinctions likely is between firms reporting materialweaknesses versus those reporting only significant deficiencies. Hammersley, Myers,and Shakespeare (2008) find that market reactions to the disclosure of a materialweakness are significantly more negative than market reactions to the disclosure ofa significant deficiency, consistent with investors being more concerned about thepotential for material misstatements when material weaknesses are disclosed.
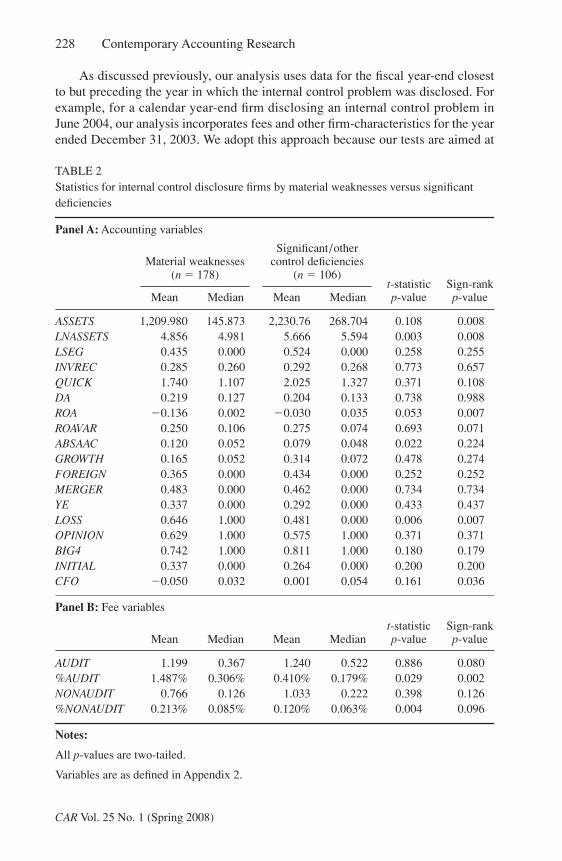
Evidence on the Audit Risk Model 227
CAR Vol. 25 No. 1 (Spring 2008)
In Table 2, we investigate differences in our summary measures for ICD firmsbased on whether a material weakness was reported. Table 2 shows that the 178ICD firms reporting material weaknesses tend to be smaller and less profitable thanthe 106 ICD firms not reporting material weaknesses (i.e., reporting significantdeficiencies or other control deficiencies). Furthermore, audit fees as a percentageof total assets are significantly higher among material weakness firms than amongnonmaterial weakness firms. The mean audit fee as a percentage of assets paid bymaterial weakness firms is more than three times as large as the correspondingvalue for nonmaterial weakness firms (1.487 percent versus 0.410 percent, respec-tively). Nonaudit fees as a percentage of total assets are also significantly larger formaterial weakness firms relative to nonmaterial weakness firms, even though thelevel of nonaudit fees is not significantly different across the two groups, and therewere no consistently significant differences in nonaudit fees for the full sampleof ICD firms relative to non-ICD firms in Table 1. These findings suggest thatdistinguishing between the presence of material weaknesses versus significantdeficiencies is likely to be important in our multivariate tests.
4. Multivariate analysis of audit fees
Overview
The results from our univariate tests in Table 1 suggest that audit fees are higherfor ICD firms than for industry match firms. Our first purpose in this section is todetermine whether the observed fee differences hold after controlling for other fac-tors known to influence audit fees. We then extend the model to accommodate theseverity of the internal control problems and, ultimately, characteristics of the auditthat might be important in evaluating the relationship between ICDs and audit fees.Our maintained hypothesis in these models is that higher fees are likely to existamong ICD firms as auditors attempt to maintain an acceptable overall level ofaudit risk (see SAS No. 55 (AICPA 1989) and SAS No. 78 (AICPA 1996)). If test-ing is extended, the final figures reported in the income statement and balancesheet should fairly represent (in all material respects) the client’s financial positioneven if weak internal controls originally resulted in errors or irregularities. How-ever, ceteris paribus, the extra procedures should result in higher fees, particularlyin cases where internal control deficiencies are most severe.
Basic fee model
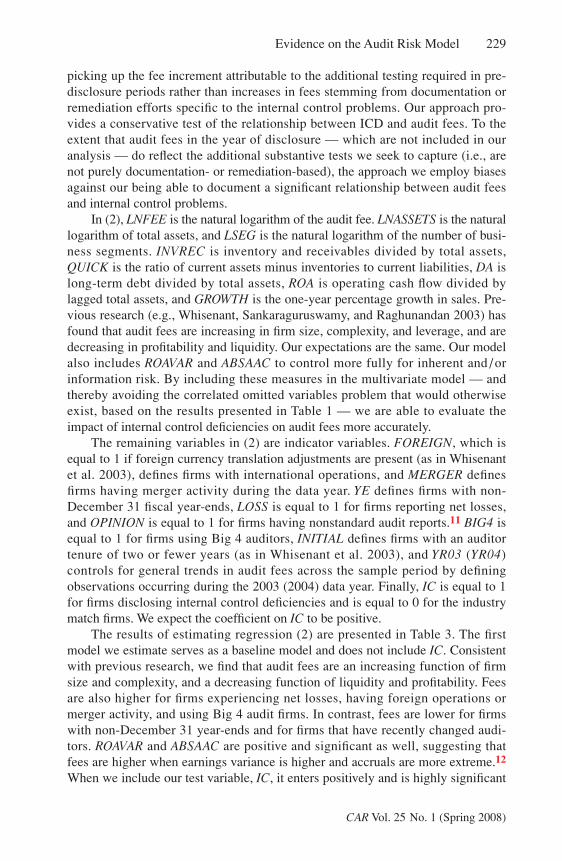
To test for the effect of ICD on audit fees, we estimate a standard audit fee modelthat includes an indicator variable defining firms with disclosures of internal controlproblems. Our initial model is as follows:
LNFEE � a0 � a1LNASSETS � a2LSEG � a3INVREC � a4QUICK � a5DA
� a6ROA � a7ROAVAR � a8ABSAAC � a9GROWTH
� a10FOREIGN � a11MERGER � a12YE � a13LOSS
� a14OPINION � a15BIG4 � a16INITIAL � a17YR03
� a18YR04 � a19IC � � (2).
228 Contemporary Accounting Research
CAR Vol. 25 No. 1 (Spring 2008)
As discussed previously, our analysis uses data for the fiscal year-end closestto but preceding the year in which the internal control problem was disclosed. Forexample, for a calendar year-end firm disclosing an internal control problem inJune 2004, our analysis incorporates fees and other firm-characteristics for the yearended December 31, 2003. We adopt this approach because our tests are aimed at
TABLE 2Statistics for internal control disclosure firms by material weaknesses versus significant deficiencies
Panel A: Accounting variables
ASSETS 1,209.980 145.873 2,230.76 268.704 0.108 0.008LNASSETS 4.856 4.981 5.666 5.594 0.003 0.008LSEG 0.435 0.000 0.524 0.000 0.258 0.255INVREC 0.285 0.260 0.292 0.268 0.773 0.657QUICK 1.740 1.107 2.025 1.327 0.371 0.108DA 0.219 0.127 0.204 0.133 0.738 0.988ROA �0.136 0.002 �0.030 0.035 0.053 0.007ROAVAR 0.250 0.106 0.275 0.074 0.693 0.071ABSAAC 0.120 0.052 0.079 0.048 0.022 0.224GROWTH 0.165 0.052 0.314 0.072 0.478 0.274FOREIGN 0.365 0.000 0.434 0.000 0.252 0.252MERGER 0.483 0.000 0.462 0.000 0.734 0.734YE 0.337 0.000 0.292 0.000 0.433 0.437LOSS 0.646 1.000 0.481 0.000 0.006 0.007OPINION 0.629 1.000 0.575 1.000 0.371 0.371BIG4 0.742 1.000 0.811 1.000 0.180 0.179INITIAL 0.337 0.000 0.264 0.000 0.200 0.200CFO �0.050 0.032 0.001 0.054 0.161 0.036
Panel B: Fee variables
AUDIT 1.199 0.367 1.240 0.522 0.886 0.080%AUDIT 1.487% 0.306% 0.410% 0.179% 0.029 0.002NONAUDIT 0.766 0.126 1.033 0.222 0.398 0.126%NONAUDIT 0.213% 0.085% 0.120% 0.063% 0.004 0.096
Notes:
All p-values are two-tailed.
Variables are as defined in Appendix 2.
Material weaknesses(n � 178)
Significant/other control deficiencies
(n � 106)t-statisticp-value
Sign-rankp-valueMean Median Mean Median
Mean Median Mean Mediant-statisticp-value
Sign-rankp-value
Evidence on the Audit Risk Model 229
CAR Vol. 25 No. 1 (Spring 2008)
picking up the fee increment attributable to the additional testing required in pre-disclosure periods rather than increases in fees stemming from documentation orremediation efforts specific to the internal control problems. Our approach pro-vides a conservative test of the relationship between ICD and audit fees. To theextent that audit fees in the year of disclosure — which are not included in ouranalysis — do reflect the additional substantive tests we seek to capture (i.e., arenot purely documentation- or remediation-based), the approach we employ biasesagainst our being able to document a significant relationship between audit feesand internal control problems.
In (2), LNFEE is the natural logarithm of the audit fee. LNASSETS is the naturallogarithm of total assets, and LSEG is the natural logarithm of the number of busi-ness segments. INVREC is inventory and receivables divided by total assets,QUICK is the ratio of current assets minus inventories to current liabilities, DA islong-term debt divided by total assets, ROA is operating cash flow divided bylagged total assets, and GROWTH is the one-year percentage growth in sales. Pre-vious research (e.g., Whisenant, Sankaraguruswamy, and Raghunandan 2003) hasfound that audit fees are increasing in firm size, complexity, and leverage, and aredecreasing in profitability and liquidity. Our expectations are the same. Our modelalso includes ROAVAR and ABSAAC to control more fully for inherent and / orinformation risk. By including these measures in the multivariate model — andthereby avoiding the correlated omitted variables problem that would otherwiseexist, based on the results presented in Table 1 — we are able to evaluate theimpact of internal control deficiencies on audit fees more accurately.
The remaining variables in (2) are indicator variables. FOREIGN, which isequal to 1 if foreign currency translation adjustments are present (as in Whisenantet al. 2003), defines firms with international operations, and MERGER definesfirms having merger activity during the data year. YE defines firms with non-December 31 fiscal year-ends, LOSS is equal to 1 for firms reporting net losses,and OPINION is equal to 1 for firms having nonstandard audit reports.11 BIG4 isequal to 1 for firms using Big 4 auditors, INITIAL defines firms with an auditortenure of two or fewer years (as in Whisenant et al. 2003), and YR03 (YR04)controls for general trends in audit fees across the sample period by definingobservations occurring during the 2003 (2004) data year. Finally, IC is equal to 1for firms disclosing internal control deficiencies and is equal to 0 for the industrymatch firms. We expect the coefficient on IC to be positive.
The results of estimating regression (2) are presented in Table 3. The firstmodel we estimate serves as a baseline model and does not include IC. Consistentwith previous research, we find that audit fees are an increasing function of firmsize and complexity, and a decreasing function of liquidity and profitability. Feesare also higher for firms experiencing net losses, having foreign operations ormerger activity, and using Big 4 audit firms. In contrast, fees are lower for firmswith non-December 31 year-ends and for firms that have recently changed audi-tors. ROAVAR and ABSAAC are positive and significant as well, suggesting thatfees are higher when earnings variance is higher and accruals are more extreme.12
When we include our test variable, IC, it enters positively and is highly significant
230 Contemporary Accounting Research
CAR Vol. 25 No. 1 (Spring 2008)
(p � 0.001), in addition to being economically significant. When all of the othervariables are entered at their mean values and IC is coded as 0, the predicted auditfee is $293,746. When IC is coded as 1, the predicted fee increases by over$100,000 to $394,538 consistent with auditors increasing their fees when issueswith control risk arise.
Next we turn to a specification of (2) that allows us to investigate how fees areinfluenced by the severity of the underlying internal control deficiencies. In thismodel we partition IC into IC_MW and IC_SIGNDEF, representing the materialweakness and significant deficiency partitions, respectively. The coefficients forboth variables are positive and significant (p 0.001) but the coefficient of 0.347for IC_MW is significantly larger (p � 0.051) than the coefficient of 0.207 forIC_SIGNDEF. These findings suggest that audit fees are much higher when mate-rial weaknesses exist than when they do not.
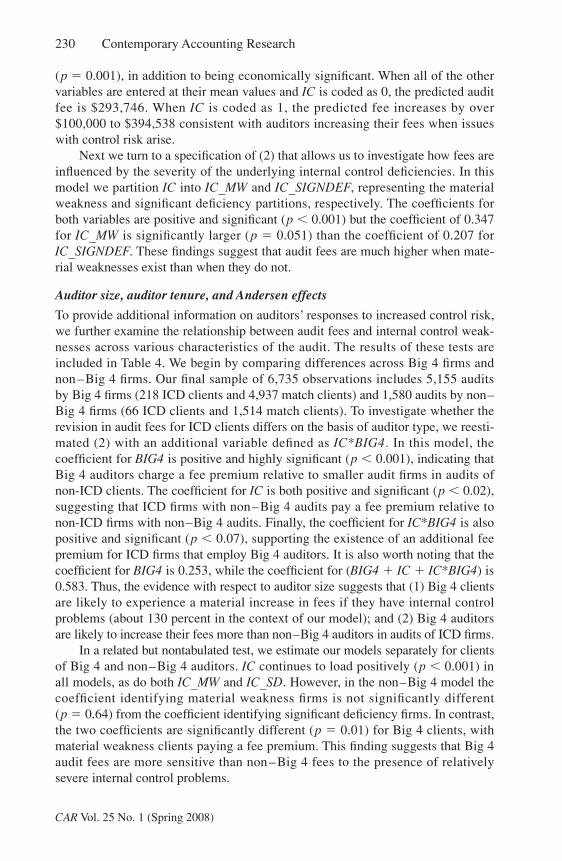
Auditor size, auditor tenure, and Andersen effects
To provide additional information on auditors’ responses to increased control risk,we further examine the relationship between audit fees and internal control weak-nesses across various characteristics of the audit. The results of these tests areincluded in Table 4. We begin by comparing differences across Big 4 firms andnon–Big 4 firms. Our final sample of 6,735 observations includes 5,155 auditsby Big 4 firms (218 ICD clients and 4,937 match clients) and 1,580 audits by non–Big 4 firms (66 ICD clients and 1,514 match clients). To investigate whether therevision in audit fees for ICD clients differs on the basis of auditor type, we reesti-mated (2) with an additional variable defined as IC*BIG4. In this model, thecoefficient for BIG4 is positive and highly significant (p 0.001), indicating thatBig 4 auditors charge a fee premium relative to smaller audit firms in audits ofnon-ICD clients. The coefficient for IC is both positive and significant (p 0.02),suggesting that ICD firms with non–Big 4 audits pay a fee premium relative tonon-ICD firms with non–Big 4 audits. Finally, the coefficient for IC*BIG4 is alsopositive and significant (p 0.07), supporting the existence of an additional feepremium for ICD firms that employ Big 4 auditors. It is also worth noting that thecoefficient for BIG4 is 0.253, while the coefficient for (BIG4 � IC � IC*BIG4) is0.583. Thus, the evidence with respect to auditor size suggests that (1) Big 4 clientsare likely to experience a material increase in fees if they have internal controlproblems (about 130 percent in the context of our model); and (2) Big 4 auditorsare likely to increase their fees more than non–Big 4 auditors in audits of ICD firms.
In a related but nontabulated test, we estimate our models separately for clientsof Big 4 and non–Big 4 auditors. IC continues to load positively (p 0.001) inall models, as do both IC_MW and IC_SD. However, in the non–Big 4 model thecoefficient identifying material weakness firms is not significantly different(p � 0.64) from the coefficient identifying significant deficiency firms. In contrast,the two coefficients are significantly different (p � 0.01) for Big 4 clients, withmaterial weakness clients paying a fee premium. This finding suggests that Big 4audit fees are more sensitive than non–Big 4 fees to the presence of relativelysevere internal control problems.
Evidence on the Audit Risk Model 231
CAR Vol. 25 No. 1 (Spring 2008)
TABLE 3Multivariate audit fee model results
LNFEE � a0 � a1LNASSETS � a2LSEG � a3INVREC � a4QUICK � a5DA � a6ROA� a7ROAVAR � a8ABSAAC � a9GROWTH � a10FOREIGN � a11MERGER� a12YE � a13LOSS � a14OPINION � a15BIG4 � a16INITIAL � a17YR03� a18YR04 � a19IC � �
Intercept 2.399 66.42 2.412 67.05 2.412 67.04LNASSETS 0.484 107.16 0.484 107.56 0.484 107.60LSEG 0.112 8.94 0.112 8.96 0.112 8.98INVREC 0.702 16.73 0.690 16.50 0.691 16.53QUICK �0.018 �9.33 �0.018 �9.22 �0.018 �9.21DA �0.048 �2.10 �0.049 �2.15 �0.049 �2.15ROA �0.268 �9.64 �0.266 �9.61 �0.266 �9.60ROAVAR 0.110 7.50 0.111 7.62 0.112 7.67ABSAAC 0.329 4.99 0.322 4.89 0.320 4.86GROWTH �0.002 �3.23 �0.002 �3.21 �0.002 �3.21FOREIGN 0.243 15.17 0.238 14.97 0.239 14.99MERGER 0.084 5.54 0.082 5.43 0.082 5.40YE �0.099 �6.35 �0.098 �6.25 �0.098 �6.27LOSS 0.163 9.59 0.154 9.09 0.154 9.05OPINION 0.137 9.00 0.135 8.89 0.135 8.86BIG4 0.261 12.34 0.259 12.34 0.259 12.33INITIAL �0.083 �5.00 �0.085 �5.16 �0.086 �5.19YR03 0.202 11.95 0.185 10.96 0.186 10.98YR04 0.598 22.05 0.589 21.77 0.589 21.78IC — — 0.295 8.21 — —IC_MW — — — — 0.347 7.75IC_SIGNDEF — — — — 0.207 3.60
Adjusted R2 0.813 0.815 0.815
p-value for equality of IC_MW and IC_SIGNDEF (two-tailed) 0.051
Notes:
n � 284 sample firms and 6,451 control firms.
IC_MW � 1 if the internal control problem disclosure indicates a material weakness; = 0 otherwise.
IC_SIGNDEF � 1 if the internal control problem disclosure indicates no material weakness, but a significant deficiency; � 0 otherwise.
Other variables are as defined in Appendix 2.
Variable Coeff. t-stat. Coeff. t-stat. Coeff. t-stat.
232 Contemporary Accounting Research
CAR Vol. 25 No. 1 (Spring 2008)
TABLE 4Fee model results for auditor size, initial audit, and former Andersen client tests
LNFEE � a0 � a1LNASSETS � a2LSEG � a3INVREC � a4QUICK � a5DA � a6ROA� a7ROAVAR � a8ABSAAC � a9GROWTH � a10FOREIGN � a11MERGER� a12YE � a13LOSS � a14OPINION � a15BIG4 � a16INITIAL � a17YR03� a18YR04 � a19IC � �
Intercept 2.416 67.05 2.416 67.16 2.410 66.81LNASSETS 0.484 107.59 0.483 107.52 0.484 107.68LSEG 0.112 8.94 0.112 8.99 0.112 9.00INVREC 0.690 16.51 0.690 16.52 0.692 16.57QUICK �0.018 �9.22 �0.018 �9.23 �0.018 �9.21DA �0.049 �2.18 �0.049 �2.15 �0.047 �2.08ROA �0.266 �9.63 �0.267 �9.67 �0.266 �9.60ROAVAR 0.111 7.62 0.111 7.62 0.111 7.63ABSAAC 0.324 4.93 0.317 4.82 0.322 4.89GROWTH �0.002 �3.22 �0.002 �3.21 �0.002 �3.21FOREIGN 0.238 14.95 0.239 15.03 0.239 15.00MERGER 0.081 5.38 0.083 5.47 0.081 5.34YE �0.098 �6.27 �0.097 �6.24 �0.097 �6.25LOSS 0.154 9.09 0.154 9.06 0.153 8.99OPINION 0.135 8.92 0.136 8.98 0.137 9.02BIG4 0.253 11.86 0.261 12.42 0.265 12.38INITIAL �0.085 �5.12 �0.097 �5.73 �0.065 �3.08YR03 0.185 10.97 0.185 10.94 0.185 10.98YR04 0.590 21.81 0.588 21.74 0.591 21.82IC 0.178 2.41 0.218 5.08 0.234 5.86IC*BIG4 0.152 1.80 — — — —IC*INITIAL — — 0.248 3.23 — —PREVAND — — — — �0.049 �1.99IC*PREVAND — — — — 0.309 3.46
Adjusted R2 0.815 0.815 0.815
Notes:
Our final sample of 6,735 observations includes 5,155 audits by Big 4 firms (218 ICD clients and 4,937 match clients) and 1,580 audits by non–Big 4 firms (66 ICD clients and 1,514 match clients). The variable INITIAL is coded as one (auditor tenure 2 years) for 31 percent of ICD firms and 26.3 percent of match firms, and this difference is significant at p � 0.08. The percentage of ICD firms that were former Andersen clients (20 percent) is not significantly different from the percentage of match firms (18 percent) that were former Andersen clients (p � 0.465).
PREVAND � 1 if the firm was an Andersen client in 2000 or 2001; � 0 otherwise.
Other variables are as defined in Appendix 2.
Variable Coeff. t-stat. Coeff. t-stat. Coeff. t-stat.
Evidence on the Audit Risk Model 233
CAR Vol. 25 No. 1 (Spring 2008)
We also test the relationship between ICDs, initial audits, and audit fees.When we include IC, INITIAL, and IC*INITIAL in (2), IC is positive, INITIAL isnegative, and the interaction term is positive (p-values for all coefficients are lessthan 0.01). Table 4 shows that the absolute value of the interaction term is alsoapproximately 2.5 times as large as the absolute value of INITIAL. Overall, theseresults confirm the presence of lowballing for initial audits in general (INITIAL isnegative), the presence of a fee premium for ICD firms with auditors having tenureof longer than two years (IC is positive), and the presence of a significant additionalfee premium for ICD firms having INITIAL audits that far surpasses the lowballingthat ordinarily would exist (IC*INITIAL is positive). These findings suggest thatthe presence of an internal control problem is very important in establishing the feepaid in an initial audit.
In our last test we augment (2) with the addition of PREVAND — a binaryvariable defining firms that were Andersen clients in 2000 or 2001 — andIC*PREVAND. The percentage of ICD firms that were former Andersen clients (20percent) is not significantly different from the percentage of match firms (18 per-cent) that were former Andersen clients (p � 0.465). As is shown in Table 4, thecoefficient for IC in this model is 0.234 (p 0.001), the coefficient for PREVANDis �0.049 (p 0.05) and the coefficient for IC*PREVAND is 0.309 (p 0.001).The significant negative coefficient for PREVAND is comparable to that of INITIAL,in that it is indicative of lower fees following an auditor change. Note that this gen-eral tendency for fees to be lower in a relatively new audit engagement holds evenfor former Andersen clients, provided that no internal control deficiencies exist.When internal control deficiencies do exist among former Andersen clients, however,the fee increment is 0.309 over and above the 0.234 associated with non-AndersenICD firms (and the �0.049 associated with the Andersen-related non-ICD effect).To put these coefficients in perspective, in the expanded model the predicted fee —using mean values for the other variables — if the firm is not an ICD firm and isnot a former Andersen client would be approximately $296,500. If the firm is notan ICD firm but is a former Andersen client, the recent auditor change (i.e., low-balling) causes the predicted fee to decrease to about $282,000. If internal controldeficiencies do exist but the firm is not a former Andersen client, the predicted feeis $356,808, and if the firm is a former Andersen client and is also an ICD firm, thepredicted fee increases to roughly $486,000.
The conclusions we draw from the results presented in Table 4 are twofold.First, if fees provide an indication of audit effort, auditors do appear to conduct moresubstantive tests when their clients have internal control deficiencies — particularlyin the case of Big 4 auditors and / or audit firms that have recently accepted anengagement. Second, the fees associated with audits of firms that are formerAndersen clients appear to be very sensitive to the existence of control risks. We findthe latter finding particularly interesting, given that former Andersen clients that donot have internal control deficiencies pay their new auditors significantly lower fees,just like any other client that has recently changed auditors (consistent withDeAngelo 1981 and other research on low-balling). Given the negative coefficientfor PREVAND, the significant positive coefficient for PREVAND*IC cannot strictly
234 Contemporary Accounting Research
CAR Vol. 25 No. 1 (Spring 2008)
be interpreted as an additional risk / litigation premium associated with auditingformer Andersen clients. Rather, we contend that it is evidence of a heightened sensi-tivity to control risks among clients that may have had audits that were deficient — orthat were at least perceived to potentially have been deficient — in previous periods.
Sensitivity tests
SOX section 404 reporting issue and changes in audit fees
One concern in interpreting the coefficients on the internal control deficiency indi-cator variable in our audit fee model is that fee increases might actually be due toauditors assisting clients in documenting internal controls in preparation for SOXsection 404 reporting. On the basis of our reading of the disclosures of the ICDdocumented by our sample firms, this does not seem to be the case for the majorityof the firms. Furthermore, our test period — the year prior to the disclosure of thedeficiency — is selected specifically to minimize this possibility. In the interest ofcompleteness, however, we also document the differences in audit fees betweensample firms and control firms in the fiscal year preceding our year of interest (i.e.,for the fiscal year ending two years before the disclosure of the ICD, predomi-nantly fiscal year 2002). We find that audit fees are significantly higher for thesample firms in this year as well. The mean (median) fee for sample firms isroughly $915,000 ($300,000) versus about $669,000 ($210,000) for control firms.Both differences are statistically significant, and similar relationships also exist forlagged audit fees as a percentage of lagged total assets. These findings strengthenour argument that the fee increase we observe is due to increased control risk,rather than being related to SOX section 404.13 In addition, in nontabulated resultswe partition the IC coefficient to define accelerated filers and nonaccelerated filers,and we find that both coefficients are positive and significant (and are not signifi-cantly different from each other). These results suggest that fees are significantlyhigher for both groups of firms rather than just for the accelerated filers who weremore likely to have been gearing up for SOX section 404.
Age of deficiencies
In a related sensitivity analysis, we try to determine whether auditors were aware ofinternal control deficiencies in prior years, or whether the deficiency was recentlydetected. Ideally, we would like to know how long management and the auditorshave been aware of the ICD; however, this information obviously is not available.Our classification is made after reading the Compliance Week disclosures anddetermining whether or not there was an indication that the deficiency existed inthe prior year (as an example, see the Foster Wheeler Ltd. disclosure included inAppendix 1, which shows a disclosure indicating that weakness existed in the priorfinancial statement period). We partition the IC variable into two components:IC_PRIOR and IC_NOPRIOR. The first component identifies ICD firms having adeficiency that is more likely to be long-standing and the second identifies ICDfirms having a deficiency that either appears to be recently detected or is ambiguous.We classified 53 percent of ICD firms as IC_PRIOR and the remaining 47 percent
Evidence on the Audit Risk Model 235
CAR Vol. 25 No. 1 (Spring 2008)
as IC_NOPRIOR. When we reestimate (2) with these partitions in place, the coefficientfor IC_NOPRIOR is 0.175 (p 0.001) and the coefficient for IC_PRIOR is 0.403(p 0.001). The coefficient for IC_PRIOR is also significantly larger (p 0.001)than the coefficient for IC_NOPRIOR. Overall, these findings indicate that evenrelatively new deficiencies (or those that have ambiguous disclosures) result inhigher audit fees; however, deficiencies that were the most likely to have existed in theprior year are associated with much higher fee premiums. It is also worth notingthat significantly more IC_PRIOR observations than IC_NOPRIOR observationsinvolve material weaknesses (75 percent versus 49 percent, respectively) such thatproblems that appear to be “older” are also more severe.
Correlated omitted variables and/or performance
Another potential concern with respect to our findings is that our test variable ofinterest (IC) may be correlated with variables that are not included in our multi-variate model. To allay these concerns, we reestimate the model after includingmost of the remaining independent variables used by Whisenant et al. 2003. Ourinitial objective in estimating (2) was to retain some degree of parsimony and toretain as many observations as possible. The latter issue is of particular concern,given that the loss of an ICD firm due to data restrictions also requires the deletionof all of its associated control firm observations. The inclusion of the current year’sstock return (RETURN), market model residual volatility (VOLATILITY), book-to-market ratio (BTM), and the number of days between the fiscal year-end and thefourth quarter earnings announcement date (LAG), for example, reduces our usableset of observations by about 20 percent (to 234 sample firms and 5,127 industrymatch firms). With these variables included in the model, the coefficient on ICdecreases from 0.295 to 0.250, but the t-statistic is still 6.70 (p 0.001). Furtheradditions to the model, in the form of square root of employees (SQEMPLS), theexistence of employee benefit plans (EMP_PLANS), and extraordinary items ordiscontinued operations (XDOPS) result in the loss of an additional 3 sample firmsand 109 control firms. In this model, the t-statistic for IC remains at 6.50(p 0.001), and the coefficients on the control variables are also consistent withthose presented by Whisenant et al. 2003. In addition, the coefficient for ICremains highly significant (p 0.001) when we include controls for restructuringcharges, auditor industry specialization, and industry fixed effects.
We also estimate an additional series of models to ensure that IC is not simplyproxying for poor financial performance (which would be positively associatedwith audit fees). Given that a number of the independent variables included in themodel are related to performance — for example, ROA, ROAVAR, and ABSAAC —we believe that these effects are being modeled adequately in (2). As an additionaltest, however, we partition observations that are above- and below-median valuesof ROA, ROAVAR, and ABSAAC and reestimate (2) separately for each of these sixpartitions. We also form a comparable partition based on CFO, which is shown tobe significantly different for ICD and match firms in Table 1; however, this is notincluded in our (or other) audit fee models. In all of these models, IC is positiveand highly significant (p 0.001) for both “low” and “high” partitions.
236 Contemporary Accounting Research
CAR Vol. 25 No. 1 (Spring 2008)
Alternative classification of severity of weaknesses
As an alternative to classifying material weaknesses versus significant deficiencies,we also classify the types of deficiencies reported. Our partitions are based on thenine broad categories of internal control problems described by Ge and McVay2005.14 We then divide the sample firms into “high” and “low” problem groups(IC_HIGH and IC_LOW ). We define sample firms as having internal controlproblems that are relatively “low” if (a) they only report a control problem in onecategory and (b) the problem they report is account- or subsidiary-specific, orinvolves account reconciliations. This classification ties closely to Moody’s Inves-tors Service 2004 characterization of internal controls that are “auditable”. Of the284 sample firms, 84 meet these criteria and are therefore classified as IC_LOW.The remaining 200 sample firms are assumed to have internal control problemsthat are more severe, either because they have issues in more problematic generalareas (e.g., accounting policies, the internal control environment as a whole, orissues with management and personnel) or because they have problems acrossmultiple categories. These firms are classified as IC_HIGH.
If we estimate the audit fee regression model and include IC_HIGH andIC_LOW rather than IC_MW and IC_SIGNDEF (results not tabulated), the coeffi-cient on IC_HIGH is 0.384 and is significant at p 0.001. The coefficient onIC_LOW is 0.084 and the p-value is 0.192. These results suggest that audit fees aresignificantly higher for firms with more pervasive weaknesses, or with multipleweaknesses, whereas fees are not significantly higher if the weaknesses are lesssevere and are relatively isolated (e.g., account-specific or subsidiary-specific).
5. Conclusions
In this study, we investigate how auditors respond to the higher levels of controlrisk experienced by firms subsequently disclosing internal control deficiencies.Our results show that audit fees are significantly higher for ICD firms after control-ling for size, risk, and profitability. Furthermore, the fee increment is highest forfirms that have the most substantial internal control problems. Our tests also indi-cate that internal control deficiency firms have higher levels of inherent risk andinformation risk than their industry counterparts, and that these risks are positivelyrelated to fees as well.
To the extent that audit fees are a proxy for audit effort, our results suggestthat auditors are increasing their audit effort where appropriate to maintain anacceptable overall level of audit risk, consistent with the audit risk model. Asstated earlier, our ability to draw inferences about audit effort and increased con-trol risk relies on audit fees being an adequate proxy for audit effort, which hasbeen found to be the case both in the pre-Sarbanes-Oxley time period (Bell et al.2001) and in the post-Sarbanes-Oxley period (Bedard and Johnstone 2006). How-ever, we cannot rule out the alternative explanation that the increased fees weobserve are due to the existence of a risk premium for firms with internal controlproblems rather than to increased testing.
Evidence on the Audit Risk Model 237
CAR Vol. 25 No. 1 (Spring 2008)
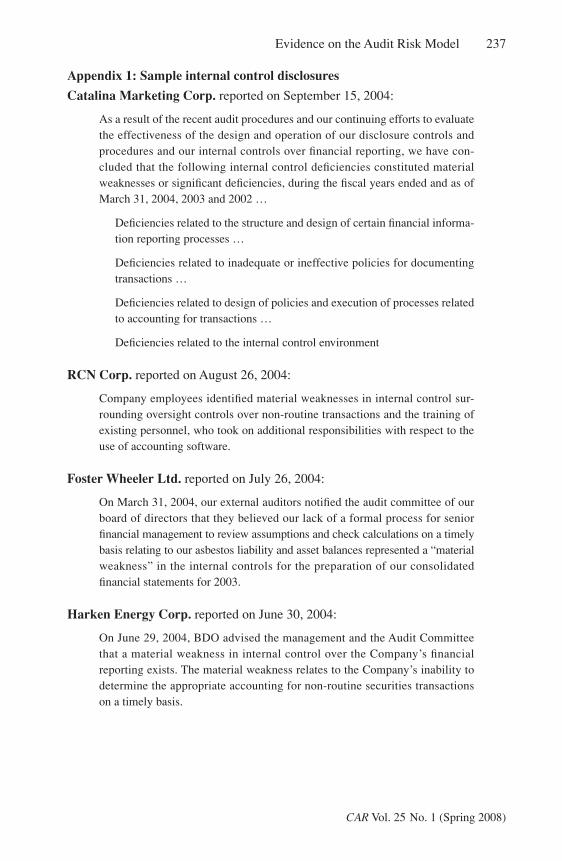
Appendix 1: Sample internal control disclosures
Catalina Marketing Corp. reported on September 15, 2004:
As a result of the recent audit procedures and our continuing efforts to evaluatethe effectiveness of the design and operation of our disclosure controls andprocedures and our internal controls over financial reporting, we have con-cluded that the following internal control deficiencies constituted materialweaknesses or significant deficiencies, during the fiscal years ended and as ofMarch 31, 2004, 2003 and 2002 …
Deficiencies related to the structure and design of certain financial informa-tion reporting processes …
Deficiencies related to inadequate or ineffective policies for documentingtransactions …
Deficiencies related to design of policies and execution of processes relatedto accounting for transactions …
Deficiencies related to the internal control environment
RCN Corp. reported on August 26, 2004:
Company employees identified material weaknesses in internal control sur-rounding oversight controls over non-routine transactions and the training ofexisting personnel, who took on additional responsibilities with respect to theuse of accounting software.
Foster Wheeler Ltd. reported on July 26, 2004:
On March 31, 2004, our external auditors notified the audit committee of ourboard of directors that they believed our lack of a formal process for seniorfinancial management to review assumptions and check calculations on a timelybasis relating to our asbestos liability and asset balances represented a “materialweakness” in the internal controls for the preparation of our consolidatedfinancial statements for 2003.
Harken Energy Corp. reported on June 30, 2004:
On June 29, 2004, BDO advised the management and the Audit Committeethat a material weakness in internal control over the Company’s financialreporting exists. The material weakness relates to the Company’s inability todetermine the appropriate accounting for non-routine securities transactionson a timely basis.
238 Contemporary Accounting Research
CAR Vol. 25 No. 1 (Spring 2008)
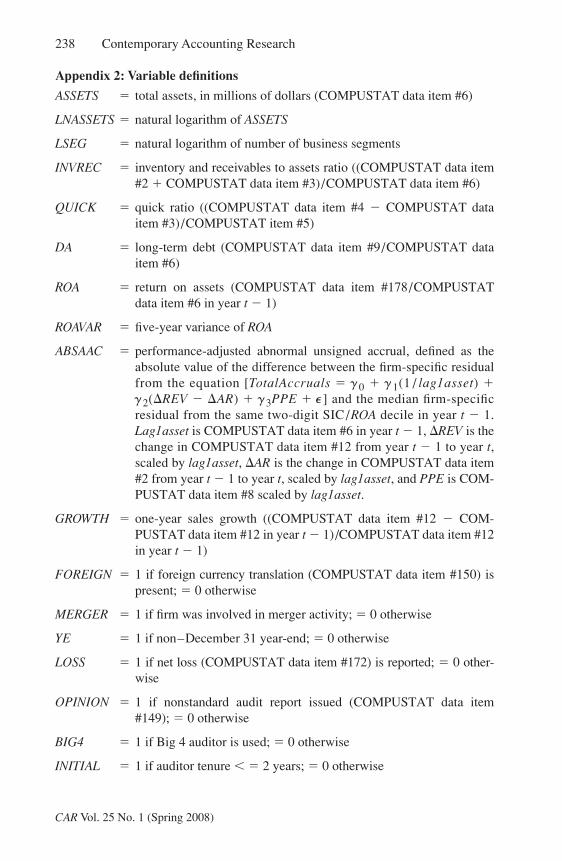
Appendix 2: Variable definitions
ASSETS � total assets, in millions of dollars (COMPUSTAT data item #6)
LNASSETS � natural logarithm of ASSETS
LSEG � natural logarithm of number of business segments
INVREC � inventory and receivables to assets ratio ((COMPUSTAT data item#2 � COMPUSTAT data item #3)/COMPUSTAT data item #6)
QUICK � quick ratio ((COMPUSTAT data item #4 � COMPUSTAT dataitem #3)/COMPUSTAT item #5)
DA � long-term debt (COMPUSTAT data item #9/COMPUSTAT dataitem #6)
ROA � return on assets (COMPUSTAT data item #178/COMPUSTATdata item #6 in year t � 1)
ROAVAR � five-year variance of ROA
ABSAAC � performance-adjusted abnormal unsigned accrual, defined as theabsolute value of the difference between the firm-specific residualfrom the equation [TotalAccruals � � 0 � � 1(1 / lag1asset) �� 2(�REV � �AR) � � 3PPE � � ] and the median firm-specificresidual from the same two-digit SIC /ROA decile in year t � 1.Lag1asset is COMPUSTAT data item #6 in year t � 1, �REV is thechange in COMPUSTAT data item #12 from year t � 1 to year t,scaled by lag1asset, �AR is the change in COMPUSTAT data item#2 from year t � 1 to year t, scaled by lag1asset, and PPE is COM-PUSTAT data item #8 scaled by lag1asset.
GROWTH � one-year sales growth ((COMPUSTAT data item #12 � COM-PUSTAT data item #12 in year t � 1)/COMPUSTAT data item #12in year t � 1)
FOREIGN � 1 if foreign currency translation (COMPUSTAT data item #150) ispresent; � 0 otherwise
MERGER � 1 if firm was involved in merger activity; � 0 otherwise
YE � 1 if non–December 31 year-end; � 0 otherwise
LOSS � 1 if net loss (COMPUSTAT data item #172) is reported; � 0 other-wise
OPINION � 1 if nonstandard audit report issued (COMPUSTAT data item#149); � 0 otherwise
BIG4 � 1 if Big 4 auditor is used; � 0 otherwise
INITIAL � 1 if auditor tenure � 2 years; � 0 otherwise
Evidence on the Audit Risk Model 239
CAR Vol. 25 No. 1 (Spring 2008)
CFO � cash flow from operations (COMPUSTAT data item#308/COMPUSTAT data item #6 in year t � 1)
AUDIT (NONAUDIT) � audit (nonaudit) fee, in millions of dollars
%AUDIT (%NONAUDIT) � audit (nonaudit) fee as a percentage of ASSETS
Endnotes1. Internal control over financial reporting is a subset of internal controls, and is defined
in Public Company Auditing Oversight Board (PCAOB) Standard No. 2 as “a process designed by, or under the supervision of, the company’s principal executive and principal financial officers, or persons performing similar functions, and effected by the company’s board of directors, management, and other personnel, to provide reasonable assurance regarding the reliability of financial reporting and the preparation of financial statements for external purposes in accordance with generally accepted accounting principles” (PCAOB 2004, 154). ICOFR also includes policies and procedures related to maintaining accounting records, recording transactions, authorizing receipts and expenditures, and safeguarding assets.
2. Francis et al. (2005, 296) suggest that lower accruals quality increases information risk, which they define as “the likelihood that firm-specific information that is pertinent to investor pricing decisions is of poor quality”. They document that lower accruals quality is associated with greater cost of capital.
3. Companies registered with the Securities and Exchange Commission (SEC) have been required to institute and maintain a system of internal controls since the passage of the Foreign Corrupt Practices Act of 1977 (FCPA). Under previous auditing standards, auditors were required to consider internal controls when planning the audit engagement, but were not required to test internal controls if they decided not to rely on them. The only public disclosure requirements related to internal control deficiencies were under Financial Reporting Release (FRR) No. 31 (SEC 1988), which requires companies to disclose certain reportable events about internal control and financial statement reliability in an 8-K when an auditor change occurs.
4. Our sample period predates the mandatory SOX section 404 disclosures for accelerated filers. Companies may have been beginning their documentation and testing of controls at this point (many of the November 2004 disclosures state that the ICDs were noted during the process of assessing controls). To the extent that there are control firms included in our regression analysis that had material weaknesses or significant deficiencies of which the auditors were aware during the fiscal year included in our analysis but which had not been reported publicly, this would bias against finding a significant difference in fees between sample and control firms.
5. Of the observations included in our final sample, 53 percent have disclosures indicating that the control weakness existed in the prior fiscal year. We test the sensitivity of our results to including the remaining 47 percent of observations in our tests, and discuss these findings under the heading “Sensitivity Tests”, below.
6. Glass Lewis argues, “In our view, the control deficiency probably did not appear overnight. Consequently, we feel that the problem most likely existed in prior quarters, and management failed to properly identify the problem” (2005, 3).
240 Contemporary Accounting Research
CAR Vol. 25 No. 1 (Spring 2008)
7. In a previous version of the paper, we used a one-to-one matching procedure. Our results under this procedure are directly comparable to the results from our current one-to-many matching procedure, but the latter is preferable because it minimizes potential self-selection problems. In the previous version, we investigated the number of one-to-one control firms that subsequently reported an ICD. Out of the 123 control firms in our initial match that had filed their first SOX section 404 report up through August 2005 (many of the firms are not accelerated filers), 14 disclosed material weaknesses (a rate of 11 percent), while the remaining 109 firms received clean opinions. Removing these 14 pairs from the analysis did not change the original results.
8. Fields, Fraser, and Wilkins (2004) show that audit fee determinants for financial institutions are different from those for other firms. When we leave the 57 financial institution observations (6 sample firms and 51 control firms) in our model, our results are qualitatively unaffected.
9. Kothari, Leone, and Wasley (2005) show that matching on performance enhances the reliability of inferences in earnings management studies.
10. Similar to Dechow and Dichev 2002, we eliminate any firm-year in the top or bottom 1 percent of ROA, CFO, or TotalAccruals before generating the industry/year expected accruals in (1). We also winsorize ABSAAC at the top and bottom 1 percent of all observations.
11. Most of the firms with OPINION � 1 simply have explanatory language added to their audit report. As such, this variable should not be interpreted as modeling the effect of going-concern modifications on audit fees.
12. As an additional sensitivity test, we also include cash flow volatility and sales volatility in addition to ABSAAC, because these measures of inherent risk have been shown to be associated with accruals quality (Francis et al. 2005). After controlling for these additional measures of inherent risk, the coefficient on ABSAAC is still positive and significant, suggesting that fees are increasing in absolute value of performance-adjusted discretionary accruals, even after controlling for other inherent risk measures associated with accruals quality. The coefficient on IC is still highly significant at p � 0.001.
13. We do not report multivariate tests of these relationships due to the changing definition of audit fees across these time periods. We cannot rule out the possibility that a portion of our basic finding stems from fees being associated with the initial identification of an internal control problem. However, both our empirical method (selecting the previous fiscal year) and our additional tests are aimed at ensuring that our results are robust to this and other potentialities.
14. The nine general categories listed by Ge and McVay 2005 are period-end reporting/accounting policies, revenue recognition, senior management, account specific, account reconciliations, subsidiary specific, segregation of duties, training, and technology issues.

Evidence on the Audit Risk Model 241
CAR Vol. 25 No. 1 (Spring 2008)
ReferencesAmerican Institute of Certified Public Accountants (AICPA). 1983. Statement on Auditing
Standards No. 47: Audit risk and materiality in conducting an audit. New York: AICPA.
American Institute of Certified Public Accountants (AICPA). 1989. Statement on Auditing Standards No. 55: Consideration of internal control in a financial statement audit. New York: AICPA.
American Institute of Certified Public Accountants (AICPA). 1996. Statement on Auditing Standards No. 78: Consideration of internal control in a financial statement audit: An amendment to SAS-55. New York: AICPA.
Ashbaugh-Skaife, H., D. Collins, and W. Kinney. 2007. The discovery and reporting of internal control deficiencies prior to SOX-mandated audits. Journal of Accounting and Economics 44 (1–2): 166–92.
Ashbaugh-Skaife, H., D. Collins, W. Kinney, and R. LaFond. 2007. The effect of internal control deficiencies and their remediation on accrual quality. Working paper, University of Wisconson.
Bedard, J. 1989. An archival investigation of audit program planning. Auditing: A Journal of Practice & Theory 9 (1): 57–71.
Bedard, J., and K. Johnstone 2006. A longitudinal comparison of auditors’ response to client risk in the Sarbanes-Oxley era. Working paper, Bentley College.
Bell, T. B., W. Landsman, and D. A. Shackelford. 2001. Auditors’ perceived business risk and audit fees: Analysis and evidence. Journal of Accounting Research 39 (1): 35–43.
DeAngelo, L. 1981. Auditor independence, “low balling” and disclosure regulation. Journal of Accounting and Economics 3 (2): 113–27.
Dechow, P. M., and I. D. Dichev. 2002. The quality of accruals and earnings: The role of accrual estimation errors. The Accounting Review 77 (Supplement): 35–59.
Doyle, J., W. Ge, and S. McVay. 2007. Determinants of weaknesses in internal controls over financial reporting. Journal of Accounting and Economics 44 (1–2): 193–223.
Doyle, J., W. Ge, and S. McVay. 2007. Accruals quality and internal control over financial reporting. The Accounting Review 82 (5): 1141–70.
Felix, W. L., A. A. Gramling, and M. J. Maletta. 2001. The contribution of internal audit as a determinant of external audit fees and factors influencing this contribution. Journal of Accounting Research 39 (3): 513–34.
Fields, L. P., D. Fraser, and M. S. Wilkins. 2004. An investigation of the pricing of audit services for financial institutions. Journal of Accounting and Public Policy 23 (1): 53–77.
Foreign Corrupt Practices Act of 1977. 1977. 15 USC §§ 78dd-1, et seq.Francis, J., R. LaFond, P. Olsson, and K. Schipper. 2005. The market pricing of accruals
quality. Journal of Accounting and Economics 39 (2): 295–327.Ge, W., and S. McVay. 2005. The disclosure of material weaknesses in internal control after
the Sarbanes-Oxley Act. Accounting Horizons 19 (3): 137–58.Glass Lewis & Co. 2005. Internal control deficiency disclosures. Interim Alert, April 12.Hackenbrack, K. E., and W. R. Knechel. 1997. Resource allocation decisions in audit
engagements. Contemporary Accounting Research 14 (3): 481–500.Hammersley, J. S., L. A. Myers, and C. Shakespeare. 2008. Market reactions to the
disclosure of internal control weaknesses and to the characteristics of those
242 Contemporary Accounting Research
CAR Vol. 25 No. 1 (Spring 2008)
weaknesses under section 302 of the Sarbanes Oxley Act of 2002. Review of Accounting Studies 13 (1) (forthcoming).
Hoitash, R., U. Hoitash, and J. Bedard. 2005. Internal control quality and audit pricing under the Sarbanes-Oxley Act. Working paper, Suffolk University.
Kothari, S. P., A. J. Leone, and C. E. Wasley. 2005. Performance-matched discretionary accrual measures. Journal of Accounting and Economics 39 (1): 163–97.
Mock, T. J., and A. M. Wright. 1993. An exploratory study of auditor evidential planning. Auditing: A Journal of Practice & Theory 12 (2): 39–61.
Mock, T. J., and A. M. Wright. 1999. Are audit programs risk-adjusted? Auditing: A Journal of Practice & Theory 18 (1): 55–74.
Moody’s Investors Service. 2004. Section 404 reports on internal control: Impact on ratings will depend on nature of material weaknesses reported. Special Comment (October).
O’Keefe, T. B., D. A. Simunic, and M. T. Stein. 1994. The production of audit services: Evidence from a major public accounting firm. Journal of Accounting Research 32 (2): 241–61.
Public Companies Accounting Oversight Board (PCAOB). 2004. Auditing Standard No. 2: An audit of internal control over financial reporting performed in conjunction with an audit of financial statements. New York: PCAOB.
Raghunandan, K., and D. Rama. 2006. SOX Section 404 material weakness disclosures and audit fees. Auditing: A Journal of Practice & Theory 25 (1): 99–114.
Sarbanes-Oxley Act of 2002. 2002. Pub. Law no. 107, 116 Stat. 745.Securities and Exchange Commission (SEC). 2004. Management’s reports on internal
control over financial reporting and certification of disclosure in Exchange Act period reports — Frequently asked questions. Washington, DC: SEC.
Whisenant, S., S. Sankaraguruswamy, and K. Raghunandan. 2003. Evidence on the joint determination of audit and non-audit fees. Journal of Accounting Research 41 (4): 721–44.