Embed Size (px)
Citation preview

Evidence-based and business-wise HRM: The case of strategic workforce planning.
CBCS XIXth Annual Conference of HRM
Dr. Gerard Evers
August 24th, 2016
14.00-16.30 hrs
Willemstad, Curacao

Dr. Gerard Evers
• Econometrician
• Former Professor in Human Capital Valuation
• Director EuroHRM
Tilburgseweg 117
5051 AC Goirle
The Netherlands
00316 53465225

Amman, Jordania Abruzzo region, Italy

Be Smart, don’t Kiss (Keep it simple, stupid)
Think SMART:
• Specific
• Measurable
• Acceptable
• Realistic
• Time-specific
Simplicity and
intuition are
alibi’s for the
poor minded
Measuring is knowing,
Guessing is missing,
gambling is paying

Why to use data?
5

The agenda for this afternoon
14.00 hrs. Evidence based and business wiseHRM, the steps towards HR Analytics
15.00 hrs. short break
15.15 hrs. Strategic Workforce Planning
16.15 hrs Discussion, questions
16.30 hrs. Closing

Two approaches
1. Internal (from HR perspective): measuring
the (effectiveness of) HR processes. HR is
in the lead.
2. External (from HR perspective): analytics
is about the contribution of HR policies
(a.o.) for the firm outcomes. Management
is in the lead.

10 Golden rules for Internal perspectives - 1
1. Analyse the HR processes and products
on the basis of data, rather than
assumptions.
2. Collect data, make it consistent, try to use
digital techniques (data infrastructure).
3. Describe the processes and the desired
outcomes, both in time and volumes.
4. Measure discrepancies between budgets
and realization.

Internal perspectives - 2
5. From partial to integral: use several sources
and techniques.
6. Try to translate in financial
data as well
(like in Prince 2 applications)

Internal perspectives - 3
7. Make adequate time- and financial
planning.
8. Develop appropriate measurement
techniques and make them objective and
repeatable.
9. Develop a good monitoring system.
10. Define the link to organizational goals
(external approach)

External approach: Metrics & Analytics
HR Metrics reveals the
present human
Machinery;
HR Analytics indicates
the possible futures.

HR metrics
Systematic and data-driven overview of recent trends
and developments in human resources, by means of
key figures, KPI’s, balanced scorecards and
dashboards.
Gerard Evers, Rolf Baarda en
Jelle Dijkstra, 2007
12

13
KPI’s and Balanced scorecards
• Define dominant themes from the organisational strategy
• Translate these themes to HR: whichinstruments could contribute?
• Create a set of KPI’s
• Make a balanced scorecard

What are good KPI’s?
• Easy to understand
• Clear definition, valid
• Efficient to collect (costs)
• Reliable measurement
• Clear relation with strategic issues
• Reasonable frequency over time
• Credibility: Roughly right is better than precisely wrong
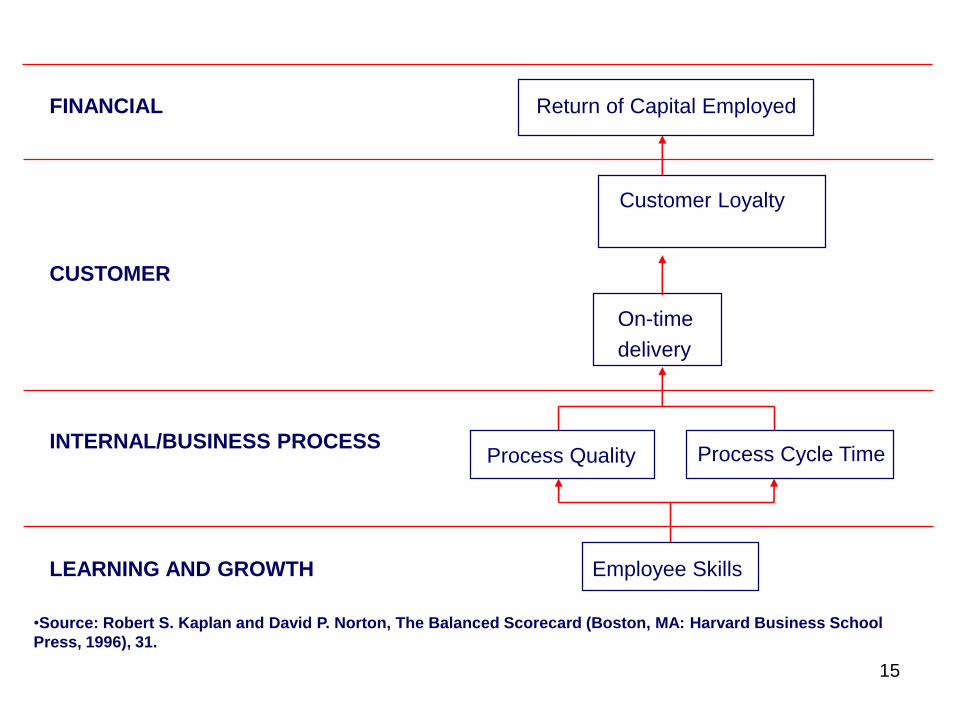
15
FINANCIAL
CUSTOMER
INTERNAL/BUSINESS PROCESS
LEARNING AND GROWTH
•Source: Robert S. Kaplan and David P. Norton, The Balanced Scorecard (Boston, MA: Harvard Business School
Press, 1996), 31.
Return of Capital Employed
Customer Loyalty
On-time
delivery
Process Quality Process Cycle Time
Employee Skills

Bron: CapGemini 2011
But, we should do better

Steering by the rear view mirror?
What is more useful:
Rapporting what happened yesterday?
OR
Forecasting what could happen tomorrow?

18
From “LAGGING”: Operational results form the past
To “LEADING”: Steering on future predictors: leadership,
commitment, talent, competencies, culture, imago
And STRATEGIC:Fit between Human Capital,
proces, Customer and Financial results (scorecard)
Shifting focus on measuring

HR Analytics – what and why?
• Definition: Systematic and data-driven analysis and translation of future developments in human resources towards the consequences and business impact.
• Primary goal: higher individual and firmperformance.

HR Analytics
Combining HR data, Customer data and financial data
From HR data to Business Impact
What is the impact of HR-instruments on:
Innovation power? Customer satisfaction? Sales?

‘HR is hitting the wall’
Source: Cascio & Boudreau 2010
Val
ue
ad
de
d
Degree of ‘HR Intelligence’
Benchmarks
Key figures
Scorecards
Link withBusiness data
Surveys
Relations
Causal analyses
Forecasts
Measuring Analytics
Why?Business impact?What if? Simulations.
Exploratory: what
happens?
Explanatory: why
does this happen?
Predictive: what
could happen
tomorrow?

Metrics versus analytics
HR metrics HR Analytics
The figures The observation
This is how it is This is how it will be
Yesterday Future
Facts and data What is it telling us?
Everything Need to know
All instruments The general picture
Information Relations
Collecting data Asking questions
Rapporting Analysing
HR ownership Corporate level

HR metrics and HR-analytics are both part of
a continious organizational process: 4 phases
I. Identifybusiness
opportunitiesand problems
II. Analytics: transform data
into action-oriented
information
III. Translate insights into desired
HR policy, and implement this
IV. Measure, monitor and evaluate theoutcomes
HR METRICS
HR ANALYTICS

24
Does my strategywork?
How much to investin learning &
development?
How to increaseemployee
commitment?
Will our best people stay or
leave?
What HR interventions do
increaseproductivity?

Phase II. Analytics : transform data into
action-oriented information (steps 2-6)1. What is thekey business
question
2. Translate thisinto an anlytic
design
3. Data collection
4. Data preparation
5. Data analysis, translate to
insights
6. Presentation and visualisation
7. Translate intoHR policies
8. Measure theoutcomes
(= metrics)

Example : labour turnover
12%
13%
14%
15%
16%
17%
2010 2011 2012 2013
Turnover
Top 5 talentsChance to
leave
1 Dwight Stewart 85%
2 Marion Young 76%
3 Iris Trump 63%
4 Churandy Martina 52%
5 Tom Peters 41%
HR metrics
HR analytics

HR analytics proces: transforming data to action-info
Problem Data AnalysisReporting,
action
From business question to analyticsquestion
Design research model (analysis tree, hypotheses)
Data sources, inventory, create
Data collecting Data cleaning
and enrichment
Analysis Reviewing
analysis tree and hypotheses
Combining and translating to insights and actions
Appropriatereporting, visualizationof results

Correlation and causality: Does more chocolate
eating leads to more Nobel price winners?

Or should we open more IKEA shops?
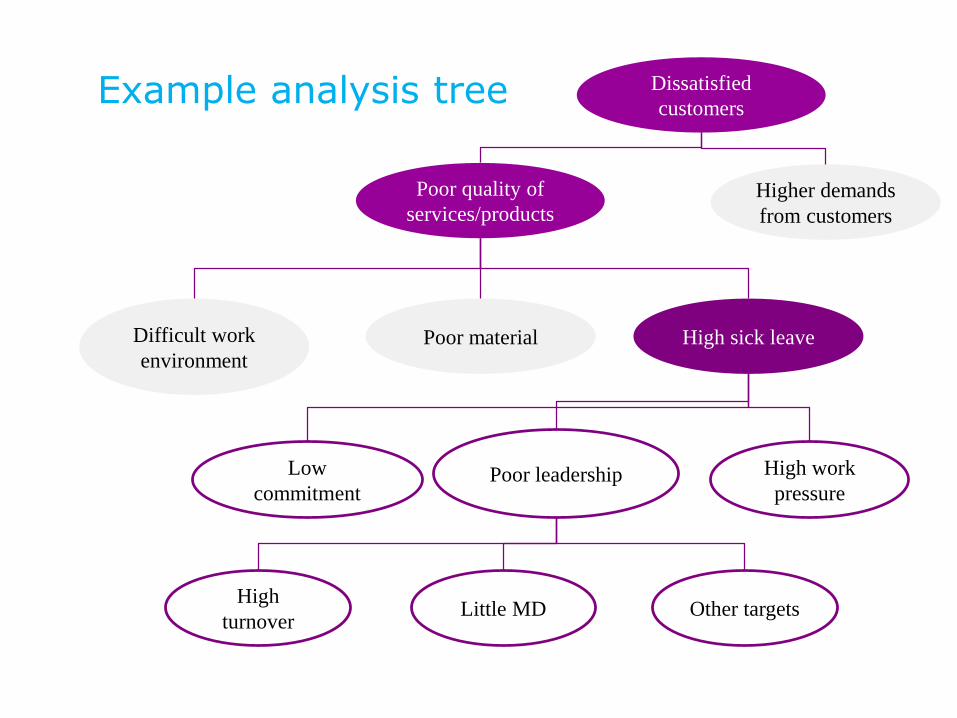
Example analysis tree
Poor quality of
services/products
Difficult work
environmentPoor material High sick leave
High work
pressurePoor leadershipLow
commitment
Other targetsLittle MDHigh
turnover
Dissatisfied
customers
Higher demands
from customers

Visualisation: Hoe many dots do
you see?

And now?

33
"A good hockey
player plays where
the puck is. A great
hockey player plays
where the puck is
going to be.“Wayne Gretzky

Conclusions HR Analytics
1. Do not collect KPI’s at random
2. Think also about KPI’s that are more difficult to measure
3. Focus on relation HR and business
4. Do not only look backwards, also use future data
5. Create a proper monitoring system
6. Create a logical design for analysis
7. Complete with a compact presentation (dashboard)

Short break
• Time for coffee and tea

Several books on HR planning
1993: HR3P 1999: strategy 2014: scenarios

Headlines
• WHY– Why SWP ?
• HOW– processes, data
• WHAT– Products, tools, instruments
37http://www.ted.com/talks/simon_sinek_how
_great_leaders_inspire_action?language=n
l

Wake-up call: understanding the importance
What will be important developments in the next years?
• Ageing and labour market consequences
• Vitality, sustainable employability
• Wage costs, budget steering
• Flexibility and income/work security
• Please add your own…

StrategicOrganisation Policy
StrategicHR-Policy
PIOFACH:people, import,
organisation, finance,
automation,communication,
housing.
StrategicHR Planning
(1)
(2)
(3)
(4)

If you don’t know where you are going, any road will take you thereLewis Caroll, “Alice in Wonderland”

41
Now
Future
Formation Actual
workforce
Desired
formation
Vis
ieio
n, m
iss
ion
,
str
ate
gy,
En
vir
on
men
t, e
tc.
K³R
Dyn
am
iek ID
U
Demand
Internal
Expected
workforce
Cocktail of
policies,
instruments and
actions
ScenarioScenario
Gaps
Vacancy
Abundancy
External
Supply
K³RK³R
K³R
Policy discussion
- Quantity
- Quality
- Costs
- Flexibility
K³R =
Scenario
automation,
outsourcing
Recruitment
training,
mobility
flexpool, etc
Ageing
Mobility
School leavers
Business cycle
Etc.
1
4
25
637
8
SWP building stones

SWP = K3R = chess on 4 boards
1. Right size: quantitative (hands)
2. Right shape: qualitative (brains)
3. Right costs: costs (dollars, euro’s)
4. Right agility: flexibility
But it should be
consumable…

SWP, Procrustes and tailor-made
• Many experiences in over 300 organisations. Differences in complexityand in degree of pragmatism. Anythinggoes….
• SWP should not become a Procrustes’ bed.
• SWP is tailor-made work.
Proces
Data
Product

SWP and proces
• Support from line managers and financedepartments.
• Position in Planning & Control cyclus
• Position in HR-cyclus

45
Generic SWP (environment, scenarios, strategy, budgets
Consolidating decentral outcomes and aggregate to organisation level
Projectmanagement (planning, communication, support)
SWP decentral
Translate central to decentral, finetuning, operationalisation
Ce
ntr
al
De
ce
ntr
al
Combination central and decentral

SPP and data
• How can you find, proces and analyse relevant data? Cross-sectional and also longitudinal?
• How can you combine HR data with financial data and other Big Data…
• How to combine quantitative and qualitative data (like fleet test)

SWP and product
• Relation with organisation strategy: scenario’s and positioning
• Present formation, PFM, job title mix
• Fleet test / HR3P
• Models for future labour supply
• Models for future labour demand
• Simulation models with possible variants

How to determine future formation(your future dream team)
At the level of job titles, there are 6 techniques:
• Extrapolation
• Proportional cutting (Dutch: kaasschaaf)
• Elbow-Machiavellism: hawks and doves
• Management opinions
• Via the product-dimension (U-turn)
• Idem, including several scenario’s

Present formation: γνῶθι σεαυτόν (gnothi seauton)
• What do we produce: core tasks and products?
• Who contributes labour for this(primary job titles, not overhead)?
• How do you produce each product, with how much labour (job titlemix)?

Products/Job title Matrix (2015)
product Job title A Job title B Job title C Total # hours
Product 1 7.000 64.000 16.000 87.000
Product 2 28.000 16.000 20.000 64.000
Product 3 35.000 0 4.000 39.000
total 70.000 80.000 40.000 190.000
W
H
A
T
WHO
HOW

Scenario’s: not SWOT but TOWS
• Analyse outside-in
• Strategy: plan A, B, C, D,
instead of “JWWH”
• Future is not predictable, however itis imaginable
What will be the effects on product volumes?

Strategy and positioning
Operational
Excellence
Operational
Excellence
Customer
Intimacy
Customer
Intimacy
Product
Leadership
Product
Leadership
What should be effects for
desired future job title mix?

The U-turn and steering wheels
l
Net hours
per job title
2015
Job title
mix 2015Desired job
title -mix
2018
Products
2015
Products
2018
Net hours per
job title, 2018
3
2
4
5
6
FTE per job
title 2015
Desired FTE per
job title 2018
Present
GNT
New
desired
GNT
18
PJT
2015
7
?????
3
Scenarios
1
2
3

Building stone 4
Information about size and characteristics of the actual workforce
Also its quality, costs and agility
And about its dynamics (Inflow, Throughflow, Outflow)

Quality: the Fleet test
Evers (1993), HR3P, the HR Performance-
Potential-Portfolio approach

The HR3P – matrix
Present performance
potential bad moderate fine excellent
No potential Peter,
Sharita
Susan,
Dick
Mary,
Patricia
Henk & Ingrid
Moderate
potential
Ayla, Pip Irene
Florence
Alice, Chuck
Good
potential
Sven Tommy
Excellent
potential
Jacques Geert-Jan,
Jorieke
56

HR3P
underperformers 31% diesels 44%
question marks 5% stars 20%
Performancelevel
low high
low
high
Potential
57

Building Stone 7: Expected gaps
1. What will be gaps within 3-5 years?
2. Make a distinction between
quantitative gaps, qualitative gaps,
cost gaps and agility gaps.

Example gap analysis
dimension Desired
formation
Expected
workforce
solutions
quantitative 400 fte 500 persons;
350 fte
qualitative High on
entrepeneurship
Moderate level
costs 30 mln 28 mln
flexibility 80 fte temporary 20 fte temporary

Building Stone 8: Solutions
1. SWP is self-denying prophecy
2. Cocktail: several instruments available.
3. Rubik-puzzle

61
With SWP, there is a picture
“Key-players”• Retention plan:
• MD• Compensation, bonus• Training
“To be moved”• Assess potential• Development plans• Mobility plan• Outplacement
“Present core”• Assess potential• Development plans• Mobility plan• Outplacement plan
“Prospects”• Recruitment program• Training• Collaboration with external suppliers“Unused potential”
• Alternative employment• Temporary detachment• Retention policy
“temporary forces”• short term contracts• detached workers fromelsewhere
“Most wanted”• Recruitment• MD/TD• Training
Needed in
future
Now
presentNow
needed
1
2
3
4
5
7
6

Questions…?