Embed Size (px)
Citation preview
Everglades Agricultural AreaStorage Reservoir Feasibility Study
November 6, 2017
Meeting Agenda Welcome and Introductions Project Study, Scope and Schedule Baseline Condition Modeling Results Initial Alternatives Scoping Next Steps Public Comment
2
PROJECT STUDY, SCOPE AND SCHEDULEEAA Storage Reservoir Feasibility Study
3
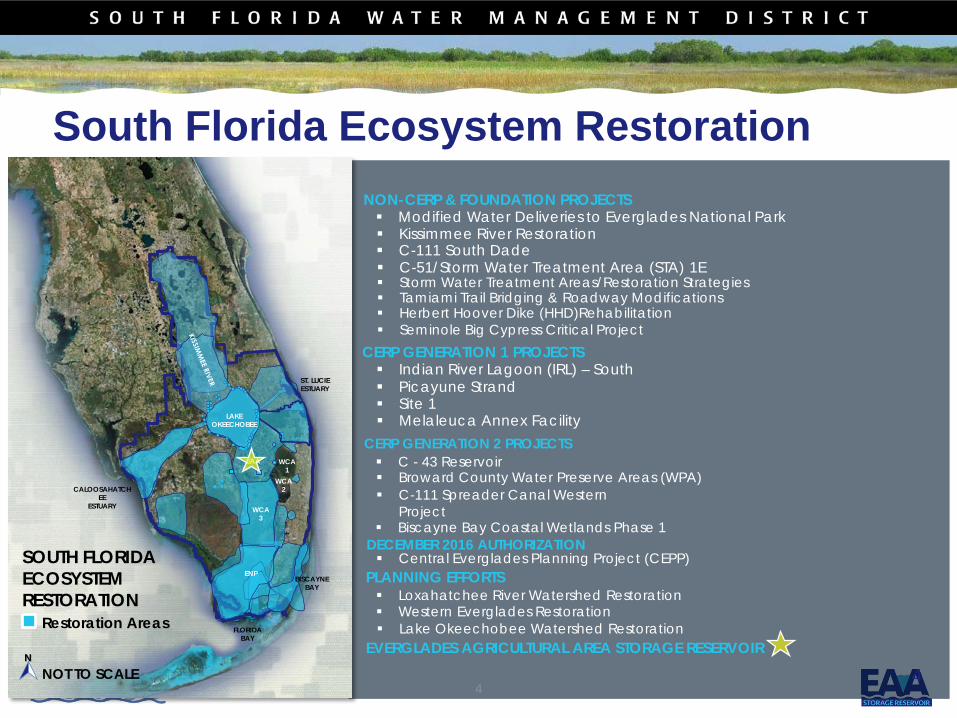
South Florida Ecosystem Restoration
Modified Water Deliveries to Everglades National Park
Seminole Big Cypress Critical ProjectCERP GENERATION 1 PROJECTS
CERP GENERATION 2 PROJECTS
C-111 South Dade C-51/Storm Water Treatment Area (STA) 1E
Indian River Lagoon (IRL) – South Picayune Strand Site 1 Melaleuca Annex Facility
Broward County Water Preserve Areas (WPA) C-111 Spreader Canal Western
Project Biscayne Bay Coastal Wetlands Phase 1
C - 43 Reservoir
Kissimmee River Restoration
NON-CERP & FOUNDATION PROJECTS
Lake Okeechobee Watershed Restoration
Central Everglades Planning Project (CEPP)PLANNING EFFORTS
Western Everglades Restoration
Storm Water Treatment Areas/Restoration Strategies Tamiami Trail Bridging & Roadway Modifications
SOUTH FLORIDA ECOSYSTEM RESTORATION
N
ENP
WCA3
EAA WCA1
WCA2CALOOSAHATCH
EEESTUARY
ST. LUCIEESTUARY
FLORIDABAY
Restoration Areas
BISCAYNEBAY
DECEMBER 2016 AUTHORIZATION
Loxahatchee River Watershed Restoration
Herbert Hoover Dike (HHD)Rehabilitation
LAKEOKEECHOBEE
NOT TO SCALE 4EVERGLADES AGRICULTURAL AREA STORAGE RESERVOIR
4
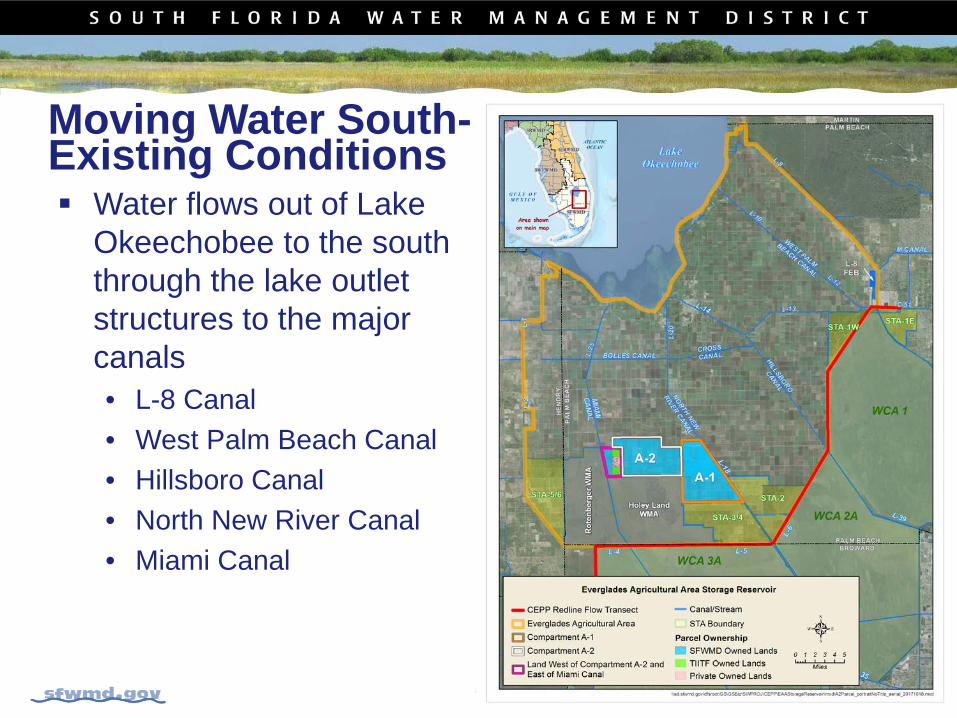
Water flows out of Lake Okeechobee to the south through the lake outlet structures to the major canals• L-8 Canal• West Palm Beach Canal• Hillsboro Canal• North New River Canal• Miami Canal
5
Moving Water South-Existing Conditions
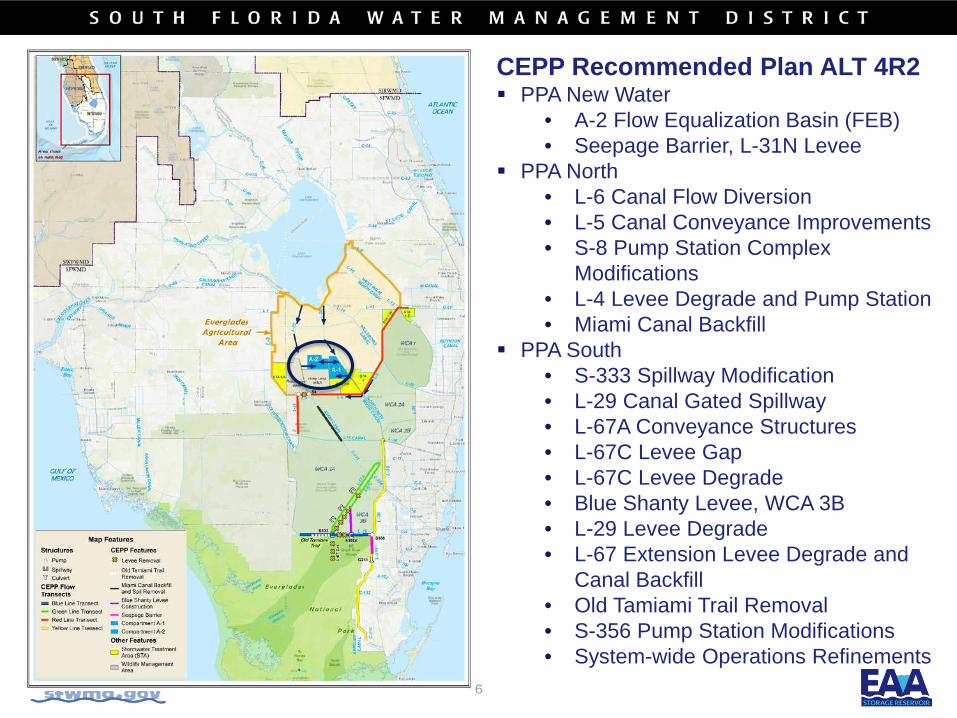
CEPP Recommended Plan ALT 4R2 PPA New Water
• A-2 Flow Equalization Basin (FEB)• Seepage Barrier, L-31N Levee
PPA North• L-6 Canal Flow Diversion• L-5 Canal Conveyance Improvements• S-8 Pump Station Complex
Modifications• L-4 Levee Degrade and Pump Station• Miami Canal Backfill
PPA South• S-333 Spillway Modification• L-29 Canal Gated Spillway• L-67A Conveyance Structures• L-67C Levee Gap • L-67C Levee Degrade • Blue Shanty Levee, WCA 3B• L-29 Levee Degrade• L-67 Extension Levee Degrade and
Canal Backfill• Old Tamiami Trail Removal• S-356 Pump Station Modifications• System-wide Operations Refinements
6
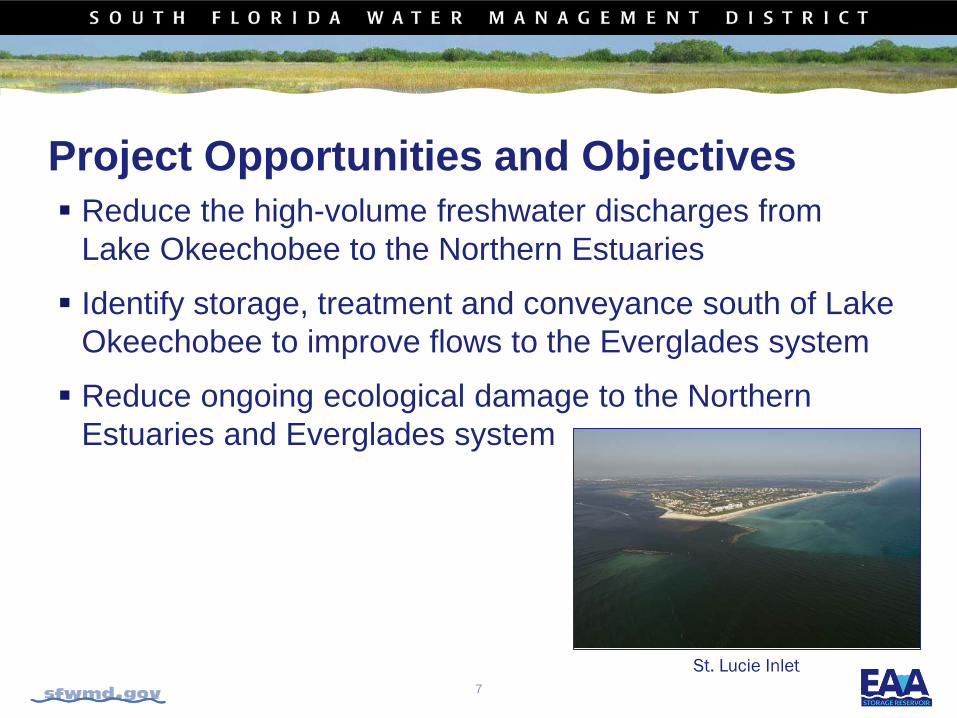
Project Opportunities and Objectives Reduce the high-volume freshwater discharges from
Lake Okeechobee to the Northern Estuaries Identify storage, treatment and conveyance south of Lake
Okeechobee to improve flows to the Everglades system Reduce ongoing ecological damage to the Northern
Estuaries and Everglades system
St. Lucie Inlet7
Constraints WRDA 2000 Sec. 601(h)(5); Sec. 373.1501, F.S.
• Elimination or transfer of existing legal sources of water must be addressed
• Maintain existing level of flood protection
Meet applicable water quality standards• Will not cause or contribute to a violation of state
water quality standards, permit discharge limits or specific permit conditions
• Reasonable assurances exist that adverse impacts on flora and fauna will not occur
Remain within federal authorities (CERP)
8
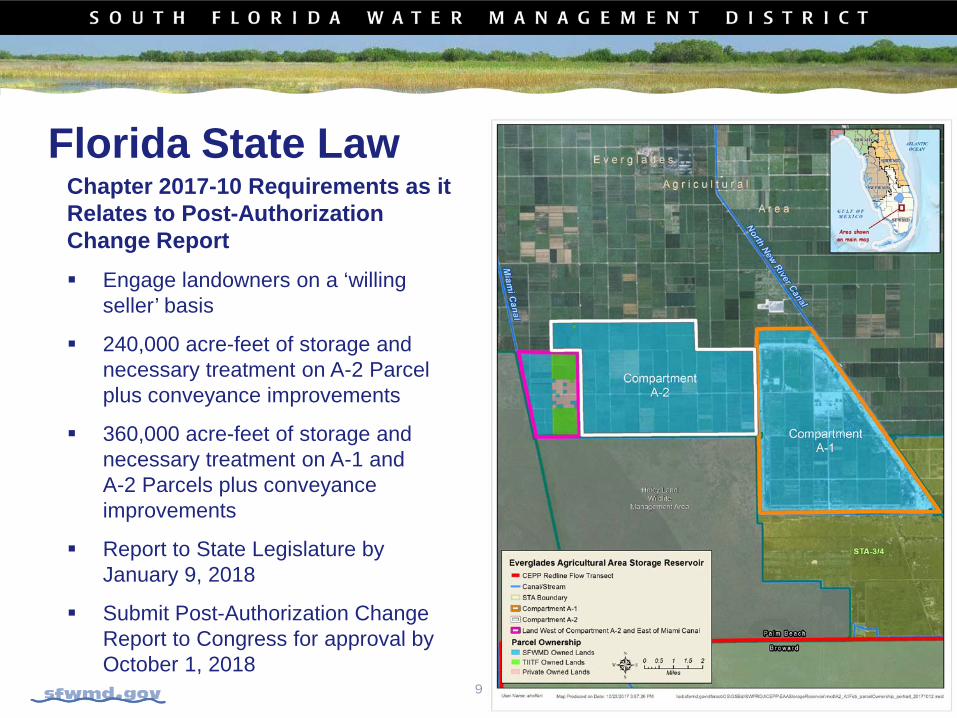
Chapter 2017-10 Requirements as it Relates to Post-Authorization Change Report Engage landowners on a ‘willing
seller’ basis
240,000 acre-feet of storage and necessary treatment on A-2 Parcel plus conveyance improvements
360,000 acre-feet of storage and necessary treatment on A-1 and A-2 Parcels plus conveyance improvements
Report to State Legislature by January 9, 2018
Submit Post-Authorization Change Report to Congress for approval by October 1, 2018
Florida State Law
9
Planning Process & Schedule Section 203 of the Water Resources Development Act
(WRDA) of 1986, as amended Key Activities and Target Dates:
• Update to Florida State Legislature - by January 9, 2018• Draft Report complete – by January 30, 2018• Final Report and submittal to Assistant Secretary of the
Army for Civil Works – March 30, 2018• ASA(CW) submit report to Congress – October 1, 2018• Anticipated Congressional authorization – by
December 31, 2019
10
BASE CONDITIONMODELING RESULTSEAA Storage Reservoir Feasibility Study
11
Modeling of “Baseline” scenarios helps to provide reference points for comparison. These scenarios show how current conditions or “No Action” future conditions will perform so that the potential benefits of suggested infrastructure changes can be evaluated.
Guiding principle in developing baseline modeling for the EAA Storage Reservoir planning effort:
Try to maintain consistency with Central Everglades Planning (CEPP)
Baseline Modeling
12
Baseline Modeling Assumptions (cont) Existing Condition Baseline (EARECB) attempts to represent on-
ground conditions circa 2017
• Assumptions per CEPP RSMBN ECB and IORBL1 simulations (depending on sub-basin) and CEPP RSMGL 2012EC (Scenarios defined in CEPP Project Implementation Report)
Future Without Project Baseline (EARFWO) attempts to represent the projected future conditions circa 50 years in the future if there was no EAA Storage Reservoir Project
• Assumptions per RSMBN ALT4R2 and RSMGL ALT4R2 (CEPP Selected Plan + Other Authorized Projects)
Today’s presentation will review a system-wide comparison of Current EARECB and Future EARFWO Baselines.
13
14
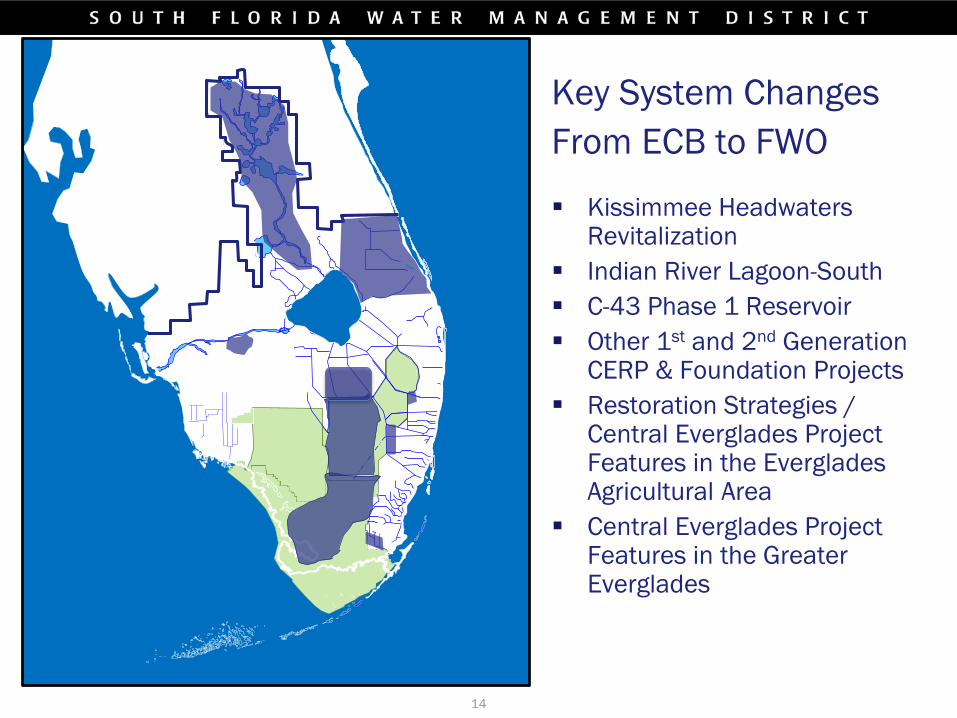
Key System ChangesFrom ECB to FWO
Kissimmee Headwaters Revitalization
Indian River Lagoon-South C-43 Phase 1 Reservoir Other 1st and 2nd Generation
CERP & Foundation Projects Restoration Strategies /
Central Everglades Project Features in the Everglades Agricultural Area
Central Everglades Project Features in the Greater Everglades
15
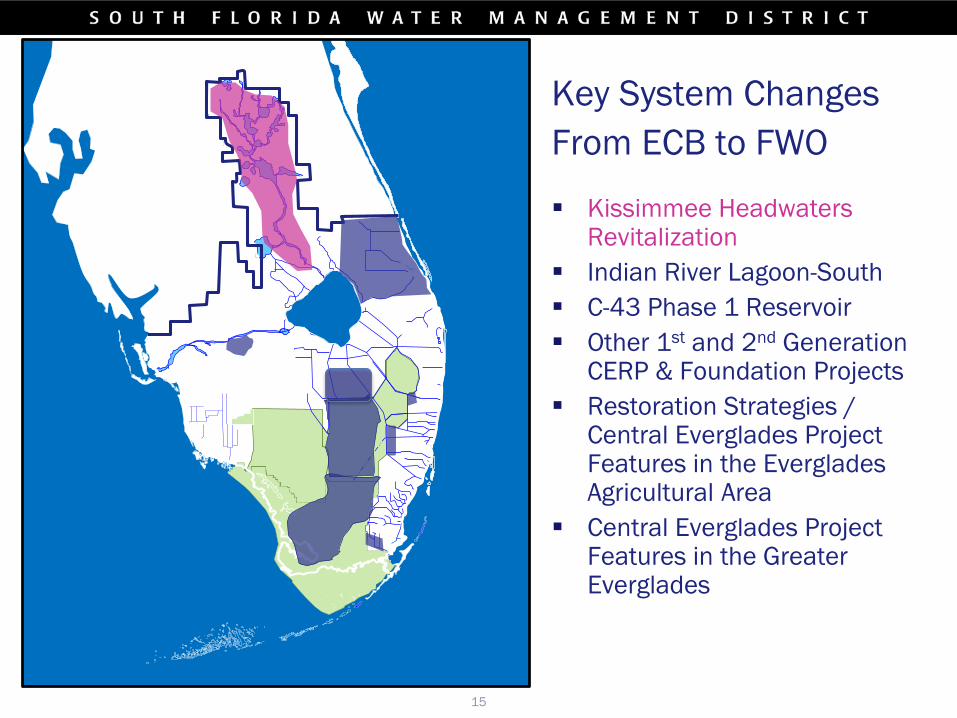
Key System ChangesFrom ECB to FWO
Kissimmee Headwaters Revitalization
Indian River Lagoon-South C-43 Phase 1 Reservoir Other 1st and 2nd Generation
CERP & Foundation Projects Restoration Strategies /
Central Everglades Project Features in the Everglades Agricultural Area
Central Everglades Project Features in the Greater Everglades
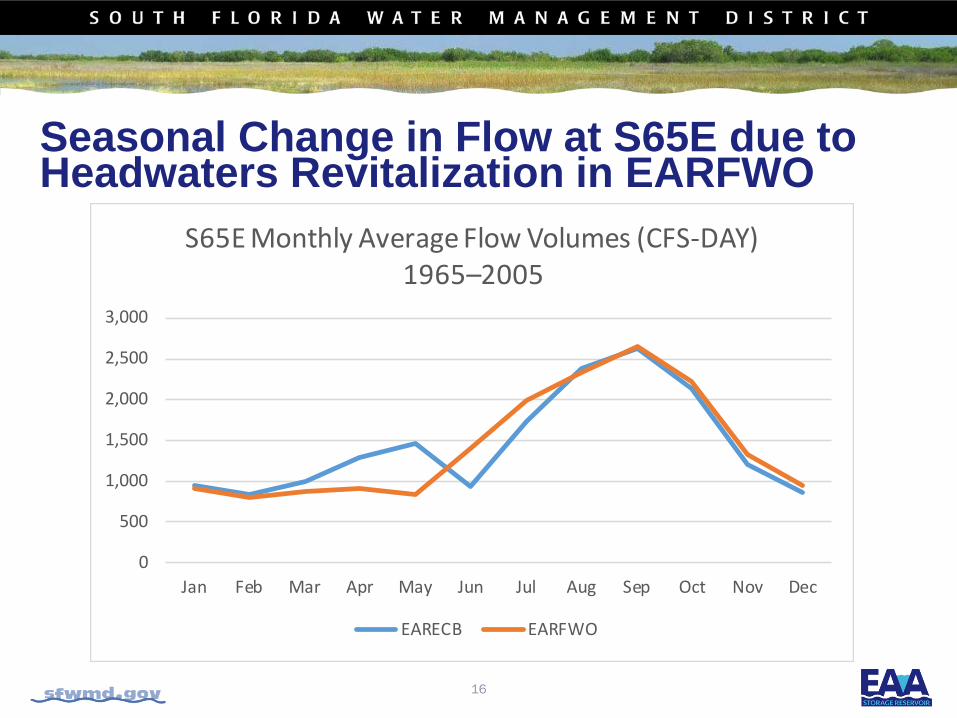
Seasonal Change in Flow at S65E due to Headwaters Revitalization in EARFWO
16
0
500
1,000
1,500
2,000
2,500
3,000
Jan Feb Mar Apr May Jun Jul Aug Sep Oct Nov Dec
S65E Monthly Average Flow Volumes (CFS-DAY) 1965–2005
EARECB EARFWO

17
Key System ChangesFrom ECB to FWO
Kissimmee Headwaters Revitalization
Indian River Lagoon-South C-43 Phase 1 Reservoir Other 1st and 2nd Generation
CERP & Foundation Projects Restoration Strategies /
Central Everglades Project Features in the Everglades Agricultural Area
Central Everglades Project Features in the Greater Everglades
18
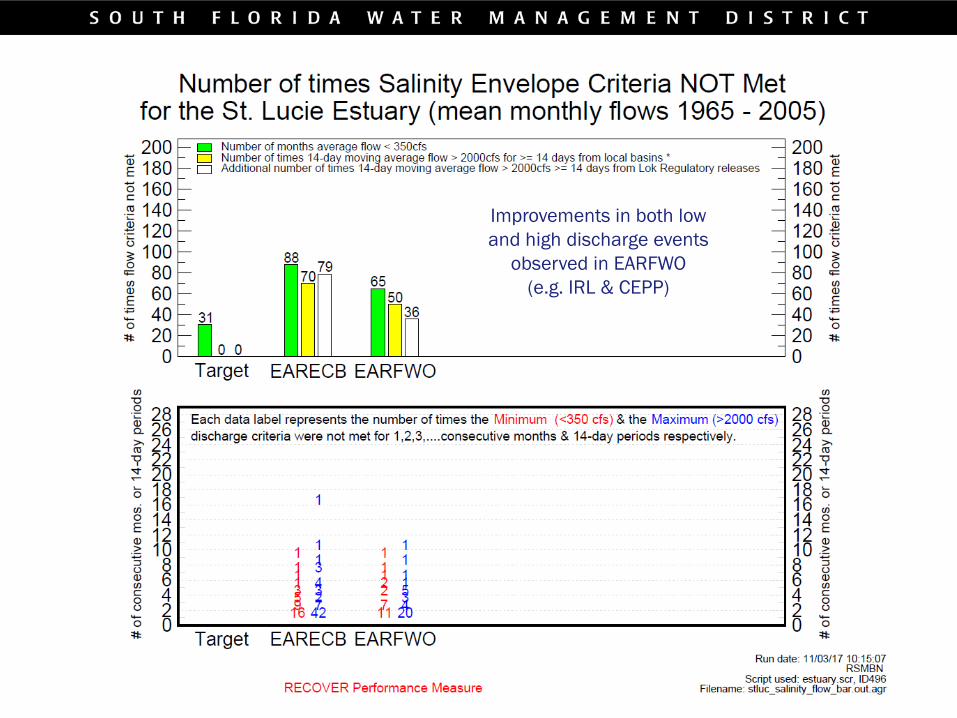
Improvements in both low and high discharge events
observed in EARFWO (e.g. IRL & CEPP)

19
Key System ChangesFrom ECB to FWO
Kissimmee Headwaters Revitalization
Indian River Lagoon-South C-43 Phase 1 Reservoir Other 1st and 2nd Generation
CERP & Foundation Projects Restoration Strategies /
Central Everglades Project Features in the Everglades Agricultural Area
Central Everglades Project Features in the Greater Everglades
20
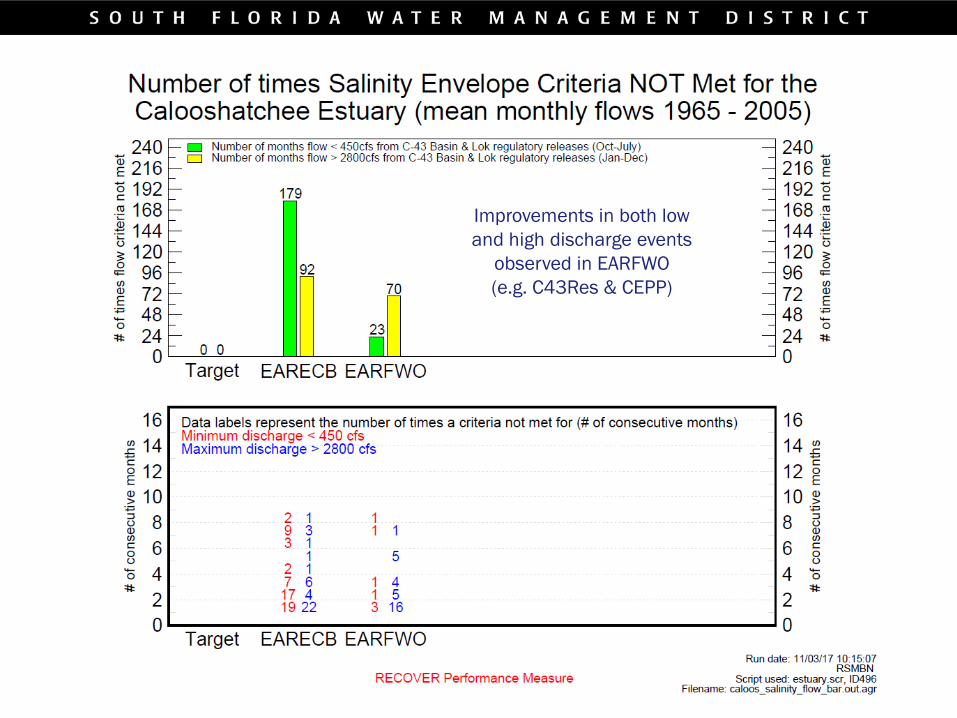
Improvements in both low and high discharge events
observed in EARFWO (e.g. C43Res & CEPP)

21
Key System ChangesFrom ECB to FWO
Kissimmee Headwaters Revitalization
Indian River Lagoon-South C-43 Phase 1 Reservoir Other 1st and 2nd Generation
CERP & Foundation Projects Restoration Strategies /
Central Everglades Project Features in the Everglades Agricultural Area
Central Everglades Project Features in the Greater Everglades
EARECB EARFWO
23
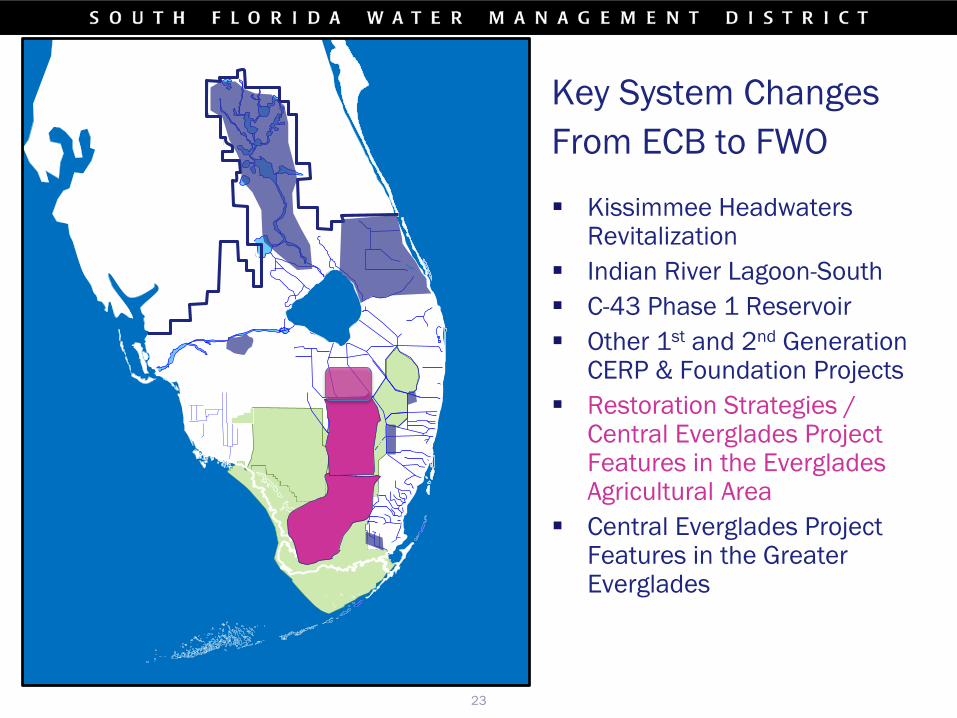
Key System ChangesFrom ECB to FWO
Kissimmee Headwaters Revitalization
Indian River Lagoon-South C-43 Phase 1 Reservoir Other 1st and 2nd Generation
CERP & Foundation Projects Restoration Strategies /
Central Everglades Project Features in the Everglades Agricultural Area
Central Everglades Project Features in the Greater Everglades
24
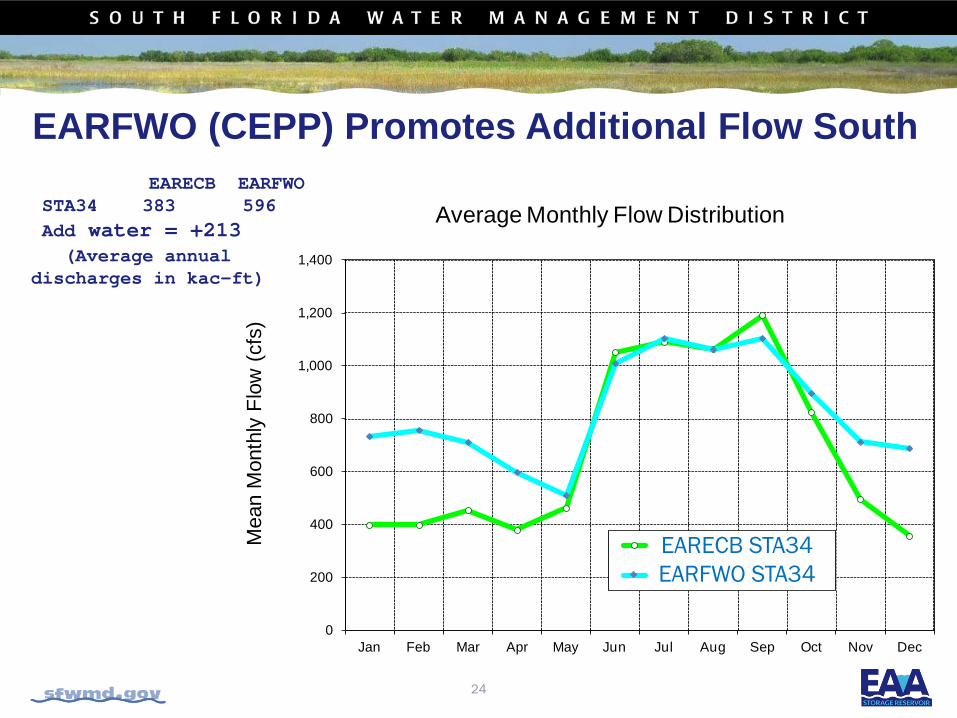
EARFWO (CEPP) Promotes Additional Flow South
0
200
400
600
800
1,000
1,200
1,400
Jan Feb Mar Apr May Jun Jul Aug Sep Oct Nov Dec
Mea
n M
onth
ly F
low
(cfs
)
Average Monthly Flow Distribution
RS: STA34
CEPP RSMBN FEB Alt: STA34
EARECB STA34EARFWO STA34
EARECB EARFWOSTA34 383 596Add water = +213(Average annual
discharges in kac-ft)
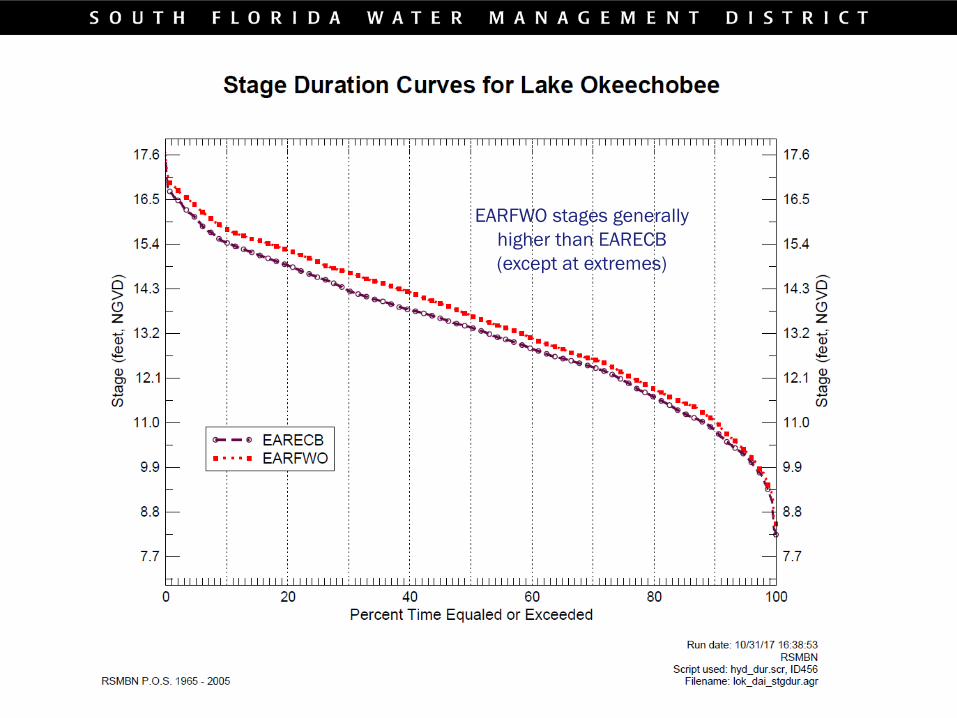
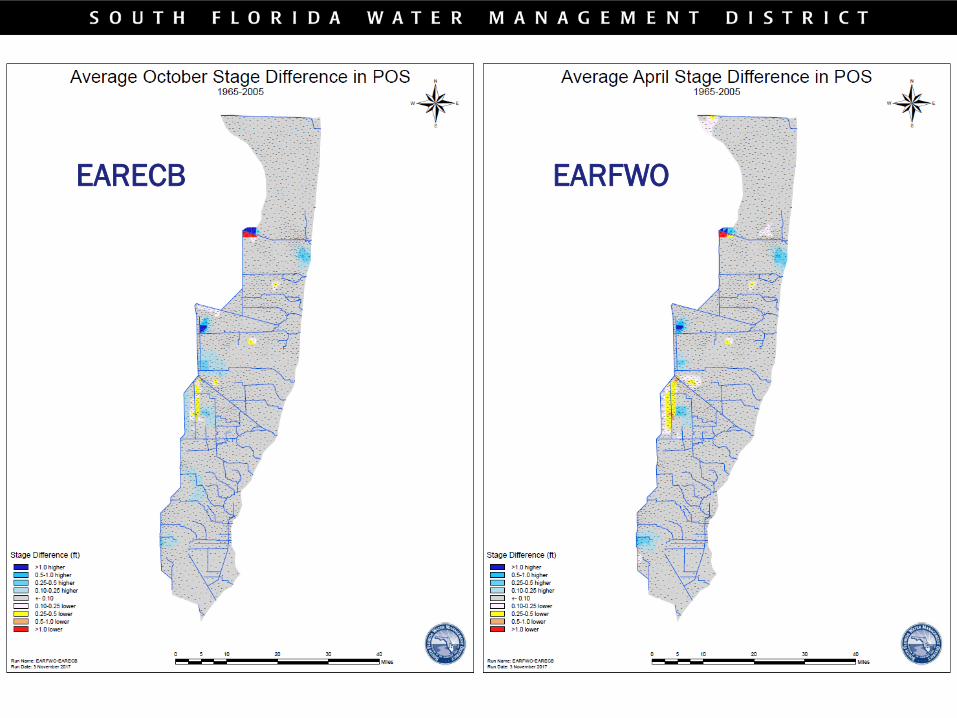
EARFWO stages generally higher than EARECB (except at extremes)
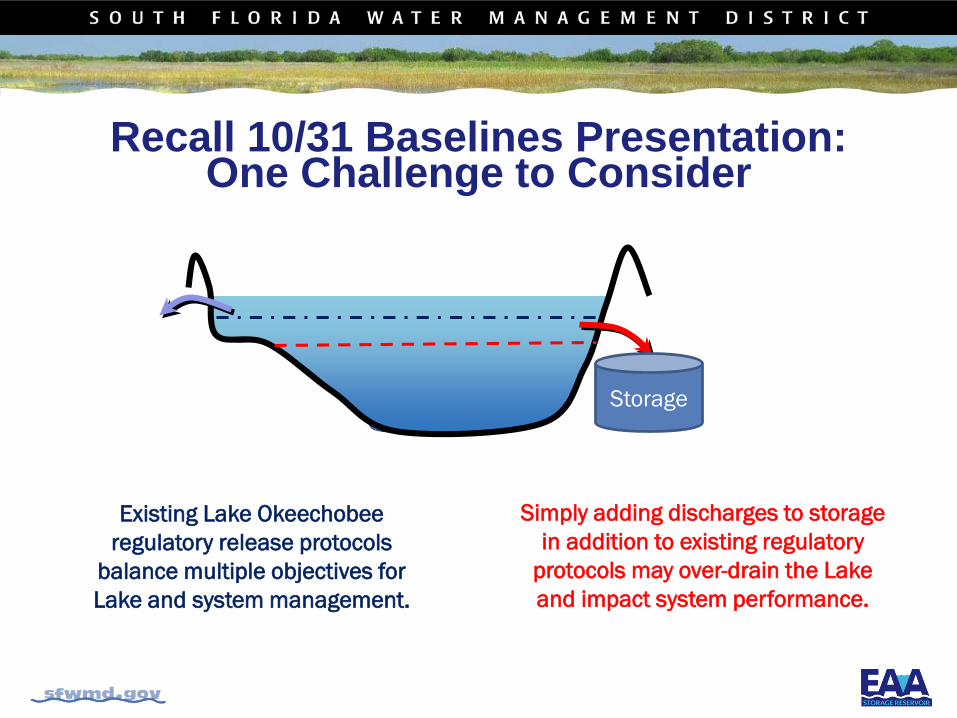
Recall 10/31 Baselines Presentation:One Challenge to Consider
Storage
Existing Lake Okeechobee regulatory release protocols
balance multiple objectives for Lake and system management.
Simply adding discharges to storage in addition to existing regulatory
protocols may over-drain the Lake and impact system performance.
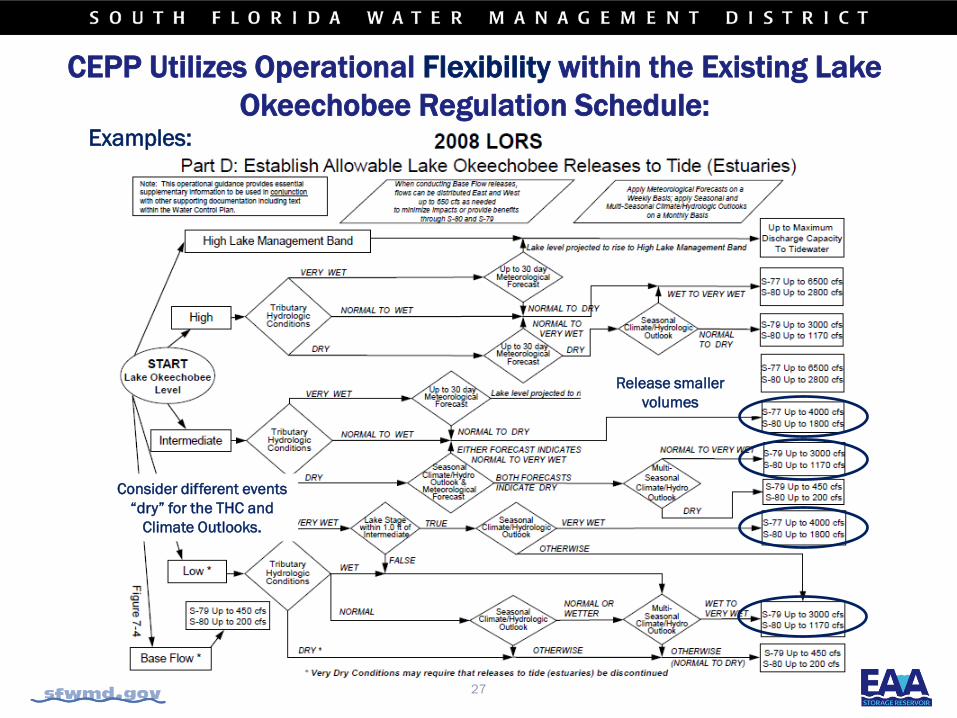
CEPP Utilizes Operational Flexibility within the Existing Lake Okeechobee Regulation Schedule:
Examples:
Release smaller volumes
Consider different events “dry” for the THC and
Climate Outlooks.
27
28
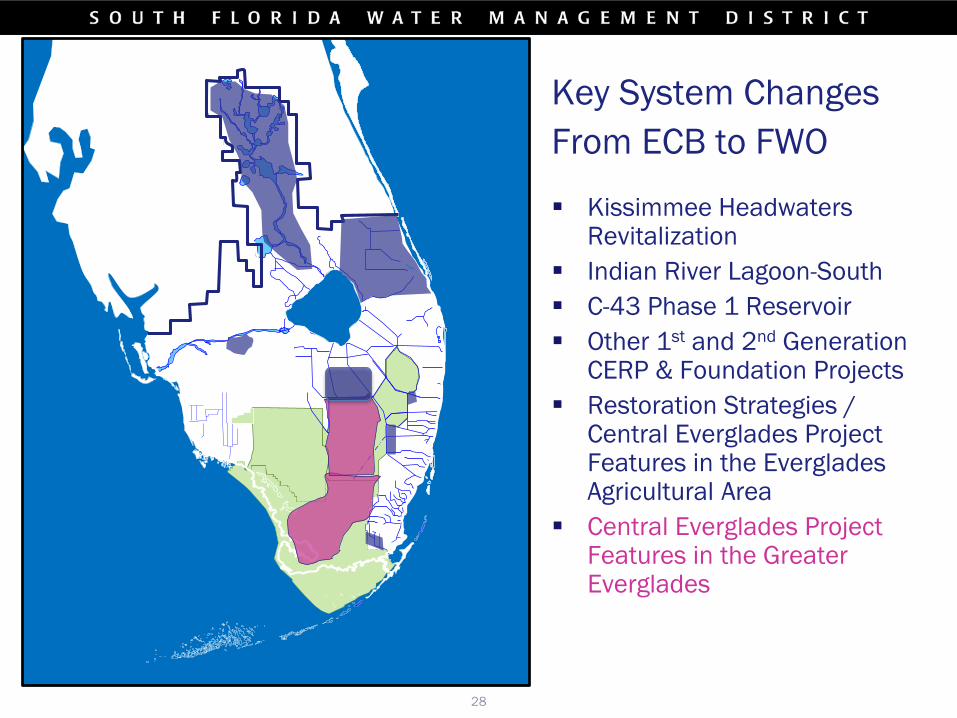
Key System ChangesFrom ECB to FWO
Kissimmee Headwaters Revitalization
Indian River Lagoon-South C-43 Phase 1 Reservoir Other 1st and 2nd Generation
CERP & Foundation Projects Restoration Strategies /
Central Everglades Project Features in the Everglades Agricultural Area
Central Everglades Project Features in the Greater Everglades
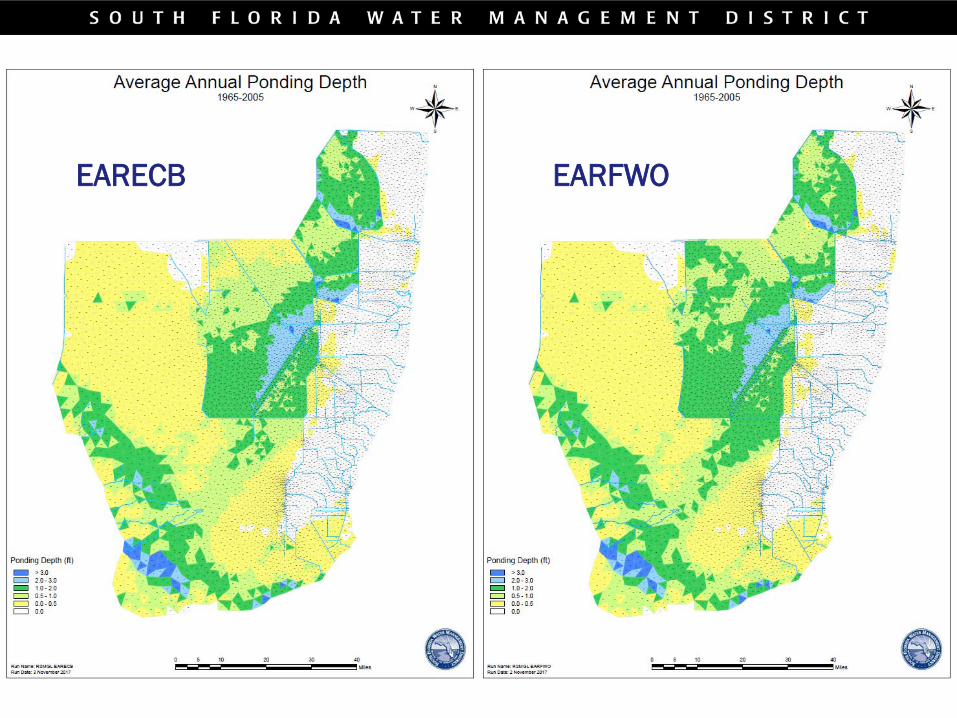
EARECB EARFWO
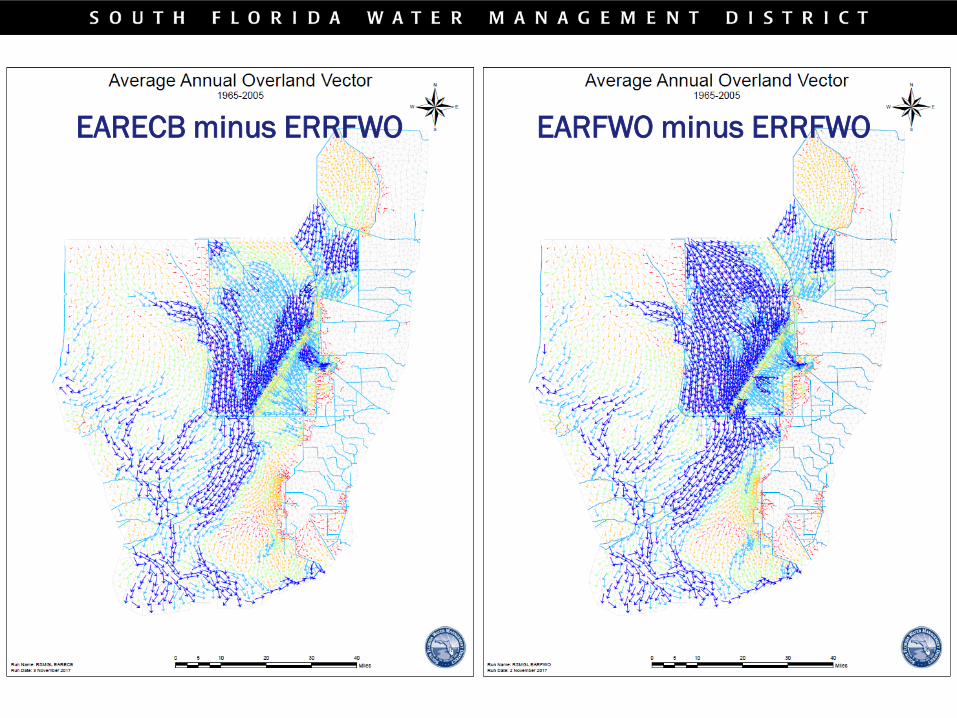
EARECB minus ERRFWO EARFWO minus ERRFWO
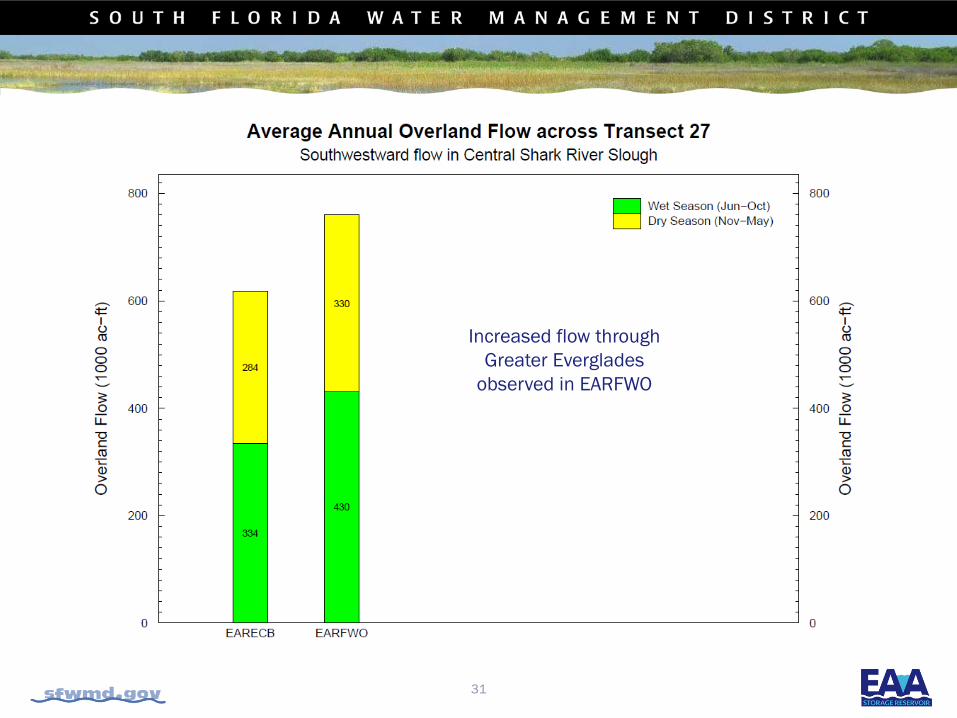
31
Increased flow through Greater Everglades
observed in EARFWO
EAA Storage Reservoir Modeling Data
Modeling data is available via ftp at:ftp://ftp.sfwmd.gov/pub/EAASR/
INITIAL ALTERNATIVES SCOPINGEAA Storage Reservoir Feasibility Study
33
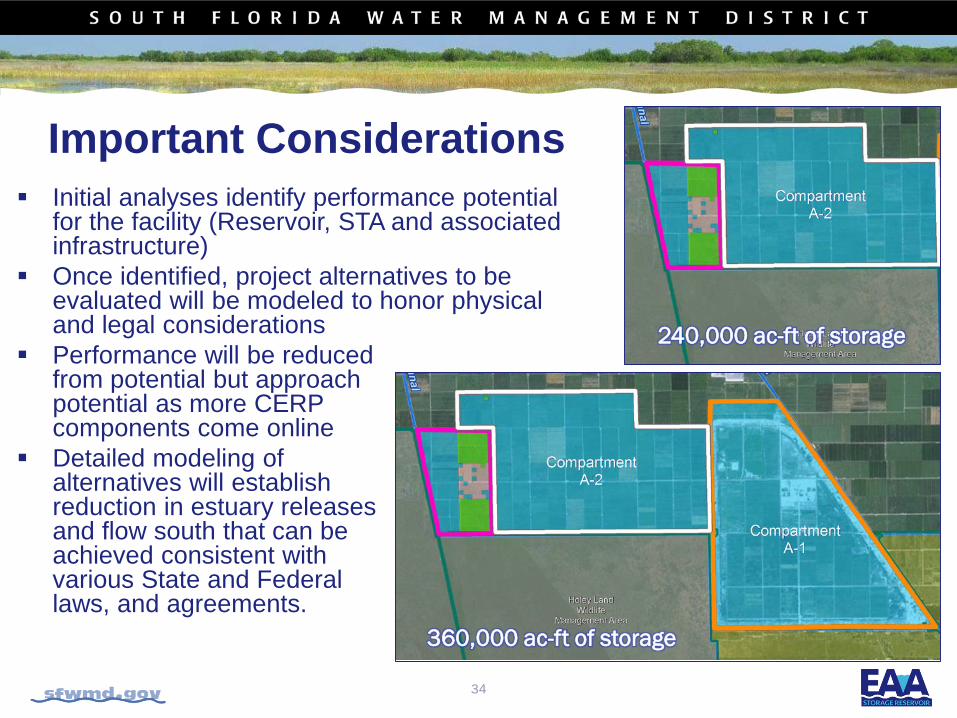
Initial analyses identify performance potential for the facility (Reservoir, STA and associated infrastructure)
Once identified, project alternatives to be evaluated will be modeled to honor physical and legal considerations
Performance will be reduced from potential but approach potential as more CERP components come online
Detailed modeling of alternatives will establish reduction in estuary releases and flow south that can be achieved consistent with various State and Federal laws, and agreements.
34
Important Considerations
240,000 ac-ft of storage
360,000 ac-ft of storage
Informing the EAA Storage Reservoir Study: Defining the CERP Goal
The following scenarios represent the with- and without- CERP conditions: Pre-CERP Baseline (PCB1)
per RECOVER, 2005 Full CERP (CERPA) per
RECOVER 2005
These scenarios combined with the original Plan report (Restudy, 1999) help to inform EAA Storage Reservoir planning
35
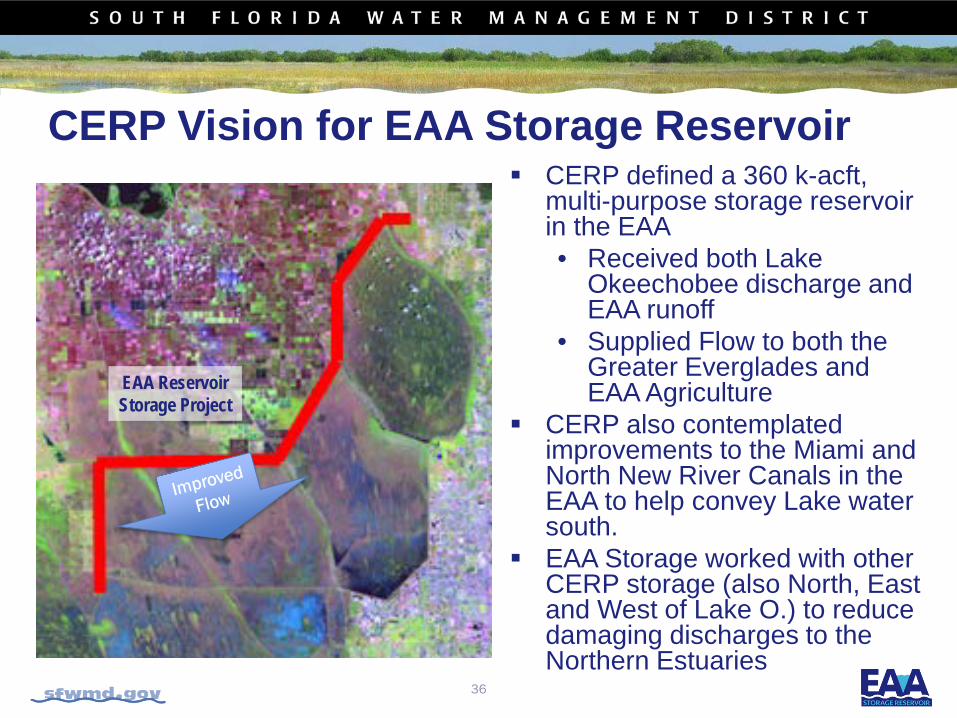
CERP Vision for EAA Storage Reservoir CERP defined a 360 k-acft,
multi-purpose storage reservoir in the EAA• Received both Lake
Okeechobee discharge and EAA runoff
• Supplied Flow to both the Greater Everglades and EAA Agriculture
CERP also contemplated improvements to the Miami and North New River Canals in the EAA to help convey Lake water south.
EAA Storage worked with other CERP storage (also North, East and West of Lake O.) to reduce damaging discharges to the Northern Estuaries
EAA ReservoirStorage Project
36
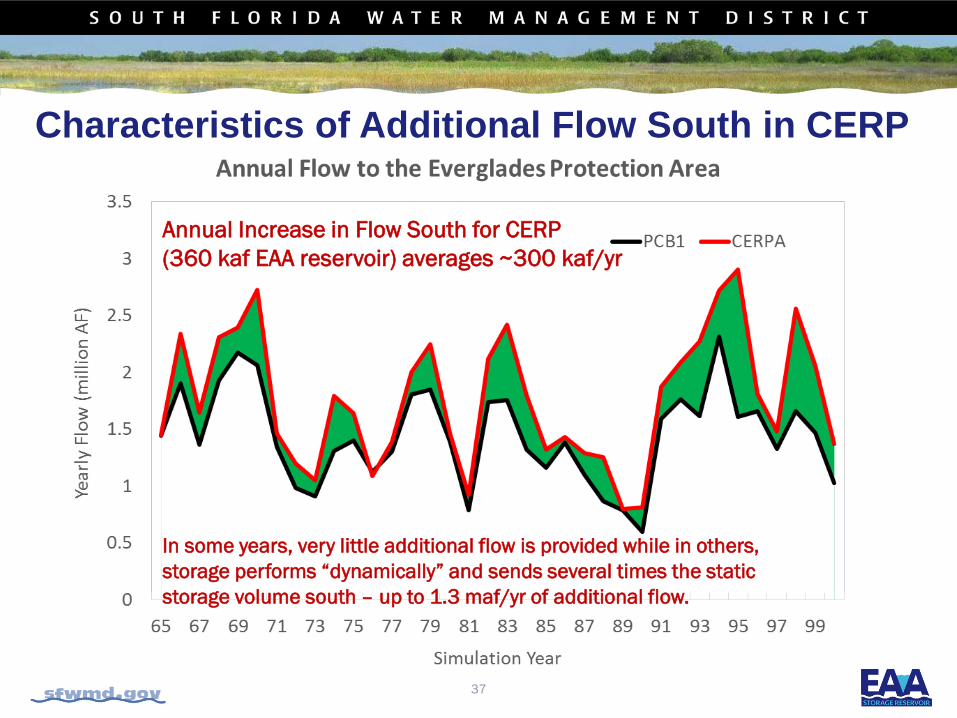
Characteristics of Additional Flow South in CERP
Annual Increase in Flow South for CERP(360 kaf EAA reservoir) averages ~300 kaf/yr
In some years, very little additional flow is provided while in others, storage performs “dynamically” and sends several times the static storage volume south – up to 1.3 maf/yr of additional flow.
37
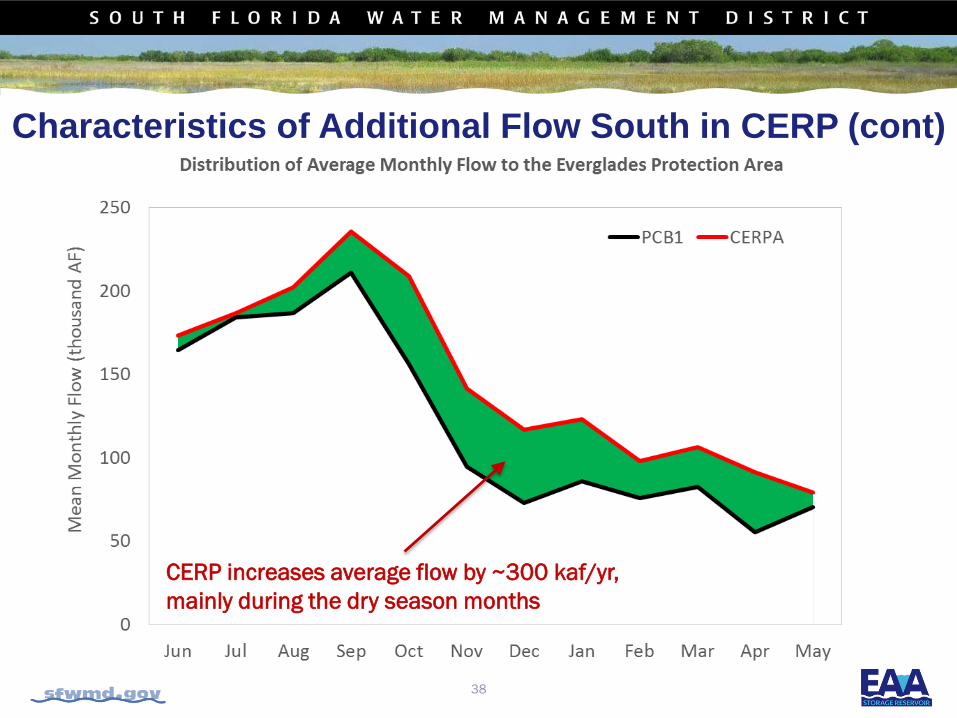
Characteristics of Additional Flow South in CERP (cont)
CERP increases average flow by ~300 kaf/yr, mainly during the dry season months
38
SIZING OF MANAGEMENT MEASURESEAA Storage Reservoir Feasibility Study
39
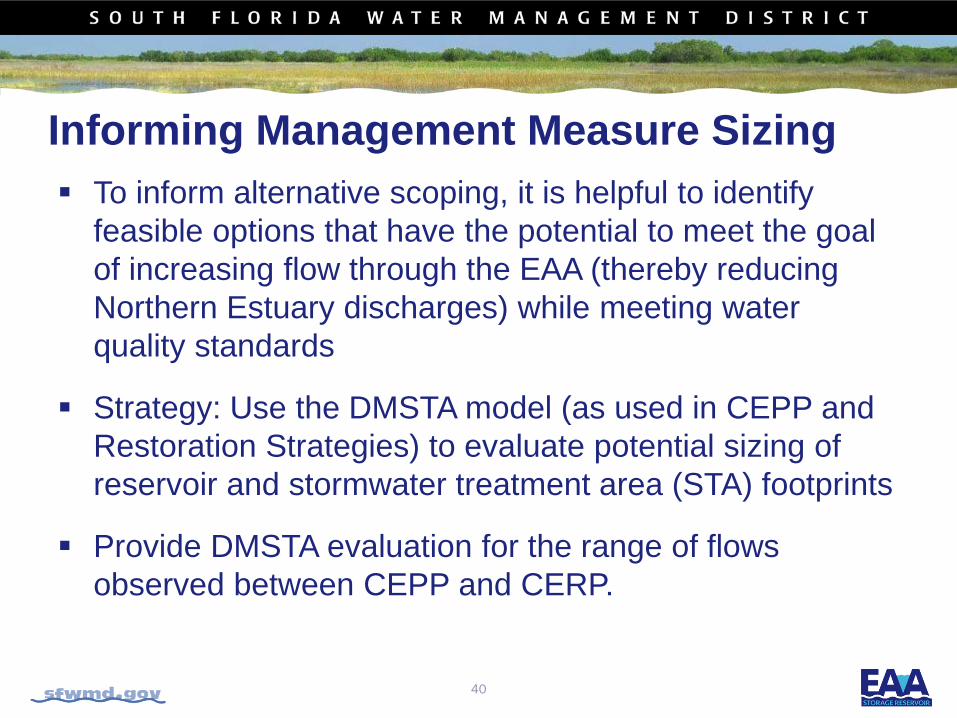
Informing Management Measure Sizing To inform alternative scoping, it is helpful to identify
feasible options that have the potential to meet the goal of increasing flow through the EAA (thereby reducing Northern Estuary discharges) while meeting water quality standards
Strategy: Use the DMSTA model (as used in CEPP and Restoration Strategies) to evaluate potential sizing of reservoir and stormwater treatment area (STA) footprints
Provide DMSTA evaluation for the range of flows observed between CEPP and CERP.
40
41
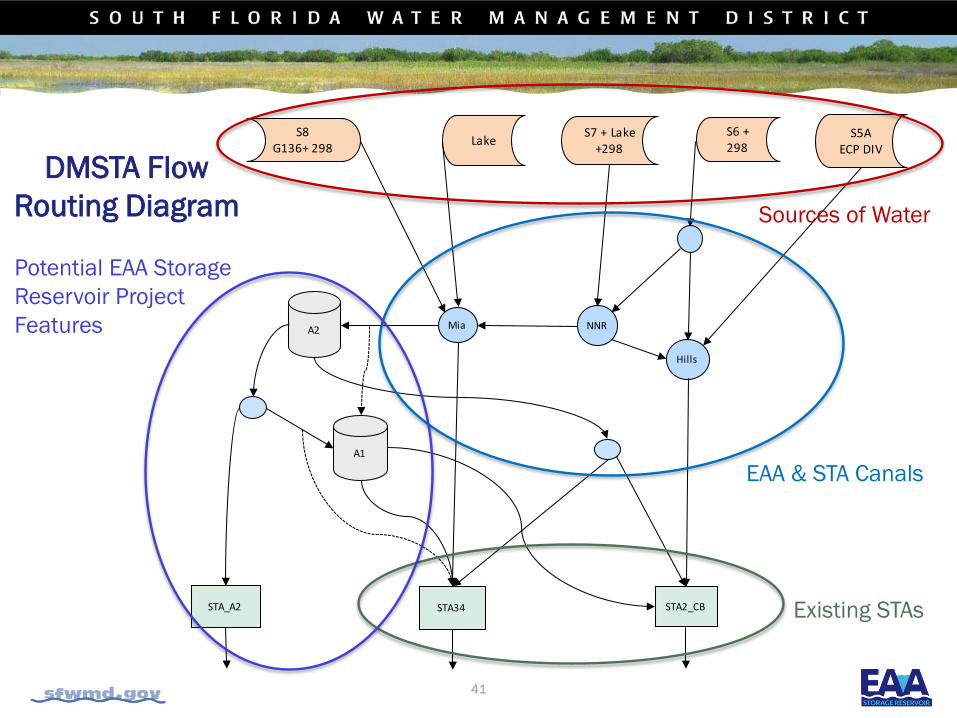
A1
STA2_CB
S6 + 298
A2 NNR
Hills
S8G136+ 298
S7 + Lake +298Lake S5A
ECP DIV
STA34
Mia
STA_A2
DMSTA Flow Routing Diagram Sources of Water
EAA & STA Canals
Existing STAs
Potential EAA Storage Reservoir Project Features
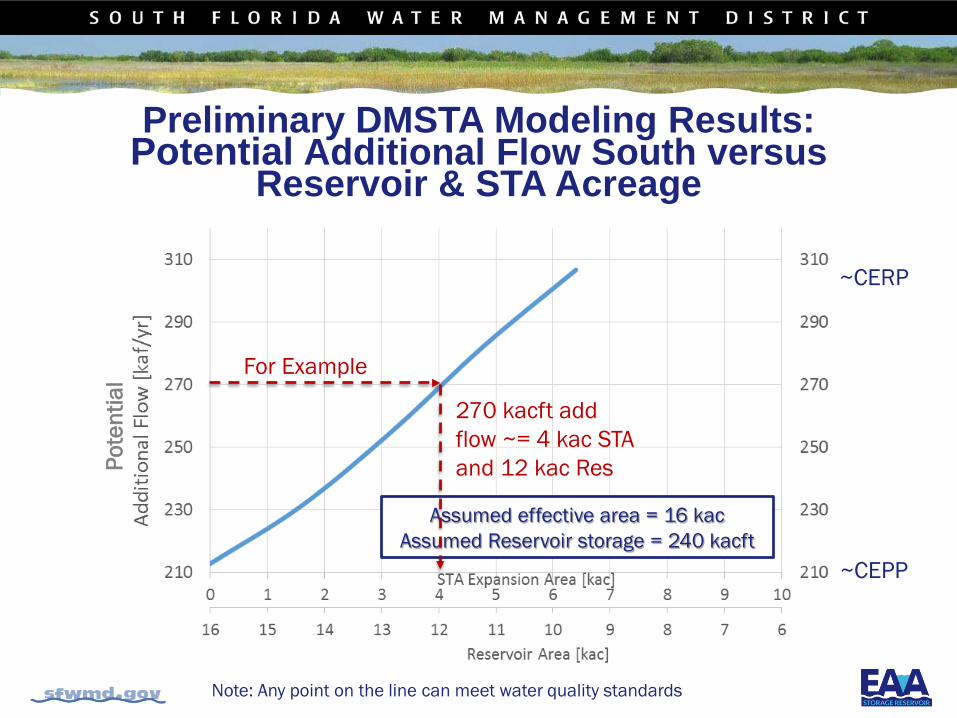
Preliminary DMSTA Modeling Results:Potential Additional Flow South versus
Reservoir & STA Acreage
Assumed effective area = 16 kacAssumed Reservoir storage = 240 kacft
Pote
ntia
l
Note: Any point on the line can meet water quality standards
~CEPP
~CERP
For Example
270 kacft add flow ~= 4 kac STA and 12 kac Res
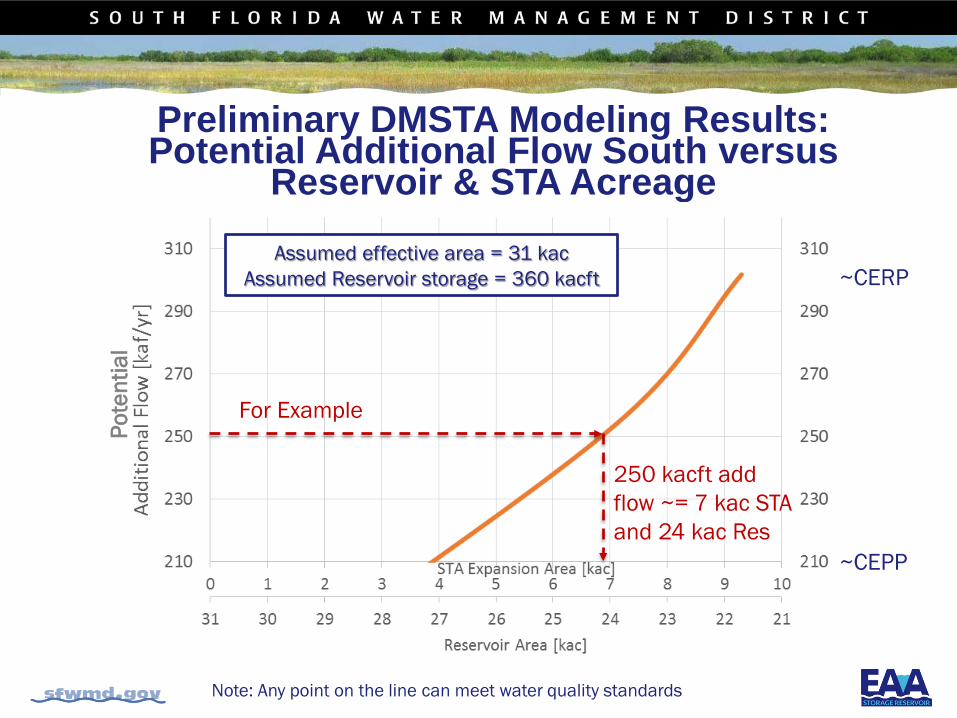
Preliminary DMSTA Modeling Results:Potential Additional Flow South versus
Reservoir & STA Acreage
Pote
ntia
l
Note: Any point on the line can meet water quality standards
~CEPP
~CERPAssumed effective area = 31 kac
Assumed Reservoir storage = 360 kacft
For Example
250 kacft add flow ~= 7 kac STA and 24 kac Res
EAA CANAL CONVEYANCEEAA Storage Reservoir Feasibility Study
44
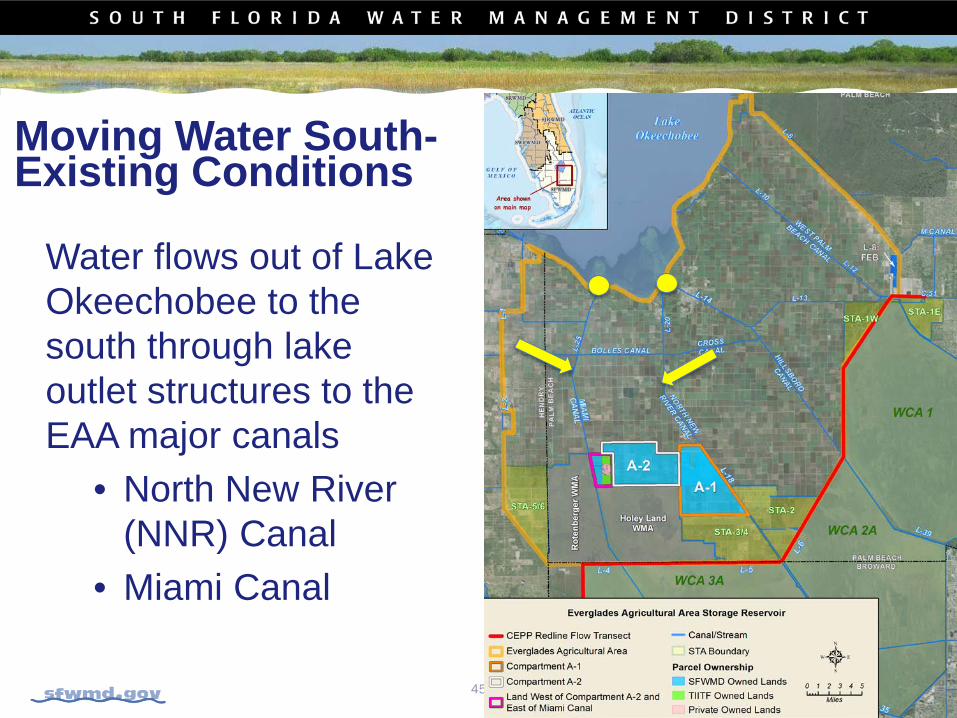
Water flows out of Lake Okeechobee to the south through lake outlet structures to the EAA major canals
• North New River (NNR) Canal
• Miami Canal
45
Moving Water South-Existing Conditions
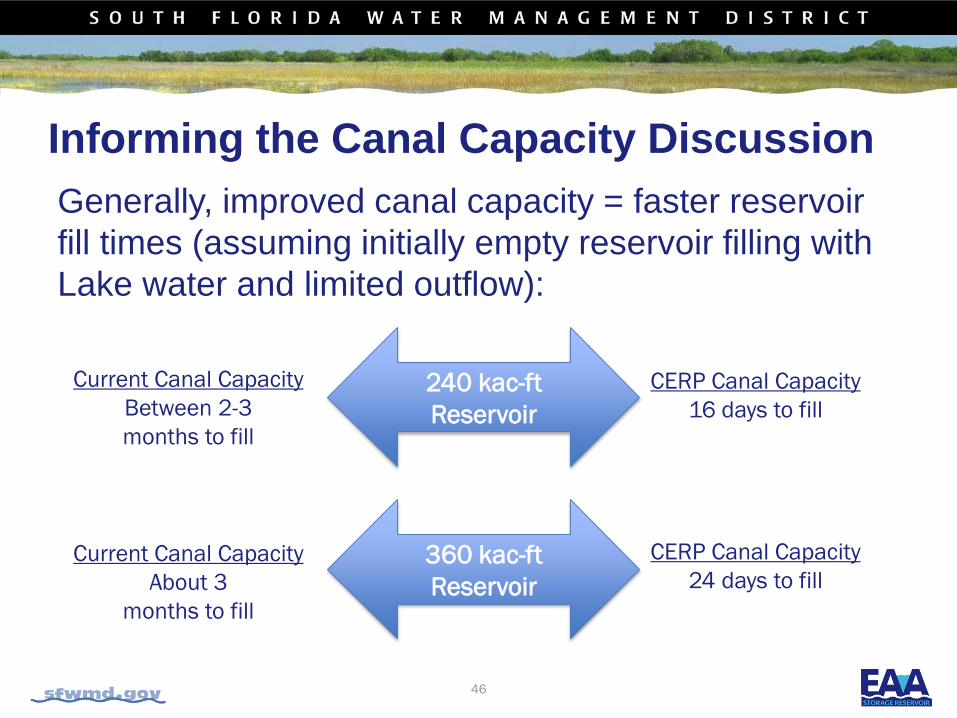
Informing the Canal Capacity DiscussionGenerally, improved canal capacity = faster reservoir fill times (assuming initially empty reservoir filling with Lake water and limited outflow):
46
240 kac-ftReservoir
360 kac-ftReservoir
Current Canal CapacityBetween 2-3 months to fill
CERP Canal Capacity16 days to fill
Current Canal CapacityAbout 3
months to fill
CERP Canal Capacity24 days to fill
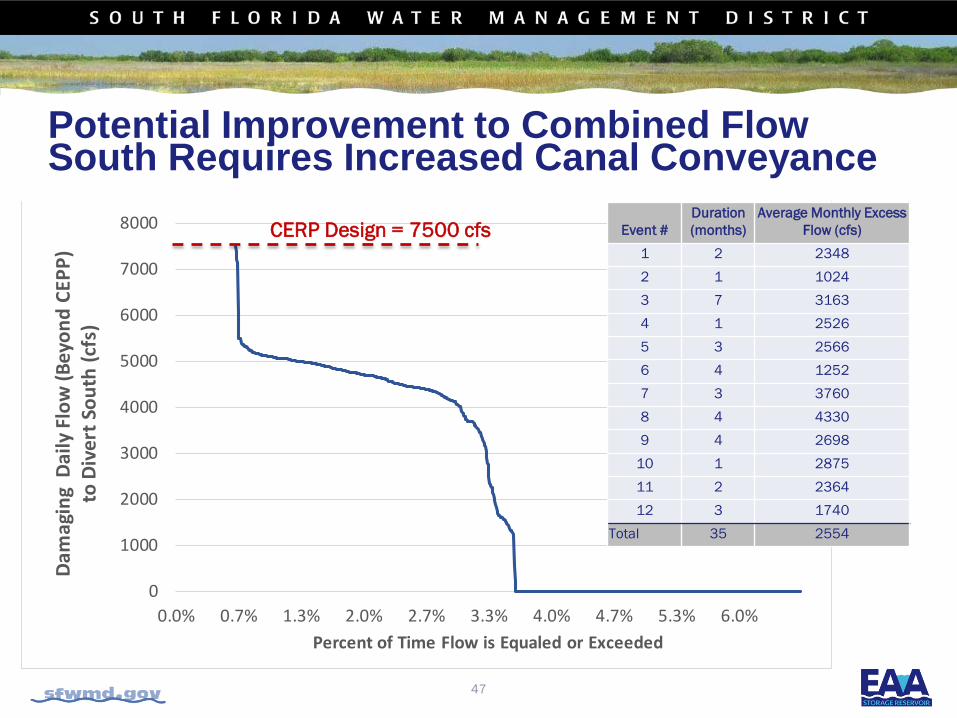
0
1000
2000
3000
4000
5000
6000
7000
8000
0.0% 0.7% 1.3% 2.0% 2.7% 3.3% 4.0% 4.7% 5.3% 6.0%
Dam
agin
g D
aily
Flo
w (B
eyon
d CE
PP)
to D
iver
t Sou
th (c
fs)
Percent of Time Flow is Equaled or Exceeded
47
Potential Improvement to Combined Flow South Requires Increased Canal Conveyance
Event #Duration (months)
Average Monthly Excess Flow (cfs)
1 2 23482 1 10243 7 31634 1 25265 3 25666 4 12527 3 37608 4 43309 4 2698
10 1 287511 2 236412 3 1740
Total 35 2554
CERP Design = 7500 cfs
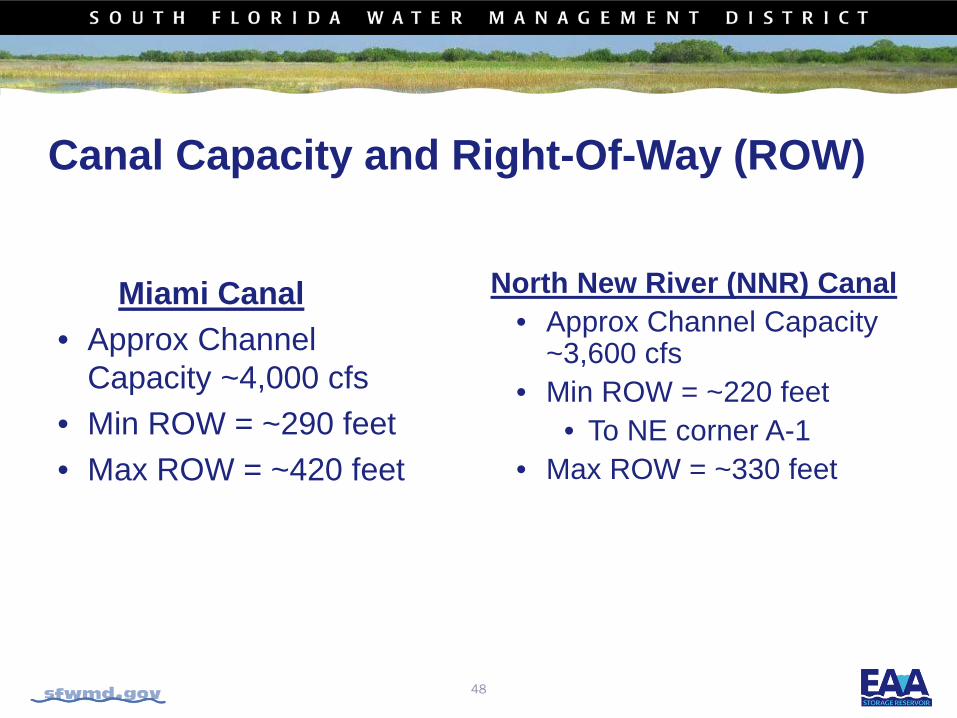
North New River (NNR) Canal• Approx Channel Capacity
~3,600 cfs• Min ROW = ~220 feet
• To NE corner A-1• Max ROW = ~330 feet
48
Canal Capacity and Right-Of-Way (ROW)
Miami Canal• Approx Channel
Capacity ~4,000 cfs• Min ROW = ~290 feet• Max ROW = ~420 feet
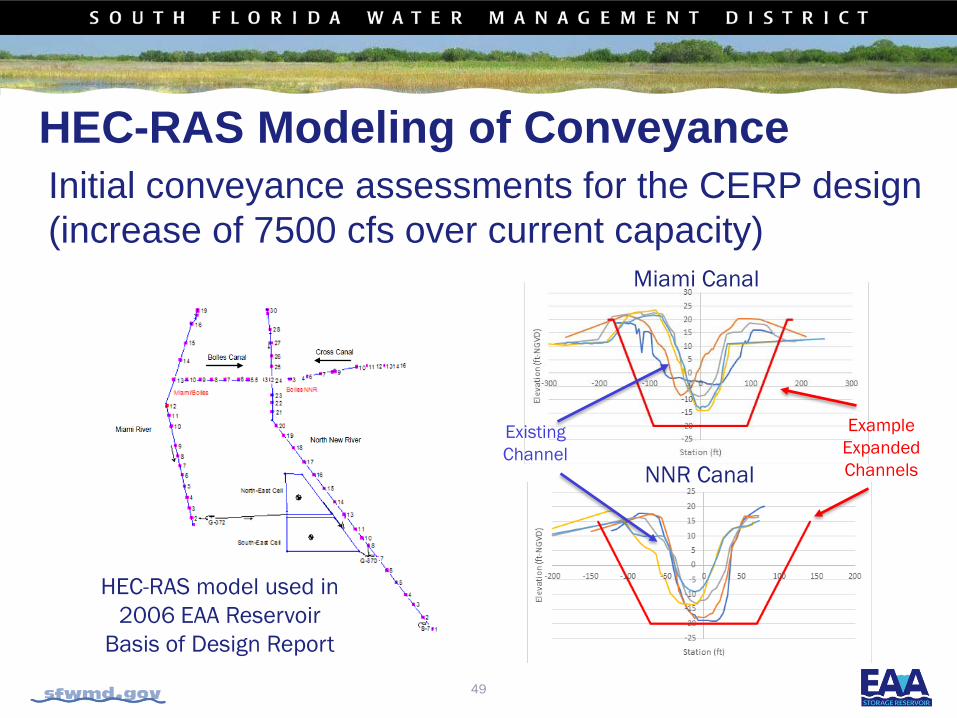
HEC-RAS Modeling of Conveyance Initial conveyance assessments for the CERP design (increase of 7500 cfs over current capacity)
HEC-RAS model used in 2006 EAA Reservoir
Basis of Design Report
Miami Canal
NNR Canal
Example Expanded Channels
ExistingChannel
49
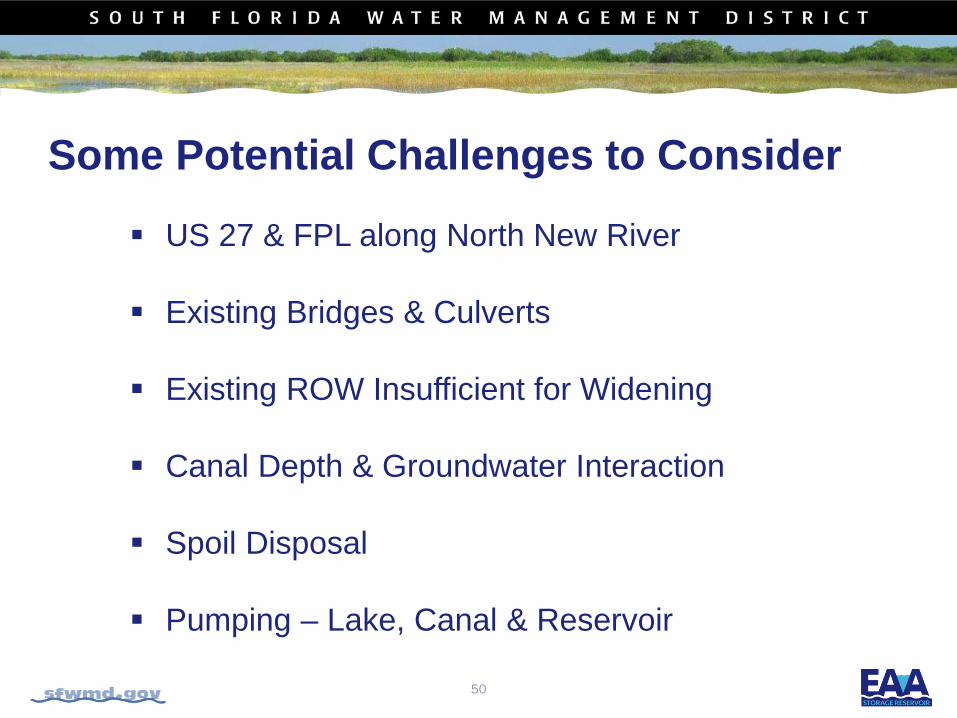
Some Potential Challenges to Consider
US 27 & FPL along North New River
Existing Bridges & Culverts
Existing ROW Insufficient for Widening
Canal Depth & Groundwater Interaction
Spoil Disposal
Pumping – Lake, Canal & Reservoir
50
QUESTIONS AND DISCUSSION
51
NEXT STEPSEAA Storage Reservoir Feasibility Study
52
Public Meetings Project Meetings:
• November 15th – Agency Project Delivery Team meeting (teleconference only)
• November 15th – 5:30 p.m. Clewiston, John Boy Auditorium
• November 16th – 6:00 p.m. SFWMD Auditorium, West Palm Beach
Other Public Meetings:• November 9th - Governing Board Meeting - Doral
53
Public Comment Opportunities Public Comments Cards Email Address [email protected] Mailing address:
Mike Albert, Project ManagerSouth Florida Water Management District3301 Gun Club Road, MSC 8312West Palm Beach, FL 33406
Scoping comment period ends November 22, 2017 Additional information available at
www.sfwmd.gov/EAAreservoir
54