Embed Size (px)
Citation preview
PROCEEDINGS, 45th Workshop on Geothermal Reservoir Engineering
Stanford University, Stanford, California, February 10-12, 2020
SGP-TR-216
1
An Integrated Feasibility Study of Reservoir Thermal Energy Storage in Portland, Oregon,
USA
John Bershaw1, Erick R. Burns
2, Trenton T. Cladouhos
3, Alison E. Horst
4, Boz Van Houten
5, Peter Hulseman
1, Alisa
Kane6, Jenny H. Liu
1, Robert B. Perkins
1, Darby P. Scanlon
7, Ashley R. Streig
1, Ellen E. Svadlenak
8, Matt W.
Uddenberg9, Ray E. Wells
1, Colin F. Williams
10
1Portland State University, Portland, OR 97201, USA
2U.S. Geological Survey, Portland, OR 97201, USA
3Cyrq Energy, Salt Lake City, UT 84101, USA
4Washington State Department of Natural Resources, Olympia, WA 98504, USA
5University of Oregon, Eugene, OR 97403, USA
6City of Portland, Portland, OR 97204, USA
7Chevron Corporation, Bakersfield, CA 93311, USA
8GSI Water Solutions, Inc., Portland, OR 97204, USA
9AltaRock Energy Inc., Seattle, WA 98103, USA
10U.S. Geological Survey, Moffett Field, CA 94043, USA
Email: [email protected]
Keywords: geothermal, direct use, seasonal heating, thermal energy storage, ATES, RTES, Pacific Northwest
ABSTRACT
In regions with long cold overcast winters and sunny summers, Deep Direct-Use (DDU) can be coupled with Reservoir Thermal Energy
Storage (RTES) technology to take advantage of pre-existing subsurface permeability to save summer heat for later use during cold
seasons. Many aquifers worldwide are underlain by permeable regions (reservoirs) containing brackish or saline groundwater that has
limited beneficial use due to poor water quality. We investigate the utility of these relatively deep, slow flowing reservoirs for RTES by
conducting an integrated feasibility study in the Portland Basin, Oregon, USA, developing methods and obtaining results that can be
widely applied to RTES systems elsewhere. As a case study, we have conducted an economic and social cost-benefit analysis for the
Oregon Health and Science University (OHSU), a teaching hospital that is recognized as critical infrastructure in the Portland
Metropolitan Area. Our investigation covers key factors that influence feasibility including 1) the geologic framework, 2) heat and fluid
flow modeling, 3) capital and maintenance costs, 4) the regulatory framework, and 5) operational risks. By pairing a model of building
seasonal heat demand with an integrated model of RTES resource supply, we determine that the most important factors that influence
RTES efficacy in the study area are operational schedule, well spacing, the amount of summer heat stored (in our model, a function of
solar array size), and longevity of the system. Generally, heat recovery efficiency increases as the reservoir and surrounding rocks
warm, making RTES more economical with time. Selecting a base-case scenario, we estimate a levelized cost of heat (LCOH) to
compare with other sources of heating available to OHSU and find that it is comparable to unsubsidized solar and nuclear, but more
expensive than natural gas. Additional benefits of RTES include energy resiliency in the event that conventional energy supplies are
disrupted (e.g., natural disaster) and a reduction in fossil fuel consumption resulting in a smaller carbon footprint. Key risks include
reservoir heterogeneity and a possible reduction in permeability through time due to scaling (mineral precipitation). Lastly, a map of
thermal energy storage capacity for the Portland Basin yields a total of 87,000 GWh, suggesting tremendous potential for RTES in the
Portland Metropolitan Area.
1. INTRODUCTION
Storage of thermal energy in saline or brackish aquifers underlying freshwater aquifers (hereafter called Reservoir Thermal Energy
Storage or RTES) would allow the use of largely undeveloped and relatively low-quality groundwater-resources for matching of peak
energy production with peak energy demand. RTES can be coupled with deep direct-use. Direct use refers to energy consumption that is
used at the source or transmitted without transformation. According to the United States Department of Energy (2019), typical direct-
use operations utilize geothermal fluid capable of providing heat and cooling (via absorption chillers) to commercial or residential
buildings. In the case of direct-use coupled with RTES, the energy produced, stored, and later extracted is delivered as hot or cold water.
For example, summer solar energy might be stored and then extracted in the winter. Similarly, winter low temperatures might be stored
for use during the summer.
Much of the physics of this technology has been historically researched, developed, and implemented, usually under the name Aquifer
Thermal Energy Storage (ATES); and this technology is mature in some parts of the world, though most applications are restricted to
Bershaw et al.
2
shallow depths in the uppermost aquifers beneath metropolitan areas. For a systematic description and history, see Fleuchaus et al.
(2018). A primary distinction between most ATES systems and RTES as defined herein, is that the target saline/brackish reservoirs for
RTES have much in common with traditional geothermal reservoirs, except for having comparatively low temperatures and relatively
shallow depths. Saline/brackish reservoirs have geochemically evolved fluids, a consequence of comparatively low groundwater
flowrates and long residence times along flow paths that are poorly connected with shallower fresh groundwater systems. For ATES,
regional groundwater flow may cause drift of stored heat in the direction of regional groundwater flow, and extraction wells need to be
located to optimally intercept the stored heat. In contrast, the low groundwater flowrates within many brackish/saline systems ensures
that most of the stored heat does not migrate away from the injection zone. Because the proposed brackish/saline storage zones share
characteristics of traditional geothermal reservoirs (particularly in terms of chemistry, flowrate, and poor connection with shallow fresh
aquifers), the term RTES is proposed to distinguish thermal energy storage using slow-moving geochemically-evolved aquifers from
traditional ATES applications.
RTES may have advantages over ATES, and the disadvantages are seemingly tractable problems. In regions where freshwater supplies
have largely been appropriated for other beneficial uses, the use of brackish/saline waters as a working fluid for heat exchange
represents a new opportunity for beneficial use of these largely undeveloped groundwater resources. Deep storage of heat would prevent
thermal plumes from easily reaching surface waters, greatly reducing the likelihood of adverse ecological impacts. While exploration
risks and costs of development of RTES will likely be higher than for ATES, working with geochemically evolved waters is standard
fare for the geothermal industry, so engineering solutions already exist or are the subject of active engineering research.
The remainder of this paper explores the feasibility (cost/benefit) of implementing RTES in the Portland Basin, Portland, Oregon, USA.
We begin with a detailed study of the geologic framework (Section 2). Then, we employ a heat and fluid flow model to estimate the
stored thermal resource available for heating an urban hospital, Oregon Health Sciences University (OHSU) using RTES technology.
We also estimate the potential RTES resource if utilized throughout the Portland Basin (Section 3). We describe some anticipated risks
and uncertainties related to RTES operations (Section 4). Lastly, the economics of implementing RTES in a new conventional building
at OHSU are estimated, resulting in a levelized cost of energy (LCOE), which is compared to other sources of heating available to
OHSU (Section 5). This, in addition to societal (non-fiscal) benefits are integrated into an interpretation of feasibility.
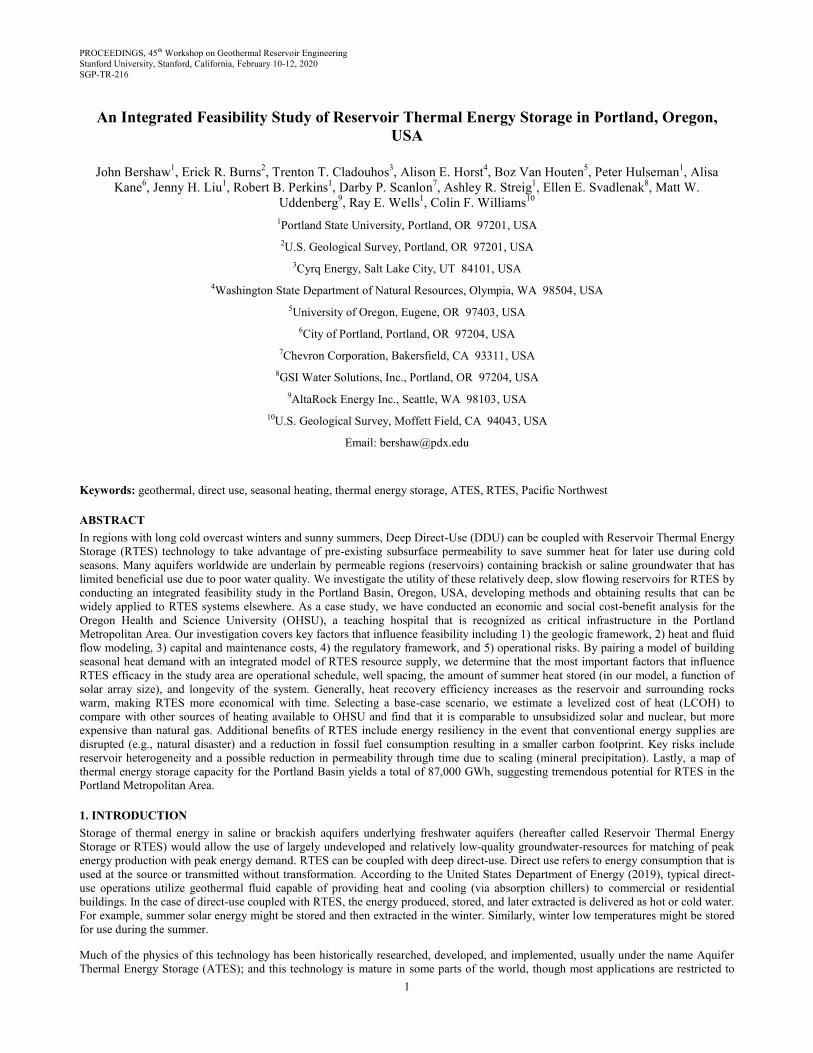
Figure 1: Location maps of study extents with elevation contours of the top of the Columbia River Basalt Group (CRBG). (A)
Study area extent for resource map development. Geology is modified from Evarts et al. (2009). A-A’ is an approximate location
for the generalized cross-section in Figure 2. (B) Focus area inset map shows a high-density area where RTES might be used for
district heating and the Oregon Health and Science University (OHSU) south waterfront expansion area used as the foundation
for representative simulations.
Bershaw et al.
3
2. STUDY AREA
The 1,300 km2 Portland Basin contains the cities of Portland, Oregon and Vancouver, Washington, separated by the Columbia River,
which traverses the basin center on its way to the Pacific Ocean (Figure 1). The Portland Basin has low heat flow at ~50 mW/m2 (Burns
et al., 2018) and low traditional hydrothermal favorability (Williams & DeAngelo, 2008). Water quality within the target reservoir is
likely poor, as residence time is relatively long resulting in geochemically evolved (saline or brackish) fluid (Svadlenak, 2019). Within
this framework, there exist favorable conditions for RTES: a permeable low-flow aquifer system in the Columbia River Basalt Group
(CRBG) that is hydraulically separated and thermally well-insulated from the overlying regional aquifer.
2.1 Geology
The Portland Basin (Figure 1) is a NW-SE trending part of the Puget-Willamette forearc trough, formed during oblique subduction of
the Juan de Fuca plate beneath North America (Wells et al., 1998; Evarts et al., 2009). The forearc trough may be a flexural response of
loading by the Cascade magmatic arc or Coast Range, with basin segmentation related to NW-striking dextral faults, which have been
active since at least the mid-Miocene. The Willamette Valley region is seismically active with the largest historic event a M 5.7
earthquake that occurred in Scotts Mills in 1993 (Wong, 1997).
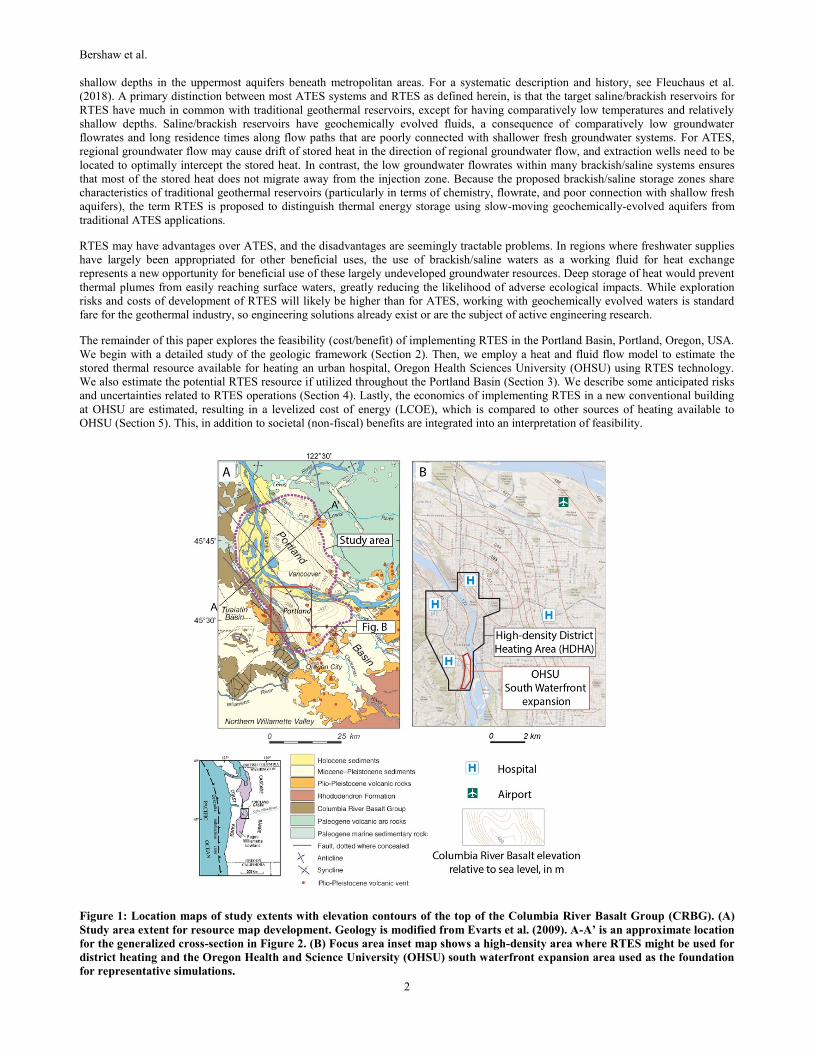
The Portland Basin stratigraphy (Figure 2) records a history of volcanism and sedimentation from the Eocene to present. The Eocene
basement consists of oceanic basalt of the Siletzia terrane, accreted to North America about 50 million years ago (Wells et al., 2014).
The basement is overlain by marine sedimentary rocks which interfinger with Cascade volcanics to the east. The Eocene basement
within the Portland Basin is estimated (using gravity data) to be up to 2.5 km deep (McPhee et al., 2014). Marine sedimentation was
followed by emplacement of more than a dozen CRBG lava flows arriving from eastern Washington via the ancestral Columbia River
valley, filling in pre-existing topography with 300m or more of basalt (Beeson et al., 1985). Neogene subsidence and uplift of the
Portland Hills followed CRBG emplacement. About 300 m of lacustrine, fluvial, and volcaniclastic rocks overlie the CRBG, forming
the regional aquifer system. Eruption of the Boring volcanic field between 3 Ma and 50 ka produced cinder cones and associated lava
flows, still visible on the east side of the basin (Evarts et al., 2009). Between about 18 and 15 ka, glacial outburst floods (Missoula
floods) inundated the region to a depth of about 120m, mantling the basin with sediments derived from the continental interior (Waitt,
1985).
Figure 2: Geologic cross section A-A’ including all modeled units down to Eocene basement. Basement offsets are interpreted
from the residual gravity data (dotted line) of McPhee et al. (2014). Data constraints include (1) well - WASH 206, (2) well -
WASH 633, (3) interpolation guide, and (4) - seismic profiles of Liberty (2002). Vertical exaggeration 5:1. Fault acronyms are
GC – Gales Creek fault, BV – Beaverton fault, SOF – Sylvan-Oatfield fault, PH – Portland Hills fault, and EB – East Bank
fault.
2.2 New 3D Geologic Model and Reservoir Geology
Three stratigraphic surfaces were mapped (top CRBG, base CRBG, and Eocene basement) to construct a 3D geologic model using well
log, outcrop, seismic, aeromagnetic, and gravity data (Figure 2). The majority of available drilling logs for the southern Portland basin
were accessed from the Oregon Water Resources Department (OWRD) Groundwater Site Information System (GWIS). Oil and gas
exploration wells were accessed through the Oregon Department of Geology and Mineral Industries (DOGAMI) oil and gas index.
Refer to Scanlon (2019) for a detailed explanation of the 3D geologic model methods and results.
The focus area for RTES simulations (the OHSU south waterfront expansion) is on NE dipping strata, where the top of CRBG decreases
from surface outcrop to ~500 m below sea-level in the center of the Portland basin (Figure 1B). The base of CRBG similarly decreases
in elevation toward the center of the basin to a maximum depth of ~800 m below sea-level. The uncertainty of the base CRBG surface is
higher than for the top CRBG surface, as it is derived from far fewer data points (i.e., PSU injection well and outcrop data from Wells et
Bershaw et al.
4
al., in press). The reservoir target for RTES is between top and base CRBG, which is ~300 m thick in the area of interest. RTES wells
for the OHSU south waterfront expansion would be drilled to a measured depth (MD) of 125-250 m. Wells in this location may cross
the inferred trace of the Portland Hills fault, which could cause reservoir heterogeneity and pose a seismic hazard (see Section 4).
Motion on this fault is thought to be taken up in dextral strike-slip motion, with a component of dip-slip (Blakely et al., 1995).
3. HEAT AND FLUID FLOW MODELING
3.1 Hydrogeology
The thick sediments and volcanic deposits overlying the CRBG (Figure 2) form the primary aquifer system that transmits most of the
groundwater to rivers and streams, and these overlying deposits are the main source of groundwater for the Portland Basin (McFarland
and Morgan, 1996; Morgan and McFarland, 1996; Herrera et al., 2014). River and stream gains (including springs) are the primary
discharge of groundwater, though groundwater is pumped for a variety of uses. All Miocene-age and older rocks, except for the CRBG,
tend to have low permeability (McFarland and Morgan, 1996; Morgan and McFarland, 1996; Herrera et al., 2014). While the dense
flow-interiors of CRBG lava flows tend to have very low permeability (<10-18 m2), the thin laterally connected interflow zones are
productive, resulting in strongly anisotropic low-storage aquifers (porosity ~0.2-0.25) (Burns et al., 2016). Because the overlying
aquifers are very productive, Miocene and older rocks are generally only used as aquifers in the uplands where recharge can enter
exposed CRBG units (i.e., younger aquifers are absent). Lower in the basin, where CRBG is buried by the younger rocks, the low-
permeability flow interiors form confining units, preventing CRBG groundwater from easily flowing out of the CRBG into the
overlying aquifer system. As a result, CRBG reservoirs beneath younger rocks and sediments contain older groundwater that is slow
moving or stagnant. Valley-bottom rivers and streams do not intersect the CRBG, except possibly the Willamette River, near the SW
basin margin (Figure 1). The extent to which the Willamette River incises the CRBG is not well-understood.
CRBG aquifers can be connected over tens of kilometers, though the connectivity can be complex, and faults tend to form barriers
where thin aquifers are juxtaposed against confining units (Burns et al., 2012, 2016; Ely et al., 2014). Bulk permeability (i.e., effective
permeability of combined CRBG aquifers and confining units) from CRBG aquifer tests in the regional Columbia Plateau Regional
Aquifer System (CPRAS) varies across seven orders of magnitude, with most tests in the range of 10-10—10-13 m2 and a mean value of
~10-11.5 m2 (Burns et al., 2015, 2016). Morgan and McFarland (1996) lumped all older-rock aquifer tests, documenting a range of 10-
10—10-16 m2. Noting that the CRBG aquifers are the most permeable of the older-rocks, the range of permeabilities in the Portland
Basin dataset is consistent with larger CRBG compilations. Further, calibrated CPRAS hydraulic conductivities are in good agreement
with calibrated Portland Basin hydraulic conductivities, indicating the length scale of permeability is also similar. Permeable interflow
thickness is typically ~10% of total CRBG thickness, indicating individual flow horizons will have ~10 times bulk permeability.
Similarly, bulk porosity is estimated to be in the range 0.02-0.025 on average (Burns et al., 2016).
3.2 Ambient Geothermal Heat Flow
Subduction of the cold oceanic Juan de Fuca plate and associated sediments results in low regional geothermal heat flow beneath the
Portland Basin. Heat flow increases to the east where subduction creates the Cascades magmatic arc. A preliminary analysis of the
available twelve heat-flow measurements for the Portland Basin (Blackwell et al., 1978, 1990; Steele et al., 1982; and Blackwell and
Steele, 1987), ranged from 33 to 77 mW/m2, with a mean value of 52 mW/m2. These values are relatively low, compared with much of
the western United States, and are similar to those observed throughout much of the central and eastern United States (Blackwell et al.,
2011).
3.3 Conceptual Model for the Portland RTES System
The target thermal storage zone for simulations is a single permeable interflow zone near the base of the CRBG (Figure 3). A well-
doublet in this CRBG aquifer allows efficient distribution, storage, and retrieval of thermally regulated water, but requires little or no
above-ground storage of water. The overlying CRBG promotes thermal and hydraulic separation from the regional potable aquifer
system, allowing the CRBG and underlying low-permeability rocks to store heat. Low groundwater flow rates (assumed to be zero for
simulations herein) in the CRBG and older rocks ensure that most injected heat will not be advectively transported away from the
doublet. Heat that is conducted to the overlying primary aquifer above the CRBG is assumed to be removed advectively by the primary
aquifer. The thermal plume is assumed to be well-mixed within the reservoir, and because the reservoir and plume are comparatively
thin, most conductive heat loss is upwards towards the primary aquifer or downwards as the surrounding rocks are heated up. Initially
heat loss will be high as the reservoir itself and the overlying and underlying rocks are heated up. As the surrounding geology is heated,
conductive heat loss decreases over time, and annual recovery of injected heat will increase.
3.4 Model Sensitivity Analysis
A preliminary sensitivity analysis was performed to identify which features of an ATES system would be most important for controlling
energy delivery in the Portland RTES system (Burns et al., 2018). Well-spacing, hydrogeologic heterogeneity, and operational schedule
(i.e., timing and rate of injection and extraction of hot/cold water) dominated, with lesser effects attributed to the insulation thickness
overlying the injection horizon and ambient groundwater flow within the CRBG. Well-spacing and insulation thickness over the
injection horizon are engineering choices, and heterogeneity and ambient groundwater flow are conditions that cannot be controlled, but
that can be assessed during resource exploration and accounted for during RTES system design and construction. Operational schedule
is controlled by when and how much heating is required by the end-user, and when excess hot water is available to be injected. The
total amount of heating required by the building and the temperature of stored water determine the necessary size of the RTES (i.e., the
areal footprint of the RTES, and the well-spacing to prevent thermal breakthrough) and the RTES pumping rate.
Bershaw et al.
5
3.5 Heating and Cooling Demand
Operational schedule of the RTES is driven by simulated hourly space-heating and cooling demand for the Knight Cancer Research
Building (KCRB) in the OHSU South Waterfront Expansion area (Figure 1B). The KCRB is six stories, 10,400 m2, and consists of
office and laboratory space. During KCRB design, energy consumption for a typical year was simulated using the eQuest/DOE2.2
software, resulting in hourly estimates of heat exchanger temperatures and pumping rates (PAE, 2017). Though we only consider a
conventional building as a base case (KCRB), a building could be customized for RTES, potentially improving energy use efficiency.
The representative weather file used was the eQuest/DOE2.2 provided meteorological data for Portland International Airport (PDX).
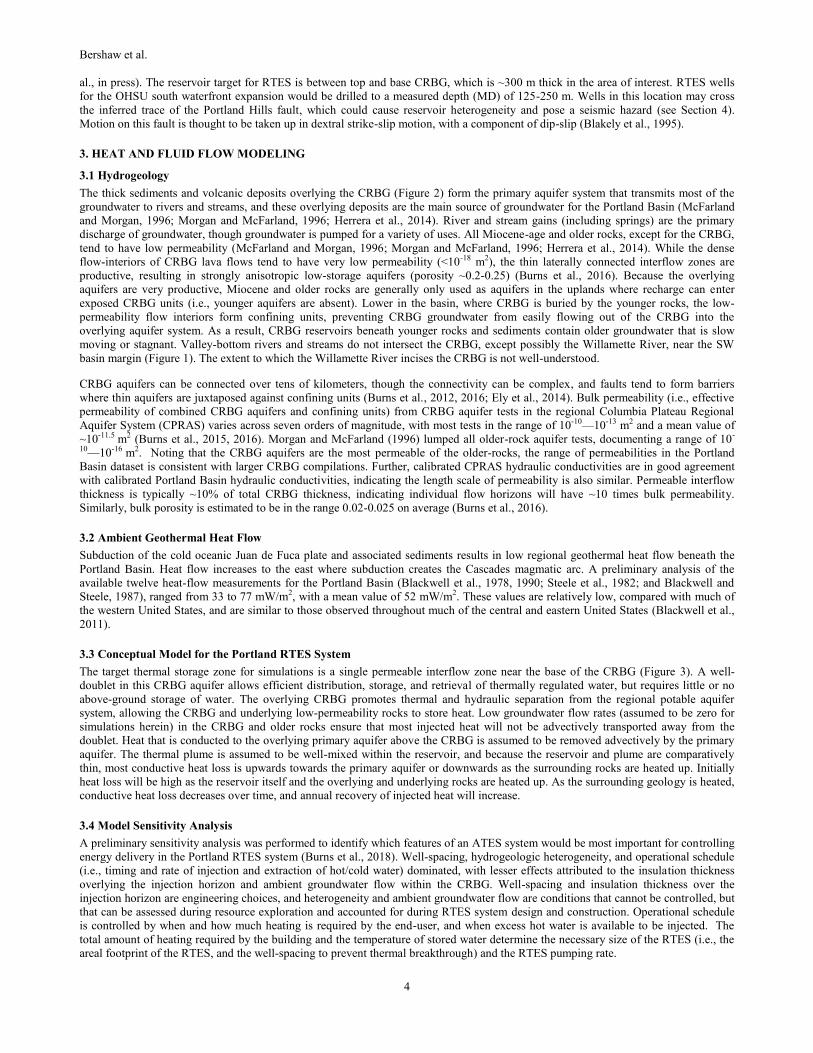
Total annual space-heating is estimated to consume 1.88 GWh of thermal energy. Space-heating water is supplied to the building at
~50°C, and return temperatures for the loop generally fall within the range 20-45°C. The flow-weighted average return temperature is
32.2°C, so the thermal load to be supplied is to heat water from 32°C to 50°C on average (Figure 3).
While an RTES can be operated in either continuous or cyclic modes for heating or cooling (Burns et al., 2018), for simplicity, only
cyclic operations of a doublet for heating purposes are considered here. Cyclic operations have reversal of pumping direction when
switching between heat storage and extraction, typically providing the highest temperatures first and declining temperatures during the
heat extraction period. Continuous operations are unidirectional flow, requiring heat to break through at the downgradient well before it
can be utilized. Under cyclic operations, one well is the thermal storage well, where heat is injected for later extraction, and the second
well, is the balancing well, where water is injected or extracted at the same rate but opposite direction as the thermal storage well. Use
of a doublet prevents the need to store significant amounts of water above ground by balancing flow rate at the thermal storage well
with the balancing well.
Figure 3: Conceptual model of Reservoir Thermal Energy Storage (RTES) for the OHSU study area. Heat can be injected into
the thermal storage well (left) in the summer, and flow will be reversed in the winter to extract heat from the thermal storage
well. The balancing well (right) maintains the same flowrate as the thermal storage well and injection temperature is determined
by heat exchange with the building heating system. Dark blue arrows show regional groundwater flow above and within the
CRBG. Large red arrows represent background geothermal heat. Heat is conducted away from the injection horizon down into
older rocks and up into overlying CRBG aquifers. The overlying CRBG promotes hydraulic and thermal separation between
the thermal energy storage zone and the overlying primary aquifer system.
3.6 Seasonal Sources of Energy to be Stored
Thermal energy can be taken from a variety of sources, including solar, heat exchange with ambient natural conditions (e.g., summer
heat and winter cold), or using heaters/chillers during periods when electricity surpluses provide low-cost electricity. Here, it is assumed
that the solar energy delivery pattern can be estimated using standard solar design criteria, that the solar array can be linearly sized to
deliver any desired percentage of heat, and that this scaled solar source will first supply any building thermal load. Excess solar heat is
injected into the reservoir as hot water at a prescribed fixed temperature.
The solar supply pattern was estimated hourly for 2018 using solar incidence data at Portland International Airport. The magnitude of
energy supplied by solar heating per square meter of installed solar collector is a function of desired production temperature, type of
collector, etc. Solar water heating can be used to heat water to a desired injection temperature. This temperature may be chosen based on
desired RTES operational considerations.
3.7 RTES Simulations
The simulation tool of Burns et al. (2018) was altered to simulate reservoir operations that would result from use of a solar array to
provide building heating demand (see Burns et al., in press, for a comprehensive description of the modeling and the conditions
Bershaw et al.
6
evaluated). Each 30-year simulation was divided into a series of approximately week-long simulations where boundary conditions
representing average conditions for the week are held constant. Environmental variables that change on a timescale of less than a week
(e.g., hourly, daily, etc.) will average out on the timescale of months to years, so upscaling to weekly simulations results in increased
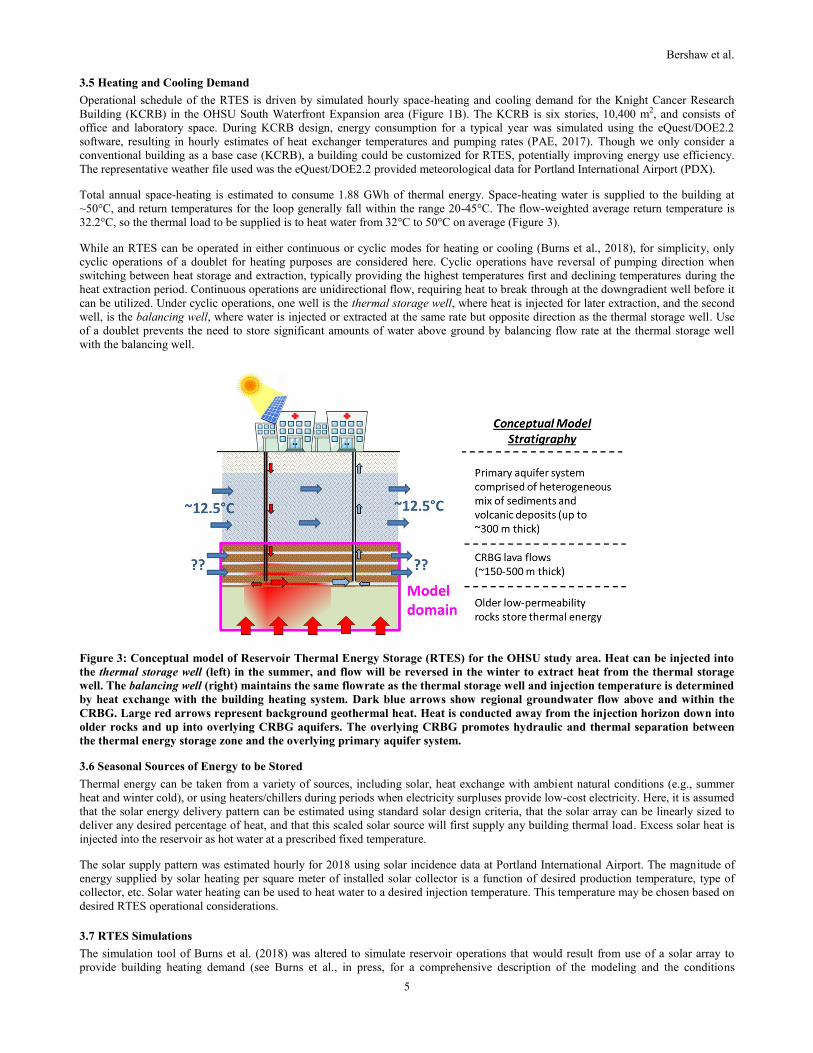
computational efficiency. Weekly average building heat load and solar source can be divided into energy components that determine
model stresses (Figure 4). Summer heat in excess of building heat demand (red) is injected into the reservoir, and winter heating need is
supplied by a combination of solar (yellow) plus hot water from the reservoir. The heat demand placed on the reservoir (blue) is
partially or fully satisfied from the reservoir, only if reservoir temperatures are sufficiently high to heat the hourly building return flows
from the hot water loop.
Figure 4: Energy that can be supplied directly to the building (yellow), the solar energy excess (red), and the winter heating
deficit (blue).
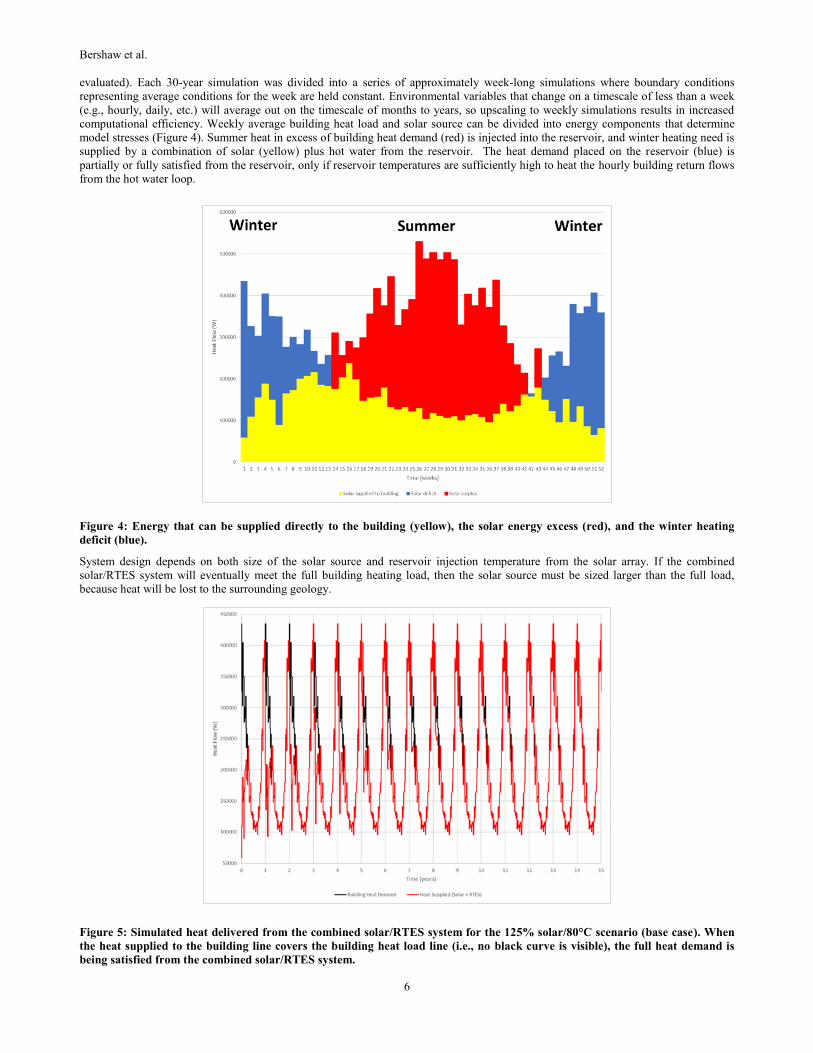
System design depends on both size of the solar source and reservoir injection temperature from the solar array. If the combined
solar/RTES system will eventually meet the full building heating load, then the solar source must be sized larger than the full load,
because heat will be lost to the surrounding geology.
Figure 5: Simulated heat delivered from the combined solar/RTES system for the 125% solar/80°C scenario (base case). When
the heat supplied to the building line covers the building heat load line (i.e., no black curve is visible), the full heat demand is
being satisfied from the combined solar/RTES system.
Bershaw et al.
7
Representative reservoir properties (e.g., geometry and thermal and hydraulic properties) were used in a model that was stressed with a
range of conditions, with the base case stresses being defined as having a solar array sized at 125% of annual average building heat
demand with an injection temperature of 80°C. Because the desired temperature on the building supply side is 50°C, the effect of
lowering the injection temperature to 55°C was also considered. Because space may be limited for installation of a solar array, the effect
of having a smaller solar array sized at 75% of the annual average building heat demand was also considered (75% is approximately the
amount that could be supplied if the entire roof of the KCRB was covered with a solar array). To aid in sizing and design of
infrastructure, Burns et al. (in press) develops and summarizes a range of tools that can be used to estimate
well spacing and the size of the external heat source necessary to meet full building thermal demand after the reservoir is heated up.
Well spacing is a function of volume of water to be stored, and the same amount of heat can be stored in a smaller volume if water
temperatures are higher. For all simulations, well-spacing was fixed at 500 m, though for higher temperature simulations, a spacing of
~100 m might be possible (assuming a homogeneous system). Heterogeneity would require larger well spacing.
For the base case where we assume a system lifespan of 30 years, the 15th year of operations is the first year when 100% of building
thermal demand is met from the combined solar/RTES system (Figure 5), but this time can be shortened considerably by increasing the
early-time heat addition (e.g., using nearby heating infrastructure, oversizing the solar array, having a period of operation where all solar
is injected rather than being used for the building, etc.). If all solar heat (i.e., 125% at 80°C) is injected for 1-2 summers, then 100% of
KCRB heating demand can be met by the combined solar/RTES system thereafter (Burns et al., in press). After full-heat demand is met,
the reservoir continues to heat, building a surplus that can provide additional heat in the future (e.g., new buildings, or particularly cold
years, etc.).
Time until full heat demand can be satisfied is a function of heat recovery, and Burns et al. (in press) provide analytic estimates of
minimum heat recovered as a function of years of operation. Heat recovery depends on the reservoir surface area to volume ratio, with
a higher surface area losing more heat to surrounding rock. Because the CRBG reservoirs are thin, they have a relatively high surface
area to volume ratio, and heat recovery starts low compared with what might be expected in thicker reservoirs. For the base case, first
year thermal recovery efficiency (i.e., the fraction of injected heat that could be extracted to meet building heat demand) was ~30%, and
in year 15, when 100% of building heat demand was satisfied, recovery was ~60%. The long-term thermal recovery is estimated to
asymptotically approach 93%.
3.8 Resource (Heat) Estimates for the Portland Basin
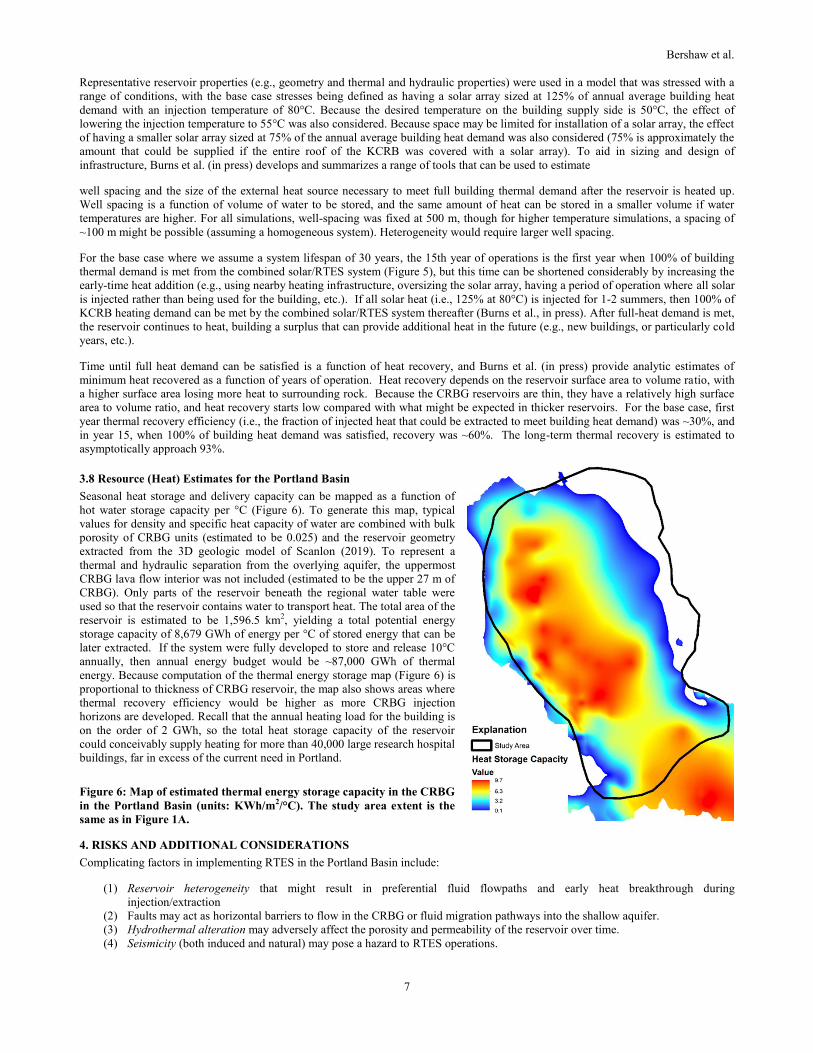
Seasonal heat storage and delivery capacity can be mapped as a function of
hot water storage capacity per °C (Figure 6). To generate this map, typical
values for density and specific heat capacity of water are combined with bulk
porosity of CRBG units (estimated to be 0.025) and the reservoir geometry
extracted from the 3D geologic model of Scanlon (2019). To represent a
thermal and hydraulic separation from the overlying aquifer, the uppermost
CRBG lava flow interior was not included (estimated to be the upper 27 m of
CRBG). Only parts of the reservoir beneath the regional water table were
used so that the reservoir contains water to transport heat. The total area of the
reservoir is estimated to be 1,596.5 km2, yielding a total potential energy
storage capacity of 8,679 GWh of energy per °C of stored energy that can be
later extracted. If the system were fully developed to store and release 10°C
annually, then annual energy budget would be ~87,000 GWh of thermal
energy. Because computation of the thermal energy storage map (Figure 6) is
proportional to thickness of CRBG reservoir, the map also shows areas where
thermal recovery efficiency would be higher as more CRBG injection
horizons are developed. Recall that the annual heating load for the building is
on the order of 2 GWh, so the total heat storage capacity of the reservoir
could conceivably supply heating for more than 40,000 large research hospital
buildings, far in excess of the current need in Portland.
Figure 6: Map of estimated thermal energy storage capacity in the CRBG
in the Portland Basin (units: KWh/m2/°C). The study area extent is the
same as in Figure 1A.
4. RISKS AND ADDITIONAL CONSIDERATIONS
Complicating factors in implementing RTES in the Portland Basin include:
(1) Reservoir heterogeneity that might result in preferential fluid flowpaths and early heat breakthrough during
injection/extraction
(2) Faults may act as horizontal barriers to flow in the CRBG or fluid migration pathways into the shallow aquifer.
(3) Hydrothermal alteration may adversely affect the porosity and permeability of the reservoir over time.
(4) Seismicity (both induced and natural) may pose a hazard to RTES operations.
Bershaw et al.
8
The analyses summarized herein are a proof of concept, and (1) and (2) would need to be addressed during and after field testing, with
new simulations being performed to incorporate information gained. In the following sections, we consider risks associated with
hydrothermal alteration (3) and seismicity (4).
4. 1 Hydrothermal Alteration of the Reservoir
Heating of brackish waters and rocks of the reservoir during cyclical hot water injection and extraction can result in chemical changes
that form scale in piping and heat exchange components, and mineral deposits that change aquifer porosity and permeability. This has
been documented in laboratory, modelling, and field-based experiments (Bonte et al., 2013; Garcia-Gil et al., 2016; Rosenbrand et al.,
2013). Groundwater chemistry data analyzed for this project was compiled from published literature, well logs, and local, state, and
federal water quality reports, including >200 wells in and around the Portland Basin.
RTES will likely source its water from deeper CRBG aquifers present in the Portland Basin. Because there is little published data
regarding the water composition in the lower CRBG, and because groundwater compositions may vary depending on depth, proximity
to structures, and location within the basin, a range of potential native water compositions were simulated with geochemical reaction
models (details provided in Svadlenak, 2019).
Silica precipitation is likely to occur at the cooling / mixing front in the RTES reservoir. However, the volumes precipitated are
unlikely to cause significant porosity loss and over time the cooling front and associated mineral buildup may migrate with expansion of
the hot water storage zone. However, because many CRBG groundwaters are near saturation with respect to calcite and because the
solubilities of calcite and other carbonates, such as siderite, decrease with temperature and with loss of CO2(g), carbonate scaling is of
primary concern during heating of groundwaters. Our modeling confirms that elevated temperatures may result in extensive mineral
precipitation. Reaction rates for carbonate precipitation are typically orders of magnitude faster than for clays, so precipitation of
carbonate minerals (chiefly, calcite and siderite) has the potential to form extensive scale deposits within pipes and heat exchange
systems upon heating. Precipitation of these phases in the aquifer, or transfer of suspended precipitates to the aquifer, could result in
significant declines in porosity and permeability, likely at or near the injection site when injected waters are heated to 70°C. Such loss is
minimized, though not necessarily eliminated, when waters are heated to ~50°C.
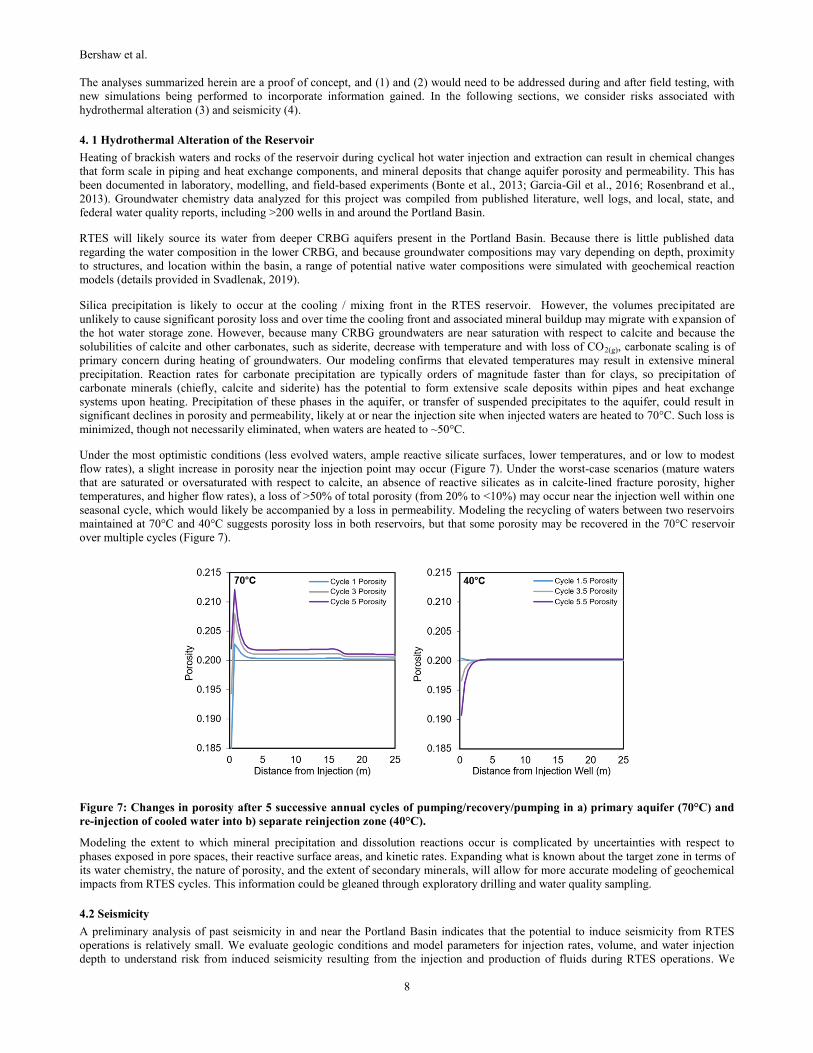
Under the most optimistic conditions (less evolved waters, ample reactive silicate surfaces, lower temperatures, and or low to modest
flow rates), a slight increase in porosity near the injection point may occur (Figure 7). Under the worst-case scenarios (mature waters
that are saturated or oversaturated with respect to calcite, an absence of reactive silicates as in calcite-lined fracture porosity, higher
temperatures, and higher flow rates), a loss of >50% of total porosity (from 20% to <10%) may occur near the injection well within one
seasonal cycle, which would likely be accompanied by a loss in permeability. Modeling the recycling of waters between two reservoirs
maintained at 70°C and 40°C suggests porosity loss in both reservoirs, but that some porosity may be recovered in the 70°C reservoir
over multiple cycles (Figure 7).
Figure 7: Changes in porosity after 5 successive annual cycles of pumping/recovery/pumping in a) primary aquifer (70°C) and
re-injection of cooled water into b) separate reinjection zone (40°C).
Modeling the extent to which mineral precipitation and dissolution reactions occur is complicated by uncertainties with respect to
phases exposed in pore spaces, their reactive surface areas, and kinetic rates. Expanding what is known about the target zone in terms of
its water chemistry, the nature of porosity, and the extent of secondary minerals, will allow for more accurate modeling of geochemical
impacts from RTES cycles. This information could be gleaned through exploratory drilling and water quality sampling.
4.2 Seismicity
A preliminary analysis of past seismicity in and near the Portland Basin indicates that the potential to induce seismicity from RTES
operations is relatively small. We evaluate geologic conditions and model parameters for injection rates, volume, and water injection
depth to understand risk from induced seismicity resulting from the injection and production of fluids during RTES operations. We
Bershaw et al.
9
compiled rates, volumes and depths of injection for local injection activities (e.g., CRBG aquifer storage and recovery wells in the
adjacent Tualatin basin) and also for Oklahoma, and compared injection activities to published seismic activity for these areas. We
compare proposed depths and rates of injection for the proposed RTES in Portland, Oregon with compiled values and find the proposed
system falls below the range of values for nearby operating aquifer storage and recovery wells which are shallow, have low injection
and withdrawal rates, and have not been historically associated with occurrences of induced seismicity in the Portland region.
Two injection wells located < 2 km northwest of the proposed RTES site inject water to depths less than 1,200 feet and have injection
rates that reach 1,500 gallons per month, similar to our proposed wells. No historical seismicity is associated with water injection in
these or aquifer storage and recovery (ASR) wells nearby (https://pnsn.org/pnsn-data-products/earthquake-catalogs, last accessed
4/2019). For ASR systems in the Tualatin Basin, ~30 km west of the proposed site, in the same regional stress regime, fluid injection
depths are generally shallower than our proposed wells and injection rates are much higher.
While there is little to no evidence that injection into CRBG results in induced seismicity, there is evidence that fluid injection has
triggered earthquakes in other settings, where pore pressure at a fault increases beyond a critical pressure threshold (Keranen et al.,
2013). Wastewater in Oklahoma is being injected at greater depths (>6,000 ft / 1,825 m) into crystalline basement, and as a result
induces slip on basement faults causing seismicity. In recent decades, there has been an increase in earthquakes in the central United
States, which has been linked with oil and gas wastewater fluid injection in these regions (Rubinstein and Mahani, 2015). In Oklahoma,
three > M 5 earthquakes have occurred in injection areas that experienced an increase in both the number of injection wells and injection
rates (Hincks et al., 2018). Injection rates and depths are typically higher in Oklahoma compared to this study. Also, in contrast to wells
in Oklahoma, the RTES system proposed here cycles water in and out of the same reservoir, minimizing increases in pore pressure.
Based primarily on the fact that higher injection rates into CRBG in the Tualatin basin have not historically induced seismicity,
proposed RTES operations are deemed low-risk for inducing seismicity within the Portland Metropolitan area. Current research at
Lawrence Berkeley National Laboratory is using the Portland Basins geologic model and RTES properties to simulate the effects of
heating and cooling near faults on potential seismicity (Eric Sonnenthal, personal communication).
Seismicity associated with a naturally occurring earthquake poses a risk to RTES operations, but also provides the basis for a potential
benefit to implementing RTES as a form of energy resiliency in the event that an earthquake were to disrupt conventional energy
supplies to critical infrastructure. In addition to induced seismicity, we reviewed existing ground shaking maps for the Portland
Metropolitan region for both local crustal fault rupture and a subduction zone earthquake to constrain this seismic hazard. For a crustal
fault rupture like a scenario M 6.8 earthquake on the nearby Portland Hills fault, the proposed RTES study site is expected to experience
between 0.5 to 0.75 g acceleration and Severe to Violent shaking (Wong et al., 2000; Bauer et al., 2018). There are no geophysical
investigations near the proposed study area that image the Portland Hills fault at depth, nor are there nearby geological investigations
that evaluate displacement on the Portland Hills fault in the last 12,000 years. Our compilation of existing geotechnical studies and
seismic source characterization suggests a sub-vertical Portland Hills fault (Figure 2). Given the short distance of the proposed site from
the Portland Hills fault, < 500 m, further investigation of this fault is warranted prior to development of the RTES system.
Alternatively, a scenario M 9.0 subduction zone earthquake would generate > 3 to 6 minutes of shaking and would result in peak
horizontal acceleration of 0.25 to 0.30 g classified as Severe (Bauer et al., 2018). For this scenario earthquake, the likelihood of
permanent ground deformation for saturated soil is very high, from 0.1 – 1.18 m of permanent deformation (Bauer et al., 2018).
Deformation at the proposed area of the RTES thermal storage injection well locations on Willamette waterfront OHSU property would
include liquefaction and lateral spread. Permanent ground deformation throughout the Portland Metropolitan area should be anticipated
in the event of either a crustal fault or subduction zone earthquake, and appropriate well shut-off systems should be in place in the event
of ground failure. RTES operation could be restored once shaking stops and if no substantial localized ground deformation was present.
5. COST / BENEFIT ANALYSIS
In addition to technical feasibility, a goal of this paper is to analyze the economic feasibility of RTES for district (or large critical
infrastructure) heating needs in the Portland Basin. In particular, we focus on understanding the market potential for application of
RTES in the high population-density Portland downtown area, using an OHSU building on the south waterfront expansion (Figure 1) as
a case study to investigate the possible advantages and disadvantages. This analysis considers not only the costs of existing energy
options in comparison to RTES, but also the potential environmental benefits/impacts and resiliency and reliability characteristics
related to natural catastrophes.
Our findings suggest a general framework on the types of buildings with possible efficiency improvements that could be met with a
RTES system. In particular, building types with high energy demand to keep occupants comfortable, namely hospitals, colleges, and
grocery stores, appear to be good candidates for geothermal projects. Buildings or campuses over 500,000 square feet in size may also
benefit, considering the cost of improvements may be smaller relative to the value of the building(s). Economies of scale may further
benefit campuses or groups of buildings where one geothermal system (or a district geothermal system) can supply heat to multiple
buildings, sharing large fixed costs.
5.1 Levelized Cost of Energy (LCOE)
First, we compare RTES in the Portland Metro area with the current most common methods of building heating and cooling using a
common metric for energy cost comparisons - levelized cost of energy (LCOE). This calculation allows decision makers to compare
lifetime costs of different types of energy generation systems (coal, nuclear, solar, natural gas, wind, etc.). The most basic form of an
LCOE calculation is the sum of all of the costs of installing and operating a system over the expected life of the system divided by the
lifetime energy generation of a system. We use a general LCOE equation from GEOPHIRES v2.0 (Beckers and McCabe, 2018), which
Bershaw et al.
10
assumes that all capital costs occur in the first year. LCOE and levelized cost of heating (LCOH) are present value calculations to
evaluate the per unit cost of energy or heat for a generation system over the course of an assumed lifetime. Here, we report both LCOE
($/MWh) and LCOH ($/MMBtu).
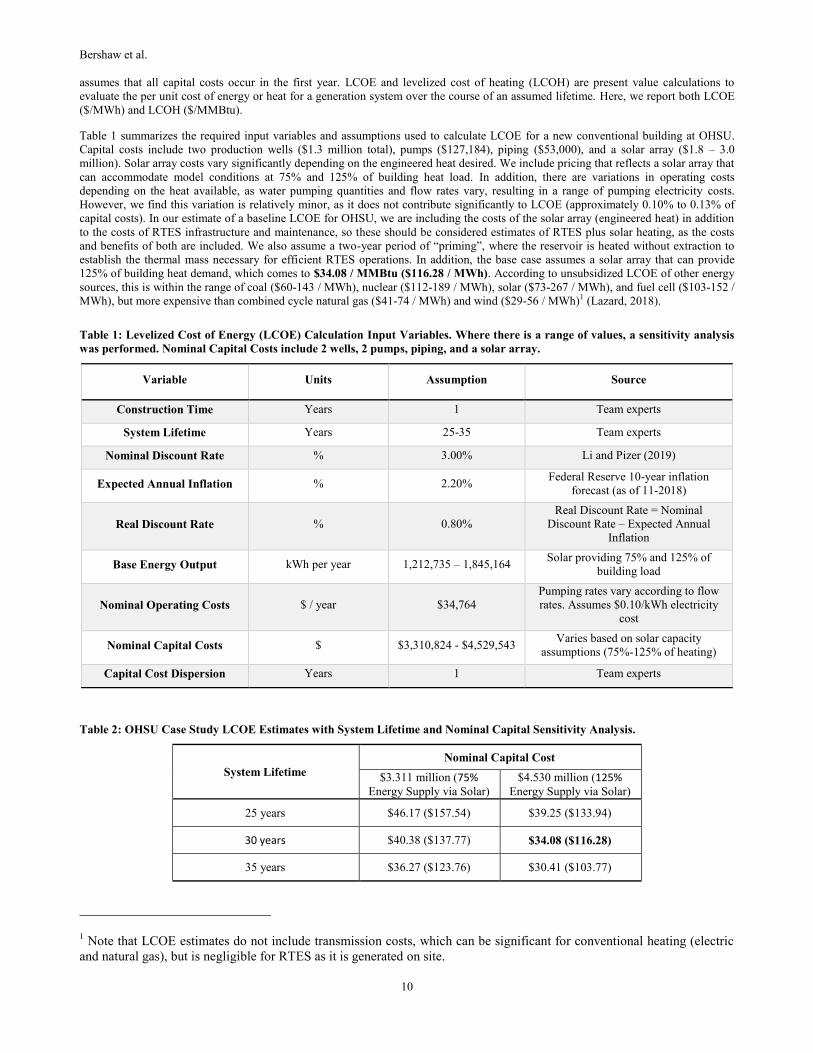
Table 1 summarizes the required input variables and assumptions used to calculate LCOE for a new conventional building at OHSU.
Capital costs include two production wells ($1.3 million total), pumps ($127,184), piping ($53,000), and a solar array ($1.8 – 3.0
million). Solar array costs vary significantly depending on the engineered heat desired. We include pricing that reflects a solar array that
can accommodate model conditions at 75% and 125% of building heat load. In addition, there are variations in operating costs
depending on the heat available, as water pumping quantities and flow rates vary, resulting in a range of pumping electricity costs.
However, we find this variation is relatively minor, as it does not contribute significantly to LCOE (approximately 0.10% to 0.13% of
capital costs). In our estimate of a baseline LCOE for OHSU, we are including the costs of the solar array (engineered heat) in addition
to the costs of RTES infrastructure and maintenance, so these should be considered estimates of RTES plus solar heating, as the costs
and benefits of both are included. We also assume a two-year period of “priming”, where the reservoir is heated without extraction to
establish the thermal mass necessary for efficient RTES operations. In addition, the base case assumes a solar array that can provide
125% of building heat demand, which comes to $34.08 / MMBtu ($116.28 / MWh). According to unsubsidized LCOE of other energy
sources, this is within the range of coal ($60-143 / MWh), nuclear ($112-189 / MWh), solar ($73-267 / MWh), and fuel cell ($103-152 /
MWh), but more expensive than combined cycle natural gas ($41-74 / MWh) and wind ($29-56 / MWh)1 (Lazard, 2018).
Table 1: Levelized Cost of Energy (LCOE) Calculation Input Variables. Where there is a range of values, a sensitivity analysis
was performed. Nominal Capital Costs include 2 wells, 2 pumps, piping, and a solar array.
Variable Units Assumption Source
Construction Time Years 1 Team experts
System Lifetime Years 25-35 Team experts
Nominal Discount Rate % 3.00% Li and Pizer (2019)
Expected Annual Inflation % 2.20% Federal Reserve 10-year inflation
forecast (as of 11-2018)
Real Discount Rate % 0.80%
Real Discount Rate = Nominal
Discount Rate – Expected Annual
Inflation
Base Energy Output kWh per year 1,212,735 – 1,845,164 Solar providing 75% and 125% of
building load
Nominal Operating Costs $ / year $34,764
Pumping rates vary according to flow
rates. Assumes $0.10/kWh electricity
cost
Nominal Capital Costs $ $3,310,824 - $4,529,543 Varies based on solar capacity
assumptions (75%-125% of heating)
Capital Cost Dispersion Years 1 Team experts
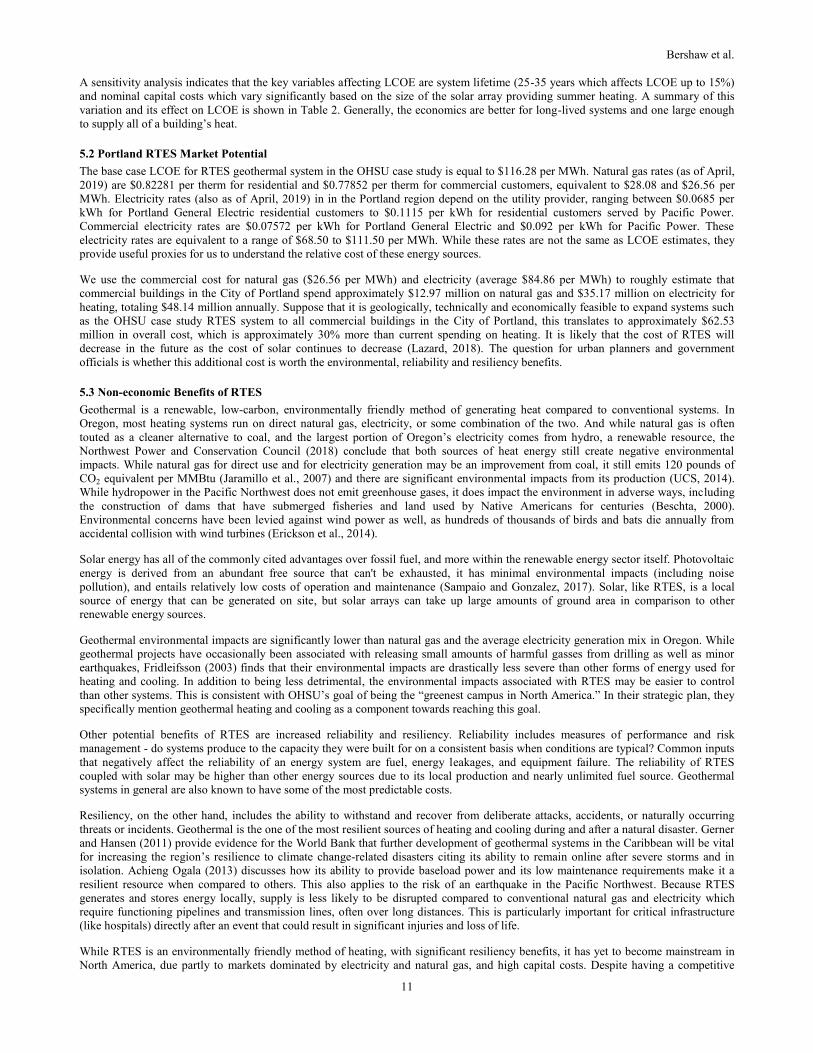
Table 2: OHSU Case Study LCOE Estimates with System Lifetime and Nominal Capital Sensitivity Analysis.
System Lifetime
Nominal Capital Cost
$3.311 million (75%
Energy Supply via Solar)
$4.530 million (125%
Energy Supply via Solar)
25 years $46.17 ($157.54) $39.25 ($133.94)
30 years $40.38 ($137.77) $34.08 ($116.28)
35 years $36.27 ($123.76) $30.41 ($103.77)
1 Note that LCOE estimates do not include transmission costs, which can be significant for conventional heating (electric
and natural gas), but is negligible for RTES as it is generated on site.
Bershaw et al.
11
A sensitivity analysis indicates that the key variables affecting LCOE are system lifetime (25-35 years which affects LCOE up to 15%)
and nominal capital costs which vary significantly based on the size of the solar array providing summer heating. A summary of this
variation and its effect on LCOE is shown in Table 2. Generally, the economics are better for long-lived systems and one large enough
to supply all of a building’s heat.
5.2 Portland RTES Market Potential
The base case LCOE for RTES geothermal system in the OHSU case study is equal to $116.28 per MWh. Natural gas rates (as of April,
2019) are $0.82281 per therm for residential and $0.77852 per therm for commercial customers, equivalent to $28.08 and $26.56 per
MWh. Electricity rates (also as of April, 2019) in in the Portland region depend on the utility provider, ranging between $0.0685 per
kWh for Portland General Electric residential customers to $0.1115 per kWh for residential customers served by Pacific Power.
Commercial electricity rates are $0.07572 per kWh for Portland General Electric and $0.092 per kWh for Pacific Power. These
electricity rates are equivalent to a range of $68.50 to $111.50 per MWh. While these rates are not the same as LCOE estimates, they
provide useful proxies for us to understand the relative cost of these energy sources.
We use the commercial cost for natural gas ($26.56 per MWh) and electricity (average $84.86 per MWh) to roughly estimate that
commercial buildings in the City of Portland spend approximately $12.97 million on natural gas and $35.17 million on electricity for
heating, totaling $48.14 million annually. Suppose that it is geologically, technically and economically feasible to expand systems such
as the OHSU case study RTES system to all commercial buildings in the City of Portland, this translates to approximately $62.53
million in overall cost, which is approximately 30% more than current spending on heating. It is likely that the cost of RTES will
decrease in the future as the cost of solar continues to decrease (Lazard, 2018). The question for urban planners and government
officials is whether this additional cost is worth the environmental, reliability and resiliency benefits.
5.3 Non-economic Benefits of RTES
Geothermal is a renewable, low-carbon, environmentally friendly method of generating heat compared to conventional systems. In
Oregon, most heating systems run on direct natural gas, electricity, or some combination of the two. And while natural gas is often
touted as a cleaner alternative to coal, and the largest portion of Oregon’s electricity comes from hydro, a renewable resource, the
Northwest Power and Conservation Council (2018) conclude that both sources of heat energy still create negative environmental
impacts. While natural gas for direct use and for electricity generation may be an improvement from coal, it still emits 120 pounds of
CO2 equivalent per MMBtu (Jaramillo et al., 2007) and there are significant environmental impacts from its production (UCS, 2014).
While hydropower in the Pacific Northwest does not emit greenhouse gases, it does impact the environment in adverse ways, including
the construction of dams that have submerged fisheries and land used by Native Americans for centuries (Beschta, 2000).
Environmental concerns have been levied against wind power as well, as hundreds of thousands of birds and bats die annually from
accidental collision with wind turbines (Erickson et al., 2014).
Solar energy has all of the commonly cited advantages over fossil fuel, and more within the renewable energy sector itself. Photovoltaic
energy is derived from an abundant free source that can't be exhausted, it has minimal environmental impacts (including noise
pollution), and entails relatively low costs of operation and maintenance (Sampaio and Gonzalez, 2017). Solar, like RTES, is a local
source of energy that can be generated on site, but solar arrays can take up large amounts of ground area in comparison to other
renewable energy sources.
Geothermal environmental impacts are significantly lower than natural gas and the average electricity generation mix in Oregon. While
geothermal projects have occasionally been associated with releasing small amounts of harmful gasses from drilling as well as minor
earthquakes, Fridleifsson (2003) finds that their environmental impacts are drastically less severe than other forms of energy used for
heating and cooling. In addition to being less detrimental, the environmental impacts associated with RTES may be easier to control
than other systems. This is consistent with OHSU’s goal of being the “greenest campus in North America.” In their strategic plan, they
specifically mention geothermal heating and cooling as a component towards reaching this goal.
Other potential benefits of RTES are increased reliability and resiliency. Reliability includes measures of performance and risk
management - do systems produce to the capacity they were built for on a consistent basis when conditions are typical? Common inputs
that negatively affect the reliability of an energy system are fuel, energy leakages, and equipment failure. The reliability of RTES
coupled with solar may be higher than other energy sources due to its local production and nearly unlimited fuel source. Geothermal
systems in general are also known to have some of the most predictable costs.
Resiliency, on the other hand, includes the ability to withstand and recover from deliberate attacks, accidents, or naturally occurring
threats or incidents. Geothermal is the one of the most resilient sources of heating and cooling during and after a natural disaster. Gerner
and Hansen (2011) provide evidence for the World Bank that further development of geothermal systems in the Caribbean will be vital
for increasing the region’s resilience to climate change-related disasters citing its ability to remain online after severe storms and in
isolation. Achieng Ogala (2013) discusses how its ability to provide baseload power and its low maintenance requirements make it a
resilient resource when compared to others. This also applies to the risk of an earthquake in the Pacific Northwest. Because RTES
generates and stores energy locally, supply is less likely to be disrupted compared to conventional natural gas and electricity which
require functioning pipelines and transmission lines, often over long distances. This is particularly important for critical infrastructure
(like hospitals) directly after an event that could result in significant injuries and loss of life.
While RTES is an environmentally friendly method of heating, with significant resiliency benefits, it has yet to become mainstream in
North America, due partly to markets dominated by electricity and natural gas, and high capital costs. Despite having a competitive
Bershaw et al.
12
LCOE, RTES systems in the Portland area will have high upfront costs (Table 1). We did not explicitly account for the cost of
financing, but did perform a sensitivity analysis on discount rate and found its impact to be relatively minor. High fixed capital costs are
compounded by a lack of commercial availability. However, these barriers can be overcome as the technology matures and research or
pilot projects similar to this one are conducted.
6. CONCLUSIONS
RTES is shown to be a viable option for heating buildings at Oregon Health Sciences University (OHSU) along the South Waterfront
expansion district, suggesting significant potential for large facilities (e.g., the Portland International Airport) or district heating across
the Portland Basin. The simplifying assumptions applied to our analysis of RTES are robust, and paired with other low-carbon sources
of energy like solar, RTES holds tremendous promise for many large cities in the USA that overlie brackish reservoirs at depth.
In summary, we find that the most important factors to consider when evaluating RTES efficacy are operational schedule, well spacing,
the amount of summer heat stored (in our model, a function of solar array size), and longevity of the system. Key risks (future research
needs) in implementing RTES in the Portland Basin include reservoir heterogeneity (e.g. faults and fractures) and scaling (mineral
precipitation) due to high temperatures involved (in this study, up to 80 C). We find that preheating of the reservoir and higher injection
temperatures shorten the period until thermal loads can be met, with heat recovery efficiency continuing to increase over time. Our base
case LCOE estimate ($34.08 per MMBtu or $116.28 per MWh) suggests RTES is comparable to unsubsidized solar and nuclear, but
more expensive than natural gas, with additional benefits in reducing our carbon footprint and energy resiliency, particularly for critical
infrastructure in the event of a natural disaster. Simulations herein assume steady storage and use of heat, but the reservoir might also be
operated to store heat for use during emergency conditions (e.g., earthquake, volcanic eruption, etc.). To handle this contingency, the
reservoir could be sized larger with hotter temperatures to store a significantly larger volume of heat. Even when the solar array is
smaller than necessary to supply 100% of annual loads, having a larger reservoir would allow receiving other episodic sources of heat
(e.g., low-cost electricity during peak wind) for regular or emergency heating.
We also find that the Portland Basin has a large thermal energy storage capacity (reaching ~87,000 GWh) for both heating and cooling,
suggesting tremendous potential to expand RTES throughout the Portland Metropolitan Area. Though we do not focus on it here,
cooling is also likely viable, but specially constructed building cooling systems may need to be utilized to allow for efficient transfer of
heat using RTES. Heating and cooling in the same vicinity would result in a reduction in thermal recovery efficiency. But if other
renewables (e.g., wind, solar, ambient air/water temperature, etc.) were used as the reservoir heating/cooling sources, the tradeoff with
thermal recovery could be evaluated.
Buildings can be engineered to use lower temperatures and lower temperature differentials, so while RTES is viable as a resource for a
new conventional building at OHSU, new buildings or retrofits might consider heating options for use in RTES systems operated at
lower temperatures. Future work could focus on the development of non-conventional building designs that are optimized for RTES
(e.g., radiant floor heating, above-ground water storage, etc.) to improve the economics (lower LCOE). Cooling needs are more
significant than heating in most cities across the USA (including Portland), with cooling demand anticipated to grow in the coming
decades as buildings become better insulated and global climate continues to warm. Compared to heating, using RTES for cooling may
also reduce risk associated with scaling. This presents a great opportunity to evaluate the potential for RTES to provide building cooling
for critical infrastructure.
7. ACKNOWLEDGMENTS
This manuscript is based upon work supported by the U.S. Department of Energy’s Office of Energy Efficiency and Renewable Energy
(EERE) under the Geothermal Technologies Office, under Award Number DE-EE0008105. Additional support for Erick Burns and
Colin Williams was provided by the U.S. Geological Survey Energy Resources Program. Any use of trade, firm, or product names is for
descriptive purposes only and does not imply endorsement by the U.S. Government.
REFERENCES
Achieng Ogala, P.F.: The power to change: Creating lifeline and mitigation-adaptation opportunities through geothermal energy
utilization, Faculty of Life and Environmental Sciences School of Engineering and Natural Sciences, University of Iceland,
Doctoral Dissertation, (2012).
Bauer, W., Burns, W.J., and Madin, I.P.: Open-File Report O-18-02, Earthquake Regional Impact Analysis for Clackamas, Multnomah,
and Washington counties, Oregon, Oregon Department of Geology and Mineral Industries, (2018), 90 p.
Beckers, K.J. and McCabe, K.: Introducing GEOPHIRES v2. 0: Updated geothermal techno-economic simulation tool, National
Renewable Energy Lab., Golden, CO, United States, No. NREL/CP-5500-70856, (2018).
Beeson, M.H., Fecht, K.R., Reidel, S.P., and Tolan, T.L.: Regional correlations within the Frenchman Springs Member of the Columbia
River Basalt Group: New insights into the middle Miocene tectonics of northwestern Oregon, Oregon Geology, 47 no. 8, (1985),
87-96.
Beschta, R.L.: Watershed management in the Pacific Northwest: The historical legacy, U.S. Department of Agriculture, Forest Service,
Rocky Mountain Research Station, (2000), 109-116.
Blackwell, D.D., Hull, D.A., Bowen, R.G., and Steele, J.L.: Heat flow of Oregon, Oregon Department of Geology and Mineral
Industries, Special Paper 4, (1978), 42 pp.
Bershaw et al.
13
Blackwell, D.D. and Steele, J.L.: Geothermal data from deep holes in the Oregon Cascade Range, Geothermal Res. Council Trans., v.
11, (1987), pp. 317-322.
Blackwell, D.D., Steel, J.L., Frohme, M.K., Murphey, C.F., Priest, G.R., and Black, G.L.: Heat flow in the Oregon Cascade Range and
its correlation with regional gravity, Curie point depths, and geology, J. of Geophys. Res., 95, (1990), 19475-19493.
Blackwell, D.D., Richards, M.C., Frone, Z.S., Batir, J.F., Williams, M.A., Ruzo, A.A., and Dingwall, R.K.: SMU geothermal laboratory
heat flow map of the conterminous United States, (2011).
Blakely, R.J., Wells, R.E., Yelin, T.S., and Beeson, M.H.: Tectonic setting of the Portland-Vancouver area, Oregon and Washington –
constraints from low-altitude aeromagnetic data, Geological Society of America Bulletin, v.107, (1995), p.1051-1062.
Bonte, M., Van Breukelen, B.M., & Stuyfzand, P.J.: Environmental impacts of aquifer thermal energy storage investigated by field and
laboratory experiments. Journal of water and climate change, 4(2), (2013), 77-89.
Burns, E.R., Bershaw, J., Williams, C.F., Wells, R., Uddenberg, M., Scanlon, D., Cladouhos, T.T., and van Houten, B.: Using Saline or
Brackish Aquifers as Reservoirs for Thermal Energy Storage, with Example Calculations for Direct-Use Heating in the Portland
Basin, OR, USA, in peer-review for Geothermics, (2020).
Burns, E.R, Snyder, D.T, Haynes, J.V., and Waibel, M.S.: Groundwater status and trends for the Columbia Plateau Regional Aquifer
System, Washington, Oregon, and Idaho, U.S. Geological Survey Scientific Investigations Report 2012–5261, (2012), 52 p.
Burns, E.R., Williams, C.F., Ingebritsen, S.E., Voss, C.I., Spane, F.A., and DeAngelo, J.: Understanding heat and groundwater flow
through continental flood basalt provinces: insights gained from alternative models of permeability/depth relationships for the
Columbia Plateau, USA: Geofluids, v. 15, (2015), p. 120–138.
Burns, E.R., Williams, C.F., Tolan, T., and Kaven, J.O.: Are the Columbia River Basalts, Columbia Plateau, Oregon and Washington,
USA, a Viable Geothermal Target? A Preliminary Analysis, Proceedings: 41st Workshop on Geothermal Reservoir Engineering,
Stanford University, Stanford, California, February 22-24, (2016).
Burns, E.R., Cladouhos, T.T., Williams, C.F. and Bershaw, J.: Controls on Deep Direct-Use Thermal Energy Storage (DDU-TES) in the
Portland Basin, Oregon, USA, GRC Transactions, Vol. 42, (2018).
Ely, D.M., Burns, E.R., Morgan, D.S., and Vaccaro, J.J.: Numerical simulation of groundwater flow in the Columbia Plateau Regional
Aquifer System, Idaho, Oregon, and Washington, (ver. 1.1, January 2015), U.S. Geological Survey Scientific Investigations Report
2014–5127, (2014), 90 p.
Erickson, W., Wolfe, M., Bay, K., Johnson, D., and Gehring, J.: A comprehensive analysis of small-passerine fatalities from collision
with turbines at wind energy facilities. PLoS One, 15(9), (2014).
Evarts, R.C., O’Connor, J.E., Wells, R.E., and Madin, I.P.: The Portland Basin: A (big) river runs through it, GSA Today, 19 no. 9,
(2009), 4-10.
Fleuchaus, P., Godschalk, B., Stober, I., and Blum, P.: Worldwide application of aquifer thermal energy storage – A review, Renewable
and Sustainable Energy Reviews, (2018), 861-876.
Fridleifsson, I.: Status of geothermal energy amongst the world’s energy sources, Geothermics, 32(4), (2003).
García-Gil, A., Epting, J., Ayora, C., Garrido, E., Vázquez-Suñé, E., Huggenberger, P., and Gimenez, A.C.: A reactive transport model
for the quantification of risks induced by groundwater heat pump systems in urban aquifers, Journal of Hydrology, 542, (2016),
719-730.
Gerner, F., and Hansen, M.: Caribbean Regional Electricity Supply Options: Toward Greater Security, Renewables and Resilience.
World Bank, (2011).
Herrera, N.B., Burns, E.R., and Conlon, T.D.: Simulation of groundwater flow and the interaction of groundwater and surface water in
the Willamette Basin and Central Willamette subbasin, Oregon, U.S. Geological Survey Scientific Investigations Report 2014–
5136, (2014), 152 p.
Hincks, T., Aspinall, W., Cooke, R. and Gernon, T.: Oklahoma's induced seismicity strongly linked to wastewater injection depth,
Science, 359(6381), (2018), pp.1251-1255.
Jaramillo, P., Griffin, W., and Matthews, H.: Comparative life-cycle air emissions of coal, domestic natural gas, LNG, and SNG for
electricity generation, Environmental Science & Technology, 41(17), (2007), 6290-6296.
Keranen, K.M., Savage, H.M., Abers, G.A., and Cochran, E.S.: Potentially induced earthquakes in Oklahoma, USA: Links between
wastewater injection and the 2011 Mw 5.7 earthquake sequence, Geology, 41(6), (2013), 699-702.
Lazard: Levelized Cost of Energy Analysis - Version 12.0. Retrieved from https://www.lazard.com/media/450784/lazards-levelized-
cost-of-energy-version-120-vfinal.pdf, (2018).
Li, Q., and Pizer, W.A.: Discounting for Public Cost–Benefit Analysis, Working Paper 19-02, Resources for the Future, Retrieved from
https://www.rff.org/documents/1976/WP-19-02-Li-Pizer-f.pdf, (2019).
Bershaw et al.
14
Liberty, L.M.: Procurement and reprocessing of an industry marine seismic reflection profile from the Columbia River, Oregon and
Washington, Center for Geophysical Investigation of the Shallow Subsurface (CGISS), Boise State University, (2002), p. 1–14.
McFarland, W.D., and Morgan, D.S.: Description of the ground-water flow system in the Portland Basin, Oregon and Washington, U.S.
Geological Survey Water Supply Paper 2470-A, (1996), 58 p.
McPhee, D.K., Langenheim, V.E., Wells, R.E., and Blakely, R.J.: Tectonic evolution of the Tualatin basin, northwest Oregon, as
revealed by inversion of gravity data, Geosphere, v.10, (2014), p.264-275.
Morgan, D.S., and McFarland, W.D.: Simulation analysis of the ground-water flow system in the Portland Basin, Oregon and
Washington, U.S. Geological Survey Water Supply Paper 2470-B, (1996), 83 p.
Northwest Power and Conservation Council: Avoided Carbon Dioxide Production Rates in the Northwest Power System, Retrieved
from https://www.nwcouncil.org/sites/default/files/2018-1.pdf, (2018).
PAE: Energy Analysis Report – Energy Trust Project #2014347, (2017).
Rosenbrand, E., Haugwitz, C., Jacobsen, P.S.M., Kjøller, C., and Fabricius, I.L.: The effect of hot water injection on sandstone
permeability. Geothermics, 50, (2014), 155-166.
Rubinstein, J.L. and Mahani, A.B.: Myths and facts on wastewater injection, hydraulic fracturing, enhanced oil recovery, and induced
seismicity, Seismological Research Letters, 86(4), (2015), pp.1060-1067.
Sampaio, P.G.V. and Gonzalez, M.O.A.: Photovoltaic solar energy: conceptual framework, Renew. Sustain. Energy Rev., 74, (2017),
590-601.
Scanlon, D.P.: The Spatial and Temporal Evolution of the Portland and Tualatin Basins, Oregon, USA, Portland State University,
Masters dissertation, (2019).
Steele, J.L., Blackwell, D.D., and Robison, J.H.: Heat flow in the vicinity of the Mount Hood volcano, Oregon, in Geology and
Geothermal Resources of the Mount Hood area, Oregon, Oregon Department of Geology and Mineral Industries, (1982), pp. 31-
42.
Svadlenak, E.E.: Geochemical Response to Thermal Energy Storage in the Columbia River Basalt Aquifer System Beneath the Portland
Basin, Oregon, Portland State University, Masters dissertation, (2019).
UCS (Union of Concerned Scientists): Environmental Impacts of natural gas, Reports & Multimedia/Explainer, (2014), Retrieved at
ucsusa.org.
United States Department of Energy (DOE): Low Temperature Deep Direct-Use Program Draft White Paper, Office of Energy
Efficiency and Renewable Energy, Retrieved from https://www.energy.gov/eere/geothermal/low-temperature-deep-direct-use-
program-draft-white-paper, (2019).
Waitt, R.B.: Case for Periodic, Colossal Jӧkulhlaups from Pleistocene Glacial Lake Missoula, Geological Society of America Bulletin,
96, (1985), 1271-1286.
Wells, R.E., Weaver, C.S., and Blakely, R.J.: Fore-arc Migration in Cascadia and its Neotectonic Significance, Geology, 26, (1998),
759-762.
Wells, R., Bukry, D., Friedman, R., Pyle, D., Duncan, R., Haeussler, P., and Wooden, J.: Geologic history of Siletzia, a large igneous
province in the Oregon and Washington Coast Range: Correlation to the geomagnetic polarity time scale and implications for a
long-lived Yellowstone hotspot, Geosphere, 10(4), (2014), 692-719.
Wells, R.E., Haugerud, R.A., Niem, A.R., Niem, W.A., Ma, Lina, Evarts, R.C., O'Connor, J.E., Madin, I.P., Sherrod, D.R., Beeson,
M.H., Tolan, T.L., Wheeler, K.L., Hanson, W.B., and Sawlan, M.G.: Geologic map of the greater Portland metropolitan area and
surrounding region, Oregon and Washington, U.S. Geological Survey Scientific Investigations Map 3443, scale 1:63,360, in press,
(2020), 127 p.
Williams, C.F., and DeAngelo, J.: Mapping Geothermal Potential in the Western United States, Transactions of the Geothermal
Resources Council, 32, (2008).
Wong, I.G.: The Historical Earthquake Record in the Pacific Northwest: Applications and Implications to Seismic Hazard Assessment,
Converging in Cascadia, Symposium Proceedings: Association of Engineering Geologists Special Publication, 10, (1997), 19-36.
Wong, I., Silva, W., Bott, J., Wright, D., Thomas, P., Gregor, N., Li, S., Maybe, M., Sojourner, A., and Y. Wang,: Earthquake Scenario
and Probabilistic Ground Shaking Maps for the Portland, Oregon Metropolitan Area, Portland Hills fault M 6.8 Earthquake Peak
Horizontal Acceleration (g) at the Ground Surface, Oregon Department of Geology and Mineral Industries, Open-File Report IMS-
15, (2000).