Embed Size (px)
Citation preview


EVEREST INDUSTRIES LIMITED
H1 / Q2–FY18 EARNINGS PRESENTATION
2
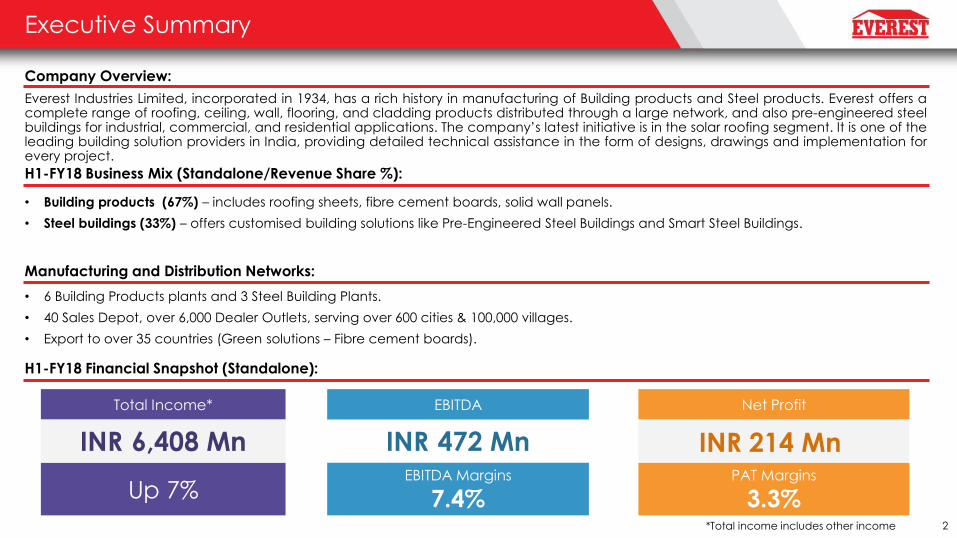
Executive Summary
• Building products (67%) – includes roofing sheets, fibre cement boards, solid wall panels.
• Steel buildings (33%) – offers customised building solutions like Pre-Engineered Steel Buildings and Smart Steel Buildings.
• 6 Building Products plants and 3 Steel Building Plants.
• 40 Sales Depot, over 6,000 Dealer Outlets, serving over 600 cities & 100,000 villages.
• Export to over 35 countries (Green solutions – Fibre cement boards).
Everest Industries Limited, incorporated in 1934, has a rich history in manufacturing of Building products and Steel products. Everest offers a complete range of roofing, ceiling, wall, flooring, and cladding products distributed through a large network, and also pre-engineered steel buildings for industrial, commercial, and residential applications. The company‟s latest initiative is in the solar roofing segment. It is one of the leading building solution providers in India, providing detailed technical assistance in the form of designs, drawings and implementation for every project.
Company Overview:
H1-FY18 Business Mix (Standalone/Revenue Share %):
Manufacturing and Distribution Networks:
H1-FY18 Financial Snapshot (Standalone):
Total Income*
Up 7%
INR 6,408 Mn
EBITDA
EBITDA Margins
7.4%
INR 472 Mn
Net Profit
PAT Margins
3.3%
INR 214 Mn
*Total income includes other income
3
Company Overview
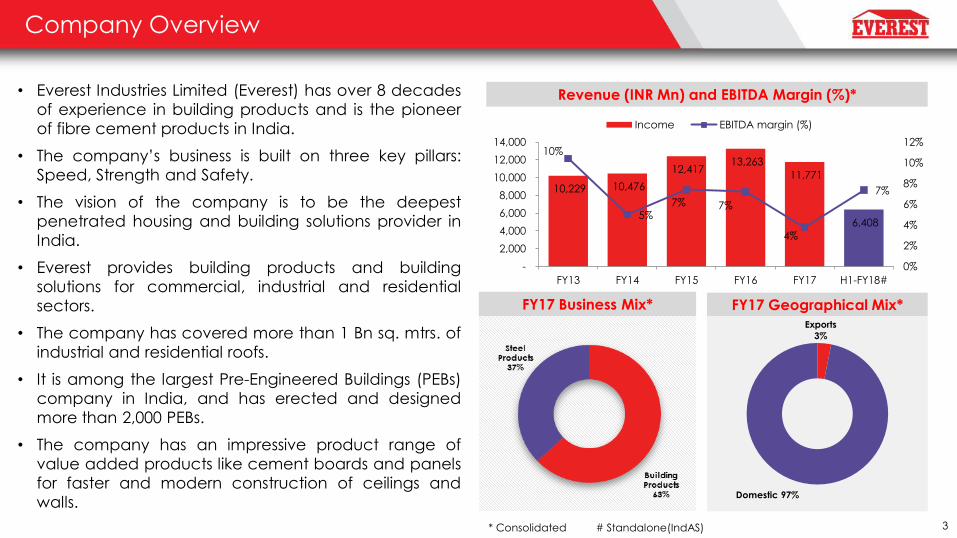
Revenue (INR Mn) and EBITDA Margin (%)* • Everest Industries Limited (Everest) has over 8 decades
of experience in building products and is the pioneer
of fibre cement products in India.
• The company‟s business is built on three key pillars:
Speed, Strength and Safety.
• The vision of the company is to be the deepest
penetrated housing and building solutions provider in
India.
• Everest provides building products and building
solutions for commercial, industrial and residential
sectors.
• The company has covered more than 1 Bn sq. mtrs. of
industrial and residential roofs.
• It is among the largest Pre-Engineered Buildings (PEBs)
company in India, and has erected and designed
more than 2,000 PEBs.
• The company has an impressive product range of
value added products like cement boards and panels
for faster and modern construction of ceilings and
walls.
FY17 Business Mix* FY17 Geographical Mix*
* Consolidated # Standalone(IndAS)
Exports
3%
Domestic 97%
10,229 10,476
12,417 13,263
11,771
6,408
10%
5% 7% 7%
4%
7%
0%
2%
4%
6%
8%
10%
12%
-
2,000
4,000
6,000
8,000
10,000
12,000
14,000
FY13 FY14 FY15 FY16 FY17 H1-FY18#
Income EBITDA margin (%)
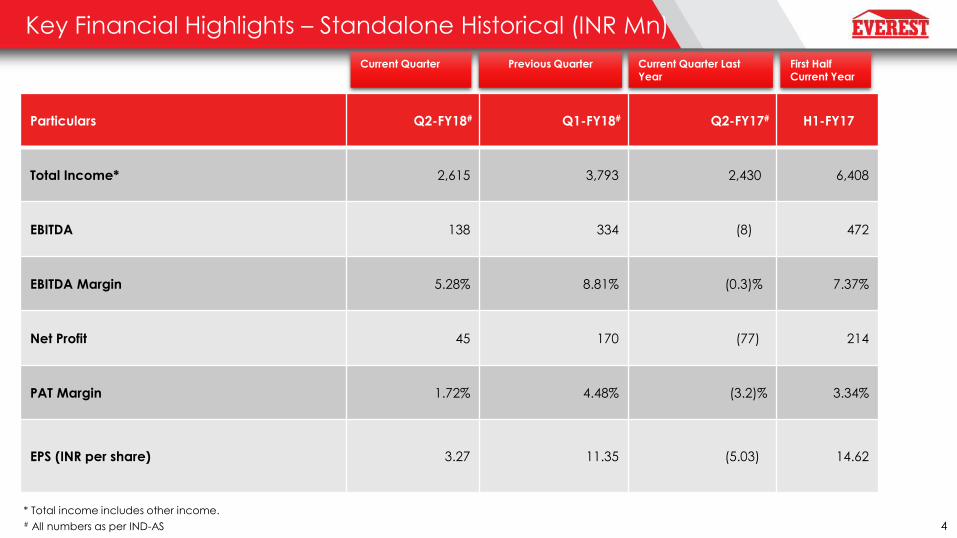
Key Financial Highlights – Standalone Historical (INR Mn)
Particulars Q2-FY18# Q1-FY18# Q2-FY17# H1-FY17
Total Income* 2,615 3,793 2,430 6,408
EBITDA 138 334 (8) 472
EBITDA Margin 5.28% 8.81% (0.3)% 7.37%
Net Profit 45 170 (77) 214
PAT Margin 1.72% 4.48% (3.2)% 3.34%
EPS (INR per share) 3.27 11.35 (5.03) 14.62
Current Quarter
Previous Quarter
Current Quarter Last Year
* Total income includes other income. # All numbers as per IND-AS 4
First Half Current Year
5
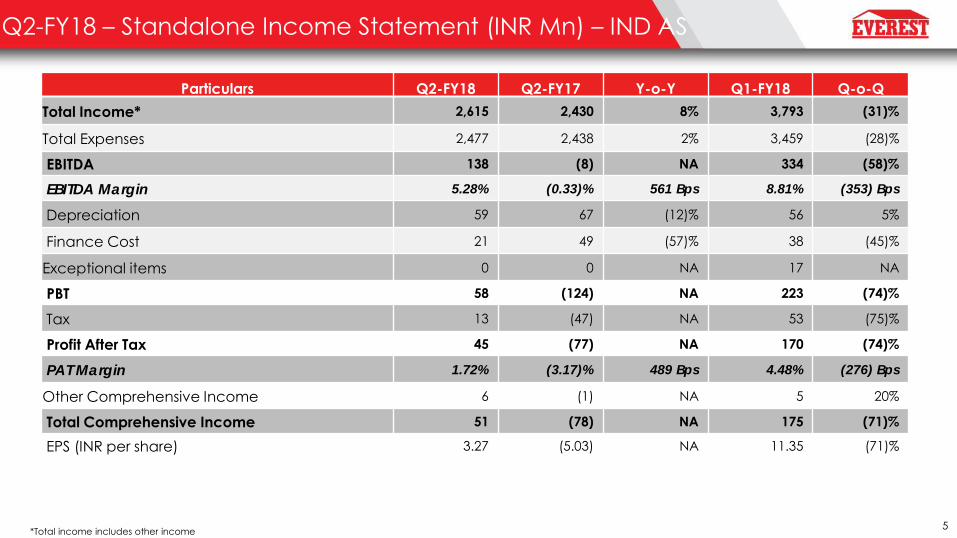
Q2-FY18 – Standalone Income Statement (INR Mn) – IND AS
*Total income includes other income
Particulars Q2-FY18 Q2-FY17 Y-o-Y Q1-FY18 Q-o-Q
Total Income* 2,615 2,430 8% 3,793 (31)%
Total Expenses 2,477 2,438 2% 3,459 (28)%
EBITDA 138 (8) NA 334 (58)%
EBITDA Margin 5.28% (0.33)% 561 Bps 8.81% (353) Bps
Depreciation 59 67 (12)% 56 5%
Finance Cost 21 49 (57)% 38 (45)%
Exceptional items 0 0 NA 17 NA
PBT 58 (124) NA 223 (74)%
Tax 13 (47) NA 53 (75)%
Profit After Tax 45 (77) NA 170 (74)%
PAT Margin 1.72% (3.17)% 489 Bps 4.48% (276) Bps
Other Comprehensive Income 6 (1) NA 5 20%
Total Comprehensive Income 51 (78) NA 175 (71)%
EPS (INR per share) 3.27 (5.03) NA 11.35 (71)%
6
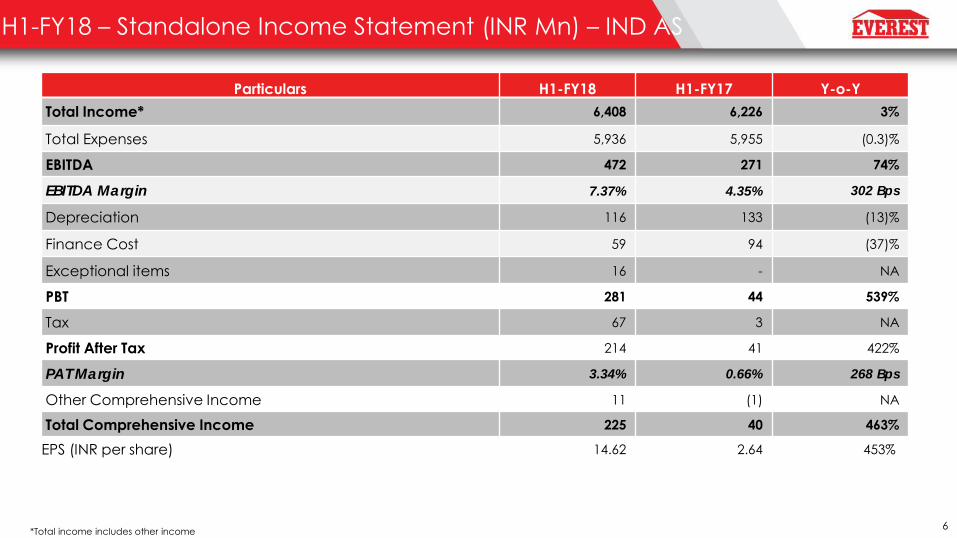
H1-FY18 – Standalone Income Statement (INR Mn) – IND AS
*Total income includes other income
Particulars H1-FY18 H1-FY17 Y-o-Y
Total Income* 6,408 6,226 3%
Total Expenses 5,936 5,955 (0.3)%
EBITDA 472 271 74%
EBITDA Margin 7.37% 4.35% 302 Bps
Depreciation 116 133 (13)%
Finance Cost 59 94 (37)%
Exceptional items 16 - NA
PBT 281 44 539%
Tax 67 3 NA
Profit After Tax 214 41 422%
PAT Margin 3.34% 0.66% 268 Bps
Other Comprehensive Income 11 (1) NA
Total Comprehensive Income 225 40 463%
EPS (INR per share) 14.62 2.64 453%

EVEREST INDUSTRIES LIMITED
H1 / Q2–FY18 Operational Highlights – Building
Products
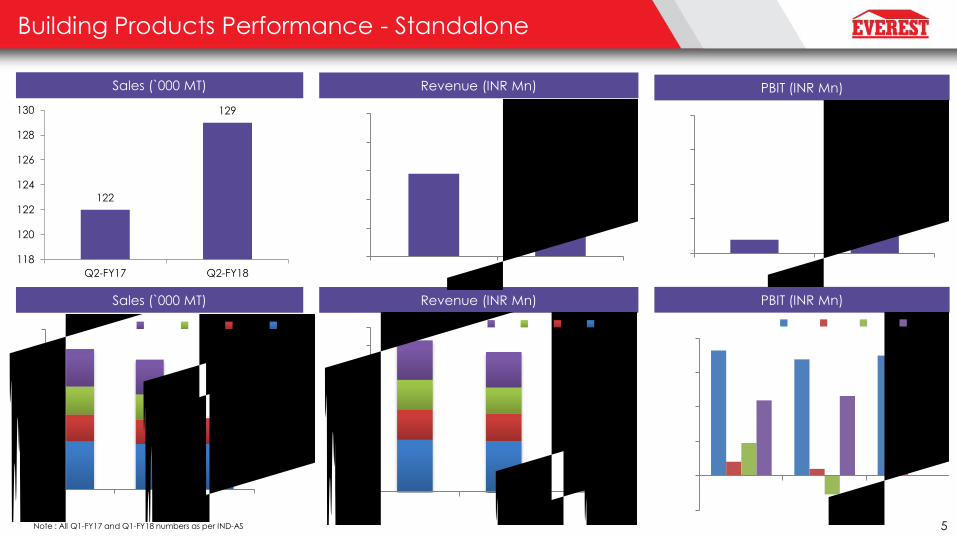
Building Products Performance - Standalone
Sales (`000 MT) Revenue (INR Mn) PBIT (INR Mn)
Sales (`000 MT) Revenue (INR Mn) PBIT (INR Mn)
122
129
118
120
122
124
126
128
130
Q2-FY17 Q2-FY18
Note : All Q1-FY17 and Q1-FY18 numbers as per IND-AS
20
149
0
50
100
150
200
Q2-FY17 Q2-FY18
364 338 349
41 20
149
95
-54
219 232
-100
0
100
200
300
400
2016 2017 2018
Q1 Q2 Q3 Q4
2,840 2,768 2,722
1,640 1,509 1,525
1,648 1,431
2,166 1,945
0
1,000
2,000
3,000
4,000
5,000
6,000
7,000
8,000
9,000
2016 2017 2018
Q4 Q3 Q2 Q1
1,509
1,525
1,480
1,490
1,500
1,510
1,520
1,530
Q2-FY17 Q2-FY18
5
239 226 226
135 122 129
140 127
188 174
0
100
200
300
400
500
600
700
800
2016 2017 2018
Q4 Q3 Q2 Q1
Key Operational Highlights – Building Products Segment
• Despite GST challenge, sales increased by 6% in terms of volume compared to Q2-FY17, and revenue by 2% vis-à-vis Q2-FY17
• Post GST previously inaccessible markets have become viable.
• Enhanced our operational utilization of plants.
• Better volumes in Boards and Panels as compared to Q2-FY17 in Domestic Markets.
• GST on fibre cement roofs and boards to 18% - improvement of the market as these products are more affordable for the end consumer.
• Continued downturn in export markets on account of poor economic conditions in Middle East.
7
Way Forward – Building products Segment
Post GST implementation and stabilization , positive sentiments back to market for demand growth.
“Housing for all” initiative expected to spur demand for speedier and faster construction.
New products will help us on more consumer centric products.
Everest will continue working towards educating influencing communities for using modern methods of construction.
Everest will keep raising awareness about conservation of natural resources, keeping in mind Speed, Strength and Safety.
With steady efforts on Research & Development, Everest will introduce newer products.
Initial IT glitches in GST implementation may impact supplies and demand from traders, current economic conditions and demand from customers are likely to negate these conditions
Government is proactively working to eliminate GST related infrastructure issues.
Expect stable prices for raw materials
8

EVEREST INDUSTRIES LIMITED
H1 / Q2–FY18 Operational Highlights – Steel
Buildings
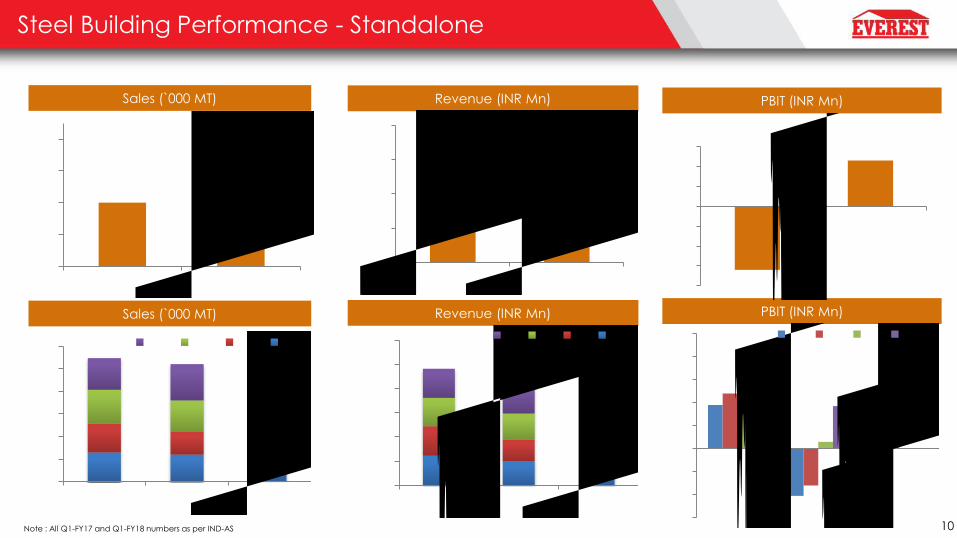
Steel Building Performance - Standalone
Sales (`000 MT) Revenue (INR Mn) PBIT (INR Mn)
Sales (`000 MT) Revenue (INR Mn) PBIT (INR Mn)
Note : All Q1-FY17 and Q1-FY18 numbers as per IND-AS
899
1,066
700
800
900
1000
1100
Q2-FY17 Q2-FY18 -32
23
-40
-30
-20
-10
0
10
20
30
Q2-FY17 Q2-FY18
38
-41
5
48
-32
23
78
6
38 37
-60
-40
-20
0
20
40
60
80
100
2016 2017 2018
Q1 Q2 Q3 Q4
1,226 998 1,058
1,223 899 1,066
1,177 1,082
1,206 1,292
0
1,000
2,000
3,000
4,000
5,000
6,000
2016 2017 2018
Q4 Q3 Q2 Q1
10
10
14
6
8
10
12
14
Q2-FY17 Q2-FY18
12.9 12 13
12.8 10 14
15 14
14 16
0
10
20
30
40
50
60
2016 2017 2018
Q4 Q3 Q2 Q1
Key Operational Highlights – Steel buildings
• Dispatched 14,299 MT material in Q2-FY18, 40% higher than Q2-FY17.
• Customers are looking for speedier handover of their orders, indicative of positive sentiments in the
economy.
• Order book as on 30th September 2017 stands at 26,518 MT.
• Commodity prices are increasing, but we expect a stable price regime for steel.
11
Way forward for Steel buildings
Everest remains committed towards smarter, safer, and speedier construction technology.
Government focus to connect Tier II and Tier III towns via air routes will help the company promote its
modern Smart Steel Building Technologies.
With more focus of the private sector to promote green buildings, Everest will directly benefit as it is in a
position to provide the best alternative construction method which is 3 times faster than the conventional
construction.
Reorganization of logistics post GST will provide a large opportunity for Everest.
Perception shift from conventional construction to pre-engineered steel structures is helping convert Tier II
and Tier III towns customers.
Everest continues undertaking consumer education by participating in seminars & exhibitions, educating
young architects in colleges and increasing its focus on creating more brand awareness and repeat
customers.
12
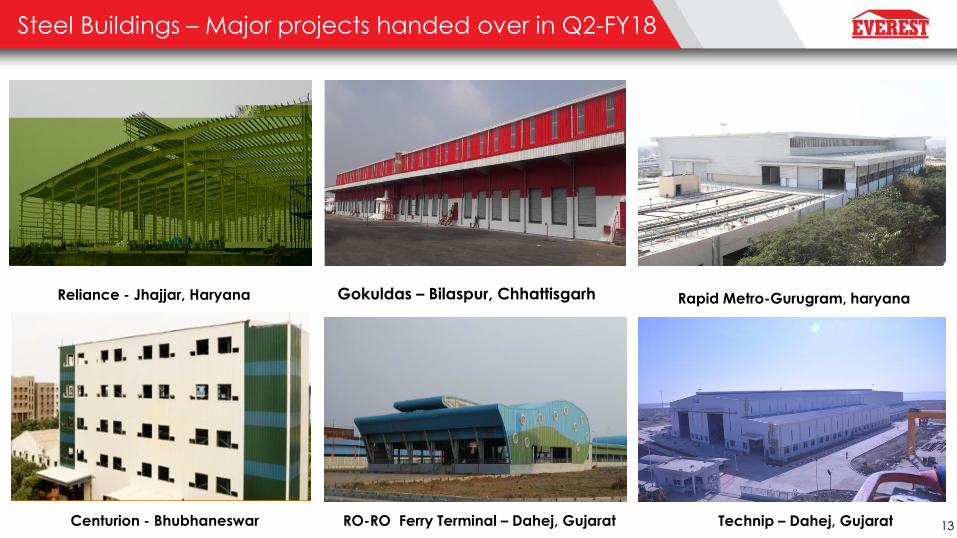
Steel Buildings – Major projects handed over in Q2-FY18
Reliance - Jhajjar, Haryana Rapid Metro-Gurugram, haryana
Centurion - Bhubhaneswar Technip – Dahej, Gujarat
Gokuldas – Bilaspur, Chhattisgarh
RO-RO Ferry Terminal – Dahej, Gujarat 13
16
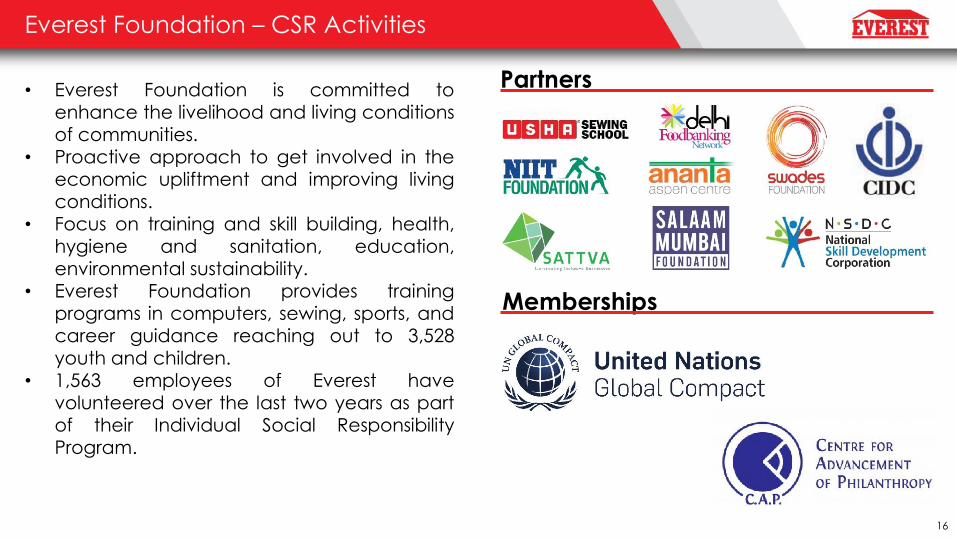
Everest Foundation – CSR Activities
• Everest Foundation is committed to enhance the livelihood and living conditions
of communities. • Proactive approach to get involved in the
economic upliftment and improving living conditions.
• Focus on training and skill building, health,
hygiene and sanitation, education, environmental sustainability.
• Everest Foundation provides training programs in computers, sewing, sports, and career guidance reaching out to 3,528
youth and children. • 1,563 employees of Everest have
volunteered over the last two years as part of their Individual Social Responsibility Program.
Partners
Memberships
17
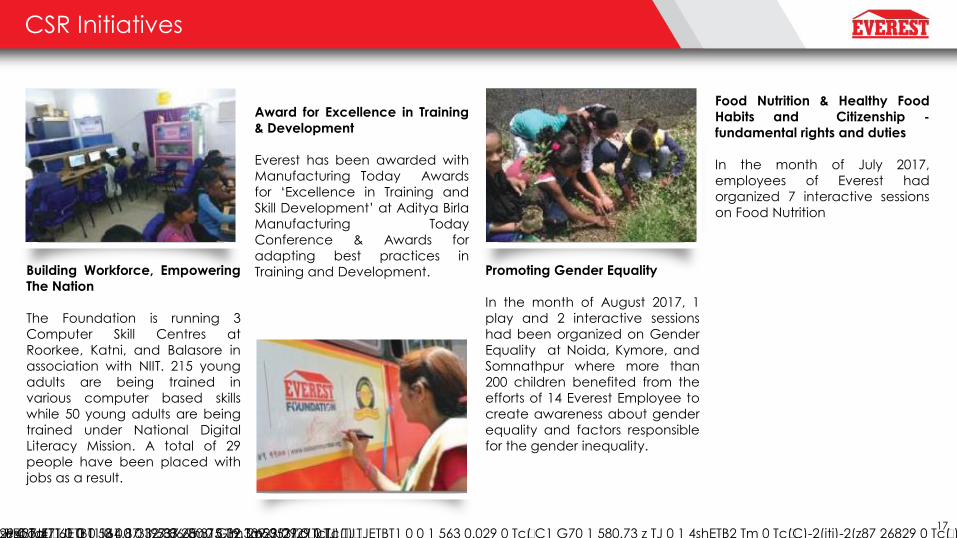
CSR Initiatives
Building Workforce, Empowering
The Nation
The Foundation is running 3
Computer Skill Centres at
Roorkee, Katni, and Balasore in
association with NIIT. 215 young
adults are being trained in
various computer based skills
while 50 young adults are being
trained under National Digital
Literacy Mission. A total of 29
people have been placed with
jobs as a result.
Award for Excellence in Training
& Development
Everest has been awarded with
Manufacturing Today Awards
for „Excellence in Training and
Skill Development‟ at Aditya Birla
Manufacturing Today
Conference & Awards for
adapting best practices in
Training and Development. Promoting Gender Equality
In the month of August 2017, 1
play and 2 interactive sessions
had been organized on Gender
Equality at Noida, Kymore, and
Somnathpur where more than
200 children benefited from the
efforts of 14 Everest Employee to
create awareness about gender
equality and factors responsible
for the gender inequality.
Food Nutrition & Healthy Food
Habits and Citizenship -
fundamental rights and duties
In the month of July 2017,
employees of Everest had
organized 7 interactive sessions
on Food Nutrition
HET 1 437.47 6t 1 0 0 1 630.53 325.32 Tm700B7>] 251
sesood
EVEREST INDUSTRIES LIMITED
Historical Financial Statements
19
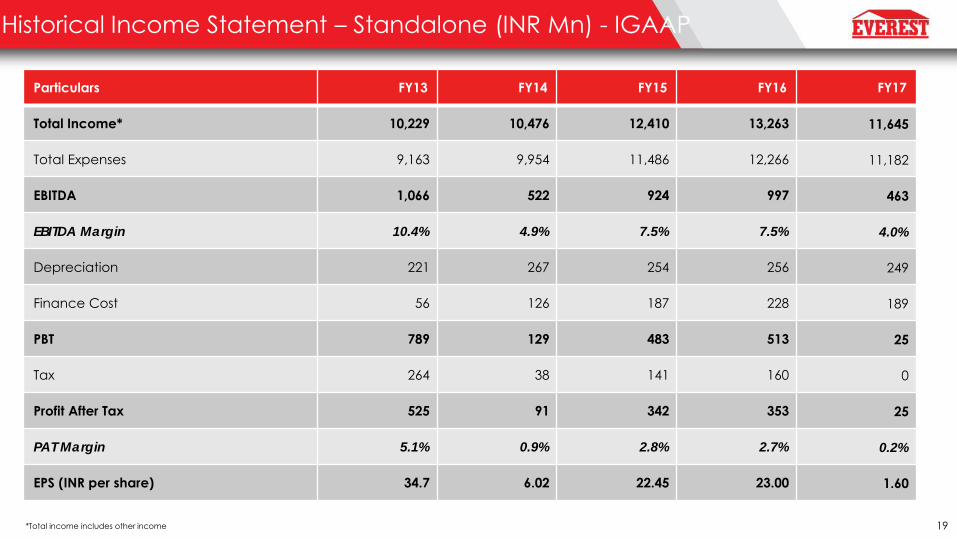
Historical Income Statement – Standalone (INR Mn) - IGAAP
Particulars FY13 FY14 FY15 FY16 FY17
Total Income* 10,229 10,476 12,410 13,263 11,645
Total Expenses 9,163 9,954 11,486 12,266 11,182
EBITDA 1,066 522 924 997 463
EBITDA Margin 10.4% 4.9% 7.5% 7.5% 4.0%
Depreciation 221 267 254 256 249
Finance Cost 56 126 187 228 189
PBT 789 129 483 513 25
Tax 264 38 141 160 0
Profit After Tax 525 91 342 353 25
PAT Margin 5.1% 0.9% 2.8% 2.7% 0.2%
EPS (INR per share) 34.7 6.02 22.45 23.00 1.60
*Total income includes other income
20
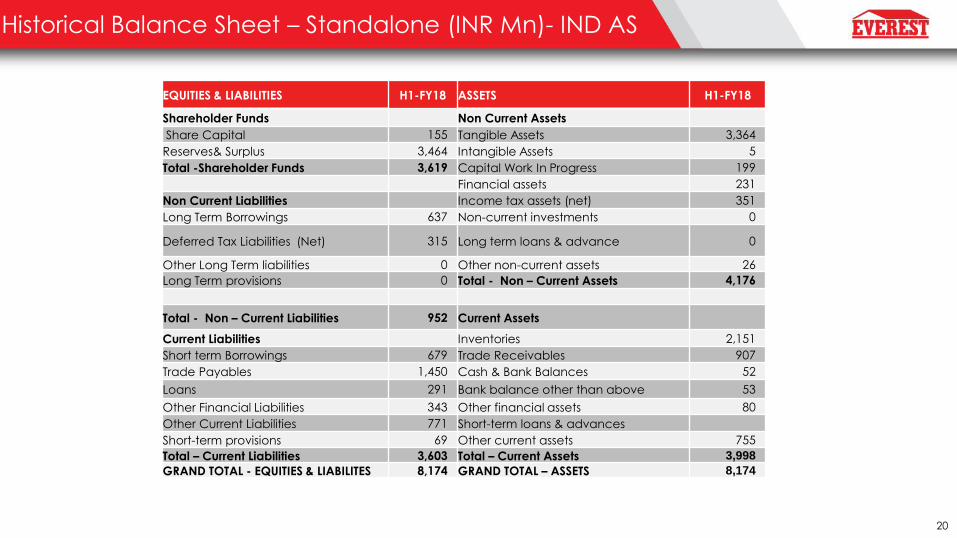
Historical Balance Sheet – Standalone (INR Mn)- IND AS
EQUITIES & LIABILITIES H1-FY18 ASSETS H1-FY18
Shareholder Funds Non Current Assets
Share Capital 155 Tangible Assets 3,364
Reserves& Surplus 3,464 Intangible Assets 5
Total -Shareholder Funds 3,619 Capital Work In Progress 199
Financial assets 231
Non Current Liabilities Income tax assets (net) 351
Long Term Borrowings 637 Non-current investments 0
Deferred Tax Liabilities (Net) 315 Long term loans & advance 0
Other Long Term liabilities 0 Other non-current assets 26
Long Term provisions 0 Total - Non – Current Assets 4,176
Total - Non – Current Liabilities 952 Current Assets
Current Liabilities Inventories 2,151
Short term Borrowings 679 Trade Receivables 907
Trade Payables 1,450 Cash & Bank Balances 52
Loans 291 Bank balance other than above 53
Other Financial Liabilities 343 Other financial assets 80
Other Current Liabilities 771 Short-term loans & advances
Short-term provisions 69 Other current assets 755
Total – Current Liabilities 3,603 Total – Current Assets 3,998
GRAND TOTAL - EQUITIES & LIABILITES 8,174 GRAND TOTAL – ASSETS 8,174
21
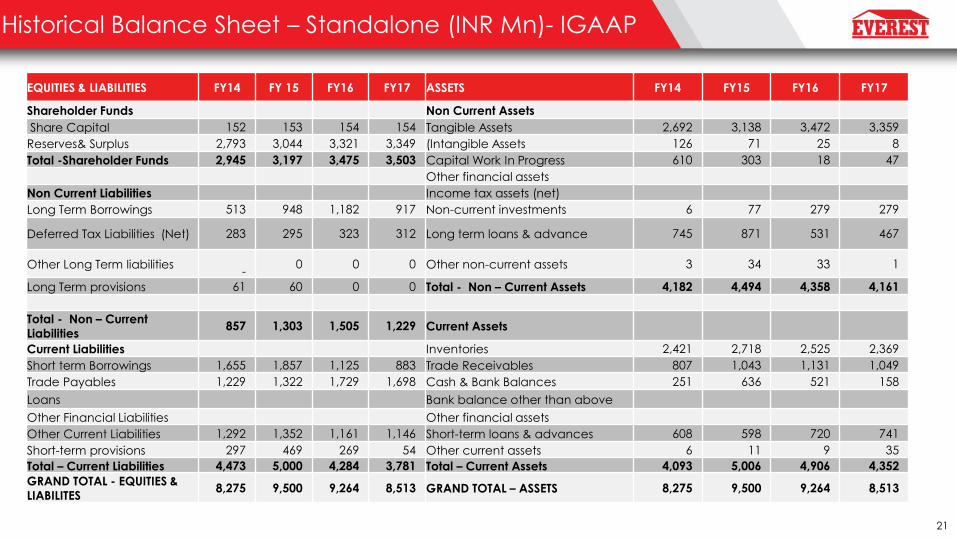
Historical Balance Sheet – Standalone (INR Mn)- IGAAP
EQUITIES & LIABILITIES FY14 FY 15 FY16 FY17 ASSETS FY14 FY15 FY16 FY17
Shareholder Funds Non Current Assets
Share Capital 152 153 154 154 Tangible Assets 2,692 3,138 3,472 3,359
Reserves& Surplus 2,793 3,044 3,321 3,349 (Intangible Assets 126 71 25 8
Total -Shareholder Funds 2,945 3,197 3,475 3,503 Capital Work In Progress 610 303 18 47
Other financial assets
Non Current Liabilities Income tax assets (net)
Long Term Borrowings 513 948 1,182 917 Non-current investments 6 77 279 279
Deferred Tax Liabilities (Net) 283 295 323 312 Long term loans & advance 745 871 531 467
Other Long Term liabilities
- 0 0 0 Other non-current assets 3 34 33 1
Long Term provisions 61 60 0 0 Total - Non – Current Assets 4,182 4,494 4,358 4,161
Total - Non – Current
Liabilities 857 1,303 1,505 1,229 Current Assets
Current Liabilities Inventories 2,421 2,718 2,525 2,369
Short term Borrowings 1,655 1,857 1,125 883 Trade Receivables 807 1,043 1,131 1,049
Trade Payables 1,229 1,322 1,729 1,698 Cash & Bank Balances 251 636 521 158
Loans Bank balance other than above
Other Financial Liabilities Other financial assets
Other Current Liabilities 1,292 1,352 1,161 1,146 Short-term loans & advances 608 598 720 741
Short-term provisions 297 469 269 54 Other current assets 6 11 9 35
Total – Current Liabilities 4,473 5,000 4,284 3,781 Total – Current Assets 4,093 5,006 4,906 4,352
GRAND TOTAL - EQUITIES &
LIABILITES 8,275 9,500 9,264 8,513 GRAND TOTAL – ASSETS 8,275 9,500 9,264 8,513
22
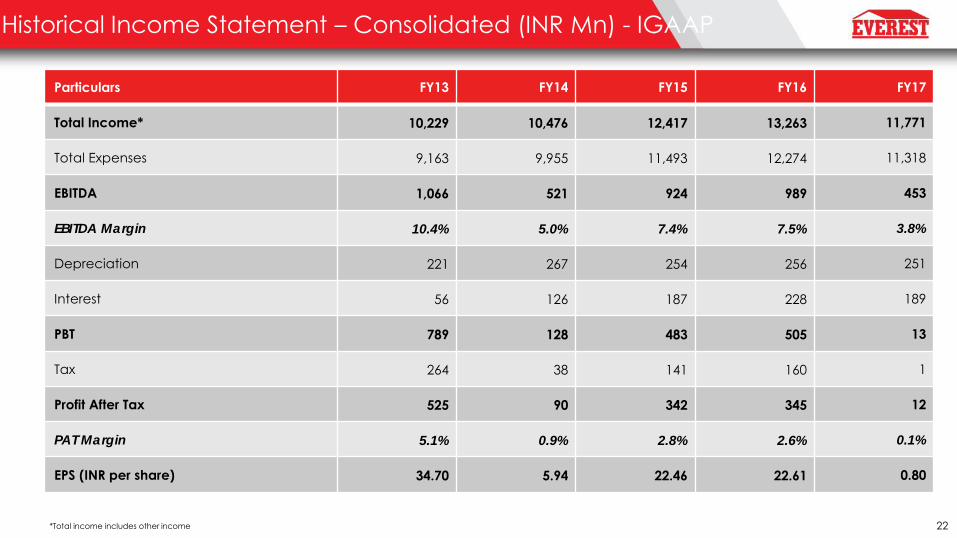
Historical Income Statement – Consolidated (INR Mn) - IGAAP
Particulars FY13 FY14 FY15 FY16 FY17
Total Income* 10,229 10,476 12,417 13,263 11,771
Total Expenses 9,163 9,955 11,493 12,274 11,318
EBITDA 1,066 521 924 989 453
EBITDA Margin 10.4% 5.0% 7.4% 7.5% 3.8%
Depreciation 221 267 254 256 251
Interest 56 126 187 228 189
PBT 789 128 483 505 13
Tax 264 38 141 160 1
Profit After Tax 525 90 342 345 12
PAT Margin 5.1% 0.9% 2.8% 2.6% 0.1%
EPS (INR per share) 34.70 5.94 22.46 22.61 0.80
*Total income includes other income
23
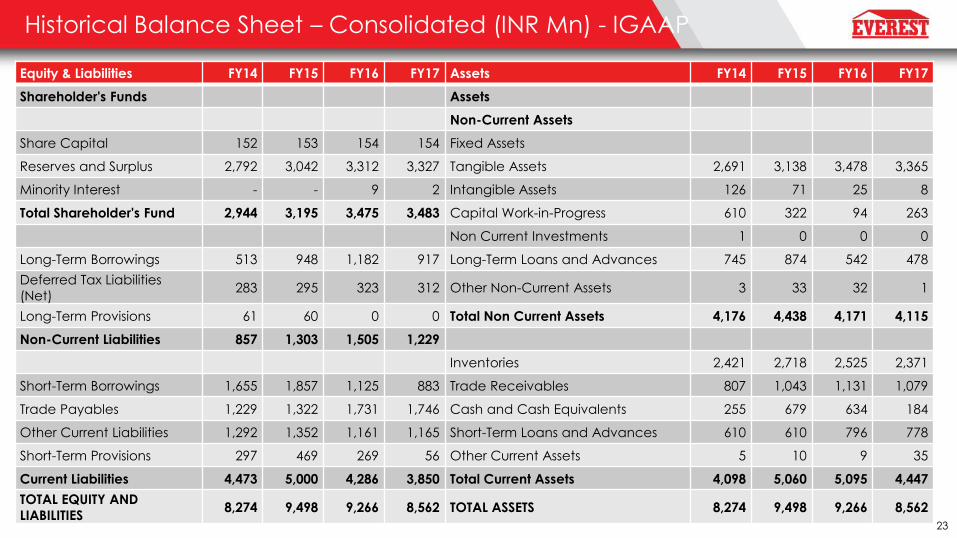
Historical Balance Sheet – Consolidated (INR Mn) - IGAAP
Equity & Liabilities FY14 FY15 FY16 FY17 Assets FY14 FY15 FY16 FY17
Shareholder's Funds Assets
Non-Current Assets
Share Capital 152 153 154 154 Fixed Assets
Reserves and Surplus 2,792 3,042 3,312 3,327 Tangible Assets 2,691 3,138 3,478 3,365
Minority Interest - - 9 2 Intangible Assets 126 71 25 8
Total Shareholder's Fund 2,944 3,195 3,475 3,483 Capital Work-in-Progress 610 322 94 263
Non Current Investments 1 0 0 0
Long-Term Borrowings 513 948 1,182 917 Long-Term Loans and Advances 745 874 542 478
Deferred Tax Liabilities
(Net) 283 295 323 312 Other Non-Current Assets 3 33 32 1
Long-Term Provisions 61 60 0 0 Total Non Current Assets 4,176 4,438 4,171 4,115
Non-Current Liabilities 857 1,303 1,505 1,229
Inventories 2,421 2,718 2,525 2,371
Short-Term Borrowings 1,655 1,857 1,125 883 Trade Receivables 807 1,043 1,131 1,079
Trade Payables 1,229 1,322 1,731 1,746 Cash and Cash Equivalents 255 679 634 184
Other Current Liabilities 1,292 1,352 1,161 1,165 Short-Term Loans and Advances 610 610 796 778
Short-Term Provisions 297 469 269 56 Other Current Assets 5 10 9 35
Current Liabilities 4,473 5,000 4,286 3,850 Total Current Assets 4,098 5,060 5,095 4,447
TOTAL EQUITY AND
LIABILITIES 8,274 9,498 9,266 8,562 TOTAL ASSETS 8,274 9,498 9,266 8,562
24
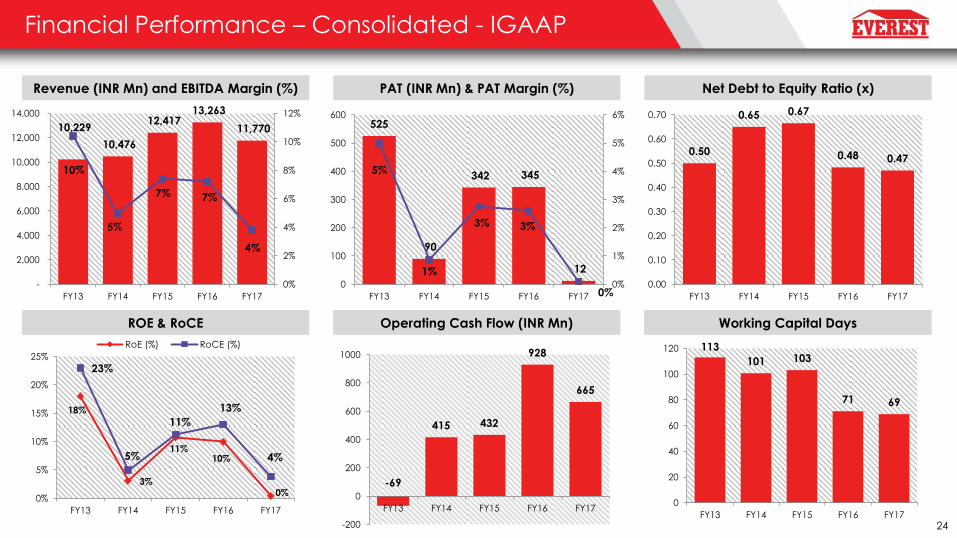
Financial Performance – Consolidated - IGAAP
PAT (INR Mn) & PAT Margin (%)
Operating Cash Flow (INR Mn)
Revenue (INR Mn) and EBITDA Margin (%)
ROE & RoCE
Net Debt to Equity Ratio (x)
Working Capital Days
10,229
10,476
12,417 13,263
11,770
10%
5%
7% 7%
4%
0%
2%
4%
6%
8%
10%
12%
-
2,000
4,000
6,000
8,000
10,000
12,000
14,000
FY13 FY14 FY15 FY16 FY17
525
90
342 345
12
5%
1%
3% 3%
0% 0%
1%
2%
3%
4%
5%
6%
0
100
200
300
400
500
600
FY13 FY14 FY15 FY16 FY17
0.50
0.65 0.67
0.48 0.47
0.00
0.10
0.20
0.30
0.40
0.50
0.60
0.70
FY13 FY14 FY15 FY16 FY17
18%
3%
11% 10%
0%
23%
5%
11%
13%
4%
0%
5%
10%
15%
20%
25%
FY13 FY14 FY15 FY16 FY17
RoE (%) RoCE (%) 113
101 103
71 69
0
20
40
60
80
100
120
FY13 FY14 FY15 FY16 FY17
-69
415 432
928
665
-200
0
200
400
600
800
1000
FY13 FY14 FY15 FY16 FY17
25
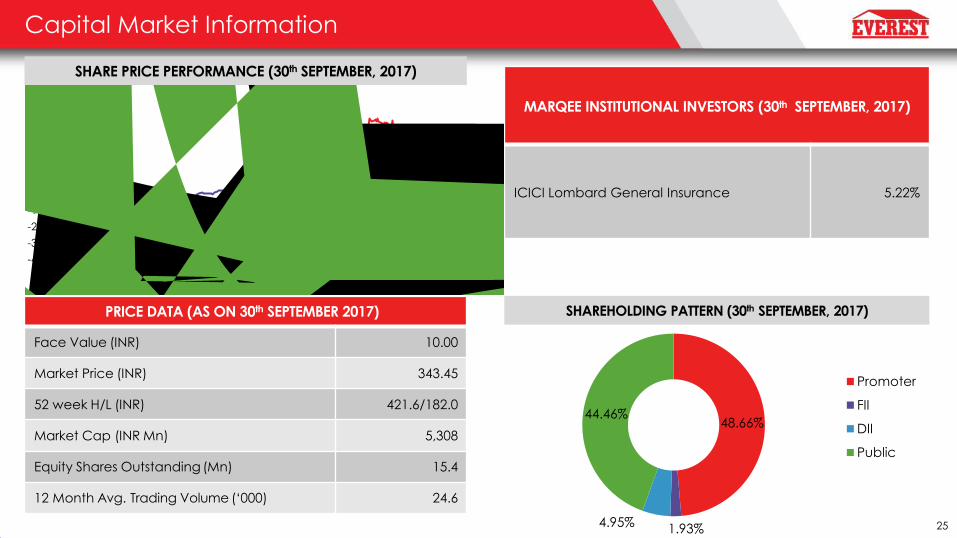
Capital Market Information
SHAREHOLDING PATTERN (30th SEPTEMBER, 2017)
SHARE PRICE PERFORMANCE (30th SEPTEMBER, 2017)
PRICE DATA (AS ON 30th SEPTEMBER 2017)
Face Value (INR) 10.00
Market Price (INR) 343.45
52 week H/L (INR) 421.6/182.0
Market Cap (INR Mn) 5,308
Equity Shares Outstanding (Mn) 15.4
12 Month Avg. Trading Volume („000) 24.6
MARQEE INSTITUTIONAL INVESTORS (30th SEPTEMBER, 2017)
ICICI Lombard General Insurance 5.22%
48.66%
1.93% 4.95%
44.46%
Promoter
FII
DII
Public
-40%
-30%
-20%
-10%
0%
10%
20%
30%
40%
50%
60%
26
The earnings call to discuss financial and operational performance for
H1/Q2-FY18 with Mr. Manish Sanghi, Managing Director and Mr. Nikhil Dujari,
CFO will be held on:
Date: Monday, 30th October, 2017
Time: 11.00 AM
Primary Dial-in Numbers: +91 22 3960 0763
H1/Q2- FY18 Earnings Call Information
27
Disclaimer
Everest Industries Limited Disclaimer: No representation or warranty, express or implied, is made as to, and no reliance should be placed on, the fairness, accuracy, completeness or correctness of the information or opinions contained in this presentation. Such information and opinions are in all events not current after the date of this presentation. Certain statements made in this presentation may not be based on historical information or facts and may be "forward looking statements" based on the currently held beliefs and assumptions of the management of Everest Industries Limited(“Company” or “Everest Industries Limited”), which are expressed in good faith and in their opinion reasonable, including those relating to the Company’s general business plans and strategy, its future financial condition and growth prospects and future developments in its industry and its competitive and regulatory environment. Forward-looking statements involve known and unknown risks, uncertainties and other factors, which may cause the actual results, financial condition, performance or achievements of the Company or industry results to differ materially from the results, financial condition, performance or achievements expressed or implied by such forward-looking statements, including future changes or developments in the Company’s business, its competitive environment and political, economic, legal and social conditions. Further, past performance is not necessarily indicative of future results. Given these risks, uncertainties and other factors, viewers of this presentation are cautioned not to place undue reliance on these forward-looking statements. The Company disclaims any obligation to update these forward-looking statements to reflect future events or developments. This presentation is for general information purposes only, without regard to any specific objectives, financial situations or informational needs of any particular person. This presentation does not constitute an offer or invitation to purchase or subscribe for any securities in any jurisdiction, including the United States. No part of it should form the basis of or be relied upon in connection with any investment decision or any contract or commitment to purchase or subscribe for any securities. None of our securities may be offered or sold in the United States, without registration under the U.S. Securities Act of 1933, as amended, or pursuant to an exemption from registration there from. This presentation is confidential and may not be copied or disseminated, in whole or in part, and in any manner. Valorem Advisors Disclaimer:
Valorem Advisors is an Independent Investor Relations Management Service company. This Presentation has been prepared by Valorem Advisors based on information and data which the Company considers reliable, but Valorem Advisors and the Company makes no representation or warranty, express or implied, whatsoever, and no reliance shall be placed on, the truth, accuracy, completeness, fairness and reasonableness of the contents of this Presentation. This Presentation may not be all inclusive and may not contain all of the information that you may consider material. Any liability in respect of the contents of, or any omission from, this Presentation is expressly excluded. Valorem Advisors also hereby certifies that the directors or employees of Valorem Advisors do not own any stock in personal or company capacity of the Company under review.
For further details, please feel free to contact our Investor Relations Representatives:
Mr. Anuj Sonpal
Valorem Advisors
Tel: +91-22-3006-7521 / 22 / 23 / 24
Email: [email protected]