Embed Size (px)
Citation preview
Even More SQA:Even More SQA:
CAPACAPA
Corrective and Preventive Actions
What is CAPA?
activities not intended to correct defects, but to eliminate the cause of those defects.
corrective - fix past problems preventive - predict potential problems
Reality Check...Reality Check...
How can we see into the future and fix problems that have not yet occurred?
How to conduct CAPA
1. information collection
2. analysis of information
3. development of improved methods
4. implementation of improved methods
5. follow-up
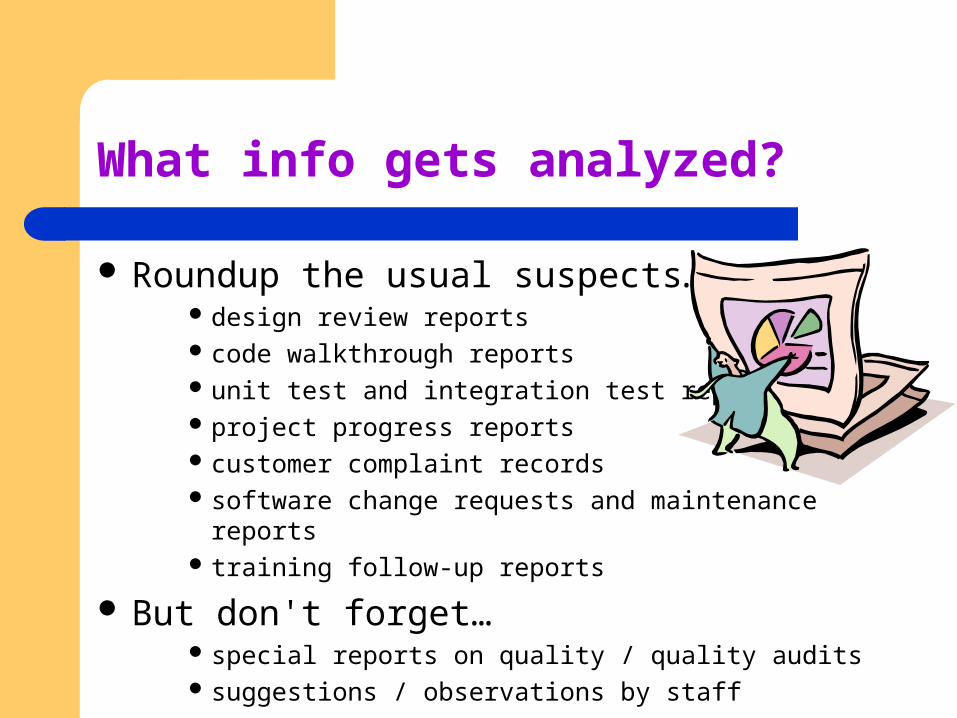
What info gets analyzed?
Roundup the usual suspects… design review reports code walkthrough reports unit test and integration test reports project progress reports customer complaint records software change requests and maintenance reports training follow-up reports
But don't forget… special reports on quality / quality audits suggestions / observations by staff
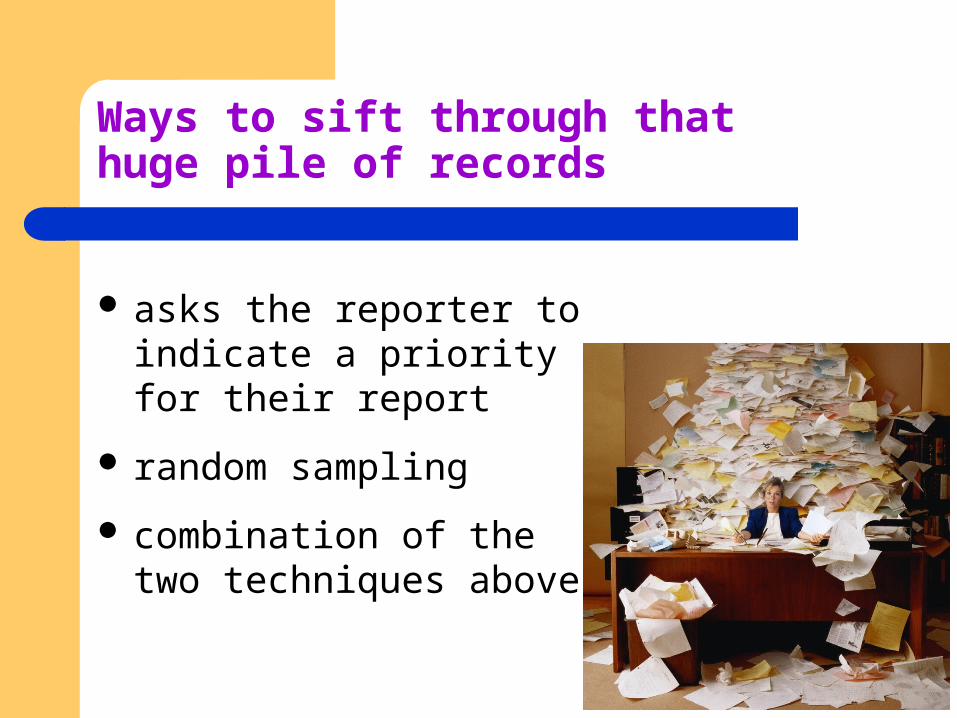
Ways to sift through that huge pile of records
asks the reporter to indicate a priority for their report
random sampling
combination of the two techniques above
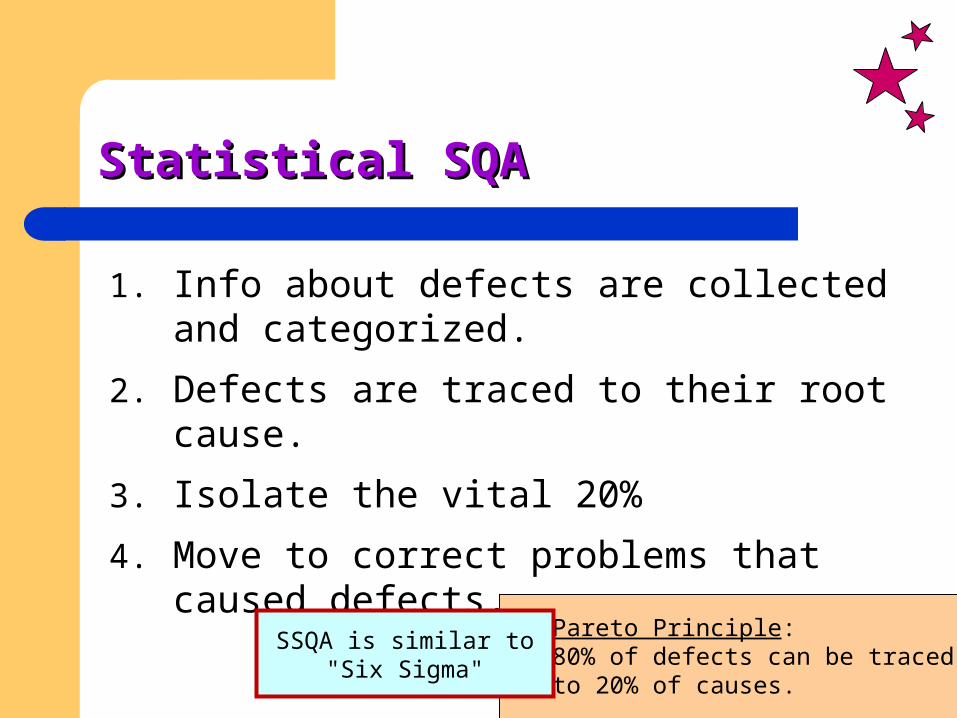
Statistical SQAStatistical SQA
1. Info about defects are collected and categorized.
2. Defects are traced to their root cause.
3. Isolate the vital 20%
4. Move to correct problems that caused defects.
Pareto Principle: 80% of defects can be traced to 20% of causes.
SSQA is similar to"Six Sigma"
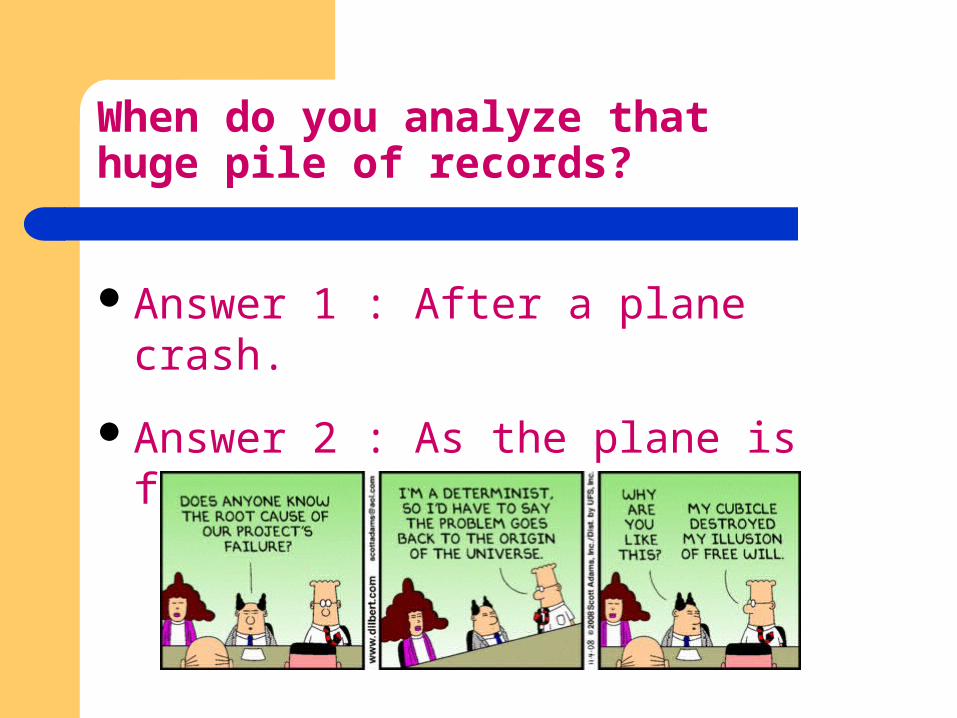
When do you analyze that huge pile of records?
Answer 1 : After a plane crash.
Answer 2 : As the plane is flying.
Background:Common Cause and Special Cause
" 'A riot occurs in a certain prison. Officials and sociologists turn out a detailed report about the prison, with a full explanation of why and how it happened here, ignoring the fact that the causes were common to a majority of prisons, and that the riot could have happened anywhere.'
The quote recognizes that there is a temptation to react to an extreme outcome and to see it as significant, even where its causes are common to many situations and the distinctive circumstances surrounding its occurrence, the results of mere chance. Such behavior has many implications within management, often leading to interventions in processes that merely increase the level of variation and frequency of undesirable outcomes."
Harry Alpert
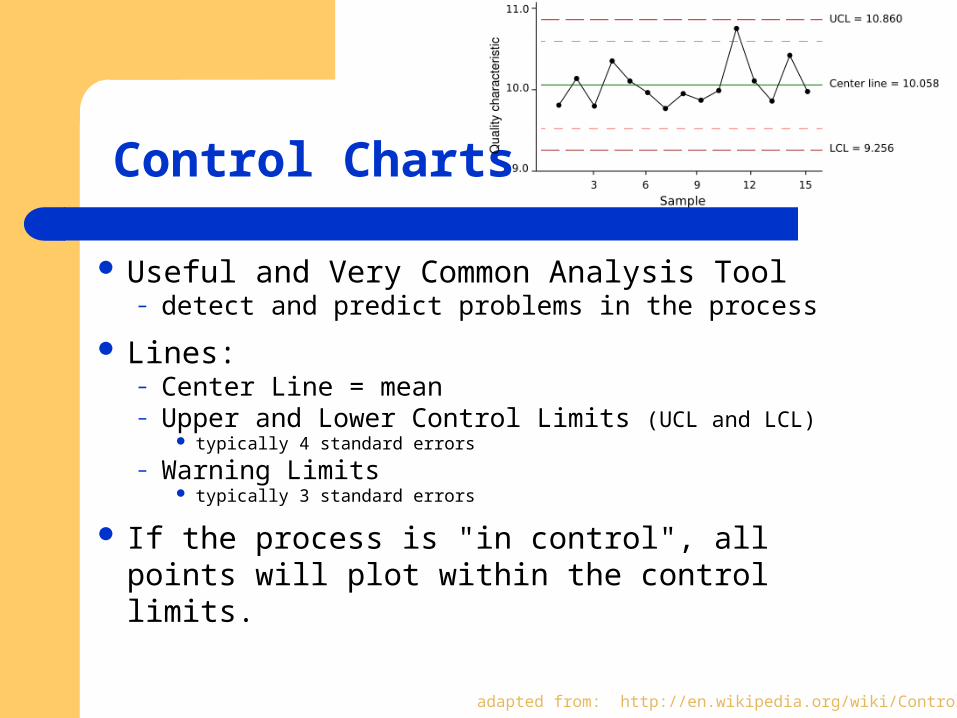
Control Charts
Useful and Very Common Analysis Tool– detect and predict problems in the process
Lines:– Center Line = mean– Upper and Lower Control Limits (UCL and LCL)
typically 4 standard errors
– Warning Limits typically 3 standard errors
If the process is "in control", all points will plot within the control limits.
adapted from: http://en.wikipedia.org/wiki/Control_chart
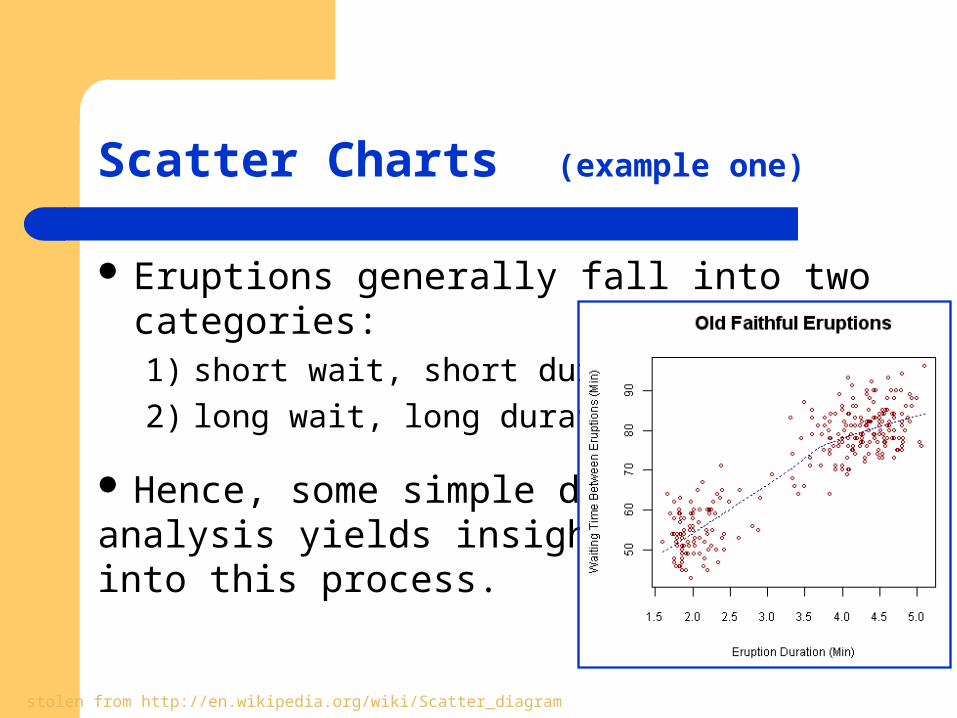
Scatter Charts (example one)
Eruptions generally fall into two categories:1) short wait, short duration
2) long wait, long duration
Hence, some simple dataanalysis yields insights into this process.
stolen from http://en.wikipedia.org/wiki/Scatter_diagram
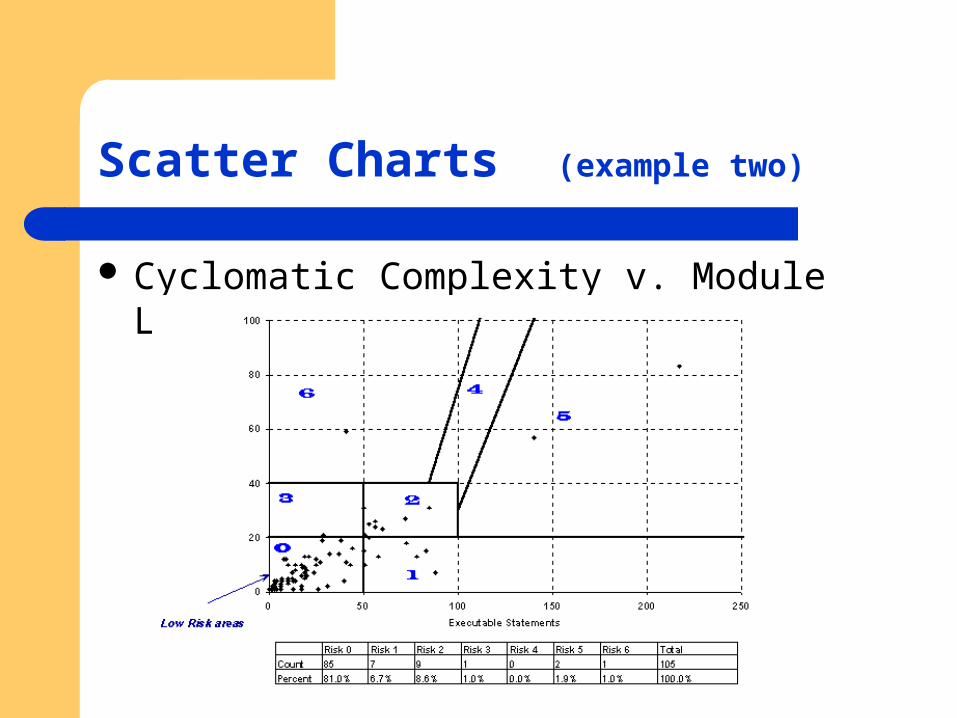
Scatter Charts (example two)
Cyclomatic Complexity v. Module Length
CAPA Outcome : Improved Methods
updating processes updating relevant work procedures changing tools improvement of reporting methods
report contents report frequency
changes in training probably, several of the above
And, of course, the obvious question
Why bother with CAPA?