Embed Size (px)
Citation preview
Evapotranspiration modules for crop growth simulation
Implementation of the algorithms from Penman, Makkink and Priestley-Taylor
PRODUCTION ECOLOGY
• a·b-dlo
Quantitative Approaches in Systems Analysis
The Quantitative Approaches in Systems Analysis series provides a platform for publication and
documentation of simulation models, optimization programs, Geographic Information Systems
(GIS), expert systems, data bases, and utilities for the quantitative analysis of agricultural and
environmental systems. The series enables staff members, students and visitors of AB-DLO and PE to publish, beyond the constraints of refereed journal articles, updates of models, extensive data
sets used for validation and background material to journal articles. The QASA series thus primarily serves to support peer reviewed articles published elsewhere. The inclusion of listings of programs
in an appendix is encouraged.
All manuscript are reviewed by an editorial board comprising one AB-DLO and one PE staff member. The editorial board may consult external reviewers. The review process includes
assessing the following: relevance of the topic to the series, overall scientific soundness, clear structure and presentation, and completeness of the presented material(s). The editorial board evaluates manuscripts on language and lay-out matters in a general sense. However, the sole
responsibility for the contents of the reports, the use of correct language and lay-out rests with the
authors. Manuscripts or suggestions should be submitted to the editorial board. Reports of the
series are available on request.
Quantitative Approaches in Systems Analysis are issued by the DLO Research Institute for Agrobiology and Soil Fertility (AB-DLO) and The C.T. de Wit Graduate School for Production
Ecology (PE).
AB-DLO, with locations in Wageningen and Haren, carries out research into plant physiology, soil science and agro-ecology with the aim of improving the quality of soils and agricultural produce and
of furthering sustainable production systems. The 'Production Ecology• Graduate School explores options for crop production systems associated
with sustainable land use and natural resource management; its activities comprise research on crop production and protection, soil management, and cropping and farming systems.
Address for ordering copies of volumes in the series:
Secretariat
TPE-WAU
Bornsesteeg 4 7
NL-6708 PD Wageningen
Phone: (+) 31 317.482141 Fax: (+) 31 317.484892 E-mail: [email protected]
Addresses of editorial board (for submitting manuscripts):
H.F.M. ten Berge M.K. van lttersum
AB-DLO TPE-WAU
P.O. Box 14 Bornsesteeg 47
NL-6700 AA Wageningen NL-6708 PD Wageningen
Phone: (+) 31 317.475951 Phone: (+) 31 317.482382
Fax: (+) 31 317.423110 Fax: (+) 31 317.484892
E-mail: [email protected] E-mail: [email protected]
Quantitative Approaches
in Systems Analysis No. 11
March 1997
Evapotranspiration modules for crop growth simulation
Implementation of the algorithms from Penman, Makkink and Priestley-Taylor
D.W.G. van Kraalingen & W. Stol
CIP-DATA KONINKLIJKE BIBLIOTHEEK, DEN HAAG
Kraalingen, D.W.G. van & W. Stol
Evapotranspiration Modules for Crop Growth Simulation -Penman, Makkink and Priestley-Taylor I D.W.G. van Kraalingen & W. Stol. - Wageningen : DLO Research Institute for Agrobiology and Soil Fertility; Wageningen : The C.T. de Wit Graduate School for Production Ecology. -(Quantitative approaches in systems analysis; no. 11) ISBN 90-73384-54-0 NUGI835
Subject headings: FORTRAN I transpiration I evaporation I Penman I Makkink I Priestley-Taylor I crop growth; simulation models I agro-ecology
Keywords transpiration, evaporation, Penman, Makkink, Priestley-Taylor, crop growth; simulation models, agro-ecology
Guidelines •Quantitative Approaches in Systems Analysis•
Manuscripts or suggestions should be submitted to the editorial board (H.F.M. ten Berge, AB-DLO, or M.K. van lttersum, TPE-WAU). The final version of the manuscripts should be delivered to the editors camera-ready for reproduction. The submission letter should indicate the scope and aim of the manuscript (e.g. to support scientific publications in journals, program manual, educational purposes). The costs of printing and mailing are borne by the authors.
The English language is preferred. Authors are responsible for correct language and lay-out. Overall guidelines for the format of the texts, figures and graphs can be obtained from the publication editor at AB-DLO, or from the PE office:
H. Terburg
AB-DLO
P.O. Box 14
NL-6700 AA Wageningen
Phone: (+) 31 317.475723
Fax: (+) 31 317.423110
E-mail: [email protected]
Th.H. Jetten
Secretariat C.T. de Wit Graduate School
for Production Ecology
Lawickse Allee 13
NL-6701 AN Wageningen
Phone: (+) 31 317.485116
Fax: (+) 31 317.484855
E-mail: theo.jetten@ beleid.spp. wau.nl
Table of Contents page
List of Symbols 1. Objective and summary 1 2. Scientific descriptions 3
2.1. Penman method 3 2.1.1. Energy balance principle 3 2.1.2. Net Radiation Rn 5 2.1.3. Wind function f(u) 9 2.1.4. Effects of linearization of the Penman equation 10
2.2. Priestley-Taylor method 12 2.2.1. Theory 12 2.2.2. Comparison of Penman vs. Priestley-Taylor for different locations 13
2.3. Makkink method 15 2.3.1. Theory 15 2.3.2. Comparison of Penman vs. Makkink for different locations 16
3. User guide 19 3.1. Availability of the described modules 19 3.2. Module SETPMD (Penman evapotranspiration) 19
3.2.1. Purpose 19 3.2.2. Usage 19 3.2.3. Input I Output 20 3.2.4. Optional switches 20 3.2.5. Example program 21 3.2.6. Other modules needed 22 3.2. 7. Control of errors and warnings
3.3. Module SETPTD (Priestley-Taylor evapotranspiration) 3.3.1. Purpose 3.3.2. Usage 3.3.3. Input I Output 3.3.4. Optional switches 3.3.5. Example program 3.3.6. Other modules needed 3.3. 7. Control of errors and warnings
3.4. Module SETMKD (Makkink evapotranspiration) 3.4.1. Purpose 3.4.2. Usage 3.4.3. Input I Output 3.4.4. Optional switches 3.4.5. Example program 3.4.6. Other modules needed 3.4. 7. Control of errors and warnings
References Appendix 1: Appendix II: Appendix Ill: Appendix IV:
Module SETPMD (Penman) Module SETPTD (Priestley-Taylor) Module SETMKD (Makkink) Additional modules SASTRO, SVPS1
22 23 23 23 24 24 24 24 25 25 25 25 25 25 26 26 26 27
5 pp. 2 pp. 2 pp. 3 pp.

List of Symbols
Symbol Abbreviation Meaning Unit
a RF Reflection coefficient of the surface(= albedo)
a DATMTR Daily average atmospheric transmission coefficient
A a ANGA A coefficient of Angstrom formula
Ab ANGB B coefficient of Angstrom formula
Be Coefficient of Brunt formula
Bd Coefficient of Brunt formula
CMK MAKFAC Makkink correction coefficient
Cpr PTFAC Priestley-Taylor correction coefficient
d Displacement height m E Rate of evaporation mm d-1
8 Emissivity coefficient
e2 VP Vapour pressure at 2 m above the surface kPa
Ea EA Isothermal evaporation mm d-1
EMK Makkink evapotranspiration mm d-1
EpM Penman evapotranspiration mm d-1
Epr Priestley-Taylor evapotranspiration mm d-1
e8
(T) VPS Saturated vapour pressure at temperature T kPa f(u2) FU2 Wind function mm water d-1 kPa-1
G Flux of heat into the ground, soil or water J m-2 d-1
y PSCH Psychrometer constant kPa oc-1
g Conversion factor kg m-3 Pa-1
H Sensible heat flux into the air J m-2 d-1
'A LHVAP Latent heat of evaporation of water J g-1
'AE Latent heat flux into the air J.m-2 d-1
'AEa Isothermal latent heat flux J.m-2 d-1
'AEd Air driven component of 'AE J.m-2 d-1
'AEr Radiation driven component of A.E J.m-2 d-1
n Actual duration of sunshine h d-1
N Maximum duration of sunshine h d-1
p Coefficient of cloudiness factor
r RE Resistance to vapour transfer s m-1
R RGBL Universal gas constant J oc-1 mor1
pep RHOCP Specific heat of air J m-3 oc-1
Rt,down ROLl Downward flux of long-wave radiation from the sky J m-2 d-1
Rt,up ROLO Upward flux of long-wave radiation from the earth J m-2 d-1
Rn RON Net radiation J m-2 d-1
Rn,l Net long-wave radiation J m-2 d-1
Rs ROD Downward flux of short-wave radiation J m-2 d-1
s VPSL Slope of saturated vapour pressure curve kPa oc-1
cr SIGMA Stefan Boltzmann coefficient J m-2 d-1 oK4
T2 TMDA Average air temperature at 2 m above the surface oc
Ts Surface temperature of soil, crop or water oc
u2 WN Wind speed at 2 m above the surface m s-1
VPD VPD Vapour pressure deficit kPa
zo Roughness length m

1
1. Objective and summary
Calculation of evapotranspiration is essential for the estimation of crop water use or for studying the
effect of drought stress on crop performance with simulation models. Several methods are available for calculation of evapotranspiration. This report describes three different methods: the Penman
method (1948) and the approaches of Makkink (1957) and Priestley-Taylor (1972). The modules described in this report are developed for use in general crop growth models for water-limited
conditions, such as in Van Laar eta/. (1992). The application of the modules, however, is not limited
to the SUCROS type models.
The Penman method is important for the general understanding of evapotranspiration from surfaces
both in more advanced models (such as greenhouse models) and in more simple approaches. When
considered over longer periods of time(> 10 days), the Penman method calculates crop water loss with a reasonable degree of accuracy. It can be considered the best among the simple approaches. All three methods have in common that they estimate evapotranspiration of short, well-watered crops, however, they differ in their data requirements. Makkink and Priestley-Taylor require fewer meteorological observations because they are based on the observation that in many climates, the radiation-driven part of evapotranspiration is much more important than the part driven by vapour
pressure deficit and wind speed. In the Priestley-Taylor equation, evapotranspiration is proportional
to net radiation, while Makkink evapotranspiration is proportional to short-wave radiation. The Penman method requires daily values of radiation, temperature, vapour pressure and wind speed. The Makkink and Priestley-Taylor equations require only radiation and temperature.
The Priestley-Taylor equation is used world-wide, e.g. in the IBSNAT network, but regional calibration can be necessary since it is based on the assumption that a constant relation exists between the evaporative demand by radiation and by wind. The same holds for the Makkink equation which is calibrated for use during the growing season in The Netherlands. In The
Netherlands, Makkink and Priestley-Taylor should be used only during the growing season. An important finding is that the Makkink and Priestley-Tailor methods are valid for a larger part of the year in areas closer to the equator. This more or less justifies the use of these simple methods in agro-ecological zonation studies in these areas.
The Penman formula calculates evapotranspiration by assuming that the surface temperature is not very different from the air temperature. Under normal circumstances this is indeed the case, but under extreme conditions surface temperatures can differ much from air temperatures, resulting in
unwanted errors. To avoid this situation, the Penman module, as described here, can iteratively search for the equilibrium surface temperature and give an improved estimate of surface water loss.

2. Scientific descriptions
2.1. Penman method
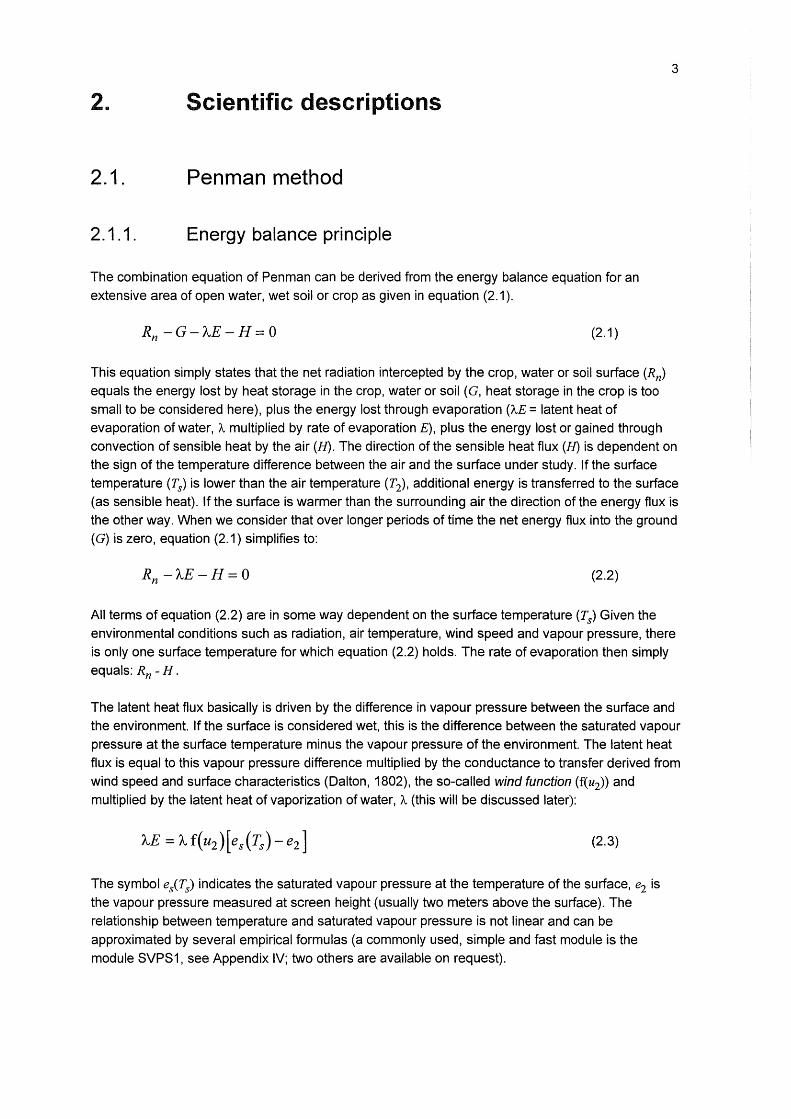
2.1.1. Energy balance principle
The combination equation of Penman can be derived from the energy balance equation for an
extensive area of open water, wet soil or crop as given in equation (2.1 ).
R -G-A.E-H=O n (2.1)
3
This equation simply states that the net radiation intercepted by the crop, water or soil surface (Rn) equals the energy lost by heat storage in the crop, water or soil ( G, heat storage in the crop is too
small to be considered here), plus the energy lost through evaporation ('AE = latent heat of
evaporation of water, 'A multiplied by rate of evaporation E), plus the energy lost or gained through
convection of sensible heat by the air (H). The direction of the sensible heat flux (H) is dependent on
the sign of the temperature difference between the air and the surface under study. If the surface
temperature (T8 } is lower than the air temperature (T2), additional energy is transferred to the surface
(as sensible heat). If the surface is warmer than the surrounding air the direction of the energy flux is
the other way. When we consider that over longer periods of time the net energy flux into the ground
(G) is zero, equation (2.1) simplifies to:
R -'AE-H=O n (2.2)
All terms of equation (2.2) are in some way dependent on the surface temperature (T8
} Given the
environmental conditions such as radiation, air temperature, wind speed and vapour pressure, there
is only one surface temperature for which equation (2.2) holds. The rate of evaporation then simply
equals: Rn - H.
The latent heat flux basically is driven by the difference in vapour pressure between the surface and
the environment. If the surface is considered wet, this is the difference between the saturated vapour
pressure at the surface temperature minus the vapour pressure of the environment. The latent heat
flux is equal to this vapour pressure difference multiplied by the conductance to transfer derived from
wind speed and surface characteristics (Dalton, 1802), the so-called wind function (f(u2)) and
multiplied by the latent heat of vaporization of water, 'A (this will be discussed later):
(2.3)
The symbol es(T8 ) indicates the saturated vapour pressure at the temperature of the surface, e2 is
the vapour pressure measured at screen height (usually two meters above the surface). The
relationship between temperature and saturated vapour pressure is not linear and can be
approximated by several empirical formulas (a commonly used, simple and fast module is the
module SVPS1, see Appendix IV; two others are available on request).
4
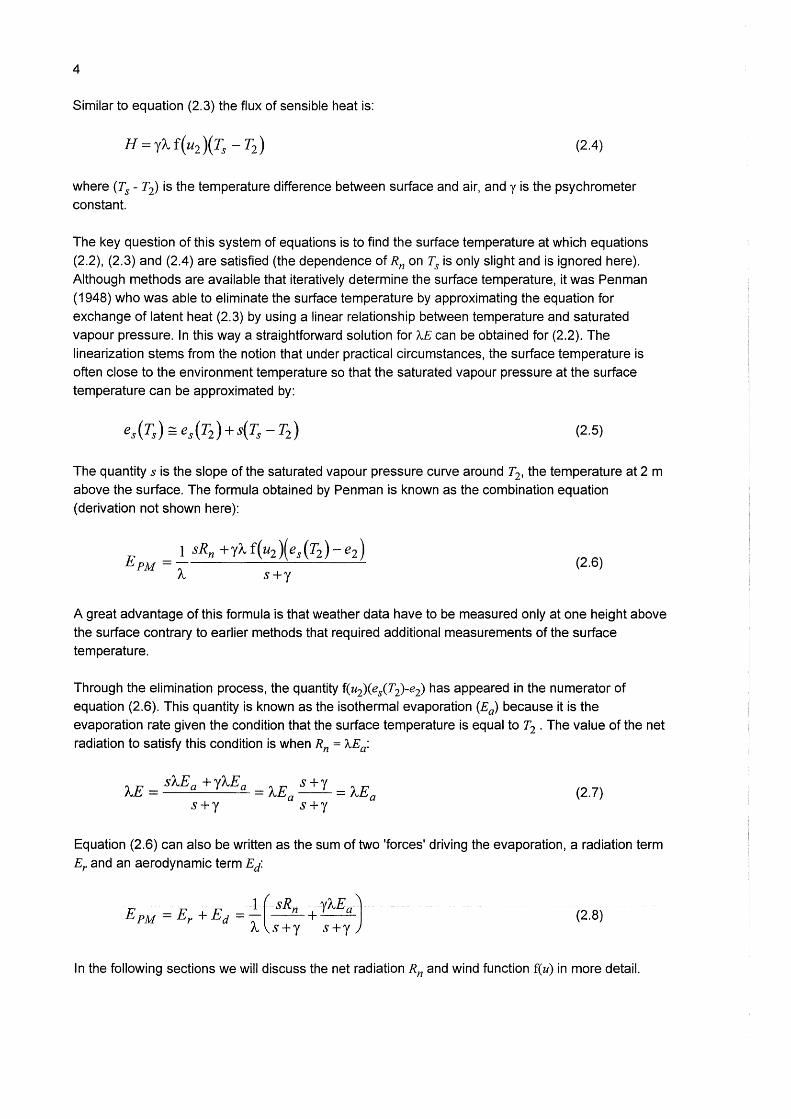
Similar to equation (2.3) the flux of sensible heat is:
(2.4)
where (Ts- T2) is the temperature difference between surface and air, andy is the psychrometer constant.
The key question of this system of equations is to find the surface temperature at which equations
(2.2), (2.3) and (2.4) are satisfied (the dependence of Rn on Ts is only slight and is ignored here).
Although methods are available that iteratively determine the surface temperature, it was Penman
(1948) who was able to eliminate the surface temperature by approximating the equation for
exchange of latent heat (2.3) by using a linear relationship between temperature and saturated
vapour pressure. In this way a straightforward solution for A.E can be obtained for (2.2). The
linearization stems from the notion that under practical circumstances, the surface temperature is
often close to the environment temperature so that the saturated vapour pressure at the surface
temperature can be approximated by:
e s ( ~) = e s ( T2 ) + s( ~ - T2 ) (2.5)
The quantity s is the slope of the saturated vapour pressure curve around T2, the temperature at 2 m
above the surface. The formula obtained by Penman is known as the combination equation
(derivation not shown here):
(2.6)
A great advantage of this formula is that weather data have to be measured only at one height above
the surface contrary to earlier methods that required additional measurements of the surface
temperature.
Through the elimination process, the quantity f(u2)(esCT2)-e2) has appeared in the numerator of
equation (2.6). This quantity is known as the isothermal evaporation (Ea) because it is the
evaporation rate given the condition that the surface temperature is equal to T2 . The value of the net
radiation to satisfy this condition is when Rn = A.Ea:
A.E = sA.Ea +y'AEa = A.E s +y = A.E a a s+y s+y
(2.7)
Equation (2.6) can also be written as the sum of two 'forces' driving the evaporation, a radiation term
Er and an aerodynamic term Ei
E - E E - 1 ( sRn yA.E a) PM- r + d -- --+--A s+y s+y
(2.8)
In the following sections we will discuss the net radiation Rn and wind function f(u) in more detail.
5
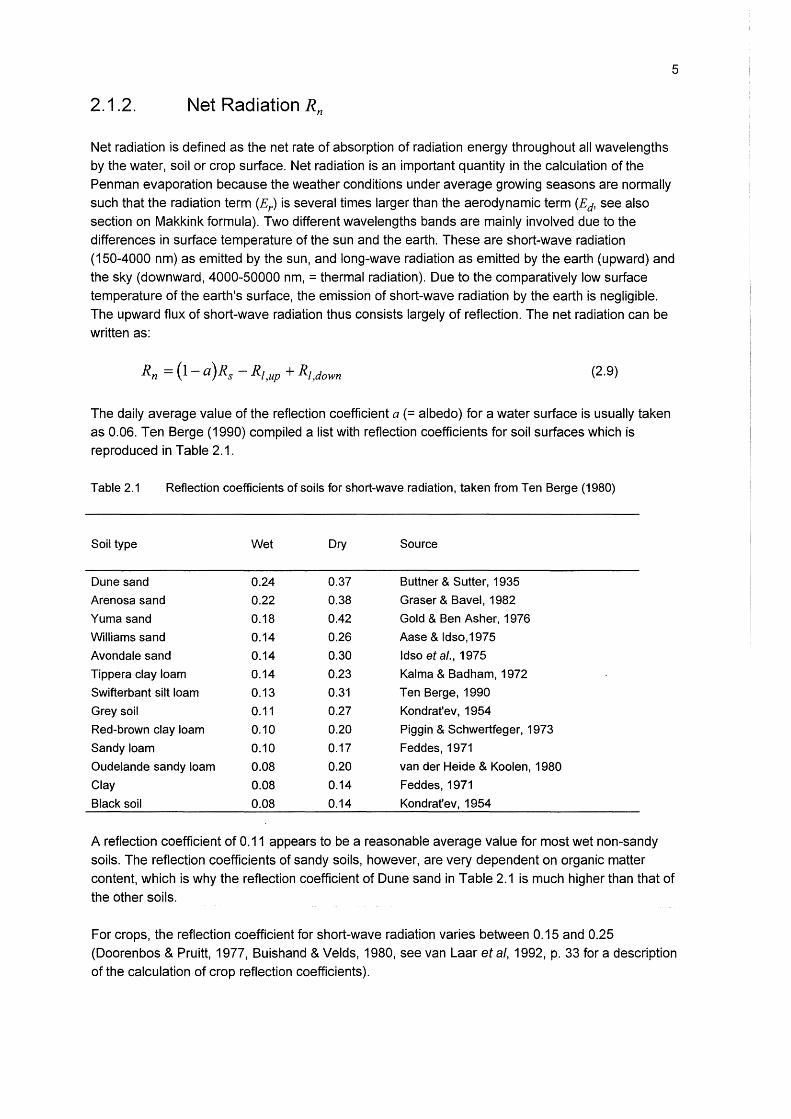
2.1.2. Net Radiation Rn
Net radiation is defined as the net rate of absorption of radiation energy throughout all wavelengths
by the water, soil or crop surface. Net radiation is an important quantity in the calculation of the
Penman evaporation because the weather conditions under average growing seasons are normally
such that the radiation term (Er) is several times larger than the aerodynamic term (Ed, see also
section on Makkink formula). Two different wavelengths bands are mainly involved due to the
differences in surface temperature of the sun and the earth. These are short-wave radiation
(150-4000 nm) as emitted by the sun, and long-wave radiation as emitted by the earth (upward) and
the sky (downward, 4000-50000 nm, =thermal radiation). Due to the comparatively low surface
temperature of the earth's surface, the emission of short-wave radiation by the earth is negligible.
The upward flux of short-wave radiation thus consists largely of reflection. The net radiation can be
written as:
Rn = (1- a )Rs - Rt,up + Rt,down (2.9)
The daily average value of the reflection coefficient a (= albedo) for a water surface is usually taken
as 0.06. Ten Berge (1990) compiled a list with reflection coefficients for soil surfaces which is
reproduced in Table 2.1.
Table 2.1 Reflection coefficients of soils for short-wave radiation, taken from Ten Berge (1980)
Soil type Wet Dry Source
Dune sand 0.24 0.37 Buttner & Sutter, 1935
Arenosa sand 0.22 0.38 Graser & Savel, 1982
Yuma sand 0.18 0.42 Gold & Ben Asher, 1976
Williams sand 0.14 0.26 Aase & ldso,1975
Avondale sand 0.14 0.30 ldso eta/., 1975
Tippera clay loam 0.14 0.23 Kalma & Badham, 1972
Swifterbant silt loam 0.13 0.31 Ten Berge, 1990
Grey soil 0.11 0.27 Kondrat'ev, 1954
Red-brown clay loam 0.10 0.20 Piggin & Schwertfeger, 1973
Sandy loam 0.10 0.17 Feddes, 1971
Oudelande sandy loam 0.08 0.20 van der Heide & Koolen, 1980
Clay 0.08 0.14 Feddes, 1971
Black soil 0.08 0.14 Kondrat'ev, 1954
A reflection coefficient of 0.11 appears to be a reasonable average value for most wet non-sandy
soils. The reflection coefficients of sandy soils, however, are very dependent on organic matter
content, which is why the reflection coefficient of Dune sand in Table 2.1 is much higher than that of
the other soils.
For crops, the reflection coefficient for short-wave radiation varies between 0.15 and 0.25
(Doorenbos & Pruitt, 1977, Buishand & Velds, 1980, see van Laar eta/, 1992, p. 33 for a description
of the calculation of crop reflection coefficients).
6
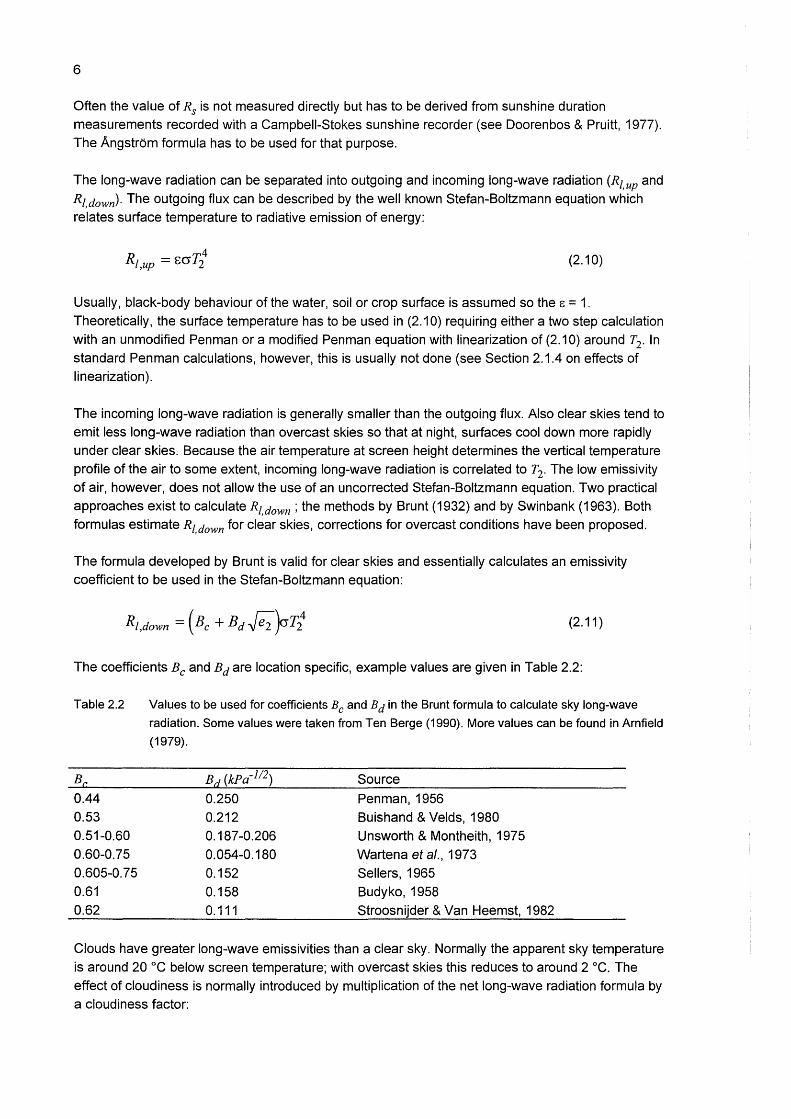
Often the value of Rs is not measured directly but has to be derived from sunshine duration measurements recorded with a Campbell-Stokes sunshine recorder (see Doorenbos & Pruitt, 1977). The Angstrom formula has to be used for that purpose.
The long-wave radiation can be separated into outgoing and incoming long-wave radiation (Rt,up and
Rt,down). The outgoing flux can be described by the well known Stefan-Boltzmann equation which relates surface temperature to radiative emission of energy:
4 Rt,up = f.crJ2 (2.10)
Usually, black-body behaviour of the water, soil or crop surface is assumed so the c: = 1.
Theoretically, the surface temperature has to be used in (2.1 0) requiring either a two step calculation with an unmodified Penman or a modified Penman equation with linearization of (2.1 0) around T2 . In
standard Penman calculations, however, this is usually not done (see Section 2.1.4 on effects of linearization).
The incoming long-wave radiation is generally smaller than the outgoing flux. Also clear skies tend to emit less long-wave radiation than overcast skies so that at night, surfaces cool down more rapidly under clear skies. Because the air temperature at screen height determines the vertical temperature profile of the air to some extent, incoming long-wave radiation is correlated to T2. The low emissivity of air, however, does not allow the use of an uncorrected Stefan-Boltzmann equation. Two practical
approaches exist to calculate Rl,down; the methods by Brunt (1932) and by Swinbank (1963). Both
formulas estimate Rl,down for clear skies, corrections for overcast conditions have been proposed.
The formula developed by Brunt is valid for clear skies and essentially calculates an emissivity coefficient to be used in the Stefan-Boltzmann equation:
(2.11)
The coefficients Be and Bd are location specific, example values are given in Table 2.2:
Table 2.2
Be 0.44 0.53
0.51-0.60
0.60-0.75
0.605-0.75 0.61
0.62
Values to be used for coefficients Be and Bd in the Brunt formula to calculate sky long-wave
radiation. Some values were taken from Ten Berge (1990). More values can be found in Arnfield
(1979).
Bd (kPa-112) Source
0.250 Penman, 1956
0.212 Buishand & Velds, 1980
0.187-0.206 Unsworth & Montheith, 1975
0.054-0.180 Wartena et a/., 1973
0.152 Sellers, 1965
0.158 Budyko, 1958
0.111 Stroosnijder & Van Heemst, 1982
Clouds have greater long-wave emissivities than a clear sky. Normally the apparent sky temperature is around 20 oc below screen temperature; with overcast skies this reduces to around 2 °C. The
effect of cloudiness is normally introduced by multiplication of the net long-wave radiation formula by a cloudiness factor:
p = 0.2 (KNMI, in Buishands & Velds, 1980)
p = 0.1 (Penman, 1956)
(2.12)
As has been pointed out by De Bruin (1979), (2.12) is physically not correct as the effect of
cloudiness should apply to Rt,down only. Nevertheless, (2.12) gives satisfactory results.
7
Another approach to find Rt,down is followed in the formula derived by Swinbank (1963). Swinbank
concluded that Rt,down could be related very accurately to temperature only without the need to
derive location-specific regression coefficients. This formula was found to give a good fit between
measured and computed values of Rt,down across different latitudes (Swinbank, 1963; Arnfield,
1979). Both the Brunt and the Swinbank method can optionally be used in the Penman subprogram.
The most useful form of the Swinbank formula is:
(2.13)
(Note that the screen temperature is raised to the power six instead of four). Holtslag & Van Ulden
(1983) modified this formula to include the effect of cloudiness derived for higher latitudes by
Paltridge & Platt (1976):
-8 6 6( n) Rz,down = 4.59 ·10 12 + 5.184 ·10 1- N (2.14)
The numerical behavior of this formula was found to be unsatisfactory, because the net long-wave
radiation calculated from (2.1 0) and (2.13) can switch from a net upward flux of energy to a net
downward flux under cloudy conditions and high screen temperatures. This is physically possible (if
the soil is colder than the cloud base), but cannot be detected with this formula. We have adopted a
different approach to include cloudiness, which gives a very good correlation with the Brunt formula
and does not suffer from the deficiency of (2.14)
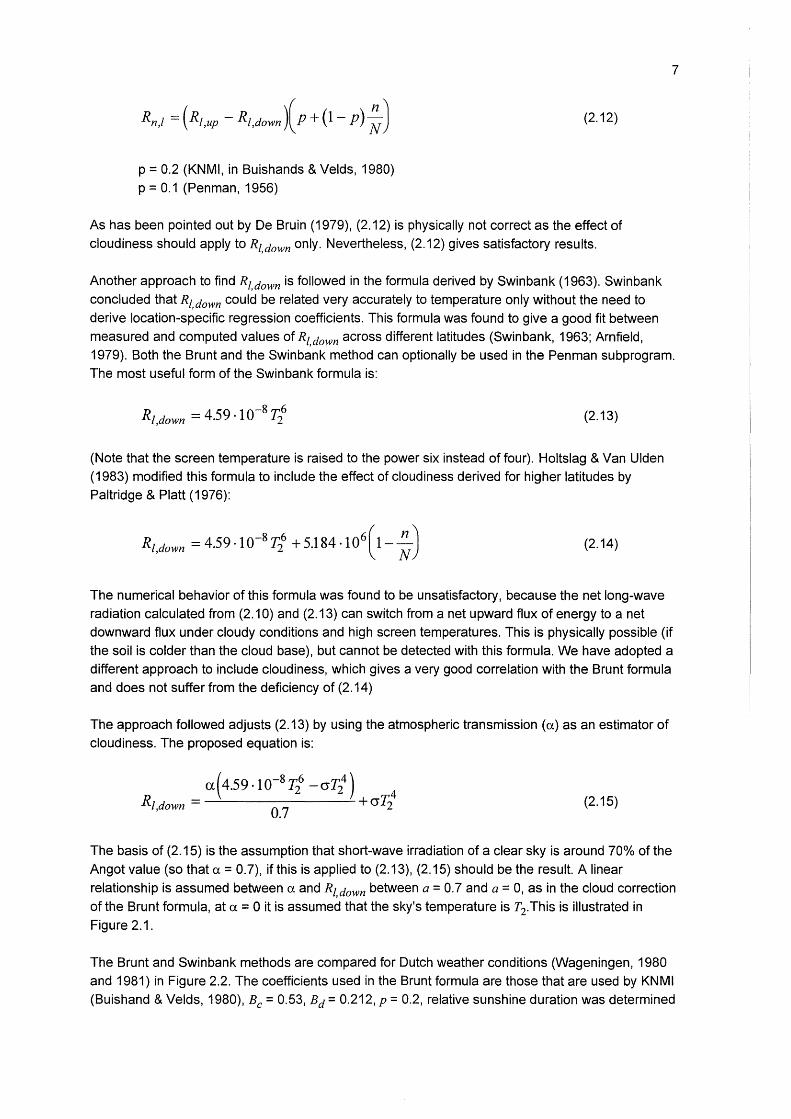
The approach followed adjusts (2.13) by using the atmospheric transmission (a) as an estimator of
cloudiness. The proposed equation is:
(2.15)
The basis of (2.15) is the assumption that short-wave irradiation of a clear sky is around 70% of the
Angot value (so that a = 0. 7), if this is applied to (2.13), (2.15) should be the result. A linear
relationship is assumed between a and Rt,down between a= 0.7 and a= 0, as in the cloud correction
of the Brunt formula, at a= 0 it is assumed that the sky's temperature is T2.This is illustrated in
Figure 2.1.
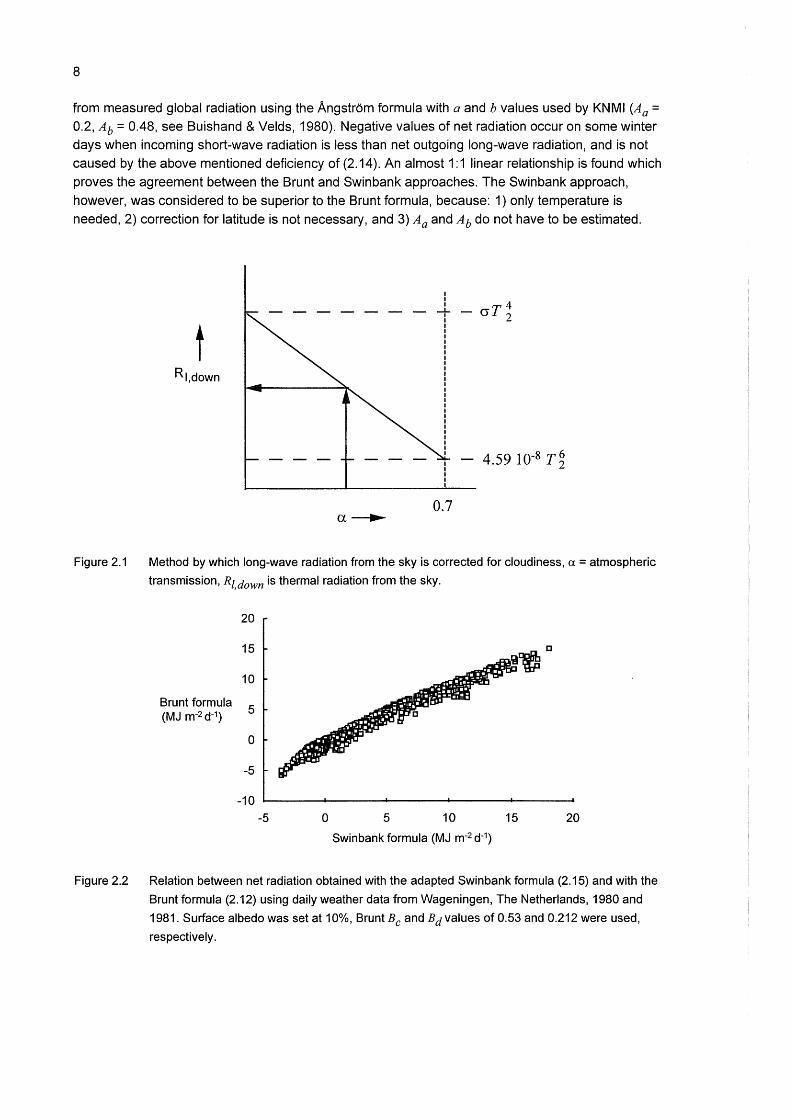
The Brunt and Swinbank methods are compared for Dutch weather conditions (Wageningen, 1980
and 1981) in Figure 2.2. The coefficients used in the Brunt formula are those that are used by KNMI
(Buishand & Velds, 1980), Be= 0.53, Bd = 0.212, p = 0.2, relative sunshine duration was determined
8
from measured global radiation using the Angstrom formula with a and b values used by KNMI (Aa = 0.2, Ab = 0.48, see Buishand & Velds, 1980). Negative values of net radiation occur on some winter days when incoming short-wave radiation is less than net outgoing long-wave radiation, and is not caused by the above mentioned deficiency of (2.14). An almost 1:1 linear relationship is found which
proves the agreement between the Brunt and Swinbank approaches. The Swinbank approach, however, was considered to be superior to the Brunt formula, because: 1) only temperature is
needed, 2) correction for latitude is not necessary, and 3) Aa and Ab do not have to be estimated.
t Rl,down
0.7
- aT 4 2
- 4.59 to-8 r ~
Figure 2.1 Method by which long-wave radiation from the sky is corrected for cloudiness, a = atmospheric
transmission, Rt,down is thermal radiation from the sky.
20
15
10
Brunt formula 5 (MJ m-2d-1)
0
-5
-10
-5 0 5 10 15 20
Swinbank formula (MJ m-2 d-1)
Figure 2.2 Relation between net radiation obtained with the adapted Swinbank formula (2.15) and with the
Brunt formula (2.12) using daily weather data from Wageningen, The Netherlands, 1980 and
1981. Surface albedo was set at 10%, Brunt Be and Bd values of 0.53 and 0.212 were used,
respectively.
9
2.1.3. Wind function f(u)
The wind function is the name of a formula that estimates conductance to transfer of latent (2.3) and sensible heat (2.4) from the surface to the reference height. In the Penman method most often
empirical wind functions are used that are implicitly parameterized for effects of roughness of the surface and atmospheric stability. Wind functions that are physically more sound are also available but will not be treated in detail here.
The wind function that is mostly used for open water and soil surfaces is (Penman, 1956):
f( u2 ) = 2.63( 0.5 + 0.54u2 ) (2.16)
This formula has been modified to conform to the units of this report which explains the difference with the expressions for open water found normally in the literature (e.g. Withers & Vipond, 1974). The units of (2.16) are: f(u2) in mm (water) d-1 kPa-1 and u2 in m s-1 (2.63 is a unit conversion factor).
The wind function that is mostly used for short grass crops with a closed canopy is:
f( u2 ) = 2.63( 1 + 0.54u2 ) (2.17)
Note: Doorenbos & Pruitt (1977) derived a wind function from experimental data that differs
somewhat from (2.17). This is caused to a considerable extent by the way components of the Penman formula are calculated (Doorenbos & Pruitt, 1977).
The larger value of the wind function for crops (the intercept is larger, 1 for crops vs. 0.5 for open
water) is due to the greater surface roughness of crop canopies compared to open water. Tall, fully closed crops even show greater aerodynamic roughnesses and, consequently, greater
conductances to transfer of vapour and heat. At equal net radiation values, tall crops therefore tend to transpire more than short crops. Another important point to note is that the linear shape of these
wind functions is actually a fit of a linear function on a limited set of measurements which follow a curvilinear path (e.g. Penman, 1948). Under truly isothermal conditions, the function should go
through the origin because still air cannot transfer heat and vapour. Often, however, it is doubtful if isothermal conditions existed and the intercept is partly caused by buoyancy effects at low wind
speeds. This is the reason that the wind functions (2.16) and (2.17) are not very accurate at wind speeds close to zero under isothermal conditions.
Errors in the wind function, however, do not infltJence evaporation very much because under normal conditions in a growing season, the radiation term is much greater than the aerodynamic term, which
means that errors in the estimation of the wind function will have less effect than inaccuracies in the net radiation. This is not necessarily true for tall crops, however.
For crops taller than grass several formulas have been proposed including that of Thorn & Oliver (1977):
( ) _136(1 + 0.54u2)
f u2 - 2 -d ln2-
zo
(2.18)
10
where d and zo are displacement height and roughness length of the logarithmic wind profile (estimated with d = 0.7 land z0 = 0.1 !, l being the height of the crop in meters). It can be shown that this formula gives roughly the same relationship as (2.17) when the height of the crop is set at 0.02
m.
2.1.4. Effects of linearization of the Penman equation
The linearization of the relation between the saturated vapour pressure and temperature that was the basis for the derivation of the Penman formula introduces errors in the calculation of A.E when the
equilibrium surface temperature differs from T2 . Only when the surface temperature equals r2, the
Penman equation yields an exact solution, given the uncertainties in input data; this situation occurs when Rn = 'AEa. Part of the error can be avoided by a second linearization around T2 namely of
outgoing long-wave radiation instead of a zero-order approach. In (2.10) the outgoing long-wave radiation was approximated by taking the air temperature as representative for the surface temperature. In Figure 2.3 a comparison is made between the standard Penman equation (2.6), with zero-order outgoing long-wave radiation, and an iterative Penman procedure that searches for the
equilibrium temperature.
The temperature of the surface can be calculated from the sensible heat flux and the resistance to transfer of heat from the surface to reference height. This resistance can in turn be derived from the wind function. Therefore, the empirical form of the wind function has to be converted to an equation describing a resistance (with unit s m-1 ). By applying Fick's law of diffusion over a finite distance, the general form of the evaporation equation can be written as:
(
_2
_1
) concentration difference (kg m - 3 )
E kg m s = ( _) r s m 1
(2.19)
If we equate (2.3) and (2.19) and write VPD for the difference in vapour pressure between surface and reference height:
f(u2 )VPD _ p·VPD
86400 r (2.20)
where g is a conversion factor derived from the gas law of Boyle-Gay Lussac to convert VP D (which is a difference of pressure) to a concentration difference:
(k -3 kP -1) 1000·0.018016
g g m a = -R-( T-2
-+ -27-3.-16-) (2.21)
The factors 1000 and 0.018016 are the correction for VPD in kPa and the weight of one mole of water in kg's, respectively. The symbol R is the universal gas constant(= 8.31436 J oc-1 mole-1
). The
resistance r (in s m-1) now becomes:
86400·1000·Q018016 r = --:---:----:-:------~
f(u2) · R · (T2 + 273.16) (2.22)
The loss of latent and sensible heat as given in (2.3) and (2.4) can now be reformulated in:
Latent heat:
Sensible heat:
A.E= g·VPD r
H ~-T2 = pc
r P
VPD·pc often written as A.E = P (2.23)
ry
(2.24)
The temperature difference between surface and screen height can be calculated from (2.24) by
eliminating H from the radiation balance (2.2) and Ts- T2 from (2.24):
T 'T' _ Rn- A.E
-12
-r-.;..:__ __ s 86400pcP
(2.25)
The correct slope to be used in the iterated Penman equation is now:
(2.26)
11
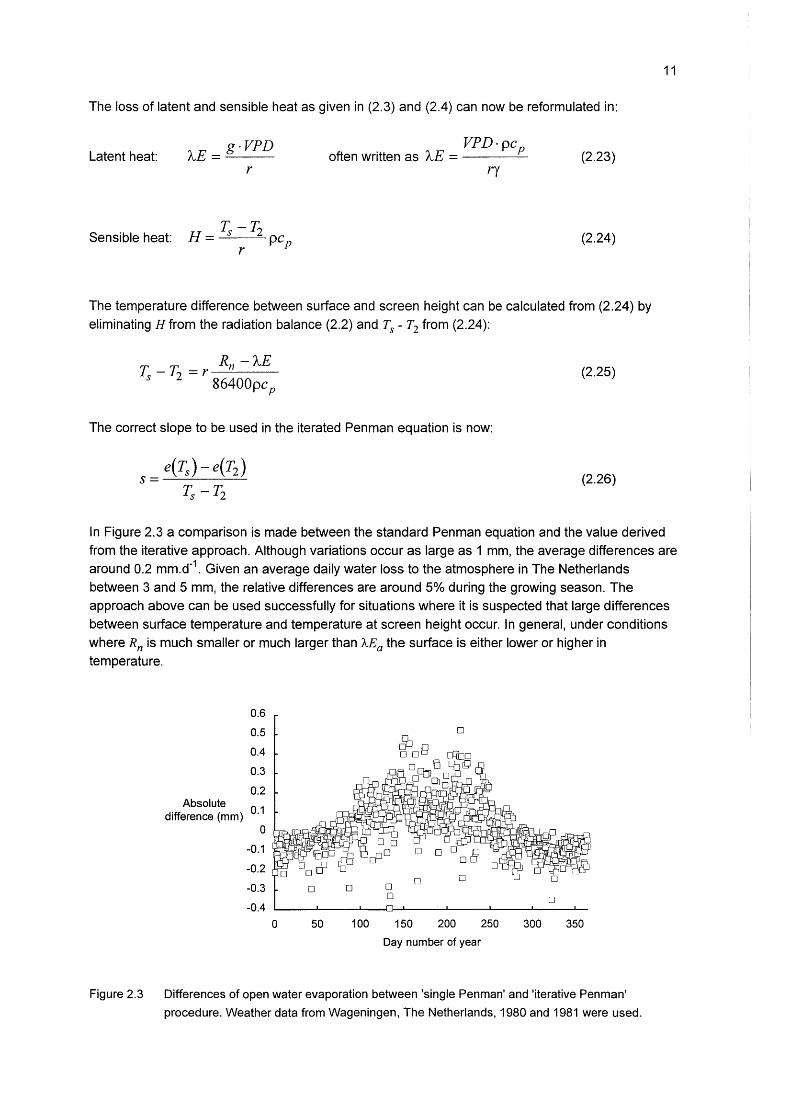
In Figure 2.3 a comparison is made between the standard Penman equation and the value derived
from the iterative approach. Although variations occur as large as 1 mm, the average differences are around 0.2 mm.d-1
. Given an average daily water loss to the atmosphere in The Netherlands between 3 and 5 mm, the relative differences are around 5% during the growing season. The
approach above can be used successfully for situations where it is suspected that large differences between surface temperature and temperature at screen height occur. In general, under conditions where Rn is much smaller or much larger than f..Ea the surface is either lower or higher in temperature.
0.6
0.5
0.4
0.3
0.2 Absolute
0 1 difference (mm) · 0
-0.1
-0.2
-0.3
-0.4
0
0 50
0
100
0 0
150 200
Day number of year
0
250 300 350
Figure 2.3 Differences of open water evaporation between 'single Penman' and 'iterative Penman'
procedure. Weather data from Wageningen, The Netherlands, 1980 and 1981 were used.
12
2.2. Priestley-Taylor method
2.2.1. Theory
The Priestley-Taylor method (Priestley-Taylor, 1972; De Bruin, 1983) is a simplified Penman
method, requiring only radiation and temperature as inputs. This is justified by the observation that evapotranspiration is generally more determined by levels of net radiation than by air dryness and
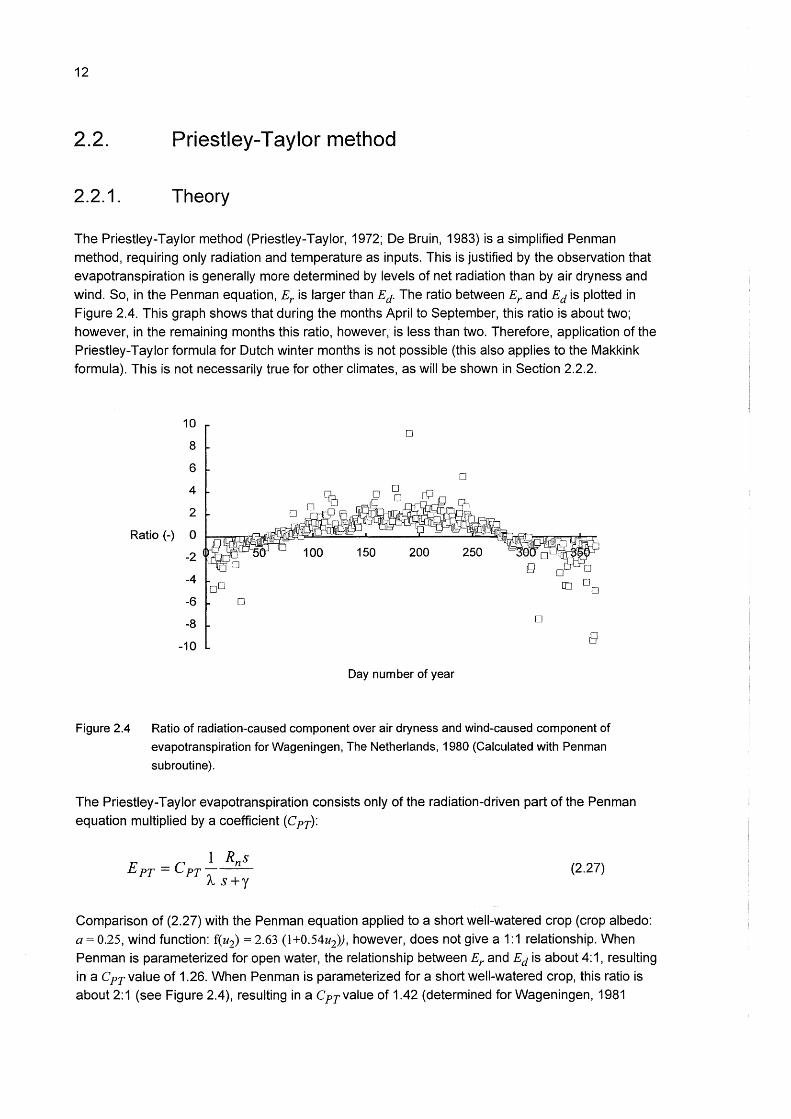
wind. So, in the Penman equation, Er is larger than Ed. The ratio between Er and Ed is plotted in Figure 2.4. This graph shows that during the months April to September, this ratio is about two; however, in the remaining months this ratio, however, is less than two. Therefore, application of the
Priestley-Taylor formula for Dutch winter months is not possible (this also applies to the Makkink formula). This is not necessarily true for other climates, as will be shown in Section 2.2.2.
10
8
6
4
2
Ratio(-) 0
-2
-4
-6
-8 D
-10
Day number of year
Figure 2.4 Ratio of radiation-caused component over air dryness and wind-caused component of
evapotranspiration for Wageningen, The Netherlands, 1980 (Calculated with Penman
subroutine).
The Priestley-Taylor evapotranspiration consists only of the radiation-driven part of the Penman
equation multiplied by a coefficient ( C pr):
(2.27)
Comparison of (2.27) with the Penman equation applied to a short well-watered crop (crop albedo:
a= 0.25, wind function: f(u2) = 2.63 (1 +0.54u2)), however, does not give a 1:1 relationship. When
Penman is parameterized for open water, the relationship between Er and Ed is about 4:1, resulting
in a Cpr value of 1.26. When Penman is parameterized for a short well-watered crop, this ratio is about2:1 (see Figure 2.4), resulting in a Cprvalue of 1.42 (determined forWageningen, 1981
13
weather data between day 91 and 273). The formula that we use in the Priestley-Taylor subprogram
is now:
E PT = 1.42 __!_ Rns 'A s+y
(2.28)
As has been described in the previous chapter, two methods exist to calculate net long-wave radiation, the Brunt and the Swinbank formula. However, the Brunt formula requires vapour pressure
data, cloudiness and average daily air temperature, whereas the Swinbank formula requires only
average daily air temperature and cloudiness. We prefer to use the latter method as the Priestley
Taylor method will normally be used in cases where only a limited amount of weather data are
available.
The Priestley-Taylor formula appears to be purely based on empiricism. De Bruin (1987) however, states that recent research has shown that there is a more fundamental basis for the formula. We
will not discuss this here any further.
2.2.2. Comparison of Penman vs. Priestley-Taylor for different
locations
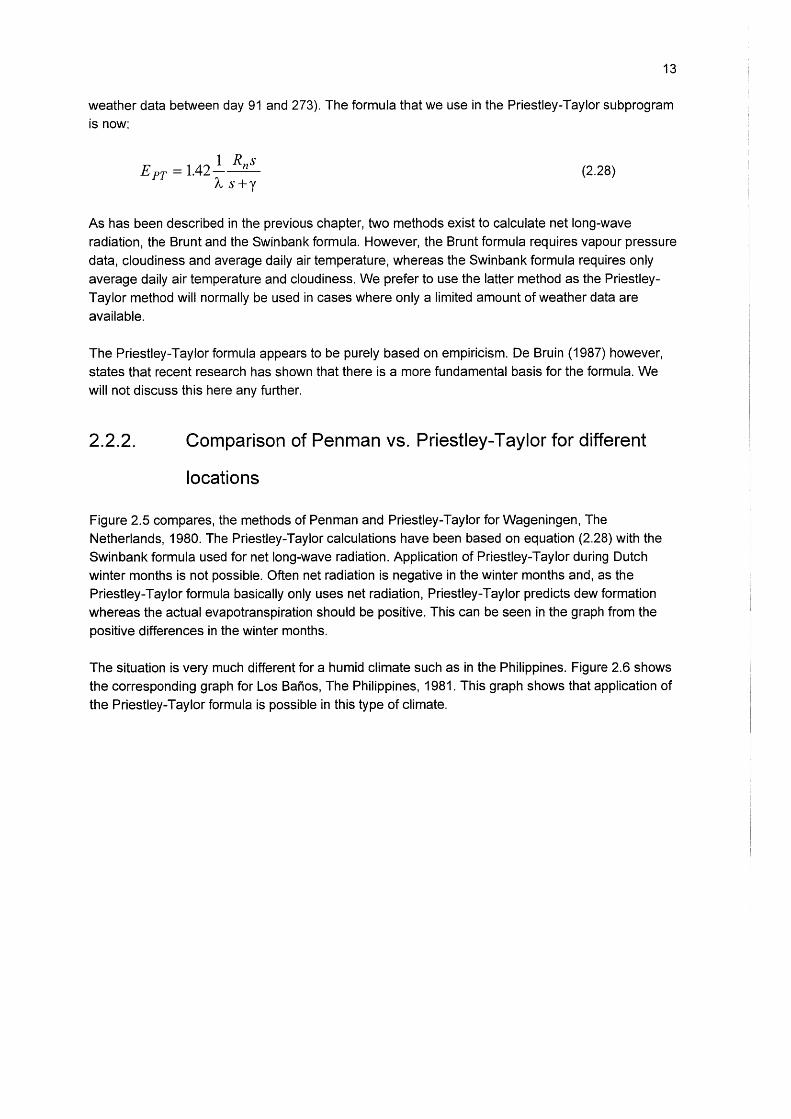
Figure 2.5 compares, the methods of Penman and Priestley-Taylor for Wageningen, The Netherlands, 1980. The Priestley-Taylor calculations have been based on equation (2.28) with the
Swinbank formula used for net long-wave radiation. Application of Priestley-Taylor during Dutch winter months is not possible. Often net radiation is negative in the winter months and, as the
Priestley-Taylor formula basically only uses net radiation, Priestley-Taylor predicts dew formation whereas the actual evapotranspiration should be positive. This can be seen in the graph from the
positive differences in the winter months.
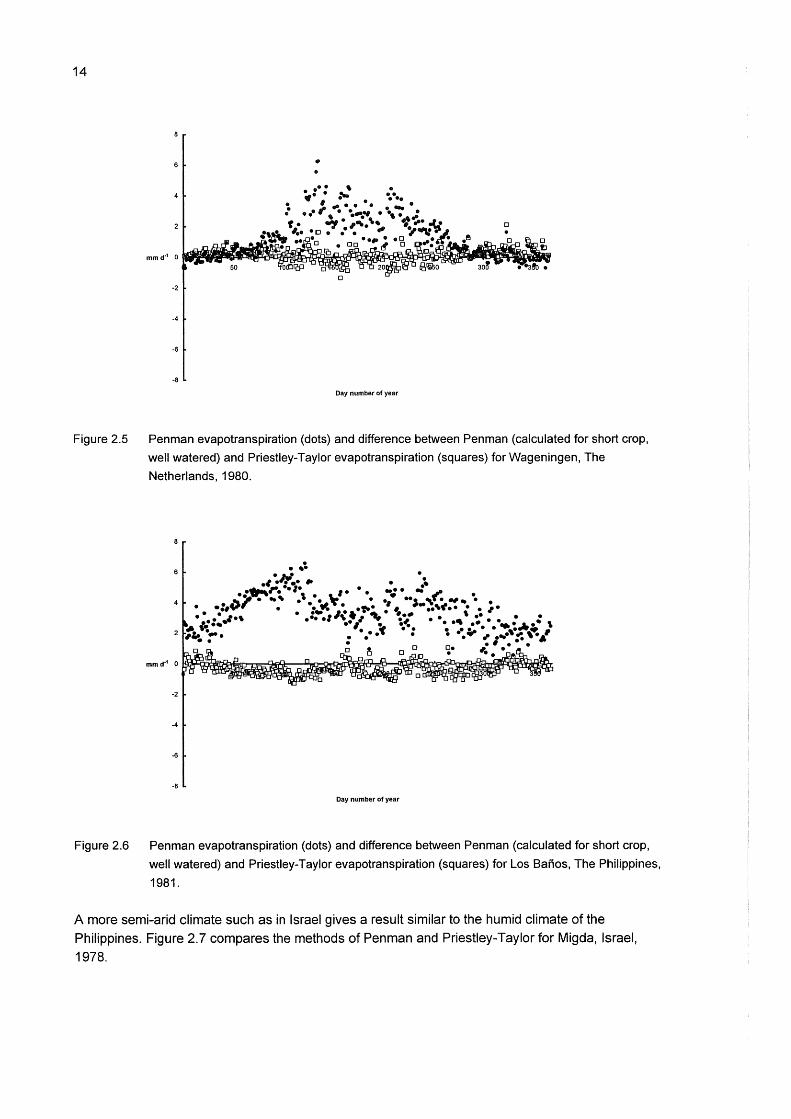
The situation is very much different for a humid climate such as in the Philippines. Figure 2.6 shows the corresponding graph for Los Banos, The Philippines, 1981. This graph shows that application of the Priestley-Taylor formula is possible in this type of climate.
14
Figure 2.5
Figure 2.6
-2
-4
-6
-8
. . •
" • .. . :- .. 0
0
Day number of year
Penman evapotranspiration (dots) and difference between Penman (calculated for short crop,
well watered) and Priestley-Taylor evapotranspiration (squares) for Wageningen, The
Netherlands, 1980.
• ••• . ,·.~~':,. .. ·:. .. *",. ... ,. ,. . . •. . .. .it
_ ... ~ ... , ·'··· ~ .. ,· .. ~ ,~ . ., .. · .. • • ·.:.v' • :."- .. •te• • ._ .. ••'tt• • • • ,. • • • .,.l•t. ••• •I ~, t I .. ••.- • \ •• • • '"""...... .., • \< ............... , - ..-. • ., • • • ".!.a • • ··-· .. 2 ~~ ... • ... • • ....- " ....... ,. ~·---• • • • II • • ..,
0 ~.~
-2
-4
-6
-8
Day number of year
Penman evapotranspiration (dots) and difference between Penman (calculated for short crop,
well watered) and Priestley-Taylor evapotranspiration (squares) for Los Banos, The Philippines,
1981.
A more semi-arid climate such as in Israel gives a result similar to the humid climate of the Philippines. Figure 2.7 compares the methods of Penman and Priestley-Taylor for Migda, Israel,
1978.
.. . . ., . • • •• • ,.. •• ~ ~~ I_
• • ••, ,-,:: L•~ .......;,~!~ .. _;. . . ~ ,~ --~~ ._..... ~ . • ~ • ~ ~. • N.._• • •
•
.... '· .. .,.., . .. . ~-~. . 2 ' 1). ~~ '' • • • ~ I
~ •~":.•• \ •' •o -·~~J~ 8~ D
-2
-4
-6
-8
Day number of year
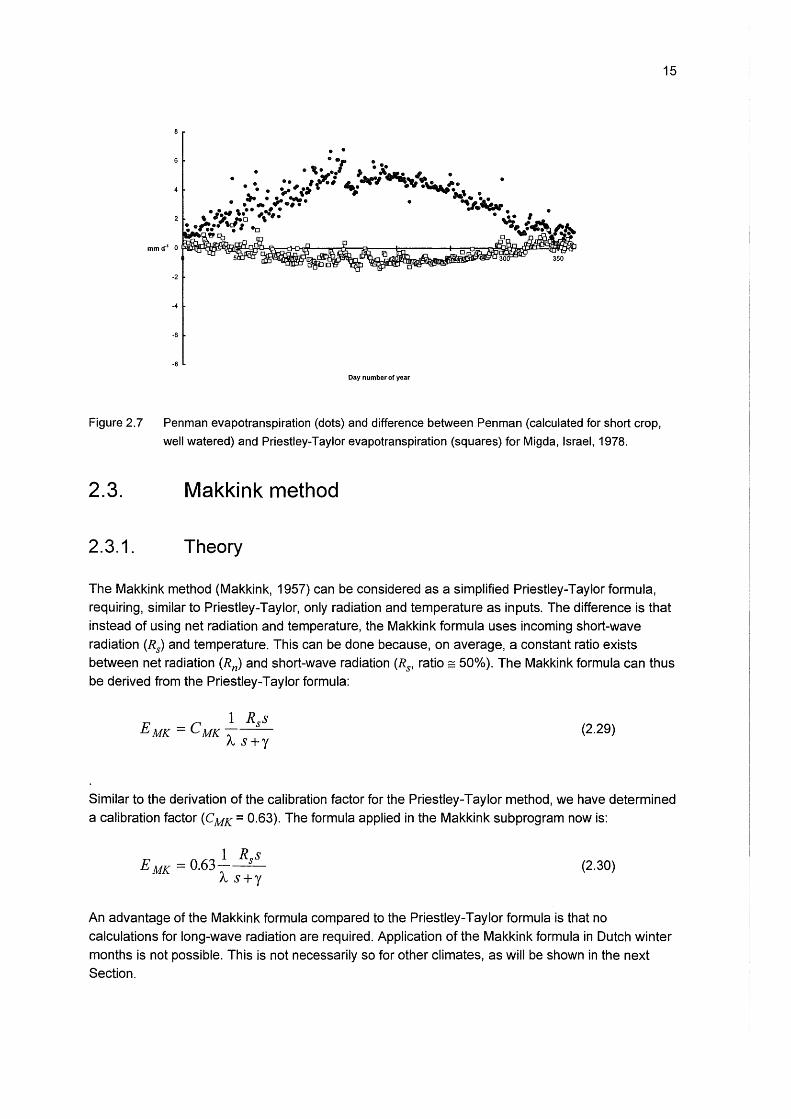
Figure 2.7 Penman evapotranspiration (dots) and difference between Penman (calculated for short crop,
well watered) and Priestley-Taylor evapotranspiration (squares) for Migda, Israel, 1978.
2.3. Makkink method
2.3.1. Theory
15
The Makkink method (Makkink, 1957) can be considered as a simplified Priestley-Taylor formula, requiring, similar to Priestley-Taylor, only radiation and temperature as inputs. The difference is that instead of using net radiation and temperature, the Makkink formula uses incoming short-wave
radiation (R8 } and temperature. This can be done because, on average, a constant ratio exists
between net radiation (Rn} and short-wave radiation (R8 , ratio = 50%). The Makkink formula can thus be derived from the Priestley-Taylor formula:
E C 1 R8 s
MK = MK __ _ A s+y
(2.29)
Similar to the derivation of the calibration factor for the Priestley-Taylor method, we have determined
a calibration factor ( C MK = 0.63). The formula applied in the Makkink subprogram now is:
E MK = 0.63_!_ Rss A s+y
(2.30)
An advantage of the Makkink formula compared to the Priestley-Taylor formula is that no
calculations for long-wave radiation are required. Application of the Makkink formula in Dutch winter months is not possible. This is not necessarily so for other climates, as will be shown in the next Section.
16
2.3.2. Comparison of Penman vs. Makkink for different locations
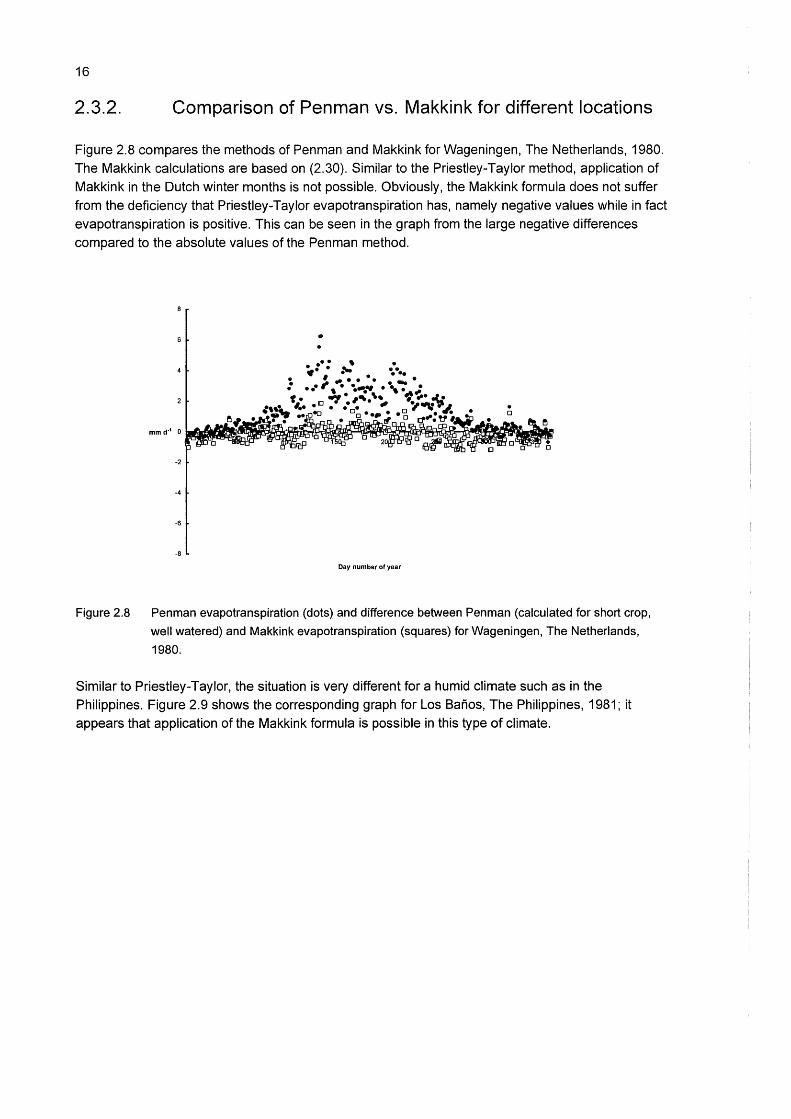
Figure 2.8 compares the methods of Penman and Makkink for Wageningen, The Netherlands, 1980. The Makkink calculations are based on (2.30). Similar to the Priestley-Taylor method, application of
Makkink in the Dutch winter months is not possible. Obviously, the Makkink formula does not suffer
from the deficiency that Priestley-Taylor evapotranspiration has, namely negative values while in fact evapotranspiration is positive. This can be seen in the graph from the large negative differences
compared to the absolute values of the Penman method .
•
-2
-4
-6
-8
Day number of year
Figure 2.8 Penman evapotranspiration (dots) and difference between Penman (calculated for short crop,
well watered) and Makkink evapotranspiration (squares) for Wageningen, The Netherlands,
1980.
Similar to Priestley-Taylor, the situation is very different for a humid climate such as in the
Philippines. Figure 2.9 shows the corresponding graph for Los Banos, The Philippines, 1981; it appears that application of the Makkink formula is possible in this type of climate.
17
-2
-4
-6
-8
Day number of year
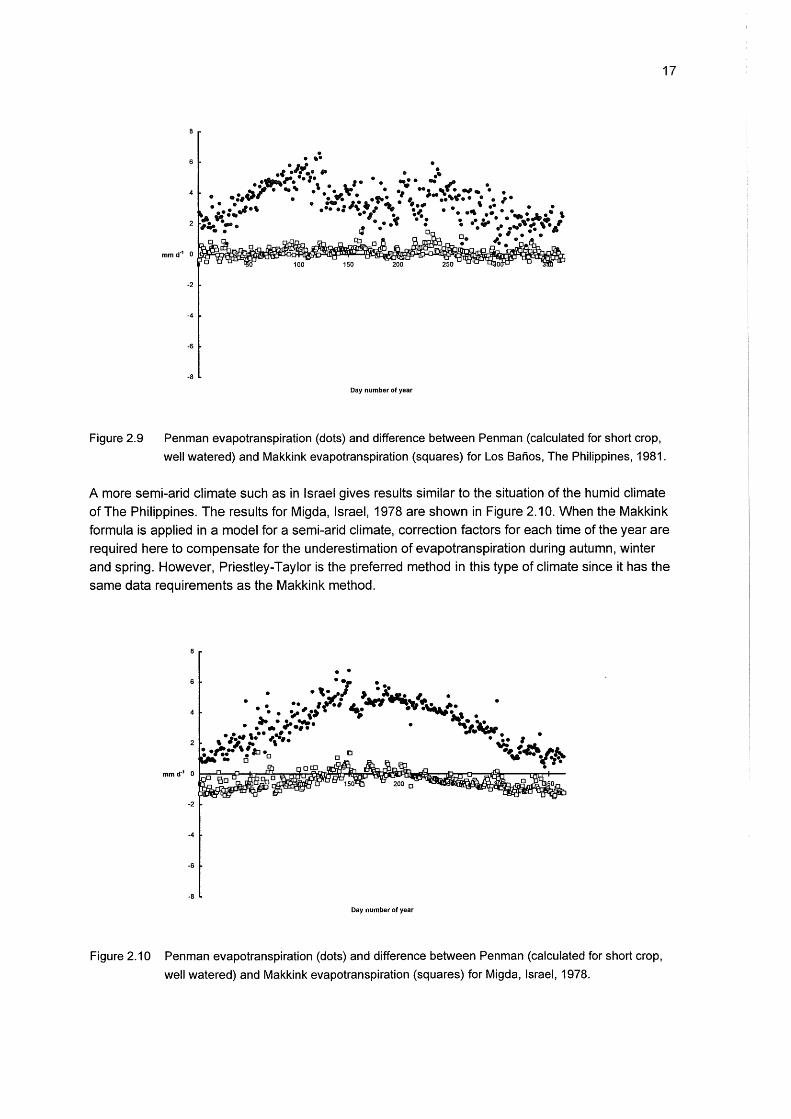
Figure 2.9 Penman evapotranspiration (dots) and difference between Penman (calculated for short crop,
well watered) and Makkink evapotranspiration (squares) for Los Banos, The Philippines, 1981.
A more semi-arid climate such as in Israel gives results similar to the situation of the humid climate of The Philippines. The results for Migda, Israel, 1978 are shown in Figure 2.1 0. When the Makkink formula is applied in a model for a semi-arid climate, correction factors for each time of the year are required here to compensate for the underestimation of evapotranspiration during autumn, winter and spring. However, Priestley-Taylor is the preferred method in this type of climate since it has the same data requirements as the Makkink method.
• •
-2
-4
-6
-8
Day number of year
Figure 2.10 Penman evapotranspiration (dots) and difference between Penman (calculated for short crop,
well watered) and Makkink evapotranspiration (squares) for Migda, Israel, 1978.

19
3. User guide
3.1. Availability of the described modules
The modules as they are described in this manual are written in standard Fortran-77 with the
exception of the IMPLICIT NONE statement. This statement, however, is supported by almost all Fortran-77 compilers. The modules are available on 1.44Mb MS-DOS compatible floppy disk. To
use the modules in unaltered form, you also need a recent version of the TTUTIL utility library. If you are interested in working with these modules and TTUTIL, send a request to:
AB-DLO
Software Product Support c/o P.W.J. Uithol P.O. Box 14 6700 AA Wageningen
The Netherlands
or through e-mail to: [email protected]
3.2. Module SETPMD (Penman evapotranspiration)
3.2.1. Purpose
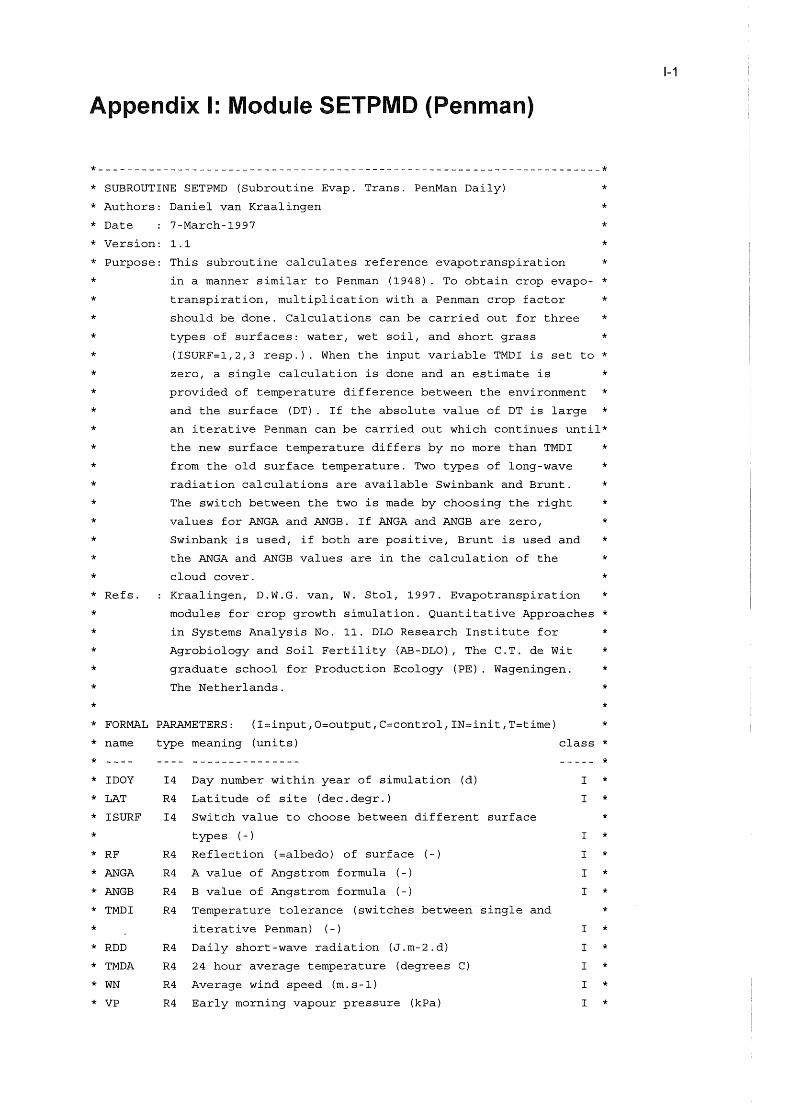
This module calculates reference evapotranspiration in a manner similar to Penman (1948). To
obtain crop evapotranspiration, multiplication with a Penman crop factor should be performed. Calculations can be carried out for three types of surfaces: water, wet soil, and short grass (I SURF = 1 ,2,3 resp.). For the calculation of the long-wave radiation, a choice can be made between the methods of Brunt (1932) and Swinbank (1963) (through the values of the input variables ANGA
and ANGB). When the input variable TMDI is set at zero, a single calculation is done and an estimate is provided of the temperature difference between the environment and the surface (DT). If the absolute value of DT is large, an iterative Penman calculation can be carried out which continues
until the new surface temperature differs by no more than TMDI from the surface temperature calculated with the single step procedure. The Brunt formula is parameterized with KNMI (Dutch Royal Meteorological Institute) data. To obtain actual crop transpiration from reference
evapotranspiration on the basis of leaf area index, the method of Van Laar et a/. ( 1992) can be
followed. To obtain actual crop transpiration from reference evapotranspiration on the basis of date in the growing season, the method of Feddes (1987) can be followed.
3.2.2. Usage
CALL SETPMD (IDOY 1 LAT 1 ISURF 1 RF 1 ANGA 1 ANGB 1 TMDI 1 RDD 1 TMDA 1 WN 1 VP 1
ETD I ETRDI ETAE I DT)
20
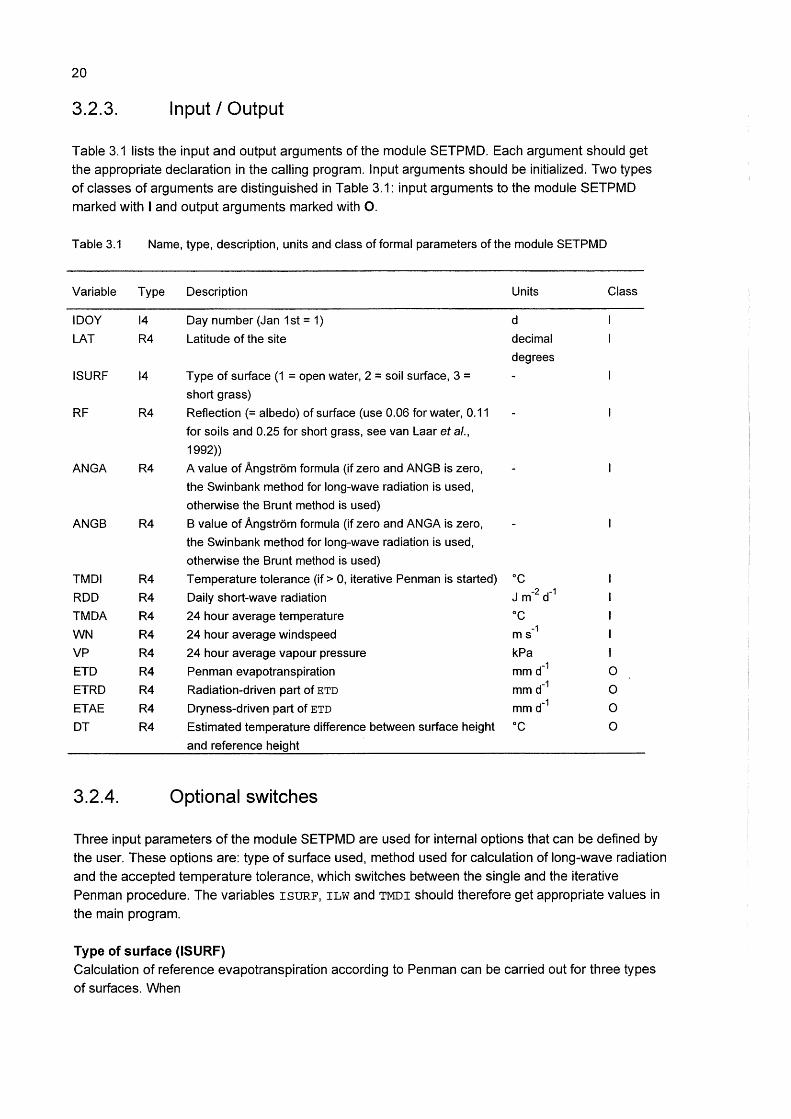
3.2.3. Input I Output
Table 3.1 lists the input and output arguments of the module SETPMD. Each argument should get
the appropriate declaration in the calling program. Input arguments should be initialized. Two types
of classes of arguments are distinguished in Table 3.1: input arguments to the module SETPMD
marked with I and output arguments marked with 0.
Table 3.1 Name, type, description, units and class of formal parameters of the module SETPMD
Variable Type Description Units Class
IDOY 14 Day number (Jan 1st= 1) d
LAT R4 Latitude of the site decimal
degrees
I SURF 14 Type of surface (1 =open water, 2 =soil surface, 3 =
short grass)
RF R4 Reflection (=albedo) of surface (use 0.06 for water, 0.11
for soils and 0.25 for short grass, see van Laar eta/.,
1992))
ANGA R4 A value of Angstrom formula (if zero and ANGB is zero,
the Swinbank method for long-wave radiation is used,
otherwise the Brunt method is used)
ANGB R4 B value of Angstrom formula (if zero and ANGA is zero,
the Swinbank method for long-wave radiation is used,
otherwise the Brunt method is used)
TMDI R4 Temperature tolerance (if> 0, iterative Penman is started) oc ROD R4 Daily short-wave radiation J m-2 d-1
TMDA R4 24 hour average temperature oc WN R4 24 hour average windspeed ms -1
VP R4 24 hour average vapour pressure kPa I
ETD R4 Penman evapotranspiration mm d-1 0
ETRD R4 Radiation-driven part of ETD mm d-1 0
ETAE R4 Dryness-driven part of ETD mm d-1 0
DT R4 Estimated temperature difference between surface height oc 0
and reference height
3.2.4. Optional switches
Three input parameters of the module SETPMD are used for internal options that can be defined by
the user. These options are: type of surface used, method used for calculation of long-wave radiation
and the accepted temperature tolerance, which switches between the single and the iterative Penman procedure. The variables I SURF, ILW and TMDI should therefore get appropriate values in
the main program.
Type of surface (ISURF) Calculation of reference evapotranspiration according to Penman can be carried out for three types
of surfaces. When
21
I SURF= 1: calculation for open water surface (use RF = 0.06), ISURF = 2: calculation for a wet soil (use RF = 0.11 ), ISURF = 3: calculation for short grass (use RF = 0.25).
Please note that by giving a value to the variable ISURF, the corresponding reflection coefficient RF is not automatically assigned; one has to assign the corresponding albedo in the calling program.
The value of RF can be calculated from crop and top soil characteristics, see Van Laar eta/. (1992).
Calculation of long-wave radiation (ANGA and ANGB) With the variables ANGA and ANGB one can choose whether the calculation of long-wave radiation is done according to the Swinbank formula or to the Brunt formula.
ANGA = 0, ANGB = 0 : Swinbank formula otherwise : Brunt formula
Only the Brunt formula requires ANGA and ANGB so that the user has to take care to supply valid values to the routine. It is not enough simply to choose non-zero numbers if one wants to use the Brunt formula.
Temperature tolerance {TMDI) By giving a value to the real variable TMDI, the module SETPMD switches between the single (TMDI
= 0) and the iterative Penman procedure (TMDI equals the accepted temperature tolerance). Note that the estimated temperature difference between reference height and surface height is returned through the variable DT even if iteration is switched off. If DT is very large one could decide to use an iterative Penman procedure.
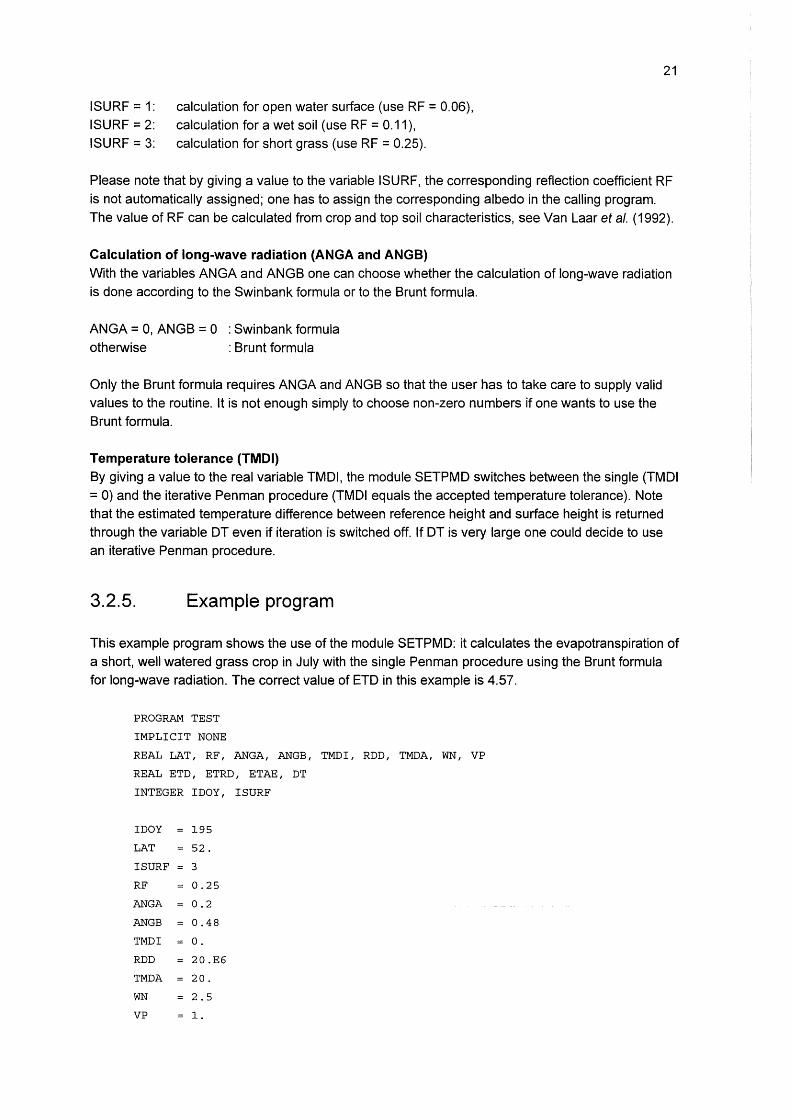
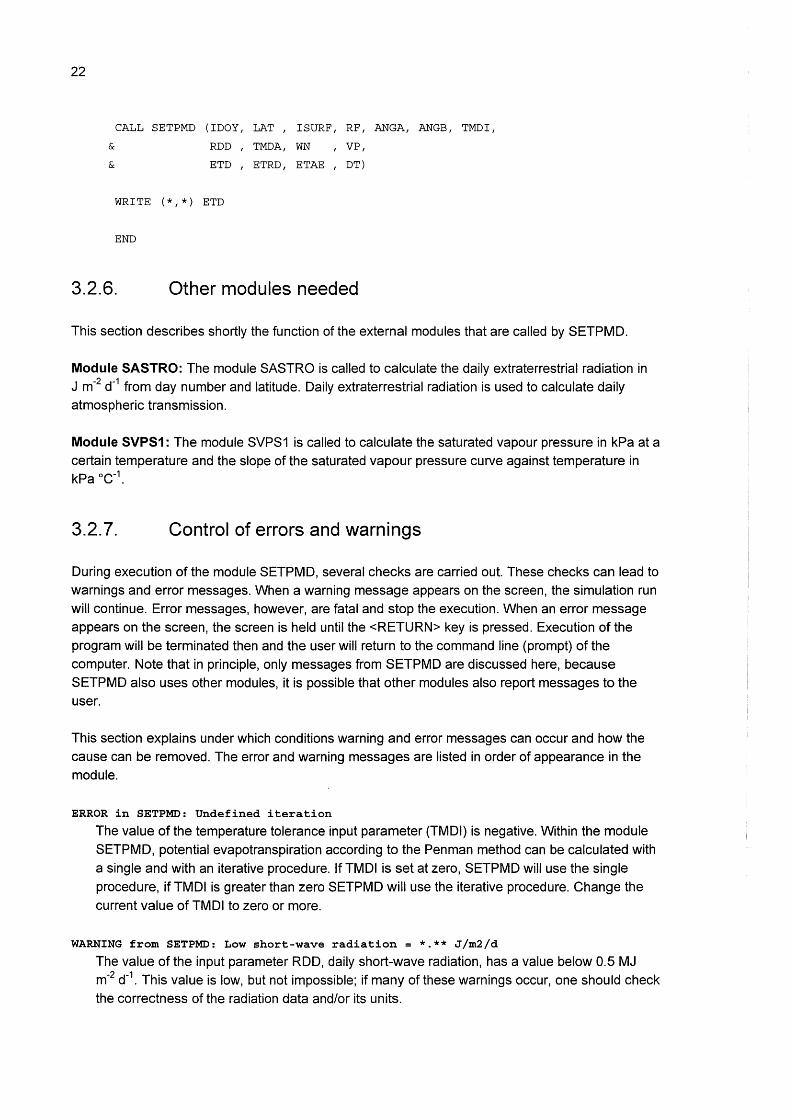
3.2.5. Example program
This example program shows the use of the module SETPMD: it calculates the evapotranspiration of a short, well watered grass crop in July with the single Penman procedure using the Brunt formula for long-wave radiation. The correct value of ETD in this example is 4.57.
PROGRAM TEST
IMPLICIT NONE
REAL LAT, RF, ANGA, ANGB, TMDI, RDD, TMDA, WN, VP
REAL ETD, ETRD, ETAE, DT
INTEGER IDOY, ISURF
IDOY 195
LAT 52.
I SURF = 3
RF 0.25
ANGA 0.2
ANGB 0.48
TMDI 0.
RDD 20.E6
TMDA 20.
WN 2.5
VP 1.
22
&
&
CALL SETPMD (IDOY 1 LAT 1 ISURF 1 RF 1 ANGA 1 ANGB 1 TMDI 1
RDD I TMDAI WN I VP I
ETD I ETRDI ETAE I DT)
WRITE (* 1 *) ETD
END
3.2.6. Other modules needed
This section describes shortly the function of the external modules that are called by SETPMD.
Module SASTRO: The module SASTRO is called to calculate the daily extraterrestrial radiation in J m-2 d-1 from day number and latitude. Daily extraterrestrial radiation is used to calculate daily atmospheric transmission.
Module SVPS1: The module SVPS1 is called to calculate the saturated vapour pressure in kPa at a certain temperature and the slope of the saturated vapour pressure curve against temperature in kPa ac-1.
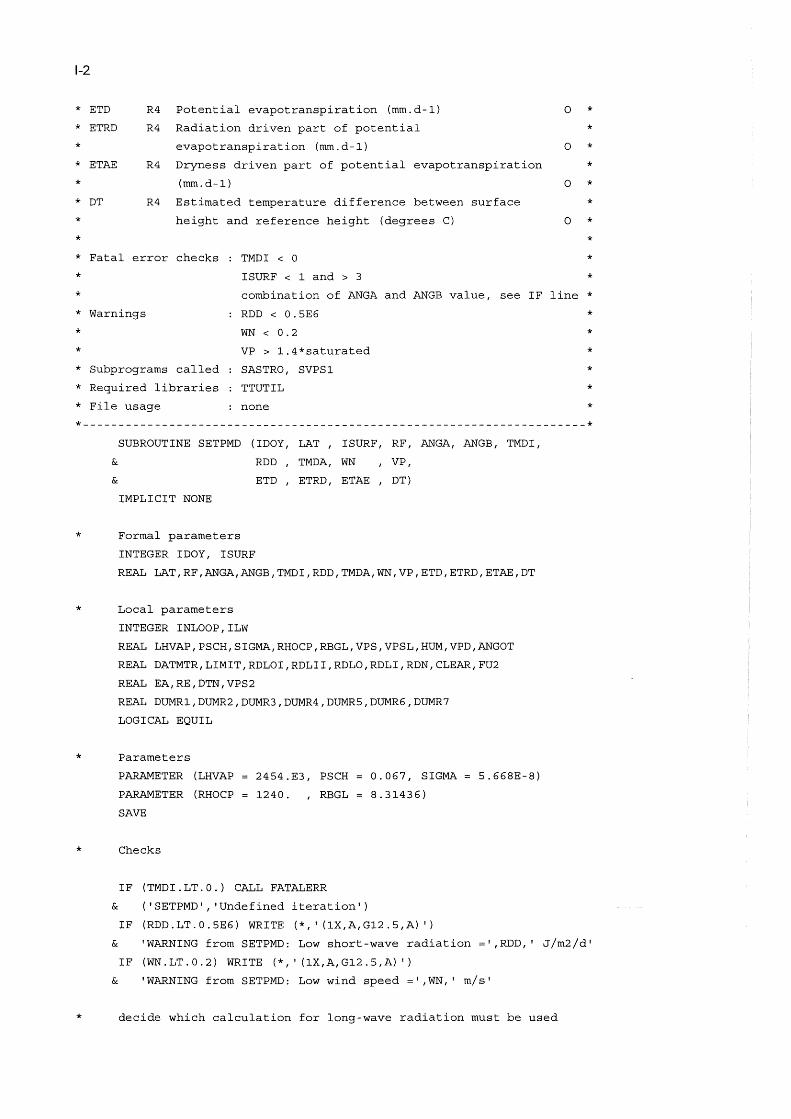
3.2.7. Control of errors and warnings
During execution of the module SETPMD, several checks are carried out. These checks can lead to warnings and error messages. When a warning message appears on the screen, the simulation run will continue. Error messages, however, are fatal and stop the execution. When an error message appears on the screen, the screen is held until the <RETURN> key is pressed. Execution of the program will be terminated then and the user will return to the command line (prompt) of the
computer. Note that in principle, only messages from SETPMD are discussed here, because SETPMD also uses other modules, it is possible that other modules also report messages to the user.
This section explains under which conditions warning and error messages can occur and how the cause can be removed. The error and warning messages are listed in order of appearance in the module.
ERROR in SETPMD: Undefined iteration
The value of the temperature tolerance input parameter (TMDI) is negative. Within the module
SETPMD, potential evapotranspiration according to the Penman method can be calculated with
a single and with an iterative procedure. If TMDI is set at zero, SETPMD will use the single
procedure, if TMDI is greater than zero SETPMD will use the iterative procedure. Change the
current value of TMDI to zero or more.
WARNING from SETPMD: Low short-wave radiation = *·** J/m2/d
The value of the input parameter RDD, daily short-wave radiation, has a value below 0.5 MJ m-2 d-1
. This value is low, but not impossible; if many of these warnings occur, one should check
the correctness of the radiation data and/or its units.
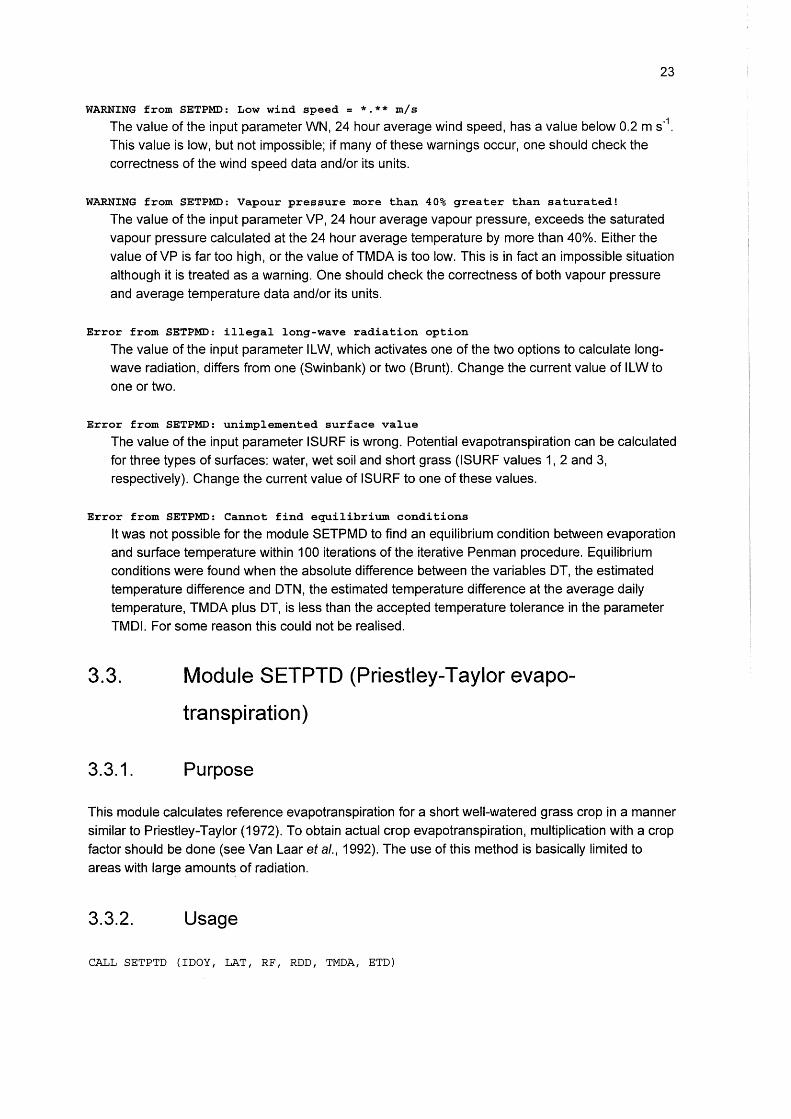
23
WARNING from SETPMD: Low wind speed = *·** m/s
The value of the input parameter WN, 24 hour average wind speed, has a value below 0.2 m s·1.
This value is low, but not impossible; if many of these warnings occur, one should check the
correctness of the wind speed data and/or its units.
WARNING from SETPMD: Vapour pressure more than 40% greater than saturated!
The value of the input parameter VP, 24 hour average vapour pressure, exceeds the saturated vapour pressure calculated at the 24 hour average temperature by more than 40%. Either the
value of VP is far too high, or the value of TMDA is too low. This is in fact an impossible situation
although it is treated as a warning. One should check the correctness of both vapour pressure
and average temperature data and/or its units.
Error from SETPMD: illegal long-wave radiation option
The value of the input parameter ILW, which activates one of the two options to calculate long
wave radiation, differs from one (Swinbank) or two (Brunt). Change the current value of ILW to one or two.
Error from SETPMD: unimplemented surface value
The value of the input parameter I SURF is wrong. Potential evapotranspiration can be calculated for three types of surfaces: water, wet soil and short grass (I SURF values 1, 2 and 3, respectively). Change the current value of I SURF to one of these values.
Error from SETPMD: Cannot find equilibrium conditions
It was not possible for the module SETPMD to find an equilibrium condition between evaporation and surface temperature within 100 iterations of the iterative Penman procedure. Equilibrium conditions were found when the absolute difference between the variables DT, the estimated temperature difference and DTN, the estimated temperature difference at the average daily temperature, TMDA plus DT, is less than the accepted temperature tolerance in the parameter TMDI. For some reason this could not be realised.
3.3.
3.3.1.
Module SETPTD (Priestley-Taylor evapo
transpiration)
Purpose
This module calculates reference evapotranspiration for a short well-watered grass crop in a manner similar to Priestley-Taylor (1972). To obtain actual crop evapotranspiration, multiplication with a crop
factor should be done (see VanLaar eta/., 1992). The use of this method is basically limited to
areas with large amounts of radiation.
3.3.2. Usage
CALL SETPTD (IDOY, LAT, RF, RDD, TMDA, ETD)
24
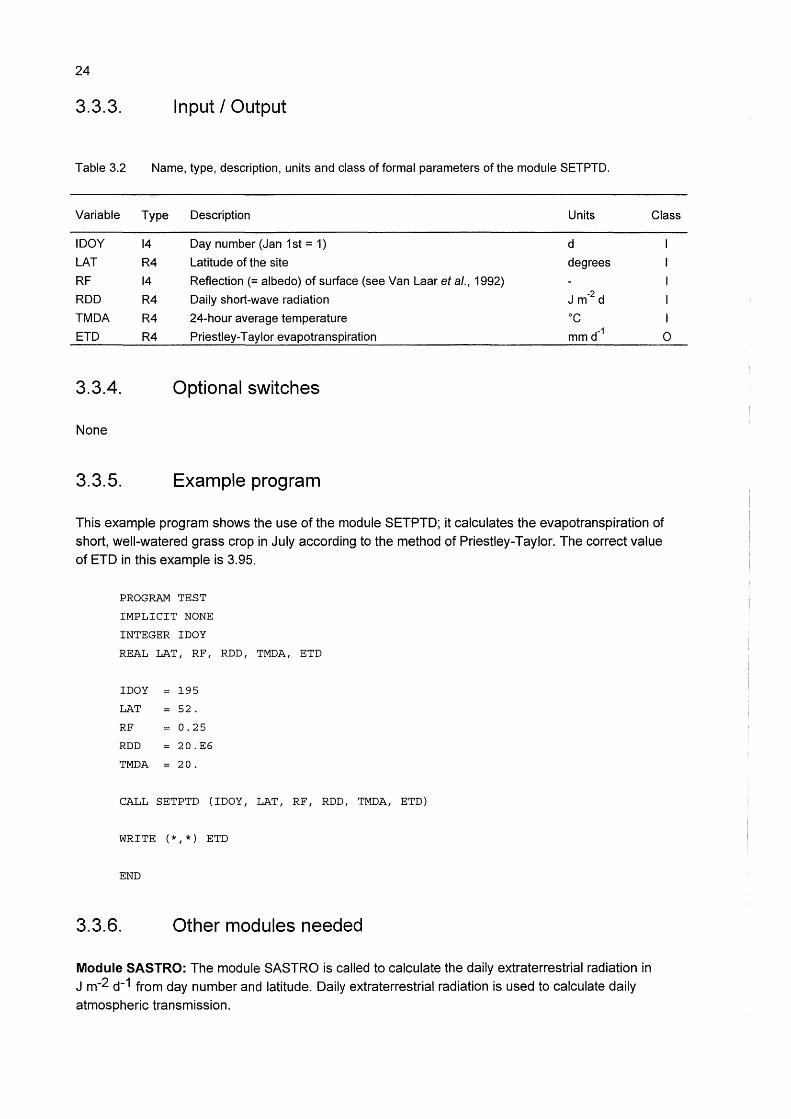
3.3.3. Input I Output
Table 3.2 Name, type, description, units and class of formal parameters of the module SETPTD.
Variable Type Description Units Class
IDOY 14 Day number (Jan 1st = 1) d
LAT R4 Latitude of the site degrees
RF 14 Reflection(= albedo) of surface (see VanLaar eta/., 1992)
ROD R4 Daily short-wave radiation J m-2 d
TMDA R4 24-hour average temperature oc ETD R4 Priestley-Taylor evapotranspiration mm d-1 0
3.3.4. Optional switches
None
3.3.5. Example program
This example program shows the use of the module SETPTD; it calculates the evapotranspiration of short, well-watered grass crop in July according to the method of Priestley-Taylor. The correct value of ETD in this example is 3.95.
PROGRAM TEST
IMPLICIT NONE
INTEGER IDOY
REAL LAT, RF, RDD, TMDA, ETD
IDOY 195
LAT 52.
RF 0.25
RDD 20.E6
TMDA 20.
CALL SETPTD (IDOY, LAT, RF, RDD, TMDA, ETD)
WRITE (*,*) ETD
END
3.3.6. Other modules needed
Module SASTRO: The module SASTRO is called to calculate the daily extraterrestrial radiation in J m-2 d-1 from day number and latitude. Daily extraterrestrial radiation is used to calculate daily
atmospheric transmission.
25
Module SVPS1: The module SVPS1 is called to calculate the saturated vapour pressure in kPa at a certain temperature and the slope of the saturated vapour pressure curve against that temperature in kPa oc-1
.
3.3.7. ·Control of errors and warnings
WARNING from SETPTD: Low short-wave radiation = *·** J/m2/d
The value of the input parameter ROD, daily short-wave radiation, has a value below 0.5 MJ m-2 d-1
. This value is low, but not impossible: if many of these warnings occur, one should check
the correctness of the radiation data and/or its units.
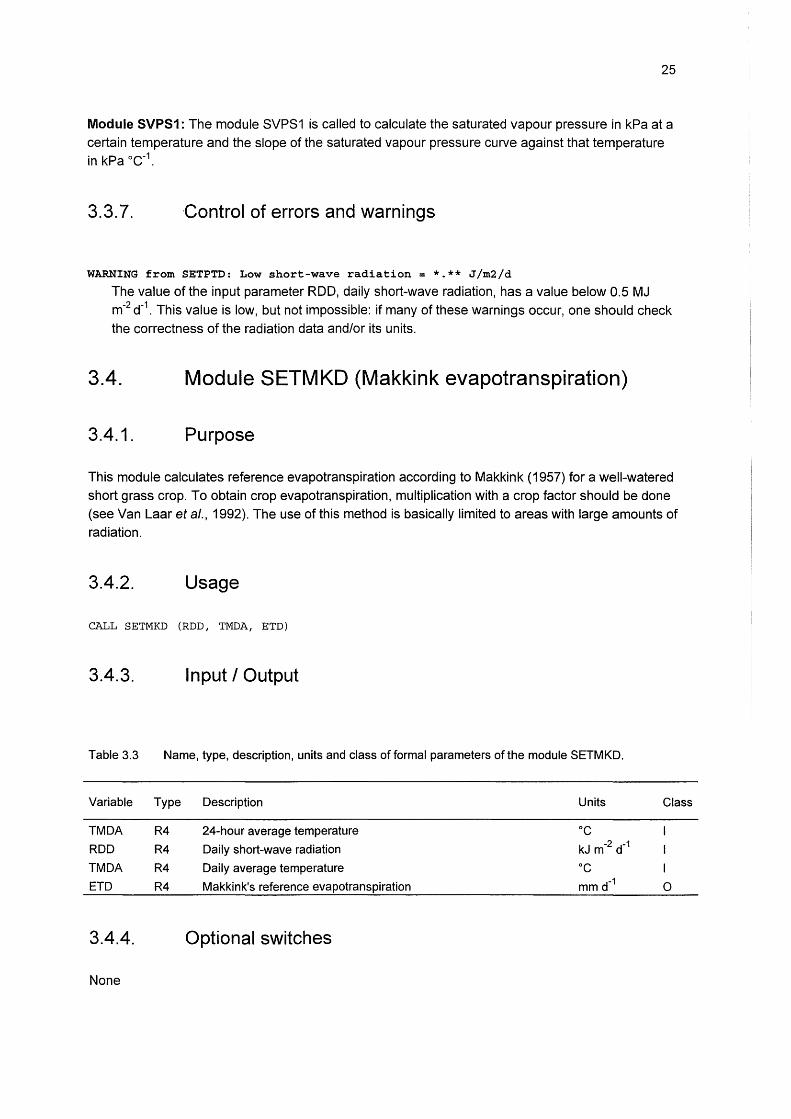
3.4. Module SETMKD (Makkink evapotranspiration)
3.4.1. Purpose
This module calculates reference evapotranspiration according to Makkink (1957) for a well-watered short grass crop. To obtain crop evapotranspiration, multiplication with a crop factor should be done
(see VanLaar eta/., 1992). The use of this method is basically limited to areas with large amounts of radiation.
3.4.2. Usage
CALL SETMKD (RDD, TMDA, ETD)
3.4.3. Input I Output
Table 3.3 Name, type, description, units and class of formal parameters of the module SETMKD.
Variable Type Description Units Class
TMDA R4 24-hour average temperature oc ROD R4 Daily short-wave radiation kJ m-2 d-1
TMDA R4 Daily average temperature oc ETD R4 Makkink's reference evapotranspiration mm d-1 0
3.4.4. Optional switches
None
26
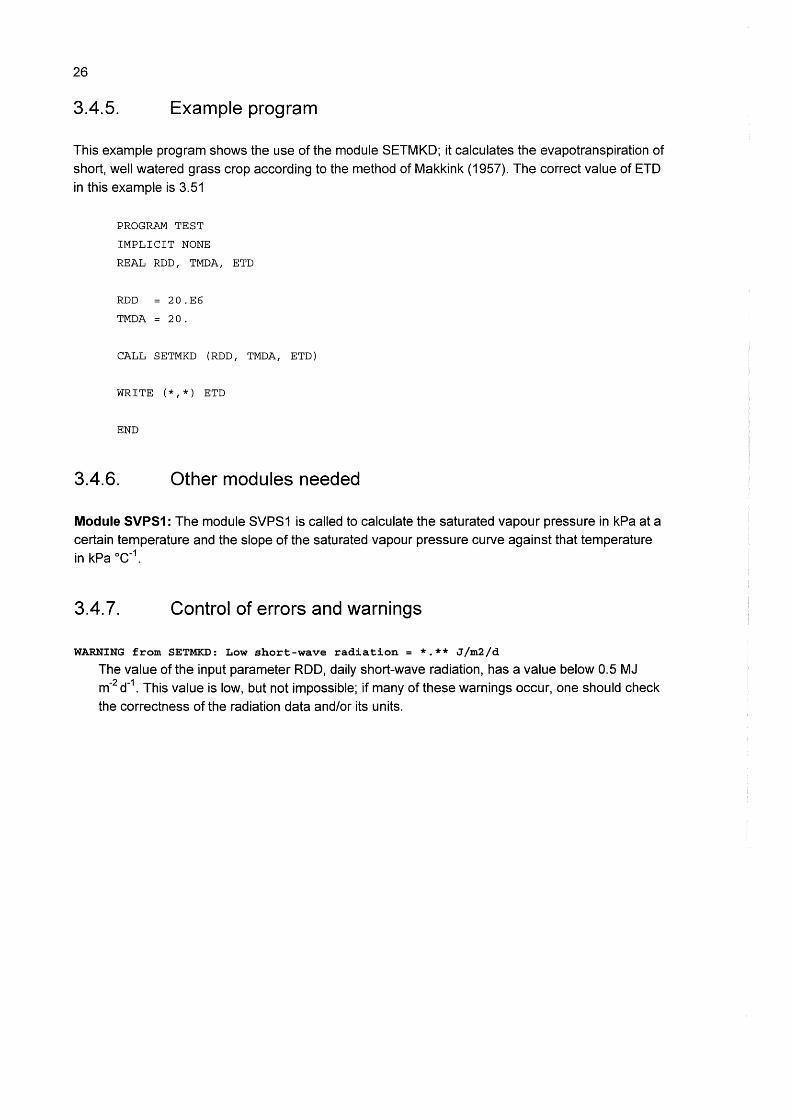
3.4.5. Example program
This example program shows the use of the module SETMKD; it calculates the evapotranspiration of
short, well watered grass crop according to the method of Makkink (1957). The correct value of ETD in this example is 3.51
PROGRAM TEST
IMPLICIT NONE
REAL RDD, TMDA, ETD
RDD 20.E6
TMDA 20.
CALL SETMKD (RDD, TMDA, ETD)
WRITE (*,*) ETD
END
3.4.6. Other modules needed
Module SVPS1: The module SVPS1 is called to calculate the saturated vapour pressure in kPa at a certain temperature and the slope of the saturated vapour pressure curve against that temperature in kPa oc-1.
3.4.7. Control of errors and warnings
WARNING from SETMKD: Low short-wave radiation = *·** J/m2/d
The value of the input parameter ROD, daily short-wave radiation, has a value below 0.5 MJ m-2 d-1
. This value is low, but not impossible; if many of these warnings occur, one should check
the correctness of the radiation data and/or its units.
References
Aase, J.K. & S.B. ldso, 1975.
Solar radiation interactions with mixed prairie rangeland in natural and denuded conditions.
Archiv fOr Meteorologie, Geophysik und Bioklimatologie, Serie B, 23: 255-264.
Arnfield, A.J., 1979.
27
Evaluation of empirical expressions for the estimation of hourly and daily totals of atmospheric
long-wave emissions under all sky conditions. Quarterly Journal of the Royal Meteorological
Society 105: 1041-1052.
Brunt, D., 1932.
Notes on radiation in the atmosphere. I. Quarterly Journal of the Royal Meteorological Society
58: 389-420.
Budyko, M.l., 1958.
Heat balance of the earth's surface. Translation by N.A. Stepanova, U.S. Department of
Commerce, Washington, D.C.
Buishand, T.A. & C.A. Velds, 1980.
Neerslag en verdamping. KNMI serie: Klimaat van Nederland, 206 pp.
Buttner, K. & E. Sutter, 1935.
AbkOiungs Grosse in den DOnen, ROckstrahlung Verschiedener Bodenbedeckungen.
Strahlentherapie 54: 156-173.
Dalton, J., 1802.
On the constitution of mixed gases, on the force of steam of vapour from water and other liquids
in different temperatures, both in a Torricellia vacuum and in air; on evaporation; and on the
expansion of gases by heat. Memoirs, Literary and Philosophical Society of Manchester 5(2):
536-602.
De Bruin, H.A.R., 1979.
Neerslag, open water verdamping en potentieel neerslagoverschot in Nederland.
Frequentieverdelingen in het groeiseizoen. Scientific Report W.R. 79-4. Koninklijk Nederlands
Meteorologisch lnstituut, De Bilt, The Netherlands.
De Bruin, H.A.R., 1983.
A model for the Priestley-Taylor parameter a. Journal of Climate and Applied Meteorology 22:
572-578.
De Bruin, H.A.R., 1987.
From Penman to Makkink. In: J.C Hooghart (Ed.), Evaporation and weather. Proceedings and
Information No. 39, TNO Committee on Hydrological Research, The Hague, pp. 5-31.
Doorenbos, J. & W.O. Pruitt, 1977.
Guidelines for predicting crop water requirements. FAO Irrigation and Drainage Paper 24.
Feddes, R.A., 1971.
Water, heat and crop growth. PhD thesis, Wageningen, Agricultural University.
Feddes, R.A., 1987.
Crop factors in relation to Makkink reference-crop evapotranspiration. In: J.C. Hooghart (Ed.),
Evaporation and weather. Proceedings and Information No. 39, TNO Committee on
Hydrological Research, The Hague, pp 33-45.
Gold, A. & J. Ben Asher, 1976.
Soil reflectance measurement using a photographic method. Soil Science Society of America
Journal 40: 337-341.
Graser, E.A. & C.H.V. Bavel, 1982.
The effect of soil moisture upon soil albedo. Agricultural Meteorology 27: 17-26.
28
Holtslag, A.A.M. & A.P. van Ulden, 1983. A simple scheme for daytime estimates of the surface
fluxes from routine weather data. Journal of Climate and Applied Meteorology. 22(4): 517-529.
ldso, S.B., T.J. Schmugge, R.D. Jackson & R.J. Reginato, 1975.
The utility of surface temperature measurements for the remote sensing of surface soil water
status. Journal of Geophysical Research 80: 3044-3049.
Kalma, J.D. & R. Badham, 1972.
The radiation balance of a tropical pasture. I. The reflection of short-wave radiation. Agricultural
Meteorology 10: 251-259.
Kondrat'ev, K.Y., 1954.
The radiant energy of the sun, Leningrad, Chapter 9, Albedo of the underlying surface and
clouds. English summary by A. Kurlent and P. Larson, McGill University.
Makkink, G.F., 1957.
Testing the Penman formula by means of lysimeters. International Journal of Water Engineering, 11: 277-288
Paltridge, G.W. & C.M.R. Platt, 1976.
Radiative processes in meteorology and climatology. Development in Atmospheric Science. Vol. 5. Elsevier, 318 pp.
Penman, H.L., 1948.
Natural evaporation from open water, bare soil and grass. Royal Society, London Proc. Series
A, 193: 120-146. Penman, H.L., 1956.
Evaporation: an introductory survey. Netherlands Journal of Agricultural Science 4: 9-29. Piggin, I. & P. Schwertfeger, 1973.
Variations in the albedo of wheat and barley crops. Archiv fur Meteorologie, Geophysik und Bioklimatologie, Serie B, 21:365-391.
Priestley, C.H.B. & R.J. Taylor, 1972.
On the assessment of the surface heat flux and evaporation using large scale parameters.
Monthly Weather Review, 100: 81-92 Sellers, W.O., 1965.
Physical climatology. University of Chicago Press.
Ten Berge, H.F.M., 1990.
Heat and water transfer in bare topsoil and the lower atmosphere. Simulation Monographs 33.
Pudoc, Wageningen, 207 pp.
Thom, A.S. & H.R. Oliver, 1977. On Penman's equation for estimating regional evaporation.
Quarterly Journal of the Royal Meteorological Society 103: 345-357.
Unsworth, M.H. & J.L. Monteith, 1975. Long-wave radiation at the ground. Quarterly Journal of the
Royal Meteorological Society 101: 13-24.
Stroosnijder, L., & H.D.J. van Heemst, 1982. La meteorologie du Sahel et du terrain de l'etude. In:
F.W.T. Penning de Vries & M.A. Djiteye (Eds.),La productivite des paturages Saheliens, Pudoc, Wageningen.
Swinbank, W.C., 1963.
Long-wave-radiation from clear skies. Quarterly Journal of the Royal Meteorological Society 89:
339-348.
Vander Heide, G. & A.J. Koolen, 1980.
Soil surface albedo and multispectral reflectance of short-wave radiation as a function of degree
of soil slaking. Netherlands Journal of Agricultural Science 28: 252-258.
VanLaar, H. H., J. Goudriaan & H. van Keulen (editors), 1992.
Simulation of crop growth for potential and water-limited production situations (as applied to
spring wheat). Simulation Report CABO-TT no. 27, Centre for Agrobiological Research, Dept. of Theoretical Production Ecology, PO Box 430, Wageningen, 72 pp.
29
Wartena, L., 1973.
Checking of some formulae for the calculation of long-wave radiation from clear skies. Archiv fOr
Meteorologie, Geophysik und Bioklomatologie, Serie B, 21: 335-348.
Withers, B. & S. Vipond, 197 4.
Irrigation: design and practice. Batsford Academic and Educational Limited, London, 306 pp.

Appendix 1: Module SETPMD (Penman)
*----------------------------------------------------------------------* * SUBROUTINE SETPMD (Subroutine Evap. Trans. PenMan Daily)
* Authors: Daniel van Kraalingen * *
* Date 7-March-1997 * * Version: 1.1 * * Purpose: This subroutine calculates reference evapotranspiration *
* * * * * * * * * * * * * * * * * * Refs.
* * * * * *
in a manner similar to Penman (1948) . To obtain crop evapo- *
transpiration, multiplication with a Penman crop factor
should be done. Calculations can be carried out for three * *
types of surfaces: water, wet soil, and short grass * (ISURF=1,2,3 resp.). When the input variable TMDI is set to*
zero, a single calculation is done and an estimate is *
provided of temperature difference between the environment *
and the surface (DT) . If the absolute value of DT is large * an iterative Penman can be carried out which continues until*
the new surface temperature differs by no more than TMDI
from the old surface temperature. Two types of long-wave
radiation calculations are available Swinbank and Brunt.
The switch between the two is made by choosing the right
values for ANGA and ANGB. If ANGA and ANGB are zero,
Swinbank is used, if both are positive, Brunt is used and
the ANGA and ANGB values are in the calculation of the
cloud cover.
Kraalingen, D.W.G. van, W. Stol, 1997. Evapotranspiration
* * * * * * * * *
modules for crop growth simulation. Quantitative Approaches *
in Systems Analysis No. 11. DLO Research Institute for *
Agrobiology and Soil Fertility (AB-DLO), The C.T. de Wit *
graduate school for Production Ecology (PE) . Wageningen.
The Netherlands. * * *
* FORMAL PARAMETERS: (I=input,O=output,C=control,IN=init,T=time) * * name
* * IDOY
* LAT
* ISURF
*
type meaning (units)
I4 Day number within year of simulation (d)
R4 Latitude of site (dec.degr.)
I4 Switch value to choose between different surface
types (-)
* RF R4 Reflection (=albedo) of surface (-)
* ANGA R4 A value of Angstrom formula (-)
* ANGB R4 B value of Angstrom formula (-)
* TMDI
* * RDD
* TMDA
* WN
* VP
R4 Temperature tolerance (switches between single and
iterative Penman) (-)
R4 Daily short-wave radiation (J.m-2.d)
R4 24 hour average temperature (degrees C)
R4 Average wind speed (m.s-1)
R4 Early morning vapour pressure (kPa)
class *
* I *
I *
*
I *
I * I * I *
* I * I *
I *
I * I *
1-1
1-2
* ETD
* ETRD
* * ETAE
* * DT
* *
R4 Potential evapotranspiration (mm.d-1)
R4 Radiation driven part of potential
evapotranspiration (mm.d-1)
R4 Dryness driven part of potential evapotranspiration
(mm.d-1)
R4 Estimated temperature difference between surface
height and reference height (degrees C)
* Fatal error checks TMDI < 0
* ISURF < 1 and > 3
0 *
* 0 *
* 0 *
* 0 *
* * *
* combination of ANGA and ANGB value, see IF line *
* Warnings
* * * Subprograms called
* Required libraries
* File usage
RDD < 0.5E6
WN < 0.2
VP > 1.4*saturated
SASTRO, SVPS1
TTUTIL
none
* * * * * *
*----------------------------------------------------------------------*
*
*
&
&
SUBROUTINE SETPMD (IDOY, LAT , ISURF, RF, ANGA, ANGB, TMDI,
IMPLICIT NONE
Formal parameters
INTEGER IDOY, ISURF
RDD I TMDA, WN I VP,
ETD I ETRD, ETAE I DT)
REAL LAT 1RF 1ANGA1ANGB 1TMDI 1RDD 1TMDA1WN 1VP,ETD,ETRD 1ETAE 1DT
Local parameters
INTEGER INLOOP 1ILW
REAL LHVAP,PSCH 1SIGMA1RHOCP,RBGL 1VPS,VPSL 1HUM 1VPD 1ANGOT
REAL DATMTR,LIMIT 1RDLOI 1RDLII 1RDLO,RDLI 1RDN,CLEAR,FU2
REAL EA,RE,DTN 1VPS2
REAL DUMR1 1DUMR2 1DUMR3 1DUMR4 1DUMR5 1DUMR6 1DUMR7
LOGICAL EQUIL
* Parameters
PARAMETER (LHVAP
PARAMETER (RHOCP
SAVE
2454.E3, PSCH
1240. RBGL
0.067, SIGMA
8.31436)
5.668E-8)
* Checks
*
IF (TMDI.LT.O.) CALL FATALERR
& ('SETPMD' 1 'Undefined iteration')
IF (RDD.LT.0.5E6) WRITE (*,I (1XIAIG12.51A) ')
& 'WARNING from SETPMD: Low short-wave radiation =' 1 RDD 1 ' J/m2/d'
IF (WN.LT.0.2) WRITE (*I I (1XIAIG12.5,A) ')
& 'WARNING from SETPMD: Low wind speed =' 1WN,' m/s'
decide which calculation for long-wave radiation must be used
*
*
&
&
&
IF (ANGA.EQ.O .. AND.ANGB.EQ.O.) THEN
use Swinbank formula
ILW = 1
ELSE IF (ANGA.GT.O .. AND.
ANGB .GT. 0 .. AND.
(ANGA+ANGB) .GT.O.S.AND.
(ANGA+ANGB) .LT.0.9) THEN
use Brunt formula
ILW = 2
ELSE
CALL FATALERR ( 1 SETPMD 1, 'illegal long-wave radiation option')
END IF
CALL SVPSl (TMDA, VPS, VPSL)
HUM = VP/VPS
IF (HUM.GT.l.) THEN
VPD = 0.
IF (HUM.GT.l.4) WRITE (*,' (2A) 1) 'WARNING from SETPMD:',
& 1 Vapour pressure more than 40% greater than saturated ! 1
ELSE
VPD VPS-VP
END IF
* Long-wave radiation (J/m2/s and J/m2/d) and net radiation
&
*
*
&
CALL SASTRO (IDOY,LAT,
DATMTR
RDLOI
DUMR1,ANGOT,DUMR2,DUMR3,DUMR4,DUMR5,DUMR6,DUMR7)
LIMIT (O.,l.,RDD/ANGOT)
SIGMA*(TMDA+273.16)**4
RDLO 86400.*RDLOI
IF (ILW.EQ.1) THEN
Swinbank formula for net long-wave radiation
RDLII
RDLI
ELSE IF
Brunt
CLEAR
RDLII
RDLI
END IF
DATMTR*(5.31E-13*(TMDA+273.16)**6-RDLOI)/0.7+RDLOI
86400.*RDLII
( ILW. EQ . 2) THEN
formula for net long-wave radiation
LIMIT (0., 1., (DATMTR-ANGA)/ANGB)
SIGMA*(TMDA+273.16)**4*(1.-(0.53-0.212*SQRT(VP))*
(0. 2+0. 8*CLEAR))
86400.*RDLII
RDN (1.-RF)*RDD+RDLI-RDLO
* Wind functions and isothermal evaporation
* 2.63 is conversion from mm Hg to kPa
IF (ISURF.EQ.1.0R.ISURF.EQ.2) THEN
1-3
1-4
*
*
* * *
open water and soils
FU2 = 2.63*(0.5+0.54*WN)
ELSE IF (ISURF.EQ.3) THEN
short grass crops
FU2 2.63*(1.0+0.54*WN)
ELSE
CALL FATALERR ('SETPMD', 'unimplemented surface value')
END IF
EA VPD*FU2
Actual water loss (separated in radiation term and
aerodynamic term) and resistance to transfer of vapour (s/m)
and estimated temperature difference
ETRD
ETAE
ETD
RE
DT
(RDN*(VPSL/(VPSL+PSCH)))/LHVAP
(PSCH*EA)/(VPSL+PSCH)
ETRD+ETAE
86400.*1000.*0.018016/(FU2*RBGL*(TMDA+273.16))
RE*((RDN-LHVAP*ETD)/86400.)/RHOCP
* Iteration on surface temperature if requi~ed with DO-WHILE loop
IF (TMDI.GT.O.) THEN
DTN 0.
INLOOP 0
EQUIL .FALSE.
10 IF (INLOOP.EQ.O .OR .. NOT.EQUIL) THEN
*
* *
&
*
DT = (DT+DTN)/2.
Net radiation and slope of saturated vapour pressure
RDLOI SIGMA*(TMDA+DT+273.16)**4
RDLO 86400.*RDLOI
RDN (1.-RF)*RDD+RDLI-RDLO
CALL SVPS1 ((TMDA+DT), VPS2, DUMR1)
VPSL = (VPS2-VPS)/DT
Actual water loss, resistance to vapour transfer and
estimated temperature difference
ETRD
ETAE
ETD
RE
DTN
(RDN*(VPSL/(VPSL+PSCH)))/LHVAP
(PSCH*EA)/(VPSL+PSCH)
ETRD+ETAE
86400.*1000.*0.018016/
(FU2*RBGL*(TMDA+O.S*DT+273.16))
RE*((RDN-LHVAP*ETD)/86400.)/RHOCP
Check on equilibrium and maximum number of iterations
EQUIL = ABS (DTN-DT) .LT.TMDI
INLOOP = INLOOP+l
IF (INLOOP.GT.lOO.AND .. NOT.EQUIL) CALL FATALERR
& ('SETPMD', 'Cannot find equilibrium conditions')
DT = DTN
GOTO 10
END IF
END IF
RETURN
END
1-5

Appendix II: Module SETPTD (Priestley-Taylor)
*----------------------------------------------------------------------* * SUBROUTINE SETPTD (Subroutine Evap. Trans.Priestley-Taylor Daily) * * Authors: Daniel van Kraalingen * * Date 7-March-1997 * * Version: 1.0 * * Purpose: This subroutine calculates reference evapotranspiration *
* * * * Refs.
in a manner similar to Priestley and Taylor (1972) .
To obtain crop evapotranspiration, multiplication with a
crop factor should be done.
Kraalingen, D.W.G. van, W. Stol, 1997. Evapotranspiration
* * * *
* * *
modules for crop growth simulation. Quantitative Approaches * in Systems Analysis No. 11. DLO Research Institute for * Agrobiology and Soil Fertility (AB-DLO), The C.T. de Wit *
* * *
graduate school for Production Ecology (PE). Wageningen.
The Netherlands.
* FORMAL PARAMETERS: (I=input,O=output,C=control,IN=init,T=time)
* name type meaning (units) class
* * IDOY
* LAT
* RF
* RDD
* TMDA
* ETD
*
I4 Day number within year of simulation (d)
R4 Latitude of site (dec.degr.)
R4 Reflection (=albedo) of surface (-)
R4 Daily short-wave radiation (J.m-2.d)
R4 24 hour average temperature (degrees C)
R4 Potential evapotranspiration (mm.d-1)
* Fatal error checks
* Warnings
none
RDD < 0.5E6
SASTRO, SVPS1
TTUTIL
* Subprograms called
* Required libraries
* File usage none
I
I
I
I
I
0
* * * * * * * * * * * * * * * * * *
*----------------------------------------------------------------------* SUBROUTINE SETPTD (IDOY,LAT,RF,RDD,TMDA,ETD)
IMPLICIT NONE
* Formal parameters
INTEGER IDOY
REAL LAT,RF,RDD,TMDA,ETD
* Local variables
REAL LHVAP,PSCH,SIGMA,PTFAC,VPSL,ANGOT,DATMTR,LIMIT
REAL RDLOI,RDLO,RDLII,RDLI,RDN
REAL DUMR1,DUMR2,DUMR3,DUMR4,DUMR5,DUMR6,DUMR7
PARAMETER (LHVAP
PARAMETER (PTFAC
2454.E3 I PSCH
1.42)
0.067, SIGMA 5.668E-8)
11-1
11-2
SAVE
* Checks
IF (RDD.LT.O.SE6) WRITE (*,I (1X,A,G12.5,A) ')
& 'WARNING from SETPTD: Low short-wave radiation =',RDD,' J/m2/d'
CALL SVPSl (TMDA, DUMRl, VPSL)
* Long-wave radiation (J/m2/s and J/m2/d) and net radiation
* according to Swinbank
CALL SASTRO (IDOY,LAT,
&
DATMTR
RDLOI
RDLII
RDLO
RDLI
RDN
DUMR1,ANGOT,DUMR2,DUMR3,DUMR4,DUMRS,DUMR6,DUMR7)
LIMIT (O.,l.,RDD/ANGOT)
SIGMA*(TMDA+273.16)**4
DATMTR*(5.31E-13*(TMDA+273.16)**6-RDLOI)/0.7+RDLOI
86400.*RDLOI
86400.*RDLII
(1.-RF)*RDD+RDLI-RDLO
* Priestley and Taylor reference evapotranspiration
ETD = PTFAC*(RDN*(VPSL/(VPSL+PSCH)))/LHVAP
RETURN
END
Appendix Ill: Module SETMKD (Makkink)
*----------------------------------------------------------------------*
* SUBROUTINE SETMKD (Subroutine Evap. Trans. MaKkink Daily)
* Authors: Daniel van Kraalingen
* Date 7-March-1997
* * *
*Version: 1.0 *
* Purpose: This subroutine calculates reference evapotranspiration *
* according to Makkink (1957) . To obtain crop evapo- * * *
transpiration, multiplication with a Makkink crop factor *
should be done. The use of this formula is basically limited*
* to areas with large amounts of radiation * * Refs. Kraalingen, D.W.G. van, W. Stol, 1997. Evapotranspiration * * modules for crop growth simulation. Quantitative Approaches *
* in Systems Analysis No. 11. DLO Research Institute for *
* Agrobiology and Soil Fertility (AB-DLO), The C.T. de Wit *
* * *
graduate school for Production Ecology (PE) . Wageningen.
The Netherlands.
* FORMAL PARAMETERS: (I=input,O=output,C=control,IN=init,T=time)
* name type meaning (units) class
* * RDD
* TMDA
* ETD
R4 Daily short-wave radiation (J.m-2.d)
* * Fatal
R4 24 hour average temperature (degrees C)
R4 Potential evapotranspiration (mm.d-1)
error checks none
* Warnings RDD < O.SE6
* Subprograms called SVPS1
* Required libraries none
* File usage none
I
I
0
* * * * *
*
*
*
* * * * *
*
*
*----------------------------------------------------------------------*
SUBROUTINE SETMKD (RDD, TMDA, ETD)
IMPLICIT NONE
* Formal parameters
REAL RDD, TMDA, ETD
* Local variables
REAL LHVAP, PSCH, VPS, VPSL, MAKFAC
PARAMETER (LHVAP
PARAMETER (MAKFAC
SAVE
* Checks
2454.E3, PSCH
0.63)
0.067)
IF (RDD.LT.O.SE6) WRITE (*,I (1X,A,G12.5,A) ')
& 'WARNING from SETMKD: Low short-wave radiation =',RDD,' J/m2/d'
111-1
111-2
* Calculate saturated vapour pressure
CALL SVPSl (TMDA, VPS, VPSL)
* Calculate Makkink evaporation, MAKFAC factor is calibrated for the
* Netherlands
ETD = MAKFAC*(RDD*(VPSL/(VPSL+PSCH)))/LHVAP
RETURN
END
IV-1
Appendix IV: Additional modules SASTRO, SVPS1
*----------------------------------------------------------------------* * SUBROUTINE SASTRO * * Authors: Daniel van Kraalingen * * Date 12-June-1996, Version: 1.1 * * Purpose: This subroutine calculates solar constant, daily * * extraterrestrial radiation, daylength and some intermediate *
* *
variables required by other routines. The routine has been * written such that latitudes from pole to pole can be used. *
* * * FORMAL PARAMETERS: (I=input,O=output,C=control,IN=init,T=time) * * name type meaning
* * IDOY I4 Day of year (Jan 1st 1)
* LAT R4 Latitude of the site
* SOLCON R4 Solar constant at day=IDOY
* ANGOT R4 Daily extraterrestrial radiation
* DAYL R4 Astronomical daylength (base = 0 degrees)
* DAYLP R4 Photoperiodic daylength (base = -4 degrees)
* DSINB R4 Daily total of sine of solar height
* DSINBE R4 Daily integral of sine of solar height
* * * SINLD
* COSLD
corrected for lower transmission at low
elevation
R4 Intermediate variable for subroutine SSKYC
R4 Intermediate variable for subroutine SSKYC
units class *
d
degrees
W/m2
J/m2/d
h
h
s
s
* I * I * 0 * 0 * 0 * 0 * 0 * 0 *
* *
0 * 0 *
* * * Fatal error checks: LAT > 90, LAT < -90 * * Warnings LAT above polar circle, LAT within polar circle * * Required libraries: TTUTIL * * File usage none * *----------------------------------------------------------------------*
&
&
SUBROUTINE SASTRO (IDOY LAT
IMPLICIT NONE
SOLCON, ANGOT I DAYL I DAYLP,
DSINB , DSINBE, SINLD, COSLD)
* Formal parameters
REAL LAT, SOLCON, ANGOT, DAYL, DAYLP, DSINB, DSINBE, SINLD, COSLD
INTEGER IDOY
* Local parameters
REAL AOB, PI, DEGTRAD, DOY, DEC, ZZCOS, ZZSIN, ZZA
SAVE
* PI and conversion factor from degrees to radians
PARAMETER (PI=3.1415927, DEGTRAD=0.017453292)
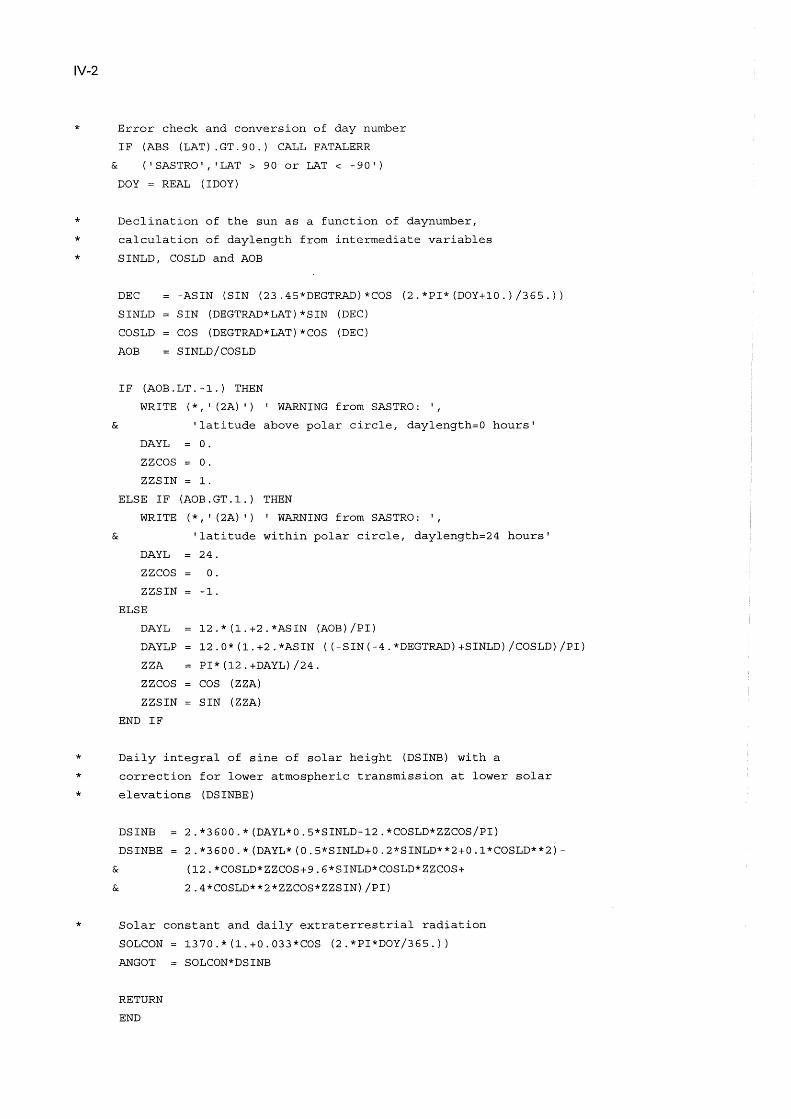
IV-2
* Error check and conversion of day number
IF (ABS (LAT) .GT.90.) CALL FATALERR
& ('SASTRO', 'LAT > 90 or LAT < -90')
DOY = REAL (IDOY)
* Declination of the sun as a function of daynumber,
* calculation of daylength from intermediate variables
* SINLD, COSLD and AOB
DEC
SINLD
COSLD
AOB
-ASIN (SIN (23.45*DEGTRAD)*COS (2.*PI*(DOY+10.)/365.))
SIN (DEGTRAD*LAT)*SIN (DEC)
COS (DEGTRAD*LAT)*COS (DEC)
SINLD/COSLD
IF (AOB.LT.-1.) THEN
WRITE (*,' (2A) ') ' WARNING from SASTRO: ',
& 'latitude above polar circle, daylength=O hours'
DAYL 0.
zzcos 0.
ZZSIN 1.
ELSE IF (AOB.GT.1.) THEN
WRITE (*,' (2A) ') ' WARNING from SASTRO: ',
&
DAYL
zzcos ZZSIN
ELSE
DAYL
DAYLP
ZZA
zzcos ZZSIN
END IF
'latitude within polar circle, daylength=24 hours'
24.
0.
-1.
12.*(1.+2.*ASIN (AOB)/PI)
12.0*(1.+2.*ASIN ((-SIN(-4.*DEGTRAD)+SINLD)/COSLD)/PI)
PI*(12.+DAYL)/24.
COS (ZZA)
SIN (ZZA)
* Daily integral of sine of solar height (DSINB) with a
* correction for lower atmospheric transmission at lower solar
* elevations (DSINBE)
&
&
DSINB
DSINBE
2.*3600.*(DAYL*0.5*SINLD-12.*COSLD*ZZCOS/PI)
2.*3600.*(DAYL*(0.5*SINLD+0.2*SINLD**2+0.1*COSLD**2)
(12.*COSLD*ZZCOS+9.6*SINLD*COSLD*ZZCOS+
2.4*COSLD**2*ZZCOS*ZZSIN)/PI)
* Solar constant and daily extraterrestrial radiation
SOLCON 1370.*(1.+0.033*COS (2.*PI*DOY/365.))
AN GOT
RETURN
END
SOLCON*DSINB
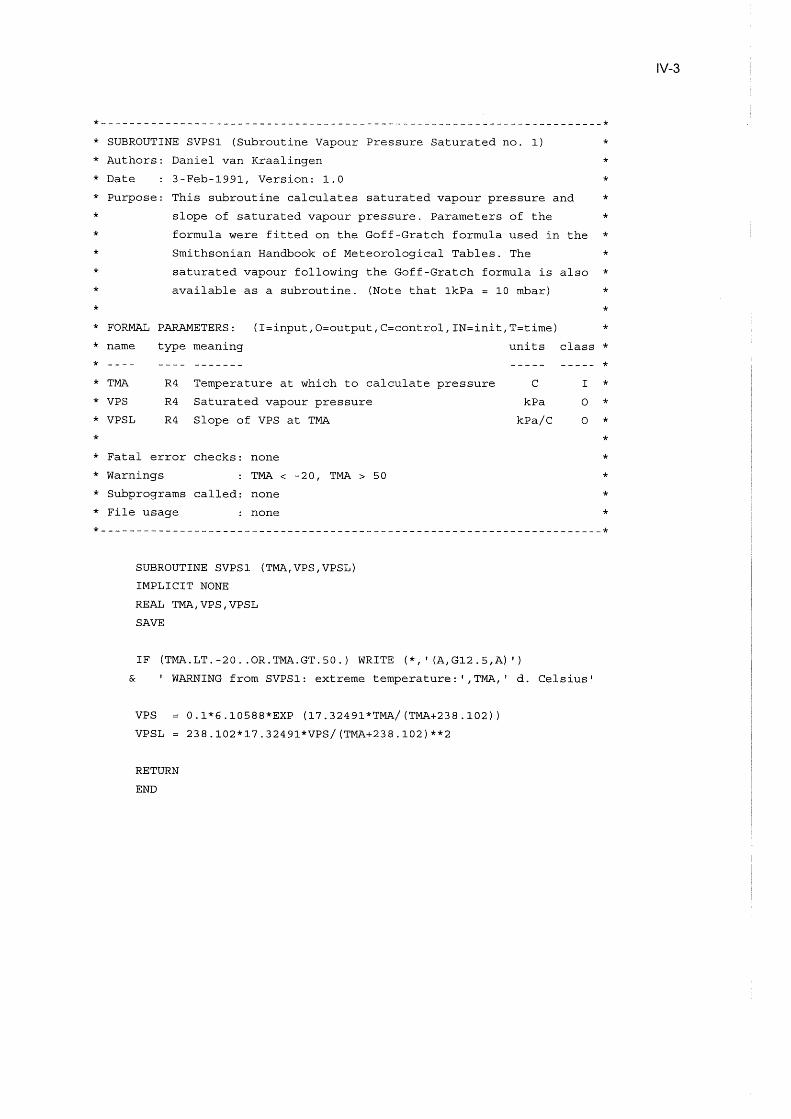
*---------------------------------------------------- -----------------* * SUBROUTINE SVPS1 (Subroutine Vapour Pressure Saturated no. 1) *
* Authors: Daniel van Kraalingen *
* Date 3-Feb-1991, Version: 1.0 *
* Purpose: This subroutine calculates saturated vapour pressure and *
* * * * *
slope of saturated vapour pressure. Parameters of the *
formula were fitted on the Goff-Gratch formula used in the *
Smithsonian Handbook of Meteorological Tables. The *
saturated vapour following the Goff-Gratch formula is also *
available as a subroutine. (Note that 1kPa = 10 mbar) *
* * * FORMAL PARAMETERS: (I=input,O=output,C=control,IN=init,T=time) * * name type meaning units class *
* * TMA
* VPS
* VPSL
*
R4 Temperature at which to calculate pressure
R4 Saturated vapour pressure
R4 Slope of VPS at TMA
* Fatal error checks: none
* Warnings TMA < -20, TMA > 50
* Subprograms called: none
* File usage none
c kPa
kPa/C
* I * 0 * 0 *
* * * * *
*----------------------------------------------------------------------*
SUBROUTINE SVPS1 (TMA,VPS,VPSL)
IMPLICIT NONE
REAL TMA,VPS,VPSL
SAVE
IF (TMA.LT.-20 .. OR.TMA.GT.SO.) WRITE (*,I (A,G12.5,A) ')
& ' WARNING from SVPS1: extreme temperature:' ,TMA,' d. Celsius'
VPS 0.1*6.10588*EXP (17.32491*TMA/(TMA+238.102))
VPSL
RETURN
END
238.102*17.32491*VPS/(TMA+238.102)**2
IV-3