Embed Size (px)
Citation preview

Evapotranspiration and GroundwaterA Brief Overview
John WheatonMontana Bureau of Mines and GeologyPresented to:Water Policy Interim CommitteeHelena March 11, 2010

Some People we are working with:
MBMG – Elizabeth MeredithGary Icopini
MSU – Clayton Marlow
Monitoring Well In Salt Cedar stand
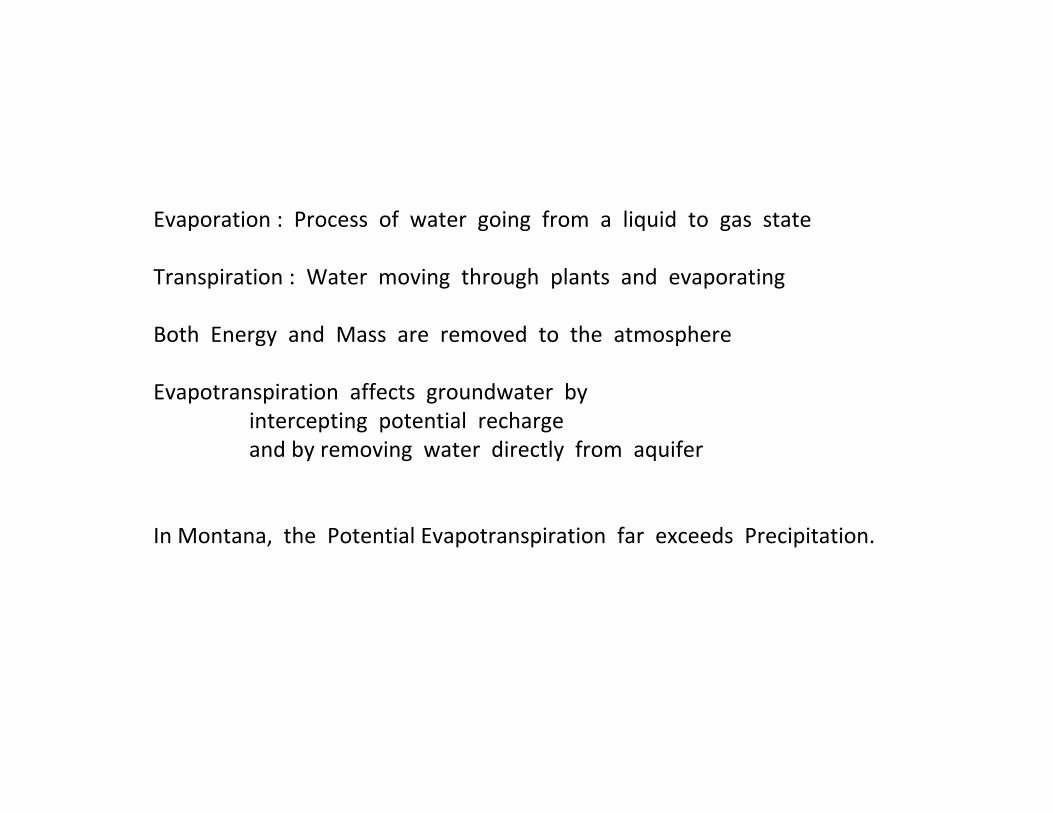
Evaporation : Process of water going from a liquid to gas state
Transpiration : Water moving through plants and evaporating
Both Energy and Mass are removed to the atmosphere
Evapotranspiration affects groundwater by intercepting potential rechargeand by removing water directly from aquifer
In Montana, the Potential Evapotranspiration far exceeds Precipitation.
NATIONAL WEATHER SERVICE OFFICE OF HYDROLOGY
HYDROLOGIC RESEARCH LABORATORY
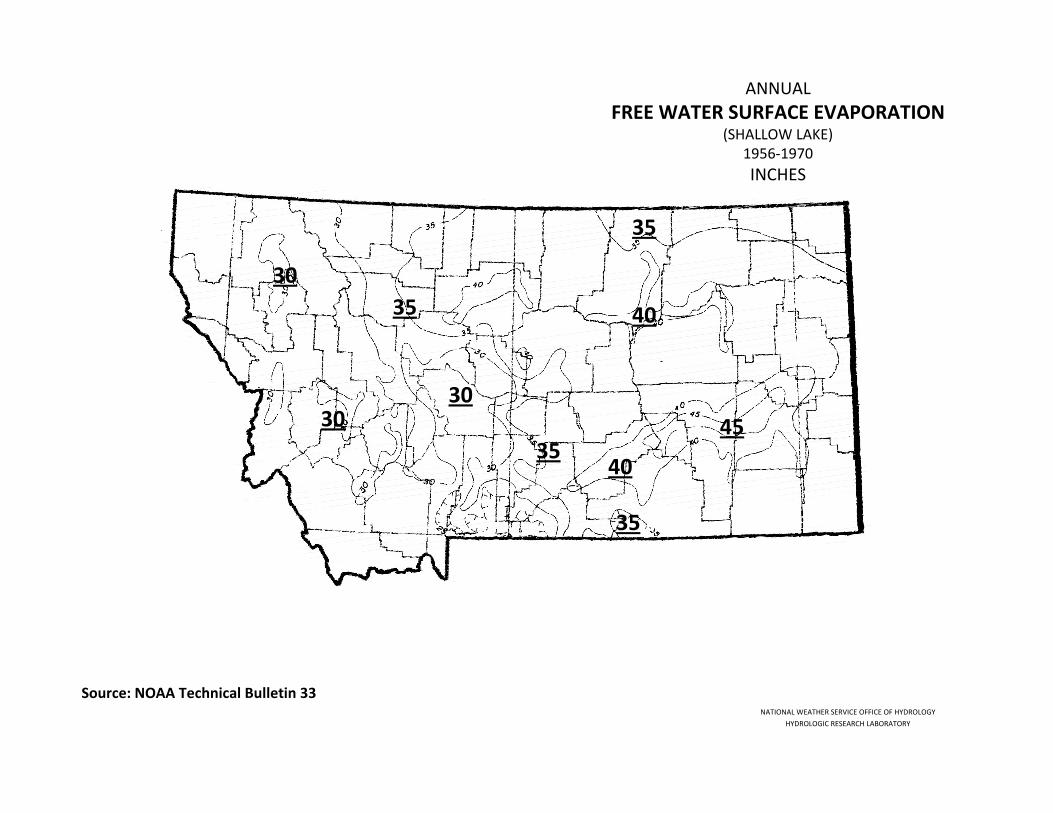
ANNUALFREE WATER SURFACE EVAPORATION
(SHALLOW LAKE)1956‐1970INCHES
Source: NOAA Technical Bulletin 33
35
40
40
45
35
35
35
30
30
30

Source: Western Regional Climate Center
http://www.wrcc.dri.edu/pcpn/mt.gif
10 ‐ 14
14 ‐ 18

Floating Class A pan
Measuring Free – Water
Surface Evaporation

Free Water Surface Evaporation ExampleMine Pit Impoundment in eastern MontanaMeasured with floating pan Annual Total : 3.19 ft
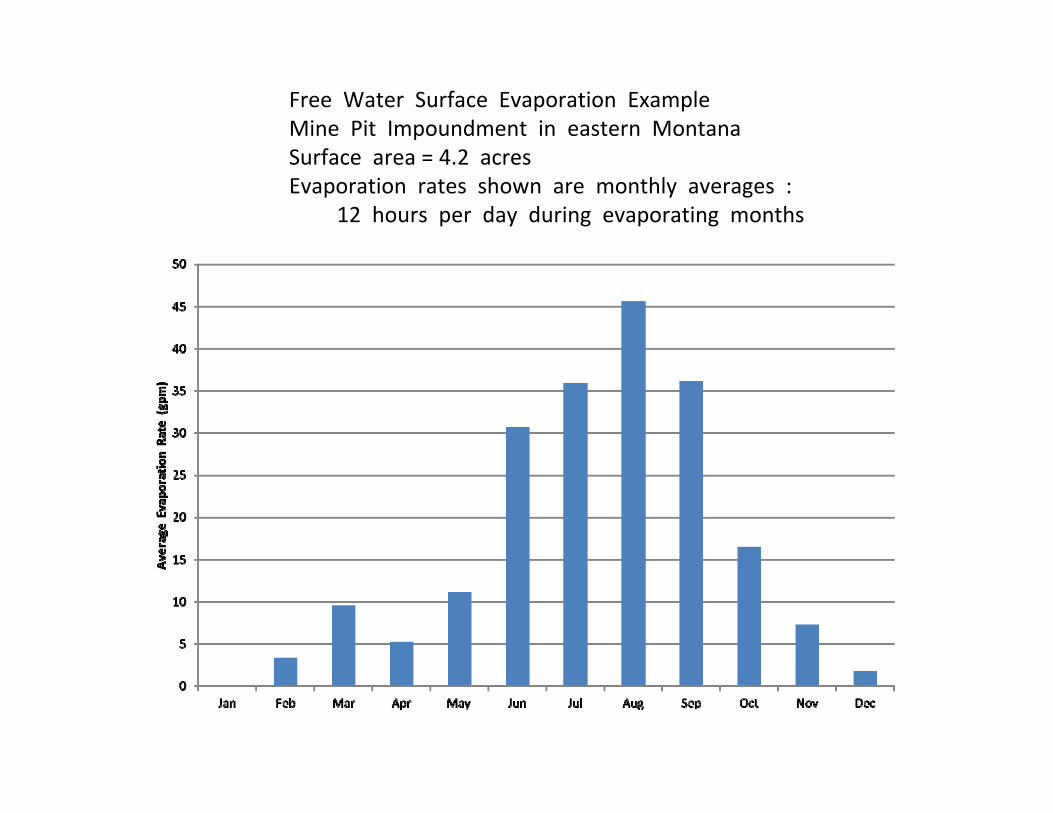
Free Water Surface Evaporation ExampleMine Pit Impoundment in eastern MontanaSurface area = 4.2 acresEvaporation rates shown are monthly averages :
12 hours per day during evaporating months

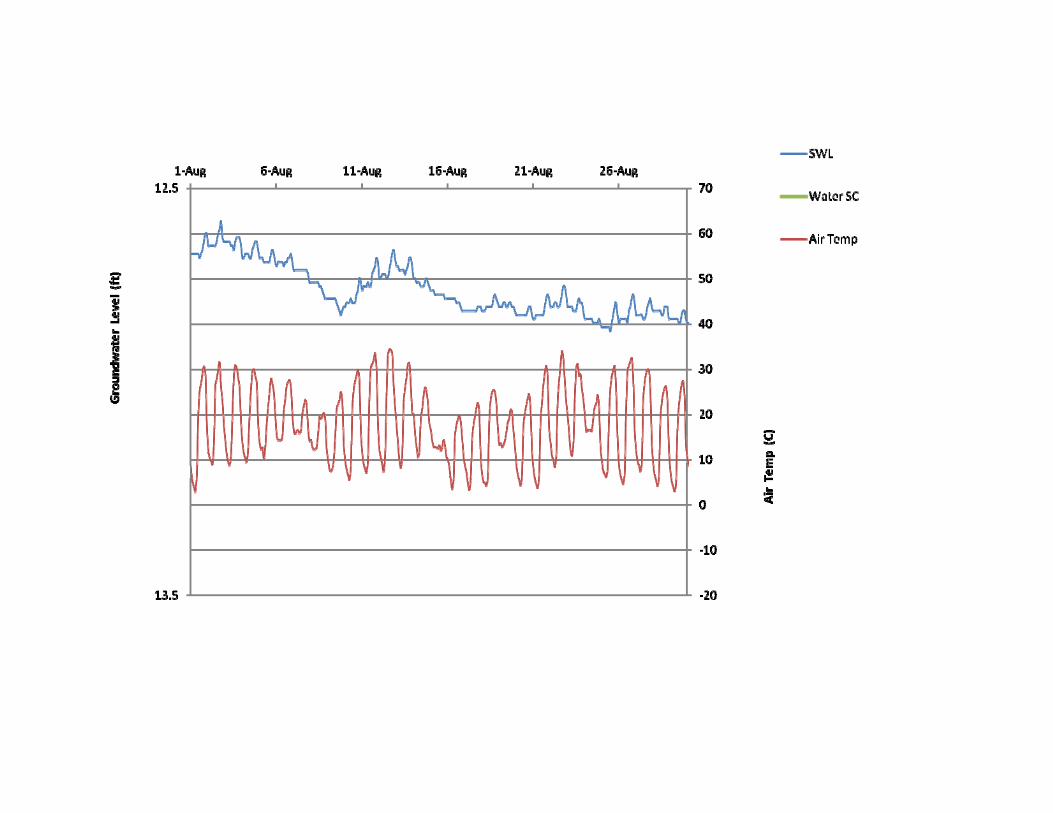
Some results of impact to surface water and groundwater reservoirs

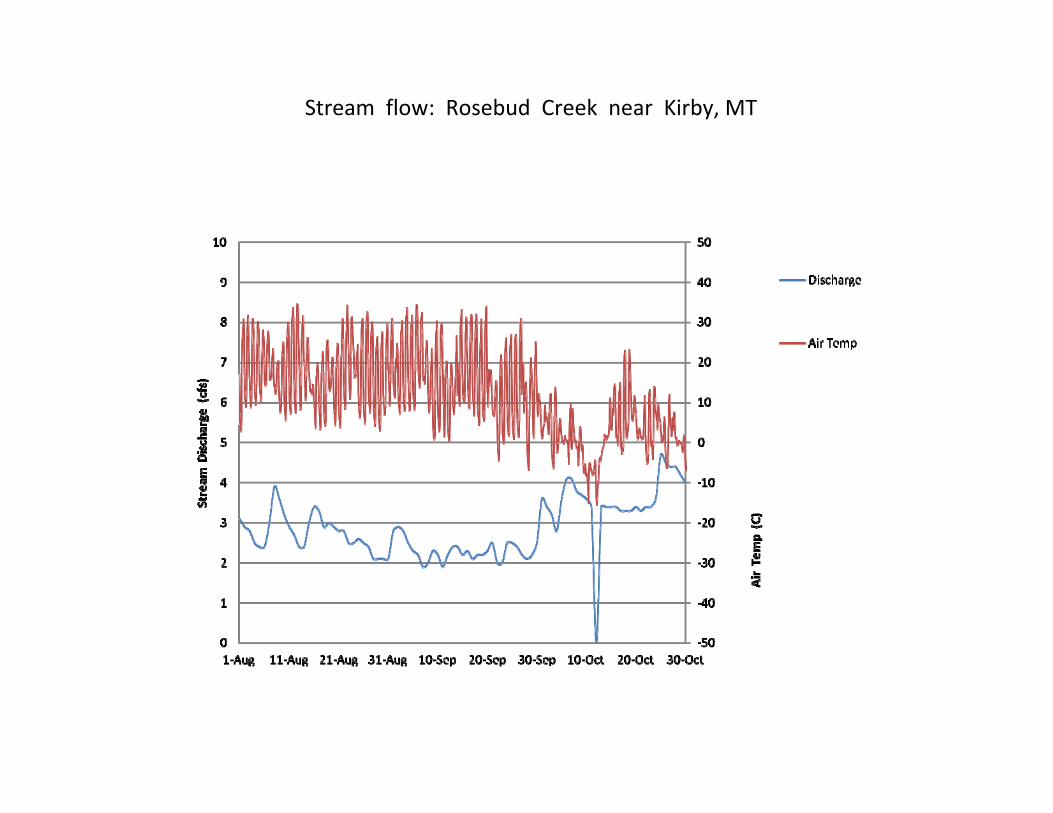
Stream flow: Rosebud Creek near Kirby, MT

Specific conductivity of groundwater

Missouri Breaks (Roy)Clayton Marlow (MSU)
Average Seasonal Groundwater Response to Prescribed Fire
-160.0
-140.0
-120.0
-100.0
-80.0
-60.0
-40.0
-20.0
0.0
2002 2003 2004 2005 2006
Date
Dep
th to
Gro
undw
ater
(cm
)
Up ControlLow ControlBU1BU2BU3BU4

Ashland Ranger DistrictSpring Inventory : 2002 & 2003435,000 acresPrecipitation : 16 inches per yearPotential Evaporation : 40 inches per yearLivestock : 20,500


Spring Discharge Count, Ashland Ranger District : 409
125 Or 31 % Q = 0 gpm

Ashland Ranger District Water
Evapotranspiration Precipitation
Groundwater (in)Groundwater (out)
Surface water (out)
Recharge
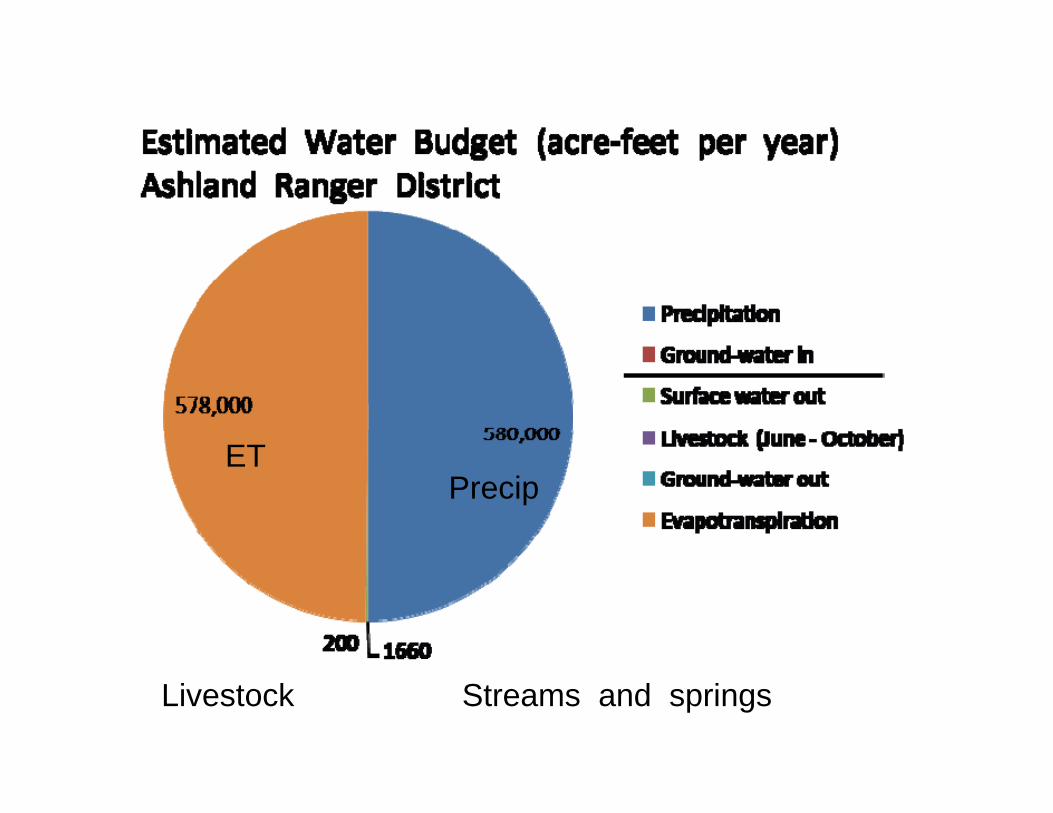
Livestock Streams and springs
ETPrecip
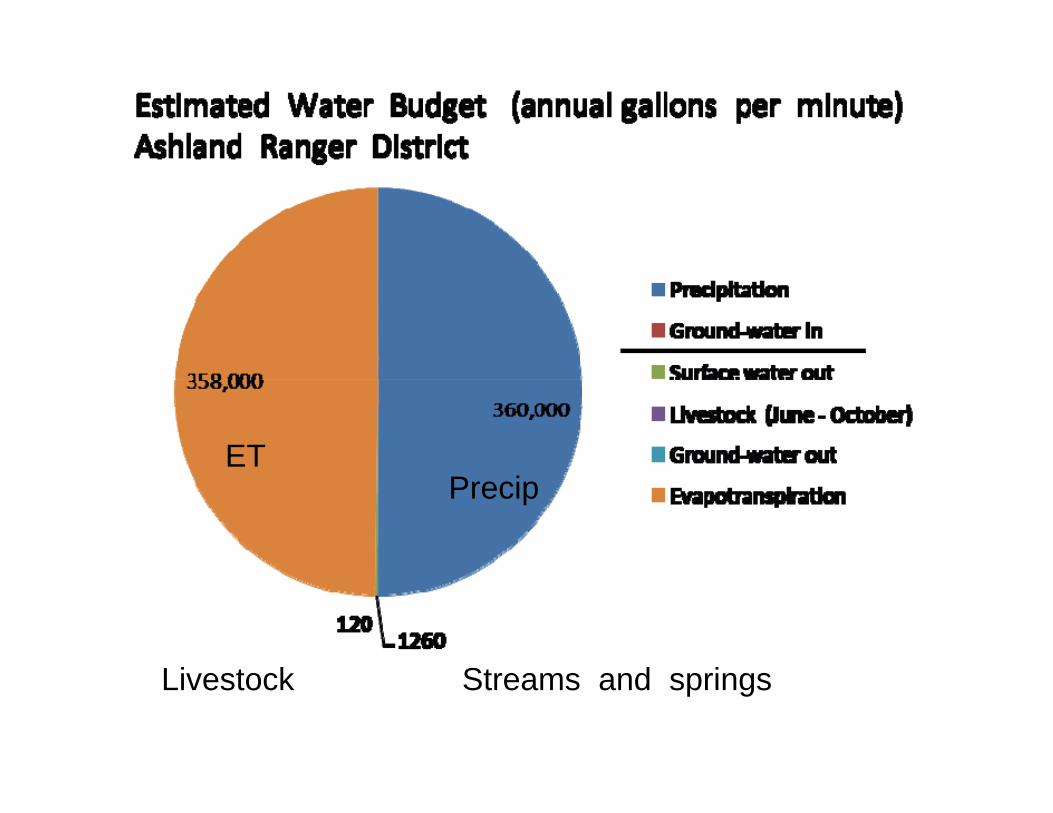
Livestock Streams and springs
ETPrecip

Conclusion:
We need to recognize the role of transpiration in:
Stream flow
Spring flow
Aquifer recharge
Aquifer depletion