Embed Size (px)
Citation preview

Salinization in semi arid irrigated regionsof ArgentinaDr. E.P. Querner
• Salinization process
• Salinization in Argentina
• Hydrological modelling using SIMGRO
• Model application: Mendoza region
• Conclusions
Contents

Hydrological processes at the soil surface

Why does soils get saline
Vineyard affected by salts no problems

Region Area (mln ha)Africa 69.5Near and Middle East 53.1Asia and Far East 19.5Latin America 59.4Australia 84.7North America 16.0Europe 20.7_________________________________Irrigated area world wide 275.0
Salinised soils in the world
Salinity is measured in electric conductivity of a saturated extract of the soil sampleexpressed as:EC – Electrical Conductivity (dS/m)
(deci Siemens per meter)Fresh water: EC < 0.5 dS/mSaline soil: EC 4 – 8 often results in yield depression
(less crop production)Some crops like barley are salt tolerant (EC < 12=16)
Salinity

Salinization (salt accumulation) can take place both at relatively shallow and deep groundwater tables.
Salinity movement in the soil
How to estimate salinity (1)• Make a water balance of the water flowsAssign an EC to each flow

How to estimate salinity (2)
Make use of a hydrological modelEC is regarded as a conservative matter(as a tracer)
Requirements for a modelling approach
• Physically based ( a white box )
Not a conceptual or lumped model ( a grey box )
• Simulate processes as accurately as possible
• Not too much input data
• Modular set=up
• Applicable practical problems and hydrological research

Hydrological model: model? SWAT (not yet) or SIMGRO (yes)
Root zone
Capillary rise or deep percolation
1st aquifer
2nd aquifer
Aquitard (less permeable layer)
Hydrological base
Irrigationsystem
Soil use
Drainagesystem
Surface drainage
Sub surface drainage
Prescribed flux or level
Sub region
border
Sub region
border
For irrigated systems

Discretisation
Model areaSubcatchment
Nodes
Subcatchments: Surface waterNodes: Groundwater
Unsaturated zone

Sub=soil salinity transport (SIMGRO model)
Interaction surface water = groundwater

SIMGRO/AlterrAqua
Digital input data
GIS=application:
AlterrAqua
Presentation of input data
Calculation with SIMGRO
Results
Presentation of results:• Groundwater levels and river flows
• Evapotranspiration (potential and actual)
• Etc.
Example input data
Watercourses
Subcatchments
DTM
Sewer catchments
Culverts
Weirs
Land-use
Topographic. data
Country Name DescriptionPoland Biebrza wetland Management tool for analysis of
measures to ensure a sustainable situation of this wetland
Brazil Pantanal=Taquari Determine the impact of climate change and land use changes
Lithuania Dovine Basin To support the design of an integrated restoration and management plan
South Africa Limpopo and Small holder farming. Effect ofLetaba upstream water use on down=
stream nature areas
Some case studies carried out with Simgro model to support policy making
Argentina
Irrigated area in Argentina 1.35 mln ha (4.1% of country)20% of irrigated land is in Prov. of Mendoza
70% irrigated with surface water21% sprinkler irrigation9% drip irrigation

Mendoza Province
�
�
�
�
�
�
��
��
MENDOZA RIVER IRRIGATED AREA
Irrigation water is allocated according to area with water rights
Problems- water shortage (dry years)- supplementary groundwater use- over-irrigation (wet years)- high water tables- soil salinization- crop productivity reduction- environmental degradation

Lower Tunuyan
Upper Tunuyan
Mendoza River

Irrigation network
Sometimes quite complex
Irrigation by flooding

Irrigation of crops
Saline soils
Mendozacity
MENDOZA RIVER BASINSalinity modelling
Potrerillos new reservoir
Andes
Mendoza river
Mendozairrigated system

Question to be addressed by INA=CRA1. What will be the consequences in the irrigated area of
Mendoza River because of the construction of Portrerillosdam in the Andes mountains
2. Will the salinity level increase
Consequence of building the dam
1. Sediments are trapped in the dam2. The irrigation water will be clear (no sediments)3. Unlined canals will have less sediments on the
bottom, thus the canals are more permeable and water can percolate to the groundwater
4. Groundwater levels become higher5. More capillary rise6. Consequence higher salinity
Objectives of study
To analyse basin behaviour because of construction Potrerillosstorage dam:• Hydrology (surface water and groundwater )• Salt balance (soil & water)
• SIMGRO model calibration in the area irrigated by Mendoza river
• Performance indicators are used to quantify & qualify the irrigation and drainage water use
• Give present situation and after dam constructed
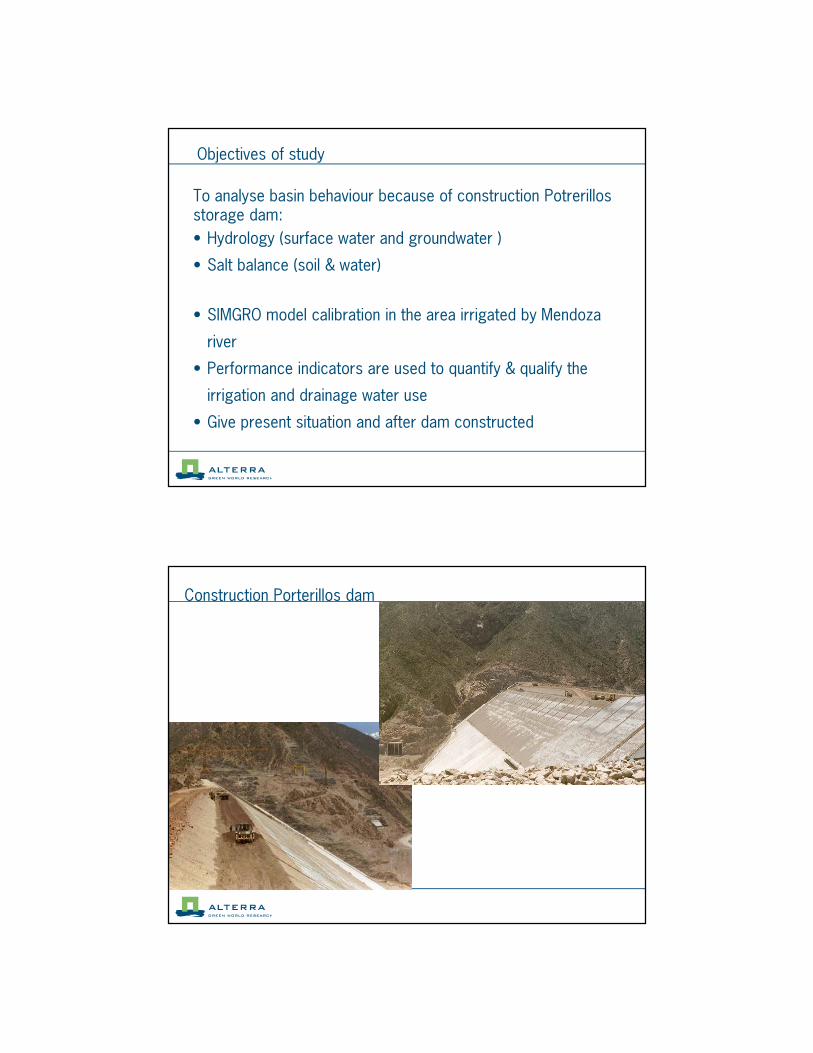
Construction Porterillos dam

Portrerillos dam
Before and after construction of the dam
Before:
After:

Irrigation canals
Tertiary and drainage canal

Irrigated area of Mendoza River
Image land=use
Areas irrigated by Mendoza and Tunuyan River

False color (red means irrigated land) Zones
Modelling area
Modelling area was based on the irrigated areas (area 3400 km2)

Irrigation and drainage canals plus natural streams
References
N
Projet Area
Natural StreamRiverDrainage System
Superficial Drainage System
Irrigation System
Río MendozaRío Tunuyán Poligonos Subrregiones Modelo SimgroCanales 1º TunuyánDrenes Tunuyán
Riego y Drenaje
N
1:750000
Subregiones Modelo Simgro
10 0 10 20 Kilometers
• Nodes: 3685• Distance: 1000 m * 1000 m• Elements: 6986• Subregions: 124• 3 aquifers and 2 aquitards
Land use:• grapes & fruit trees• olives• summer vegetables• winter vegetables• grass• fallow• urban area
SIMGRO model

Finite element network and the irrigation canalsNetwork has 3685 nodal points;approx. 1000 m apart
SERIES DE SUELOSI - Compuertas MaipúII - Ciudad - Agrelo - RodeoIII - Corralitos - BarcalaIV - El Sauce - JocolíV - LavalleVI - Tres Porteñas
#
#
#
##
#
#
#
#
##
#
#
#
#
#
#
##
##
#
#
#
#
#
#
##
#
##
#
#
#
#
#
##
#
#
#
#
##
#
#
#
#
#
#
#
#
#
#
#
#
#
#
#
#
#
#
##
#
#
#
#
#
#
#
##
# ##
##
#
# #
#
###
#
#
#
#
#
#
#
#
#
#
#
#
#
#
##
#
#
#
#
#
#
#
#
#
##
#
#
#
#
#
# #
# #
#
#
#
#
#
#
##
#
#
#
#
#
#
#
#
#
#
#
#
#
#
#
#
#
#
#
#
# #
#
#
#
#
#
#
#
##
#
#
#
#
#
#
#
#
##
#
#
#
# #
#
#
#
##
#
#
# #
#
##
#
#
#
#
#
#
#
###
#
#####
#
#
##
##
# #
#
#
#
#
#
#
#
#
#
#
#
#
#
#
# #
#
#
#
#
#
##
#
#
#
#
#
#
##
#
#
#
##
#
# # #
#
#
#
#
#
##
#
#
###
###
##
### #
##
#
##
#
#
##
#
#
#
#
#
# #
#
#
#
##
#
#
#
#
#
#
#
#
#
#
#
#
#
#
#
#
#
#
#
#
#
#
#
#
#
#
#
#
##
#
#
#
#
#
#
#
#
##
#
#
#
#
#
#
#
##
#
#
#
#
# #
#
#
#
#
#
#
#
#
#
#
#
# # ##
#
##
#
#
#
#
# #
###
#
#
##
#
#
#
#
#
#
#
#
#
# #
#
#
##
#
##
#
#
#
#
#
###
#
#
#
##
#
#
#
#
#
#
# #
#
#
#
#
#
#
#
##
#
#
#
#
#
#
#
#
#
#
##
#
#
#
#
#
#
#
#
##
#
#
#
#
#
#
# #
#
#
#
#
#
#
#
#
#
#
##
#
#
#
#
#
#
##
#
# ##
#
#
#
#
#
#
#
##
#
#
#
###
# #
#
#
#
###
#
# #
# ##
#
##
##
#
# #
#
#
##
#
#
##
#
#
#
#
#
#
#
#
#
#
#
#
##
#
#
##
#
#
##
#
#
#
# #
#
#
#
#
#
#
#
#
#
#
#
#
#
#
#
References
N
Projet Area# Well Network
Soil type: meanbasic infiltration 1.3 – 7.3 mm.h-1
Groundwater pumping wells in the area

• To evaluate changes and feasibility of mitigation measures
• Performance indicators should include water delivery, water use efficiency, maintenance, irrigation sustainability, environmental aspects, socio=economics and management.
Performance indicators
Performance indicators used• Relative evapotranspiration (RET): ratio between actual and
potential evapotranspiration. It reflects to what an extent thepotential evapotranspiration is met, and influences crop yield.
• Depleted fraction (DF): relates water balance parameters for anirrigated area with each other in such a way that the managerknows the rate of change of groundwater level.
c
actualF VP
ETD
+=
ETactual : actual evapotranspiration by irrigated cropsP : precipitationVc : volume of irrigation by surface= and groundwater

0
20
40
60
80
100
120
140
sep oct nov dec jan feb mar apr
ET
(m
m/m
onth
)
Grape measured Grape simulated subregion 403
MODEL CALIBRATION
The model was calibrated using groundwater levels, evapotranspiration, and salinity for 94/95 growing season.
Groundwater depth at node 2391
-2.5
-2.0
-1.5
-1.0
-0.5
0.0
Ene-94 Abr-94 Jul-94 Oct-94 Feb-95 May-95
Time (month)
GW
dep
th (
m)
2391 measured 2391 simulated

Simulated and measured soil electrical conductivity (salinity) at grape root zone subregion 408 (growing season 90-95)
0.0
1.0
2.0
3.0
4.0
5.0
6.0
7.0
May/90 May/91 May/92 May/93 May/94 May/95
EC
e (d
S.m
-1)
cultivated measured max cultivated measured min grape simulated
Simulated and measured soil electrical conductivity (salinity) at root zone in different irrigated crops (growing season 90-95).
1.0
2.0
3.0
4.0
5.0
6.0
7.0
8.0
9.0
May/90 May/91 May/92 May/93 May/94 May/95
Time (month)
EC
e (d
S.m
-1)
cultivated measured max cultivated measured min olive simulated summer vegetables simulatedwinter vegetables simulated grass simulatedgrape simulated

0.0
0.1
0.2
0.3
0.4
0.5
0.6
0.7
0.8
0.9
1.0
May-90 Nov-90 May-91 Nov-91 May-92 Nov-92 May-93 Nov-93 May-94 Nov-94 May-95
Rel
ativ
e E
T
agricultural technologies
Relative evapotranspiration (RET) of agricultural technologies
RESULTS OF PERFORMANCE INDICATORS
y = -0.2371x + 0.1418
-0.20
-0.10
0.00
0.10
0.20
0.30
0.40
0 0.1 0.2 0.3 0.4 0.5 0.6 0.7 0.8 0.9 1 1.1
Depleted fraction
Cha
nge
of g
roun
dwat
er ta
ble
(m/m
onth
)
Rate of change of groundwater table as a function of depleted fraction

0.0
1.0
2.0
3.0
4.0
5.0
6.0
7.0
May/90 May/91 May/92 May/93 May/94 May/95
EC
e (d
S.m
-1)
measured max measured min S-1 S-0
SCENARIO ANALYSIS
S0: present situation - S1: new scenario (more infiltration from the river bed and irrigation canals)
Rel. evapotranspiration of agricultural land
S0: present situation and S1: new scenario
SCENARIO ANALYSIS

Conclusions and recommendations� SIMGRO can be used in situations where changing conditions affectthe hydrological system
� Irrigation practices can be simulated for a number of years withchanging meteorological conditions and irrigation depths
� The increase of infiltration losses in the riverbed and canals willresult in a rise of the groundwater table
� In the lower part of the basin a significant increment in salinity canbe expected
� Future modelling must reveal an improved water distributionscheme using the performance indicators as a reference