Embed Size (px)
Citation preview
CSG 15 (9/01) 1
DEPARTMENT for ENVIRONMENT, FOOD and RURAL AFFAIRS CSG 15 Research and Development
Final Project Report (Not to be used for LINK projects)
Two hard copies of this form should be returned to: Research Policy and International Division, Final Reports Unit DEFRA, Area 301 Cromwell House, Dean Stanley Street, London, SW1P 3JH. An electronic version should be e-mailed to [email protected]
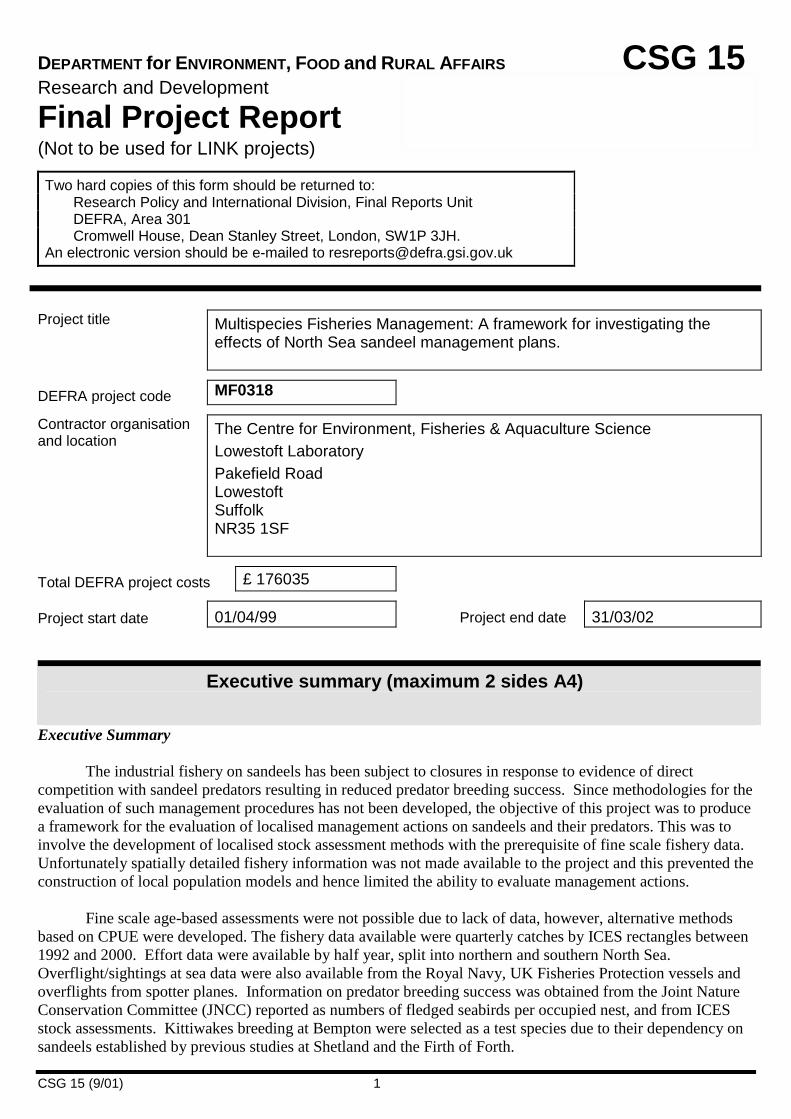
Project title Multispecies Fisheries Management: A framework for investigating the effects of North Sea sandeel management plans.
DEFRA project code MF0318
Contractor organisation and location
The Centre for Environment, Fisheries & Aquaculture Science Lowestoft Laboratory Pakefield Road Lowestoft Suffolk NR35 1SF
Total DEFRA project costs £ 176035
Project start date 01/04/99 Project end date 31/03/02
Executive summary (maximum 2 sides A4)
Executive Summary The industrial fishery on sandeels has been subject to closures in response to evidence of direct
competition with sandeel predators resulting in reduced predator breeding success. Since methodologies for the evaluation of such management procedures has not been developed, the objective of this project was to produce a framework for the evaluation of localised management actions on sandeels and their predators. This was to involve the development of localised stock assessment methods with the prerequisite of fine scale fishery data. Unfortunately spatially detailed fishery information was not made available to the project and this prevented the construction of local population models and hence limited the ability to evaluate management actions.
Fine scale age-based assessments were not possible due to lack of data, however, alternative methods based on CPUE were developed. The fishery data available were quarterly catches by ICES rectangles between 1992 and 2000. Effort data were available by half year, split into northern and southern North Sea. Overflight/sightings at sea data were also available from the Royal Navy, UK Fisheries Protection vessels and overflights from spotter planes. Information on predator breeding success was obtained from the Joint Nature Conservation Committee (JNCC) reported as numbers of fledged seabirds per occupied nest, and from ICES stock assessments. Kittiwakes breeding at Bempton were selected as a test species due to their dependency on sandeels established by previous studies at Shetland and the Firth of Forth.
Project title
Multispecies Fisheries Management: A framework for investigating the effects of North Sea sandeel management plans.
DEFRA project code
MF0318
CSG 15 (9/01) 2
Spatio-temporal analysis of vessel sightings showed variability in the spatial pattern of fleet deployment around the Dogger Bank between months and years. Overflight data were used to estimate localised sandeel fishing effort and was subsequently combined with catch data (by ICES rectangle) to provide a proxy for local sandeel abundance (CPUE). Comparison of CPUE for three contiguous ICES rectangles over the period 1992 to 2000 revealed considerable interannual variation among the three ICES rectangles reflecting the patchy nature of sandeel stocks and the variable patterns of fishing vessel deployment. These results highlight the need for assessments of population and fishery dynamics on a patch by patch basis. The impact of sandeel fishing activity on kittiwake breeding success was examined at three spatial ranges using the finest scale overflight data. There were no significant relationships between breeding success and fishing activity (sightings, CPUE or landings) within 50, 100 and 200km of the colony. An alternative analysis was made which utilised all overflight data at the ICES rectangle within approximately 100km. Again, there was no statistically significant relationship with fishing intensity over the period 1986 to 1999. The coarse nature of the available fishery data and lack of age disaggregation may, however, mask any effects of the industrial fishery. This study should not be taken as definitive proof of a lack of impact by industrial fishing upon kittiwake breeding success at the Bempton colony. The impact of sandeel fishing activity on predatory fish was constrained due to the lack of a time series of dietary data. ICES year of the stomach data showed high levels of sandeel usage outside the main fishery areas, possibly indicating the presence of unfished sandeel patches. These patches may buffer predator stocks from the effects of the fishery, but require fishery independent data for confirmation. At a coarser scale, North Sea cod recruitment was found to be correlated to the sandeel stock, sandeel landings and sandeel recruitment. At present it is unclear as to whether these apparent relationships are caused by direct biological interaction, fishery impact or a common environmental driver and further analysis with finer scale data is required before causality can be confirmed. In order for the potential interspecific relationships described by this project to be investigated further, fine scale fishery and fishery independent data should be acquired.
Project title
Multispecies Fisheries Management: A framework for investigating the effects of North Sea sandeel management plans.
DEFRA project code
MF0318
CSG 15 (9/01) 3
Scientific report (maximum 20 sides A4) This report should be ideally printed in colour to obtain benefit from the maps it contains.
1. Introduction and Objectives
An industrial fishery for sandeels, i.e. where landings are processesed for fish meal and fish oil rather than human consumption, commenced in the 1950s at a low level (100-200 thousand tonnes). The 1970s saw a rapid expansion of the fishery which currently takes an average of approximately 750 thousand tonnes, but has peaked at over 1 million tonnes three times . An average of 250,000 tonnes of the North Sea sandeel landings (approximately 30%) come from the Dogger Bank region, principally the western edge. Sandeels from this area are a potential resource for a number of seabird and seal colonies as well as predatory fish. The impact of this level of fishing activity on the local sandeel population structure or their predators has not been assessed, so the fishery at this location was chosen for analysis.
The ecology of sandeels is atypical of marine fish. There are several species of sandeel found in the
North Sea of which Ammodytes marinus is by far the most common and the term “sandeel” is used throughout the report to refer to A. marinus . Sandeels are small (up to 20cm) fish with a relatively short lifespan, in unfished areas individuals can live up to 8 years, but within the North Sea individuals over the age of 4 are rare. As their name suggests, sandeels spend a large proportion of the time buried in sand, emerging only to feed or reproduce. Feeding emergence generally occurs between April and July where they emerge just prior to dawn (Winslade 1974) and return to the sediment when either satiated or daylight fades. The seasonal pattern of feeding emergence varies with location, whilst spawning appears to occur in a relatively narrow window in early January. After hatching, the larval sandeels are highly mobile and are distributed by oceanic currents. This provides the mechanism for recruitment to sandeel banks within regions although there is relatively little exchange between regions (Wright et al, 1998). Once pre-settled sandeels locate suitable habitat they settle out and subsequently do not appear to undergo large scale migrations (Kunzlik et al, 1986).
Although sandeels are one of the most abundant fish in the North Sea their spatial distribution is very
patchy. The principal limitation to sandeel distribution is the presence of suitable sediment, sandeels have specific requirements regarding sediment and prefer coarse sand with a maximum of 10% silt (Wright et al, 1998). The secondary limitation to sandeel distribution appears to be the presence of hydrodynamic fronts which are linked to high planktonic productivity.
Industrial fisheries for sandeel have been implicated in the decline of breeding success of kittiwakes around Shetland and the Firth of Forth (Wee Bankie/Marr Bank fishing grounds) resulting in localised management action. At Shetland a series of seasonal closures were introduced in 1989 until 1991 when a complete closure was established. The fishery has been operating on a restricted basis (7,000 tonnes) since 1995. At the Wee Bankie/Marr Bank grounds, a 3 year closure to industrial fishing was introduced following a series of poor breeding successes for kittiwakes on local colonies (i.e. Isle of May). This closure has been in force since 2000, although a monitoring fishery has been conducted for up to 20 boat days to ensure continuity of CPUE series. Both of these fisheries operated within the foraging ranges of seabirds from their breeding colonies.
In order for the impact of management actions on sandeel populations and their predators to be
evaluated at localised scales, methodology for the local assessment of sandeel populations is required. The current assessment methodology used by ICES for sandeels in the North Sea assumes a single population, although Pedersen, Lewy and Wright (1999) suggest that there may be 6 sub-stocks with limited interchange. Even this level of disaggregation may be insufficient if predators are dependent on particular patches.
Project title
Multispecies Fisheries Management: A framework for investigating the effects of North Sea sandeel management plans.
MAFF project code MF0318
4
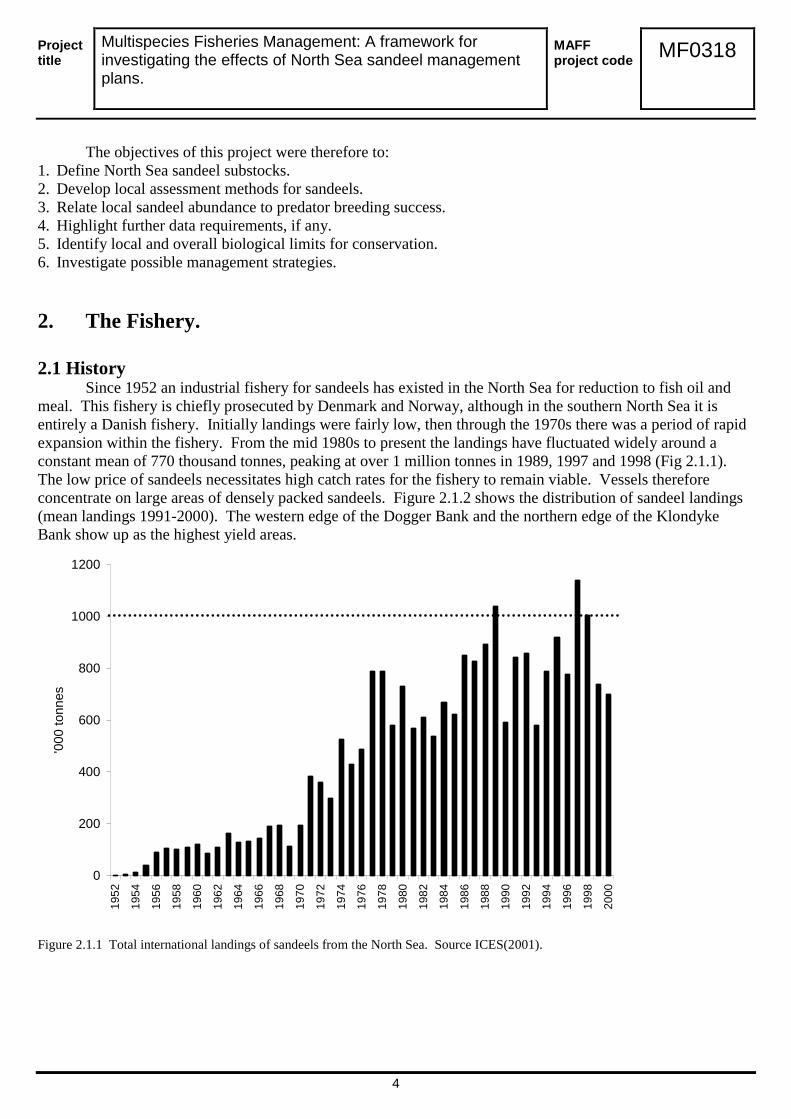
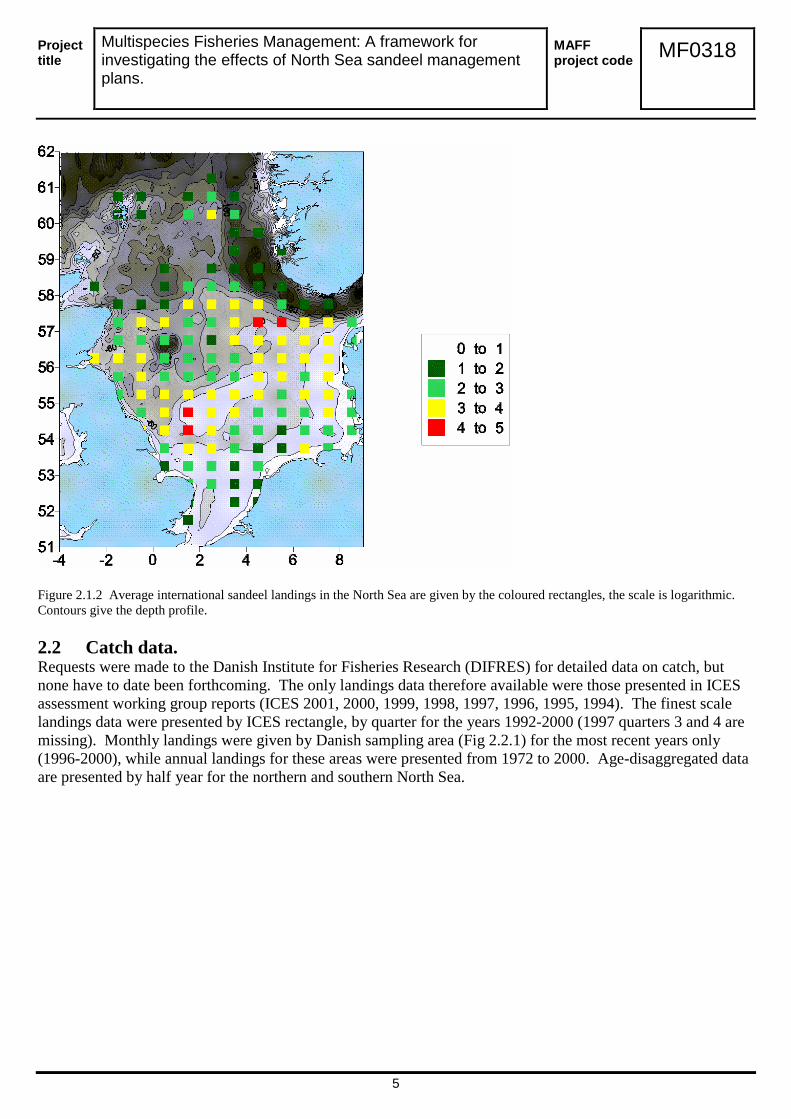
The objectives of this project were therefore to: 1. Define North Sea sandeel substocks. 2. Develop local assessment methods for sandeels. 3. Relate local sandeel abundance to predator breeding success. 4. Highlight further data requirements, if any. 5. Identify local and overall biological limits for conservation. 6. Investigate possible management strategies. 2. The Fishery. 2.1 History Since 1952 an industrial fishery for sandeels has existed in the North Sea for reduction to fish oil and meal. This fishery is chiefly prosecuted by Denmark and Norway, although in the southern North Sea it is entirely a Danish fishery. Initially landings were fairly low, then through the 1970s there was a period of rapid expansion within the fishery. From the mid 1980s to present the landings have fluctuated widely around a constant mean of 770 thousand tonnes, peaking at over 1 million tonnes in 1989, 1997 and 1998 (Fig 2.1.1). The low price of sandeels necessitates high catch rates for the fishery to remain viable. Vessels therefore concentrate on large areas of densely packed sandeels. Figure 2.1.2 shows the distribution of sandeel landings (mean landings 1991-2000). The western edge of the Dogger Bank and the northern edge of the Klondyke Bank show up as the highest yield areas.
0
200
400
600
800
1000
1200
1952
1954
1956
1958
1960
1962
1964
1966
1968
1970
1972
1974
1976
1978
1980
1982
1984
1986
1988
1990
1992
1994
1996
1998
2000
'000
tonn
es
Figure 2.1.1 Total international landings of sandeels from the North Sea. Source ICES(2001).
Project title
Multispecies Fisheries Management: A framework for investigating the effects of North Sea sandeel management plans.
MAFF project code MF0318
5
Figure 2.1.2 Average international sandeel landings in the North Sea are given by the coloured rectangles, the scale is logarithmic. Contours give the depth profile. 2.2 Catch data. Requests were made to the Danish Institute for Fisheries Research (DIFRES) for detailed data on catch, but none have to date been forthcoming. The only landings data therefore available were those presented in ICES assessment working group reports (ICES 2001, 2000, 1999, 1998, 1997, 1996, 1995, 1994). The finest scale landings data were presented by ICES rectangle, by quarter for the years 1992-2000 (1997 quarters 3 and 4 are missing). Monthly landings were given by Danish sampling area (Fig 2.2.1) for the most recent years only (1996-2000), while annual landings for these areas were presented from 1972 to 2000. Age-disaggregated data are presented by half year for the northern and southern North Sea.
Project title
Multispecies Fisheries Management: A framework for investigating the effects of North Sea sandeel management plans.
MAFF project code MF0318
6
CLOSED
AREA
-4 -2 0 2 4 6 8 10Longitude
50
51
52
53
54
55
56
57
58
59
60
61
62
Ltt
Shetland 1C 2C
1B 2B
3
1A 2A 6
4 5
Danish Sandeel sampling areas and assessments areas used by the Working Group
Northern Assessment= 1C + 2C +1B + 2B + 3
Southern Assessment= 1A + 2A + 4 + 5+ 6
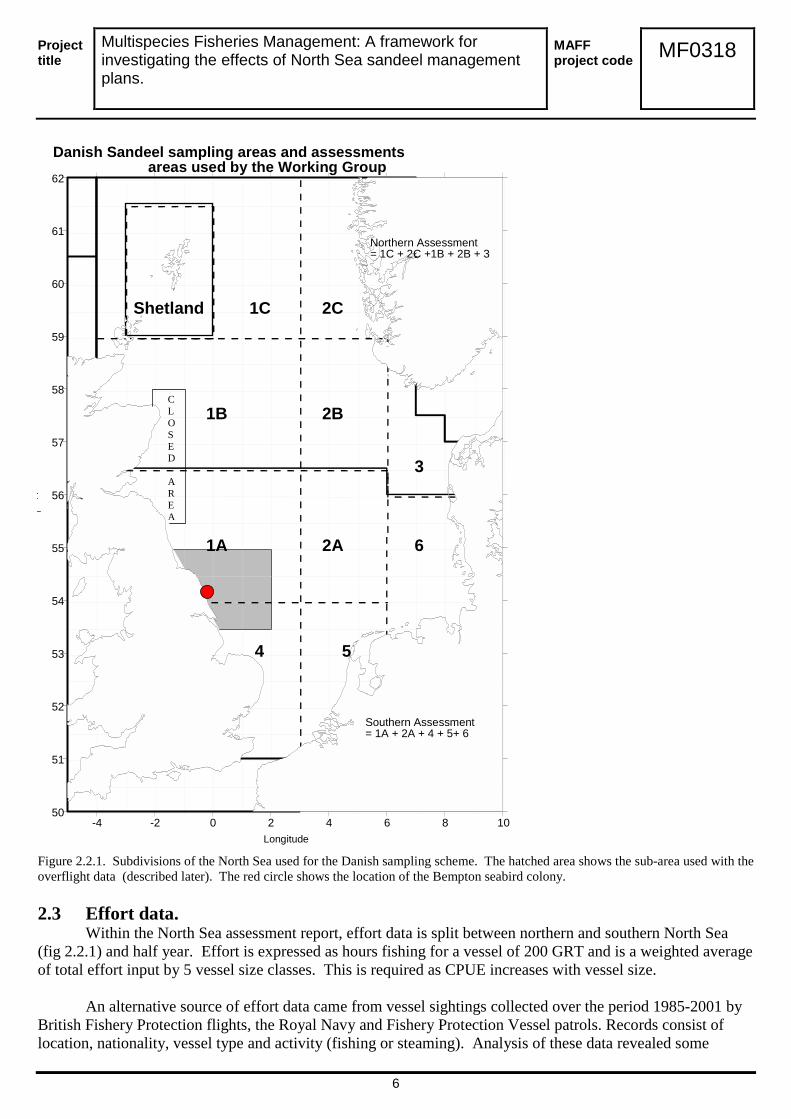
Figure 2.2.1. Subdivisions of the North Sea used for the Danish sampling scheme. The hatched area shows the sub-area used with the overflight data (described later). The red circle shows the location of the Bempton seabird colony. 2.3 Effort data.
Within the North Sea assessment report, effort data is split between northern and southern North Sea (fig 2.2.1) and half year. Effort is expressed as hours fishing for a vessel of 200 GRT and is a weighted average of total effort input by 5 vessel size classes. This is required as CPUE increases with vessel size.
An alternative source of effort data came from vessel sightings collected over the period 1985-2001 by British Fishery Protection flights, the Royal Navy and Fishery Protection Vessel patrols. Records consist of location, nationality, vessel type and activity (fishing or steaming). Analysis of these data revealed some
Project title
Multispecies Fisheries Management: A framework for investigating the effects of North Sea sandeel management plans.
MAFF project code MF0318
7
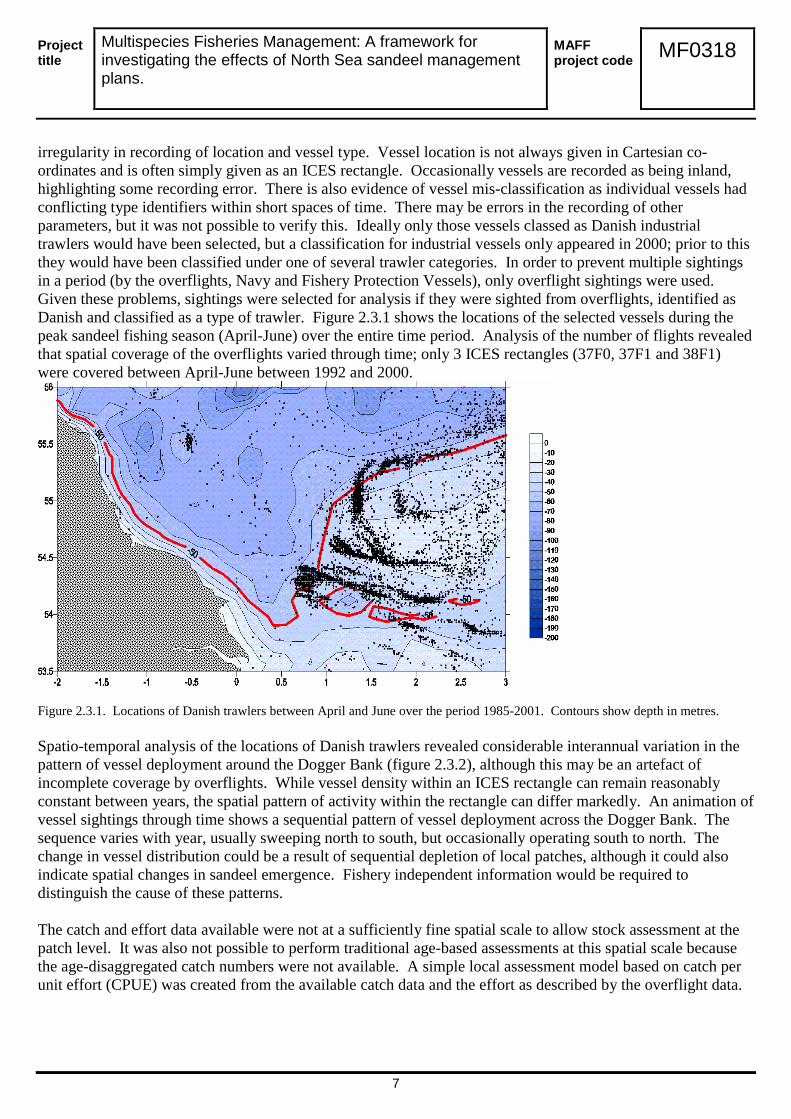
irregularity in recording of location and vessel type. Vessel location is not always given in Cartesian co-ordinates and is often simply given as an ICES rectangle. Occasionally vessels are recorded as being inland, highlighting some recording error. There is also evidence of vessel mis-classification as individual vessels had conflicting type identifiers within short spaces of time. There may be errors in the recording of other parameters, but it was not possible to verify this. Ideally only those vessels classed as Danish industrial trawlers would have been selected, but a classification for industrial vessels only appeared in 2000; prior to this they would have been classified under one of several trawler categories. In order to prevent multiple sightings in a period (by the overflights, Navy and Fishery Protection Vessels), only overflight sightings were used. Given these problems, sightings were selected for analysis if they were sighted from overflights, identified as Danish and classified as a type of trawler. Figure 2.3.1 shows the locations of the selected vessels during the peak sandeel fishing season (April-June) over the entire time period. Analysis of the number of flights revealed that spatial coverage of the overflights varied through time; only 3 ICES rectangles (37F0, 37F1 and 38F1) were covered between April-June between 1992 and 2000.
Figure 2.3.1. Locations of Danish trawlers between April and June over the period 1985-2001. Contours show depth in metres. Spatio-temporal analysis of the locations of Danish trawlers revealed considerable interannual variation in the pattern of vessel deployment around the Dogger Bank (figure 2.3.2), although this may be an artefact of incomplete coverage by overflights. While vessel density within an ICES rectangle can remain reasonably constant between years, the spatial pattern of activity within the rectangle can differ markedly. An animation of vessel sightings through time shows a sequential pattern of vessel deployment across the Dogger Bank. The sequence varies with year, usually sweeping north to south, but occasionally operating south to north. The change in vessel distribution could be a result of sequential depletion of local patches, although it could also indicate spatial changes in sandeel emergence. Fishery independent information would be required to distinguish the cause of these patterns. The catch and effort data available were not at a sufficiently fine spatial scale to allow stock assessment at the patch level. It was also not possible to perform traditional age-based assessments at this spatial scale because the age-disaggregated catch numbers were not available. A simple local assessment model based on catch per unit effort (CPUE) was created from the available catch data and the effort as described by the overflight data.
Project title
Multispecies Fisheries Management: A framework for investigating the effects of North Sea sandeel management plans.
MAFF project code MF0318
8
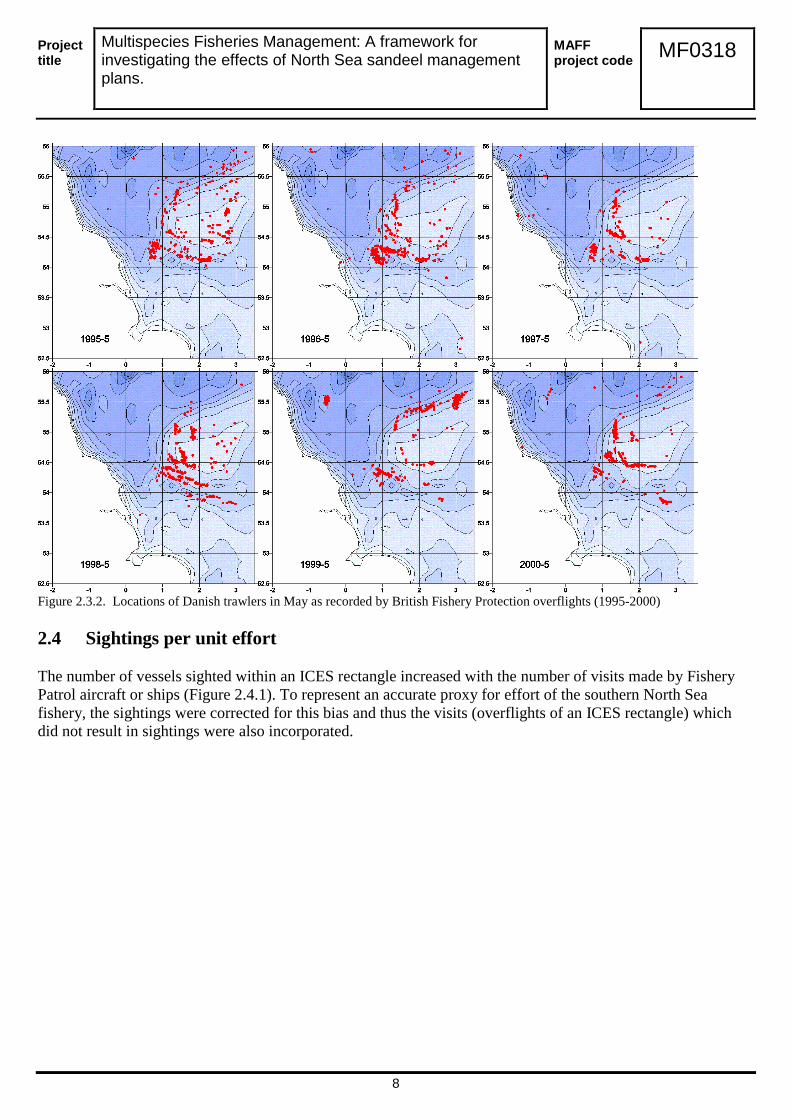
Figure 2.3.2. Locations of Danish trawlers in May as recorded by British Fishery Protection overflights (1995-2000) 2.4 Sightings per unit effort The number of vessels sighted within an ICES rectangle increased with the number of visits made by Fishery Patrol aircraft or ships (Figure 2.4.1). To represent an accurate proxy for effort of the southern North Sea fishery, the sightings were corrected for this bias and thus the visits (overflights of an ICES rectangle) which did not result in sightings were also incorporated.
Project title
Multispecies Fisheries Management: A framework for investigating the effects of North Sea sandeel management plans.
MAFF project code MF0318
9
0
100
200
300
400
500
600
700
800
900
100 300 500 700 900
Number of overflights
Num
ber o
f sig
htin
gs
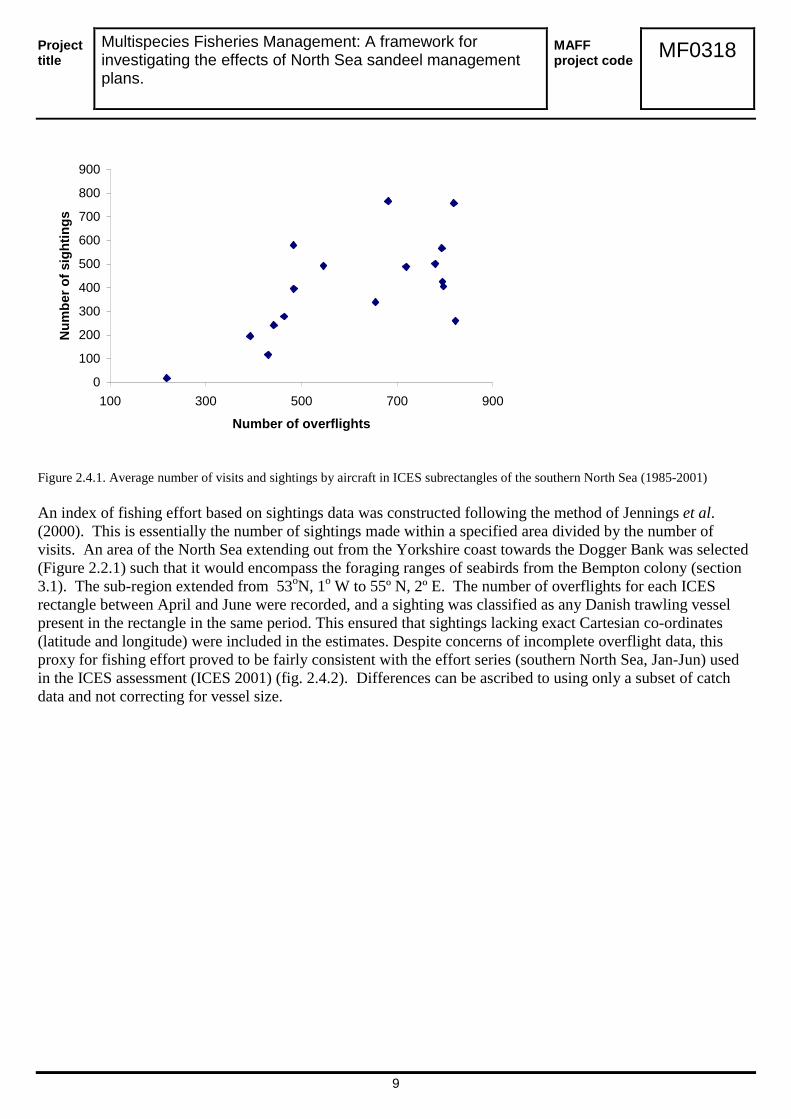
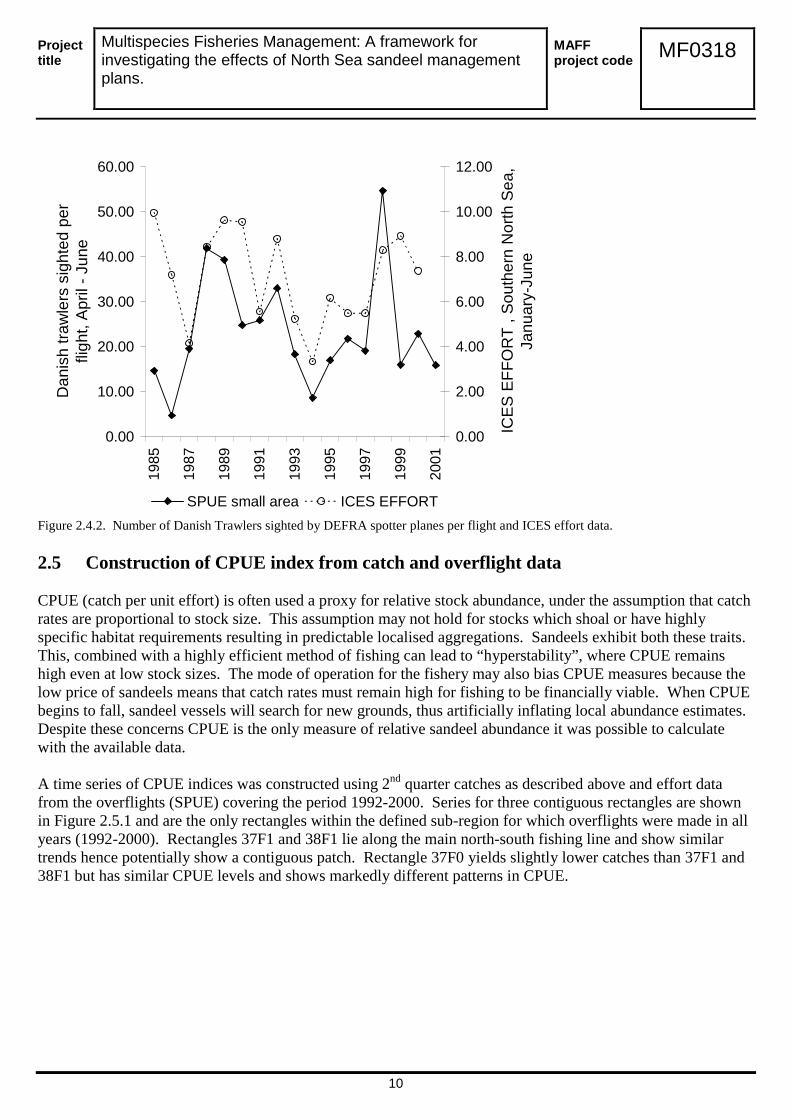
Figure 2.4.1. Average number of visits and sightings by aircraft in ICES subrectangles of the southern North Sea (1985-2001) An index of fishing effort based on sightings data was constructed following the method of Jennings et al. (2000). This is essentially the number of sightings made within a specified area divided by the number of visits. An area of the North Sea extending out from the Yorkshire coast towards the Dogger Bank was selected (Figure 2.2.1) such that it would encompass the foraging ranges of seabirds from the Bempton colony (section 3.1). The sub-region extended from 53oN, 1o W to 55º N, 2º E. The number of overflights for each ICES rectangle between April and June were recorded, and a sighting was classified as any Danish trawling vessel present in the rectangle in the same period. This ensured that sightings lacking exact Cartesian co-ordinates (latitude and longitude) were included in the estimates. Despite concerns of incomplete overflight data, this proxy for fishing effort proved to be fairly consistent with the effort series (southern North Sea, Jan-Jun) used in the ICES assessment (ICES 2001) (fig. 2.4.2). Differences can be ascribed to using only a subset of catch data and not correcting for vessel size.
Project title
Multispecies Fisheries Management: A framework for investigating the effects of North Sea sandeel management plans.
MAFF project code MF0318
10
0.00
10.00
20.00
30.00
40.00
50.00
60.0019
85
1987
1989
1991
1993
1995
1997
1999
2001
Dan
ish
traw
lers
sig
hted
per
fli
ght,
April
- Ju
ne
0.00
2.00
4.00
6.00
8.00
10.00
12.00
ICES
EFF
OR
T , S
outh
ern
Nor
th S
ea,
Janu
ary-
June
SPUE small area ICES EFFORT
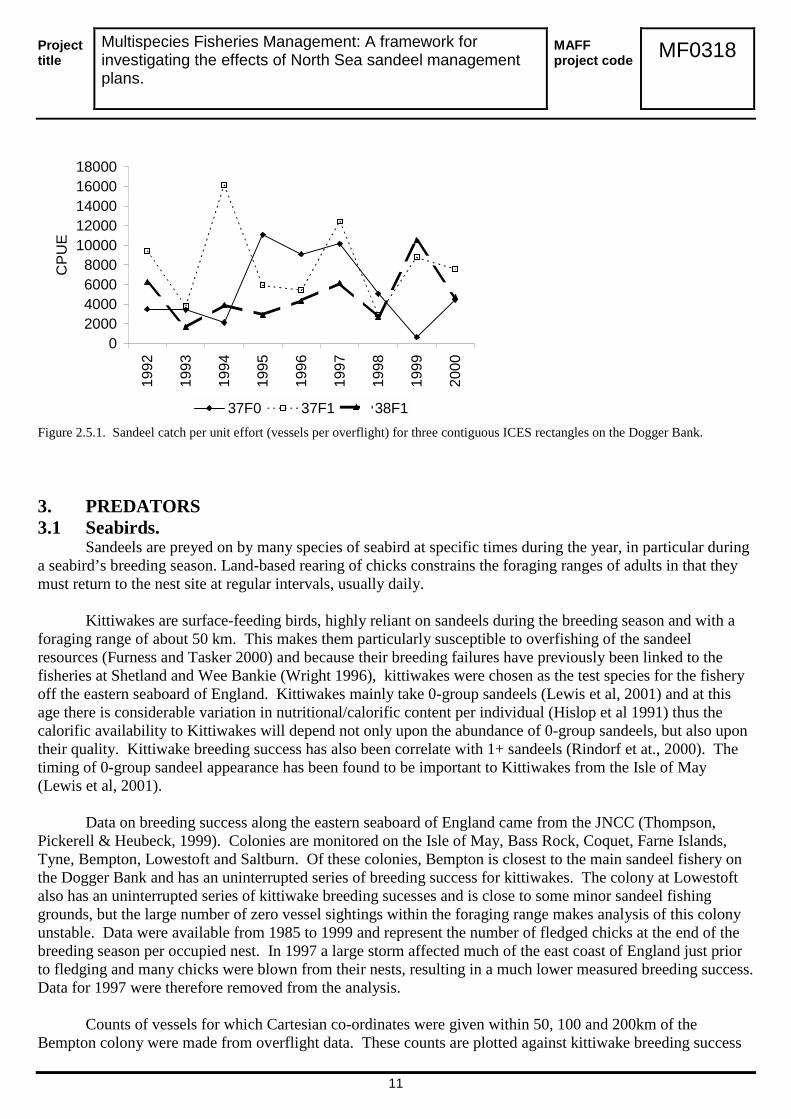
Figure 2.4.2. Number of Danish Trawlers sighted by DEFRA spotter planes per flight and ICES effort data. 2.5 Construction of CPUE index from catch and overflight data CPUE (catch per unit effort) is often used a proxy for relative stock abundance, under the assumption that catch rates are proportional to stock size. This assumption may not hold for stocks which shoal or have highly specific habitat requirements resulting in predictable localised aggregations. Sandeels exhibit both these traits. This, combined with a highly efficient method of fishing can lead to “hyperstability”, where CPUE remains high even at low stock sizes. The mode of operation for the fishery may also bias CPUE measures because the low price of sandeels means that catch rates must remain high for fishing to be financially viable. When CPUE begins to fall, sandeel vessels will search for new grounds, thus artificially inflating local abundance estimates. Despite these concerns CPUE is the only measure of relative sandeel abundance it was possible to calculate with the available data. A time series of CPUE indices was constructed using 2nd quarter catches as described above and effort data from the overflights (SPUE) covering the period 1992-2000. Series for three contiguous rectangles are shown in Figure 2.5.1 and are the only rectangles within the defined sub-region for which overflights were made in all years (1992-2000). Rectangles 37F1 and 38F1 lie along the main north-south fishing line and show similar trends hence potentially show a contiguous patch. Rectangle 37F0 yields slightly lower catches than 37F1 and 38F1 but has similar CPUE levels and shows markedly different patterns in CPUE.
Project title
Multispecies Fisheries Management: A framework for investigating the effects of North Sea sandeel management plans.
MAFF project code MF0318
11
02000400060008000
1000012000140001600018000
1992
1993
1994
1995
1996
1997
1998
1999
2000
CPU
E
37F0 37F1 38F1
Figure 2.5.1. Sandeel catch per unit effort (vessels per overflight) for three contiguous ICES rectangles on the Dogger Bank. 3. PREDATORS 3.1 Seabirds. Sandeels are preyed on by many species of seabird at specific times during the year, in particular during a seabird’s breeding season. Land-based rearing of chicks constrains the foraging ranges of adults in that they must return to the nest site at regular intervals, usually daily.
Kittiwakes are surface-feeding birds, highly reliant on sandeels during the breeding season and with a foraging range of about 50 km. This makes them particularly susceptible to overfishing of the sandeel resources (Furness and Tasker 2000) and because their breeding failures have previously been linked to the fisheries at Shetland and Wee Bankie (Wright 1996), kittiwakes were chosen as the test species for the fishery off the eastern seaboard of England. Kittiwakes mainly take 0-group sandeels (Lewis et al, 2001) and at this age there is considerable variation in nutritional/calorific content per individual (Hislop et al 1991) thus the calorific availability to Kittiwakes will depend not only upon the abundance of 0-group sandeels, but also upon their quality. Kittiwake breeding success has also been correlate with 1+ sandeels (Rindorf et at., 2000). The timing of 0-group sandeel appearance has been found to be important to Kittiwakes from the Isle of May (Lewis et al, 2001).
Data on breeding success along the eastern seaboard of England came from the JNCC (Thompson, Pickerell & Heubeck, 1999). Colonies are monitored on the Isle of May, Bass Rock, Coquet, Farne Islands, Tyne, Bempton, Lowestoft and Saltburn. Of these colonies, Bempton is closest to the main sandeel fishery on the Dogger Bank and has an uninterrupted series of breeding success for kittiwakes. The colony at Lowestoft also has an uninterrupted series of kittiwake breeding sucesses and is close to some minor sandeel fishing grounds, but the large number of zero vessel sightings within the foraging range makes analysis of this colony unstable. Data were available from 1985 to 1999 and represent the number of fledged chicks at the end of the breeding season per occupied nest. In 1997 a large storm affected much of the east coast of England just prior to fledging and many chicks were blown from their nests, resulting in a much lower measured breeding success. Data for 1997 were therefore removed from the analysis.
Counts of vessels for which Cartesian co-ordinates were given within 50, 100 and 200km of the
Bempton colony were made from overflight data. These counts are plotted against kittiwake breeding success
Project title
Multispecies Fisheries Management: A framework for investigating the effects of North Sea sandeel management plans.
MAFF project code MF0318
12
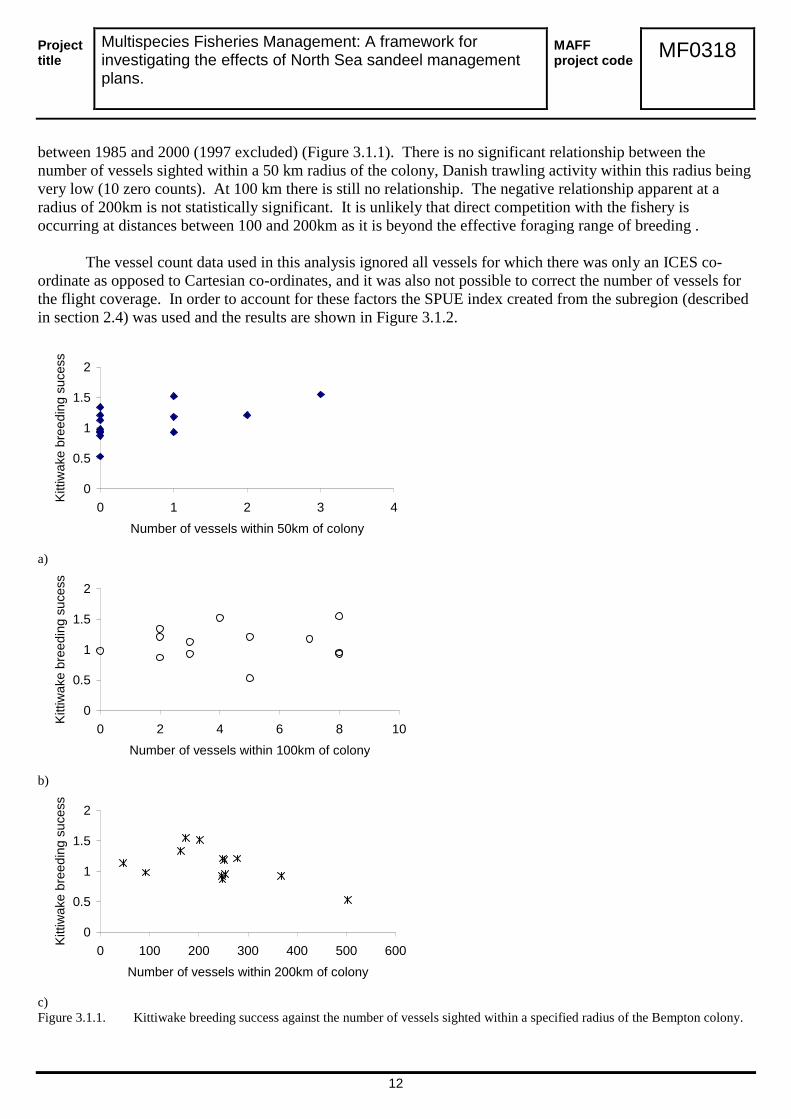
between 1985 and 2000 (1997 excluded) (Figure 3.1.1). There is no significant relationship between the number of vessels sighted within a 50 km radius of the colony, Danish trawling activity within this radius being very low (10 zero counts). At 100 km there is still no relationship. The negative relationship apparent at a radius of 200km is not statistically significant. It is unlikely that direct competition with the fishery is occurring at distances between 100 and 200km as it is beyond the effective foraging range of breeding .
The vessel count data used in this analysis ignored all vessels for which there was only an ICES co-
ordinate as opposed to Cartesian co-ordinates, and it was also not possible to correct the number of vessels for the flight coverage. In order to account for these factors the SPUE index created from the subregion (described in section 2.4) was used and the results are shown in Figure 3.1.2.
0
0.5
1
1.5
2
0 1 2 3 4Number of vessels within 50km of colony
Kitti
wak
e br
eedi
ng s
uces
s
a)
0
0.5
1
1.5
2
0 2 4 6 8 10Number of vessels within 100km of colony
Kitti
wak
e br
eedi
ng s
uces
s
b)
0
0.5
1
1.5
2
0 100 200 300 400 500 600Number of vessels within 200km of colony
Kitti
wak
e br
eedi
ng s
uces
s
c) Figure 3.1.1. Kittiwake breeding success against the number of vessels sighted within a specified radius of the Bempton colony.
Project title
Multispecies Fisheries Management: A framework for investigating the effects of North Sea sandeel management plans.
MAFF project code MF0318
13
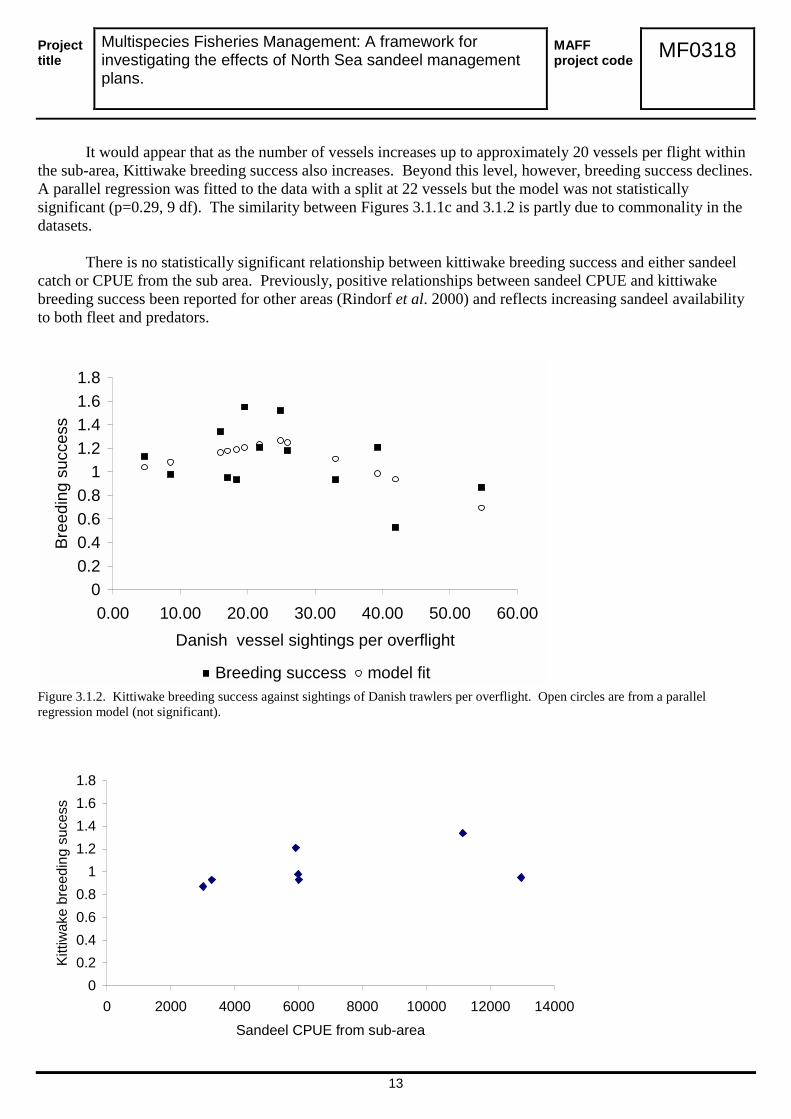
It would appear that as the number of vessels increases up to approximately 20 vessels per flight within the sub-area, Kittiwake breeding success also increases. Beyond this level, however, breeding success declines. A parallel regression was fitted to the data with a split at 22 vessels but the model was not statistically significant (p=0.29, 9 df). The similarity between Figures 3.1.1c and 3.1.2 is partly due to commonality in the datasets.
There is no statistically significant relationship between kittiwake breeding success and either sandeel
catch or CPUE from the sub area. Previously, positive relationships between sandeel CPUE and kittiwake breeding success been reported for other areas (Rindorf et al. 2000) and reflects increasing sandeel availability to both fleet and predators.
00.20.40.60.8
11.21.41.61.8
0.00 10.00 20.00 30.00 40.00 50.00 60.00Danish vessel sightings per overflight
Bree
ding
suc
cess
Breeding success model fit
Figure 3.1.2. Kittiwake breeding success against sightings of Danish trawlers per overflight. Open circles are from a parallel regression model (not significant).
00.20.40.60.8
11.21.41.61.8
0 2000 4000 6000 8000 10000 12000 14000Sandeel CPUE from sub-area
Kitti
wak
e br
eedi
ng s
uces
s
Project title
Multispecies Fisheries Management: A framework for investigating the effects of North Sea sandeel management plans.
MAFF project code MF0318
14
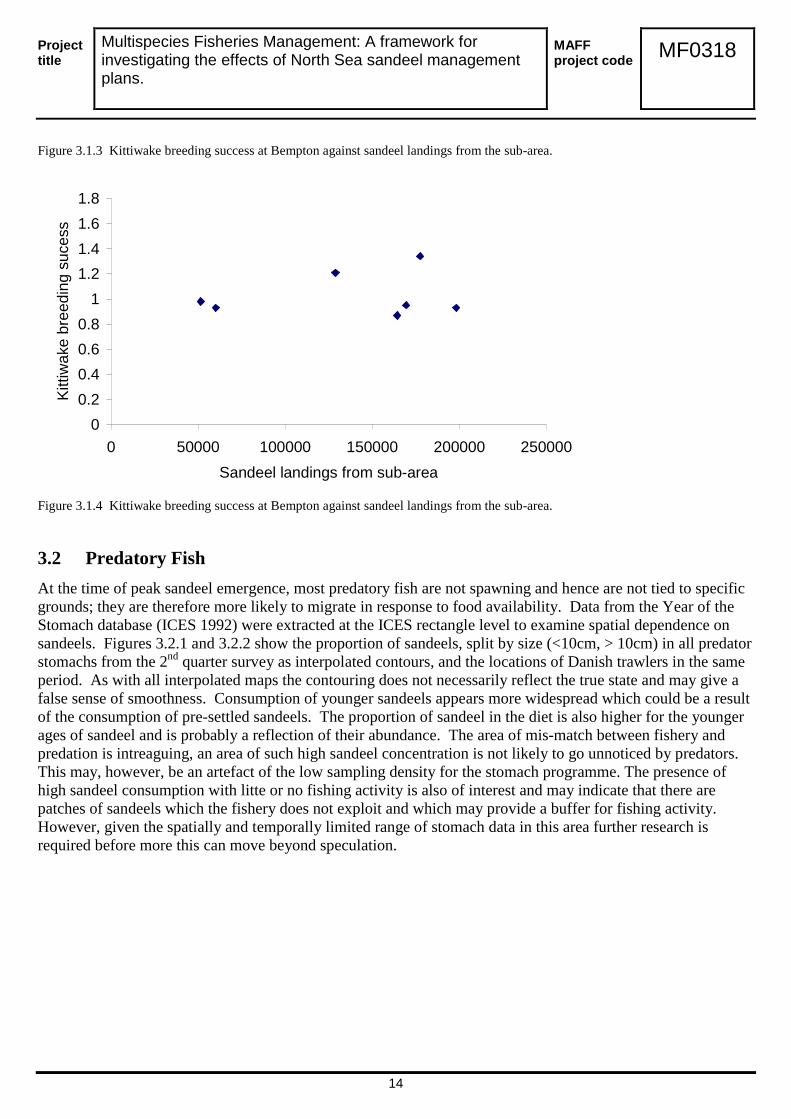
Figure 3.1.3 Kittiwake breeding success at Bempton against sandeel landings from the sub-area.
00.20.40.60.8
11.21.41.61.8
0 50000 100000 150000 200000 250000Sandeel landings from sub-area
Kitti
wak
e br
eedi
ng s
uces
s
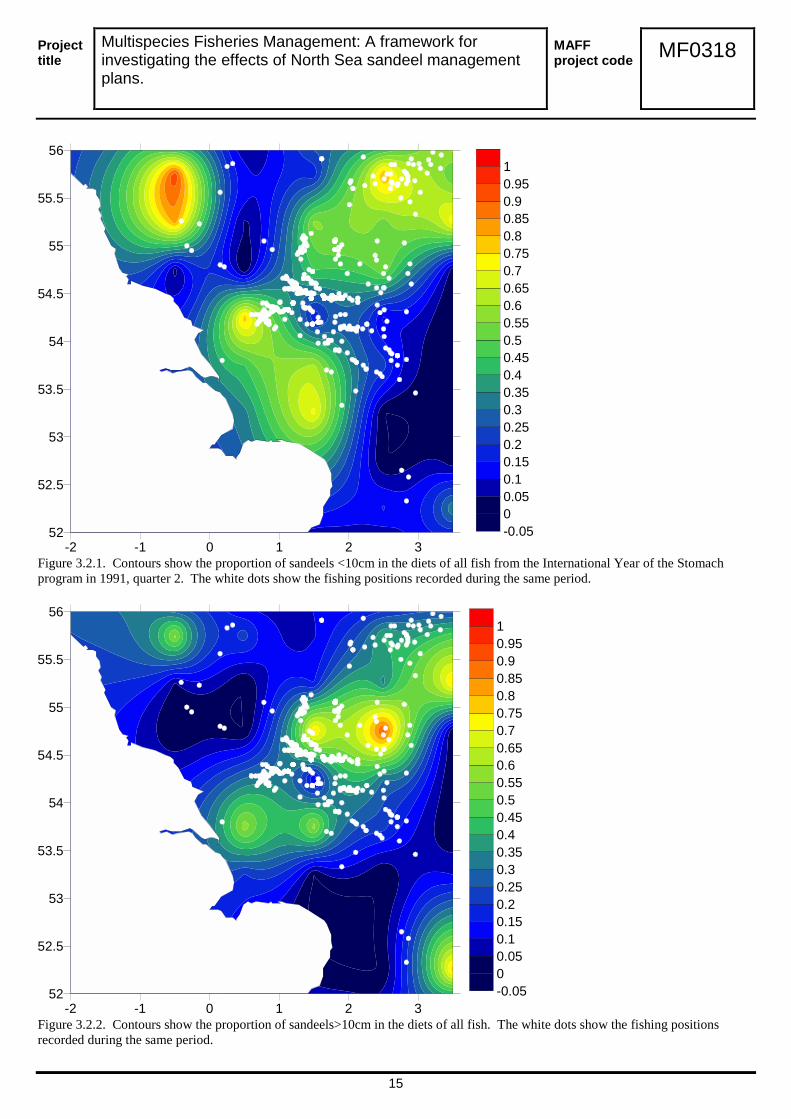
Figure 3.1.4 Kittiwake breeding success at Bempton against sandeel landings from the sub-area. 3.2 Predatory Fish At the time of peak sandeel emergence, most predatory fish are not spawning and hence are not tied to specific grounds; they are therefore more likely to migrate in response to food availability. Data from the Year of the Stomach database (ICES 1992) were extracted at the ICES rectangle level to examine spatial dependence on sandeels. Figures 3.2.1 and 3.2.2 show the proportion of sandeels, split by size (<10cm, > 10cm) in all predator stomachs from the 2nd quarter survey as interpolated contours, and the locations of Danish trawlers in the same period. As with all interpolated maps the contouring does not necessarily reflect the true state and may give a false sense of smoothness. Consumption of younger sandeels appears more widespread which could be a result of the consumption of pre-settled sandeels. The proportion of sandeel in the diet is also higher for the younger ages of sandeel and is probably a reflection of their abundance. The area of mis-match between fishery and predation is intreaguing, an area of such high sandeel concentration is not likely to go unnoticed by predators. This may, however, be an artefact of the low sampling density for the stomach programme. The presence of high sandeel consumption with litte or no fishing activity is also of interest and may indicate that there are patches of sandeels which the fishery does not exploit and which may provide a buffer for fishing activity. However, given the spatially and temporally limited range of stomach data in this area further research is required before more this can move beyond speculation.
Project title
Multispecies Fisheries Management: A framework for investigating the effects of North Sea sandeel management plans.
MAFF project code MF0318
15
-2 -1 0 1 2 352
52.5
53
53.5
54
54.5
55
55.5
56
-0.0500.050.10.150.20.250.30.350.40.450.50.550.60.650.70.750.80.850.90.951
Figure 3.2.1. Contours show the proportion of sandeels <10cm in the diets of all fish from the International Year of the Stomach program in 1991, quarter 2. The white dots show the fishing positions recorded during the same period.
-2 -1 0 1 2 352
52.5
53
53.5
54
54.5
55
55.5
56
-0.0500.050.10.150.20.250.30.350.40.450.50.550.60.650.70.750.80.850.90.951
Figure 3.2.2. Contours show the proportion of sandeels>10cm in the diets of all fish. The white dots show the fishing positions recorded during the same period.
In the absence of a spatially disaggregated time series of sandeel utilisation by predatory fish, it is not possible to determine the effects of local sandeel depletions on annual food consumption and thus growth and reproductive output. As predatory fish such as cod are less restricted in their foraging range than seabirds during the peak sandeel fishing season, it might be expected that coarser scale fishery activities could impact predator growth and breeding success. In order to investigate this, the relationship between cod recruitment for the whole North Sea was analysed with respect to sandeel landings and stock size aggregated to several spatial scales.
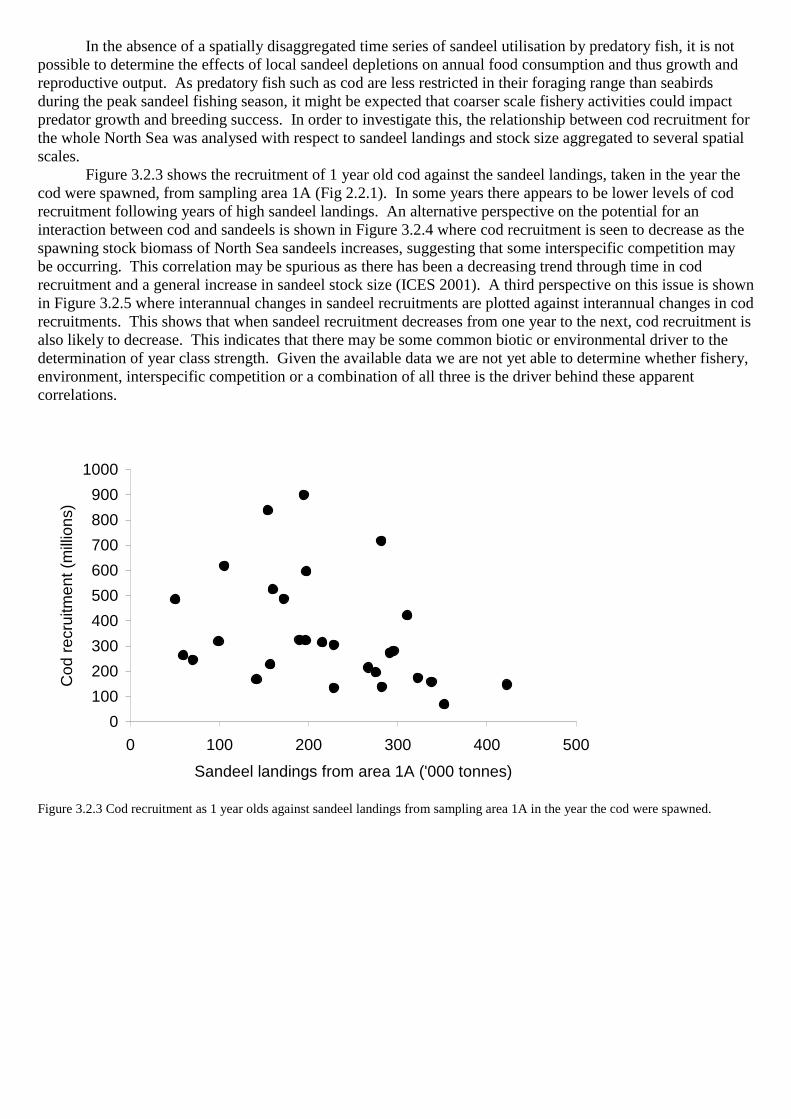
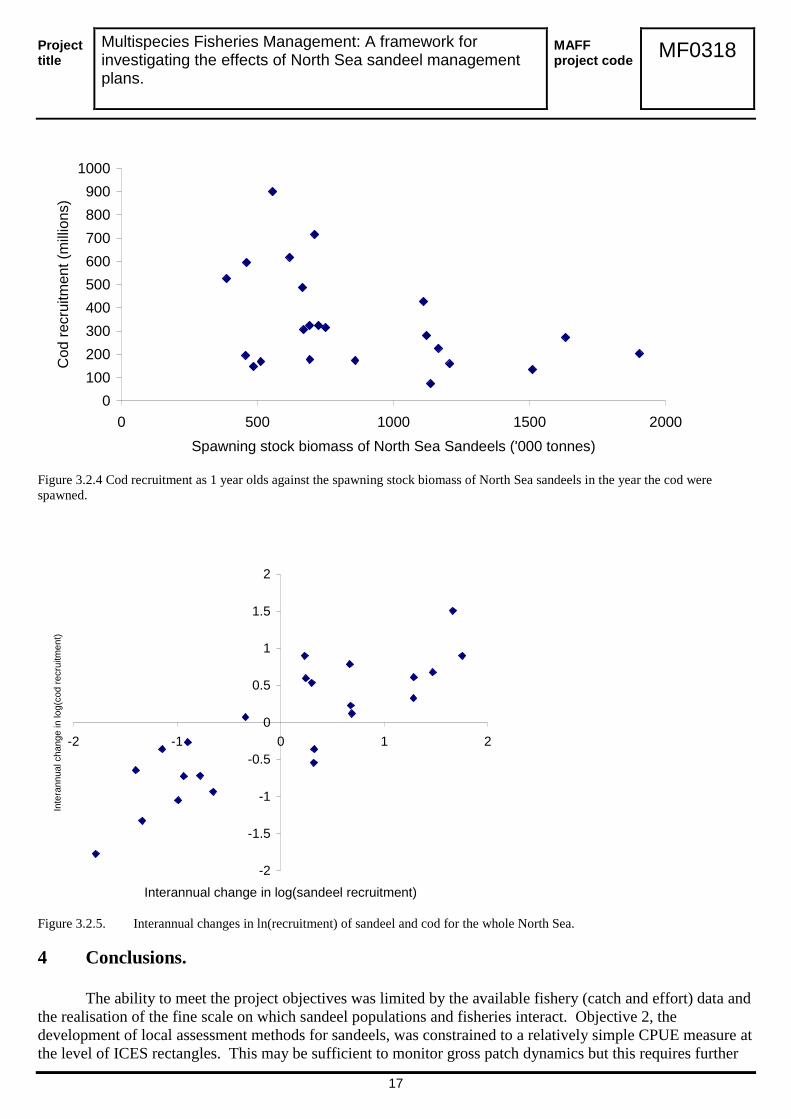
Figure 3.2.3 shows the recruitment of 1 year old cod against the sandeel landings, taken in the year the cod were spawned, from sampling area 1A (Fig 2.2.1). In some years there appears to be lower levels of cod recruitment following years of high sandeel landings. An alternative perspective on the potential for an interaction between cod and sandeels is shown in Figure 3.2.4 where cod recruitment is seen to decrease as the spawning stock biomass of North Sea sandeels increases, suggesting that some interspecific competition may be occurring. This correlation may be spurious as there has been a decreasing trend through time in cod recruitment and a general increase in sandeel stock size (ICES 2001). A third perspective on this issue is shown in Figure 3.2.5 where interannual changes in sandeel recruitments are plotted against interannual changes in cod recruitments. This shows that when sandeel recruitment decreases from one year to the next, cod recruitment is also likely to decrease. This indicates that there may be some common biotic or environmental driver to the determination of year class strength. Given the available data we are not yet able to determine whether fishery, environment, interspecific competition or a combination of all three is the driver behind these apparent correlations.
0100200300400500600700800900
1000
0 100 200 300 400 500Sandeel landings from area 1A ('000 tonnes)
Cod
recr
uitm
ent (
milli
ons)
Figure 3.2.3 Cod recruitment as 1 year olds against sandeel landings from sampling area 1A in the year the cod were spawned.
Project title
Multispecies Fisheries Management: A framework for investigating the effects of North Sea sandeel management plans.
MAFF project code MF0318
17
0100200300400500600700800900
1000
0 500 1000 1500 2000Spawning stock biomass of North Sea Sandeels ('000 tonnes)
Cod
recr
uitm
ent (
milli
ons)
Figure 3.2.4 Cod recruitment as 1 year olds against the spawning stock biomass of North Sea sandeels in the year the cod were spawned.
-2
-1.5
-1
-0.5
0
0.5
1
1.5
2
-2 -1 0 1 2
Interannual change in log(sandeel recruitment)
Inte
rann
ual c
hang
e in
log(
cod
recr
uitm
ent)
Figure 3.2.5. Interannual changes in ln(recruitment) of sandeel and cod for the whole North Sea. 4 Conclusions.
The ability to meet the project objectives was limited by the available fishery (catch and effort) data and the realisation of the fine scale on which sandeel populations and fisheries interact. Objective 2, the development of local assessment methods for sandeels, was constrained to a relatively simple CPUE measure at the level of ICES rectangles. This may be sufficient to monitor gross patch dynamics but this requires further

Project title
Multispecies Fisheries Management: A framework for investigating the effects of North Sea sandeel management plans.
MAFF project code MF0318
18
analysis using finer scale data. The analyses of kittiwake breeding success and cod recruitment in relation to the sandeel fishery met the third objective, although the lack of fine scale data mean that the spatial resolution is coarser than local sandeel populations. The identification of biological limits for conservation and the investigation of possible management strategies (objectives 5 and 6) must also await the availibility of fine scale fishery data. The highlighting of further data requirements (objective 4) are discussed in this section.
The most useful fine-scale resource were the overflight data where Cartesian co-ordinates (latitude and
longitude) of individual vessels were recorded. Indeed this level of resolution is essential for monitoring fisheries at the scale of sandeel banks. The monitoring authorities should be encouraged to record exact co-ordinates whenever possible. The lack of fine scale catch and age data precluded assessment of population dynamics at sandeel patches and thus prevented the assessment of fishery activity at patch level upon predators. Patch level dynamics may be important in situations where patches are isolated and within the predators foraging range. In the case of kittiwakes at Bempton, patches of sandeels between the coast and the major fishery on the Dogger Bank are potentially important, but there are no available records of an active fishery within the area.
One of the major problems with sandeel assessment is the lack of fishery independent data, at present
lack of catch data for an area implies that sandeels are absent. However, recent work undertaken by CEFAS has found small patches of sandeels in areas devoid of fishing (as indicated by overflight sightings). The lack of fishing activity may be due to the small size of shoals rendering the fishery financially inviable. Alternatively the fishery may not have fully explored potential grounds, although Danish scientists do not think the latter is the case. The data from the recent CEFAS work, coupled to the data from the Year of the Stomach programme suggests that predators may be buffered from the major fishery on the Dogger bank by the availability of smaller, unfished patches of sandeels. Sandeel recruitment is generally to within 200km of the spawning populations (Wright et al 1998), thus the Dogger Bank fishery retains the potential to impact unfished patches and it is therefore important that information regarding these areas is acquired. The acquisition of fishery independent data, including data on unfished areas, could be progressed through new acoustic techniques which are currently being developed at CEFAS to estimate sandeel abundance under DEFRA contract MF0317.
This study has found no statistically significant evidence that the industrial fishery on the Dogger Bank is impacting kittiwake breeding success. This result is relevant to policy, albeit based on a short time series. Kittiwakes are one of the most sensitive indicators of sandeel availability, so it is unlikely that, using current available data, signals from the Dogger Bank fishery would be found in other species. It must be borne in mind that the coarse level of fishery data available to this project may have masked any signal, and that finer scale, age-disaggregated data should be analysed in order to assess the likely impact of the industrial fisheries on Kittiwakes. This project has provided insights into the potential drivers for correlations between cod and sandeel stocks. This has aided the provision of advice and provides a basis for identifying further research needed. However, in order to get beyond correlation to causality, specific research need to be directed at these issues. The behavioural responses of predatory fish in relation to prey availability are being investigated in DEFRA contract MF0317. In order to investigate the potential impacts of the fishery on predatory fish it would be necessary to determine their ability to compensate food intake through the year. This may be achieved by lipid analysis and otolith microstructure of the predators, which in turn may indicate the effects of sandeel availability on the predators growth and reproductive output. References

Project title
Multispecies Fisheries Management: A framework for investigating the effects of North Sea sandeel management plans.
MAFF project code MF0318
19
Furness R.W. and Tasker M.L. 2000. Seabird-fishery interactions: Quantifying the sensitivity of seabirds to reductions in sandeel abundance, and identification of key areas for sensitive seabirds in the North Sea. Marine Ecology Progress Series. 202: 253-264. Hislop, J. R. G., Harris, M. P., Smith, J. G. M. 1991. Variation in the calorific value and total energy content of the lesser sandeel (Ammodytes marinus) and other fish preyed on by seabirds. J. Zool. 224. 501-517. ICES. 1992. Progress report on the ICES 1991 North Sea stomach sampling project. ICES CM/G:12. 35 p. ICES. 1994. Report of the working group on the assessment of Norway pout and sandeel. ICES CM/Assess:7. 109p. ICES. 1995. Report of the working group on the assessment of Norway pout and sandeel. ICES CM/Assess:5. 145p. ICES. 1996. Report of the working group on the assessment of demersal stocks in the North Sea and Skagerrak. ICES CM 1996/Assess:6. 199-407p. ICES. 1997. Report of the working group on the assessment of demersal stocks in the North Sea and Skagerrak. ICES CM 1997/Assess:6. 31p. ICES. 1998. Report of the working group on the assessment of demersal stocks in the North Sea and Skagerrak. ICES CM 1998/Assess:7. 702p. ICES.1999. Report of the working group on the assessment of demersal stocks in the North Sea and Skagerrak. ICES CM 1999/ACFM:8. 246p. ICES. 2000.Report of the working group on the assessment of demersal stocks in the North Sea and Skagerrak. ICES CM 2000/ACFM:7. 607p. ICES. 2001.Report of the working group on the assessment of demersal stock in the North Sea and Skagerrak. ICES CM 2001/ACFM:07. 541p. Jennings S., Pinnegar J.K., Polunin N.V.C. and Warr K.J. 2001. Impacts of trawling disturbance on the trophic structure of benthic invertebrate communities. Marine Ecology Progress Series. 213:127-142. Kunzlik, P.A. Gauld, J.A. and Hutcheon, J. R. 1986. Preliminary results of the Scottish sandeel tagging project. ICES CM 1986/G:7. Lewis, S., Wanless, S., Wright, PJ., Harris, MP., Bull, J.l, Elston, D. A., 2001. Diet and breeding performance of black-legged kittiwakes Rissa tridactyla at a North Sea colony. Marine Ecology Progress Series. Vol. 221, pp. 277-284. 2001. Pedersen S.A., Lewy P., and Wright P. 1999.Assessments of the lesser sandeel (Ammodytes marinus) in the North Sea based on revised stock divisions. Fisheries Research. 41(3): 221-241. Rindorf A., Wanless S. and Harris M.P. 2000. Effects of changes in sandeel availability on the reproductive output of seabirds. Marine ecology progress series.202:241-252.

Project title
Multispecies Fisheries Management: A framework for investigating the effects of North Sea sandeel management plans.
MAFF project code MF0318
20
Thompson, K. R., Pickerell G. & Heubeck, M. Seabird numbers and breeding success in Britain and Ireland, 1998. UK Nature Conservation, No. 23. ISBN 1 86107 473 5 Winslade, P. 1974. Behavioural studies on the lesser sandeel Ammodytes marinus (Rait) III. The effect of temperature on activity and the environmental control of the annual cycle of activity. J. Fish Biol. 6, 587–599. Wright P.J. and Tasker M.L. 1996. Analysis of fish consumption by seabirds by age class of prey fish . In: Hunt G.I. and Furness R.W. (Eds.). Seabird/fish interactions, with particular reference to seabirds in the North Sea. ICES Cooperative Research Report No. 216, pp. 42-44. Wright P.J., Pederesen S.A., Donald L., Anderson C., Lewy P., Proctor R. 1998. The influence of physical factors on the distribution of lesser sandeel, Ammodytes marinus, and its relevance to fishing pressure in the North Sea. ICES CM: 1998/AA: 3. 9 p. Please press enter