Embed Size (px)
Citation preview

Evaluation of Volunteer Data – The Lakes of Missouri
Volunteer Program Review
Daniel V. ObrechtAnthony P. Thorpe
John R. JonesDepartment of Fisheries and Wildlife
SciencesUniversity of Missouri

LMVP Background• Program was created in 1992• Coordinated by the University of Missouri
Limnology Lab• Funding:
US EPA Region VII through the Missouri Department of Natural Resources has provided partial funding for this project under Section 319 of the Clean Water Act

LMVP Goals
1. Determine current water quality in Missouri lakes
2. Monitor for changes in water quality over time
3. Educate the public about lake ecology and water quality issues

Parameters Monitored
• Total Phosphorus (5 – 85 μg/L)
• Total Nitrogen (200 – 1400 μg/L)
• Algal Chlorophyll (3 – 50 μg/L)
• Suspended Solids (0 – 20 mg/L)
• Secchi Transparency (20 – 230 inches)
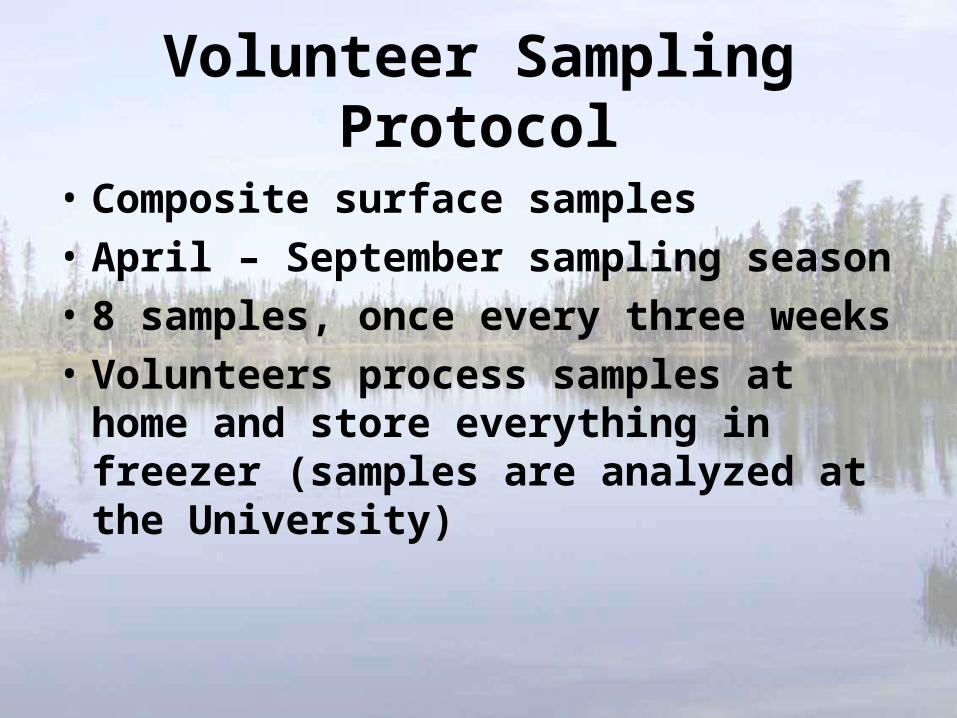
Volunteer Sampling Protocol
• Composite surface samples
• April – September sampling season
• 8 samples, once every three weeks
• Volunteers process samples at home and store everything in freezer (samples are analyzed at the University)

University Monitoring
• Statewide Lake Assessment Project– 3 or 4 composite surface samples mid-May
to mid-August
• Table Rock Lake Long-Term Monitoring– 5 or 6 epilimnetic composite samples May
through September
• Lake of the Ozarks Long-Term Monitoring– 4 composite surface samples in July and
August

Is Volunteer Data Quality Data?
1. Comparison of annual geometric mean values
2. Comparison of long-term geometric mean values
3. Split Samples
4. Evaluation of chlorophyll filter replication

Comparison of annual geometric mean values
29 lakes
41 lake-sites
178 lake-site/years
At least 3 samples from both Volunteer and University
Analyzed using Mann-Whitney Test with significance level set at 0.05

Total Phosphorus
164 comparisons (92%) were not significantly different
0 20 40 60 80University
0
20
40
60
80
Vo
lun
tee
r
1:1 line

Total Nitrogen
167 comparisons (94%) were not significantly different
100 500 900 1300University
100
500
900
1300
Vo
lun
tee
r 1:1 line

Chlorophyll
171 comparisons (96%) were not significantly different
0 10 20 30 40 50University
0
10
20
30
40
50
Vo
lun
tee
r
1:1 line

0 5 10 15University
0
5
10
15
Vo
lun
tee
r
Inorganic Suspended Solids
116 comparisons (99%) were not significantly different
n = 117
1:1 line

Secchi
166 comparisons (93%) were not significantly different
0 50 100 150 200University
0
50
100
150
200
Vo
lun
tee
r
1:1 line

Should we be concerned that 5% of the comparisons were
significantly different?

Comparison of long-term geometric mean values
11 lakes
23 lake-sites
4 to 10 years of data per lake-site
Analyzed using Mann-Whitney Test with significance level set at 0.05

Total Phosphorus
no significant differences
0 20 40 60University
0
20
40
60
Vo
lun
tee
r
1:1 line
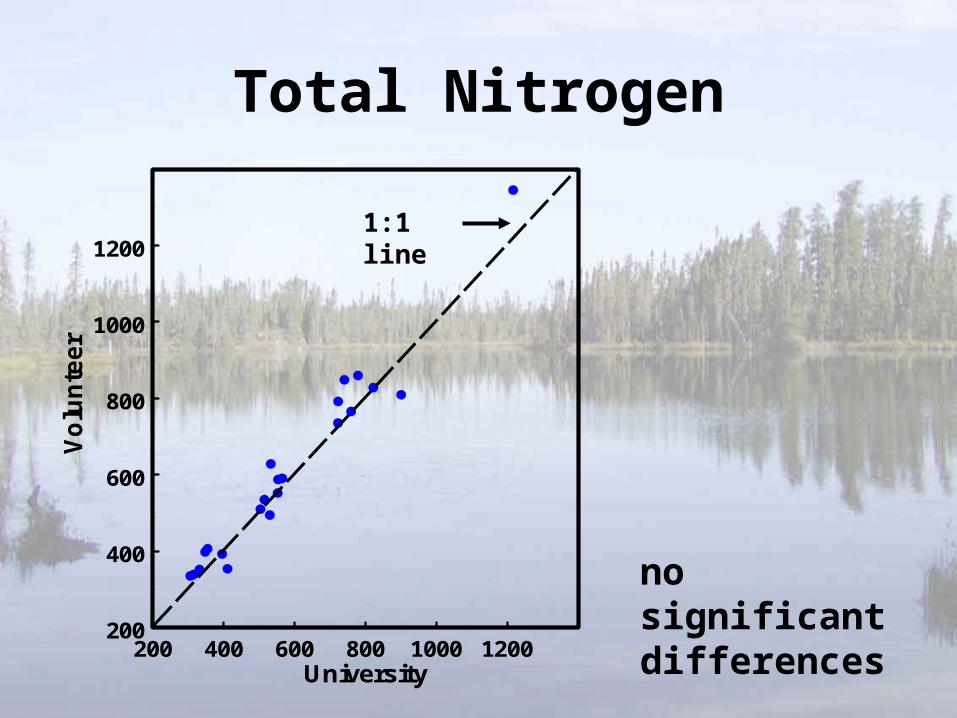
Total Nitrogen
no significant differences
200 400 600 800 1000 1200University
200
400
600
800
1000
1200
Vo
lun
tee
r
1:1 line

Chlorophyll
no significant differences 0 10 20 30 40
University
0
10
20
30
40
Vo
lun
tee
r
1:1 line

Inorganic Suspended Solids
no significant differences 0 2 4 6
University
0
2
4
6
Vo
lun
tee
r
1:1 line

Secchi
no significant differences
0 50 100 150University
0
50
100
150
Vo
lun
tee
r
1:1 line

Split SamplesDifference in processing and storage include:
Hand pump vs. vacuum
Frozen TP bottles vs. refrigerated tubes
Volunteers generally process samples quicker
18 lakes 27 lake-sites
Analyzed using Paired T-Test on log transformed data with significance level set at 0.05
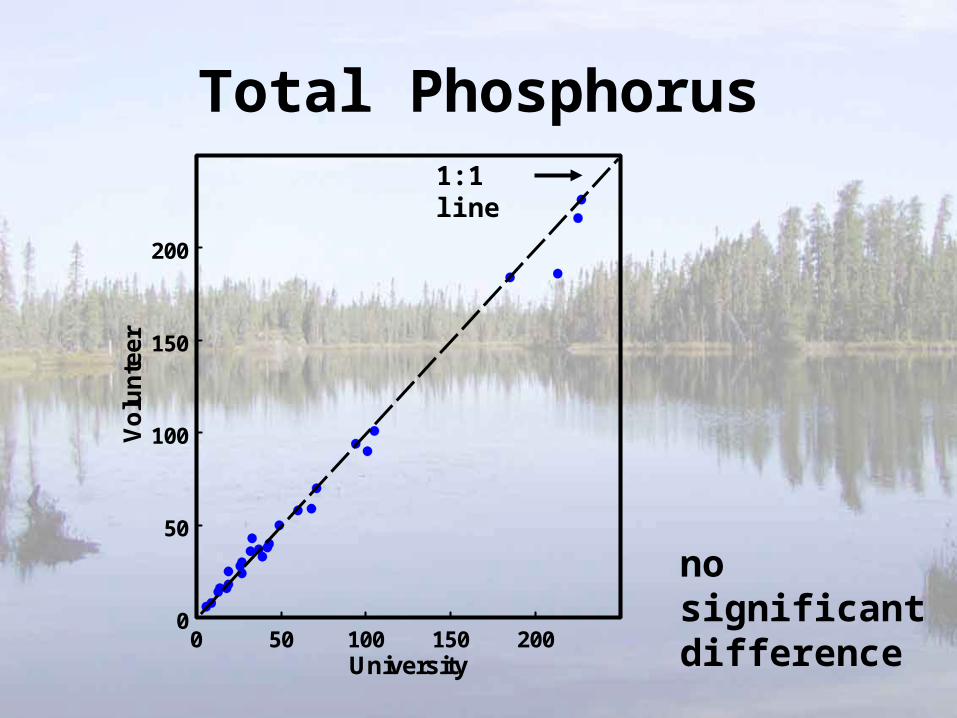
Total Phosphorus
0 50 100 150 200University
0
50
100
150
200
Vo
lun
tee
r
no significant difference
1:1 line
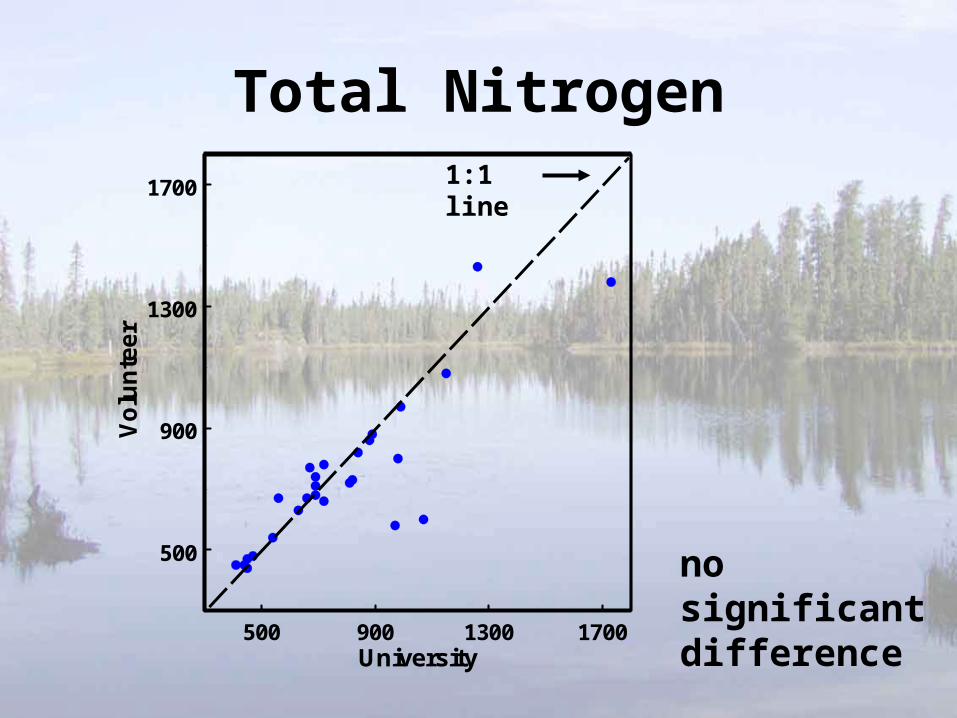
Total Nitrogen
500 900 1300 1700University
500
900
1300
1700
Vo
lun
tee
r
no significant difference
1:1 line

Inorganic Suspended Solids
0 5 10 15University
0
5
10
15
Vo
lun
tee
r
no significant difference
1:1 line

Chlorophyll
0 10 20 30 40University
0
10
20
30
40
Vo
lun
teer
significant difference
1:1 line

0 20 40 60
0
20
40
60
University
Vo
lun
tee
r
Chlorophyll
1:1 line

Evaluation of filter replication
Two chlorophyll filters processed from each sample
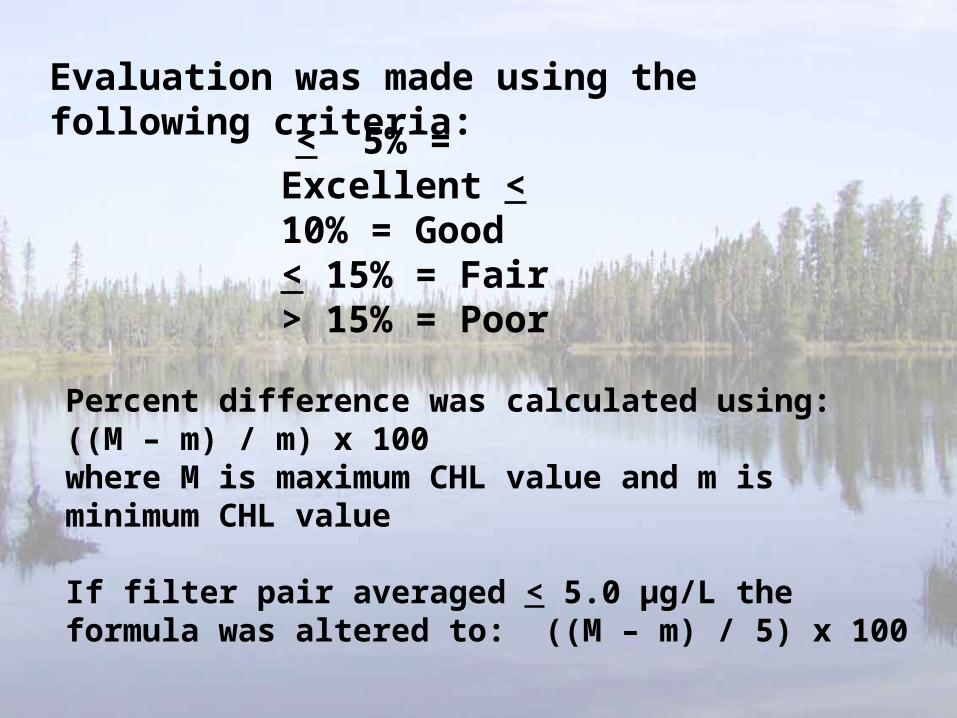
Evaluation was made using the following criteria:
Percent difference was calculated using:((M – m) / m) x 100 where M is maximum CHL value and m is minimum CHL value If filter pair averaged < 5.0 μg/L the formula was altered to: ((M – m) / 5) x 100
< 5% = Excellent < 10% = Good< 15% = Fair> 15% = Poor

University Volunteer
77% Excellent 74%16% Good 15%4% Fair 5%3% Poor 6%
n = 4035 n = 3947

Summary
• Volunteer and University annual geometric means do not differ in majority of cases – given the slight differences in site locations and natural variation in parameters, some differences should be expected
• Long-term geometric means (4+ years) do not differ

Summary
• Split samples for phosphorus and inorganic suspended solids showed no differences. Nitrogen was not statistically different, though outliers were present. Chlorophyll was statistically different, though results may be anomaly.
• Volunteer chlorophyll filter replication is extremely comparable to University results

The Missouri DNR uses LMVP data for 305b reporting. Currently Missouri does not have nutrient
criteria, so volunteer data has not been used for 303d listing.