Embed Size (px)
Citation preview

Current Traditional Medicine, 2017, 3, 157-173 1
RESEARCH ARTICLE
2215-0838/17 $58.00+.00 © 2017 Bentham Science Publishers
Evaluation of Two Types of Signals of Sphygmography and Hepa-titis Detection
Andrew Chen and Chiachung Chen*
Department of Bio-industrial Mechatronics Engineering, National ChungHsing University, 250 Kuokuang Rd., Taichung Taiwan
A R T I C L E H I S T O R Y
Received: September 30, 2016 Revised: August 04, 2017 Accepted: September 28, 2017
DOI: 10.2174/2215083803666171024094105
Abstract: Introduction: The diagnosis of the arterial pulse is important in traditional Chinese medicine. The signals of this technique are evaluated by doctors with long-term experience.
Methods: In this study, we used a sphygmography to record the variation in the arterial pulse expressed as two types of signals: the pressure wave and spectrum frequency. The measure-ment was performed at three positions in the left and right hands in the health people and pa-tients of hepatitis with B carriers in Taiwan. Five variables taken from the pressure wave signals and three variables taken from the spectrum analysis were used and then were evalu-ated by ANOVA and the Tukey’s test.
Results: The results found that some variables from the pressure wave signals were affected by subject, time of measurement and positions. However, results were inconsistent. Spectrum fre-quency variables were only affected significantly at left Guan position. Detecting time and day did not have significant effect on the spectrum variables for subjects in healthy state.
Conclusion: Our results are consistent with the traditional Chinese medicine information. The significant discrepancy of signals at right Guan position was found for patients of hepa-titis with B carriers. The results strongly suggested that the spectrum of sphygmogram could be applied for detection of hepatitis.
Keywords: Sphygmography, Spectrum analysis, Pulse wave, left Guan position, hepatitis.
1. INTRODUCTIONThe Introduction section should include the
background four diagnostic methods are used in traditional Chinese medicine (TCM): inspection, listening, inquiring and pulse diagnosis. The in-formation obtained by these methods is then used by doctors to determine and treat the condition. The pulse diagnostic method could yield much
*Address correspondence to this author at the Department ofBio-industrial Mechatronics Engineering, National ChungHsing University, 250 Kuokuang Rd., Taichung Taiwan; Tel: +886422857562; Fax: +886422857135; E-mail: [email protected]
complex and important information; however, training in pulse diagnosis is time-consuming.
Pulse diagnosis has served as a general guide for clinical diagnosis in TCM for more than 2,000 years. The physician places the fingertips of the index, middle, and fourth fingers on the skin over the radial artery on the underside of the wrist to palpate the pulse [1].
A similar concept of pulse diagnostics is to de-termine the blood pressure waveform of the car-diovascular system [2]. The shape and dimension of the blood pressure waveform could be studied to describe the physical state of the body. The rela-

2 Current Traditional Medicine, 2017, Vol. 3, No. 3 Chen and Chen
tionship between the pulse force and time is called the pressure wave diagram or the time domain method [3].
A powerful tool in signal treatment was intro-duced to process pulse wave signals [4,5]. These signals were processed with the Fourier transfor-mation. The pulse wave is expressed as the sum of a series of amplitudes and frequencies. The dia-gram to express the relationship between ampli-tudes and frequencies is called the spectrum analy-sis of signals [6].
A typical pulse wave diagram for a healthy sub-ject is in Fig. (1). The first peak of the pulse wave is called the Percussive wave (P wave). The P wave is created by the blood moving from the left ventricle into the aorta. The height of the P wave is denoted as h1. The ejection time of the left ventri-cle is t1. The value of h1 is used as an index of heart ejection ability [3].
The second wave, the Tidal wave (T wave), is found when the blood hits the artery wall and re-bounds. The height of the T wave, h3, indicates the elasticity of the arterial system. In some cases, the T wave is merged with the P wave. The lowest po-
sition between the T wave and the next Peak (D wave) is called as V3. The height of V3 is h4. The h4 value represents the peripheral resistance of vessels. As the aortic valve is closed, the dicrotic wave (D wave) is generated. The height of the D wave is denoted as h5. The h5 value expressed the stiffness of the aorta.
The width of the P wave at the two-thirds the height of h1 is denoted as the interwave w. The w value is equal for the time of maintaining maxi-mum pressure. The l value is the width of the di-crotic wave from the maximum position to the end of the pulse motion. The t value is the total pulse duration.
Tyan et al. [7] investigated the signals of the radial artery pulse for patients with Systemic Lu-pus Erythematosus (SLE). The area of pressure wave, ratio of w to t, and ratio of h4 to h1, were compared between patients and controls with no significant differences between the patients and controls. Chang [8] compared the w/t value for pa-tients with congestive heart failure and controls and found significant difference in three detecting positions. Feng [9] compared five variables, h1, t, h3/h1, h4/h1, and w/l, among the subjects with dif-
Fig. (1). A typical radial pressure pulse waveform measured in this study.

Evaluation of Two Types of Signals of Sphygmography Current Traditional Medicine, 2017, Vol. 3, No. 3 3
ferent diseases and controls but found inconsistent results.
Lee and Wei [4] calculated the pulse spectral graphs for the pulse wave and defined the energy ratio (ER) for the energy of spectral density. The ER value was > 100 at three positions of both bands for healthy persons and < 100 for people with disease. So the ER value can be an index for some organs with disease in humans. Wei and Chow [10] evaluated the spectral energy ratio (SER) values for three frequencies and suggested that SER(10) - the spectral energy density 10 Hz, could be an index of the state of health.
Recently, sphygmography research has re-ceived much attention. Huang et al. [11] analyzed the arterial pulse in the spectral domain and de-fined the spectral harmonic energy ratio (SHER) to evaluate the decreased spectral energy for patients with palpitation. The radial pressure pulse and heart variability has been studied in subjects under the heat and cold stressed [12]. The spectral en-ergy for different ranges of frequency was affected by environmental stress. The researchers also stud-ied the possibility to detect the dyspepsia and rhinitis by Sphygmography [13]. Jeon and co-workers [14] proposed a novel diagnostic algo-rithm for classifying the floating and Sunken pulse. Huang et al. [15] evaluated the effect of acupuncture on the pulse spectrum of the radial pressure pulse for patients with dyspepsia and found that acupuncture influenced the spectral en-ergy density from 10 to 50 Hz. From the above studies, sphygmography has been used as a clini-cal tool. However, practitioners of Western medi-cine doubt that the possibility pulse can be de-tected by fingertips placed on the wrist. Questions involve the pulse variations with measurement on different days and at different times of the same day. What are the variations of the pulse signal among different subjects in a healthy state? What kinds of factors of humans, for example, age or occupation could affect the pulse diagnostics? What are the significant difference of the signal between the healthy and patients?
In this study, we aimed to evaluate performance of the Sphygmography by analyzing of two types of signals: pulse wave and spectrum frequency. Variables were taken from healthy people and pa-tients of hepatitis with B carriers in Taiwan. Vari-ables from both subjects were further analyzed to
evaluate factors affecting these variables. Patients of hepatitis with B carriers were selected to evalu-ate the utilization of sphygmography.
2. MATERIALS AND METHOD 2.1. Subjects The experiment involved two groups of healthy subjects. The first groups (n = 12) was under-graduate and graduate students (6 male; mean age 24 ± 3.6 yr, range 20 to 30 yr). All subjects were not receiving medical treatment.
The second groups (n = 6) were patients of hepatitis with B carriers (4 male; mean age 40.2 ± 6.8 yr). Their liver panel of GOT was ranged from 105 to 240 units.
The measurement of the pulse wave was a no-injuring, noninvasive procedure without harmful effect.
2.2. Sphygmography The Huang-CWl type sphygmography was used to detect the pulse wave of the radial artery at the wrist (Fig. 2). This device contained a strain-gage pressure transducer, X-Y-Z axial moveable framework, amplifier, signal recording card and A/D conditioner.
The pressure signals were processed by a digi-tal signal conditioner. The pulse versus time plot called pulse wave diagram could be created di-rectly. This signal was transformed by Fast Fourier Transform (FFT). The amplitude versus frequency data were recorded and called the spectrum fre-quency diagram. The power spectra energy, SER(f) was defined as follows [10]:
SER (f) = E1(f) / E2(f)
where E1(f) is the integrated spectral energy below frequency f, and E2(f) is the integrated spectral en-ergy above frequency f.
The electrical pulse signal was digitized with the FFT to obtain the spectral energy density of 0-10 Hz, 10-50 Hz and 13-50 Hz. The sample rate was 4,000 Hz.
2.3. Detection Procedure The six detecting positions for Sphygmography were the Chun, Guan and Chy positions for the left and right hand (Fig. 3).
4 Current Traditional Medicine, 2017, Vol. 3, No. 3 Chen and Chen
Fig. (2). The diagram of the sphygmogram used in this study.
Fig. (3). The position of the Chun, Guan and Chy on the hand. All subjects were asked to have no alcoholic or caffeinated beverages during the experimental day. Each test involved a 20 min rest before the initial pulse examination. Examinations involved five replicates with each subject in the sitting position while the radial artery pulse was recorded with the pressure sensor of the analyzer. Suitable pressure was considered with the greatest pulse amplitude. A typical pulse wave is shown in Fig. (4). The re-lated spectrum analysis diagram is in Fig. (5).
2.4. Variables of Pulse Wave and Spectrum Analysis Diagram The detection times were the morning (9:00), afternoon (15:00) and night (20:00).
The detection positions were denoted RI (right Chun), RB (right Guan), RC (right Chy), LI (left Chun), LB (left Guan), and LC (left Chy).
The variables for the pulse wave diagram were h1, h4, t, t1, and w and for the spectrum analysis

Evaluation of Two Types of Signals of Sphygmography Current Traditional Medicine, 2017, Vol. 3, No. 3 5
(a) RCD
(b). LBD Fig. (4). Example of a pulse wave diagram.
6 Current Traditional Medicine, 2017, Vol. 3, No. 3 Chen and Chen
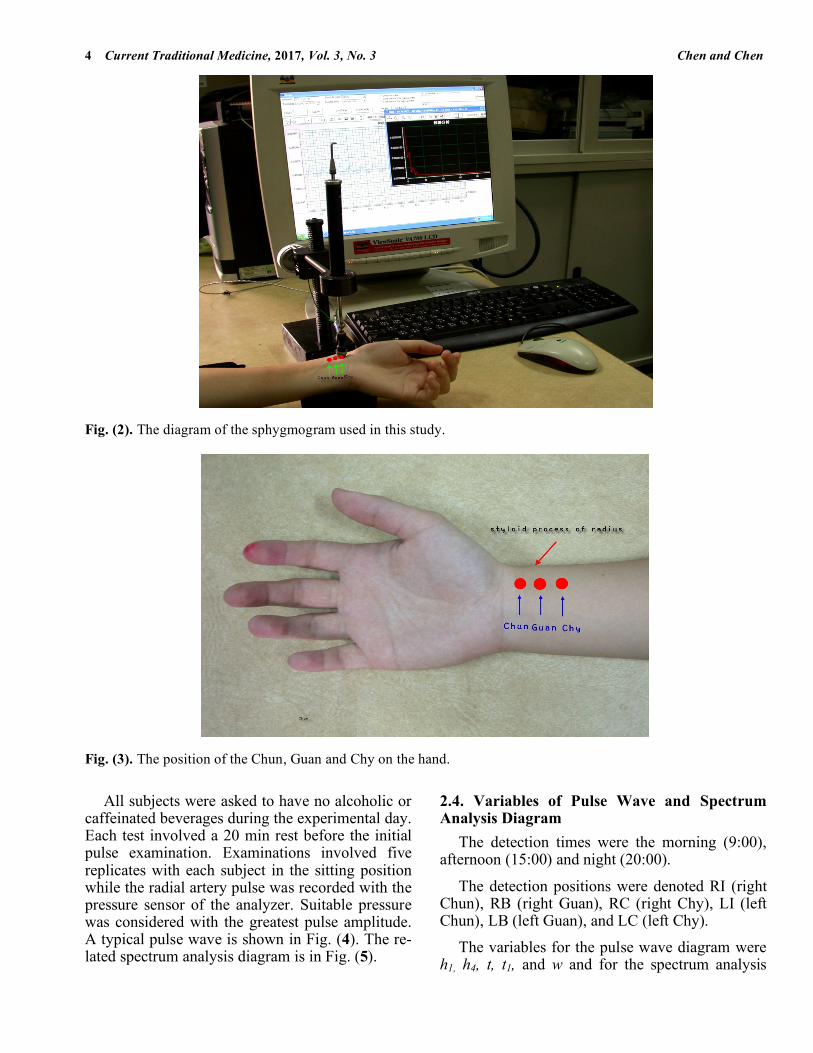
Fig. (5). Example of a spectrum frequency diagram. diagram were the spectral energy ratio (SER), the spectrum energy between 10-50 Hz, denoted as P10-50 and the spectrum energy between 13-50 Hz, denoted as P13-50.
3. EXPERIMENTAL In the first experiment, we examined the effect of detection time (morning, afternoon and eve-ning) and position (RI, RB, RC, LI, LB, and LC) with students.
In the second experiment, we examined the ef-fect of the detection time and day (the interval was 2 days) for four weeks. Subjects were randomly selected from students. That is, the experiment was performed at even number day of that month.
The third experiment, we exampled the effect of hepatitis with B carriers on the signals of spec-trum frequency diagram.
The observed variables for the pulse wave dia-gram were h1, h4, t, t1, and w. Three explicative were taken from each pulse wave pattern. The SER, spectrum energy 10-50 Hz and spectrum energy 13-50 Hz were taken from the spectrum frequency dia-gram. Each spectrum frequency only had one data.
Two-way analysis of variance (ANOVA) was used for comparison with Tukey's post-hoc test. Statistical analysis involved use of Sigmaplot 12.3 (Sigma SPSS Inc. Chicago, IL, USA). p < 0.05 was considered statistically significant.
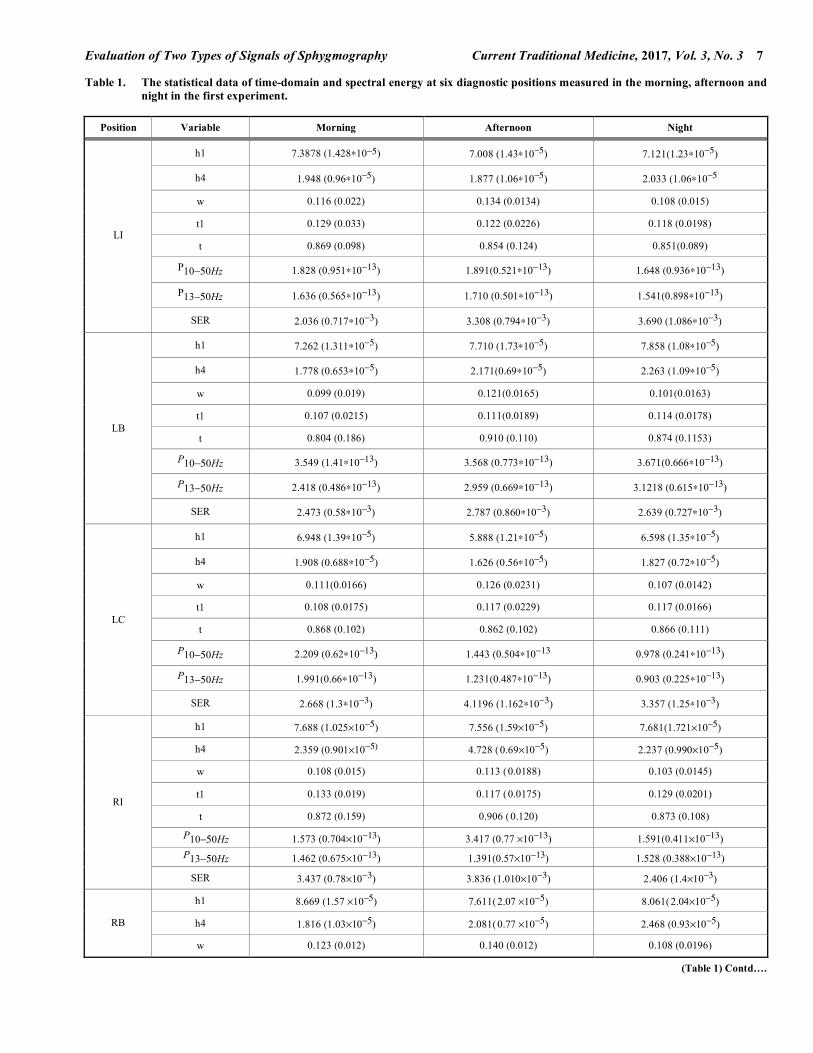
4. RESULTS AND DISCUSSIONS 4.1. Effect of Detecting Time and Position The statistical data for the time-domain and spectral energy at six diagnostic positions meas-ured in students in the morning, afternoon and night are in Table 1.
Evaluation of Two Types of Signals of Sphygmography Current Traditional Medicine, 2017, Vol. 3, No. 3 7
Table 1. The statistical data of time-domain and spectral energy at six diagnostic positions measured in the morning, afternoon and night in the first experiment.
Position Variable Morning Afternoon Night
h1 7.3878 (1.428∗10−5) 7.008 (1.43∗10−5) 7.121(1.23∗10−5)
h4 1.948 (0.96∗10−5) 1.877 (1.06∗10−5) 2.033 (1.06∗10−5
w 0.116 (0.022) 0.134 (0.0134) 0.108 (0.015)
t1 0.129 (0.033) 0.122 (0.0226) 0.118 (0.0198)
t 0.869 (0.098) 0.854 (0.124) 0.851(0.089)
P10−50Hz 1.828 (0.951∗10−13) 1.891(0.521∗10−13) 1.648 (0.936∗10−13)
P13−50Hz 1.636 (0.565∗10−13) 1.710 (0.501∗10−13) 1.541(0.898∗10−13)
LI
SER 2.036 (0.717∗10−3) 3.308 (0.794∗10−3) 3.690 (1.086∗10−3)
h1 7.262 (1.311∗10−5) 7.710 (1.73∗10−5) 7.858 (1.08∗10−5)
h4 1.778 (0.653∗10−5) 2.171(0.69∗10−5) 2.263 (1.09∗10−5)
w 0.099 (0.019) 0.121(0.0165) 0.101(0.0163)
t1 0.107 (0.0215) 0.111(0.0189) 0.114 (0.0178)
t 0.804 (0.186) 0.910 (0.110) 0.874 (0.1153)
P10−50Hz 3.549 (1.41∗10−13) 3.568 (0.773∗10−13) 3.671(0.666∗10−13)
P13−50Hz 2.418 (0.486∗10−13) 2.959 (0.669∗10−13) 3.1218 (0.615∗10−13)
LB
SER 2.473 (0.58∗10−3) 2.787 (0.860∗10−3) 2.639 (0.727∗10−3)
h1 6.948 (1.39∗10−5) 5.888 (1.21∗10−5) 6.598 (1.35∗10−5)
h4 1.908 (0.688∗10−5) 1.626 (0.56∗10−5) 1.827 (0.72∗10−5)
w 0.111(0.0166) 0.126 (0.0231) 0.107 (0.0142)
t1 0.108 (0.0175) 0.117 (0.0229) 0.117 (0.0166)
t 0.868 (0.102) 0.862 (0.102) 0.866 (0.111)
P10−50Hz 2.209 (0.62∗10−13) 1.443 (0.504∗10−13 0.978 (0.241∗10−13)
P13−50Hz 1.991(0.66∗10−13) 1.231(0.487∗10−13) 0.903 (0.225∗10−13)
LC
SER 2.668 (1.3∗10−3) 4.1196 (1.162∗10−3) 3.357 (1.25∗10−3)
h1 7.688 (1.025×10⁻⁵) 7.556 (1.59×10⁻⁵) 7.681(1.721×10⁻⁵)
h4 2.359 (0.901×10⁻⁵) 4.728 ( 0.69×10⁻⁵) 2.237 (0.990×10⁻⁵)
w 0.108 (0.015) 0.113 ( 0.0188) 0.103 (0.0145)
t1 0.133 (0.019) 0.117 ( 0.0175) 0.129 (0.0201)
t 0.872 (0.159) 0.906 ( 0.120) 0.873 (0.108)
P10−50Hz 1.573 (0.704×10⁻¹³) 3.417 (0.77 ×10⁻¹³) 1.591(0.411×10⁻¹³) P13−50Hz 1.462 (0.675×10⁻¹³) 1.391(0.57×10⁻¹³) 1.528 (0.388×10⁻¹³)
RI
SER 3.437 (0.78×10⁻³) 3.836 (1.010×10⁻³) 2.406 (1.4×10⁻³)
h1 8.669 (1.57 ×10⁻⁵) 7.611( 2.07 ×10⁻⁵) 8.061( 2.04×10⁻⁵)
h4 1.816 (1.03×10⁻⁵) 2.081( 0.77 ×10⁻⁵) 2.468 (0.93×10⁻⁵) RB
w 0.123 (0.012) 0.140 (0.012) 0.108 (0.0196)
(Table 1) Contd….
8 Current Traditional Medicine, 2017, Vol. 3, No. 3 Chen and Chen
Position Variable Morning Afternoon Night
t1 0.126 (0.0256) 0.138 (0.0226) 0.127 (0.0257)
t 0.868 (0.141) 0.944 (0.147) 0.935 (0.057)
P10−50Hz 2.381(0.518∗10−13) 1.868 (0.548∗10−13) 2.741(0.919∗10−13)
P13−50Hz 2.180 (0.592∗10−13) 1.720 (0.510∗10−13) 2.410 (0.881∗10−13)
SER 3.721(1.711∗10−3) 2.335 (1.27 ∗10−3) 1.896 (1.201∗10−3)
h1 5.840 (1.175∗10−5) 5.321(1.16∗10−5) 5.503 (1.30∗10−5)
h4 1.801(0.874∗10−5) 1.080 (0.47 ∗10−5) 1.408 (0.65∗10−5)
w 0.112 (0.014) 0.117 (0.0196) 0.103 (0.0162)
t1 0.127 (0.0256) 0.127 (0.0308) 0.116 (0.0151)
t 0.844 (0.168) 0.874 (0.108) 0.833 (0.104)
P10−50Hz 1.220 (0.514∗10−13) 0.993 (0.714∗10−13) 1.011(0.394∗10−13)
P13−50Hz 1.118 (0.455∗10−13) 0.927 (0.665∗10−13) 0.956 (0.336∗10−13)
RC
SER 2.259 (1.85∗10−3) 2.848 (1.212∗10−3) 2.814 (1.118∗10−3)
Data are mean ± SD.
Position
RI RB RC LI LB LC
h1
0.00000
0.00002
0.00004
0.00006
0.00008
0.00010
0.00012
0.00014
0.00016
0.00018
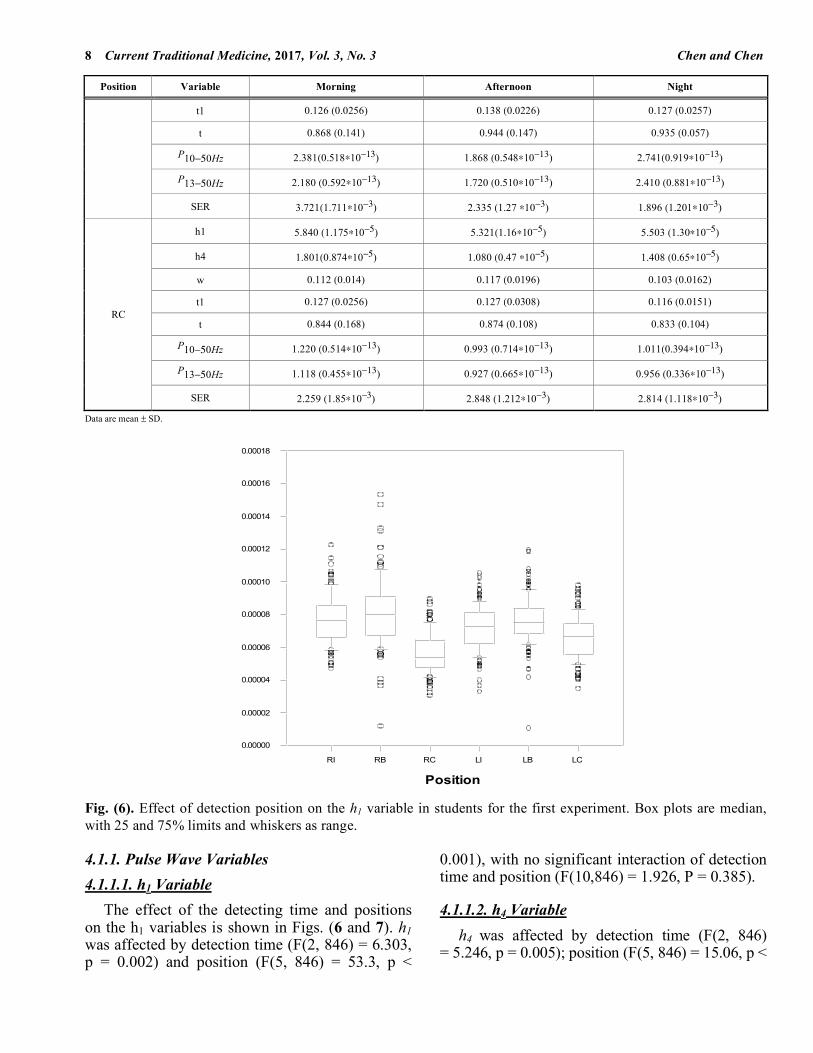
Fig. (6). Effect of detection position on the h1 variable in students for the first experiment. Box plots are median, with 25 and 75% limits and whiskers as range. 4.1.1. Pulse Wave Variables 4.1.1.1. h1 Variable The effect of the detecting time and positions on the h1 variables is shown in Figs. (6 and 7). h1 was affected by detection time (F(2, 846) = 6.303, p = 0.002) and position (F(5, 846) = 53.3, p <
0.001), with no significant interaction of detection time and position (F(10,846) = 1.926, P = 0.385).
4.1.1.2. h4 Variable h4 was affected by detection time (F(2, 846) = 5.246, p = 0.005); position (F(5, 846) = 15.06, p <

Evaluation of Two Types of Signals of Sphygmography Current Traditional Medicine, 2017, Vol. 3, No. 3 9
0.001), and interaction of time and position (F(10, 846) = 3.520, p < 0.0001).
4.1.1.3. t Variable t was affected by positions F(5, 846) = 5.860, p < 0.001) and time (F (2, 846) = 6.584, p = 0.0015). No significant effect was found for the interaction (F(10, 846) = 2.311, p = 0.112).
4.1.1.4. t1 Variable The detection position had a significant effect on the t1 variable (F(5, 846) = 16.50, p < 0.0001) as did the position and time interaction (F(10, 846) = 3.949, p < 0.001), but not time (F (2,846) = 0.401, p = 0.670).
4.1.1.5. w Variable w was affected by detection time (F(2, 846) = 19.58, p < 0.001), but not position (F (2,846) = 2.159, p = 0.056) and the position and time inter-action (F(10, 846) = 0.940, p = 0.49).
Thus, the effect of detection time and position on pulse wave variables was inconsistent. No regular rules or relationship could be established.
4.1.2. Spectrum Analysis Variables 4.1.2.1. Spectral Energy Ratio, SER SER was not affected by detection position (F(5, 270) = 0.881, p = 0.492), or time (F(2, 270) = 0.240, p = 0.787) or the interaction (F(10, 270) = 0.826, p = 0.604).
4.1.2.2. Spectrum Power between 10 and 50 Hz, P10-50 P10-50 was affected by detection position (F(5, 270) = 10.22, p < 0.0001), but not time (F(2, 270) = 0.489, p = 0.614) and the interaction (F(10, 270) = 1.483, p = 0.1466). Subsequent post-hoc com-parison by Tukey’s test revealed that the variable at the LB position significantly differed from that at other positions.
4.1.2.3. Spectrum Power between 13 and 50 Hz, P13-50 As for P10-50, P13-50 was affected by detection position (F(5, 270) = 9.261, p < 0.0001) but not detection time (F(2, 270) = 0.240, p = 0.787) and no interaction (F(10, 270) = 0.826, p = 0.604). P13-50 at the LB position differed from that at other posi-tions.
Time
Morning Afternoon Night
Y Axis
4.0e-5
6.0e-5
8.0e-5
1.0e-4
1.2e-4
1.4e-4
Fig. (7). Effect of detection time on the h1 variable in students for the first experiment.
10 Current Traditional Medicine, 2017, Vol. 3, No. 3 Chen and Chen
Table 2. The statistical data of time-domain and spectral energy at six diagnosis positions for students t at different time and day.
Position Variable Morning Afternoon Night
h1 7.663 (1.0526∗10−5) 7.549 (1.660∗10−5) 7.888 (1.738∗10−5)
h4 2.353 (1.189∗10−5) 1.921(1.332∗10−5) 2.075 (1.079∗10−5)
w 0.115 (0.021) 0.138 (0.032) 0.108 (0.0156)
t1 0.133 (0.0196) 0.117 (0.0174) 0.130 (0.0202)
t 7.633 (1.053) 7.549 (1.662) 7.788 (1.137)
P10−50Hz 2.139 (0.221∗10−13) 2.237 (0.197∗10−13) 2.289 (0.225∗10−13)
P13−50Hz 1.420 (0.709∗10−13) 1.333 (0.933∗10−13) 1.501(0.138∗10−13)
RI
SER 3.817 (0.830∗10−3) 3.959 (0.331∗10−3) 3.340 (0.481∗10−3)
h1 8.284 (2.185∗10−5) 7.929 (1.929∗10−5) 8.152 (1.269∗10−5)
h4 1.767 (0.670 ∗10−5) 2.085 (0.690 ∗10−5) 2.285 (1.156 ∗10−5)
w 0.0963 (0.0108) 0.123 (0.016) 0.102 (0.0116)
t1 0.125 (0.026) 0.137 (0.023) 0.127 (0.0247)
t 0.843 (0.146) 0.923 (0.145) 0.935 (0.0607)
P10−50Hz 2.491(0.229∗10−13) 2.065 (0.117∗10−13) 2.74 (0.919∗10−13)
P13−50Hz 2.282 (0.987∗10−13) 1.885 (0.610∗10−13) 2.41(0.881∗10−13)
RB
SER 4.102 (0.541∗10−3) 2.323 (1.345∗10−3) 2.019 (1.231∗10−3)
h1 5.825 (1.229∗10−5) 5.454 (1.138∗10−5) 5.540 (1.334∗10−5)
h4 1.892 (0.705∗10−5) 1.645 (0.624∗10−5) 1.900 (0.725∗10−5)
w 0.109 (0.016) 0.132 (0.0222) 0.107 (0.014)
t1 0.128 (0.0256) 0.261(0.029) 0.117 (0.015)
t 0.836 (0.163) 0.868 (0.101) 0.833 (0.011)
P10−50Hz 1.591(0.523∗10−13) 1.008 (0.766∗10−13) 1.036 (0.041∗10−13)
P13−50Hz 1.072 (0.461∗10−13) 0.941(0.671∗10−13) 0.987 (0.670∗10−13)
RC
SER 2.253 (0.94∗10−3) 2.973 (0.901∗10−3) 2.538 (0.561∗10−3)
h1 7.217 (1.343×10⁻⁵) 7.117 (1.484×10⁻⁵) 7.141(1.315×10⁻⁵)
h4 2.296 (0.0928×10⁻⁵ 1.963 (0.717×10⁻⁵) 2.333 (1.008×10⁻⁵)
w 0.126 (0.117) 0.116 (0.0176) 0.104 (0.0148)
t1 0.125 (0.0223) 0.123 (0.0215) 0.121(0.019)
t 0.866 (0.094) 0.844 (0.129) 0.857 (0.105)
P10−50Hz 1.813 (0.7 ×10⁻¹³) 1.964 (0.560×10⁻¹³) 1.950 (0.688×10⁻¹³) P13−50Hz 1.622 (0.592×10⁻¹³) 1.991(0.652×10⁻¹³) 1.509 (0.890×10⁻¹³)
LI
SER 2.204 (0.9×10⁻³) 3.566 (0.81×10⁻³) 3.707 (1.166×10⁻³)
h1 7.301(1.392×10⁻⁵) 7.629 (1.537×10⁻⁵) 7.784(1.0944×10⁻⁵)
h4 2.376 (1.152×10⁻⁵) 2.124 (1.049×10⁻⁵) 2.475 (0.973×10⁻⁵) LB
w 0.167 (0.014) 0.144 (0.013) 0.107 (0.018)
(Table 2) Contd….
Evaluation of Two Types of Signals of Sphygmography Current Traditional Medicine, 2017, Vol. 3, No. 3 11
Position Variable Morning Afternoon Night
t1 0.105 (0.0219) 0.112 (0.0185) 0.115 (0.017)
t 0.802 (0.190) 0.901(0.105) 0.885 (0.088)
P10−50Hz 3.822 (0.991×10⁻¹³) 3.491(0.263×10⁻¹³) 3.499 (0.931×10⁻¹³) P13−50Hz 3.288 (0.267×10⁻¹³) 2.891(0.661×10⁻¹³) 2.566 (0.766×10⁻¹³)
SER 2.687 (0.853×10⁻³) 2.951(0.907×10⁻³) 2.919 (0.736×10⁻³)
h1 6.871(1.277×10⁻⁵) 6.0405 (1.211×10⁻⁵) 6.699(1.383×10⁻⁵)
h4 1.569 (0.730×10⁻⁵) 1.124 (0.467×10⁻⁵) 1.442 (0.680×10⁻⁵)
w 0.112 (0.0149) 0.121(0.017) 0.102(0.016)
t1 0.109 (0.017) 0.117 (0.023) 0.119 (0.016)
t 0.899 (0.031) 0.893 (0.016) 0.885 (0.017)
P10−50Hz 2.304 (0.810×10⁻¹³) 1.549 (0.761×10⁻¹³) 1.545 (0.241×10⁻¹³) P13−50Hz 2.065 (0.266×10⁻¹³) 1.319 (0.134×10⁻¹³) 0.936 (0.281×10⁻¹³)
LC
SER 2.199 (0.663×10⁻³) 1.136 (0.540×10⁻³) 1.314 (0.672×10⁻³)
The results of the above comparison indicated consistent results. The detection time did not affect spectrum energy P10-50 or P13-50. Their values at the LB position were significantly higher than those at other positions.
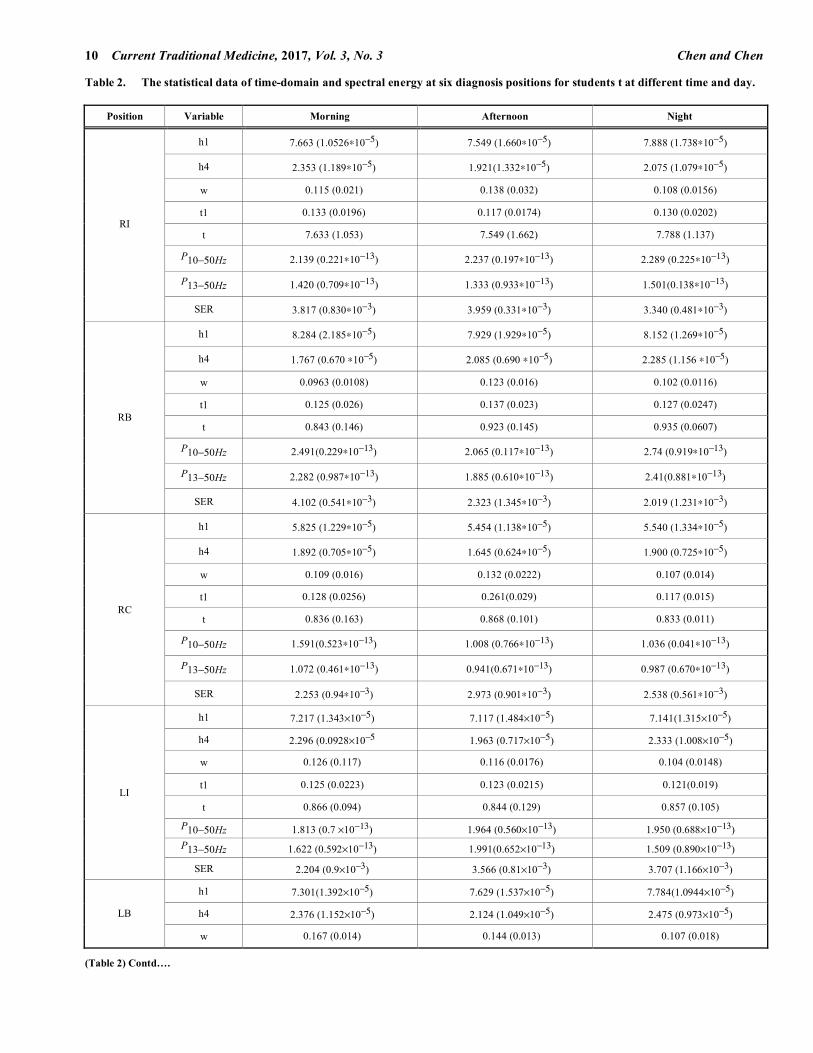
4.2. Effect of Detection Time and Day The statistical data of pressure wave and spec-tral energy at six diagnostic positions by time and day in the second experiment are in Table 2. The statistical results of five variables from the pulse wave analysis and three variables from the spec-trum analysis are in Table 3.
Form Table 3, the effect of detection time and day from pulse wave variables was inconsistent. No regular rules or relationship could be found. The statistical results of three variables from the spectrum analysis were similar. No significant dif-ference could be found for students detected at dif-ferent times or days. This result confirmed that the spectrum analysis could be used to indicate the healthy state.
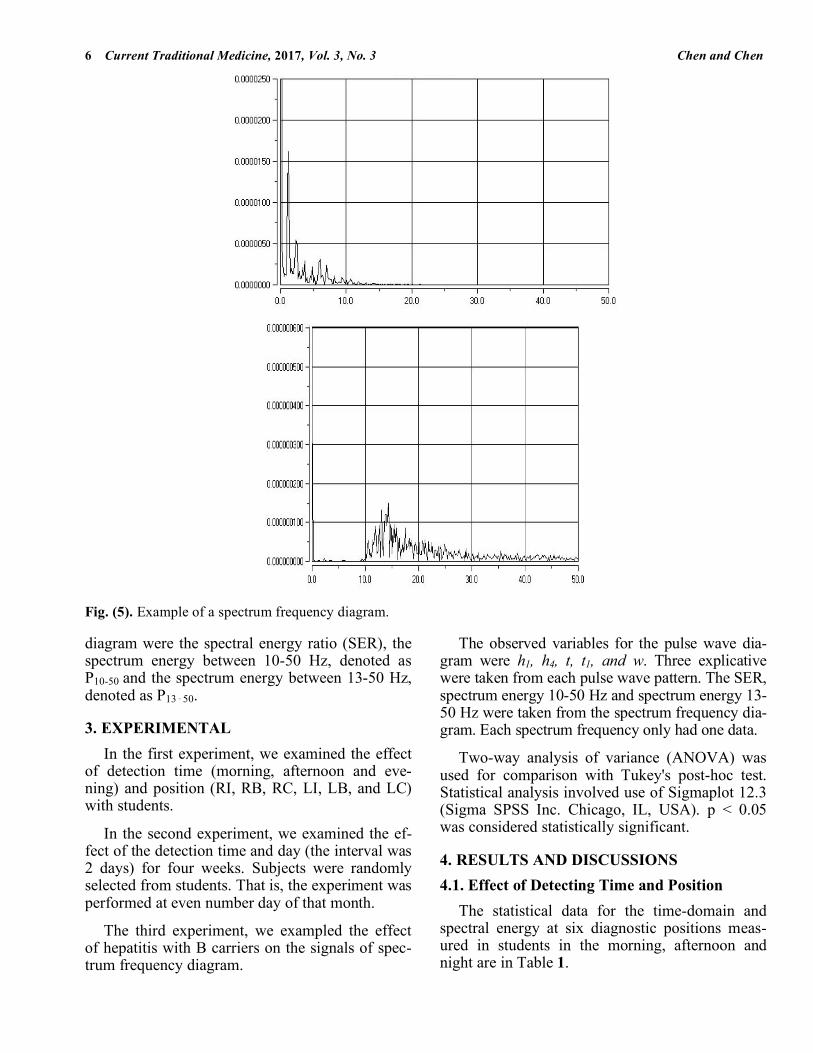
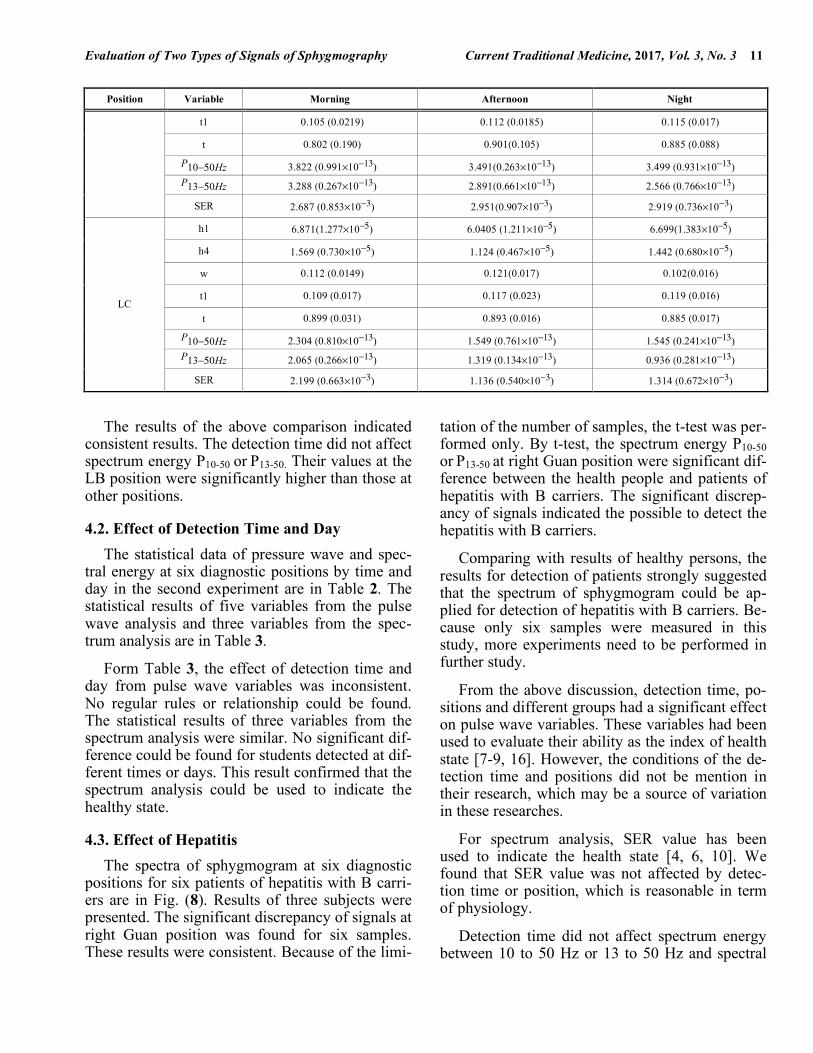
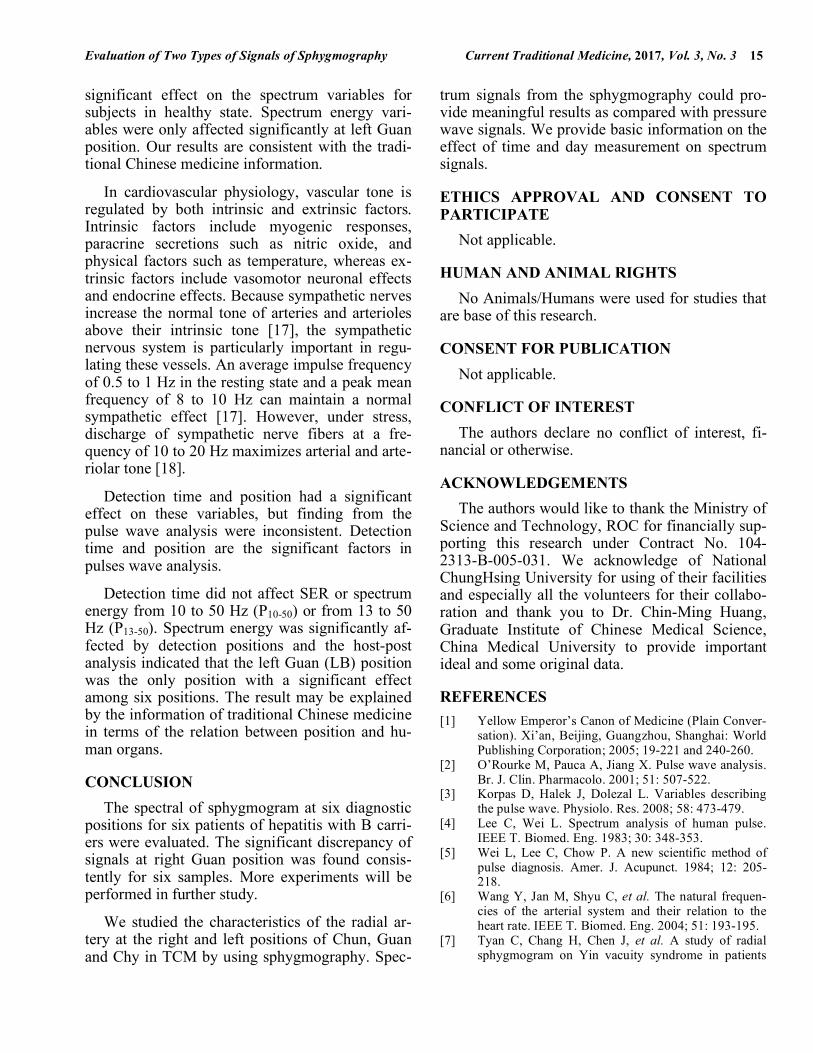
4.3. Effect of Hepatitis The spectra of sphygmogram at six diagnostic positions for six patients of hepatitis with B carri-ers are in Fig. (8). Results of three subjects were presented. The significant discrepancy of signals at right Guan position was found for six samples. These results were consistent. Because of the limi-
tation of the number of samples, the t-test was per-formed only. By t-test, the spectrum energy P10-50 or P13-50 at right Guan position were significant dif-ference between the health people and patients of hepatitis with B carriers. The significant discrep-ancy of signals indicated the possible to detect the hepatitis with B carriers.
Comparing with results of healthy persons, the results for detection of patients strongly suggested that the spectrum of sphygmogram could be ap-plied for detection of hepatitis with B carriers. Be-cause only six samples were measured in this study, more experiments need to be performed in further study.
From the above discussion, detection time, po-sitions and different groups had a significant effect on pulse wave variables. These variables had been used to evaluate their ability as the index of health state [7-9, 16]. However, the conditions of the de-tection time and positions did not be mention in their research, which may be a source of variation in these researches.
For spectrum analysis, SER value has been used to indicate the health state [4, 6, 10]. We found that SER value was not affected by detec-tion time or position, which is reasonable in term of physiology.
Detection time did not affect spectrum energy between 10 to 50 Hz or 13 to 50 Hz and spectral

12 Current Traditional Medicine, 2017, Vol. 3, No. 3 Chen and Chen
Table 3. The statistical results of five variables from the pulse wave and three variables from the spectrum analysis form the sec-ond experiment for subjects in students.
Variable Sources RI RB RC LI LB LC
h1 Day 14.54(<0.001)* 5.14(<0.001) 14.47(<0.001) 10.98(<0.001) 17.5(<0.04) 20.21(<0.001)
Time 3.50(0.0346) 1.16(0.320) 6.59(0.002) 0.31(0.7341) 10.73(<0.001) 31.75(<0.001)
Interaction 19.78(<0.001) 11.87(<0.001) 18.50(<0.001) 14.75(<0.001) 24.4(<0.001) 17.69(<0.001)
h4 Day 1.72(0.072) 7.44(<0.001) 4.77(<0.001) 1.09(0.379) 1.265(0.250) 6.17(<0.001)
Time 3.31(0.041) 7.23(<0.001) 14.52(<0.001) 1.94(0.150) 5.02(0.008) 4.22(0.018)
Interaction 3.06(<0.001) 21.10(<0.001) 6.98(<0.001) 2.84(0.0001) 2.40(0.0014) 4.28(<0.001)
t Day 14.10(<0.001) 5.81(<0.001) 10.46(<0.001) 17.07(<0.001) 9.44(<0.001) 2.81(0.002)
Time 3.05(0.0316) 15.60(<0.001) 3.44(0.037) 1.87(0.161) 19.04(<0.001) 0.75(0.414)
Interaction 17.98(<0.001) 12.20(<0.001) 8.55(<0.001) 8.65(<0.001) 5.91(<0.001) 3.20(<0.0001)
1t Day 2.39(0.009) 1.70(0.076) 3.83(<0.001) 2.90(0.002) 2.24(0.014) 4.64(<0.001)
Time 9.63(<0.001) 3.79(0.027) 3.44(0.037) 0.67(0.516) 3.96(0.0023) 6.05(0.004)
Interaction 1.11(0.349) 3.62(<0.001) 1.84(0.019) 4.16(<0.001) 1.69(0.038) 2.36(0.002)
W Day 1.05(0.414) 0.773(0.686) 5.81(<0.001) 1.29(0.261) 9.63(<0.001) 4.35(<0.001)
Time 0.94(0.40) 1.696(0.190) 33.17(<0.001) 2.07(0.133) 12.8(<0.001) 9.16(<0.001)
Interaction 1.12(0.347) 0.973(0.511) 5.61(<0.001) 0.77(0.766) 12.7(<0.001) 11.7(<0.001)
SER Day 0.87(0.587) 1.39(0.2311) 0.94(0.535) 0.91(0.556) 0.527(0.887) 1.15(0.364)
Time 0.39(0.679) 1.84(0.179) 0.36(0.703) 1.19(0.319) 0.035(0.966) 1.25(0.302)
10 50P ! Day 0.41(0.948) 0.50(0.905) 1.70(0.120) 1.51(0.181) 0.48(0.97) 2.23(0.032)
Time 0.03(0.970) 0.11(0.904) 0.32(0.727) 0.37(0.692) 0.23(0.793) 2.67(0.088)
13 50P ! Day 0.51(0.894) 0.51(0.901) 1.59(0.153) 1.62(0.14) 0.53(0.88) 2.24(0.038)
Time 0.18(0.834) 0.11(0.897) 0.27(0.767) 0.26(0.77) 0.27(0.77) 2.86(0.075)
*: F value (p-value).
energy density. The left Guan (LB) position had a significant effect among the six positions. The re-sults might be explained in terms of cardiovascular physiology. The vascular smooth muscles are in-nervated by nerve fibers and could be exposed to recurrent oscillation stimuli. The most sympathetic nerves are discharged between 2 and 6 Hz. Under the stress, the discharged energy increase to 50 Hz [17]. The left Guan (LB) position is related with the stress in humans and influences the state of the liver [1]. So the left Guan (LB) is the position for diagnosing stress. Students are under high objec-tive and subjective stress than is the general popu-lation in Taiwan, therefore, the LB pulse may be affected.
P10-50 and P13-50 are appropriate for evaluating the health of humans. Our results are similar to the previous finding [4, 6, 10, 16]. The spectrum of sphygmography was useful for detection of dys-
pepsia and rhinitis [11]. In our study, the spectrum of sphygmography at right Guan position had the significant discrepancy to other five positions for the patients of hepatitis with B carriers. The result proved that the sphygmogram could be a useful tool for detection of disease.
In this study, a sphygmography was used to re-cord the variation in the arterial pulse expressed pressure wave and spectrum frequency signals. The signals were measured at three positions in the left and right hands in students and a sample of the general population in Taiwan. Five variables taken from the pressure wave signals and three variables taken from the spectrum analysis were used and then were evaluated by ANOVA and the Tukey’s test. Some variables from the pressure wave sig-nals were affected by subject, time of measure-ment and positions. However, these results were consistent. Detecting time and day did not have

Evaluation of Two Types of Signals of Sphygmography Current Traditional Medicine, 2017, Vol. 3, No. 3 13
(a)
(b)
(c)
Fig. (8). Contd….

14 Current Traditional Medicine, 2017, Vol. 3, No. 3 Chen and Chen
(d)
(e)
(f)
Fig. (8). The spectra of sphygmogram at six diagnostic positions for six patients of hepatitis with B carriers.
Evaluation of Two Types of Signals of Sphygmography Current Traditional Medicine, 2017, Vol. 3, No. 3 15
significant effect on the spectrum variables for subjects in healthy state. Spectrum energy vari-ables were only affected significantly at left Guan position. Our results are consistent with the tradi-tional Chinese medicine information.
In cardiovascular physiology, vascular tone is regulated by both intrinsic and extrinsic factors. Intrinsic factors include myogenic responses, paracrine secretions such as nitric oxide, and physical factors such as temperature, whereas ex-trinsic factors include vasomotor neuronal effects and endocrine effects. Because sympathetic nerves increase the normal tone of arteries and arterioles above their intrinsic tone [17], the sympathetic nervous system is particularly important in regu-lating these vessels. An average impulse frequency of 0.5 to 1 Hz in the resting state and a peak mean frequency of 8 to 10 Hz can maintain a normal sympathetic effect [17]. However, under stress, discharge of sympathetic nerve fibers at a fre-quency of 10 to 20 Hz maximizes arterial and arte-riolar tone [18].
Detection time and position had a significant effect on these variables, but finding from the pulse wave analysis were inconsistent. Detection time and position are the significant factors in pulses wave analysis.
Detection time did not affect SER or spectrum energy from 10 to 50 Hz (P10-50) or from 13 to 50 Hz (P13-50). Spectrum energy was significantly af-fected by detection positions and the host-post analysis indicated that the left Guan (LB) position was the only position with a significant effect among six positions. The result may be explained by the information of traditional Chinese medicine in terms of the relation between position and hu-man organs.
CONCLUSION The spectral of sphygmogram at six diagnostic positions for six patients of hepatitis with B carri-ers were evaluated. The significant discrepancy of signals at right Guan position was found consis-tently for six samples. More experiments will be performed in further study.
We studied the characteristics of the radial ar-tery at the right and left positions of Chun, Guan and Chy in TCM by using sphygmography. Spec-
trum signals from the sphygmography could pro-vide meaningful results as compared with pressure wave signals. We provide basic information on the effect of time and day measurement on spectrum signals.
ETHICS APPROVAL AND CONSENT TO PARTICIPATE Not applicable.
HUMAN AND ANIMAL RIGHTS No Animals/Humans were used for studies that are base of this research.
CONSENT FOR PUBLICATION Not applicable.
CONFLICT OF INTEREST The authors declare no conflict of interest, fi-nancial or otherwise.
ACKNOWLEDGEMENTS The authors would like to thank the Ministry of Science and Technology, ROC for financially sup-porting this research under Contract No. 104-2313-B-005-031. We acknowledge of National ChungHsing University for using of their facilities and especially all the volunteers for their collabo-ration and thank you to Dr. Chin-Ming Huang, Graduate Institute of Chinese Medical Science, China Medical University to provide important ideal and some original data.
REFERENCES [1] Yellow Emperor’s Canon of Medicine (Plain Conver-
sation). Xi’an, Beijing, Guangzhou, Shanghai: World Publishing Corporation; 2005; 19-221 and 240-260.
[2] O’Rourke M, Pauca A, Jiang X. Pulse wave analysis. Br. J. Clin. Pharmacolo. 2001; 51: 507-522.
[3] Korpas D, Halek J, Dolezal L. Variables describing the pulse wave. Physiolo. Res. 2008; 58: 473-479.
[4] Lee C, Wei L. Spectrum analysis of human pulse. IEEE T. Biomed. Eng. 1983; 30: 348-353.
[5] Wei L, Lee C, Chow P. A new scientific method of pulse diagnosis. Amer. J. Acupunct. 1984; 12: 205-218.
[6] Wang Y, Jan M, Shyu C, et al. The natural frequen-cies of the arterial system and their relation to the heart rate. IEEE T. Biomed. Eng. 2004; 51: 193-195.
[7] Tyan C, Chang H, Chen J, et al. A study of radial sphygmogram on Yin vacuity syndrome in patients

16 Current Traditional Medicine, 2017, Vol. 3, No. 3 Chen and Chen
with Systemic Lupus Erythematosus. J. Chin. Med. 2001; 12: 145-154.
[8] Chang H. The association between left ventricular function and sphygmogram of heat failure patients. Yearbook Chin. Med. Pharm. 2005; 23: 375-424.
[9] Feng J. Contemporary Sphygmology in Traditional Chinese Medicine. Beijing: People's Health Publish-ing House 2003; 163-165.
[10] Wei L, Chow P. Frequency distribution of human pulse spectra. IEEE T. Biomed.l Eng. 1984; 32: 245.
[11] Huang C, Chang H, Kao S, et al. Radial pressure pulse and heart rate variability in heat- and cold-stressed humans. Evid.-Based Complement. Altern. Med. 2011a; doi:10.1155/2011/751317.
[12] Huang C, Chang H, Kao S, et al. Radial pressure pulse and heart rate variability in Normotensive and Hypertensive subjects. J. Altern. Complem. Med. 2011b; 21: 1-8.
13] Huang C, Chang H, Kao S, et al. Application of sphygmography to detection of dyspepsia and the rhinitis. Amer. J. Chin. Med. 2011c; 39: 271-285.
[14] Jeon Y, Kim J, Lee H, et al. A clinical study of the pulse wave characteristics at the three pulse diagnosis positions of Chon, Gwan and Cheok. Evid.-Based Complement. Altern. Med. 2009; doi:10.1093/ecam/ nep150.
[15] Huang C, Chang C, Li T, et al. Acupuncture effects on the pulse spectrum of radial pressure pulse in dys-pepsia. Amer. J. Chin. Med. 2012; 40: 443-454.
[16] Liu C, Wei C, Lo P. Variation analysis of sphyg-mogram to assess cardiovascular system under media-tion. Evid.-Based Complement. Altern. Med. 2009; 6: 107-112.
[17] Levick JR. An Introduction to Cardiovascular Physi-ology. 4th ed. London: Arnold Publications 2003; 211 and 217-250.
[18] Guyton AC, Hall JE. Textbook of Medical Physiol-ogy. 11th ed (International edition). Philadelphia: El-sevier Saunders; 2006; 756.
DISCLAIMER: The above article has been published in Epub (ahead of print) on the basis of the materials provided by the author. The Edito-rial Department reserves the right to make minor modifications for further improvement of the manuscript.