Embed Size (px)
Citation preview
Scholars' Mine Scholars' Mine
Masters Theses Student Theses and Dissertations
Fall 2010
Evaluation of metal detection audio alert signals of AN/PSS-14 by Evaluation of metal detection audio alert signals of AN/PSS-14 by
means of real time visualization means of real time visualization
Sandesh Srikantaiah Chandrashekar
Follow this and additional works at: https://scholarsmine.mst.edu/masters_theses
Part of the Mechanical Engineering Commons
Department: Department:
Recommended Citation Recommended Citation Srikantaiah Chandrashekar, Sandesh, "Evaluation of metal detection audio alert signals of AN/PSS-14 by means of real time visualization" (2010). Masters Theses. 4806. https://scholarsmine.mst.edu/masters_theses/4806
This thesis is brought to you by Scholars' Mine, a service of the Missouri S&T Library and Learning Resources. This work is protected by U. S. Copyright Law. Unauthorized use including reproduction for redistribution requires the permission of the copyright holder. For more information, please contact [email protected].
EVALUATION OF METAL DETECTION AUDIO ALERT SIGNALS OF AN/PSS-14
BY MEANS OF REAL TIME VISUALIZATION
by
SANDESH SRIKANTAIAH CHANDRASHEKAR
A THESIS
Presented to the Faculty of the Graduate School of the
MISSOURI UNIVERSITY OF SCIENCE AND TECHNOLOGY
In Partial Fulfillment of the Requirements for the Degree
MASTER OF SCIENCE IN MECHANICAL ENGINEERING
2010
Approved by
Virgil Flanigan, Advisor
K. Chandrashekhara
Richard Rechtein

iii
ABSTRACT
The sweep arm of the AN/PSS-14 Landmine Detector attached to an independent
visualization device will transform the AN/PSS-14 into a hand-held data acquisition
system for conversion of real time MD and GPR audio alert signals into captured visual
trace displays on an on-board PDA computer screen so that momentary sounds of
millisecond durations can be captured and displayed for visual scrutiny and interpretation
by analytical on-board data processing procedures. This is a part of a two-man team that
is developing a visual data adapter for the AN/PSS-14 Landmine Detector where the
current thesis is concentrating only on MD audio alerts.
The visualization device displays the amplitude-time plot and the instantaneous
frequency-time plots of the MD audio alert signal for better understanding and for
distinction of metallic firing pins from metallic clutter. This is achieved by the
identification of the metal type, which would be common in any given landmine field and
by observing the symmetric deviations of the amplitude envelope along multiple sweep
directions over a buried target. The analysis of this research is constrained to only
vertical firing pins.
Further, analyzing the frequencies of different types of firing pin (different metal
types), it can be concluded that the frequency response of the AN/PSS-14 to metallic
targets are specific to metals. This process is only applicable for single, isolated MD
audio signals.

iv
ACKNOWLEDGMENTS
I would like to thank all people who have helped and inspired me during my
masters‟ study. I especially want to thank my advisor; Dr. Virgil Flanigan for his
support, guidance, encouragement from the initial to the final level enabled me to
develop an understanding of the subject and for providing financial support.
I am indebted to Dr. K. Chandrashekhara for recommending me to this
opportunity in the first place, for being on my committee and for his constant support.
I would like to show my gratitude to my research guide Dr. Richard Rechtein for
working with me on this project and for being in my committee. His experience in
seismic and electromagnetic data acquisition, processing and mechanical systems is
invaluable.
I am thankful to Department of Mechanical and Aerospace Engineering and the
Center for Environmental Sciences and Technology faculty and staff. I would like extend
my regards to Nitin Kolekar for being my research partner and for helping me in a
number of ways to complete this project.
I would also like to thank all family members and friends for their continued
support and for having the confidence in me and helping me reach my goal.

v
TABLE OF CONTENTS
Page
ABSTRACT………………………………………......................................................... ..iii
ACKNOWLEDGMENTS…………………………………………………………..........iv
LIST OF FIGURES…………………………………………………………...................vii
LIST OF TABLES…………………………………………………………………..........ix
SECTION
1. INTRODUCTION…………………………………............................….......................1
1.1. ELECTROMAGNETIC WAVE EQUATION………………………..................2
1.2. METAL DETECTION………..…………………………...……………..............5
1.3. GROUND PENETRATING RADAR…….........................................................11
1.4. SKIN DEPTH…………………………………...................................................14
2. PROJECT DESCRIPTION………………………………….………….......................16
2.1. PROJECT OBJECTIVE………………….……………….……….……............16
2.2. PROJECT BACKGROUND…………………………….....…...........................17
2.3. LINEAR SWEEP FACILITY (LSF)……………………………….…..............19
3. DESIGN METHODOLOGY………………………………………………………….22
3.1. DESIGN PROCESS…………….……………………………………................22
3.2. HAND-HELD VISUALIZATION INSTRUMENTATION……………...........23
3.2.1. Hand-Held Computer……………………………………………................23
3.2.2. Hardware Requirement…………………………………………..................23
3.2.3. Connection………………………………...………………….…….............24
vi
3.2.4. Software………………………………………………………………….…24
3.3. INSTRUMENTATION SELECTED…………………………..……………….25
4. INSTANTANEOUS FREQUENCY PROGRAMMING……………………………..26
4.1. ALGORITHM ……………………….…………………………………………26
4.2. LABVIEW PROGRAM …..……………………………...…………………….28
5. INSTANTANEOUS FREQUENCY RESULTS……………………………………...31
6. CONCLUSIONS AND FUTURE WORK…………………………………………....40
BIBLIOGRAPHY.………………...…………………………………….…….................42
VITA……………………………………………………………......................................43

vii
LIST OF FIGURES
Figure Page
1.1. AN/PSS-14……………………………………………………………........................2
1.2. MD Coil Transmitting ………………………………………...……….……..............6
1.3. MD Coil Receiving Metallic Returns…………………………...................................6
1.4. MD Audio Alert for a Standard, Non-Metallic, Anti-Personal (AP) Landmine
Simulator with a Low-Metallic, Vertically Orientated Firing Pin................................7
1.5. MD Radiation Field....................................................................................................10
1.6. MD Total Field Shape Co-relation.............................................................................10
1.7. GPR Signal Transmitting......................................................................... ...................12
1.8. GPR Reflected Signal.......................................................................................... .......13
1.9. Planar Logarithmic Spiral Antennas...........................................................................13
1.10. Electromagnetic Dipole Showing Primary and Secondary Magnetic Fields............15
2.1. Linear Sweep Facility…................................................................................ .............20
4.1. Algorithms for Instantaneous Frequency and Instantaneous Amplitude……………28
4.2. LabView Code.…....................………………….…………………………..............29
5.1. MD Audio Alert for Aluminum with Background Noise………………….……......31
5.2. Filtered MD Audio Alert for an Aluminum Firing Pin……………………………...32
5.3. MD Audio Alert Envelope for an Aluminum Firing Pin…………..........…………..33
5.4. Unwrapped Phase of the Analytical Signal for Aluminum Firing Pin............….......33
5.5. Instantaneous Frequency of the MD Audio Alert signal for Aluminum Firing
Pin.……….....................................……………..............…...…............……….....34
5.6. Filtered MD Audio Alert…….…………….......................……………...…….……35
5.7. MD Audio Alert Envelope.......................................…………………………....…...36

viii
5.8. Instantaneous Frequency Plot.....................................................................................36
5.9. Frequency Response to Five Conductors....................…………………………....…37
5.10. Amplitude Response to Five Conductors.................................................................38

ix
LIST OF TABLES
Table Page
5.1. Metal Type and Instantaneous Frequency Values…………………………..............38
1. INTRODUCTION
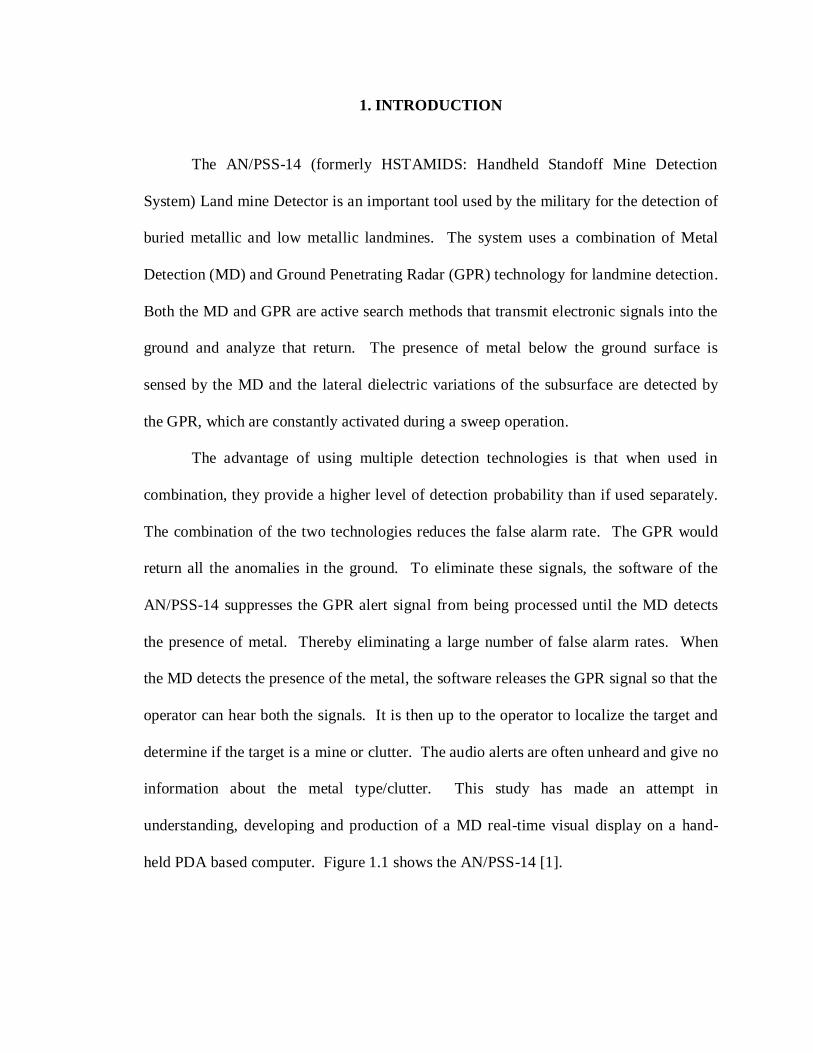
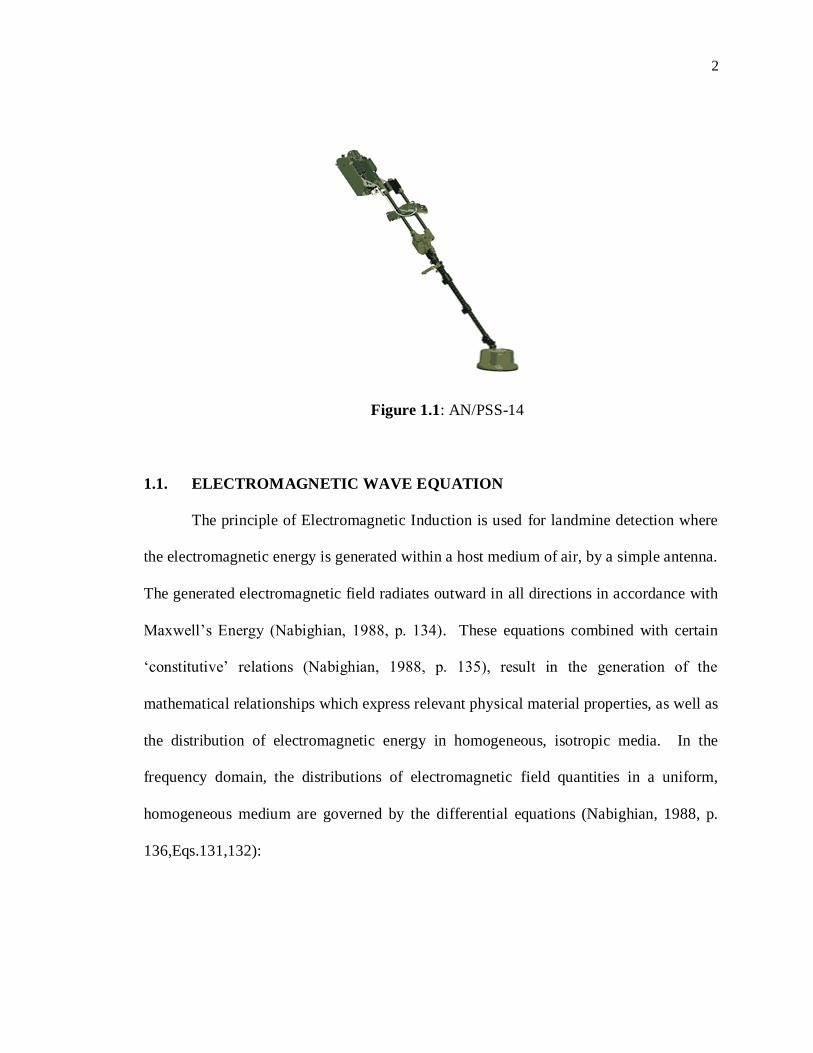
The AN/PSS-14 (formerly HSTAMIDS: Handheld Standoff Mine Detection
System) Land mine Detector is an important tool used by the military for the detection of
buried metallic and low metallic landmines. The system uses a combination of Metal
Detection (MD) and Ground Penetrating Radar (GPR) technology for landmine detection.
Both the MD and GPR are active search methods that transmit electronic signals into the
ground and analyze that return. The presence of metal below the ground surface is
sensed by the MD and the lateral dielectric variations of the subsurface are detected by
the GPR, which are constantly activated during a sweep operation.
The advantage of using multiple detection technologies is that when used in
combination, they provide a higher level of detection probability than if used separately.
The combination of the two technologies reduces the false alarm rate. The GPR would
return all the anomalies in the ground. To eliminate these signals, the software of the
AN/PSS-14 suppresses the GPR alert signal from being processed until the MD detects
the presence of metal. Thereby eliminating a large number of false alarm rates. When
the MD detects the presence of the metal, the software releases the GPR signal so that the
operator can hear both the signals. It is then up to the operator to localize the target and
determine if the target is a mine or clutter. The audio alerts are often unheard and give no
information about the metal type/clutter. This study has made an attempt in
understanding, developing and production of a MD real-time visual display on a hand-
held PDA based computer. Figure 1.1 shows the AN/PSS-14 [1].
2
Figure 1.1: AN/PSS-14
1.1. ELECTROMAGNETIC WAVE EQUATION
The principle of Electromagnetic Induction is used for landmine detection where
the electromagnetic energy is generated within a host medium of air, by a simple antenna.
The generated electromagnetic field radiates outward in all directions in accordance with
Maxwell‟s Energy (Nabighian, 1988, p. 134). These equations combined with certain
„constitutive‟ relations (Nabighian, 1988, p. 135), result in the generation of the
mathematical relationships which express relevant physical material properties, as well as
the distribution of electromagnetic energy in homogeneous, isotropic media. In the
frequency domain, the distributions of electromagnetic field quantities in a uniform,
homogeneous medium are governed by the differential equations (Nabighian, 1988, p.
136,Eqs.131,132):
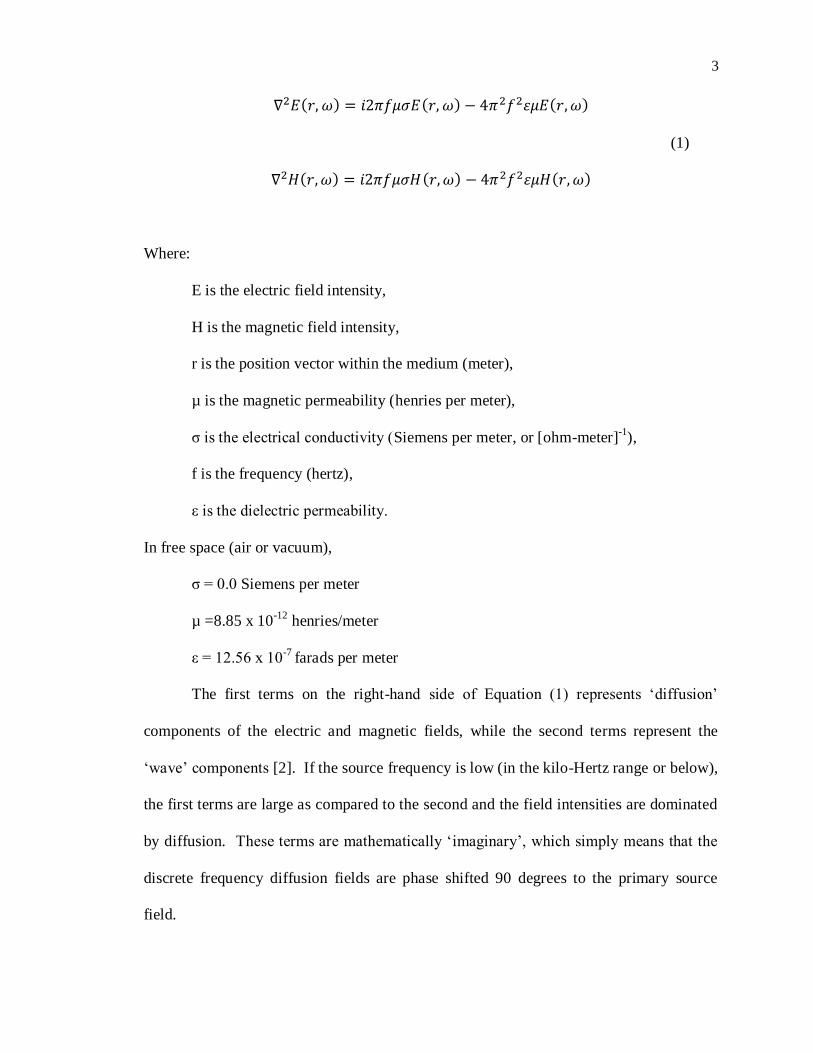
3
(1)
Where:
E is the electric field intensity,
H is the magnetic field intensity,
r is the position vector within the medium (meter),
µ is the magnetic permeability (henries per meter),
σ is the electrical conductivity (Siemens per meter, or [ohm-meter]-1
),
f is the frequency (hertz),
ε is the dielectric permeability.
In free space (air or vacuum),
σ = 0.0 Siemens per meter
µ =8.85 x 10⁻¹²
henries/meter
ε = 12.56 x 10⁻⁷
farads per meter
The first terms on the right-hand side of Equation (1) represents „diffusion‟
components of the electric and magnetic fields, while the second terms represent the
„wave‟ components [2]. If the source frequency is low (in the kilo-Hertz range or below),
the first terms are large as compared to the second and the field intensities are dominated
by diffusion. These terms are mathematically „imaginary‟, which simply means that the
discrete frequency diffusion fields are phase shifted 90 degrees to the primary source
field.
4
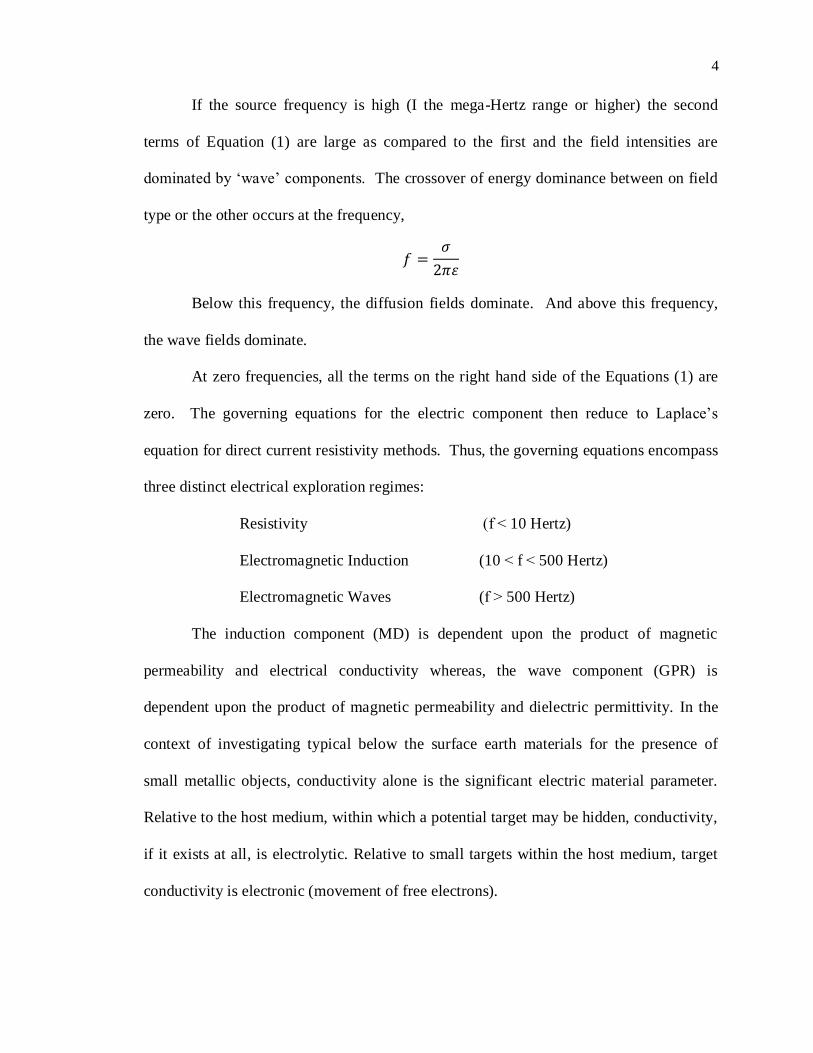
If the source frequency is high (I the mega-Hertz range or higher) the second
terms of Equation (1) are large as compared to the first and the field intensities are
dominated by „wave‟ components. The crossover of energy dominance between on field
type or the other occurs at the frequency,
Below this frequency, the diffusion fields dominate. And above this frequency,
the wave fields dominate.
At zero frequencies, all the terms on the right hand side of the Equations (1) are
zero. The governing equations for the electric component then reduce to Laplace‟s
equation for direct current resistivity methods. Thus, the governing equations encompass
three distinct electrical exploration regimes:
Resistivity (f ˂ 10 Hertz)
Electromagnetic Induction (10 ˂ f ˂ 500 Hertz)
Electromagnetic Waves (f ˃ 500 Hertz)
The induction component (MD) is dependent upon the product of magnetic
permeability and electrical conductivity whereas, the wave component (GPR) is
dependent upon the product of magnetic permeability and dielectric permittivity. In the
context of investigating typical below the surface earth materials for the presence of
small metallic objects, conductivity alone is the significant electric material parameter.
Relative to the host medium, within which a potential target may be hidden, conductivity,
if it exists at all, is electrolytic. Relative to small targets within the host medium, target
conductivity is electronic (movement of free electrons).

5
1.2. METAL DETECTION
Landmine‟s firing pins, shrapnel, or in portions of the casing are usually built
using metal. The Metal Detection system is the heart of the AN/PSS-14 which detects
metal if the mine has enough detectable metal. Without the MD system the GPR system
will not be activated. The AN/PSS-14 is programmed to give out different types of audio
alerts for different metals. The metal detector consists of an oscillator producing an
alternating current that passes through a coil producing an alternating magnetic field. The
MD coil is a cylindrically shaped coil covering the entire diameter of the sensor head of
the AN/PSS-14. The MD coils consist of a low frequency transmission and receiver
induction coils. The transmission coil continuously transmits magnetic pulses during
operation. When a piece of electrically conductive metal is close to the coil, eddy
currents will be induced by the pulses in the metal. The eddy currents in turn create an
alternating secondary magnetic field. Depending on the composition and the quantity of
the metal in the target, the secondary magnetic field may be strong enough to be detected
by the system‟s MD receiver coil. When metal is detected in a buried object, an audio
signal is provided to the operator through an earpiece.
The following figures illustrate how a metallic object is detected. Figure 1.2
shows the block diagram operation of an AN/PSS-14 MD transmitting coil continually
transmitting magnetic pulses, while Figure 1.3 shows the block diagram operation of an
AN/PSS-14 MD receiving coil receiving metallic returns [3].

6
Figure 1.2: MD Coil Transmitting
Buried Object
Magnetic Pulses
Coil
Electronics
Unit
Pulse Generator
& Transmitter
Sensor
Head
Secondary
Magnetic Field
Electronics
Unit
Sensor
Head
Coil
Signal Processor
Buried Object
Figure 1.3: MD Coil Receiving Metallic Returns

7
While the MD transmitter coil is continuously transmitting magnetic pulses, the
MD Audio alert can be heard at all times even in the absence of surface, subsurface or
metal content due to electromagnetic background noise. The MD receiver starts picking
up the low frequency induction signal as it comes in the vicinity of metallic objects and
the MD audio alert increases in magnitude as the sensor head passes over the object. The
audio alert signal will have the maximum amplitude when the transmitter-receiver is right
over the head of a vertical firing pin along the sweep direction. This is illustrated in
Figure 1.4 [4]. The MD alert curve should be a symmetrical for a vertical firing pin swept
with a constant speed. The maximum amplitude of the MD audio alert envelope occurs
right at that time of the sweep when the centre of the transmitter-receiver antenna is on
top of a vertical firing pin.
Figure 1.4: MD Audio Alert for a Standard, Non-Metallic, and Anti-Personal (AP)
Landmine Simulator with a Low-Metallic, Vertically Orientated Firing Pin
The shape of the envelope of the illustrated example is dependent upon the lateral
extent and geometry of the metallic object and the magnitude of the Total Illumination
Field of the AN/PSS-14 Induction Coil. The AN/PSS-14 has a decision making algorithm
that considers 100 distinct measured values associated with the transmitted and received

8
wave fields, two of which are associated with the MD measurement. The MD audio
signal has been synthetically engineered to produce frequency modulated content which
reveals information relative to the „Metal Factor‟ or electrical conductivity of the metallic
target. Thereby, the MD signal contains material information relative to the metal type of
the firing pin.
The evident background noise that is seen in the above illustration is semi-
deterministic which contains a dominant low-level sinusoidal in nature. Its frequency is
determined to be in the neighborhood of 800 Hertz. The noise component is readily
perceivable in an instantaneous frequency-time display and not so obvious in a spectral
frequency-time display. The important addition of this noise to the audio alert is that it
provides a frequency reference for the modulated frequency content associated with the
Metal Factor of a given firing pin.
Most solid constituents (clay, sand, gravel, etc) of near surface materials, wherein
land mines are to be found are essentially non-conductors of electric current. For a
material in a surface to be conductive at all, electric conduction must be electrolytic; the
conducting medium being an aqueous solution of common salts distributed in a
complicated manner through the void structure of the material. The conductivity of such
surface material will depend upon the porosity and permeability of the medium, the
degree of saturation of pore spaces, the salinity of the water and the way in which the
water is distributed.
Relative to electromagnetic fields, the substantive mineral property is the product
of magnetic permeability and conductivity-as seen in the first (inductive) term on the
right hand side of Equation (1). Magnetic permeability plays the role of magnification of

9
the inductive field, so that minerals with high electrical conductivity and low magnetic
permeability have commensurate response to inductive magnetic fields as minerals with
low electrical conductivity and high magnetic permeability.
The lateral extent of the MD alerts from a cylindrically shaped aluminum vertical
pin simulators should be approximately 20 cm. The size is dependent on the diameter of
the transmitter-receiver coil. In case of AN/PSS-14, the MD coil diameter is 19 cm. The
figure below shows the AN/PSS-14 audio alerts, transmitter-receiver-landmine
orientation and the field strength of the AN/PSS-14 MD emission filed. The total MD
emission field along with the vertical (red) and the radial (blue) components are also
shown. MD audio alert amplitude envelope is a function of the distance along the sweep
which mirrors the total field of the AN/PSS-14 MD emission field. The total MD
emission field is the sum of the squares of the vertical and radial components. The
temporal peak positions of the MD audio alert amplitude depends on the sweep speed: as
the speed increases the two positions (onset and offset) of the maximum MD audio alert
merge towards a single peak. At zero sweep speed the distance between MD peaks is
approximately 16 cm determined by the diameter of the MD Induction Coil. When
viewed in a time frame, the time interval from peak to peak decreases at a rate given by:
speed x time. The sweep shown below is for a vertical aluminum firing pin simulator.
Figure 1.5 shows the MD radiation field strength in a 3-D plot.
The MD audio alert at slow sweep speed is shown in Figure 1.6. When the onset
edge of the MD transmission passes over the firing pin, the slope of the MD curve starts
increasing and when the center the MD transmission coil passes over the firing pin, the

10
slope of the MD curve starts decreasing. The two peaks of the MD curve shown below
converge as one peak as the sweep speed increases.
Figure 1.5: MD Radiation
Field
Figure 1.6: MD Total Field Shape Co-relation
11
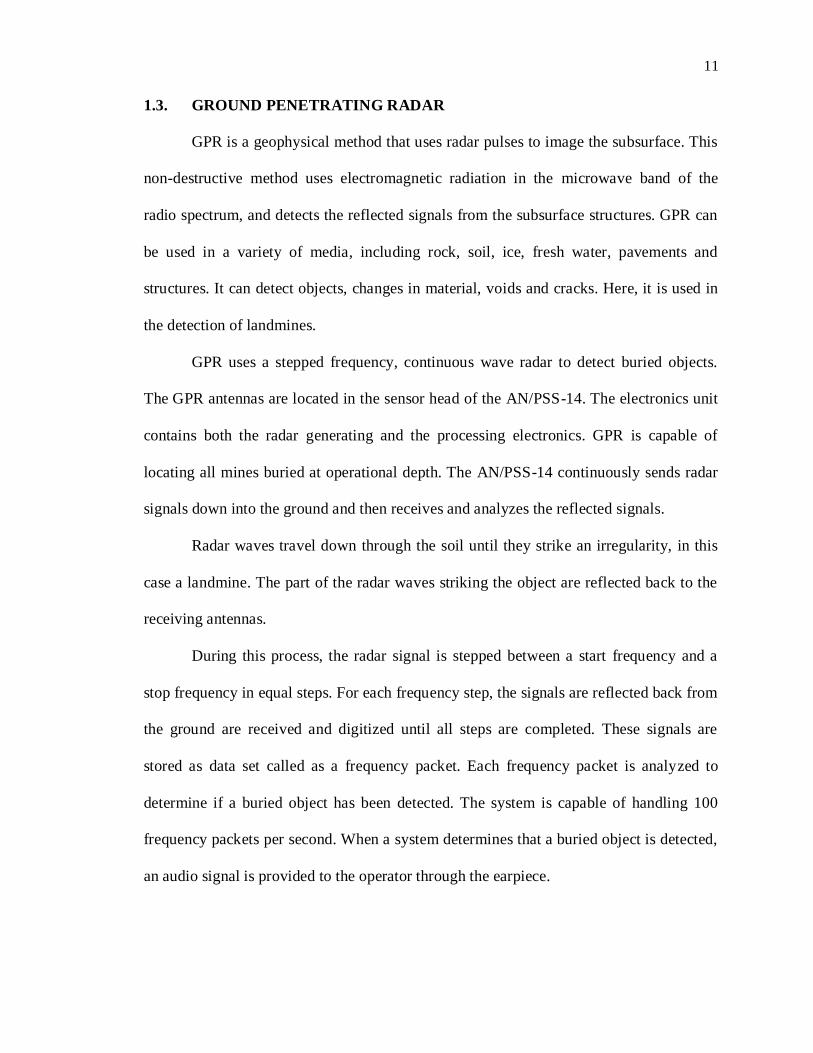
1.3. GROUND PENETRATING RADAR
GPR is a geophysical method that uses radar pulses to image the subsurface. This
non-destructive method uses electromagnetic radiation in the microwave band of the
radio spectrum, and detects the reflected signals from the subsurface structures. GPR can
be used in a variety of media, including rock, soil, ice, fresh water, pavements and
structures. It can detect objects, changes in material, voids and cracks. Here, it is used in
the detection of landmines.
GPR uses a stepped frequency, continuous wave radar to detect buried objects.
The GPR antennas are located in the sensor head of the AN/PSS-14. The electronics unit
contains both the radar generating and the processing electronics. GPR is capable of
locating all mines buried at operational depth. The AN/PSS-14 continuously sends radar
signals down into the ground and then receives and analyzes the reflected signals.
Radar waves travel down through the soil until they strike an irregularity, in this
case a landmine. The part of the radar waves striking the object are reflected back to the
receiving antennas.
During this process, the radar signal is stepped between a start frequency and a
stop frequency in equal steps. For each frequency step, the signals are reflected back from
the ground are received and digitized until all steps are completed. These signals are
stored as data set called as a frequency packet. Each frequency packet is analyzed to
determine if a buried object has been detected. The system is capable of handling 100
frequency packets per second. When a system determines that a buried object is detected,
an audio signal is provided to the operator through the earpiece.

12
The AN/PSS-14 GPR uses three antennas mounted in a shape of a triangle in the
sensor head. One antenna transmits radar signals into the ground and the other two
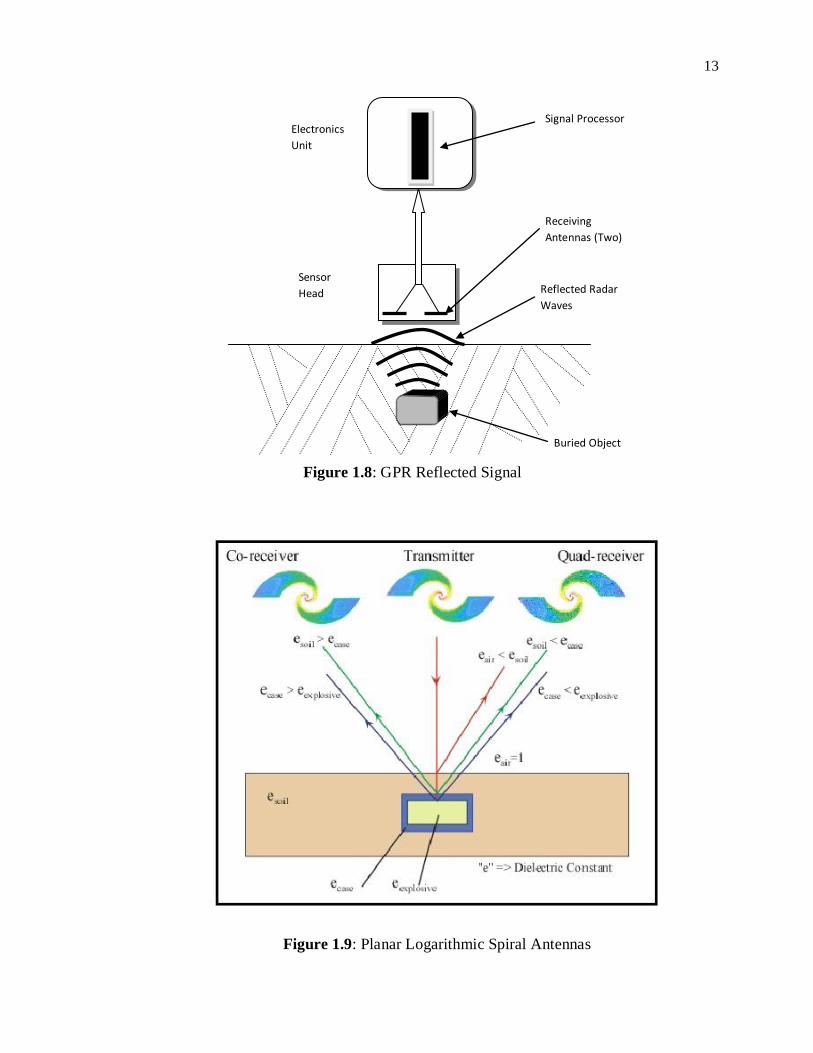
antennas receive the reflected radar signals. Figure 1.7 and Figure 1.8 show the operation
of GPR.
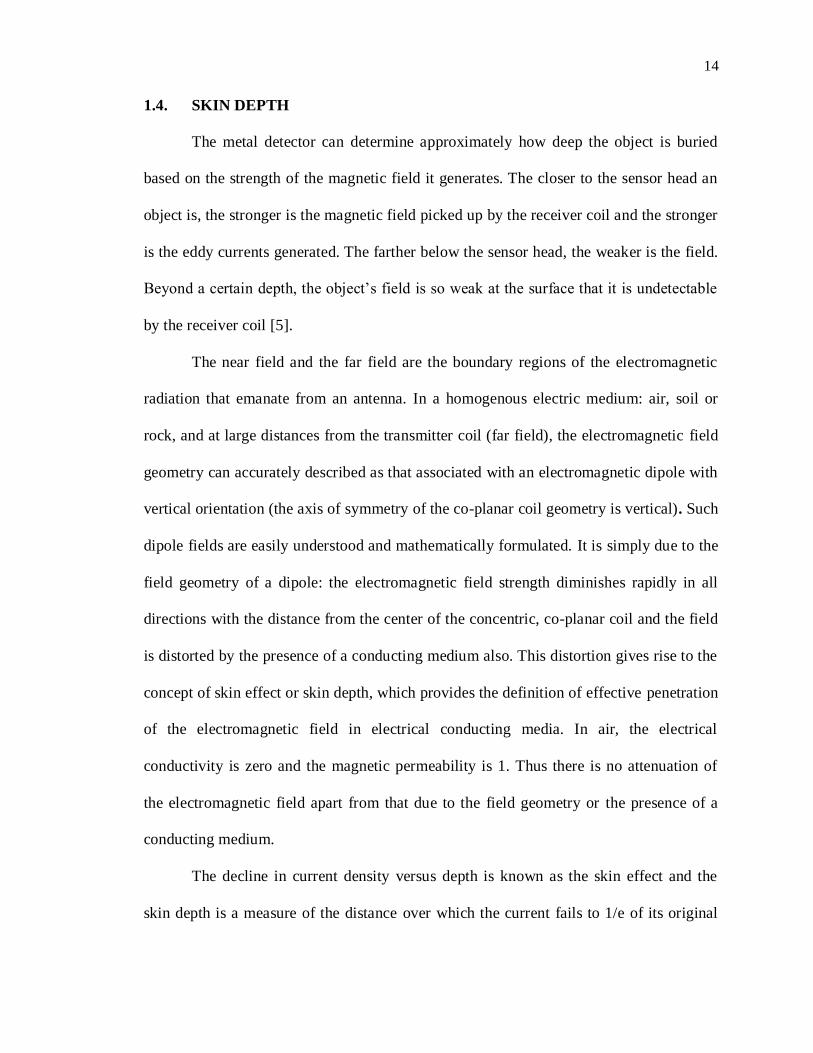
Figure 1.9 shows the planar logarithmic spiral antennas. The co-polarity and the
quad-polarity of the receiver antennas relative to the transmission antenna are shown.
Note that the co-receiver only senses reflections from the interfaces across which the
dielectric constant decreases with depth. The converse is true for the quad-receiver.
Transmission field components across any boundary layer always retain the polarity of
the incident wave component.
Figure 1.7: GPR Signal Transmitting
Sensor
Head
Electronics
Unit
Buried Object
Transmitted
Radar Waves
Transmit
Antenna
Radar Wave
Generator
13
Figure 1.8: GPR Reflected Signal
Figure 1.9: Planar Logarithmic Spiral Antennas
Buried Object
Reflected Radar
Waves
Receiving
Antennas (Two)
Signal Processor Electronics
Unit
Sensor
Head
14
1.4. SKIN DEPTH
The metal detector can determine approximately how deep the object is buried
based on the strength of the magnetic field it generates. The closer to the sensor head an
object is, the stronger is the magnetic field picked up by the receiver coil and the stronger
is the eddy currents generated. The farther below the sensor head, the weaker is the field.
Beyond a certain depth, the object‟s field is so weak at the surface that it is undetectable
by the receiver coil [5].
The near field and the far field are the boundary regions of the electromagnetic
radiation that emanate from an antenna. In a homogenous electric medium: air, soil or
rock, and at large distances from the transmitter coil (far field), the electromagnetic field
geometry can accurately described as that associated with an electromagnetic dipole with
vertical orientation (the axis of symmetry of the co-planar coil geometry is vertical). Such
dipole fields are easily understood and mathematically formulated. It is simply due to the
field geometry of a dipole: the electromagnetic field strength diminishes rapidly in all
directions with the distance from the center of the concentric, co-planar coil and the field
is distorted by the presence of a conducting medium also. This distortion gives rise to the
concept of skin effect or skin depth, which provides the definition of effective penetration
of the electromagnetic field in electrical conducting media. In air, the electrical
conductivity is zero and the magnetic permeability is 1. Thus there is no attenuation of
the electromagnetic field apart from that due to the field geometry or the presence of a
conducting medium.
The decline in current density versus depth is known as the skin effect and the
skin depth is a measure of the distance over which the current fails to 1/e of its original
15
value. A gradual change in phase accompanies the change in magnitude, so that, at a
given time and at appropriate depths, the current can be flowing in the opposite direction
to that at the surface.
For distances from the center of the transmitter coil of the order of the coil
diameter or less (near field), the electromagnetic field geometry is much more
complicated. The near field dominates over the far field within this distance range and
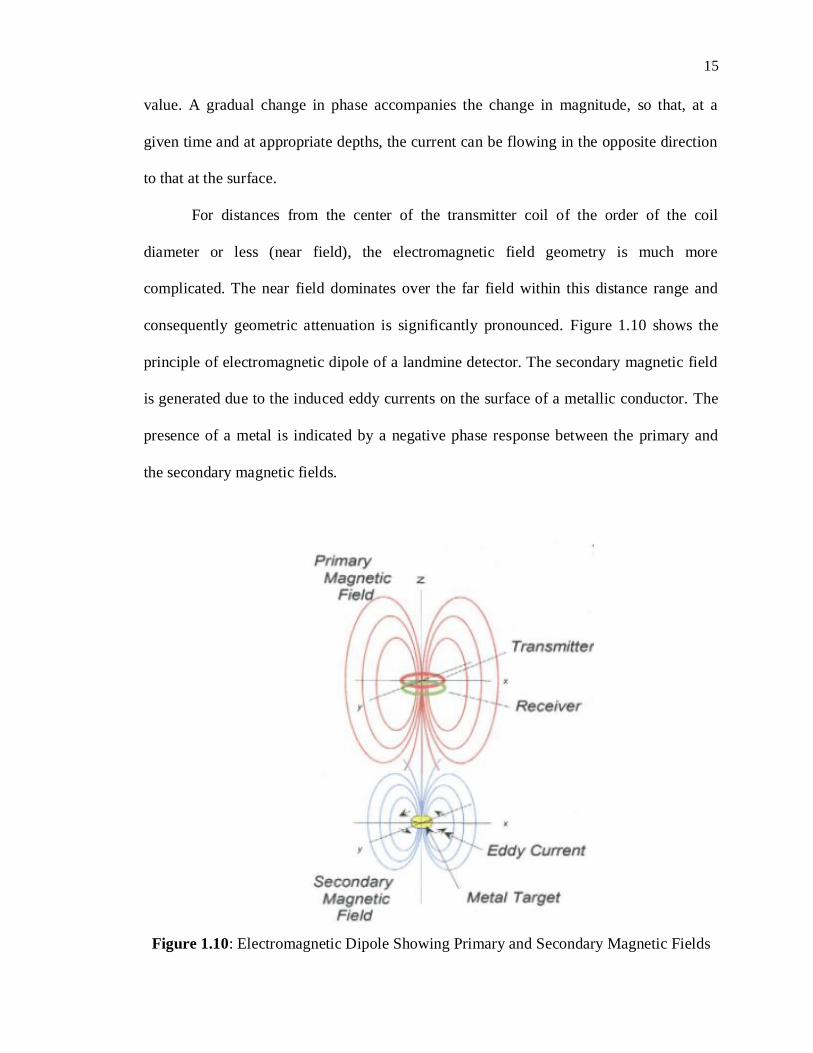
consequently geometric attenuation is significantly pronounced. Figure 1.10 shows the
principle of electromagnetic dipole of a landmine detector. The secondary magnetic field
is generated due to the induced eddy currents on the surface of a metallic conductor. The
presence of a metal is indicated by a negative phase response between the primary and
the secondary magnetic fields.
Figure 1.10: Electromagnetic Dipole Showing Primary and Secondary Magnetic Fields
16
2. PROJECT DESCRIPTION
2.1. PROJECT OBJECTIVE
The aim of this research project was to design and build a visual data adapter for
the military AN/PSS-14 Landmine Detector that will allow real-time analysis of MD
audio alert signal by using instrumentation and processing techniques in addition to the
one already programmed in the AN/PSS-14. This visual clip-on data adaptor will
transform the AN/PSS-14 into a hand-held data acquisition system for conversion of real
time MD audio alert signal into captured visual traces on an on-board PDA computer
screen so that the momentary sounds of millisecond durations can be captured and
displayed for visual scrutiny and interpretation by on-board data processing procedures.
This research is concurrent to the analysis of the GPR audio alert signal of the AN/PSS-
14 given by Nitin Kolekar [6].
The main challenge was to study the field process of the AN/PSS-14 and using
that to develop a visual data adaptor for the AN/PSS-14 without changing the current
system followed by the military. This project expects to benefit the military in the
reduction of complexity, confusion and the uncertainty in the use of this instrument. This
project also has a commercial potential of the production of a ruggedized, low cost
system that would be useful on any MD only, or MD plus GPR composite, landmine
detector that has an audio output connector. The data collected for this thesis was
obtained from a field test performed at Linear Sweep Facility. The MD and GPR audio
alerts coming from the earphone jack of the AN/PSS-14 were recorded in wave format.
This data is then analyzed using National Instruments‟ (NI) instrumentation and
processing Virtual Instrument‟s (VI) on a handheld computer which will also display the

17
processed audio alert signal in envelope amplitude-time and instantaneous frequency-
time formats.
This thesis is only valid only for non-metallic, vertically oriented low-metallic
firing pin simulator. Basic knowledge of the working procedure of AN/PSS-14, metal
detection principles and instrumentation techniques are essential to understand the scope
of this project. This thesis will discuss all these with some detail.
2.2. PROJECT BACKGROUND
The users have faced a lot of trouble in understanding the audio alerts of this
instrument (AN/PSS-14 Landmine Detector). There have been many cases of spurious
and multiple issuances of audio alerts. The audio alerts from the landmines are often
interpreted as clutter and the audio alerts from the clutter are often interpreted as
landmines. These issues were studied and documented by Richard Rechtien. The study
was carried out from the focal point of what interactions are, or are not, probable and
when do the GPR audio alerts occur relative to the occurrence of the maximum intensity
of the MD audio alert. It focused on source-target-receiver configuration geometry.
A GPR alert will only be released by the AN/PSS-14 detection software if and
only if the MD sensor detects the presence of metal. Yet, GPR alerts commonly occur
when there is no metal present in the vicinity of the sweep path. These spurious events
and the equally spurious multiplicity of the events are consistently non repeatable,
resulting in the inability of the user to trust the instrument. Thereby, this thesis was
initiated where the MD audio alerts are studied and a companion thesis by Nitin Kolekar
for the study of GPR alerts.

18
The findings of the Richard Rechtien‟s study [2] are as follows:
MD Audio Alerts for Vertical Metallic Firing Pins
MD audio alerts from the vertical firing pin simulators have a lateral extent of
approximately 20 cm.
MD audio alerts vary in both amplitude and frequency. Amplitude is a function of
metallic volume and frequency is determined by the Metal Factor, resulting in an
additional phase shift between the primary and the secondary electromagnetic
field.
MD audio alert is an engineered synthetic signal.
The temporal form of the MD audio alert amplitude envelope at slow speed
mirrors the spatial form of the Total MD Illumination field in space by the firing
pin position and the diameter of the illumination coil of the AN/PSS-14.
Validation of GPR Events-
GPR‟s should not occur in the absence of a MD audio alert.
There should be at least one GPR event within the lateral extent of the MD
envelope.
The fundamental form of the GPR Event is a time-windowed, constant frequency
of a discrete sine wave having a frequency of approximately 504 Hertz, with
duration of approximately 93 milliseconds.
All GPRs of greater duration are seamless superimpositions of multiply activated
fundamental forms.

19
2.3. LINEAR SWEEP FACILITY (LSF)
A Linear Sweep Facility was constructed for the purpose of restraining the
AN/PSS-14 to follow a reproducible path across a target to provide an investigative
platform to evaluate the Land Mine Detector in a stand-alone scenario. This restraint
eliminates any motion variations that might be induced by the operator. While this
process cannot be duplicated in the field during search operations without a stable robotic
platform, it can be used to evaluate the system alone with regard to the question of
repeatability. Moreover, in a laboratory environment many observed response
characteristics that have generally not been explained beyond speculation can be
addressed quantitatively through experimentation.
Figure 2.1 shows the Linear Sweep Translation System. The AN/PSS-14 is
strapped into a vertical cradle of a translation carriage. The carriage is mounted on
parallel overhead transport rails and propelled by a belt-driven actuator at speeds up to 3
feet per second. The actuator has a length of 3 meters and is powered by a user
programmable drive that allows for controlled acceleration, constant velocity over the
target and deceleration to a stop position.
The drive also includes an on board encoder that allows for display of realized
acceleration, velocity and deceleration. Programmable positions are accurate to within
.0625 cm. The carriage is also connected to an external wire-line position and velocity
transducer, which can be calibrated to all positions along the sweep traverse to within
0.625 cm. By this it means the position of the “sweet spot” of the PSS-14, at the time of
reception of any reflected or diffracted event, is measurable to within 0.625 cm.

20
Figure 2.1: Linear Sweep Facility
The test bed is constructed from Styrofoam blocks and panels. The dielectric
constant for Styrofoam is 1.03, as compared to 1.0 of vacuum. Thus, the test platform is,
for all the practical purposes, transparent to electromagnetic waves and will not generate
any diffractions, or reflections, except where the PSS-14 moves across the top surface
contact between the Styrofoam with the earth medium. The surface contains a 4x24x48
inch well for the placement of an electromagnetic receiver beneath a soil cover. This
receiver is used for in-site measurements of the dielectric constant of the material above
it. The process of measurement yields depth-dependent dielectrically, moisture content,
and electrical resistivity.
21
Measureable quantities are: MD, GPR, wire-line position, and velocity. Typically,
combined MD and GPR are measured, along with wire-line position of the “sweet spot”,
on a dual channel, 16-bit, 12 GHz PicoScope 9201 PC Oscilloscope. The scope provides
real time observation of these measurements. A 24 bit, 96 KHz Edirol WAVE recorders
is also used to measure MD and GPR data. This data must be transferred to the PC for
visualization by means of a WAVE analyzer.
22
3. DESIGN METHODOLOGY
3.1. DESIGN PROCESS
The users of this instrument (AN/PSS-14) were not able to perceive the audio
alerts at all times. In case of background noise or any other factors that may affect the
attention of the user are dominant during a sweep of the landmine detector, the user may
not pick up the audio alert if the instrument detects one. To assist the user in better
understanding and validating the audio alert of the landmine detector, a visual data
adaptor is necessary. This thesis is not about the detailed analysis of the data but it is
about the design and the usefulness of the visual display to confirm the alert for the user.
This is important as the visual display will give a better perspective of the target rather
than the mere beep coming out of the earphone jack.
The instrument is synthetically engineered to give out different types of alert for
different metallic objects. The intensity of the audio alert is dependent on the metal factor
or electrical conductivity of the metallic target/object giving out the alert in different
frequencies for different metal types. In plain words the intensity of the audio alert heard
will be different for different kinds of metals. This requires the concentration of the user
during the entire operation. At times, this may be confusing or induce uncertainty to the
user. The visual device with a metal type indicator will give the user additional /specific
details in better handling of the situation when a landmine is detected.
Since the AN/PSS-14 Landmine detector is currently the military instrument of
choice for the detection of buried metallic and low metallic landmines and is in full
operation, redesigning the instrument would incur huge losses to both the manufacture of
the instrument and to the military to buy the new instrument. The addition of a clip-on to

23
the current instrument would take care of both the parties (manufacturer of the instrument
and the military).
3.2. HAND-HELD VISUALIZATION INSTRUMENTATION
3.2.1 Hand-Held Computer. It is very important to use off the shelf (readily
available) products from the market keeping in view of the time required to complete this
project. A compact device yet powerful enough to analyze and process the data coming
out from the instrument is required. It should have display capabilities for the user to
interpret the results. A number of latest smart phones, hand-held computers
(PDA/palmtop) or laptop computer will meet the requirements. A laptop is capable of
doing all the required tasks by this project but it will not be handy to carry around in the
field. It is not practical, space consuming, affects the weight of the total package
(instrument plus add on device) and also not cost effective. The smart phones and hand-
held computers are both powerful enough to do the processing. But hand-held computers
are easier to program and add external programs which are required for acquiring,
analyzing, processing and displaying results. Since hand-held computers are a miniature
version of a laptop computer, it is easier to write/code programs to interlink the hardware
devices to speak to each other.
3.2.2 Hardware Requirement. For a clip on device such as a hand-held
computer to read the incoming data from the AN/PSS-14, some kind of hardware system
is required. The hand held computer has restricted access to additional hardware. Keeping
in view of this, a compatible memory card will be needed for acquiring the data and
feeding the same to the analyzing program for processing.

24
There are a number of data acquisition hardware systems readily available in the
market. For a mobile application such as this and for the hardware to be programmable
by the software for analyzing and processing, National Instruments CF-6004 [7],
Compact Flash Data Acquisition for PDAs was selected. The CF-6004 in a PDA is ideal
for a number of applications where economy, small size and portability are essential for
field monitoring/diagnostics and portable data logging and analysis. The features of the
card are:
Lightweight, ultraportable for mobile applications
4 analog inputs, 14-bit resolution, up to 200 kS/s single-channel sampling
Programmable with LabView PDA Module for handheld measurements
3 connectivity options- base wires and shielded or unshielded connector blocks
4 LVTTL/LVCMOS digital I/O lines
National Instruments hardware and software were chosen for this project as it reduces the
customization of hardware and software. The hardware is compatible to the LabView
software as it is from the same manufacturer.
3.2.3. Connection. A number of cables are required to hook the system together.
The AN/PSS-14 audio alert signal output, NI digitizing module and the PDA are all
required to be connected to each other. The NI SH-15-15-B is readily available as an
accessory for the NI CF-6004 to connect directly to the signals. In this case it is the audio
alert signal of the AN/PSS-14.
3.2.4. Software. System programming constitutes the dominant work load of this
project. The software should be able to take in the input (in this case the output of the
AN/PSS-14), analyze and process the input and display the output. LabView, MATLAB

25
or any other computing/programming language can be used. The LabView software [8]
was selected as it is a visual programming language which is mainly used for data
acquisition, instrument control and automation which are the requirements of this project.
3.3. INSTRUMENTATION SELECTED
HP iPAQ hx2000-PDA
LabView PDA Module- Programming software
NI CF-6004 Data Acquisition Card- Hardware
Windows Mobile for Pocket PC- PDA operating system

26
4. INSTANTANEOUS FREQUENCY PROGRAMMING
To have a better understanding of the MD audio alerts, the output of the MD
audio alerts of the AN/PSS-14 is fed to a hand-held PDA computer for analysis. The
LabView program analyzes the incoming data and displays the Instantaneous Envelope
Graph, Unwrapped Phase and the Instantaneous Frequency Graph of the MD signal
through a serious of mathematical manipulations. The visual data displayed on the PDA
screen helps the user/soldier to discriminate between a valid and an invalid audio alert,
thereby giving more clarity and information on the screen (in case the audio alert is not
picked up by the user).
4.1 ALGORITHM
Hilbert transforms helps us to look at relationships between real and imaginary
parts of a complex signal. Hilbert transform can be used to create an analytic signal
which is very important in simulation. The analytical representation of a real-valued
function or signal (in this case the MD audio alert) facilitates manipulation of the signal.
The analytic signals help to represent bandpass signals as complex signals which have
especially attractive properties for signal processing. An analytic signal [9] is a complex
signal created by taking a signal and then adding in quadrature its Hilbert transform. An
analytic signal is defined as follows:
Where,
g+ (t) is the analytic signal
g (t) is the MD audio alert

27
is the Hilbert Transform of g(t)
The audio alerts recorded at the Linear Sweep Facility are inputted in to a
measurement file which takes in point by point of the signal. Point by point analysis is
ideally suited for real time data acquisition. With point by point analysis in LabView,
data analysis also utilizes real time performance. The discrete stages of array based
analysis such as buffer preparation, analysis and output, might be too slow for higher
speed, deterministic, real time analysis. Real-time systems require continuous analysis, in
which analysis occurs for each data point, point by point. The advantages of using
LabView Point-By-Point VIs offer the following benefits:
Track and respond to real-time events
The analysis process connects directly to the signal for speed and minimal data
loss
Perform programming tasks more easily as allocating arrays and making
adjustments to the sampling rates is not required.
Analysis synchronizes automatically with data acquisition as a single signal is
worked on instantaneously.
The raw input is passed through a Butterworth Bandpass Filter to minimize the
noise which takes in data at a sampling rate of 44100 Hz. The Hilbert transform of the
filtered signal g (t) is added to the filtered signal to get a complex analytic signal g+ (t).
The Hilbert Transform of a function x (t) is defined as
The rectangular components of the complex signal coming out from the Hilbert
transform is converted into its polar components to find the amplitude envelope and

28
instantaneous frequency. The instantaneous frequency for a complex valued signal is
given by the derivative of the instantaneous phase [10]. The algorithm developed to
acquire field data and display its instantaneous frequency and envelope is shown in
Figure 4.1.
Figure 4.1: Algorithms for Instantaneous Frequency and Instantaneous Amplitude
4.2. LABVIEW PROGRAM
The LabView program to calculate the instantaneous phase and instantaneous
amplitude is shown in Figure 4.2.
Instantaneous Phase (t)
Hilbert
Transform
Form
Complex Sum
Atan(
)
Instantaneous
Frequency Graph
Instantaneous
Envelope Graph
g(t)
Instantaneous Amplitude (t)

29
Figure 4.2: LabView Code
The AN/PSS-14‟s audio alerts are recorded at a sampling rate of 44100 Hz and
are stored in wave format sound for use on a laptop for processing purposes. This is in
turn converted to be read by the Read From Measurement File VI. The original MD audio
alert is displayed in amplitude-time format as a reference to the manipulated signal. The
original signal is also passed to Butterworth Filter VI to eliminate background noise and
to also obtain a smooth curve whose lower cutoff frequency is set to 0.01 Hz and the
upper cutoff frequency set to 3500 Hz. Once filtered, the signal is sent to Hilbert
Transform VI which calculates the Hilbert transform of the signal required to form an
analytical signal. The output of the Hilbert Transform VI is then added to the original
signal to form a complex signal. This complex signal also called as an analytical signal is
used to determine the instantaneous frequency and instantaneous amplitude envelope.
The rectangular components of the complex number are converted into its polar
components by the Re/Im To Polar Function VI. This inserted into a for loop for point by
point analysis. The radial component r is then displayed in amplitude-time format as
instantaneous amplitude. The phase of the polar angle aka theta is unwrapped by Unwrap

30
Phase VI and the time derivative of the unwrapped phase is calculated as the
instantaneous frequency by Derivative x(t) VI.
This research is limited to processing the data already stored in wave format.
However, by connecting the output of the AN/PSS-14 directly to a PDA via cables, real
time visualization of the MD audio alerts can be possible.
31
5. INSTANTANEOUS FREQUENCY RESULTS
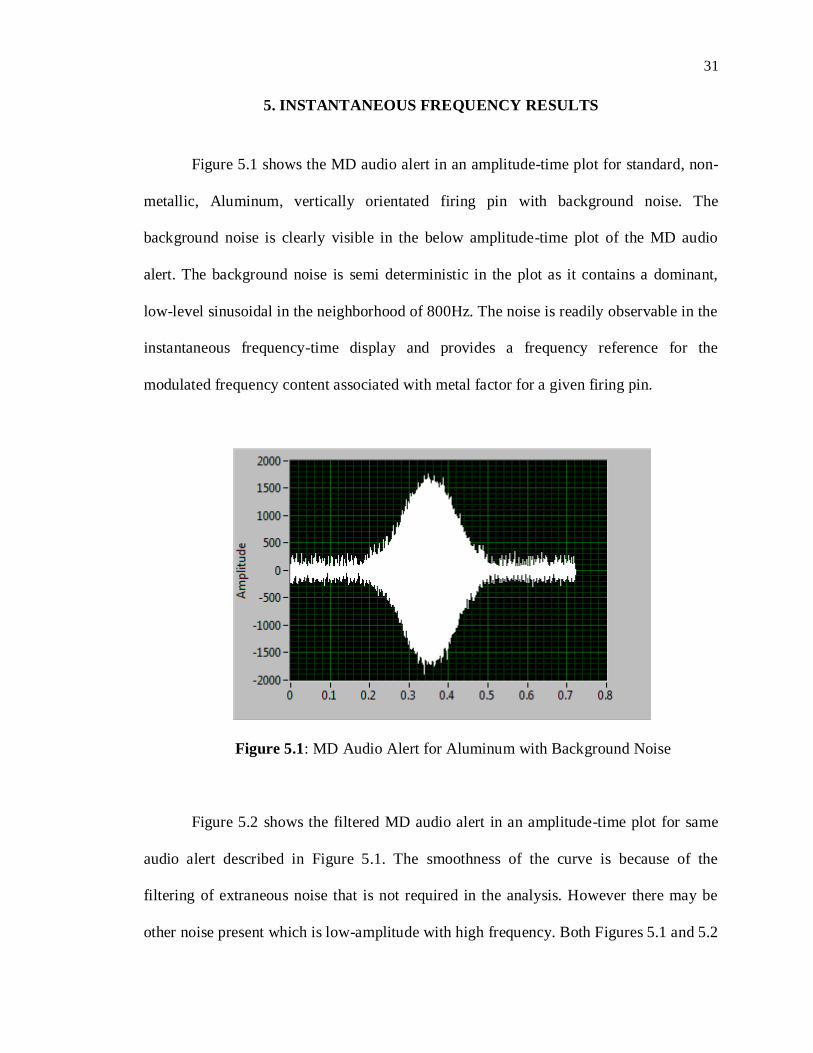
Figure 5.1 shows the MD audio alert in an amplitude-time plot for standard, non-
metallic, Aluminum, vertically orientated firing pin with background noise. The
background noise is clearly visible in the below amplitude-time plot of the MD audio
alert. The background noise is semi deterministic in the plot as it contains a dominant,
low-level sinusoidal in the neighborhood of 800Hz. The noise is readily observable in the
instantaneous frequency-time display and provides a frequency reference for the
modulated frequency content associated with metal factor for a given firing pin.
Figure 5.1: MD Audio Alert for Aluminum with Background Noise
Figure 5.2 shows the filtered MD audio alert in an amplitude-time plot for same
audio alert described in Figure 5.1. The smoothness of the curve is because of the
filtering of extraneous noise that is not required in the analysis. However there may be
other noise present which is low-amplitude with high frequency. Both Figures 5.1 and 5.2

32
are formed by plotting point by point of the recorded oscillating signal of the MD audio
alert of the vertical firing pin.
Figure 5.2: Filtered MD Audio Alert for an Aluminum Firing Pin
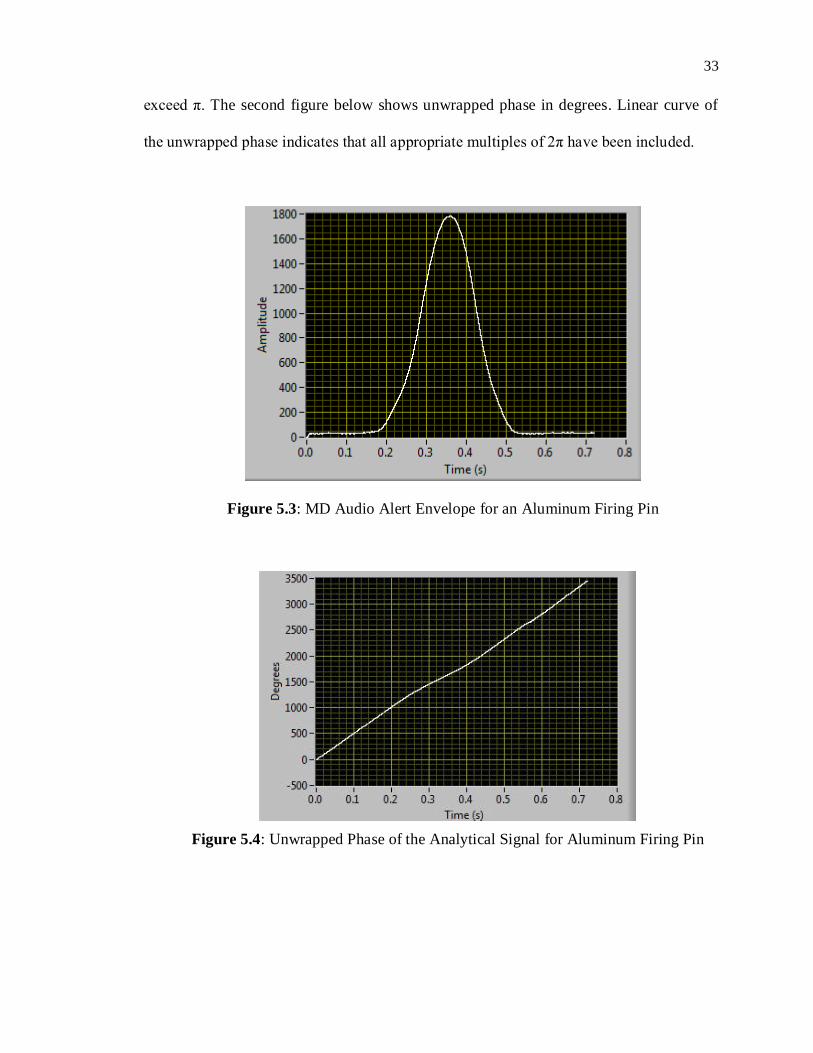
Figure 5.3 shows the Envelope of the MD audio alert in amplitude-time plot. This
figure confirms that the program has not altered any characteristics of the original audio
alert after mathematical manipulations as it is an exact replica of the original audio alert
shown in Figure 5.2 before mathematical manipulations. This validates the logic of the
program for determining the instantaneous frequency.
Figure 5.4 shows the Unwrapped Phase of the analytical signal created. The
output phase of the analytic signal is returned in a form that suffers from 2π phase jumps
due to the mathematical arctangent function, which produces an inherently wrapped
output. Unwrapping the phase array eliminates the discontinuities whose absolute values
33
exceed π. The second figure below shows unwrapped phase in degrees. Linear curve of
the unwrapped phase indicates that all appropriate multiples of 2π have been included.
Figure 5.3: MD Audio Alert Envelope for an Aluminum Firing Pin
Figure 5.4: Unwrapped Phase of the Analytical Signal for Aluminum Firing Pin

34
Figure 5.5 shows the instantaneous frequency-time plot of the MD audio alert.
The unwrapped phase can be represented in terms of an instantaneous frequency which is
simply the time derivative of the instantaneous phase. Since the sampling rate of the MD
audio alert is very high (44100 Hz), the phase between consecutive points in the for loop
constructed will not be that great unless there is a major 2π shift between them. This can
be eliminated by locally unwrapping the phase for all the points to guard against any 2π
discontinuities present between them. The low-amplitude, high frequency which is not
eliminated by the band pass filter is quite evident in this plot. As it is present in the base
frequency range of 818 Hz and not when a metal is detected, it can be noted as
background noise.
Figure 5.5: Instantaneous Frequency of the MD Audio Alert Signal for an Aluminum
Firing Pin

35
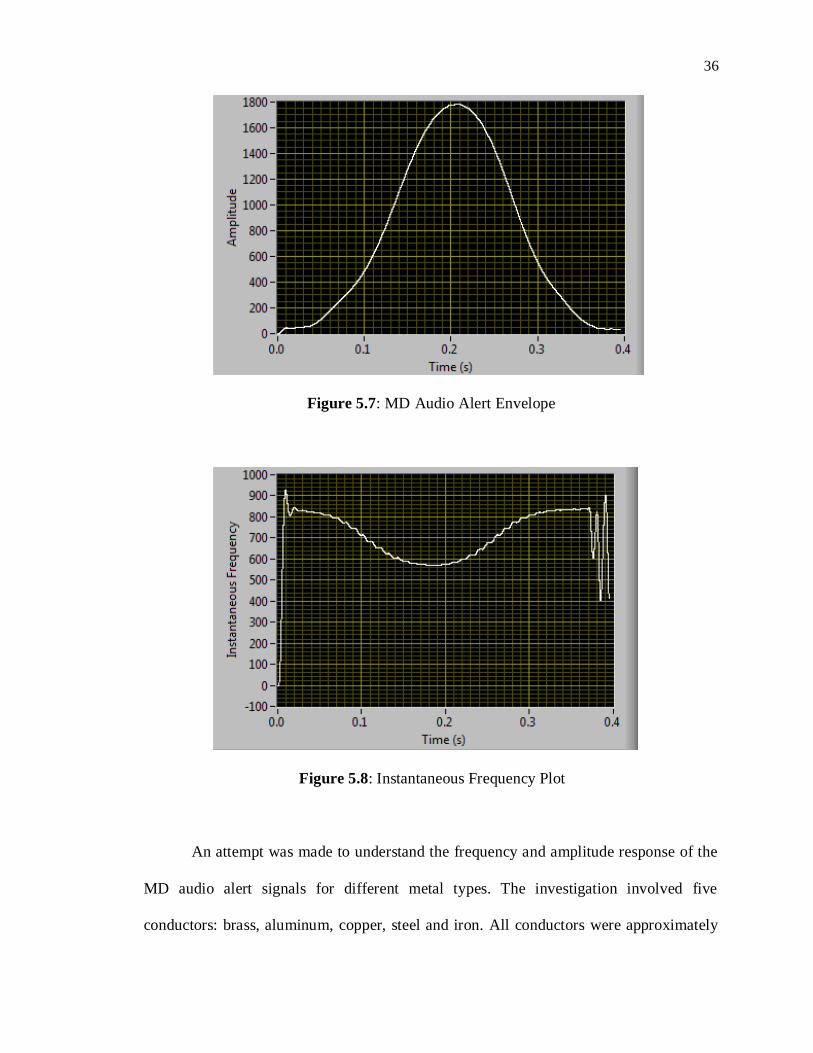
The below figures show the results of another sweep of the MD audio alert for an
aluminum firing pin. Figure 5.6 shows the filtered MD signal. Figure 5.7 shows the MD
audio alert envelope for a second sample of the same aluminum firing pin. Figure 5.8
shows the instantaneous frequency of the second sample for the same aluminum firing
pin. This is done to verify the repeatability and consistency of the program developed.
As seen from the below figures, the MD response for the same firing pin yielded the
same results consistently, thereby, validating the program‟s logic in determining the
instantaneous frequency and envelope for MD audio alerts of the AN/PSS-14. The sweep
for the second sample was done the exact same way the first data was acquired. The
sensitivity was set to 3 on the AN/PSS-14 where only the MD audio alert was recorded.
This process is only applicable to a single, isolated MD audio signal only and does not
apply to a sequence of MD plus GPR.
Figure 5.6: Filtered MD Audio Alert
36
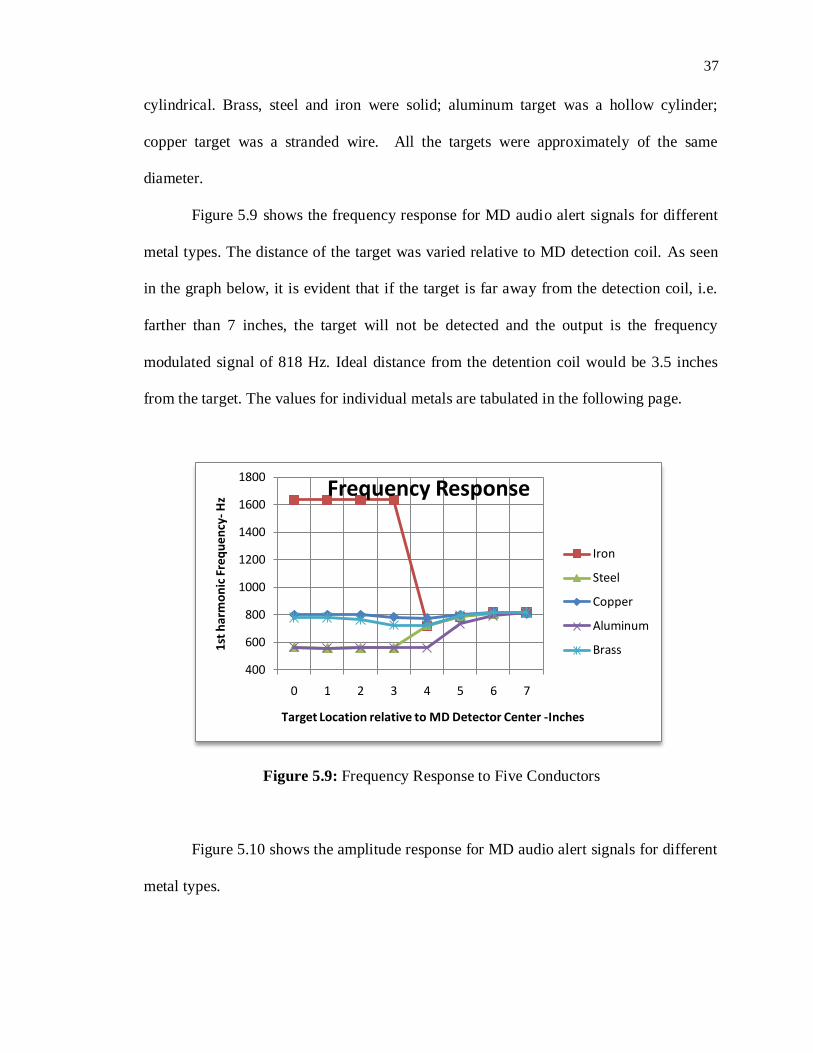
Figure 5.7: MD Audio Alert Envelope
Figure 5.8: Instantaneous Frequency Plot
An attempt was made to understand the frequency and amplitude response of the
MD audio alert signals for different metal types. The investigation involved five
conductors: brass, aluminum, copper, steel and iron. All conductors were approximately
37
cylindrical. Brass, steel and iron were solid; aluminum target was a hollow cylinder;
copper target was a stranded wire. All the targets were approximately of the same
diameter.
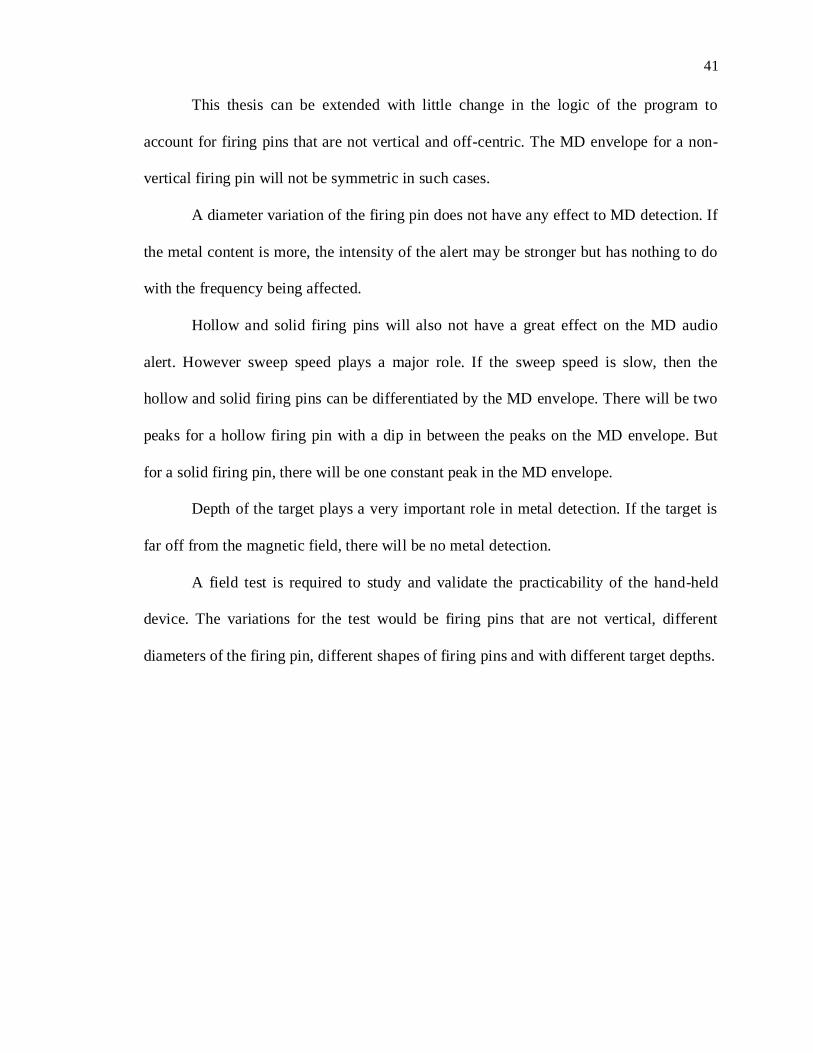
Figure 5.9 shows the frequency response for MD audio alert signals for different
metal types. The distance of the target was varied relative to MD detection coil. As seen
in the graph below, it is evident that if the target is far away from the detection coil, i.e.
farther than 7 inches, the target will not be detected and the output is the frequency
modulated signal of 818 Hz. Ideal distance from the detention coil would be 3.5 inches
from the target. The values for individual metals are tabulated in the following page.
Figure 5.9: Frequency Response to Five Conductors
Figure 5.10 shows the amplitude response for MD audio alert signals for different
metal types.
400
600
800
1000
1200
1400
1600
1800
0 1 2 3 4 5 6 7
1st
har
mo
nic
Fre
qu
ency
-Hz
Target Location relative to MD Detector Center -Inches
Frequency Response
Iron
Steel
Copper
Aluminum
Brass

38
Figure 5.10: Amplitude Response to Five Conductors
Table 5.1 shows the instantaneous frequency response for different metal types.
Table 5.1: Metal Type and Instantaneous Frequency Values
Metal Type Instantaneous Frequency (Hz)
Aluminum 559
Brass 712
Iron 1636
Copper 778
Steel 559
The instantaneous frequency for different metal types is different. This is evident
in the frequency values obtained for different metals in the tests. Since MD audio alert is
an engineered signal, specific metals give out specific frequency values. But the MD
audio alerts were of same type and intensity, audibly.
-60
-50
-40
-30
-20
-10
0
0 1 2 3 4 5 6 7
1st
Har
mo
nic
Am
plit
ud
e-d
B
Target Location relative to MD Detector Center- Inches
Amplitude Response
Copper
Iron
Steel
Aluminum
Brass

39
Similar kind of metals or in other words low-metallic content metals give out the
same frequency values. The first harmonic frequency for Aluminum is found to be 559
Hz, which of Brass is found to be 712 Hz, for Iron it is found to be 1636 Hz, for Copper it
is found to be 778 Hz and for Steel it is found to be 559 Hz.

40
6. CONCULSIONS AND FUTURE WORK
The visual data adaptor will transform the AN/PSS-14 into a hand-held data
acquisition system for conversion of real time MD audio signals into captured visual
trace displays on an on-board PDA computer screen so that momentary sounds of
millisecond durations can be captured and displayed for visual scrutiny and interpretation
by analytical on-board data processing procedures. The developed program executed on
hand-held computer attached to the output of the AN/PSS-14 is reliable in analyzing and
confirming the MD audio alert. The visual display of instantaneous frequency-time plot
of the MD audio alert on the clip-on device helps the user with specifics of the target
rather than a mere audio alert. The hand-held device is a feasible yet practical solution for
better understanding of the audio alerts of the AN/PSS-14. This result can be extended to
any metal detector systems available in the market.
This thesis is centered on low-metallic vertical firing pin simulators. Distinction
of metallic firing pins from metallic clutter is achieved by the identification of the metal
type and by symmetric deviations of the amplitude envelope along multiple sweep
directions over a buried target. The frequency response of the MD audio alerts of the
AN/PSS-14 for different metal types is different. The individual frequency responses for
brass, aluminum, steel, copper and iron were studied and analyzed. The response to these
metals is found in the results section. The „envelope and instantaneous frequency‟
approach is only valid for a single, isolated MD audio signal only and does not apply to a
sequence of MD plus GPR.
41
This thesis can be extended with little change in the logic of the program to
account for firing pins that are not vertical and off-centric. The MD envelope for a non-
vertical firing pin will not be symmetric in such cases.
A diameter variation of the firing pin does not have any effect to MD detection. If
the metal content is more, the intensity of the alert may be stronger but has nothing to do
with the frequency being affected.
Hollow and solid firing pins will also not have a great effect on the MD audio
alert. However sweep speed plays a major role. If the sweep speed is slow, then the
hollow and solid firing pins can be differentiated by the MD envelope. There will be two
peaks for a hollow firing pin with a dip in between the peaks on the MD envelope. But
for a solid firing pin, there will be one constant peak in the MD envelope.
Depth of the target plays a very important role in metal detection. If the target is
far off from the magnetic field, there will be no metal detection.
A field test is required to study and validate the practicability of the hand-held
device. The variations for the test would be firing pins that are not vertical, different
diameters of the firing pin, different shapes of firing pins and with different target depths.

42
BIBLIOGRAPHY
[1] http://www.cyterra.com/products/handheld-cm.html. “AN/PSS-14” January 2010.
[2] Dr. Richard D Rechtien, “White Paper, Sensitivity Issues of the AN/PSS-12
Mine Detection System,” 2007.
[3] 20HS4310, “Operator‟s Manual, HSTAMIDS,” 1st June 2004.
[4] Dr. Virgil J Flanigan and Dr. Richard D Rechtien, “Investigation of AN/PSS-14
(HSTAMIDS) GPR Wave Field Interactions with Buried Dielectric Targets,”
Final Report, 31st March 2009.
[5] Motoyuki Sato, Jun Fujiwaara, Xuan Feng, Zheng-Shu Zhou and Yakao
Kobayashi, “Evaluation of a Hand-Held GPR MD sensor system (ALIS),”
December 2004.
[6] Nitin S Kolekar, “Real-Time Visualization of AN/PSS-14 Audio Alert Signals for
Landmine Detection Validation,” Thesis, Missouri University of Science and
Technology, Rolla, MO-2010.
[7] http://www.ni.com/pdf/manuals/371399c.pdf. “User Guide and Specifications,
NI CF-6004,” December 2007.
[8] http://sine.ni.com/nips/cds/view/p/lang/en/nid/12222. “National Instruments,”
June 2010.
[9] http://en.wikipedia.org/wiki/Analytic_signal. “Analytic Signal,” January 2010.
[10] http://en.wikipedia.org/wiki/Instantaneous_phase. “Instantaneous Phase,” March
2010.

43
VITA
Sandesh Srikantaiah Chandrashekar was born on August 8th, 1986 in Bangalore,
India. He did his schooling in St. Paul‟s English School, Bangalore, India. He obtained
his Bachelor‟s Degree in Mechanical Engineering in July 2008 from Visvesvaraya
Technological University, Belgaum, India.
He enrolled at the Missouri University of Science and Technology to pursue a
Master‟s Degree in the Department of Mechanical and Aerospace Engineering under the
guidance of Dr. Virgil Flanigan in August 2008. He worked for seven months in Samtec
Inc, New Albany, Indiana as an Engineering Intern. He received his Master of Science
Degree in Mechanical Engineering in December 2010.