Embed Size (px)
Citation preview
Evaluation of three-dimensional virtual perception of
garments
G Aydoğdu1, S Yeşilpinar2 and D Erdem2
1GNT Textile, Tınaztepe Mevkii Adatepe Mahallesi 2/20 Sok No:29 Begos 3. Bölge,
Buca/İzmir, Turkey 2Dokuz Eylül University, Engineering Faculty, Textile Engineering Department,
Tınaztepe Campus, 35397, Buca/İzmir, Turkey
Abstract. In recent years, three-dimensional design, dressing and simulation programs came
into prominence in the textile industry. By these programs, the need to produce clothing
samples for every design in design process has been eliminated. Clothing fit, design, pattern,
fabric and accessory details and fabric drape features can be evaluated easily. Also, body size
of virtual mannequin can be adjusted so more realistic simulations can be created. Moreover,
three-dimensional virtual garment images created by these programs can be used while
presenting the product to end-user instead of two-dimensional photograph images. In this
study, a survey was carried out to investigate the visual perception of consumers. The survey
was conducted for three different garment types, separately. Questions about gender,
profession etc. was asked to the participants and expected them to compare real samples and
artworks or three-dimensional virtual images of garments. When survey results were analyzed
statistically, it is seen that demographic situation of participants does not affect visual
perception and three-dimensional virtual garment images reflect the real sample characteristics
better than artworks for each garment type. Also, it is reported that there is no perception
difference depending on garment type between t-shirt, sweatshirt and tracksuit bottom.
1. Introduction
In recent years, three-dimensional design, dressing and simulation programs came into prominence in
the textile industry. These programs have some advantages both in terms of designers/factories and
consumers. By these programs, the need to produce clothing samples for every design in design
process has been eliminated. Clothing fit, design, pattern, fabric and accessory details and fabric drape
features can be evaluated easily. Also, body size of virtual mannequin can be adjusted so more
realistic simulations can be created. All these features accelerate the design and decision-making
process. Moreover, three-dimensional virtual garment images created by these programs can be used
while presenting the product to end-user instead of two-dimensional photograph images [1, 2, 3].
In this study, a survey was carried out to investigate the visual perception of consumers. The survey
was conducted for three different garment types separately. For the survey study, artworks, three-
dimensional virtual garment images and real samples of the garments were created. It was expected
from the participants to compare artworks, three-dimensional virtual garment images, and real
samples. The answers of the participants were analyzed to understand if there is a difference in visual
perception of individuals for the garment designs prepared by three different methods.
2. Materials
Artworks, three-dimensional virtual garment images and real samples of the same design were used to
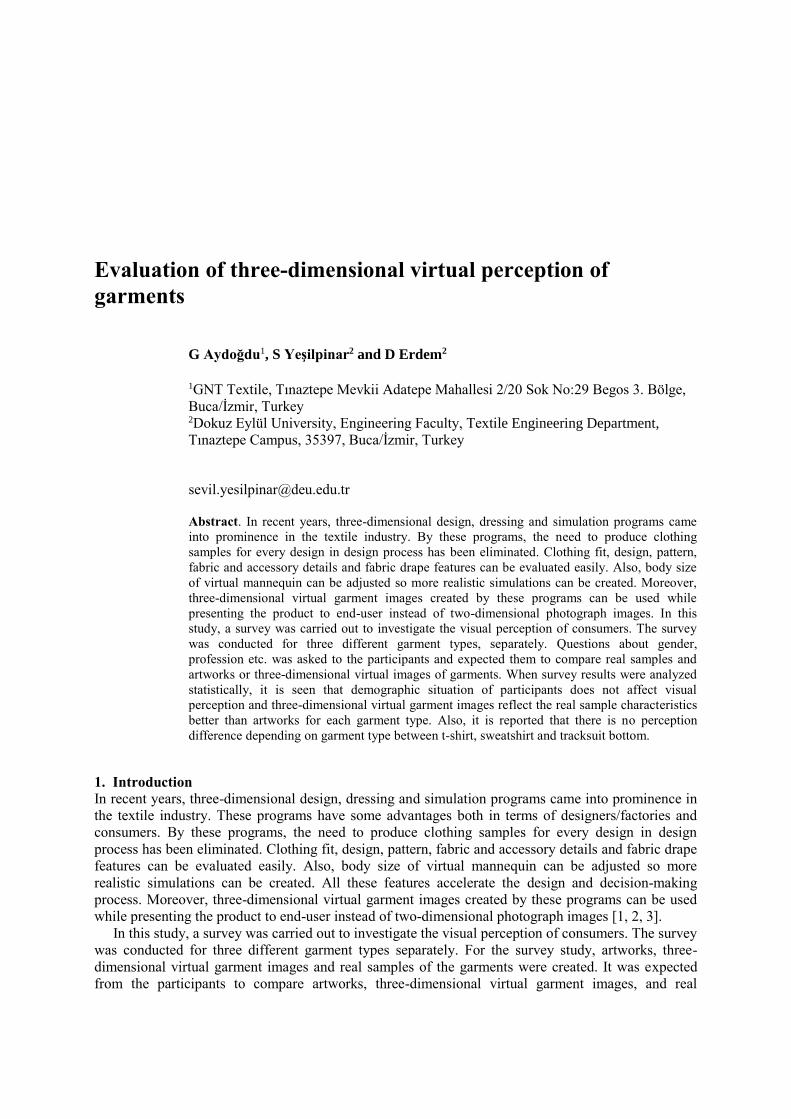
investigate the visual perception of individuals. Three different garment samples (t-shirt, sweatshirt
and tracksuit bottom) were provided from the selected apparel company (Figure 1).
Figure 1. Real garment samples of real garment samples
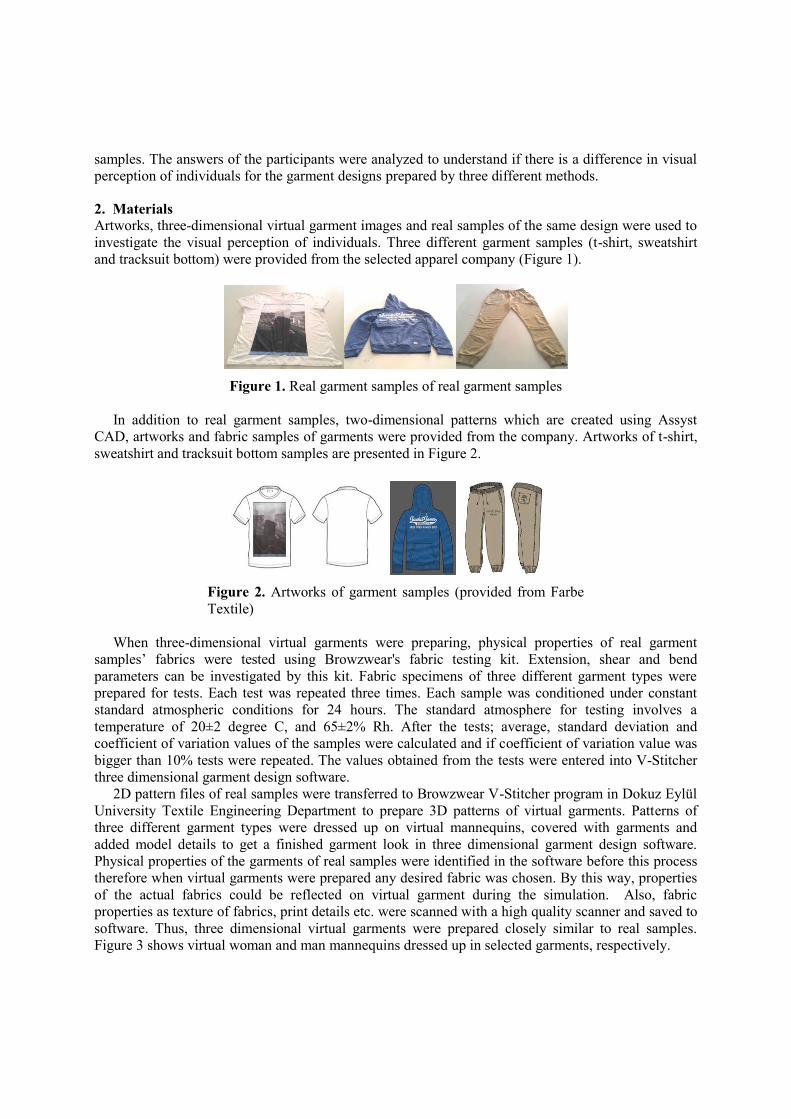
In addition to real garment samples, two-dimensional patterns which are created using Assyst
CAD, artworks and fabric samples of garments were provided from the company. Artworks of t-shirt,
sweatshirt and tracksuit bottom samples are presented in Figure 2.
Figure 2. Artworks of garment samples (provided from Farbe
Textile)
When three-dimensional virtual garments were preparing, physical properties of real garment
samples’ fabrics were tested using Browzwear's fabric testing kit. Extension, shear and bend
parameters can be investigated by this kit. Fabric specimens of three different garment types were
prepared for tests. Each test was repeated three times. Each sample was conditioned under constant
standard atmospheric conditions for 24 hours. The standard atmosphere for testing involves a
temperature of 20±2 degree C, and 65±2% Rh. After the tests; average, standard deviation and
coefficient of variation values of the samples were calculated and if coefficient of variation value was
bigger than 10% tests were repeated. The values obtained from the tests were entered into V-Stitcher
three dimensional garment design software.
2D pattern files of real samples were transferred to Browzwear V-Stitcher program in Dokuz Eylül
University Textile Engineering Department to prepare 3D patterns of virtual garments. Patterns of
three different garment types were dressed up on virtual mannequins, covered with garments and
added model details to get a finished garment look in three dimensional garment design software.
Physical properties of the garments of real samples were identified in the software before this process
therefore when virtual garments were prepared any desired fabric was chosen. By this way, properties
of the actual fabrics could be reflected on virtual garment during the simulation. Also, fabric
properties as texture of fabrics, print details etc. were scanned with a high quality scanner and saved to
software. Thus, three dimensional virtual garments were prepared closely similar to real samples.
Figure 3 shows virtual woman and man mannequins dressed up in selected garments, respectively.
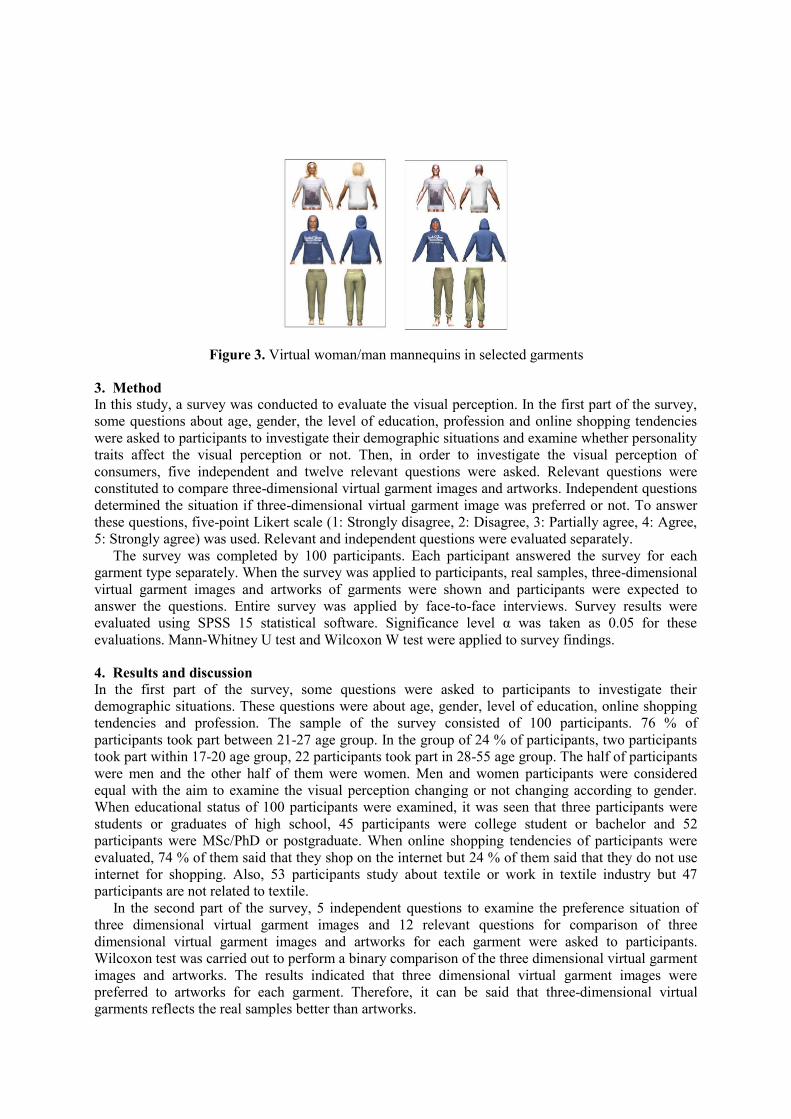
Figure 3. Virtual woman/man mannequins in selected garments
3. Method
In this study, a survey was conducted to evaluate the visual perception. In the first part of the survey,
some questions about age, gender, the level of education, profession and online shopping tendencies
were asked to participants to investigate their demographic situations and examine whether personality
traits affect the visual perception or not. Then, in order to investigate the visual perception of
consumers, five independent and twelve relevant questions were asked. Relevant questions were
constituted to compare three-dimensional virtual garment images and artworks. Independent questions
determined the situation if three-dimensional virtual garment image was preferred or not. To answer
these questions, five-point Likert scale (1: Strongly disagree, 2: Disagree, 3: Partially agree, 4: Agree,
5: Strongly agree) was used. Relevant and independent questions were evaluated separately.
The survey was completed by 100 participants. Each participant answered the survey for each
garment type separately. When the survey was applied to participants, real samples, three-dimensional
virtual garment images and artworks of garments were shown and participants were expected to
answer the questions. Entire survey was applied by face-to-face interviews. Survey results were
evaluated using SPSS 15 statistical software. Significance level α was taken as 0.05 for these
evaluations. Mann-Whitney U test and Wilcoxon W test were applied to survey findings.
4. Results and discussion
In the first part of the survey, some questions were asked to participants to investigate their
demographic situations. These questions were about age, gender, level of education, online shopping
tendencies and profession. The sample of the survey consisted of 100 participants. 76 % of
participants took part between 21-27 age group. In the group of 24 % of participants, two participants
took part within 17-20 age group, 22 participants took part in 28-55 age group. The half of participants
were men and the other half of them were women. Men and women participants were considered
equal with the aim to examine the visual perception changing or not changing according to gender.
When educational status of 100 participants were examined, it was seen that three participants were
students or graduates of high school, 45 participants were college student or bachelor and 52
participants were MSc/PhD or postgraduate. When online shopping tendencies of participants were
evaluated, 74 % of them said that they shop on the internet but 24 % of them said that they do not use
internet for shopping. Also, 53 participants study about textile or work in textile industry but 47
participants are not related to textile.
In the second part of the survey, 5 independent questions to examine the preference situation of
three dimensional virtual garment images and 12 relevant questions for comparison of three
dimensional virtual garment images and artworks for each garment were asked to participants.
Wilcoxon test was carried out to perform a binary comparison of the three dimensional virtual garment
images and artworks. The results indicated that three dimensional virtual garment images were
preferred to artworks for each garment. Therefore, it can be said that three-dimensional virtual
garments reflects the real samples better than artworks.
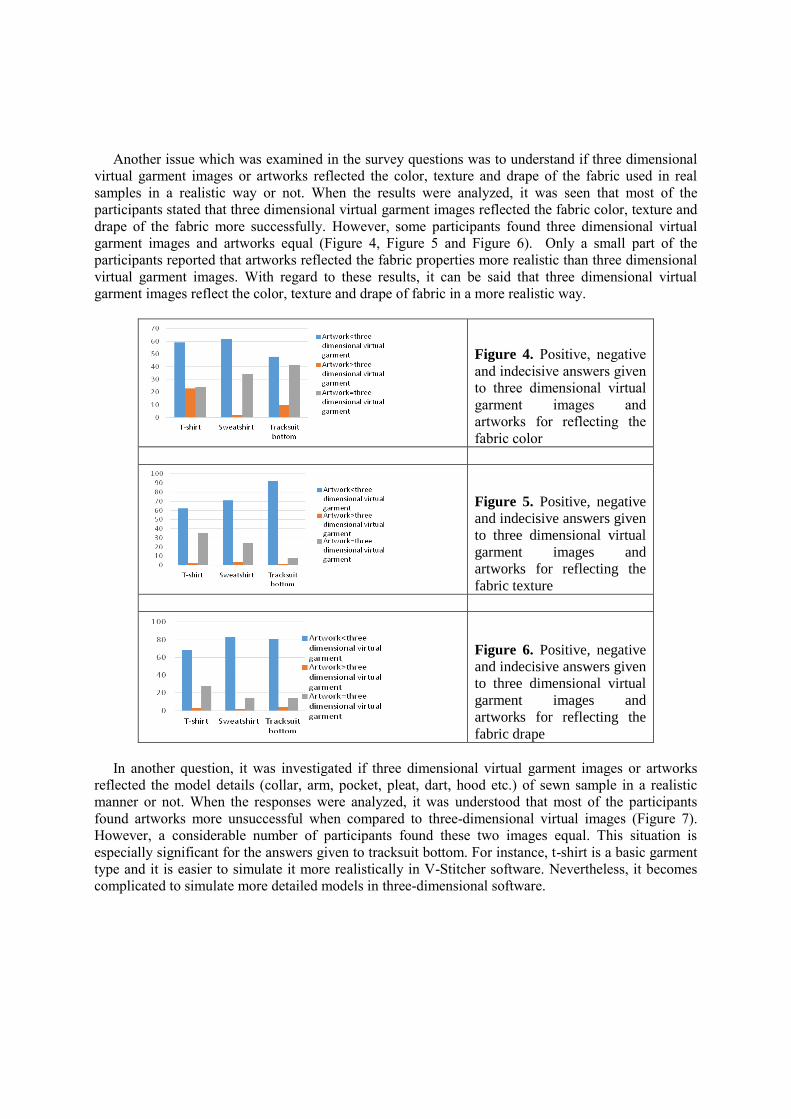
Another issue which was examined in the survey questions was to understand if three dimensional
virtual garment images or artworks reflected the color, texture and drape of the fabric used in real
samples in a realistic way or not. When the results were analyzed, it was seen that most of the
participants stated that three dimensional virtual garment images reflected the fabric color, texture and
drape of the fabric more successfully. However, some participants found three dimensional virtual
garment images and artworks equal (Figure 4, Figure 5 and Figure 6). Only a small part of the
participants reported that artworks reflected the fabric properties more realistic than three dimensional
virtual garment images. With regard to these results, it can be said that three dimensional virtual
garment images reflect the color, texture and drape of fabric in a more realistic way.
Figure 4. Positive, negative
and indecisive answers given
to three dimensional virtual
garment images and
artworks for reflecting the
fabric color
Figure 5. Positive, negative
and indecisive answers given
to three dimensional virtual
garment images and
artworks for reflecting the
fabric texture
Figure 6. Positive, negative
and indecisive answers given
to three dimensional virtual
garment images and
artworks for reflecting the
fabric drape
In another question, it was investigated if three dimensional virtual garment images or artworks
reflected the model details (collar, arm, pocket, pleat, dart, hood etc.) of sewn sample in a realistic
manner or not. When the responses were analyzed, it was understood that most of the participants
found artworks more unsuccessful when compared to three-dimensional virtual images (Figure 7).
However, a considerable number of participants found these two images equal. This situation is
especially significant for the answers given to tracksuit bottom. For instance, t-shirt is a basic garment
type and it is easier to simulate it more realistically in V-Stitcher software. Nevertheless, it becomes
complicated to simulate more detailed models in three-dimensional software.
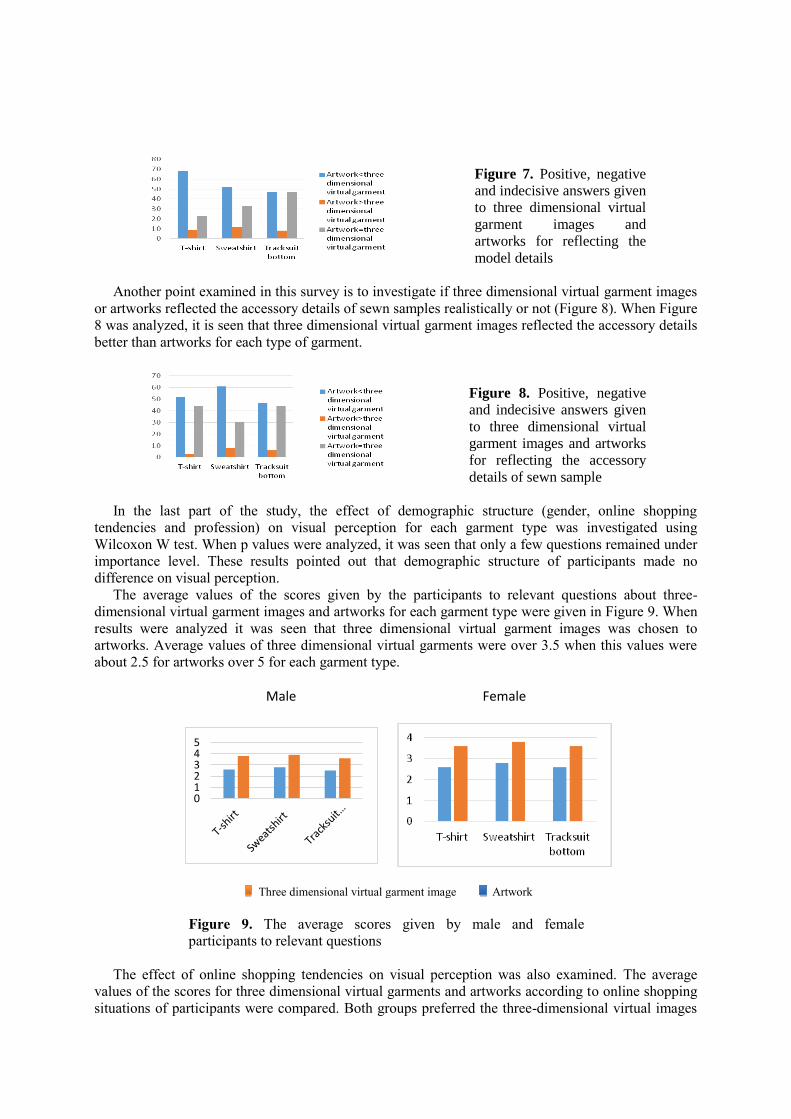
Figure 7. Positive, negative
and indecisive answers given
to three dimensional virtual
garment images and
artworks for reflecting the
model details
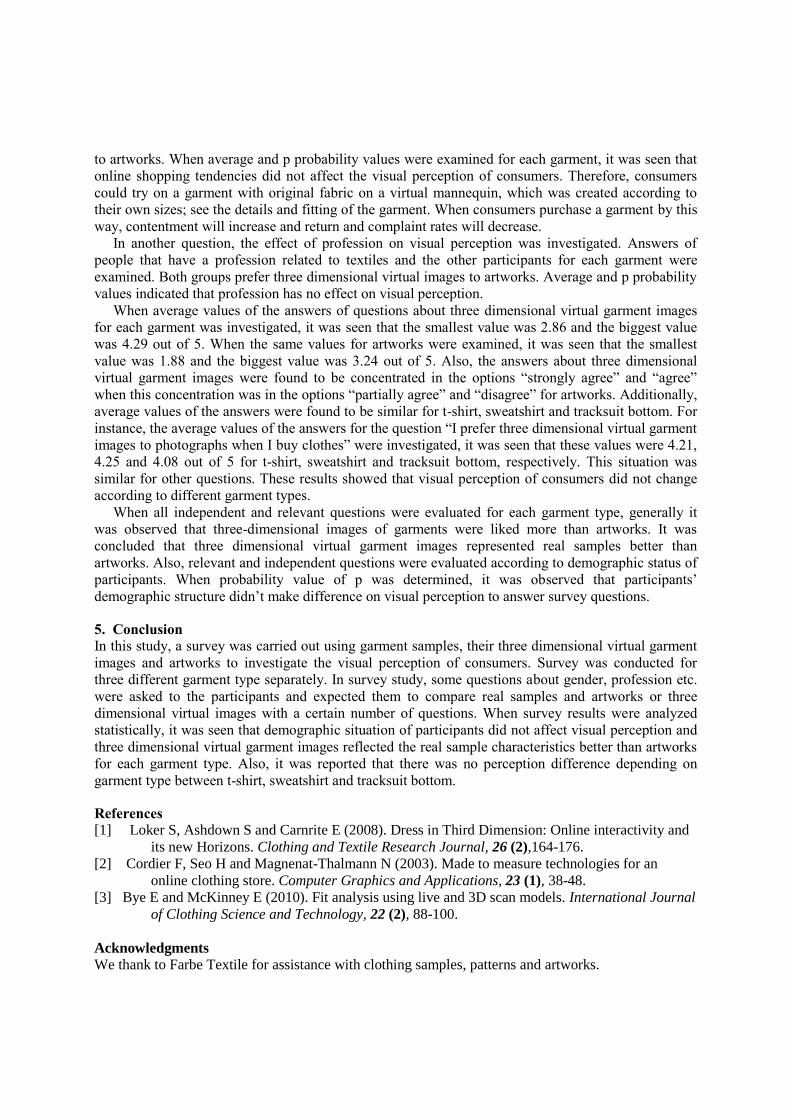
Another point examined in this survey is to investigate if three dimensional virtual garment images
or artworks reflected the accessory details of sewn samples realistically or not (Figure 8). When Figure
8 was analyzed, it is seen that three dimensional virtual garment images reflected the accessory details
better than artworks for each type of garment.
Figure 8. Positive, negative
and indecisive answers given
to three dimensional virtual
garment images and artworks
for reflecting the accessory
details of sewn sample
In the last part of the study, the effect of demographic structure (gender, online shopping
tendencies and profession) on visual perception for each garment type was investigated using
Wilcoxon W test. When p values were analyzed, it was seen that only a few questions remained under
importance level. These results pointed out that demographic structure of participants made no
difference on visual perception.
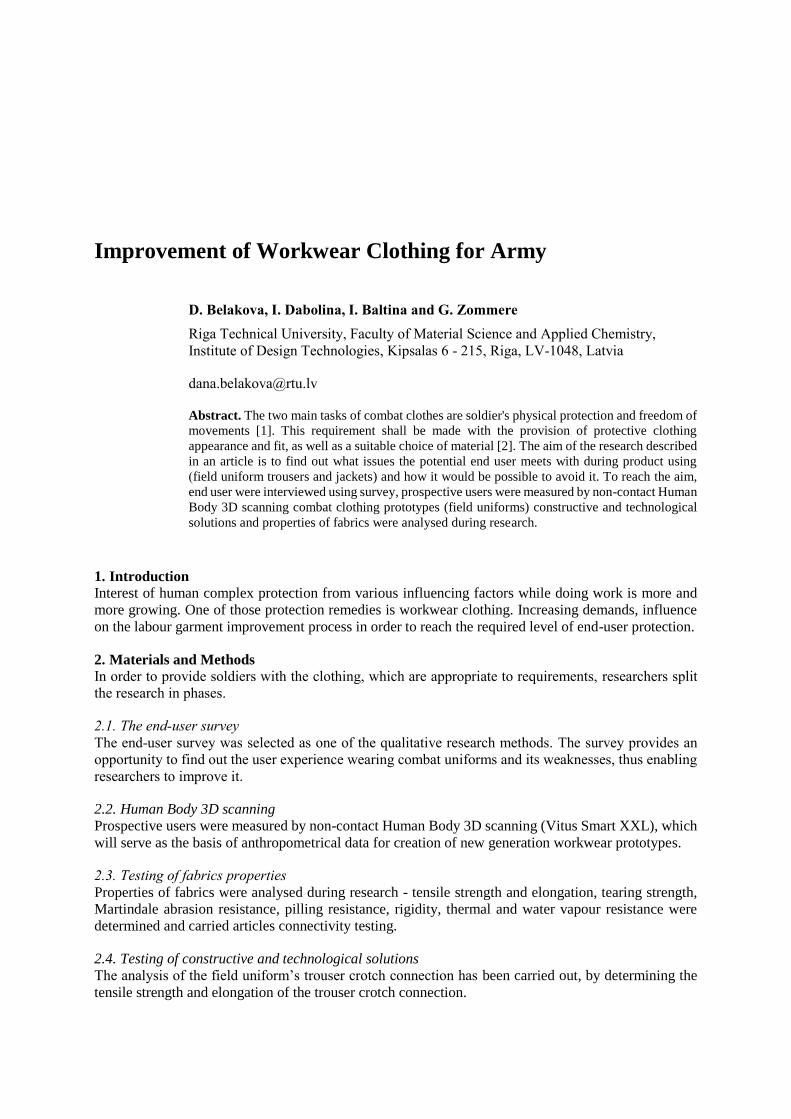
The average values of the scores given by the participants to relevant questions about three-
dimensional virtual garment images and artworks for each garment type were given in Figure 9. When
results were analyzed it was seen that three dimensional virtual garment images was chosen to
artworks. Average values of three dimensional virtual garments were over 3.5 when this values were
about 2.5 for artworks over 5 for each garment type.
Male
012345
Female
Three dimensional virtual garment image Artwork
Figure 9. The average scores given by male and female
participants to relevant questions
The effect of online shopping tendencies on visual perception was also examined. The average
values of the scores for three dimensional virtual garments and artworks according to online shopping
situations of participants were compared. Both groups preferred the three-dimensional virtual images
to artworks. When average and p probability values were examined for each garment, it was seen that
online shopping tendencies did not affect the visual perception of consumers. Therefore, consumers
could try on a garment with original fabric on a virtual mannequin, which was created according to
their own sizes; see the details and fitting of the garment. When consumers purchase a garment by this
way, contentment will increase and return and complaint rates will decrease.
In another question, the effect of profession on visual perception was investigated. Answers of
people that have a profession related to textiles and the other participants for each garment were
examined. Both groups prefer three dimensional virtual images to artworks. Average and p probability
values indicated that profession has no effect on visual perception.
When average values of the answers of questions about three dimensional virtual garment images
for each garment was investigated, it was seen that the smallest value was 2.86 and the biggest value
was 4.29 out of 5. When the same values for artworks were examined, it was seen that the smallest
value was 1.88 and the biggest value was 3.24 out of 5. Also, the answers about three dimensional
virtual garment images were found to be concentrated in the options “strongly agree” and “agree”
when this concentration was in the options “partially agree” and “disagree” for artworks. Additionally,
average values of the answers were found to be similar for t-shirt, sweatshirt and tracksuit bottom. For
instance, the average values of the answers for the question “I prefer three dimensional virtual garment
images to photographs when I buy clothes” were investigated, it was seen that these values were 4.21,
4.25 and 4.08 out of 5 for t-shirt, sweatshirt and tracksuit bottom, respectively. This situation was
similar for other questions. These results showed that visual perception of consumers did not change
according to different garment types.
When all independent and relevant questions were evaluated for each garment type, generally it
was observed that three-dimensional images of garments were liked more than artworks. It was
concluded that three dimensional virtual garment images represented real samples better than
artworks. Also, relevant and independent questions were evaluated according to demographic status of
participants. When probability value of p was determined, it was observed that participants’
demographic structure didn’t make difference on visual perception to answer survey questions.
5. Conclusion
In this study, a survey was carried out using garment samples, their three dimensional virtual garment
images and artworks to investigate the visual perception of consumers. Survey was conducted for
three different garment type separately. In survey study, some questions about gender, profession etc.
were asked to the participants and expected them to compare real samples and artworks or three
dimensional virtual images with a certain number of questions. When survey results were analyzed
statistically, it was seen that demographic situation of participants did not affect visual perception and
three dimensional virtual garment images reflected the real sample characteristics better than artworks
for each garment type. Also, it was reported that there was no perception difference depending on
garment type between t-shirt, sweatshirt and tracksuit bottom.
References
[1] Loker S, Ashdown S and Carnrite E (2008). Dress in Third Dimension: Online interactivity and
its new Horizons. Clothing and Textile Research Journal, 26 (2),164-176.
[2] Cordier F, Seo H and Magnenat-Thalmann N (2003). Made to measure technologies for an
online clothing store. Computer Graphics and Applications, 23 (1), 38-48.
[3] Bye E and McKinney E (2010). Fit analysis using live and 3D scan models. International Journal
of Clothing Science and Technology, 22 (2), 88-100.
Acknowledgments We thank to Farbe Textile for assistance with clothing samples, patterns and artworks.
Improvement of Workwear Clothing for Army
D. Belakova, I. Dabolina, I. Baltina and G. Zommere
Riga Technical University, Faculty of Material Science and Applied Chemistry,
Institute of Design Technologies, Kipsalas 6 - 215, Riga, LV-1048, Latvia
Abstract. The two main tasks of combat clothes are soldier's physical protection and freedom of
movements [1]. This requirement shall be made with the provision of protective clothing
appearance and fit, as well as a suitable choice of material [2]. The aim of the research described
in an article is to find out what issues the potential end user meets with during product using
(field uniform trousers and jackets) and how it would be possible to avoid it. To reach the aim,
end user were interviewed using survey, prospective users were measured by non-contact Human
Body 3D scanning combat clothing prototypes (field uniforms) constructive and technological
solutions and properties of fabrics were analysed during research.
1. Introduction
Interest of human complex protection from various influencing factors while doing work is more and
more growing. One of those protection remedies is workwear clothing. Increasing demands, influence
on the labour garment improvement process in order to reach the required level of end-user protection.
2. Materials and Methods
In order to provide soldiers with the clothing, which are appropriate to requirements, researchers split
the research in phases.
2.1. The end-user survey
The end-user survey was selected as one of the qualitative research methods. The survey provides an
opportunity to find out the user experience wearing combat uniforms and its weaknesses, thus enabling
researchers to improve it.
2.2. Human Body 3D scanning
Prospective users were measured by non-contact Human Body 3D scanning (Vitus Smart XXL), which
will serve as the basis of anthropometrical data for creation of new generation workwear prototypes.
2.3. Testing of fabrics properties
Properties of fabrics were analysed during research - tensile strength and elongation, tearing strength,
Martindale abrasion resistance, pilling resistance, rigidity, thermal and water vapour resistance were
determined and carried articles connectivity testing.
2.4. Testing of constructive and technological solutions
The analysis of the field uniform’s trouser crotch connection has been carried out, by determining the
tensile strength and elongation of the trouser crotch connection.
3. Results
Interim results achieved allowed to estimate the main imperfections of existing protective clothing (field
uniform trousers and jackets) - lack of durability and thus loss of defences and even usability. It was
observed gaps in human body measurements, which affect the fit of clothing, quality of textile materials,
as well as constructive and technological solutions of components. Factors are different and
improvement solutions should be complex throughout the research.
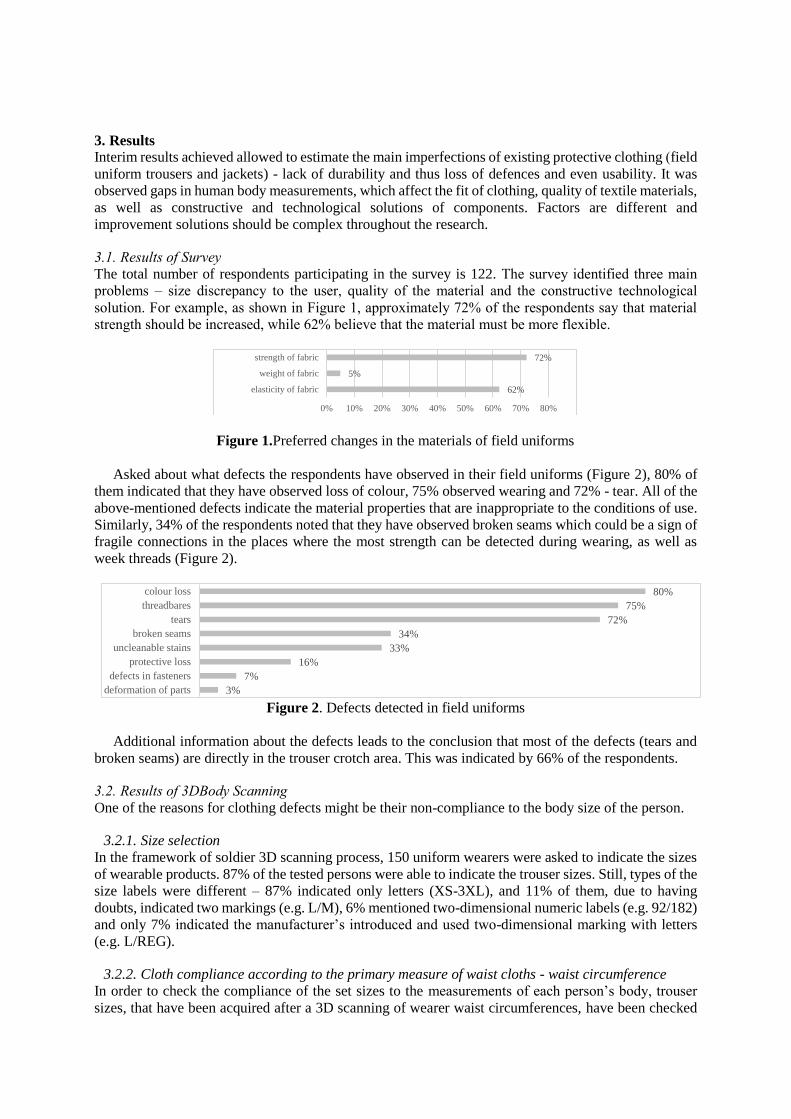
3.1. Results of Survey
The total number of respondents participating in the survey is 122. The survey identified three main
problems – size discrepancy to the user, quality of the material and the constructive technological
solution. For example, as shown in Figure 1, approximately 72% of the respondents say that material
strength should be increased, while 62% believe that the material must be more flexible.
Figure 1.Preferred changes in the materials of field uniforms
Asked about what defects the respondents have observed in their field uniforms (Figure 2), 80% of
them indicated that they have observed loss of colour, 75% observed wearing and 72% - tear. All of the
above-mentioned defects indicate the material properties that are inappropriate to the conditions of use.
Similarly, 34% of the respondents noted that they have observed broken seams which could be a sign of
fragile connections in the places where the most strength can be detected during wearing, as well as
week threads (Figure 2).
Figure 2. Defects detected in field uniforms
Additional information about the defects leads to the conclusion that most of the defects (tears and
broken seams) are directly in the trouser crotch area. This was indicated by 66% of the respondents.
3.2. Results of 3DBody Scanning
One of the reasons for clothing defects might be their non-compliance to the body size of the person.
3.2.1. Size selection
In the framework of soldier 3D scanning process, 150 uniform wearers were asked to indicate the sizes
of wearable products. 87% of the tested persons were able to indicate the trouser sizes. Still, types of the
size labels were different – 87% indicated only letters (XS-3XL), and 11% of them, due to having
doubts, indicated two markings (e.g. L/M), 6% mentioned two-dimensional numeric labels (e.g. 92/182)
and only 7% indicated the manufacturer’s introduced and used two-dimensional marking with letters
(e.g. L/REG).
3.2.2. Cloth compliance according to the primary measure of waist cloths - waist circumference
In order to check the compliance of the set sizes to the measurements of each person’s body, trouser
sizes, that have been acquired after a 3D scanning of wearer waist circumferences, have been checked
62%
5%
72%
0% 10% 20% 30% 40% 50% 60% 70% 80%
elasticity of fabric
weight of fabric
strength of fabric
3%
7%
16%
33%
34%
72%
75%
80%
deformation of parts
defects in fasteners
protective loss
uncleanable stains
broken seams
tears
threadbares
colour loss
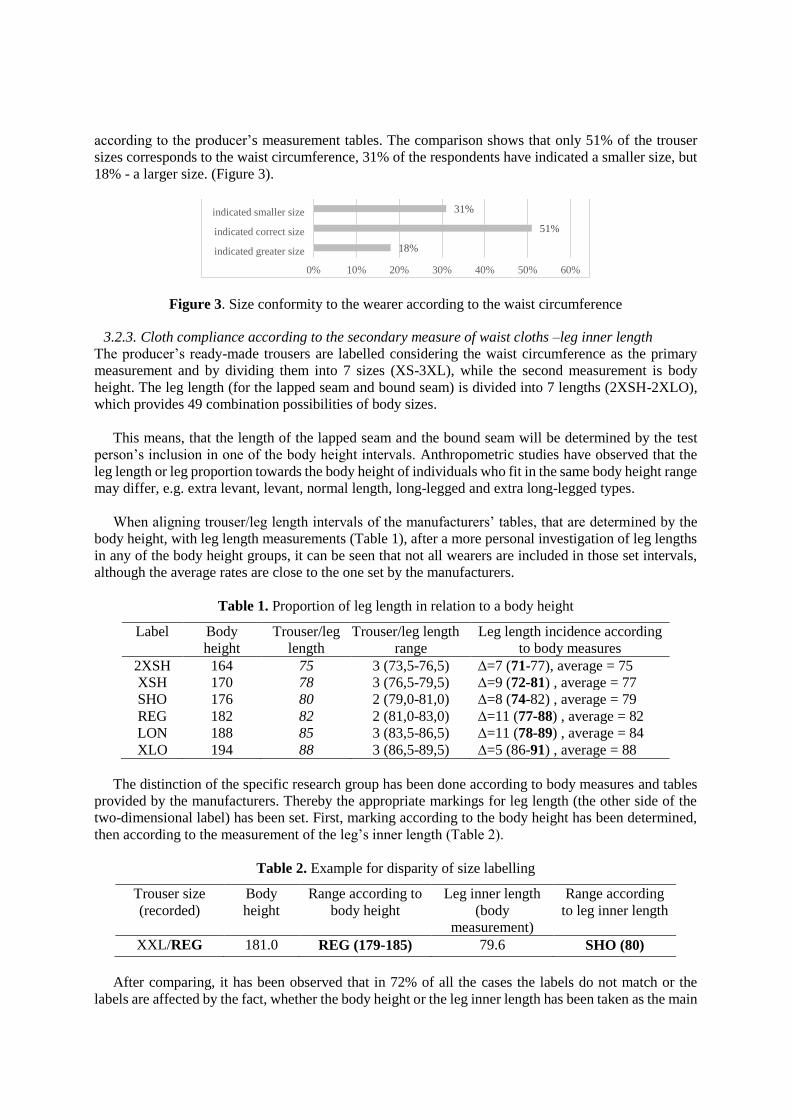
according to the producer’s measurement tables. The comparison shows that only 51% of the trouser
sizes corresponds to the waist circumference, 31% of the respondents have indicated a smaller size, but
18% - a larger size. (Figure 3).
Figure 3. Size conformity to the wearer according to the waist circumference
3.2.3. Cloth compliance according to the secondary measure of waist cloths –leg inner length
The producer’s ready-made trousers are labelled considering the waist circumference as the primary
measurement and by dividing them into 7 sizes (XS-3XL), while the second measurement is body
height. The leg length (for the lapped seam and bound seam) is divided into 7 lengths (2XSH-2XLO),
which provides 49 combination possibilities of body sizes.
This means, that the length of the lapped seam and the bound seam will be determined by the test
person’s inclusion in one of the body height intervals. Anthropometric studies have observed that the
leg length or leg proportion towards the body height of individuals who fit in the same body height range
may differ, e.g. extra levant, levant, normal length, long-legged and extra long-legged types.
When aligning trouser/leg length intervals of the manufacturers’ tables, that are determined by the
body height, with leg length measurements (Table 1), after a more personal investigation of leg lengths
in any of the body height groups, it can be seen that not all wearers are included in those set intervals,
although the average rates are close to the one set by the manufacturers.
Table 1. Proportion of leg length in relation to a body height
Label Body
height
Trouser/leg
length
Trouser/leg length
range
Leg length incidence according
to body measures
2XSH 164 75 3 (73,5-76,5) ∆=7 (71-77), average = 75
XSH 170 78 3 (76,5-79,5) ∆=9 (72-81) , average = 77
SHO 176 80 2 (79,0-81,0) ∆=8 (74-82) , average = 79
REG 182 82 2 (81,0-83,0) ∆=11 (77-88) , average = 82
LON 188 85 3 (83,5-86,5) ∆=11 (78-89) , average = 84
XLO 194 88 3 (86,5-89,5) ∆=5 (86-91) , average = 88
The distinction of the specific research group has been done according to body measures and tables
provided by the manufacturers. Thereby the appropriate markings for leg length (the other side of the
two-dimensional label) has been set. First, marking according to the body height has been determined,
then according to the measurement of the leg’s inner length (Table 2).
Table 2. Example for disparity of size labelling
Trouser size
(recorded)
Body
height
Range according to
body height
Leg inner length
(body
measurement)
Range according
to leg inner length
XXL/REG 181.0 REG (179-185) 79.6 SHO (80)
After comparing, it has been observed that in 72% of all the cases the labels do not match or the
labels are affected by the fact, whether the body height or the leg inner length has been taken as the main
18%
51%
31%
0% 10% 20% 30% 40% 50% 60%
indicated greater size
indicated correct size
indicated smaller size
measurement. It can be seen also visually - when aligning the representations of people belonging to
one body height range, the leg ratio difference can be observed.
3.3. Results of Fabric Property Testing
Two fabrics were used for testing – fabric sample No. 1 issued by the NAF and fabric sample No. 2
issued by the fabric manufacturing company. According to the oral confirmation of the manufacturing
company, the fabric No. 1 has been produced, taking fabric No. 2 as a sample, which is then printed
according to the needs of the Latvian NAF.
The structural and geometric characteristics of the fabric No. 2 have been compared with
characteristics of fabric No. 1. The fibre content and the fabric type of both fabrics correspond to the set
requirements of NAF.
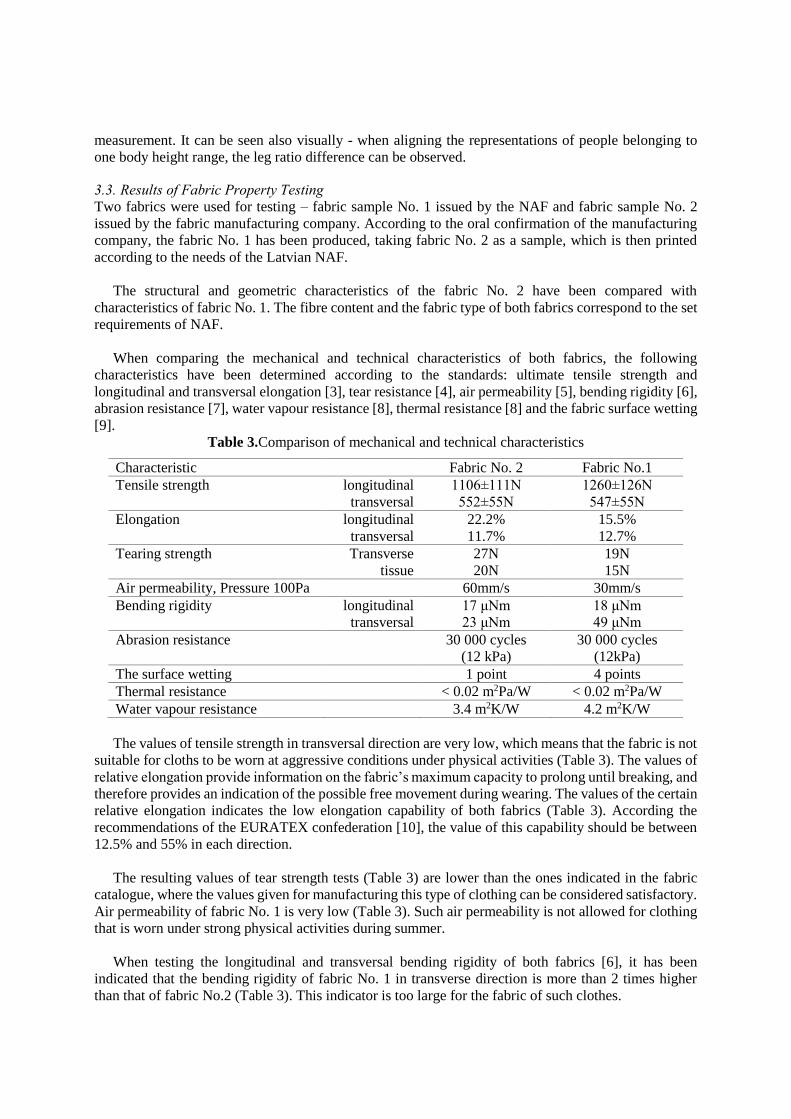
When comparing the mechanical and technical characteristics of both fabrics, the following
characteristics have been determined according to the standards: ultimate tensile strength and
longitudinal and transversal elongation [3], tear resistance [4], air permeability [5], bending rigidity [6],
abrasion resistance [7], water vapour resistance [8], thermal resistance [8] and the fabric surface wetting
[9].
Table 3.Comparison of mechanical and technical characteristics
Characteristic Fabric No. 2 Fabric No.1
Tensile strength longitudinal
transversal
1106±111N
552±55N
1260±126N
547±55N
Elongation longitudinal
transversal
22.2%
11.7%
15.5%
12.7%
Tearing strength Transverse
tissue
27N
20N
19N
15N
Air permeability, Pressure 100Pa 60mm/s 30mm/s
Bending rigidity
longitudinal
transversal
17 μNm
23 μNm
18 μNm
49 μNm
Abrasion resistance
30 000 cycles
(12 kPa)
30 000 cycles
(12kPa)
The surface wetting 1 point 4 points
Thermal resistance < 0.02 m2Pa/W < 0.02 m2Pa/W
Water vapour resistance 3.4 m2K/W 4.2 m2K/W
The values of tensile strength in transversal direction are very low, which means that the fabric is not
suitable for cloths to be worn at aggressive conditions under physical activities (Table 3). The values of
relative elongation provide information on the fabric’s maximum capacity to prolong until breaking, and
therefore provides an indication of the possible free movement during wearing. The values of the certain
relative elongation indicates the low elongation capability of both fabrics (Table 3). According the
recommendations of the EURATEX confederation [10], the value of this capability should be between
12.5% and 55% in each direction.
The resulting values of tear strength tests (Table 3) are lower than the ones indicated in the fabric
catalogue, where the values given for manufacturing this type of clothing can be considered satisfactory.
Air permeability of fabric No. 1 is very low (Table 3). Such air permeability is not allowed for clothing
that is worn under strong physical activities during summer.
When testing the longitudinal and transversal bending rigidity of both fabrics [6], it has been
indicated that the bending rigidity of fabric No. 1 in transverse direction is more than 2 times higher
than that of fabric No.2 (Table 3). This indicator is too large for the fabric of such clothes.
The abrasion resistance indicated in the characterization of fabric No. 2 of the manufacturing
company is equal 25 000 cycles, which indicates a short wearing time.
When testing the surface wetting of both fabrics, the results were different (Table 3). The surface of
fabric No. 2 strongly moistens and its resistance to soaking can be evaluated with 1 point, while the
surface of fabric No. 1 is almost water repellent and can be evaluated with 4 points.
The vapour resistance of fabric No. 2 corresponds to the one set out in the technical specification,
but vapour resistance of fabric No. 1 is higher than set out. This allows us to conclude that during
physical activities within warm weather conditions the lower layer of the cloths will accumulate a higher
level of humidity, due to which the fabric will “stick” to the body, will not resist the extra tension and
tear.
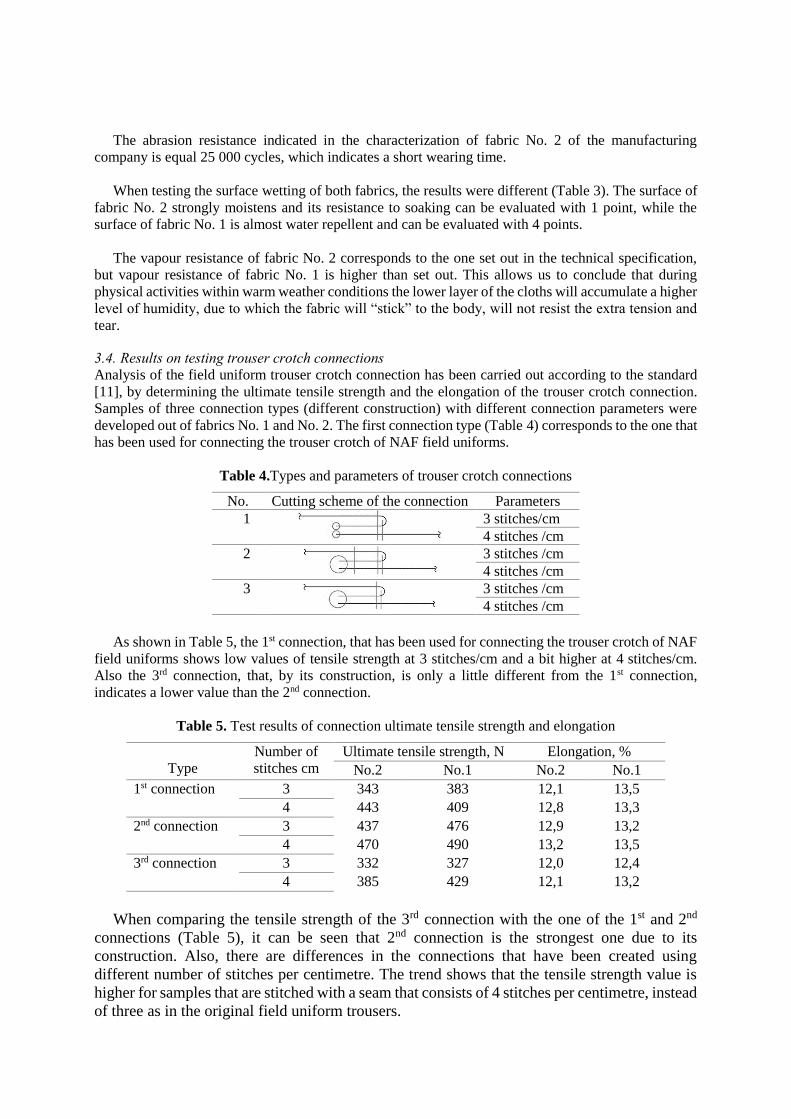
3.4. Results on testing trouser crotch connections
Analysis of the field uniform trouser crotch connection has been carried out according to the standard
[11], by determining the ultimate tensile strength and the elongation of the trouser crotch connection.
Samples of three connection types (different construction) with different connection parameters were
developed out of fabrics No. 1 and No. 2. The first connection type (Table 4) corresponds to the one that
has been used for connecting the trouser crotch of NAF field uniforms.
Table 4.Types and parameters of trouser crotch connections
No. Cutting scheme of the connection Parameters
1
3 stitches/cm
4 stitches /cm
2
3 stitches /cm
4 stitches /cm
3
3 stitches /cm
4 stitches /cm
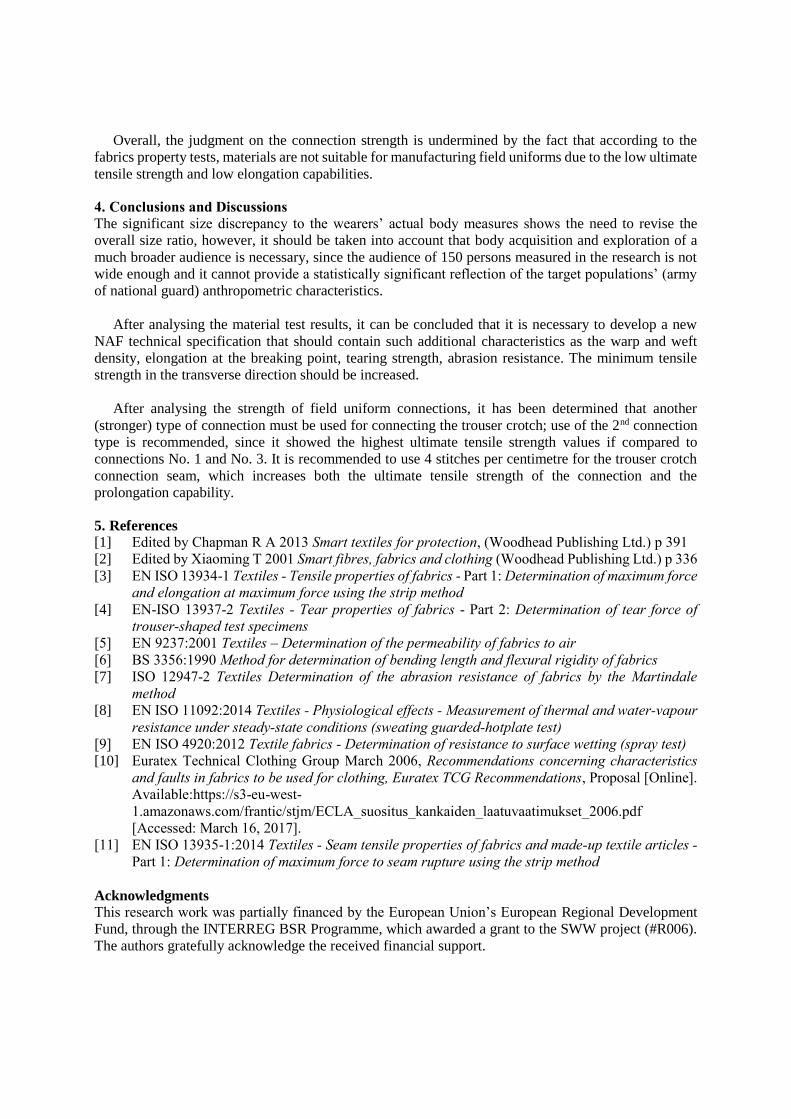
As shown in Table 5, the 1st connection, that has been used for connecting the trouser crotch of NAF
field uniforms shows low values of tensile strength at 3 stitches/cm and a bit higher at 4 stitches/cm.
Also the 3rd connection, that, by its construction, is only a little different from the 1st connection,
indicates a lower value than the 2nd connection.
Table 5. Test results of connection ultimate tensile strength and elongation
Type
Number of
stitches cm
Ultimate tensile strength, N Elongation, %
No.2 No.1 No.2 No.1
1st connection 3 343 383 12,1 13,5
4 443 409 12,8 13,3
2nd connection 3 437 476 12,9 13,2
4 470 490 13,2 13,5
3rd connection 3 332 327 12,0 12,4
4 385 429 12,1 13,2
When comparing the tensile strength of the 3rd connection with the one of the 1st and 2nd
connections (Table 5), it can be seen that 2nd connection is the strongest one due to its
construction. Also, there are differences in the connections that have been created using
different number of stitches per centimetre. The trend shows that the tensile strength value is
higher for samples that are stitched with a seam that consists of 4 stitches per centimetre, instead
of three as in the original field uniform trousers.
Overall, the judgment on the connection strength is undermined by the fact that according to the
fabrics property tests, materials are not suitable for manufacturing field uniforms due to the low ultimate
tensile strength and low elongation capabilities.
4. Conclusions and Discussions
The significant size discrepancy to the wearers’ actual body measures shows the need to revise the
overall size ratio, however, it should be taken into account that body acquisition and exploration of a
much broader audience is necessary, since the audience of 150 persons measured in the research is not
wide enough and it cannot provide a statistically significant reflection of the target populations’ (army
of national guard) anthropometric characteristics.
After analysing the material test results, it can be concluded that it is necessary to develop a new
NAF technical specification that should contain such additional characteristics as the warp and weft
density, elongation at the breaking point, tearing strength, abrasion resistance. The minimum tensile
strength in the transverse direction should be increased.
After analysing the strength of field uniform connections, it has been determined that another
(stronger) type of connection must be used for connecting the trouser crotch; use of the 2nd connection
type is recommended, since it showed the highest ultimate tensile strength values if compared to
connections No. 1 and No. 3. It is recommended to use 4 stitches per centimetre for the trouser crotch
connection seam, which increases both the ultimate tensile strength of the connection and the
prolongation capability.
5. References
[1] Edited by Chapman R A 2013 Smart textiles for protection, (Woodhead Publishing Ltd.) p 391
[2] Edited by Xiaoming T 2001 Smart fibres, fabrics and clothing (Woodhead Publishing Ltd.) p 336
[3] EN ISO 13934-1 Textiles - Tensile properties of fabrics - Part 1: Determination of maximum force
and elongation at maximum force using the strip method
[4] EN-ISO 13937-2 Textiles - Tear properties of fabrics - Part 2: Determination of tear force of
trouser-shaped test specimens
[5] EN 9237:2001 Textiles – Determination of the permeability of fabrics to air
[6] BS 3356:1990 Method for determination of bending length and flexural rigidity of fabrics
[7] ISO 12947-2 Textiles Determination of the abrasion resistance of fabrics by the Martindale
method
[8] EN ISO 11092:2014 Textiles - Physiological effects - Measurement of thermal and water-vapour
resistance under steady-state conditions (sweating guarded-hotplate test)
[9] EN ISO 4920:2012 Textile fabrics - Determination of resistance to surface wetting (spray test)
[10] Euratex Technical Clothing Group March 2006, Recommendations concerning characteristics
and faults in fabrics to be used for clothing, Euratex TCG Recommendations, Proposal [Online].
Available:https://s3-eu-west-
1.amazonaws.com/frantic/stjm/ECLA_suositus_kankaiden_laatuvaatimukset_2006.pdf
[Accessed: March 16, 2017].
[11] EN ISO 13935-1:2014 Textiles - Seam tensile properties of fabrics and made-up textile articles -
Part 1: Determination of maximum force to seam rupture using the strip method
Acknowledgments
This research work was partially financed by the European Union’s European Regional Development
Fund, through the INTERREG BSR Programme, which awarded a grant to the SWW project (#R006).
The authors gratefully acknowledge the received financial support.
Usage of noncontact human body measurements for
development of Army Work Wear Trousers
Inga Dabolina, Eva Lapkovska and Ausma Vilumsone
Riga Technical University, Faculty of Material Science and Applied Chemistry,
Institute of Design Technologies, Kipsalas 6 - 220, Riga, LV-1048, Latvia
E-mail: [email protected]
Abstract. The paper is based on issues related to imperfections of clothing fit, garment
construction solutions and control measurement systems of finished products, which were
identified in the research process analysing army soldier work wear trousers. The aim is to obtain
target group body measurements using noncontact anthropometrical data acquisition method (3D
scanning) for selection and analysis of scanned data suitable for trouser design. Tasks include
comparison of scanned data with manually taken body measurements and different
corresponding human body measurement standard data for establishing potential advantages of
noncontact method usage in solving different trouser design issues.
1. Introduction
The target group of the performed research is Latvian National Armed Force soldiers. Survey,
interviewing and investigation of protective trousers, which have already been in use, showed frequent
occurrence of tears in crotch area. Such clothing damages result in loss of practical and protective
functions. As one of the reasons the improper use of body measurements for pattern making was
proposed. Also the selection criteria of uniforms should be considered – the fit evaluation, soldier
competence in choosing appropriate size uniform and influences on protective clothing functionality in
case of wearing wrong size.
There are possibilities to eliminate the deficiencies in work wear clothing design and supply
processes, which are associated with body measurements, if body measurement analysis of a large group
of people is done using noncontact measuring method. Significant task is to improve manufacturer data
tables of the end user measurements by automated obtaining of a large amount of measurements [1]. It
has to be done considering that so far pattern making is performed using body measurement data base,
which has not been updated for years, and not taking any additional end user body measurements.
2. Materials and Methods
Body measurements of 150 end users were obtained with noncontact method using 3D anthropometrical
scanner Vitus Smart XXL® (©Human Solutions GmbH un VITRONIC GmbH) with Anthroscan
software, but control measurements were taken manually using the traditional anthropometry tools -
measuring tape and anthropometer [2]. Instruction about the 3D scanning conditions (clothing and body
postures) was conducted before the process to avoid possible data inaccuracies, which can occur as a
result of test persons’ individual behaviour, for example, trying to strain some muscle groups or take an
uncharacteristic posture.
The data analysis was made using methods of mathematical statistics; a comparative analysis was
carried out between the measurements obtained with noncontact and manual methods, as well as with
standard data [3,4] using the linear regression coefficients and formulas necessary for calculation of
constructively most significant dimensions of type figures [5].
In order to establish and summarize issues, the analysis of manufacturers’ trouser control
measurement tables was made and the most common defects of the trousers as a result of use (seam and
cloth tears) were collected – defects were visually evaluated, measured and protocoled [6].
3. Results
3.1. Correlation analysis of noncontact and manual methods
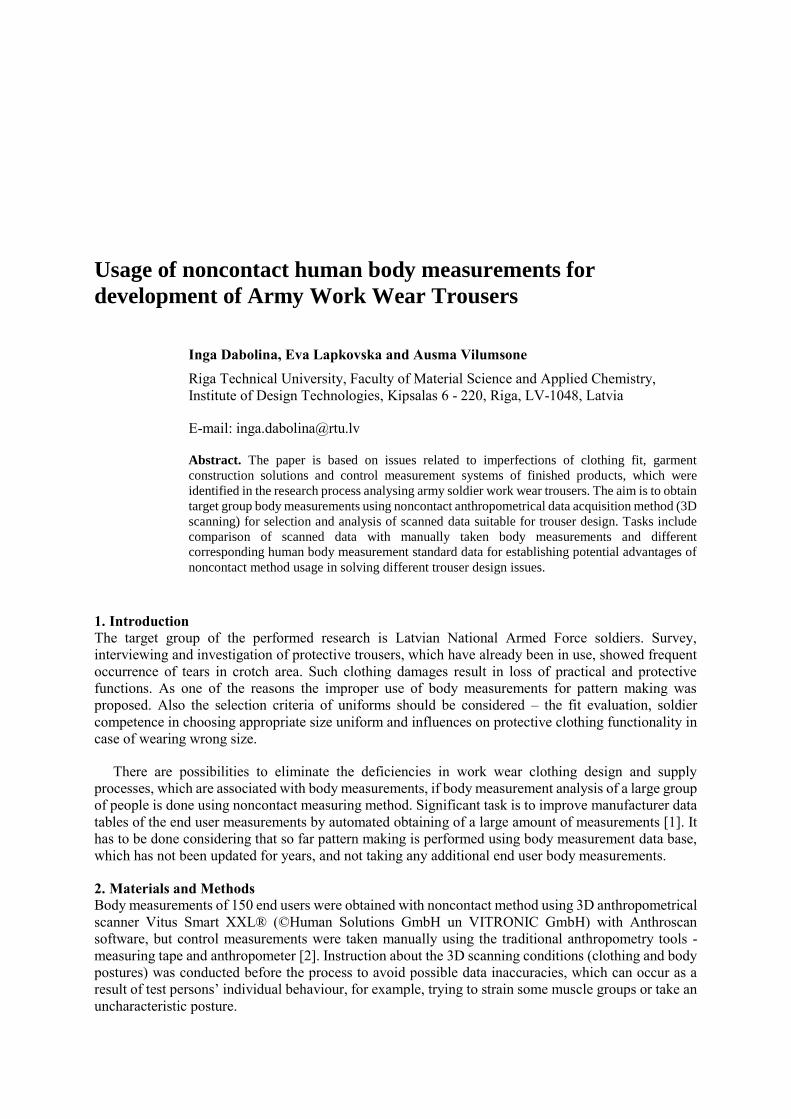
The summary of data allows to evaluate the correlations of body measurements necessary for trouser
design, which are obtained by both (noncontact and manual) methods, for example, girth measurements
- waist girth - ‘figure 1’, buttock girth, thigh girth and length measurements - inseam length - ‘figure 2’,
sideseam length, etc.
Figure 1. Correlation analysis of waist girth
measurements – noncontact and manual methods.
Figure 2. Correlation analysis of inseam length
measurements – noncontact and manual
methods.
In most cases a reasonably close correlation was observed and it was concluded that noncontact
method can serve as a reliable solution in obtaining target group body measurement data in a direct and
fast way for improving the clothing order and supply procedure.
3.2. Measurements and sizes comparisons with standards
Several measurements, which can have significant impact on garment constructions, were analysed
separately comparing gained data and calculated dimensions according standard [4] regression formulas,
for example, thigh girth, buttock girth and inseam length. The initial assumption that the defects of
trousers could arise due to different from standard data [4] thigh girth, which may be increased because
of developed thigh muscles considering physical loads of soldiers, was not confirmed. Thigh girth of
representatives of the target group do not differ compared to standard data [4], when 54% of end users
have smaller but 46% larger thigh girth – however in most cases (81%) not significant increase – within
2 cm interval.
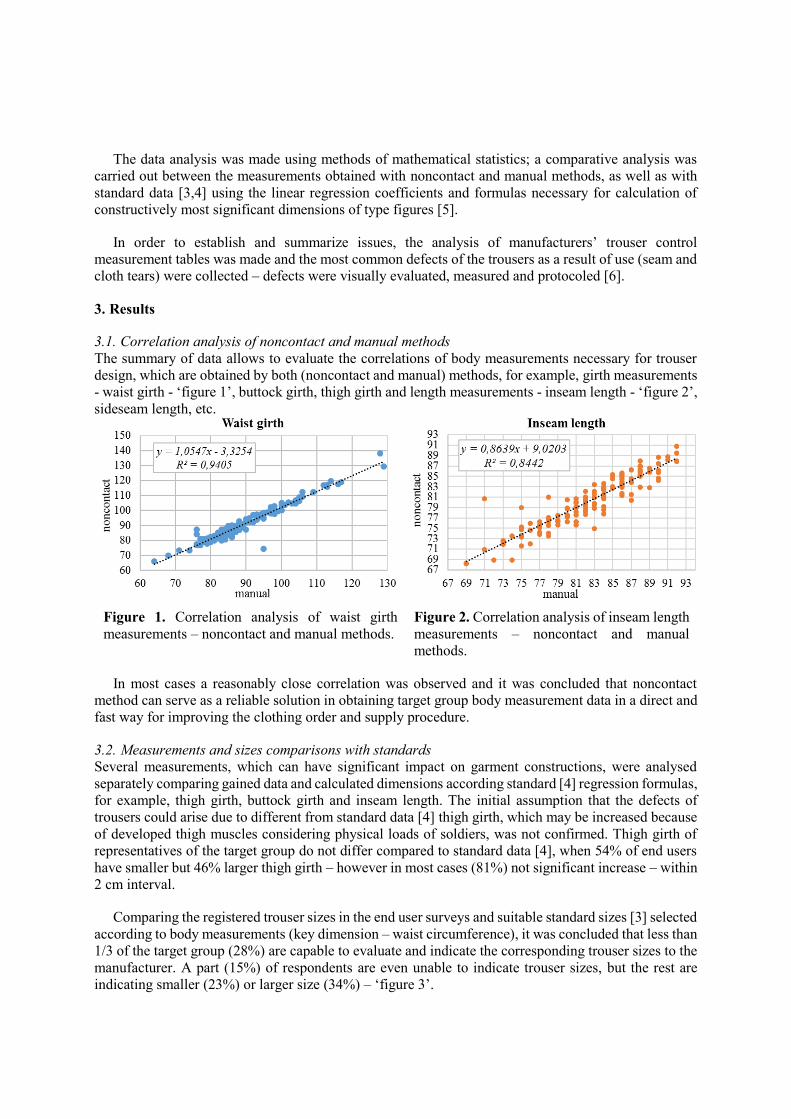
Comparing the registered trouser sizes in the end user surveys and suitable standard sizes [3] selected
according to body measurements (key dimension – waist circumference), it was concluded that less than
1/3 of the target group (28%) are capable to evaluate and indicate the corresponding trouser sizes to the
manufacturer. A part (15%) of respondents are even unable to indicate trouser sizes, but the rest are
indicating smaller (23%) or larger size (34%) – ‘figure 3’.
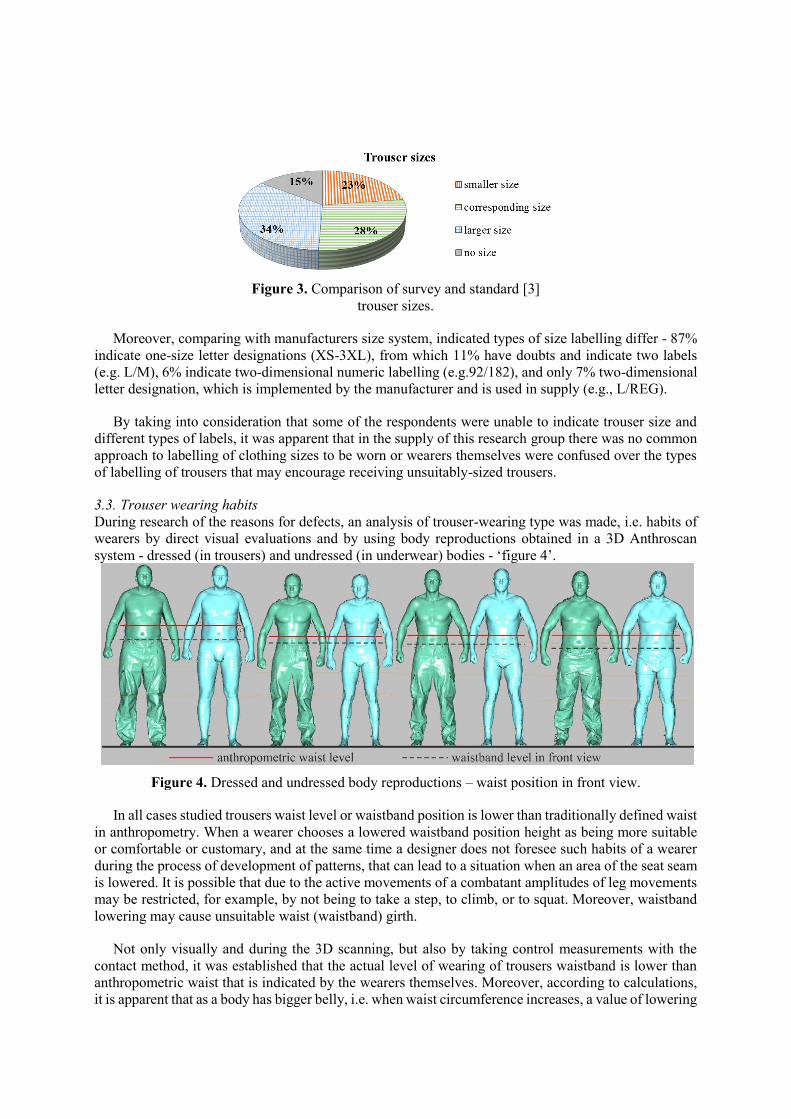
Figure 3. Comparison of survey and standard [3]
trouser sizes.
Moreover, comparing with manufacturers size system, indicated types of size labelling differ - 87%
indicate one-size letter designations (XS-3XL), from which 11% have doubts and indicate two labels
(e.g. L/M), 6% indicate two-dimensional numeric labelling (e.g.92/182), and only 7% two-dimensional
letter designation, which is implemented by the manufacturer and is used in supply (e.g., L/REG).
By taking into consideration that some of the respondents were unable to indicate trouser size and
different types of labels, it was apparent that in the supply of this research group there was no common
approach to labelling of clothing sizes to be worn or wearers themselves were confused over the types
of labelling of trousers that may encourage receiving unsuitably-sized trousers.
3.3. Trouser wearing habits
During research of the reasons for defects, an analysis of trouser-wearing type was made, i.e. habits of
wearers by direct visual evaluations and by using body reproductions obtained in a 3D Anthroscan
system - dressed (in trousers) and undressed (in underwear) bodies - ‘figure 4’.
Figure 4. Dressed and undressed body reproductions – waist position in front view.
In all cases studied trousers waist level or waistband position is lower than traditionally defined waist
in anthropometry. When a wearer chooses a lowered waistband position height as being more suitable
or comfortable or customary, and at the same time a designer does not foresee such habits of a wearer
during the process of development of patterns, that can lead to a situation when an area of the seat seam
is lowered. It is possible that due to the active movements of a combatant amplitudes of leg movements
may be restricted, for example, by not being to take a step, to climb, or to squat. Moreover, waistband
lowering may cause unsuitable waist (waistband) girth.
Not only visually and during the 3D scanning, but also by taking control measurements with the
contact method, it was established that the actual level of wearing of trousers waistband is lower than
anthropometric waist that is indicated by the wearers themselves. Moreover, according to calculations,
it is apparent that as a body has bigger belly, i.e. when waist circumference increases, a value of lowering
a waistband also increases, which should be taken into account in analysis and development of users
group sizes system or database. Or other way of wearing should be introduced.
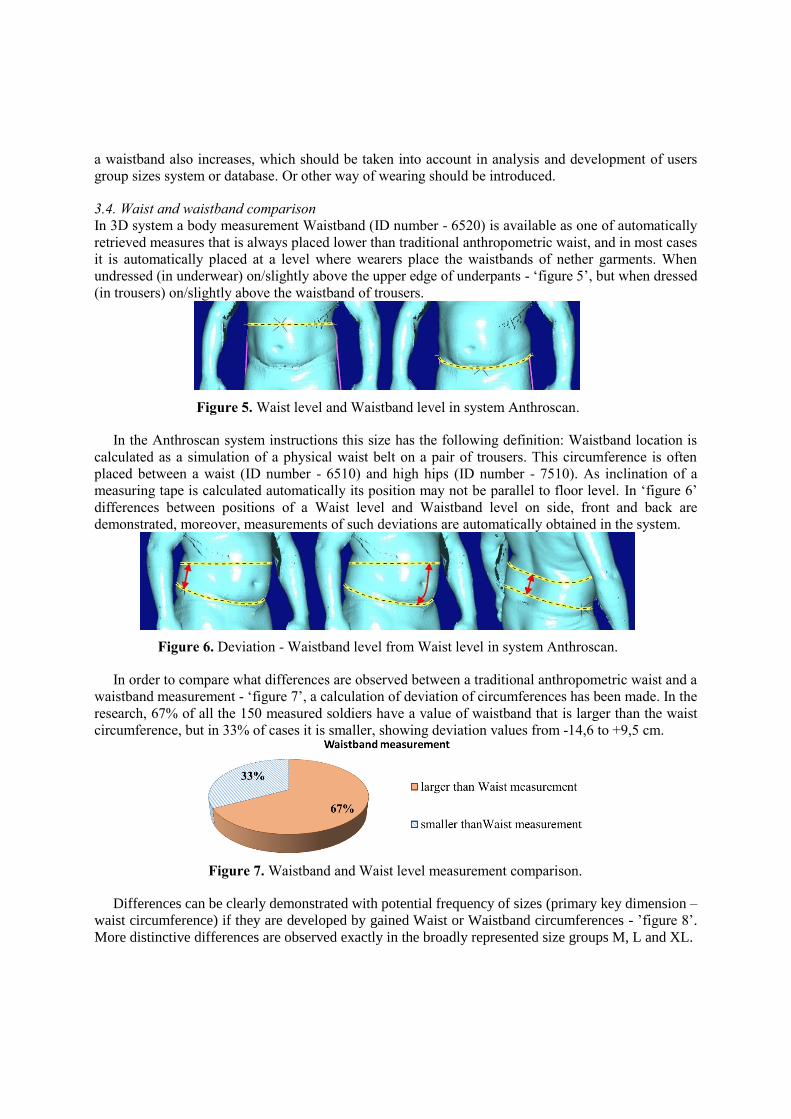
3.4. Waist and waistband comparison
In 3D system a body measurement Waistband (ID number - 6520) is available as one of automatically
retrieved measures that is always placed lower than traditional anthropometric waist, and in most cases
it is automatically placed at a level where wearers place the waistbands of nether garments. When
undressed (in underwear) on/slightly above the upper edge of underpants - ‘figure 5’, but when dressed
(in trousers) on/slightly above the waistband of trousers.
Figure 5. Waist level and Waistband level in system Anthroscan.
In the Anthroscan system instructions this size has the following definition: Waistband location is
calculated as a simulation of a physical waist belt on a pair of trousers. This circumference is often
placed between a waist (ID number - 6510) and high hips (ID number - 7510). As inclination of a
measuring tape is calculated automatically its position may not be parallel to floor level. In ‘figure 6’
differences between positions of a Waist level and Waistband level on side, front and back are
demonstrated, moreover, measurements of such deviations are automatically obtained in the system.
Figure 6. Deviation - Waistband level from Waist level in system Anthroscan.
In order to compare what differences are observed between a traditional anthropometric waist and a
waistband measurement - ‘figure 7’, a calculation of deviation of circumferences has been made. In the
research, 67% of all the 150 measured soldiers have a value of waistband that is larger than the waist
circumference, but in 33% of cases it is smaller, showing deviation values from -14,6 to +9,5 cm.
Figure 7. Waistband and Waist level measurement comparison.
Differences can be clearly demonstrated with potential frequency of sizes (primary key dimension –
waist circumference) if they are developed by gained Waist or Waistband circumferences - ’figure 8’.
More distinctive differences are observed exactly in the broadly represented size groups M, L and XL.
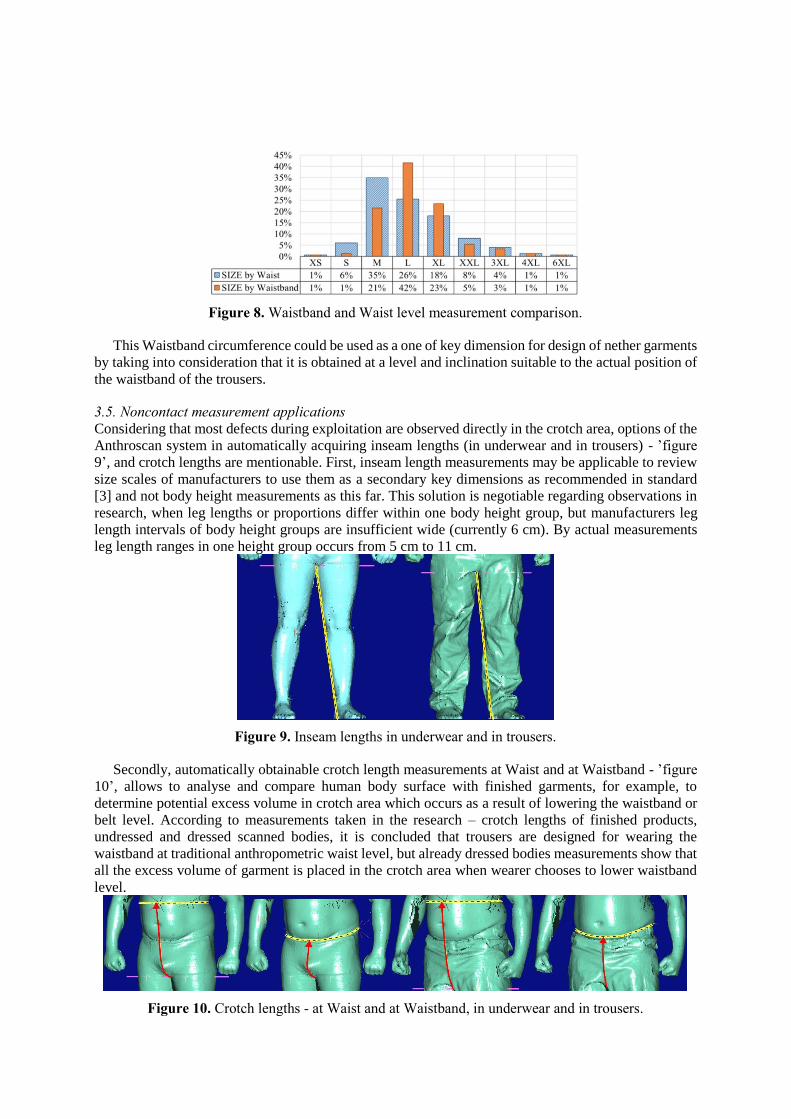
Figure 8. Waistband and Waist level measurement comparison.
This Waistband circumference could be used as a one of key dimension for design of nether garments
by taking into consideration that it is obtained at a level and inclination suitable to the actual position of
the waistband of the trousers.
3.5. Noncontact measurement applications
Considering that most defects during exploitation are observed directly in the crotch area, options of the
Anthroscan system in automatically acquiring inseam lengths (in underwear and in trousers) - ’figure
9’, and crotch lengths are mentionable. First, inseam length measurements may be applicable to review
size scales of manufacturers to use them as a secondary key dimensions as recommended in standard
[3] and not body height measurements as this far. This solution is negotiable regarding observations in
research, when leg lengths or proportions differ within one body height group, but manufacturers leg
length intervals of body height groups are insufficient wide (currently 6 cm). By actual measurements
leg length ranges in one height group occurs from 5 cm to 11 cm.
Figure 9. Inseam lengths in underwear and in trousers.
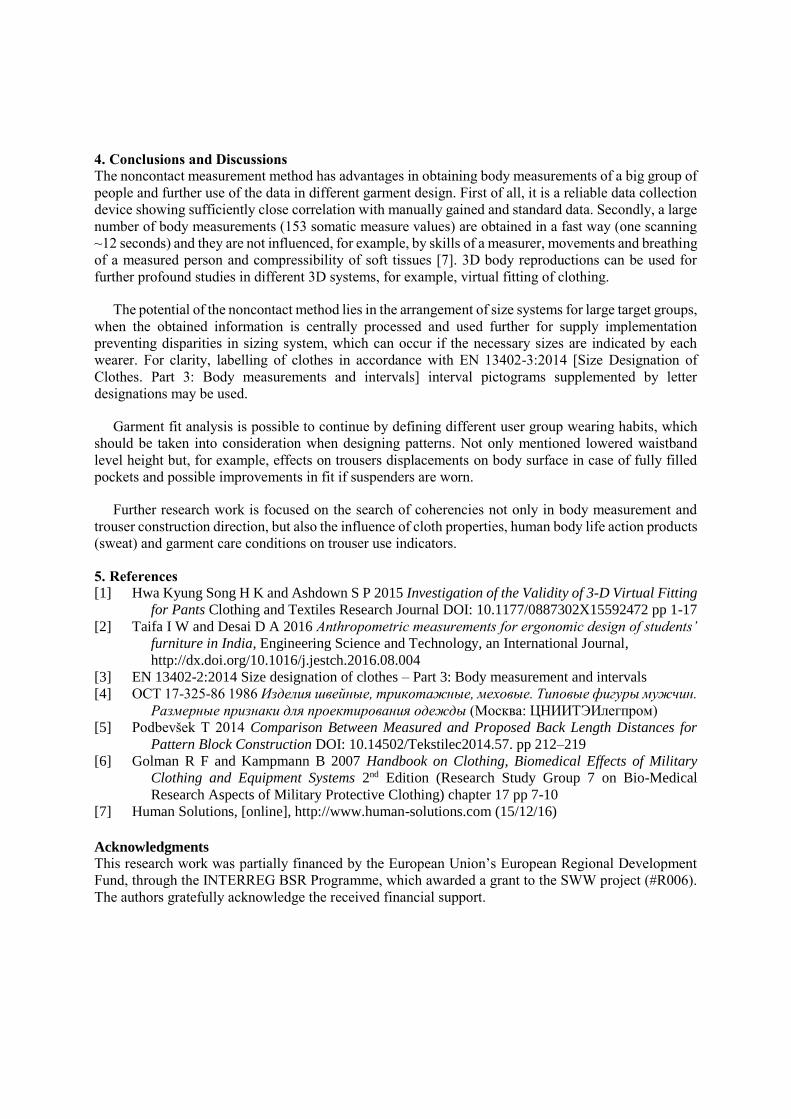
Secondly, automatically obtainable crotch length measurements at Waist and at Waistband - ’figure
10’, allows to analyse and compare human body surface with finished garments, for example, to
determine potential excess volume in crotch area which occurs as a result of lowering the waistband or
belt level. According to measurements taken in the research – crotch lengths of finished products,
undressed and dressed scanned bodies, it is concluded that trousers are designed for wearing the
waistband at traditional anthropometric waist level, but already dressed bodies measurements show that
all the excess volume of garment is placed in the crotch area when wearer chooses to lower waistband
level.
Figure 10. Crotch lengths - at Waist and at Waistband, in underwear and in trousers.
4. Conclusions and Discussions
The noncontact measurement method has advantages in obtaining body measurements of a big group of
people and further use of the data in different garment design. First of all, it is a reliable data collection
device showing sufficiently close correlation with manually gained and standard data. Secondly, a large
number of body measurements (153 somatic measure values) are obtained in a fast way (one scanning
~12 seconds) and they are not influenced, for example, by skills of a measurer, movements and breathing
of a measured person and compressibility of soft tissues [7]. 3D body reproductions can be used for
further profound studies in different 3D systems, for example, virtual fitting of clothing.
The potential of the noncontact method lies in the arrangement of size systems for large target groups,
when the obtained information is centrally processed and used further for supply implementation
preventing disparities in sizing system, which can occur if the necessary sizes are indicated by each
wearer. For clarity, labelling of clothes in accordance with EN 13402-3:2014 [Size Designation of
Clothes. Part 3: Body measurements and intervals] interval pictograms supplemented by letter
designations may be used.
Garment fit analysis is possible to continue by defining different user group wearing habits, which
should be taken into consideration when designing patterns. Not only mentioned lowered waistband
level height but, for example, effects on trousers displacements on body surface in case of fully filled
pockets and possible improvements in fit if suspenders are worn.
Further research work is focused on the search of coherencies not only in body measurement and
trouser construction direction, but also the influence of cloth properties, human body life action products
(sweat) and garment care conditions on trouser use indicators.
5. References
[1] Hwa Kyung Song H K and Ashdown S P 2015 Investigation of the Validity of 3-D Virtual Fitting
for Pants Clothing and Textiles Research Journal DOI: 10.1177/0887302X15592472 pp 1-17 [2] Taifa I W and Desai D A 2016 Anthropometric measurements for ergonomic design of students’
furniture in India, Engineering Science and Technology, an International Journal,
http://dx.doi.org/10.1016/j.jestch.2016.08.004
[3] EN 13402-2:2014 Size designation of clothes – Part 3: Body measurement and intervals
[4] ОСТ 17-325-86 1986 Изделия швейные, трикотажные, меховые. Типовые фигуры мужчин.
Размерные признаки для проектирования одежды (Москва: ЦНИИТЭИлегпром)
[5] Podbevšek T 2014 Comparison Between Measured and Proposed Back Length Distances for
Pattern Block Construction DOI: 10.14502/Tekstilec2014.57. pp 212–219
[6] Golman R F and Kampmann B 2007 Handbook on Clothing, Biomedical Effects of Military
Clothing and Equipment Systems 2nd Edition (Research Study Group 7 on Bio-Medical
Research Aspects of Military Protective Clothing) chapter 17 pp 7-10
[7] Human Solutions, [online], http://www.human-solutions.com (15/12/16)
Acknowledgments
This research work was partially financed by the European Union’s European Regional Development
Fund, through the INTERREG BSR Programme, which awarded a grant to the SWW project (#R006).
The authors gratefully acknowledge the received financial support.
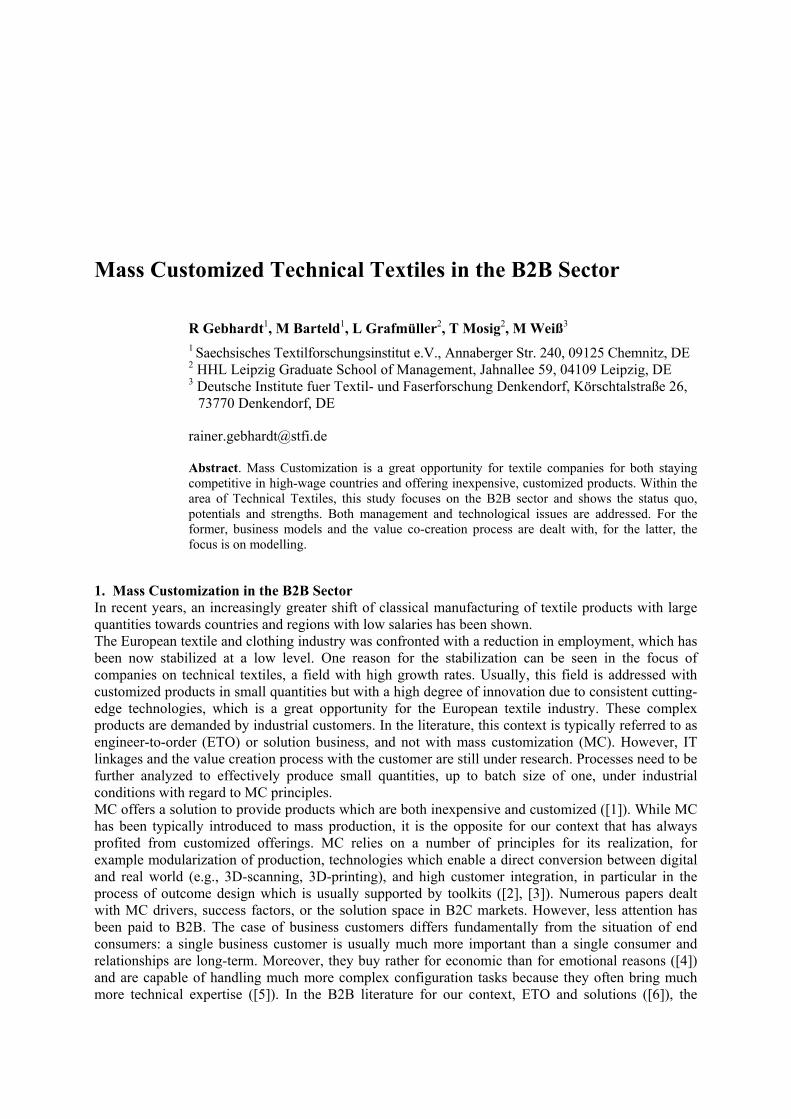
Mass Customized Technical Textiles in the B2B Sector
R Gebhardt1, M Barteld1, L Grafmüller2, T Mosig2, M Weiß3 1 Saechsisches Textilforschungsinstitut e.V., Annaberger Str. 240, 09125 Chemnitz, DE 2 HHL Leipzig Graduate School of Management, Jahnallee 59, 04109 Leipzig, DE 3 Deutsche Institute fuer Textil- und Faserforschung Denkendorf, Körschtalstraße 26,
73770 Denkendorf, DE
Abstract. Mass Customization is a great opportunity for textile companies for both staying competitive in high-wage countries and offering inexpensive, customized products. Within the area of Technical Textiles, this study focuses on the B2B sector and shows the status quo, potentials and strengths. Both management and technological issues are addressed. For the former, business models and the value co-creation process are dealt with, for the latter, the focus is on modelling.
1. Mass Customization in the B2B Sector In recent years, an increasingly greater shift of classical manufacturing of textile products with large quantities towards countries and regions with low salaries has been shown. The European textile and clothing industry was confronted with a reduction in employment, which has been now stabilized at a low level. One reason for the stabilization can be seen in the focus of companies on technical textiles, a field with high growth rates. Usually, this field is addressed with customized products in small quantities but with a high degree of innovation due to consistent cutting-edge technologies, which is a great opportunity for the European textile industry. These complex products are demanded by industrial customers. In the literature, this context is typically referred to as engineer-to-order (ETO) or solution business, and not with mass customization (MC). However, IT linkages and the value creation process with the customer are still under research. Processes need to be further analyzed to effectively produce small quantities, up to batch size of one, under industrial conditions with regard to MC principles. MC offers a solution to provide products which are both inexpensive and customized ([1]). While MC has been typically introduced to mass production, it is the opposite for our context that has always profited from customized offerings. MC relies on a number of principles for its realization, for example modularization of production, technologies which enable a direct conversion between digital and real world (e.g., 3D-scanning, 3D-printing), and high customer integration, in particular in the process of outcome design which is usually supported by toolkits ([2], [3]). Numerous papers dealt with MC drivers, success factors, or the solution space in B2C markets. However, less attention has been paid to B2B. The case of business customers differs fundamentally from the situation of end consumers: a single business customer is usually much more important than a single consumer and relationships are long-term. Moreover, they buy rather for economic than for emotional reasons ([4]) and are capable of handling much more complex configuration tasks because they often bring much more technical expertise ([5]). In the B2B literature for our context, ETO and solutions ([6]), the
offering is created within an individual and personal customer-manufacturer interaction, a time-consuming process with a high degree of product customization and hence complexity ([5], [7]). The offer fulfils specific functions for the customer, also through assistance in internal processes and provision of certain resources ([8], [9]). Hence, the promise of MC with respect to business customers is rather the opposite and poses several challenges: How can the established degree of customization be managed while moving from ETO production or solution-orientated approaches to a more standardized MC offer? What are the central customer value components of MC for business customers? How can these value components be addressed? To answer these questions, business models of the companies need to be adjusted accordingly ([1]). Core of such a MC business model is the customer-manufacturer relationship and the value provided to customers ([10]). In this case, these value-providing activities are represented by consulting and prototyping services. These services are essential for the customization and finally the fit of the product regarding the customer’s needs.
2. Results of the Study about Mass Customization in B2B sector For a first study, 60 companies have been selected [11]. Over 50% of them are interested in individualization and mass customization. The basic project “Key technologies and core competencies to transform traditional textile value chains in sustainable customer oriented value networks based on mass customization strategies” was a part of the futureTEX project. The production of customized and cost-effective products is not really new. However, the research focus until now is strongly on the retail markets and the end-user (B2C). The project tries to close the backlog and the research gap in the B2B sector and for technical textiles. In this paper, we take stock of the current challenges for specialized textile companies to implement MC. Data collected at 80 companies provide information on the current positioning, technical possibilities as well as typical customer-manufacturer interactions. The data contains 69 surveys and 35 interviews conducted with CEOs, sales personnel and heads of development. Final results of the studies on the individualization of textile processes and possible diversification potential for new applications will be presented.
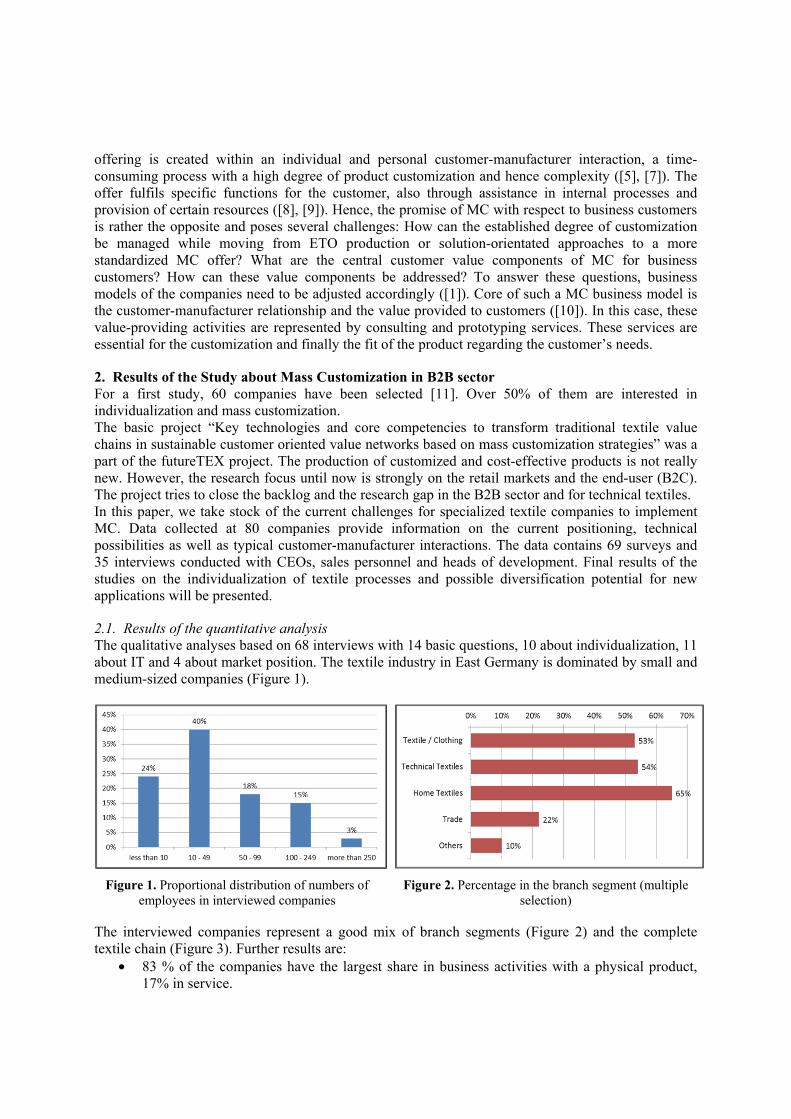
2.1. Results of the quantitative analysis The qualitative analyses based on 68 interviews with 14 basic questions, 10 about individualization, 11 about IT and 4 about market position. The textile industry in East Germany is dominated by small and medium-sized companies (Figure 1).
Figure 1. Proportional distribution of numbers of employees in interviewed companies
Figure 2. Percentage in the branch segment (multiple selection)
The interviewed companies represent a good mix of branch segments (Figure 2) and the complete textile chain (Figure 3). Further results are:
• 83 % of the companies have the largest share in business activities with a physical product, 17% in service.
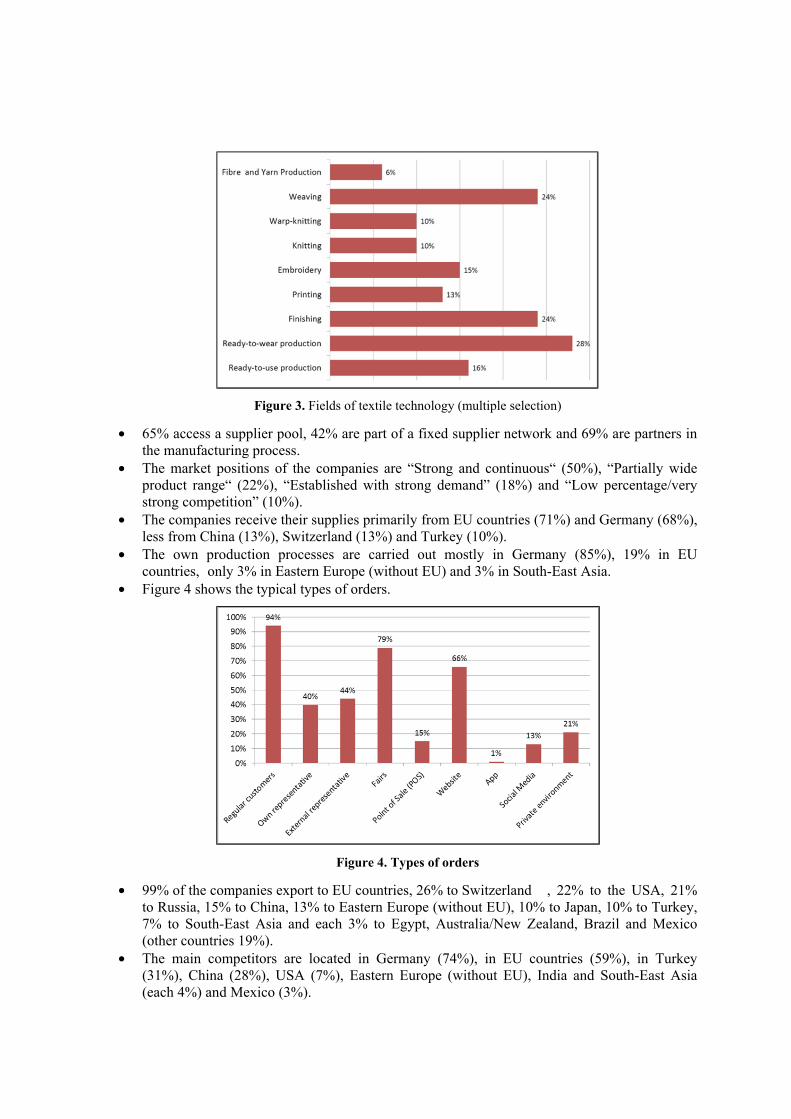
Figure 3. Fields of textile technology (multiple selection)
• 65% access a supplier pool, 42% are part of a fixed supplier network and 69% are partners in the manufacturing process.
• The market positions of the companies are “Strong and continuous“ (50%), “Partially wide product range“ (22%), “Established with strong demand” (18%) and “Low percentage/very strong competition” (10%).
• The companies receive their supplies primarily from EU countries (71%) and Germany (68%), less from China (13%), Switzerland (13%) and Turkey (10%).
• The own production processes are carried out mostly in Germany (85%), 19% in EU countries, only 3% in Eastern Europe (without EU) and 3% in South-East Asia.
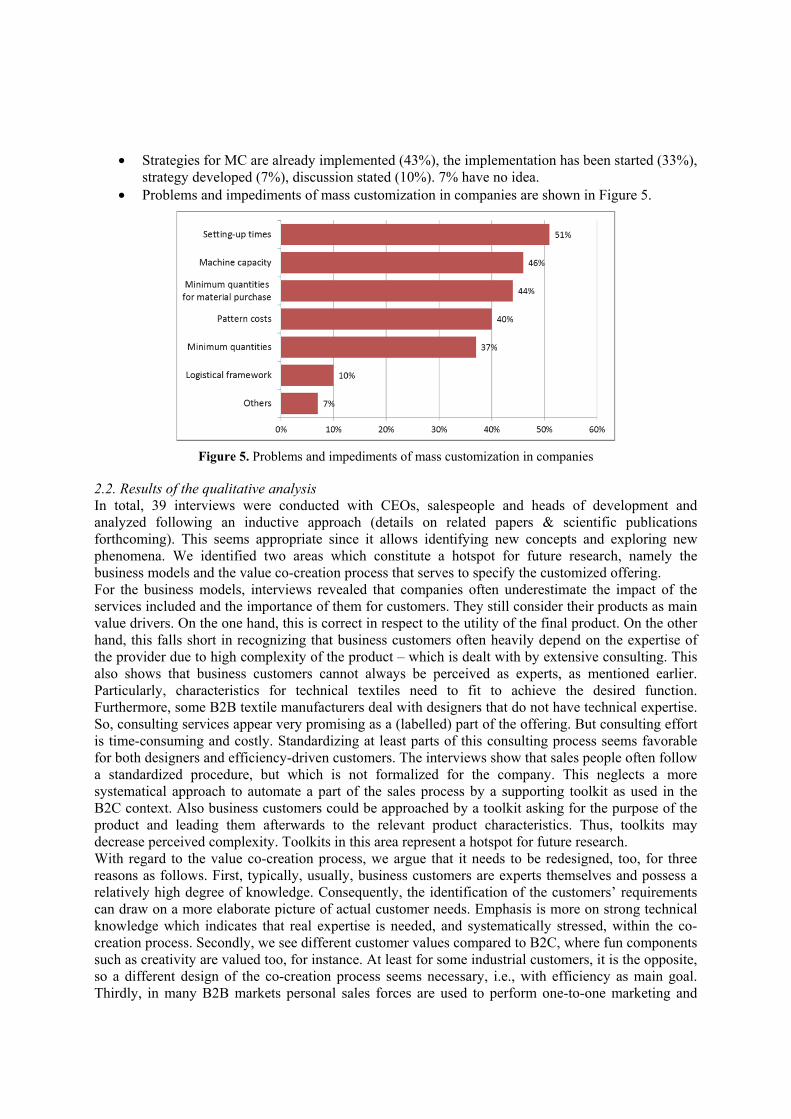
• Figure 4 shows the typical types of orders.
Figure 4. Types of orders
• 99% of the companies export to EU countries, 26% to Switzerland , 22% to the USA, 21% to Russia, 15% to China, 13% to Eastern Europe (without EU), 10% to Japan, 10% to Turkey, 7% to South-East Asia and each 3% to Egypt, Australia/New Zealand, Brazil and Mexico (other countries 19%).
• The main competitors are located in Germany (74%), in EU countries (59%), in Turkey (31%), China (28%), USA (7%), Eastern Europe (without EU), India and South-East Asia (each 4%) and Mexico (3%).
• Strategies for MC are already implemented (43%), the implementation has been started (33%), strategy developed (7%), discussion stated (10%). 7% have no idea.
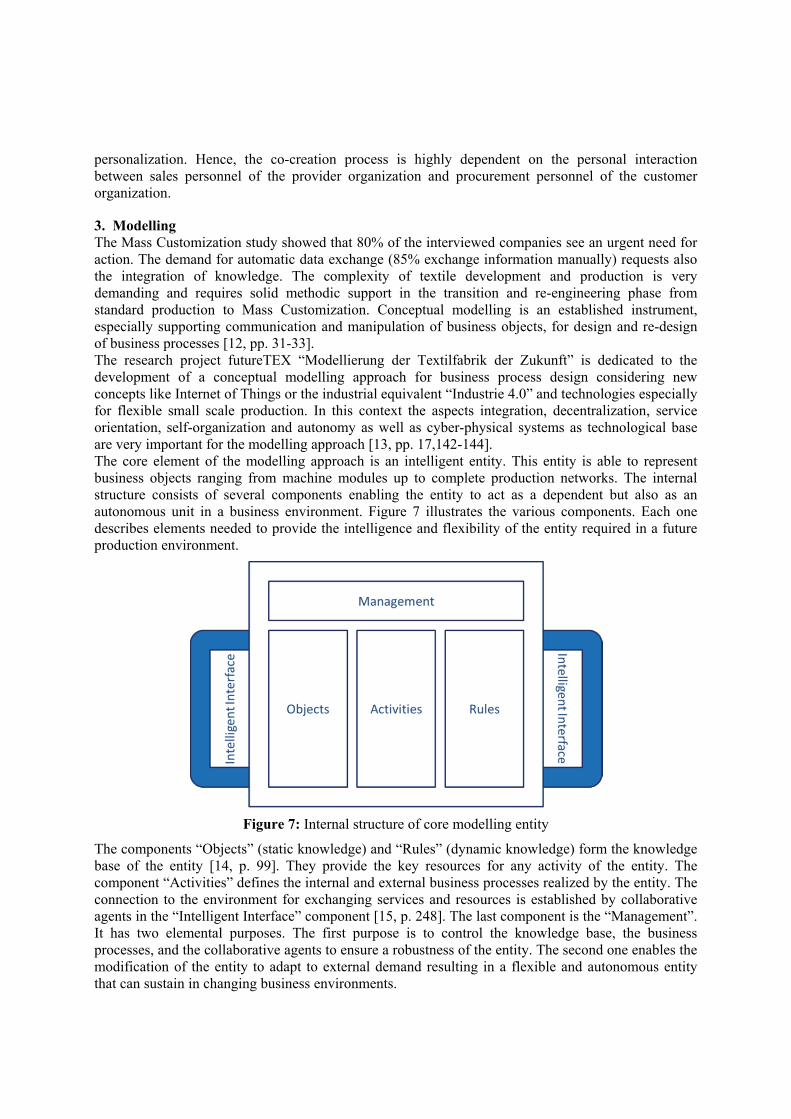
• Problems and impediments of mass customization in companies are shown in Figure 5.
Figure 5. Problems and impediments of mass customization in companies
2.2. Results of the qualitative analysis In total, 39 interviews were conducted with CEOs, salespeople and heads of development and analyzed following an inductive approach (details on related papers & scientific publications forthcoming). This seems appropriate since it allows identifying new concepts and exploring new phenomena. We identified two areas which constitute a hotspot for future research, namely the business models and the value co-creation process that serves to specify the customized offering. For the business models, interviews revealed that companies often underestimate the impact of the services included and the importance of them for customers. They still consider their products as main value drivers. On the one hand, this is correct in respect to the utility of the final product. On the other hand, this falls short in recognizing that business customers often heavily depend on the expertise of the provider due to high complexity of the product – which is dealt with by extensive consulting. This also shows that business customers cannot always be perceived as experts, as mentioned earlier. Particularly, characteristics for technical textiles need to fit to achieve the desired function. Furthermore, some B2B textile manufacturers deal with designers that do not have technical expertise. So, consulting services appear very promising as a (labelled) part of the offering. But consulting effort is time-consuming and costly. Standardizing at least parts of this consulting process seems favorable for both designers and efficiency-driven customers. The interviews show that sales people often follow a standardized procedure, but which is not formalized for the company. This neglects a more systematical approach to automate a part of the sales process by a supporting toolkit as used in the B2C context. Also business customers could be approached by a toolkit asking for the purpose of the product and leading them afterwards to the relevant product characteristics. Thus, toolkits may decrease perceived complexity. Toolkits in this area represent a hotspot for future research. With regard to the value co-creation process, we argue that it needs to be redesigned, too, for three reasons as follows. First, typically, usually, business customers are experts themselves and possess a relatively high degree of knowledge. Consequently, the identification of the customers’ requirements can draw on a more elaborate picture of actual customer needs. Emphasis is more on strong technical knowledge which indicates that real expertise is needed, and systematically stressed, within the co-creation process. Secondly, we see different customer values compared to B2C, where fun components such as creativity are valued too, for instance. At least for some industrial customers, it is the opposite, so a different design of the co-creation process seems necessary, i.e., with efficiency as main goal. Thirdly, in many B2B markets personal sales forces are used to perform one-to-one marketing and
personalization. Hence, the co-creation process is highly dependent on the personal interaction between sales personnel of the provider organization and procurement personnel of the customer organization.
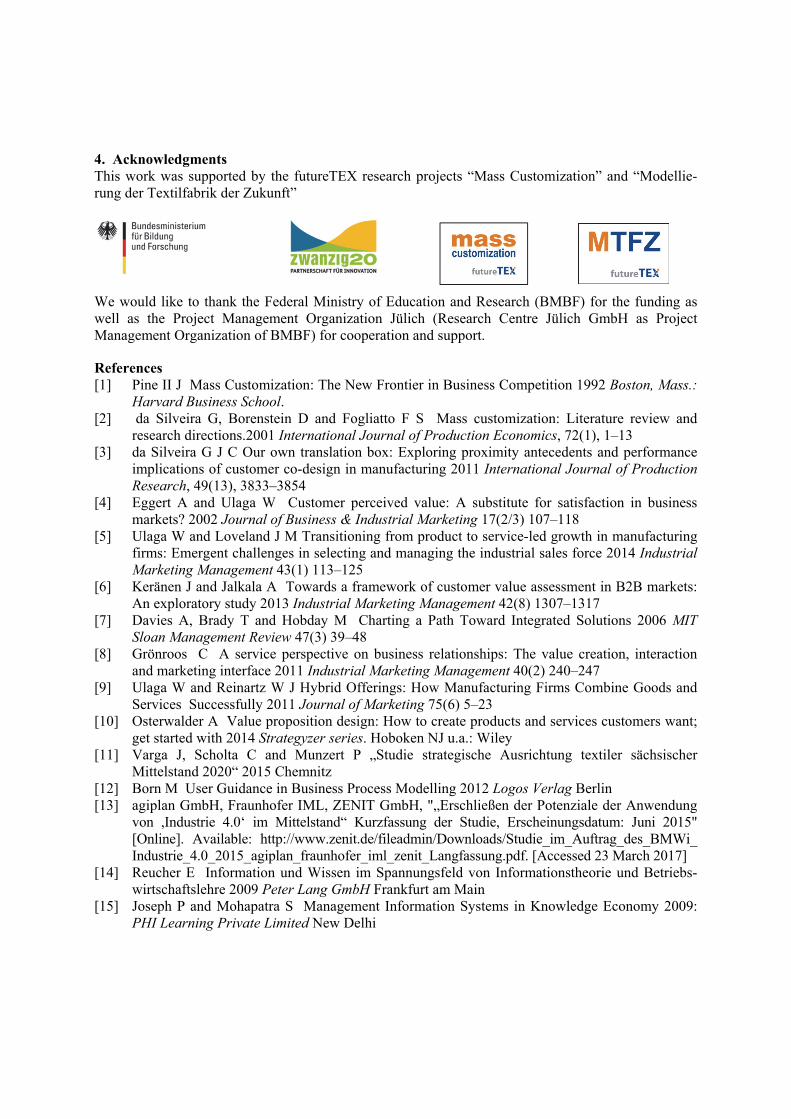
3. Modelling The Mass Customization study showed that 80% of the interviewed companies see an urgent need for action. The demand for automatic data exchange (85% exchange information manually) requests also the integration of knowledge. The complexity of textile development and production is very demanding and requires solid methodic support in the transition and re-engineering phase from standard production to Mass Customization. Conceptual modelling is an established instrument, especially supporting communication and manipulation of business objects, for design and re-design of business processes [12, pp. 31-33]. The research project futureTEX “Modellierung der Textilfabrik der Zukunft” is dedicated to the development of a conceptual modelling approach for business process design considering new concepts like Internet of Things or the industrial equivalent “Industrie 4.0” and technologies especially for flexible small scale production. In this context the aspects integration, decentralization, service orientation, self-organization and autonomy as well as cyber-physical systems as technological base are very important for the modelling approach [13, pp. 17,142-144]. The core element of the modelling approach is an intelligent entity. This entity is able to represent business objects ranging from machine modules up to complete production networks. The internal structure consists of several components enabling the entity to act as a dependent but also as an autonomous unit in a business environment. Figure 7 illustrates the various components. Each one describes elements needed to provide the intelligence and flexibility of the entity required in a future production environment.
Figure 7: Internal structure of core modelling entity
The components “Objects” (static knowledge) and “Rules” (dynamic knowledge) form the knowledge base of the entity [14, p. 99]. They provide the key resources for any activity of the entity. The component “Activities” defines the internal and external business processes realized by the entity. The connection to the environment for exchanging services and resources is established by collaborative agents in the “Intelligent Interface” component [15, p. 248]. The last component is the “Management”. It has two elemental purposes. The first purpose is to control the knowledge base, the business processes, and the collaborative agents to ensure a robustness of the entity. The second one enables the modification of the entity to adapt to external demand resulting in a flexible and autonomous entity that can sustain in changing business environments.
4. Acknowledgments This work was supported by the futureTEX research projects “Mass Customization” and “Modellie-rung der Textilfabrik der Zukunft”
We would like to thank the Federal Ministry of Education and Research (BMBF) for the funding as well as the Project Management Organization Jülich (Research Centre Jülich GmbH as Project Management Organization of BMBF) for cooperation and support.
References [1] Pine II J Mass Customization: The New Frontier in Business Competition 1992 Boston, Mass.:
Harvard Business School. [2] da Silveira G, Borenstein D and Fogliatto F S Mass customization: Literature review and
research directions.2001 International Journal of Production Economics, 72(1), 1–13 [3] da Silveira G J C Our own translation box: Exploring proximity antecedents and performance
implications of customer co-design in manufacturing 2011 International Journal of Production Research, 49(13), 3833–3854
[4] Eggert A and Ulaga W Customer perceived value: A substitute for satisfaction in business markets? 2002 Journal of Business & Industrial Marketing 17(2/3) 107–118
[5] Ulaga W and Loveland J M Transitioning from product to service-led growth in manufacturing firms: Emergent challenges in selecting and managing the industrial sales force 2014 Industrial Marketing Management 43(1) 113–125
[6] Keränen J and Jalkala A Towards a framework of customer value assessment in B2B markets: An exploratory study 2013 Industrial Marketing Management 42(8) 1307–1317
[7] Davies A, Brady T and Hobday M Charting a Path Toward Integrated Solutions 2006 MIT Sloan Management Review 47(3) 39–48
[8] Grönroos C A service perspective on business relationships: The value creation, interaction and marketing interface 2011 Industrial Marketing Management 40(2) 240–247
[9] Ulaga W and Reinartz W J Hybrid Offerings: How Manufacturing Firms Combine Goods and Services Successfully 2011 Journal of Marketing 75(6) 5–23
[10] Osterwalder A Value proposition design: How to create products and services customers want; get started with 2014 Strategyzer series. Hoboken NJ u.a.: Wiley
[11] Varga J, Scholta C and Munzert P „Studie strategische Ausrichtung textiler sächsischer Mittelstand 2020“ 2015 Chemnitz
[12] Born M User Guidance in Business Process Modelling 2012 Logos Verlag Berlin [13] agiplan GmbH, Fraunhofer IML, ZENIT GmbH, "„Erschließen der Potenziale der Anwendung
von ,Industrie 4.0‘ im Mittelstand“ Kurzfassung der Studie, Erscheinungsdatum: Juni 2015" [Online]. Available: http://www.zenit.de/fileadmin/Downloads/Studie_im_Auftrag_des_BMWi_ Industrie_4.0_2015_agiplan_fraunhofer_iml_zenit_Langfassung.pdf. [Accessed 23 March 2017]
[14] Reucher E Information und Wissen im Spannungsfeld von Informationstheorie und Betriebs-wirtschaftslehre 2009 Peter Lang GmbH Frankfurt am Main
[15] Joseph P and Mohapatra S Management Information Systems in Knowledge Economy 2009: PHI Learning Private Limited New Delhi
Big data in fashion industry
S Jain1,2,3,4, J Bruniaux
2, X Zeng1,2
and P Bruniaux1,2
1Univ Lille Nord de France, F-59000 Lille, France 2GEMTEX, ENSAIT, F-59100 Roubaix, France 3Swedish School of Textiles, University of Boras, S-50190 Boras, Sweden 4College of Textile and Clothing Engineering, Soochow University, Suzhou, China
Email: [email protected]
Abstract. Significant work has been done in the field of big data in last decade. The concept
of big data includes analysing voluminous data to extract valuable information. In the fashion
world, big data is increasingly playing a part in trend forecasting, analysing consumer
behaviour, preference and emotions. The purpose of this paper is to introduce the term fashion
data and why it can be considered as big data. It also gives a broad classification of the types of
fashion data and briefly defines them. Also, the methodology and working of a system that will
use this data is briefly described.
1. Introduction
The industries are experiencing evolution since ages. The first industrial revolution embarked the use
of steam and water to mechanize production. The second used electrification to introduce the world to
mass production and division of labour. The third saw the rise of computers and digital technology,
which automated the production processes. The third revolution has evolved into the fourth which
encompasses the ‘Internet of Things’, and at its core lies the combination of big data, analytics and
physical technologies [1] [2].
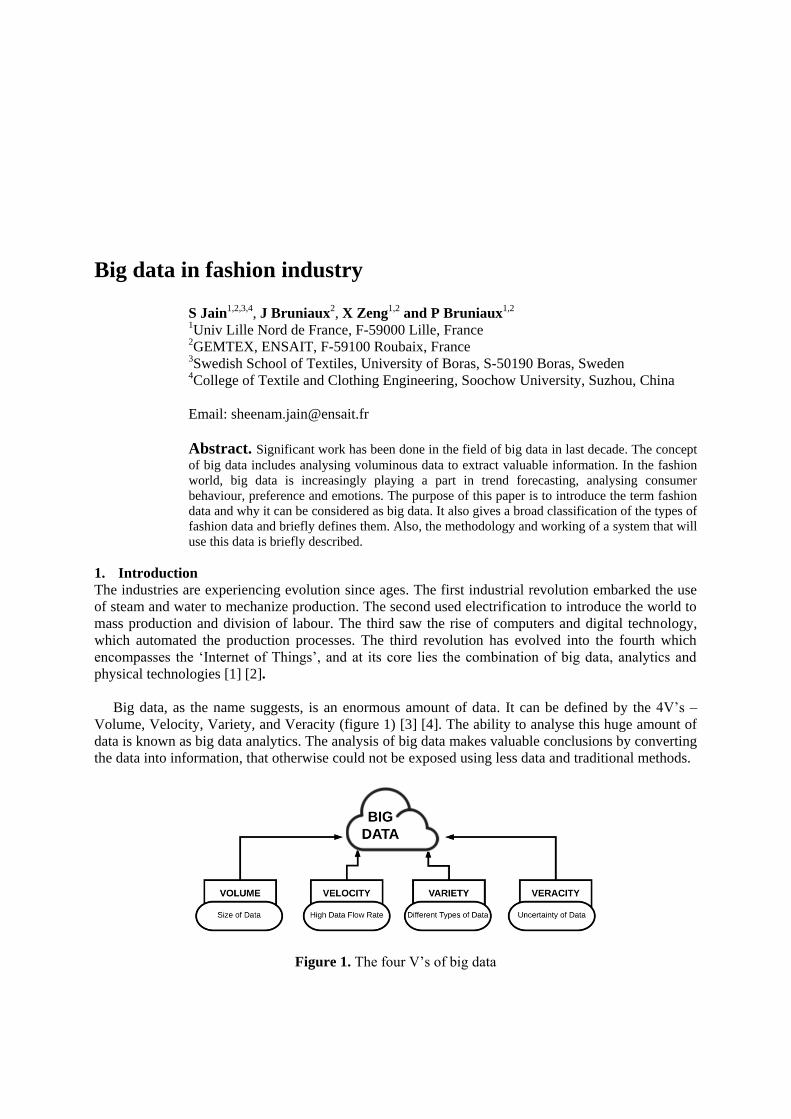
Big data, as the name suggests, is an enormous amount of data. It can be defined by the 4V’s –
Volume, Velocity, Variety, and Veracity (figure 1) [3] [4]. The ability to analyse this huge amount of
data is known as big data analytics. The analysis of big data makes valuable conclusions by converting
the data into information, that otherwise could not be exposed using less data and traditional methods.
Figure 1. The four V’s of big data
Big data has gained significant importance in the fashion world in the last decade [5] [6] [7]. It is
increasingly being used in trend forecasting, supply chain management, analysing customer behaviour,
preferences and emotions. The demands of the customer, nowadays, are constantly changing. They
want garments with a personalized style, fit and pattern/color/print. Because of this, the fashion
companies lose a lot of money due to excessive stock, which becomes obsolete because of changing
trends.
To deal with this, the industry has experienced a shift from mass production to mass customization,
which is simply customization at mass production efficiency [8]. There are many technologies that
help the industry in creating new ways for satisfying the ever-growing and ever-changing needs of the
customer. There are, however, many challenges when it comes to adapting the production process as
complexity increases with the level of customization [9] [10].
Another problem with mass customization is that, the customer is unaware of her/his needs and
mostly lack professional design knowledge. Due to this, most mass customized products are not as
desired, and hence, the customer is rendered dissatisfied. Thus, the requirement of a personal style
advisor arises; to help the customer in finding a garment that satisfies her/his needs. Since, everything
is going on the web, so there are virtual style advisors available. Most of them are not affordable by
every customer. For this, the recommendation systems were introduced. These systems offer the
customer recommendations during the process of designing. They can be based on collaborative
filtering, wherein the system recommends on the basis of the preferences of a group of users; content
based filtering, wherein the system uses user profile to match an item. This requires ratings given to a
product directly by the user [11] [12].
But there is one crucial problem with these kinds of systems – the cold start problem [11]. This
occurs when the system has to provide recommendation to a new customer. And since there is not
enough information about the new customer, the recommended product may not be so relevant. Once
the customer starts using the system, a significant amount of information about their preferences is
stored, and then the effectiveness of the system starts increasing.
As a result, recommendation system progressed into knowledge base recommender systems [11] [13].
These systems have databases that are linked together with complex relationships. These databases,
connected to the system, will give knowledge for giving recommendation to the customer. They don’t
need user profile for offering recommendations. Hence, they can help in solving the previously stated
cold start problem.
For building these knowledge bases, the first requirement is to have data, in this case the data
related to fashion industry. In this context, this paper defines the fashion data and how it can be
classified. Also, it will introduce a methodology to create a search engine, where the customer can
interact with the virtual environment to customize a garment according to his\her needs. The search
engine will have integrated knowledge bases of fashion big data, thus helping the customer by giving
style recommendations.
The rest of the paper is organized as follows: Section 2 presents an overview of the related works. The
fashion data is defined in section 3. The proposed system is presented in section 4. Conclusions and
future research direction followed in Section 5.
2. Related Work
Significant work has been done in the field of big data. The term big data has been used since many
years as a business buzz-word. Its significance and value has been proved in various sectors like
engineering, healthcare, education, manufacturing, entertainment, retail. Many companies use big data
technologies to its maximum advantage on a daily basis to extract value from them. In research, many
authors have been pointing out the potential benefits of using big data as a new tool to understand
everything from traffic jams to customer preferences. However, big data is still at a nascent stage in
the fashion industry. Several fashion retailers are now making use of big data to understand their
customers’ behavior and to cater to their needs in a better way.
In this context, a lot of research has been done, to develop recommender systems [13] [14] [15],
which make use of the big data technologies to predict customer behavior. The key function of a
recommendation system, in general, is to predict what a customer would like to buy, on the basis of
their analyzed behavior, shopping preferences and the behavior of the people with similar choices or
demographics. Most systems require sufficient information about the customer to be able to offer them
products that will meet their needs. Martinez et al [16] proposed a recommender system that caters to
the unavailability of enough information about customer preferences. Their system collects
information from the user by using numerical preference relation structure which only requires to be
filled with a small number of values. McAuley et al [17] proposed an image based recommendation
system which modeled the human sense of the relationships between objects based on their
appearance. All these systems, however, require prior knowledge about the preferences of the
customer. For this reason, many knowledge base recommender systems have been developed. Wang et
al [18] proposed a fashion recommender system that considers perception of both the fashion experts
and the consumers. Their system integrates fashion themes and human perception on personalized
body shape and fashion designer’s knowledge.
So, it can be incurred from the literature that most of the developed systems focus on a particular
knowledge – fashion design, fit, color, and material. Hence, there is an urgent need to develop a
system that has all the knowledge bases related to garment design integrated.
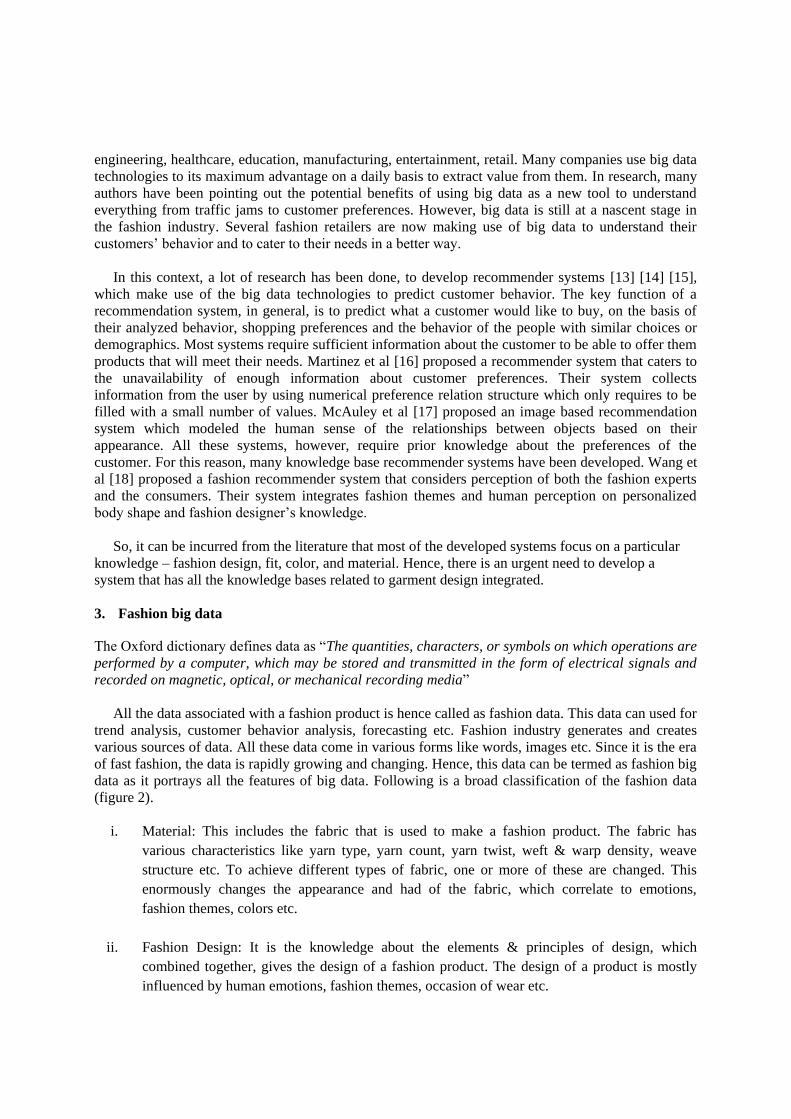
3. Fashion big data
The Oxford dictionary defines data as “The quantities, characters, or symbols on which operations are
performed by a computer, which may be stored and transmitted in the form of electrical signals and
recorded on magnetic, optical, or mechanical recording media”
All the data associated with a fashion product is hence called as fashion data. This data can used for
trend analysis, customer behavior analysis, forecasting etc. Fashion industry generates and creates
various sources of data. All these data come in various forms like words, images etc. Since it is the era
of fast fashion, the data is rapidly growing and changing. Hence, this data can be termed as fashion big
data as it portrays all the features of big data. Following is a broad classification of the fashion data
(figure 2).
i. Material: This includes the fabric that is used to make a fashion product. The fabric has
various characteristics like yarn type, yarn count, yarn twist, weft & warp density, weave
structure etc. To achieve different types of fabric, one or more of these are changed. This
enormously changes the appearance and had of the fabric, which correlate to emotions,
fashion themes, colors etc.
ii. Fashion Design: It is the knowledge about the elements & principles of design, which
combined together, gives the design of a fashion product. The design of a product is mostly
influenced by human emotions, fashion themes, occasion of wear etc.
iii. Body Data: The body data can be in the form 2D or 3D data. For 2D, it is collected using the
conventional method of body measurement. For 3D, it is collected 3D body scanners. These
data can provide information like body measurement & body type.
iv. Color: Color preference is an important aspect that influences a gamut of human behavior.
Kobayashi’s color image scale [19] states that color can have three attributes – warm or cool,
soft or hard, clear or grayish, which associate with hue, chroma & value. These attributes can
be linked with the emotion
v. Technical/Production design: The technical design allows the producer to understand that how
the product will be made. This makes the design of a product production friendly. It includes
knowledge of pattern making, sewing etc.
To extract knowledge from these data, they have to be linked together. The next section describes
the proposed system that will use this data.
Figure 2. Data in Fashion
4. Proposed System
The proposed system (figure 3) is a combination of the knowledge based recommender
system and a search engine. It takes from engine the ability to provide the customer with an
option to write her/his query and with the help of the recommender system, offer a product to
the customer.
The system will have the knowledge bases mentioned in section 3. These bases will help in
removing the cold start problem. The working of the system will be such that the customer can select a
garment silhouette and provide his measurements, now the system will recommend a material, colour,
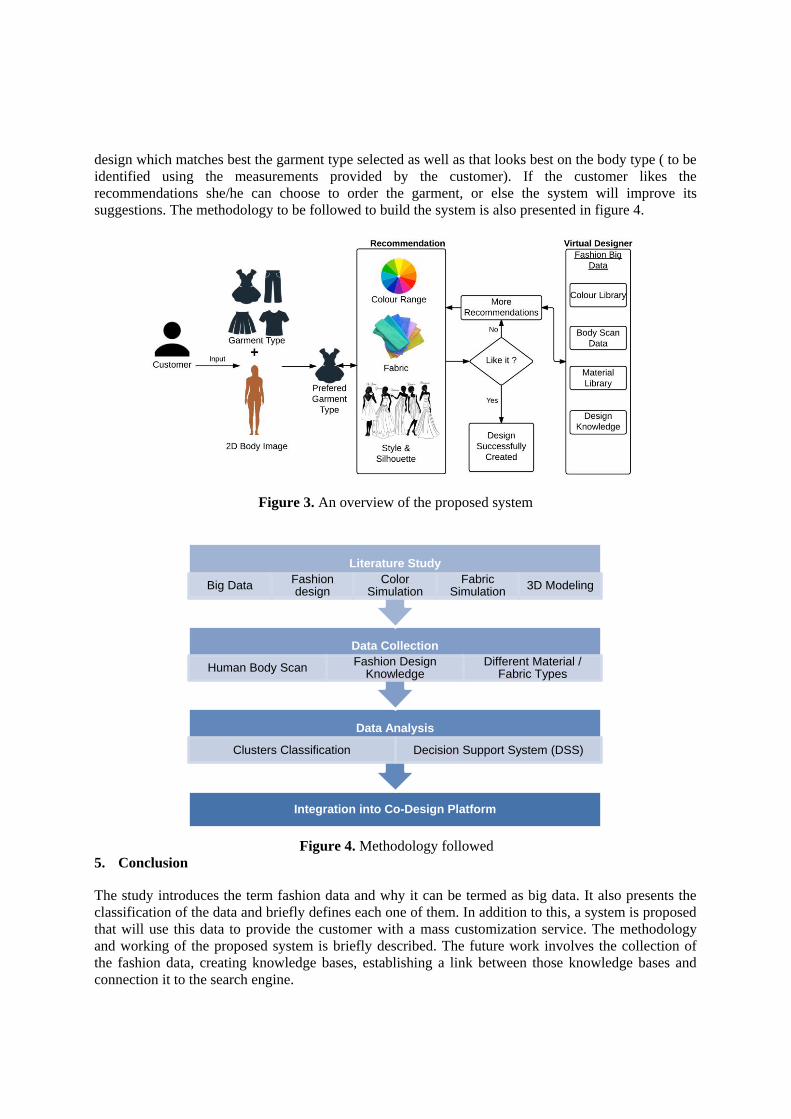
design which matches best the garment type selected as well as that looks best on the body type ( to be
identified using the measurements provided by the customer). If the customer likes the
recommendations she/he can choose to order the garment, or else the system will improve its
suggestions. The methodology to be followed to build the system is also presented in figure 4.
Figure 3. An overview of the proposed system
Figure 4. Methodology followed
5. Conclusion
The study introduces the term fashion data and why it can be termed as big data. It also presents the
classification of the data and briefly defines each one of them. In addition to this, a system is proposed
that will use this data to provide the customer with a mass customization service. The methodology
and working of the proposed system is briefly described. The future work involves the collection of
the fashion data, creating knowledge bases, establishing a link between those knowledge bases and
connection it to the search engine.
Integration into Co-Design Platform
Data Analysis
Clusters Classification Decision Support System (DSS)
Data Collection
Human Body Scan Fashion Design
Knowledge Different Material /
Fabric Types
Literature Study
Big Data Fashion design
Color Simulation
Fabric Simulation
3D Modeling
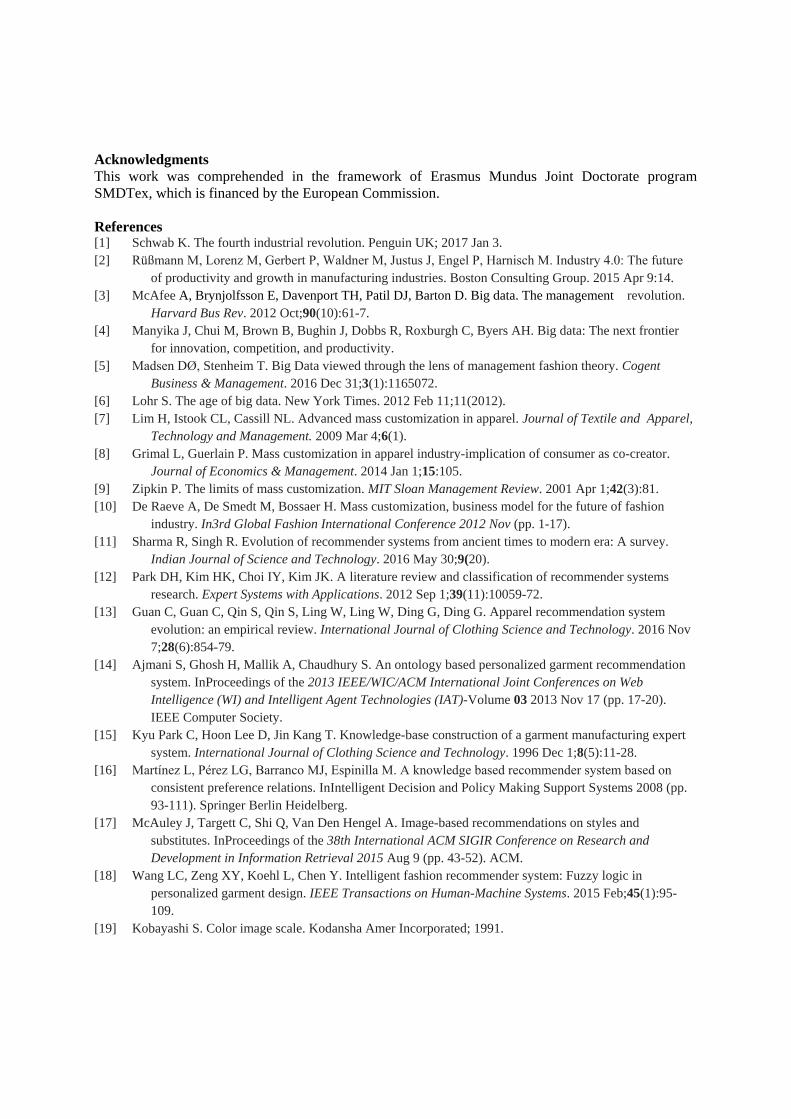
Acknowledgments
This work was comprehended in the framework of Erasmus Mundus Joint Doctorate program
SMDTex, which is financed by the European Commission.
References [1] Schwab K. The fourth industrial revolution. Penguin UK; 2017 Jan 3.
[2] Rüßmann M, Lorenz M, Gerbert P, Waldner M, Justus J, Engel P, Harnisch M. Industry 4.0: The future
of productivity and growth in manufacturing industries. Boston Consulting Group. 2015 Apr 9:14.
[3] McAfee A, Brynjolfsson E, Davenport TH, Patil DJ, Barton D. Big data. The management revolution.
Harvard Bus Rev. 2012 Oct;90(10):61-7.
[4] Manyika J, Chui M, Brown B, Bughin J, Dobbs R, Roxburgh C, Byers AH. Big data: The next frontier
for innovation, competition, and productivity.
[5] Madsen DØ, Stenheim T. Big Data viewed through the lens of management fashion theory. Cogent
Business & Management. 2016 Dec 31;3(1):1165072.
[6] Lohr S. The age of big data. New York Times. 2012 Feb 11;11(2012).
[7] Lim H, Istook CL, Cassill NL. Advanced mass customization in apparel. Journal of Textile and Apparel,
Technology and Management. 2009 Mar 4;6(1).
[8] Grimal L, Guerlain P. Mass customization in apparel industry-implication of consumer as co-creator.
Journal of Economics & Management. 2014 Jan 1;15:105.
[9] Zipkin P. The limits of mass customization. MIT Sloan Management Review. 2001 Apr 1;42(3):81.
[10] De Raeve A, De Smedt M, Bossaer H. Mass customization, business model for the future of fashion
industry. In3rd Global Fashion International Conference 2012 Nov (pp. 1-17).
[11] Sharma R, Singh R. Evolution of recommender systems from ancient times to modern era: A survey.
Indian Journal of Science and Technology. 2016 May 30;9(20).
[12] Park DH, Kim HK, Choi IY, Kim JK. A literature review and classification of recommender systems
research. Expert Systems with Applications. 2012 Sep 1;39(11):10059-72.
[13] Guan C, Guan C, Qin S, Qin S, Ling W, Ling W, Ding G, Ding G. Apparel recommendation system
evolution: an empirical review. International Journal of Clothing Science and Technology. 2016 Nov
7;28(6):854-79.
[14] Ajmani S, Ghosh H, Mallik A, Chaudhury S. An ontology based personalized garment recommendation
system. InProceedings of the 2013 IEEE/WIC/ACM International Joint Conferences on Web
Intelligence (WI) and Intelligent Agent Technologies (IAT)-Volume 03 2013 Nov 17 (pp. 17-20).
IEEE Computer Society.
[15] Kyu Park C, Hoon Lee D, Jin Kang T. Knowledge-base construction of a garment manufacturing expert
system. International Journal of Clothing Science and Technology. 1996 Dec 1;8(5):11-28.
[16] Martínez L, Pérez LG, Barranco MJ, Espinilla M. A knowledge based recommender system based on
consistent preference relations. InIntelligent Decision and Policy Making Support Systems 2008 (pp.
93-111). Springer Berlin Heidelberg.
[17] McAuley J, Targett C, Shi Q, Van Den Hengel A. Image-based recommendations on styles and
substitutes. InProceedings of the 38th International ACM SIGIR Conference on Research and
Development in Information Retrieval 2015 Aug 9 (pp. 43-52). ACM.
[18] Wang LC, Zeng XY, Koehl L, Chen Y. Intelligent fashion recommender system: Fuzzy logic in
personalized garment design. IEEE Transactions on Human-Machine Systems. 2015 Feb;45(1):95-
109.
[19] Kobayashi S. Color image scale. Kodansha Amer Incorporated; 1991.
Analysis of dynamics and fit of diving suits
M Mahnic Naglic
1, S Petrak
1, J Gersak
2 and T Rolich
1 1University of Zagreb, Faculty of Textile Technology, Department of Clothing
Technology, Prilaz baruna Filipovica 28a, Zagreb, Croatia 2University of Maribor, Faculty of Mechanical Engineering, Research and Innovation
Centre for Design and Clothing Science, Smetanova ulica 17, Maribor, Slovenia
Email: [email protected]
Abstract. Paper presents research on dynamical behaviour and fit analysis of
customised diving suits. Diving suits models are developed using the 3D flattening
method, which enables the construction of a garment model directly on the 3D
computer body model and separation of discrete 3D surfaces as well as transformation
into 2D cutting parts. 3D body scanning of male and female test subjects was
performed with the purpose of body measurements analysis in static and dynamic
postures and processed body models were used for construction and simulation of
diving suits prototypes. All necessary parameters, for 3D simulation were applied on
obtained cutting parts, as well as parameters values for mechanical properties of
neoprene material. Developed computer diving suits prototypes were used for stretch
analysis on areas relevant for body dimensional changes according to dynamic
anthropometrics. Garment pressures against the body in static and dynamic conditions
was also analysed. Garments patterns for which the computer prototype verification
was conducted were used for real prototype production. Real prototypes were also
used for stretch and pressure analysis in static and dynamic conditions. Based on the
obtained results, correlation analysis between body changes in dynamic positions and
dynamic stress, determined on computer and real prototypes, was performed.
1. Introduction
Diving suit is garment type for special purposes, for which is necessary to satisfy high criteria of
comfort, fit and functionality. There are three basic diving activities: scuba diving, spearfishing and
free diving and every activity has there one characteristics which condition properties and demands
that are to be satisfied [1-3]. Considering high demands for fit in specific dynamic conditions, we
investigated application of computer 3D pattern construction directly on surface of a 3D body model
and flattening method for separation and transformation of discrete 3D surfaces into 2D cutting parts
[4,5]. When using 3D flattening method it is necessary to take in consideration physical and
mechanical properties of the material for a real garment. It requires comprehensive approaches to
complete computer clothing design and implementation of all necessary properties into the CAD
system for clothing construction and simulation [6-9]. In order to verify the proposed method and
complete development process and prototype in real conditions of use, we selected female test subject,
which is successful and multiple awarded free diver [10] and a male test subject, which is active spear
fisher and a successful diving suits manufacturer [11].
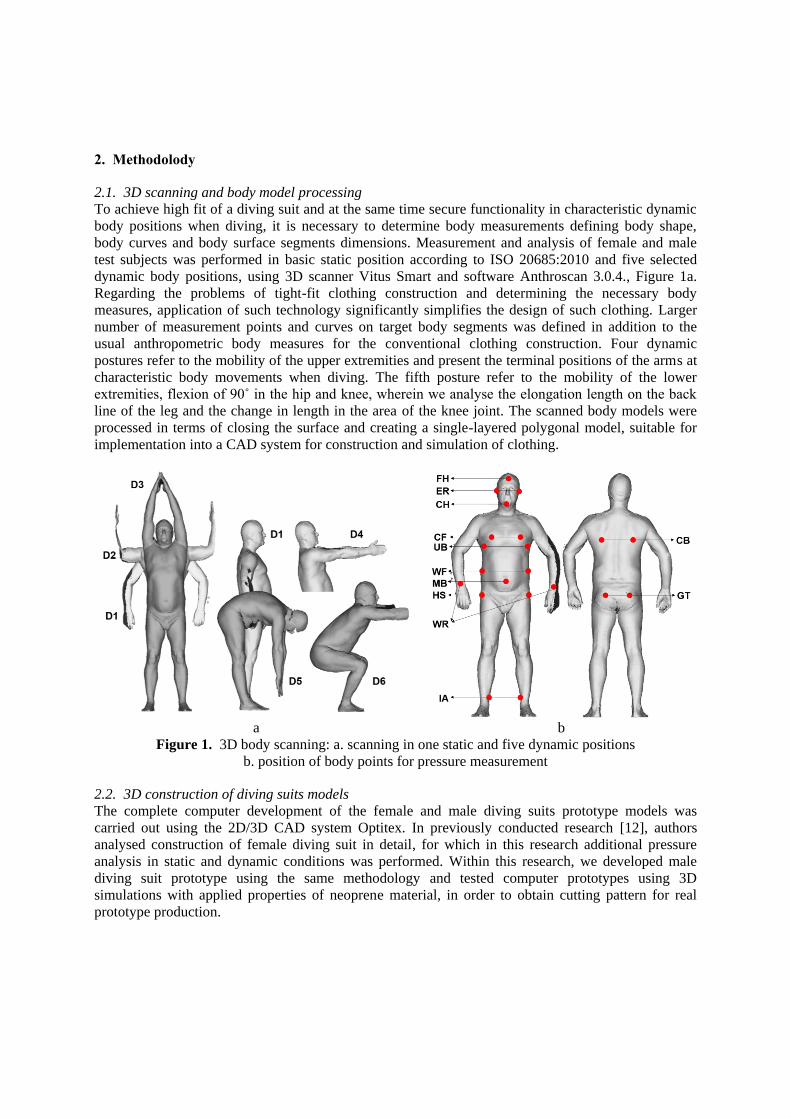
2. Methodolody
2.1. 3D scanning and body model processing
To achieve high fit of a diving suit and at the same time secure functionality in characteristic dynamic
body positions when diving, it is necessary to determine body measurements defining body shape,
body curves and body surface segments dimensions. Measurement and analysis of female and male
test subjects was performed in basic static position according to ISO 20685:2010 and five selected
dynamic body positions, using 3D scanner Vitus Smart and software Anthroscan 3.0.4., Figure 1a.
Regarding the problems of tight-fit clothing construction and determining the necessary body
measures, application of such technology significantly simplifies the design of such clothing. Larger
number of measurement points and curves on target body segments was defined in addition to the
usual anthropometric body measures for the conventional clothing construction. Four dynamic
postures refer to the mobility of the upper extremities and present the terminal positions of the arms at
characteristic body movements when diving. The fifth posture refer to the mobility of the lower
extremities, flexion of 90˚ in the hip and knee, wherein we analyse the elongation length on the back
line of the leg and the change in length in the area of the knee joint. The scanned body models were
processed in terms of closing the surface and creating a single-layered polygonal model, suitable for
implementation into a CAD system for construction and simulation of clothing.
a b
Figure 1. 3D body scanning: a. scanning in one static and five dynamic positions
b. position of body points for pressure measurement
2.2. 3D construction of diving suits models
The complete computer development of the female and male diving suits prototype models was
carried out using the 2D/3D CAD system Optitex. In previously conducted research [12], authors
analysed construction of female diving suit in detail, for which in this research additional pressure
analysis in static and dynamic conditions was performed. Within this research, we developed male
diving suit prototype using the same methodology and tested computer prototypes using 3D
simulations with applied properties of neoprene material, in order to obtain cutting pattern for real
prototype production.
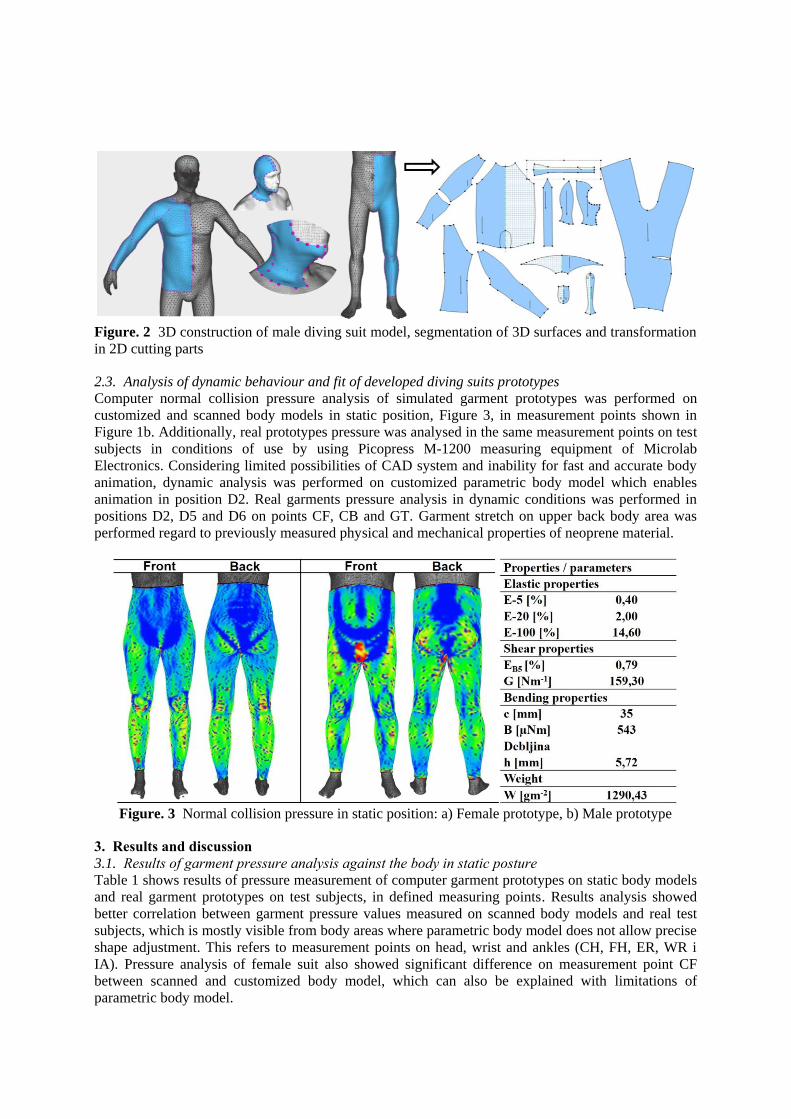
Figure. 2 3D construction of male diving suit model, segmentation of 3D surfaces and transformation
in 2D cutting parts
2.3. Analysis of dynamic behaviour and fit of developed diving suits prototypes
Computer normal collision pressure analysis of simulated garment prototypes was performed on
customized and scanned body models in static position, Figure 3, in measurement points shown in
Figure 1b. Additionally, real prototypes pressure was analysed in the same measurement points on test
subjects in conditions of use by using Picopress M-1200 measuring equipment of Microlab
Electronics. Considering limited possibilities of CAD system and inability for fast and accurate body
animation, dynamic analysis was performed on customized parametric body model which enables
animation in position D2. Real garments pressure analysis in dynamic conditions was performed in
positions D2, D5 and D6 on points CF, CB and GT. Garment stretch on upper back body area was
performed regard to previously measured physical and mechanical properties of neoprene material.
Figure. 3 Normal collision pressure in static position: a) Female prototype, b) Male prototype
3. Results and discussion
3.1. Results of garment pressure analysis against the body in static posture
Table 1 shows results of pressure measurement of computer garment prototypes on static body models
and real garment prototypes on test subjects, in defined measuring points. Results analysis showed
better correlation between garment pressure values measured on scanned body models and real test
subjects, which is mostly visible from body areas where parametric body model does not allow precise
shape adjustment. This refers to measurement points on head, wrist and ankles (CH, FH, ER, WR i
IA). Pressure analysis of female suit also showed significant difference on measurement point CF
between scanned and customized body model, which can also be explained with limitations of
parametric body model.
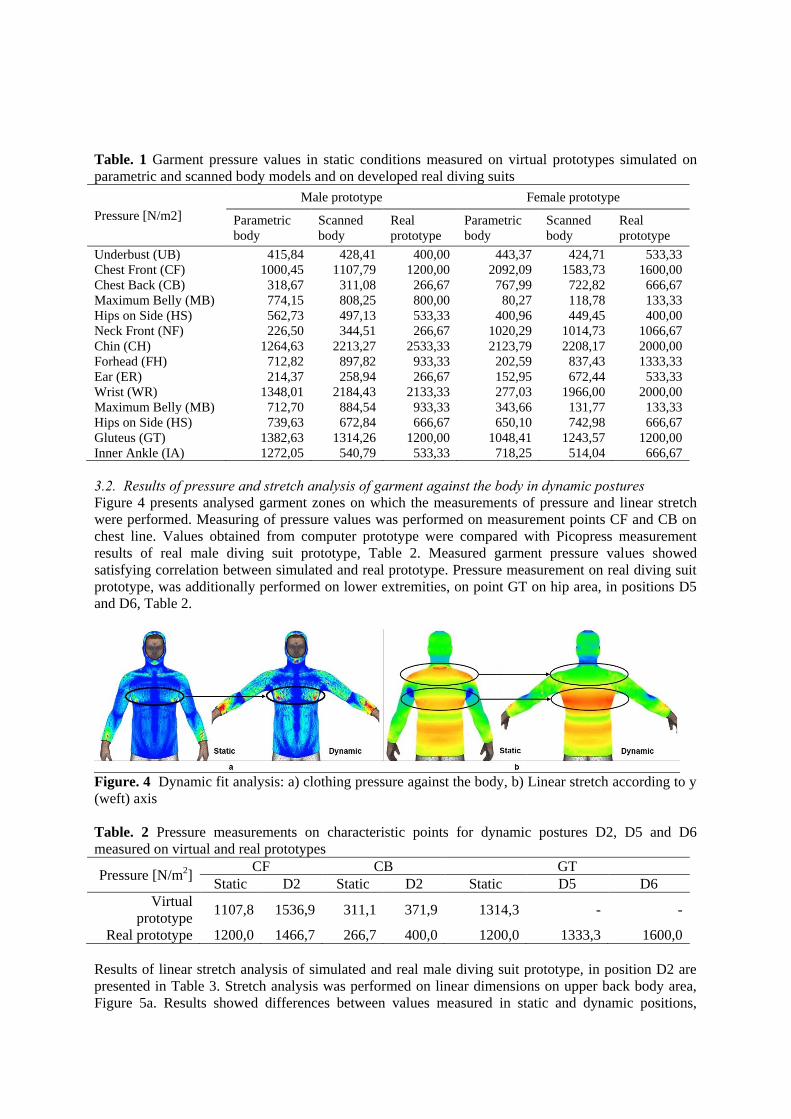
Table. 1 Garment pressure values in static conditions measured on virtual prototypes simulated on
parametric and scanned body models and on developed real diving suits
Pressure [N/m2]
Male prototype Female prototype
Parametric
body
Scanned
body
Real
prototype
Parametric
body
Scanned
body
Real
prototype
Underbust (UB) 415,84 428,41 400,00 443,37 424,71 533,33
Chest Front (CF) 1000,45 1107,79 1200,00 2092,09 1583,73 1600,00
Chest Back (CB) 318,67 311,08 266,67 767,99 722,82 666,67
Maximum Belly (MB) 774,15 808,25 800,00 80,27 118,78 133,33
Hips on Side (HS) 562,73 497,13 533,33 400,96 449,45 400,00
Neck Front (NF) 226,50 344,51 266,67 1020,29 1014,73 1066,67
Chin (CH) 1264,63 2213,27 2533,33 2123,79 2208,17 2000,00
Forhead (FH) 712,82 897,82 933,33 202,59 837,43 1333,33
Ear (ER) 214,37 258,94 266,67 152,95 672,44 533,33
Wrist (WR) 1348,01 2184,43 2133,33 277,03 1966,00 2000,00
Maximum Belly (MB) 712,70 884,54 933,33 343,66 131,77 133,33
Hips on Side (HS) 739,63 672,84 666,67 650,10 742,98 666,67
Gluteus (GT) 1382,63 1314,26 1200,00 1048,41 1243,57 1200,00
Inner Ankle (IA) 1272,05 540,79 533,33 718,25 514,04 666,67
3.2. Results of pressure and stretch analysis of garment against the body in dynamic postures
Figure 4 presents analysed garment zones on which the measurements of pressure and linear stretch
were performed. Measuring of pressure values was performed on measurement points CF and CB on
chest line. Values obtained from computer prototype were compared with Picopress measurement
results of real male diving suit prototype, Table 2. Measured garment pressure values showed
satisfying correlation between simulated and real prototype. Pressure measurement on real diving suit
prototype, was additionally performed on lower extremities, on point GT on hip area, in positions D5
and D6, Table 2.
Figure. 4 Dynamic fit analysis: a) clothing pressure against the body, b) Linear stretch according to y
(weft) axis
Table. 2 Pressure measurements on characteristic points for dynamic postures D2, D5 and D6
measured on virtual and real prototypes
Pressure [N/m2] CF CB GT
Static D2 Static D2 Static D5 D6
Virtual
prototype 1107,8 1536,9 311,1 371,9 1314,3 - -
Real prototype 1200,0 1466,7 266,7 400,0 1200,0 1333,3 1600,0
Results of linear stretch analysis of simulated and real male diving suit prototype, in position D2 are
presented in Table 3. Stretch analysis was performed on linear dimensions on upper back body area,
Figure 5a. Results showed differences between values measured in static and dynamic positions,
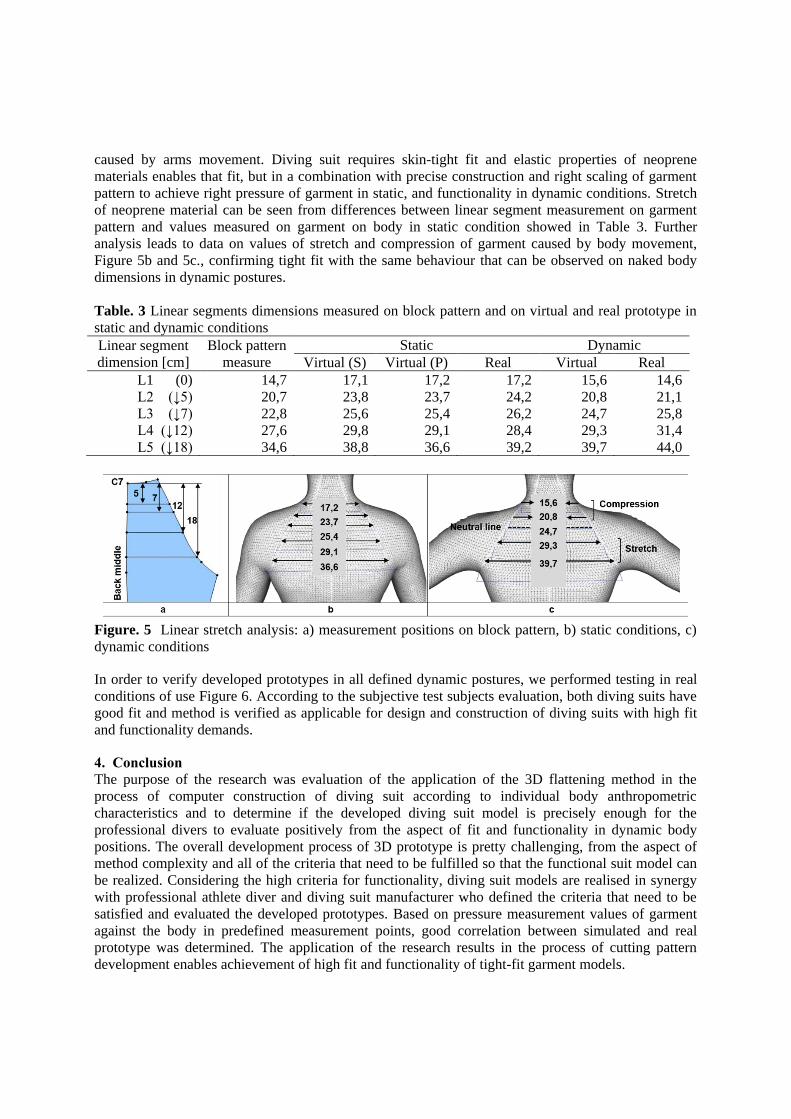
caused by arms movement. Diving suit requires skin-tight fit and elastic properties of neoprene
materials enables that fit, but in a combination with precise construction and right scaling of garment
pattern to achieve right pressure of garment in static, and functionality in dynamic conditions. Stretch
of neoprene material can be seen from differences between linear segment measurement on garment
pattern and values measured on garment on body in static condition showed in Table 3. Further
analysis leads to data on values of stretch and compression of garment caused by body movement,
Figure 5b and 5c., confirming tight fit with the same behaviour that can be observed on naked body
dimensions in dynamic postures.
Table. 3 Linear segments dimensions measured on block pattern and on virtual and real prototype in
static and dynamic conditions
Linear segment
dimension [cm]
Block pattern
measure
Static Dynamic
Virtual (S) Virtual (P) Real Virtual Real
L1 (0) 14,7 17,1 17,2 17,2 15,6 14,6
L2 (↓5) 20,7 23,8 23,7 24,2 20,8 21,1
L3 (↓7) 22,8 25,6 25,4 26,2 24,7 25,8
L4 (↓12) 27,6 29,8 29,1 28,4 29,3 31,4
L5 (↓18) 34,6 38,8 36,6 39,2 39,7 44,0
Figure. 5 Linear stretch analysis: a) measurement positions on block pattern, b) static conditions, c)
dynamic conditions
In order to verify developed prototypes in all defined dynamic postures, we performed testing in real
conditions of use Figure 6. According to the subjective test subjects evaluation, both diving suits have
good fit and method is verified as applicable for design and construction of diving suits with high fit
and functionality demands.
4. Conclusion
The purpose of the research was evaluation of the application of the 3D flattening method in the
process of computer construction of diving suit according to individual body anthropometric
characteristics and to determine if the developed diving suit model is precisely enough for the
professional divers to evaluate positively from the aspect of fit and functionality in dynamic body
positions. The overall development process of 3D prototype is pretty challenging, from the aspect of
method complexity and all of the criteria that need to be fulfilled so that the functional suit model can
be realized. Considering the high criteria for functionality, diving suit models are realised in synergy
with professional athlete diver and diving suit manufacturer who defined the criteria that need to be
satisfied and evaluated the developed prototypes. Based on pressure measurement values of garment
against the body in predefined measurement points, good correlation between simulated and real
prototype was determined. The application of the research results in the process of cutting pattern
development enables achievement of high fit and functionality of tight-fit garment models.
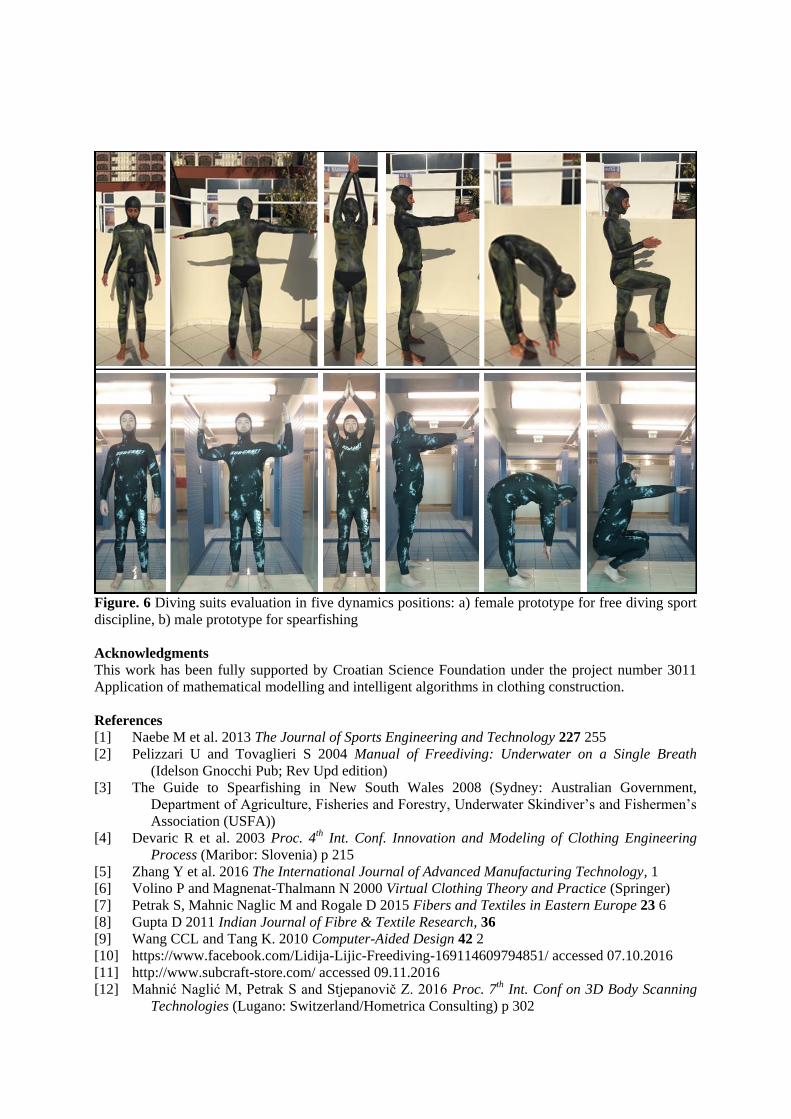
Figure. 6 Diving suits evaluation in five dynamics positions: a) female prototype for free diving sport
discipline, b) male prototype for spearfishing
Acknowledgments
This work has been fully supported by Croatian Science Foundation under the project number 3011
Application of mathematical modelling and intelligent algorithms in clothing construction.
References
[1] Naebe M et al. 2013 The Journal of Sports Engineering and Technology 227 255
[2] Pelizzari U and Tovaglieri S 2004 Manual of Freediving: Underwater on a Single Breath
(Idelson Gnocchi Pub; Rev Upd edition)
[3] The Guide to Spearfishing in New South Wales 2008 (Sydney: Australian Government,
Department of Agriculture, Fisheries and Forestry, Underwater Skindiver’s and Fishermen’s
Association (USFA))
[4] Devaric R et al. 2003 Proc. 4th Int. Conf. Innovation and Modeling of Clothing Engineering
Process (Maribor: Slovenia) p 215
[5] Zhang Y et al. 2016 The International Journal of Advanced Manufacturing Technology, 1
[6] Volino P and Magnenat-Thalmann N 2000 Virtual Clothing Theory and Practice (Springer)
[7] Petrak S, Mahnic Naglic M and Rogale D 2015 Fibers and Textiles in Eastern Europe 23 6
[8] Gupta D 2011 Indian Journal of Fibre & Textile Research, 36
[9] Wang CCL and Tang K. 2010 Computer-Aided Design 42 2
[10] https://www.facebook.com/Lidija-Lijic-Freediving-169114609794851/ accessed 07.10.2016
[11] http://www.subcraft-store.com/ accessed 09.11.2016
[12] Mahnić Naglić M, Petrak S and Stjepanovič Z. 2016 Proc. 7th Int. Conf on 3D Body Scanning
Technologies (Lugano: Switzerland/Hometrica Consulting) p 302


![2017-2018 catalog.pub - Publisher - Crossroad Bible Institute · )dfxow\ &urvv5rdgv %leoh ,qvwlwxwh xwlol]hv wkh sdvwrudo vwdii ri &urvv5rdgv 0lqlvwulhv dqg rwkhu fdsdeoh ohdghuv](https://img.pdfslide.us/doc/110x75/5f8bbd3175e48a5ed30242eb/2017-2018-publisher-crossroad-bible-institute-dfxow-urvv5rdgv-leoh-qvwlwxwh.jpg)