Embed Size (px)
Citation preview
EVALUATION OF THE TAB-SIMCO ACID MINE DRAINAGE TREATMENT SYSTEM: WATER CHEMISTRY, PERFORMANCE AND TREATMENT
PROCESSES
by
YOSIEF TEKLEHAIMANOT SEGID
B.S., University of Asmara, Eritrea, 2001
A Thesis Submitted in Partial Fulfillment of the Requirements for the
Masters of Science Degree
Department of Geology in the Graduate School Southern Illinois University Carbondale
May, 2010
THESIS APPROVAL
EVALUATION OF THE TAB-SIMCO ACID MINE DRAINAGE TREATMENT SYSTEM: WATER CHEMISTRY, PERFORMANCE AND TREATMENT
PROCESSES
By
YOSIEF TEKLEHAIMANOT SEGID
A Thesis Submitted in Partial
Fulfillment of the Requirements
for the Degree of
Masters of Science
in the field of Geology
Approved by:
Dr. Liliana Lefticariu, Chair
Dr. Steven Esling
Dr. Scott Ishman
Graduate School Southern Illinois University Carbondale
March 31st, 2010
i
AN ABSTRACT OF THE THESIS OF
YOSIEF TEKLEHAIMANOT SEGID, for the Masters of Science degree in GEOLOGY, presented on 3/31/2010, at Southern Illinois University Carbondale. TITLE: EVALUATION OF THE TAB-SIMCO ACID MINE DRAINAGE TREATMENT SYSTEM: WATER CHEMISTRY, PERFORMANCE AND TREATMENT PROCESSES MAJOR PROFESSOR: Dr. Liliana Lefticariu Evaluating the performance of an acid mine drainage treatment system,
and the biogeochemical processes that occur within it, can be vital for improving
the performance and longevity of the treatment system, and in designing new
effective long-term treatment systems. In this study, the performance of the Tab-
Simco treatment system and the biogeochemical processes that occur within it,
were investigated by analyzing water samples from the site. The Tab-Simco
treatment system comprises an anaerobic sulfate-reducing bioreactor and an
oxidation pond. Results indicated that the treatment system increased the pH of
the acid mine drainage (AMD) from 2.8 to 6.3 and decreased the mean acidity
from 3,386 to 74 mg/l, SO42- from 4,589 to 2,021 mg/l, Fe from 884 to 3.5 mg/l, Al
from 207 to 2 mg/l and Mn from 34.5 to 26.4 mg/l. The average δ34S value of the
SO42- in the untreated AMD was 7.3 ‰. This value was similar to the δ34S values
of the pyrite in the coal seams, indicating that the oxidation of the pyrites was the
cause of the AMD. In the bioreactor, δ34S value of dissolved SO42- increased
from an average of 6.9 to 9.2 ‰, confirming the presence of bacterial sulfate
reduction processes. Alkalinity production calculations for the bioreactor revealed
that roughly about 60% of the alkalinity was produced by bacterial sulfate
reduction whereas, the remaining 40% was produced by limestone dissolution.

ii
ACKNOWLEDGMENTS
First of all, I would like to thank my advisor, Dr. Liliana Lefticariu, for her
continuous assistance and advice during my thesis work. Dr. Lefticariu provided
me with the materials I needed for analyses, guided me during sample analyses,
assisted with the editing process, and was always available to answer my
questions. I will always be indebted to her for her support and advice.
Secondly, I would like to give my deepest appreciation to Mr. Paul Behum
from the Office of Surface Mining Reclamation and Enforcement (OSMRE) and
his office, for the unreserved cooperation they extended to me during the period
of my thesis study. OSMRE allowed me to use their instruments to measure field
parameters and were cooperative in analyzing my samples for certain
parameters. Mr. Behum taught me how to take field measurements and was very
helpful in finding information regarding the treatment system. Without his
guidance and support, this thesis would not have reached this stage.
In addition, I thank the Illinois Department of Natural Resources, Land
Reclamation Division, and the landowners, for allowing me access to the site in
order to evaluate their state-of-the art AMD treatment system.
I am also grateful to Dr. Steven Esling (department head) and Dr. Scott
Ishman (graduate coordinator) for serving as my committee members, proof
reading and commenting on my thesis, and for their advice.
Finally, I would like to use this opportunity to thank the Department of
Geology at Southern Illinois University Carbondale, along with all its faculty and
staff members, for allowing me to pursue my master’s degree and providing me
with an excellent education.

iii
TABLE OF CONTENTS
PAGE
ABSTRACT ....................................................................................................... i
ACKNOWLEDGMENTS ................................................................................... ii
LIST OF TABLES ............................................................................................ vi
LIST OF FIGURES .......................................................................................... vii
1. Introduction ................................................................................................. 1
2. Objectives ................................................................................................... 3
3. Background ................................................................................................. 4
3.1 Formation of Acid Mine Drainage (AMD) ............................................... 4
3.2 Acid Mine Drainage Treatment Methods ............................................... 5
3.3 Anaerobic Sulfate-reducing Bioreactors ................................................ 7
4. The Study Area ......................................................................................... 10
4.1 General Description ............................................................................ 10
4.2 Geology and Mining History of the Study Area .................................... 13
4.3 AMD Development and Its Environmental Impact at Tab-Simco Site . 15
4.4 Reclamation Efforts ............................................................................. 16
4.5 The Tab-Simco Anaerobic Sulfate-reducing Bioreactor ...................... 18
5. Methods and Materials .............................................................................. 20
5.1 Water Sampling ................................................................................... 20
5.2 Field Measurements ............................................................................ 24
5.3 Laboratory Analyses ........................................................................... 24
5.4 Mass Balance Calculations ................................................................. 26
iv
6. Results....................................................................................................... 28
6.1 Field Parameters ................................................................................. 28
6.2 Acidity and Alkalinity Values ................................................................ 31
6.3 Sulfate Concentration .......................................................................... 32
6.4 Metal Concentrations .......................................................................... 35
6.5 Sulfur Isotope Results ......................................................................... 39
7. Discussion .................................................................................................. 41
7.1 Acid Mine Drainage Water Chemistry ................................................. 41
7.2 The Bioreactor and Overall System Performance and
Treatment Processes ........................................................................... 43
7.2.1 Field parameters ....................................................................... 44
7.2.2 Acidity removal .......................................................................... 45
7.2.3 Sulfate removal ......................................................................... 46
7.2.4 Metal removals .......................................................................... 48
7.3 Seasonal Variations in the AMD Chemistry and the
Bioreactor Performance ....................................................................... 56
7.4 Alkalinity Production in the Tab-Simco Bioreactor .............................. 63
7.5 Limestone Dissolution and Bioreactor Longevity ................................ 65
7.6 Source(s) of the Sulfide Minerals that Cause the Tab-Simco AMD .... 65
8. Conclusions and Recommendations .......................................................... 67
8.1 Conclusions ........................................................................................ 67
8.2 Recommendations ............................................................................. 69
REFERENCES ............................................................................................... 71

v
APPENDICES
Appendix A - Permission for Figure Reprinting ......................................... 81
VITA ............................................................................................................. 82
vi
LIST OF TABLES
TABLE PAGE
Table 1- Field measurement results from the Tab-Simco AMD ...................... 29
Table 2- The Tab-Simco AMD flow rate measurements ................................. 31
Table 3- Acidity and alkalinity values in the Tab-Simco AMD ......................... 33
Table 4- Dissolved sulfate and metal concentrations in
the Tab-Simco AMD ........................................................................ 36
Table 5- Sulfur isotope values of the dissolved SO42- in
the Tab-Simco AMD ........................................................................ 40
Table 6a- The performance of the Tab-Simco treatment system
in removing acidity, SO42- and metals ............................................. 55
Table 6b- Calcium and potassium concentration increase at the
Tab-Simco treatment system .......................................................... 56
Table 7- Alkalinity production rates at the Tab-Simco bioreactor.................... 64

vii
LIST OF FIGURES
FIGURE PAGE
Figure 1- A section view of an anaerobic sulfate-reducing bioreactor .............. 8
Figure 2- Location map of the study area ....................................................... 11
Figure 3- Map of the Tab-Simco site and the location of sampling stations .... 12
Figure 4- Typical stratigraphic column of the Tab-Simco site geologic units .. 13
Figure 5- North-south cross-section through the Tab-Simco mining work ...... 15
Figure 6- Photos of the Tab-Simco treatment system and the
sampling stations ........................................................................... 21
Figure 7- Field measurement values along the flow direction at
the Tab-Simco site .......................................................................... 30
Figure 8- Sulfate, acidity and alkalinity values along the flow direction
at the Tab-Simco site ...................................................................... 34
Figure 9- Metal concentrations along the flow direction at
the Tab-Simco site .......................................................................... 38
Figure 10- Trend of δ34S value of dissolved SO42- in the Tab-Simco AMD ..... 40
Figure 11- Field and laboratory measurement results through time
in the Tab-Simco AMD at, the bioreactor inlet, bioreactor
outlet, and the system outlet sampling stations. ............................ 58
1
1. INTRODUCTION Acid mine drainage (AMD) is contaminated water characterized by low pH
and high concentrations of dissolved metals and sulfate (SO42-) (Blowes et al.,
2003; Tsukamoto et al., 2004; Neculita et al 2008a). AMD is a serious and
widespread environmental hazard that occurs primarily at coal and metal mining
sites as a result of the oxidation of sulfide minerals such as pyrite and pyrrhotite.
Because of its high acidity and high concentrations of dissolved metals and SO42,
AMD can cause various environmental problems including contamination of the
surface and groundwater drinking supplies, disruption of the growth and
reproduction of aquatic plants and animals, acid corrosion of the infrastructure
such as wastewater pipes, and degradation of outdoor recreation and tourism
sites (US Environmental Protection Agency website:
http://www.epa.gov/reg3wapd/nps/mining/mines.htm#acid). The precipitation of
ferric (oxy)hydroxide minerals, commonly known as “yellow-boy” at AMD sites
can destroy vegetation by covering the soil layer and clogging the substrate
interstices (Gray, 1998).
In the USA, AMD contamination has been reported in Pennsylvania, West
Virginia, Ohio, Kentucky, Maryland, Indiana, Illinois, Oklahoma, Iowa, Missouri,
Kansas, Tennessee, Virginia, Alabama, and Georgia (Appalachian Regional
Commission, 1973). According to the US Environmental Protection Agency
(1995), about 20,000 km of streams and rivers in the eastern United States are
degraded by AMD.
2
Currently, different treatment methods are used to remediate AMD. When
designed properly, anaerobic sulfate-reducing bioreactors have proved their
effectiveness in treating AMD with low pH and high concentration of metals and
SO42-. However, studies have shown that the performance and longevity of an
anaerobic sulfate-reducing bioreactor can be affected by different factors such as
changes in amount of organic matter, hydraulic retention time, quality and flow
rate of the AMD, and hydraulic properties of bioreactor due to pore clogging by
the precipitated materials (Neculita et al. 2008a). The treatment efficiency of an
anaerobic sulfate-reducing bioreactor might also vary seasonally due to
variations in air temperature that can affect the biological activities of the
bioreactor (Neculita et al., 2007).
Evaluating an acid mine drainage treatment system can be very important
in understanding the performance of the system in removing acidity, dissolved
metals and SO42- from the AMD, the conditions inside the treatment system and
the treatment processes that occur within the treatment system. Moreover, the
evaluation can be helpful in understanding the short-and long-term temporal
variations in the performance of the system. Understanding the bioreactor
performance and treatment processes, in turn, can be critical in improving the
performance and longevity of the system. Furthermore, this information is crucial
in designing new effective long-term treatment systems using minimal resources.
Consequently, evaluation of acid mine drainage treatment systems is currently
an active research topic in AMD treatment.
3
In this study, the Tab-Simco AMD treatment system was evaluated to
understand the performance of the treatment system in treating the AMD and the
chemical and biological treatment processes that take place in the treatment
system.
2. OBJECTIVES OF THIS STUDY
The main objectives of this study are:
1. To evaluate the performance of the Tab-Simco treatment system in
removing acidity, dissolved metals and SO42- from the AMD.
2. To understand both the chemical and biological processes which occur at
the Tab-Simco AMD treatment system.
3. To study the chemical characteristics of the Tab-Simco AMD along the
flow direction.
4. To study seasonal variations in the chemistry of the untreated AMD and
the performance of the Tab-Simco sulfate-reducing anaerobic bioreactor.
5. To determine the amount of alkalinity production by limestone dissolution
and bacterial sulfate reduction (BSR) in the Tab-Simco sulfate-reducing
anaerobic bioreactor.
6. To investigate the source(s) of the sulfide minerals that cause the AMD at
the site.
7. Finally, based on the results found, recommendations are presented to
improve the performance of the Tab-Simco and similar anaerobic sulfate-
reducing bioreactors.
4
3. BACKGROUND
3.1 Formation of AMD
AMD is mainly generated when sulfide minerals such as pyrite (FeS2)
oxidize due to exposure to water (H2O) and oxygen (O2) (Kalin et al., 2005;
Ziemkiewicz, 2003). In natural systems, the oxidation of sulfide minerals occurs
through combinations of abiotic and biotic processes, which result in waters with
low pH level and high concentrations of dissolved metals and SO42-. The
oxidation process involves several reaction steps (Rimstidt and Vaughan, 2003)
and begins with oxidation of sulfide minerals by O2 as shown below (Nordstrom,
1982; Garrels et al., 1960; Kalin et al., 2005; Neculita et al., 2007).
2FeS2 (s) + 7O2 + 2H2O � 2Fe2+ + 4SO42- + 4H+ (3.1)
This process oxidizes the sulfide minerals such as pyrite and releases ferrous
iron (Fe2+), SO42- and hydrogen ion (H+). Next, the Fe2+ may be oxidized to ferric
iron (Fe3+).
4Fe2+ + O2 + 4H+ � 4Fe3+ + 2H2O (3.2)
At low pH level, without bacterial involvement, the rate of reaction 3.2 is
slow. However, in a natural environment, iron oxidizing bacteria such as
Acidithiobacillus Ferrooxidans (syn-thiobacillus ferrooxidans) can accelerate the
rate of the reaction by factors greater than 106 (Singer et al., 1970; Zagury et al.,
1997; Brown et al., 2002). At pH level above about 3.0-3.5, Fe3+ is unstable and
reacts with H2O to form ferric (oxy)hydroxides (Perez-Lopez et al., 2007b; Hedin
et al., 1994), which precipitate as red to yellow colored compounds commonly
5
referred to as “yellow-boy.” During the reaction (Reaction 3.3), three moles of H+
are released in solution for every mole of Fe3+.
Fe3+ + 3H2O � Fe(OH)3 + 3H+ (3.3)
At pH level less than 3.0-3.5, Fe3+ remains in solution and can oxidize
FeS2 according to the following reaction (Stumm and Morgan, 1996; Rimstidt and
Vaughan, 2003; Hedin et al., 1994; Kalin et al., 2005):
FeS2 (s) + 14Fe3+ + 8H2O � 15Fe2+ + 2SO42- + 16H+ (3.4)
During the reaction (Reaction 3.4), for every mole of FeS2, sixteen moles
of H+ are released into the solution. The rate of FeS2 oxidation by Fe3+ (Reaction
3.4) is much higher than the rate of pyrite oxidation by O2 (Reaction 3.1)
(Neculita et al., 2007).
The overall FeS2 oxidation reaction under aerobic conditions is given by
the following reaction (Bonnissel-Gissinger et al., 1998):
FeS2(s) + 15/4O2 + 7/2H2O � Fe(OH)3(s) + 2SO42- + 4H+ (3.5)
Factors that control AMD generation include types of sulfide minerals,
mineral surface area, environmental conditions (example, pH level, temperature
and dissolved O2 concentration), and bacterial activity (Berghorn et al., 2001).
3.2 AMD Treatment Methods
In order to restore AMD contaminated sites and avoid further
environmental damage, the contaminated waters must be properly handled and
treated. Currently, there are several commonly applied treatment methods to
remediate AMD sites. The methods are categorized as active or passive
treatment methods (Skousen et al., 2005; Ziemkiewicz et al., 2003).
6
Active treatment methods involve addition of manufactured chemicals to
AMD to treat the contaminated water. The chemicals commonly used in active
treatment include hydrated lime, Ca(OH)2, caustic soda, NaOH, ammonia, NH3,
pebble quicklime, CaO, and soda ash, Na2CO3 (Skousen et al., 2005;
Ziemkiewicz et al., 2003). Active treatment methods can be reliable and effective
but they need continuous monitoring and maintenance, which makes them more
expensive than passive methods (Ziemkiewicz et al., 2003). Another drawback of
active treatment methods is handling the huge volume of sludge from
precipitation, which needs high disposal cost to prevent possible environmental
impact (Ziemkiewicz et al., 2003).
Passive treatment methods use naturally occurring materials such as
limestone and organic matter to neutralize the acid and remove the metals and
SO42-. They are less expensive and do not require continuous follow up like
active treatment methods (Hedin et al., 1994). However, passive treatment
techniques may require longer retention time and larger treatment areas. There
are different types of passive treatment methods including: (1) aerobic and
anaerobic wetlands, (2) sulfate-reducing bioreactors, (3) anoxic limestone drains
(ALD), (4) open limestone channels, (5) settling ponds, and (6) vertical flow
systems (also known as successive alkalinity producing systems (SAPS))
(Ziemkiewicz et al., 2003; Skousen et al., 2005).
Selecting and designing an efficient treatment method for a specific AMD
site depends on chemistry and flow rate of the contaminated water, site
characterization, environmental goal, and available technologies (Hedin et al.,
7
1994; US EPA, 2005; Doshi, 2006). For example, ALD is effective in treating
AMD waters with low pH and low concentrations of Fe3+ and Al3+, whereas
anaerobic sulfate-reducing bioreactor and vertical flow systems have proven their
efficiency in treating AMD waters with higher metal concentrations.
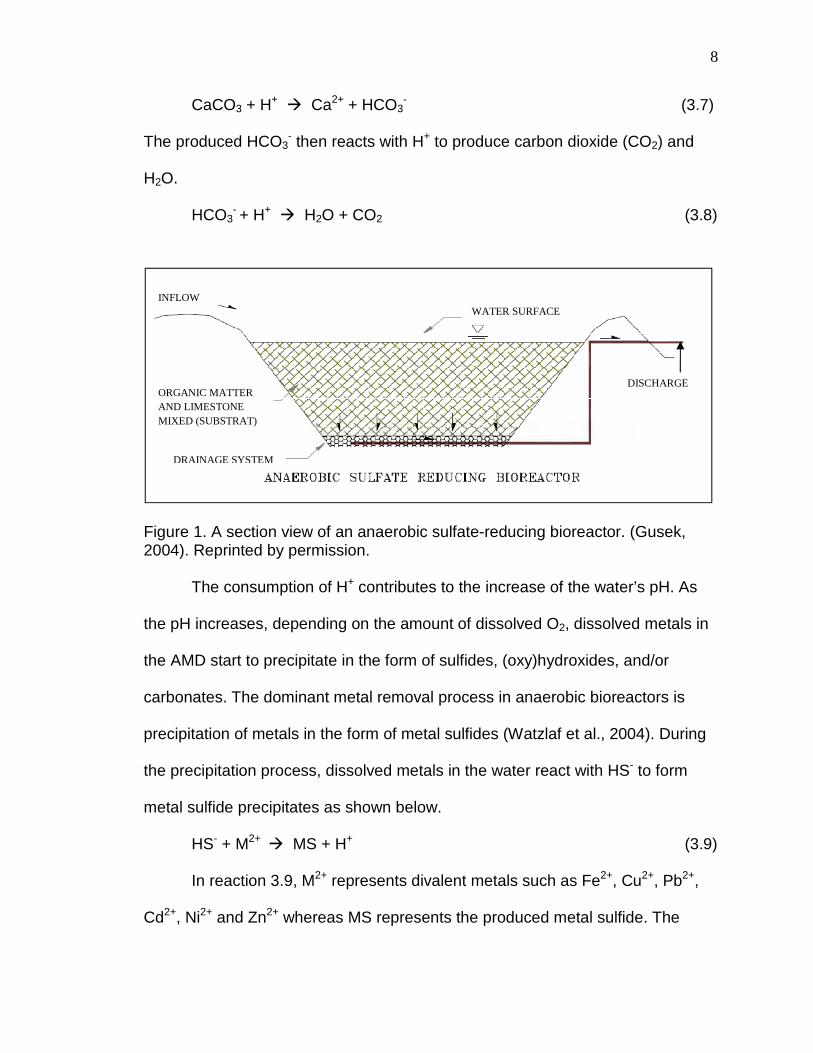
3.3 Anaerobic Sulfate-reducing Bioreactors
Anaerobic sulfate-reducing bioreactor is a type of passive treatment
method that uses mainly sulfate reducing bacteria (SRB) to treat AMD. Sulfate-
reducing bioreactors have advantages over active treatment methods because
they can remove metals from low pH AMD with lower costs and minimal energy
consumption and generate more stable sludge (Zaluski et al., 2003). An
anaerobic sulfate-reducing bioreactor consists of a thick layer of selected organic
matter mixed with limestone and often, a thin layer of limestone is set below the
organic matter layer to produce additional alkalinity and provide bedding for a
network of under draining pipes (Fig.1). The AMD flows vertically through the
organic matter and limestone layers and is discharged through the pipelines.
In the organic matter layer, sulfate-reducing bacteria reduce the SO42- in
the contaminated water to hydrogen sulfide (H2S) and oxidize the organic matter
(CH2O) to bicarbonate ions (HCO3-) as shown in the reaction below (Reaction
3.6) (Hedin et al., 1994; Watzlaf et al., 2004).
SO42- + 2CH2O � H2S + 2HCO3
- (3.6)
The interaction of the AMD with the limestone within the bioreactor results
in limestone dissolution according to reaction 3.7 and to produce additional
HCO3- and calcium (Ca2+) ions.
8
CaCO3 + H+ � Ca2+ + HCO3- (3.7)
The produced HCO3- then reacts with H+ to produce carbon dioxide (CO2) and
H2O.
HCO3- + H+ � H2O + CO2 (3.8)
Figure 1. A section view of an anaerobic sulfate-reducing bioreactor. (Gusek, 2004). Reprinted by permission.
The consumption of H+ contributes to the increase of the water’s pH. As
the pH increases, depending on the amount of dissolved O2, dissolved metals in
the AMD start to precipitate in the form of sulfides, (oxy)hydroxides, and/or
carbonates. The dominant metal removal process in anaerobic bioreactors is
precipitation of metals in the form of metal sulfides (Watzlaf et al., 2004). During
the precipitation process, dissolved metals in the water react with HS- to form
metal sulfide precipitates as shown below.
HS- + M2+ � MS + H+ (3.9)
In reaction 3.9, M2+ represents divalent metals such as Fe2+, Cu2+, Pb2+,
Cd2+, Ni2+ and Zn2+ whereas MS represents the produced metal sulfide. The
INFLOW
ORGANIC MATTER AND LIMESTONE MIXED (SUBSTRAT)
DRAINAGE SYSTEM
WATER SURFACE
DISCHARGE
9
precipitation of dissolved metals in the form of metal sulfides depends on pH,
solubility product of the specific metal sulfide, and the concentrations of the
reactants (Hedin et al., 1994).
Metals might also precipitate in the form of (oxy)hydroxides and
carbonates through oxidation and hydrolysis reactions as shown in reaction 3.3
and in the examples below (Watzlaf et al., 2004):
Al3+ + 3H2O � Al(OH)3 + 3H+ (3.10)
Fe2+ + 0.25O2 + 1.5H2O � FeOOH + 2H+ (3.11)
Mn2+ + 0.25O2 + 1.5H2O � MnOOH + 2H+ (3.12)
Mn2+ + HCO3- � MnCO3 + H+ (3.13)
Fe2+ + HCO3- � FeCO3 + H+ (3.14)
During the processes described above, acidity, dissolved metals and
SO42- concentrations decrease improving the quality of the AMD water to an
environmentally acceptable level.
10
4. THE STUDY AREA
4.1 General Description
The Tab-Simco is an abandoned coal mining site, located about 6 km
southeast of Carbondale, Illinois, USA, (Fig. 2). The site is a “U” shaped upland
about 37 meters above the surrounding lowland, and consists of approximately
12 hectares (30 acres) of underground mine works in two coal seams (Smith,
2002) (Fig. 3). The coal mining activities in the area exposed sulfide minerals to
oxygenated rainwater, which caused oxidation and the production of low pH
water with high SO42- and metal content. The low pH water severely impacted the
biological resources in the discharge area by destroying vegetation and nearly
eliminating aquatic life around the site. In 1996, the Tab-Simco site was reported
as one of the highly contaminated AMD sites in the mid-continent region (Smith,
2002). Starting in 1996, considerable reclamation works took place to restore the
site and finally, in 2007, an anaerobic sulfate-reducing bioreactor was
constructed at the site by the Illinois Department of Natural Resources Land
Reclamation Division (IDNR-LRD) with the assistance of the Office of Surface
Mining Reclamation and Enforcement Mid-Continent Region (OSMRE-MCR) to
treat the AMD. The Abandoned Mine Land (AML) fund administered by OSMRE
funded this reclamation activity.

11
Figure 2. Location map of the study area (the Tab-Simco site), Map downloaded from USGS website http://www.usgs.gov/, Carbondale, IL, 7.5 minute quadrangle
The Study Area
The City of Carbondale
N

12
Figure 3. Map of the Tab-Simco site and the location of sampling stations.
13
4.2 Geology and Mining History of the Study Area
The Tab-Simco site is located within the Mt Vernon Hill Country sub-
section of the Till Plains Section in the Central Lowlands Physiographic Province.
The geology of site is characterized by the presence of a thin layer of superficial
deposits of soils and loess underlain by Pennsylvanian rocks that dip gently to
the north-northeast (Patrick Engineering, 1998). According to a comprehensive
site investigation report by IDNR-LRD contractor Patrick Engineering in 1998, the
Pennsylvanian rocks that underlie the area are part of the Spoon Formation.
Spoon Formation rocks include alternating sandstone, shale, siltstone and
Figure 4. Typical stratigraphic column of the Tab-Simco site geologic units
14
claystone with occasional inter-layers of coal and limestone beds. The
Pennsylvanian rocks in the study area, from top to bottom, are (1) a fine to
medium grained, well jointed, pyritic channel sandstone up to 10 meters thick, (2)
the discontinuous Mount Rorah Coal, which has thickness that ranges from 0.34
to 1.2 meters, (3) about 3 to 9 meters of a shale layer (4) the Murphysboro Coal
that has thickness ranging from 1.8 to 2.4 meters (Patrick Engineering, 1998)
and (5) a shale layer underlaying the Murphysboro coal. Figure 4 shows a typical
stratigraphic column of the geologic units at the Tab-Simco site.
Underground and surface coal mining activities were performed in the
area to mine the two coal seams, the Murphysboro (the lower seam) and the
Mount Rorah. Underground coal mining occurred between 1890 and 1955
(Smith, 2002). An estimated 18 hectares (45 acres) were mined during this
period (Lewis, 2008), although the full extent of this mining has not been
identified. Strip mining of both coal seams along the south, east and north fringes
of the mining site began in 1960 and ceased in 1975 (Lewis, 2008). It removed
about 6 hectares (15 acres) of the older underground works, and has left large
masses of spoil and numerous “break throughs” into the older underground mine
works (Smith, 2002). In addition to this, the strip mining left about 1524 meters
long steep, potentially hazardous, high-walls along the sides of the mining site
(Lewis, 2008). Figure 5 shows a north-south cross-section through the mining
site.
15
Figure 5. North-south cross-section through the mining work. (Smith, 2002)
4.3 AMD Development and Its Environmental Impact at the Tab-Simco Site
The coal mining activities in the study area exposed sulfide minerals in the
rocks to oxygenated water. The exposure of sulfide minerals to H2O and O2
initiated oxidation of the sulfide minerals leading to the development of low pH
acid water in the spoil and the underground mine works. Subsequently, acid mine
pools were formed within the underground mine works (Smith, 2002). AMD from
these pools flow from south to north following the dip of the underground mine
works and discharges through a series of seeps located primarily in the northern
part of the site (Smith, 2002). The acid water discharge, then, flows along a small
tributary that runs north before discharging into the receiving stream, Sycamore
Creek.
16
Recharge replenished the acid mine pool by infiltration through the jointed
sandstone that overlies the upper coal seam and from run-off through “break ins”,
and abandoned shafts and boreholes from the mine works. Consequently, the
water level of the mine pool and volume of acid water discharge to the ground
surface vary with the amount of precipitation water that reaches the acid mine
pool. Prior to reclamation, the acid pool within the underground works discharged
about 132,489 liters per day (35,000 gallons per day) of AMD with pH ranging
from 2.6-3.0 (Lewis, 2008).
In the years between the cessation of mining activities (1975) and the
construction of the anaerobic sulfate-reducing bioreactor at site (2007), the AMD
caused severe environmental destruction on about 4 hectares of forest area,
known as the “kill-zone” (Smith, 2002). The low-pH waters destroyed the
vegetation and its ecological systems completely. It also severely degraded the
Sycamore Creek for over 3.2 km (2 miles) downstream of the AMD site,
destroying its aquatic life (Lewis, 2008).
4.4 Reclamation Efforts
Considerable efforts have been taking place at the site to minimize the
adverse environmental impact from AMD and restore the site. These efforts
comprise of a series of site investigations and reclamation works aimed at
minimizing the amount of AMD, treating it and restoring the site.
Between 1996 and 1998, Patrick Engineering, Inc. (PEI) conducted a
detailed site investigation that included drilling core, installing monitoring wells,
sampling soil and water, and measuring hydrologic parameters. This study was

17
done in three phases and provided the basis for the understanding of the
underground mine work system, geology, hydrology and flow system, the
geochemical characteristics of the AMD and other important aspects of the site
(Patrick Engineering, 1998). In 1996 and1997, IDNR-LRP, the state’s AML
program, took steps to seal the mine opening to minimize water entering the
underground mine works and back filled about 427 meters of the dangerous
high-wall left from the strip mining (Lewis, 2008).
Investigation for site restoration design at the site started in 2003 by a
technical team from the Illinois state AML program, OSMRE-MCR and the
Southern Illinois University Carbondale’s Cooperative Wildlife Resource Center.
The team was composed of professionals from mining and civil engineering,
geology, chemistry and hydrology (Lewis, 2008). The investigation took place in
three phases. During the first phase, reclamation followed the recommendations
of the previous study. The drainage system of the site was improved by
constructing trenches that directed run-off water away from the site, and all
isolated impoundments were backfilled. These efforts were undertaken to
minimize the run-off water that enters the mine works and thereby reduce the
AMD. During the second phase, in 2005, about 519 meters (1900 feet) long of
the high-wall was backfilled to reduce its slope. Possible susceptible infiltration
sites were sealed and the site was regraded, and lime and fertilizer were added
on over 8 hectares (20 acres) to the site (Lewis, 2008). During the final phase in
2007, the remaining 518 meters (1,700 feet) of the high-wall were backfilled and
7.7 hectares (19 acres) of the site were seeded. Most importantly, a sulfate-

18
reducing anaerobic bioreactor was constructed to treat the AMD and reduce the
acidity and concentration of SO42- and metals to acceptable standards (Lewis,
2008).
4.5 The Tab-Simco Anaerobic Sulfate-reducing Bioreactor
The Tab-Simco anaerobic sulfate-reducing bioreactor was constructed by
IDNR to treat the AMD at the site to prevent further environmental degradation.
The bioreactor is located on the northern edge of the site at a lower elevation
compared to the seepage points (Fig. 3). The bioreactor was constructed on an
area of approximately 300m2 (0.75 acres). The Tab-Simco bioreactor comprises,
from top to bottom, a 0.3-meter (1 foot) standing acid water impoundment, a 2-
meter (six-foot) thick organic layer underlaying the standing water, and a 0.3-
meter (one-foot) limestone layer. Within the limestone layer are perforated 6”
PVC pipes that help to collect and discharge the treated water. The 2-meter (6
foot) organic layer is composed of 53% woodchips, 27% straw mulch, 11%
seasoned compost and 9% agricultural ground limestone. The bioreactor was
completed in October 2007 and started to work in by the beginning of 2008
(Lewis, 2008).
AMD enters the bioreactor in two ways: (1) from groundwater seepage
directly into the bioreactor and (2) from surface flow through the bioreactor inlet
(Fig. 3). The AMD that enters the bioreactor from surface flow reaches the
bioreactor after seeping upstream through constructed subsurface French drains
filled with chert into an open trench that runs to the bioreactor. The water then
19
flows vertically through the organic matter and limestone layers, reaches the
PVC pipes and leaves the system after flowing horizontally through the pipes.
As the water flows through the organic matter, sulfate-reducing bacteria in
the organic matter are expected to reduce dissolved SO42- to H2S and produce
HCO3-(Reaction 3.6). Additional HCO3
- is also expected to be produced from
limestone dissolution both in the organic and the limestone layers. Then, the
HCO3- produced neutralizes the acid in the AMD, increasing the pH level. As the
pH of the water increases, dissolved metals react with hydrogen sulfide to form
metal sulfide precipitates as shown in reaction 3.9. Dissolved metals can also
precipitate in the form of (oxy)hydroxides and carbonates as shown in reactions
3.3 and 3.10-3.14. During these processes, acidity and dissolved SO42- and
metals decrease significantly and the quality of the AMD is improved.
After leaving the bioreactor, the treated water enters an oxidation pond
(settling pond) located immediately below the bioreactor. In the oxidation pond,
metals such as Fe and Mn can be oxidized and removed in the form of
(oxy)hydroxide precipitation. The treated water then continues to flow slowly
downstream in an open limestone channel, a winding open trench lined with
limestone, until it joins the north flowing Sycamore Creek (Fig. 3).

20
5. METHODS AND MATERIALS
5.1 Water Sampling
Water samples for chemical and isotopic analyses were collected from the
study area between July 2008 and Sept 2009. Samples were taken from seven
sampling stations at the study area (Fig. 3). The sampling stations were located
at: (1) groundwater monitoring well B-1, a well drilled into the underground acid
pool, (2) well B-2, a well located between the underground acid pool and the
bioreactor, (3) the bioreactor seep, where AMD from groundwater seeps into the
bioreactor, (4) the main seep, a site where most of the AMD seeps to the surface
upstream the bioreactor, (5) the bioreactor inlet, a point where the AMD enters
the bioreactor from surface flow, (6) the bioreactor outlet, a point where the
treated water leaves the bioreactor, and (7) the system outlet, a point where the
treated water leaves the entire treatment system and enters Sycamore Creek.
Figure 6a-f show photos of the Tab-Simco treatments system, and the sampling
stations.
At each station, duplicate water samples were collected in 125 ml bottles.
One of the water samples was used for metal analyses and the other water
sample was used for SO42-, alkalinity, and ferrous and total Fe analyses.
Immediately after sampling, the samples were stored in ice in an insulated cooler
until they were taken to the laboratories.

21
Figures 6a & 6b. (a) The Tab-Simco treatment system. Photo was taken looking northeast. (b) The Main Seep sampling station. Photo was taken looking southwest.
b)
Limestone aggregates
Main Seep
samplinatio
Bioreactor Outlet
Bioreactor Seep
The Bioreactor
Oxidation Pond
a) The Tab-Simco Treatment System
System Outlet
Bioreactor Inlet
22
Figures 6c & 6d. (c) The Bioreactor inlet and Bioreactor seep sampling stations. (d) The Bioreactor outlet sampling station. Both photos were taken looking east.
c)
Bioreactor
Bioreactor Inlet
Bioreactor Seep
d
)
Oxidation Pond
Bioreactor Outlet
23
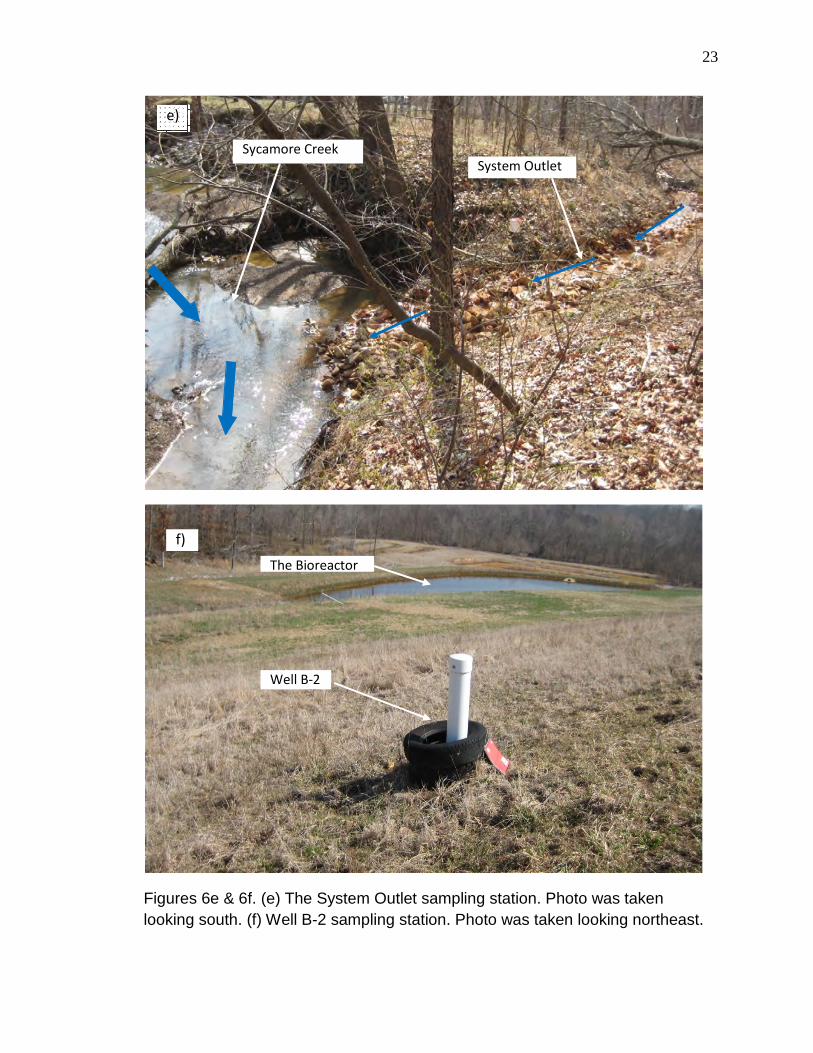
Figures 6e & 6f. (e) The System Outlet sampling station. Photo was taken looking south. (f) Well B-2 sampling station. Photo was taken looking northeast.
Well B-2
The Bioreactor
f)
System Outlet
Sycamore Creek
e)

24
5.2 Field Measurements
At each sampling station, I measured the following in situ parameters: pH
level, specific conductance (Sc), dissolved oxygen (DO), oxidation reduction
potential (ORP) and flow rate. A Hach (Loveland, CO) HQ40D pH/ conductivity/
DO meter was used to measure pH level, Sc and DO values of the acid water. A
Fisher (Pittsburgh, PA) Accumet® instrument with a platinum electrode was used
to measure the ORP. The flow rates at the bioreactor inlet and bioreactor outlet
were measured using a bucket and a stopwatch. The flow rate of the AMD that
seeped from groundwater was then determined by subtracting the bioreactor inlet
flow rate from that of the bioreactor outlet flow rate.
5.3 Laboratory Analyses
Chemical analyses: Immediately after arriving at the laboratory, the water
samples were filtered using pre-baked and dried 0.22 µm pore-size quartz-fiber
filters (Whatman, QM-A). Samples for metal analyses were then acidified to pH
below 2.0 using 50% nitric acid (HNO3) and were refrigerated until chemical
analyses were performed. The duplicate samples were analyzed for total
alkalinity, dissolved ferrous and total Fe, and SO42- concentrations immediately.
Researchers from the OSMRE-MCR, Alton, Illinois determined alkalinity,
Fe2+ and total Fe concentrations. The concentrations of the dissolved metals (Fe,
Ca, Al, Mn, Mg, Na and K) and SO42- were determined in the Geochemistry
Laboratory at Southern Illinois University Carbondale (SIUC). In addition to the
analyses in the SIUC laboratory, SO42-, Mn and Al concentrations were also
measured at OSMRE-MCR laboratory.

25
Alkalinity value in the AMD was determined by titration using Hach digital
micropipette and pH meter. Samples were titrated using H2SO4 (sulfuric acid) to
a pH of 4.5, and samples with pH less than 4.5 were considered to have zero
alkalinity value (American Public Health Association, 1998b). Total acidity was
then determined by calculation from pH, Fe3+, F2+, Al and Mn concentration
values using the formula below (Hedin et al. 1994; Rose et al., 1998).
Total Acidity = 50*[2*(Fe2+)/56 + 3*(Fe3+)/56 + 3*Al/27 + 2*Mn/55 + 1000*10-pH]
Finally, Net acidity was calculated by subtracting alkalinity from total acidity.
SO42- concentrations were determined using a Dionex (Sunnyvale, CA)
ICS-2000 ion chromatography with KOH eluent and an IonPack® AS18-HC
column. Dissolved Fe2+ and total Fe concentrations were analyzed using
colorimeter, Hach Ferrous (Method Number 8146) and FerroVer (Method
Number 8008) methods, respectively. The acidified samples for metal analyses
were analyzed for concentrations of Fe, Al, Mn, Ca, Mg, Na, and K using a
Hitachi (Suite 500 Schaumburg, Illinois) Z-2000 Polarized Zeeman Atomic
Absorption Spectrometer (AAS) flame test method.
Isotope analyses: Sulfur isotope values for dissolved SO42- were
measured at Indiana University using a Thermo Scientific (Waltham, MA)
manufactured Finnigan/Mat Delta Plus® stable-isotope ratio mass spectrometer.
The stable isotope ratios are expressed in standard δ34S notations in parts per
thousand (“per mil”, ‰) relative to Vienna Cañon Diablo Troilite (V-CDT)
standard (Craig, 1957):
δ34S = (Rsample − Rstandard) / Rstandard × 1000 (‰)
26
Where, Rsample and Rstandard refer to the 34S/32S ratios in sample and standard,
respectively.
For the stable sulfur isotope analyses, first barium chloride (BaCl) solution
was added to the samples to precipitate the SO42- in the form of barium sulfate
(BaSO4). Then the BaSO4 samples were dried in an oven. Then, from each
sample, about 510 µg of the dried BaSO4 were loaded into tin cups, mixed with
1-2 mg of V2O5, and combusted on-line in an EA 1,110 elemental analyzer at a
flash temperature of 1,400 °C. Combustion products we re carried by a
continuous flow of helium through a 1,010 °C oxidatio n-reduction column,
through a MgClO4 water trap, and a Costech (Valencia, CA) packed column (0.8
m) to purify SO2. Sulfur isotopic calibration utilized international standards IAEA-
S1 = -0.3‰, IAEA-S2 = +21.6‰, IAEA-S3 = -31.3‰, and NBS127 = +20.3‰
(SO2-scale). The analytical uncertainty was better than ±0.05‰, whereas sample
reproducibility was typically ±0.15‰.
5.4 Mass Balance Calculations
In order to assess the performance of the Tab-Simco bioreactor, and the
overall AMD treatment system, the concentration rates of the acidity, dissolved
SO42- and metals that entered and left the bioreactor, and the entire treatment
system were calculated. The concentration rates (loading) of the parameters that
entered and left the bioreactor were determined by multiplying the concentrations
in the influent and effluent by their respective flow rates (Barton et al., 1999). The
removal rates of the acidity, dissolved metals and SO42- were then determined by
27
subtracting the concentration rates in the effluent from that of the influent (Riefler
et al., 2008). Finally, removal rates were converted to kilogram per day.
The alkalinity that neutralized the AMD within the Tab-Simco bioreactor
was produced from BSR and limestone dissolution (Barton et al., 1999; Riefler et
al., 2008). To determine the amount of alkalinity produced by each of these
processes, Ca2+ and SO42- concentration differences in the effluent and influent
were used. To calculate alkalinity produced from limestone dissolution, the
increase in Ca2+ concentration within the bioreactor was considered to be solely
from limestone dissolution (Riefler et al., 2008). The alkalinity production rate by
limestone dissolution was then calculated considering the fact that limestone
dissolution produces equal number of HCO3- and Ca2+ moles (Reaction 3.7).
The rate of alkalinity production by the BSR processes was determined
using the decrease in SO42- concentration within the bioreactor. It was assumed
that all SO42- loss within the bioreactor was due to the BSR (Riefler et al., 2008).
During BSR for each SO42- mole reduced, two moles of HCO3
- are produced
(Reaction 3.6). The alkalinity production rates from both processes were then
added to find the total alkalinity production rate within the bioreactor.
The total alkalinity production rate within the bioreactor was also
determined using an independent method from net acidity removal rates within
the bioreactor (Riefler et al., 2008). In this case, the amount of acidity removed
within the bioreactor was assumed to be equal to the amount of alkalinity
produced. The total alkalinity production rate found from this method was then
compared with the one determined from the BSR and limestone dissolution.
28
6. RESULTS
6.1 Field Parameters
The Tab-Simco AMD Field parameter results measured at seven sampling
stations are presented in Table 1 and Figure 7. Figure 7 shows the trend of field
parameter values along the AMD flow direction, using the average value for each
parameter at each sampling station. The results indicate that, as the acid water
flowed from the acid mine pool (well B-1) to the main seep, pH level and DO
values decreased slightly, whereas Sc and ORP values showed a small
increase. The lowest mean pH value in the Tab-Simco AMD, 2.8, was measured
at the main seep sampling station. Between the main seep and the bioreactor
inlet sampling stations, the trend was reversed, pH, DO and ORP values
increased, whereas Sc value decreased.
Analyses of groundwater samples from well B-2, which represents the
chemical characteristics of the AMD that seeped directly into the bioreactor,
showed similar mean pH value, 2.83, to the AMD that entered the bioreactor from
surface flow through the bioreactor inlet, 2.86. However, the mean pH value at
well B-2 was lower than the mean pH value at the mine pool, 3.07, suggesting
pH decreasing processes between well B-1 and B-2. Mean Sc, DO and ORP
values at well B-2 were similar to the values at Well B-1, although, the mean Sc
and DO values at B-2 were lower compared to their values at the bioreactor inlet.
As the AMD flowed through the bioreactor, a sharp increase in pH was
observed and the pH value of the water, at the bioreactor outlet, was increased
to 6.40, whereas DO, Sc and ORP values of the AMD were decreased
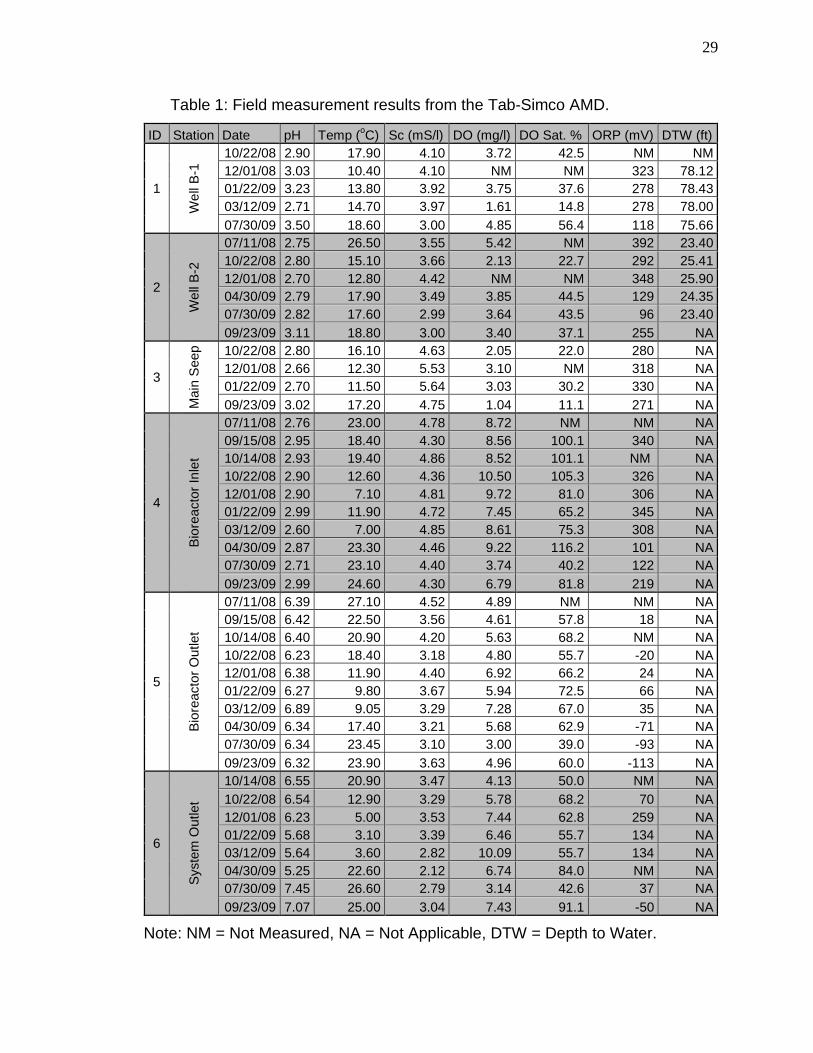
29
Table 1: Field measurement results from the Tab-Simco AMD.
ID Station Date pH Temp (oC) Sc (mS/l) DO (mg/l) DO Sat. % ORP (mV) DTW (ft)
1 W
ell B
-1 10/22/08 2.90 17.90 4.10 3.72 42.5 NM NM
12/01/08 3.03 10.40 4.10 NM NM 323 78.12 01/22/09 3.23 13.80 3.92 3.75 37.6 278 78.43 03/12/09 2.71 14.70 3.97 1.61 14.8 278 78.00 07/30/09 3.50 18.60 3.00 4.85 56.4 118 75.66
2
Wel
l B-2
07/11/08 2.75 26.50 3.55 5.42 NM 392 23.40 10/22/08 2.80 15.10 3.66 2.13 22.7 292 25.41 12/01/08 2.70 12.80 4.42 NM NM 348 25.90 04/30/09 2.79 17.90 3.49 3.85 44.5 129 24.35 07/30/09 2.82 17.60 2.99 3.64 43.5 96 23.40 09/23/09 3.11 18.80 3.00 3.40 37.1 255 NA
3
Mai
n S
eep 10/22/08 2.80 16.10 4.63 2.05 22.0 280 NA
12/01/08 2.66 12.30 5.53 3.10 NM 318 NA 01/22/09 2.70 11.50 5.64 3.03 30.2 330 NA 09/23/09 3.02 17.20 4.75 1.04 11.1 271 NA
4
Bio
reac
tor
Inle
t
07/11/08 2.76 23.00 4.78 8.72 NM NM NA 09/15/08 2.95 18.40 4.30 8.56 100.1 340 NA 10/14/08 2.93 19.40 4.86 8.52 101.1 NM NA 10/22/08 2.90 12.60 4.36 10.50 105.3 326 NA 12/01/08 2.90 7.10 4.81 9.72 81.0 306 NA 01/22/09 2.99 11.90 4.72 7.45 65.2 345 NA 03/12/09 2.60 7.00 4.85 8.61 75.3 308 NA 04/30/09 2.87 23.30 4.46 9.22 116.2 101 NA 07/30/09 2.71 23.10 4.40 3.74 40.2 122 NA 09/23/09 2.99 24.60 4.30 6.79 81.8 219 NA
5
Bio
reac
tor
Out
let
07/11/08 6.39 27.10 4.52 4.89 NM NM NA 09/15/08 6.42 22.50 3.56 4.61 57.8 18 NA 10/14/08 6.40 20.90 4.20 5.63 68.2 NM NA 10/22/08 6.23 18.40 3.18 4.80 55.7 -20 NA 12/01/08 6.38 11.90 4.40 6.92 66.2 24 NA 01/22/09 6.27 9.80 3.67 5.94 72.5 66 NA 03/12/09 6.89 9.05 3.29 7.28 67.0 35 NA 04/30/09 6.34 17.40 3.21 5.68 62.9 -71 NA 07/30/09 6.34 23.45 3.10 3.00 39.0 -93 NA 09/23/09 6.32 23.90 3.63 4.96 60.0 -113 NA
6
Sys
tem
Out
let
10/14/08 6.55 20.90 3.47 4.13 50.0 NM NA 10/22/08 6.54 12.90 3.29 5.78 68.2 70 NA 12/01/08 6.23 5.00 3.53 7.44 62.8 259 NA 01/22/09 5.68 3.10 3.39 6.46 55.7 134 NA 03/12/09 5.64 3.60 2.82 10.09 55.7 134 NA 04/30/09 5.25 22.60 2.12 6.74 84.0 NM NA 07/30/09 7.45 26.60 2.79 3.14 42.6 37 NA 09/23/09 7.07 25.00 3.04 7.43 91.1 -50 NA
Note: NM = Not Measured, NA = Not Applicable, DTW = Depth to Water.
30
Figures 7. Field measurement values along the flow direction at the Tab-Simco site using average values in each sampling station.
significantly (Fig. 7). In addition, a strong smell, which probably was produced by
H2S emissions (reaction 3.6) from the bioreactor, was detected at the bioreactor
outlet.
Between the bioreactor outlet and the system outlet, DO and ORP
increased significantly, while the pH remained relatively constant, and Sc
continued to decrease (Fig. 7).
0
1
2
3
4
5
6
7
8
9
Av
era
ge
pH
Sc (mS/cm)
DO (mg/l)
-50
0
50
100
150
200
250
300
350
Av
era
ge
OR
P (
mV
)
ORP
a)
b)
31
Flow rates: Influent and effluent flow rates within the bioreactor varied
seasonally with considerable increase during spring and summer (Table 2). Total
flow rate into the bioreactor, measured between 7/2008 and 9/2009, ranged
between 40.0 and 128.6 l/min (excluding flow rate from 4/30/2009), with an
average value of ~ 65 l/min (93,609 liters/day). The proportion of AMD that
entered the bioreactor from surface flow to groundwater seep varied seasonally.
The proportion of the AMD that entered from the groundwater seep increased
significantly during rain seasons (spring and summer). During one of the
sampling dates, 4/30/2009, after an overnight heavy rainfall, the effluent flow rate
was abnormally high due to additional of water from run-off. When calculating the
bioreactor performance for this sampling date, a reasonable flow rate, based on
the flow rates from the previous sampling dates, was used for the AMD that seep
from groundwater to avoid the effect of run-off water.
Table 2: The Tab-Simco AMD flow rate measurements (liters per minute)
Date Bioreactor Outlet Bioreactor Inlet
(from surface flow) Bioreactor seep
(from groundwater seep) 07/11/08 80.00 48.00 32.00 10/22/08 40.00 33.00 7.00 12/01/08 40.00 33.00 7.00 01/22/09 45.00 30.00 15.00 03/12/09 60.00 30.28 29.72 04/30/09 171.43 45.00 90.00 07/30/09 128.57 58.54 70.03 09/23/09 60.00 40.00 20.00
6.2 Acidity and Alkalinity Values
Alkalinity, total acidity, and net acidity values for the Tab-Simco AMD are
given in Table 3 and Fig. 8. The alkalinity and acidity values are expressed in
mg/l as CaCO3 equivalent. Since the pH values at well B-1, well B-2, bioreactor
seep, main seep, and bioreactor inlet sampling stations were always below 4.5,

32
alkalinity at these sampling stations was always zero. As the water flowed from
the mine pool to the main seep, considerable increase in average acidity, from
1,735 to 3,386 mg/l, was observed (Table 3, Fig. 8). Between the main seep and
the bioreactor inlet the average acidity decreased slightly. The highest average
acidity value at the site was measured at the main seep sampling station. For the
AMD that seeped from groundwater, the average acidity at well B-2, and
bioreactor seep were similar to that of the acid mine pool (well B-1).
Within the bioreactor, a substantial amount of alkalinity was produced and
the acidity showed a significant drop from an average of 2,766 mg/l, at the
bioreactor inlet, to an average of 360 mg/l, at the bioreactor outlet (Fig. 8).
Accordingly, the average net acidity at the bioreactor outlet was only 68 mg/l.
However, as the treated water flowed between the bioreactor outlet and
the system outlet, additional acidity released from hydrolysis reactions and
precipitation of metal hydroxides, such as Fe(OH)3 and Al(OH)3, consumed more
of the alkalinity. Consequently, the average alkalinity at the system outlet
dropped to 45 mg/l as CaCO3 equivalent (Fig. 8).
6.3 Sulfate Concentration
Table 4 lists dissolved SO42- and metal concentration values from the Tab-
Simco AMD. The trends of the SO42- concentration along the flow direction using
average values for each parameter in each sampling station is shown in Figure 8.
The data indicate that SO42- concentration in the AMD varied along the flow path
from the acid mine pool to the system outlet. As the acid water flowed from the
acid mine pool to the main seep, a substantial increase in SO42- concentration,
33
Table 3: Alkalinity and Acidity Values in Tab-Simco AMD (mg/l as CaCO3 equiv.)
ID Sampling site
Sampling Date
pH (lab)
Total Alkalinity Acidity Net Acidity
1
Wel
l B-1
12/01/08 3.03 0.0 2182.0 2182.0
01/22/09 3.23 0.0 2144.5 2144.5
07/30/09 3.50 0.0 877.7 877.7
2 W
ell B
-2 12/01/08 2.70 0.0 1989.4 1989.4
04/30/09 2.79 0.0 1880.7 1880.7
07/30/09 2.82 0.0 1577.9 1577.9
09/23/09 2.92 0.0 1312.1 1312.1
3
Bio
reac
tor
See
p 03/22/09 2.81 0.0 2036.7 2036.7
04/30/09 3.00 0.0 1772.7 1772.7
09/23/09 2.89 0.0 1404.1 1404.1
4
Mai
n S
eep
12/01/08 2.66 0.0 3366.0 3366.0
01/22/09 2.70 0.0 3553.8 3553.8
03/22/09 2.70 0.0 3397.36 3397.36
09/23/09 2.91 0.0 3233.3 3233.3
5
Bio
reac
tor
Inle
t
10/14/08 2.93 0.0 2492.2 2492.2
12/01/08 2.90 0.0 2870.3 2870.3
01/22/09 2.99 0.0 2714.9 2714.9
03/22/09 2.81 0.0 2865.4 2865.4
04/30/09 2.87 0.0 2702.6 2702.6
07/30/09 2.71 0.0 2924.6 2924.6
09/23/09 2.87 0.0 2791.7 2791.7
6
Bio
reac
tor
Ou
tlet
10/14/08 6.38 336.0 216.1 -119.9
12/01/08 6.38 350.0 403.0 53.0
01/22/09 6.27 215.2 346.5 131.3
03/22/09 6.34 289.0 367.0 78.0
04/30/09 6.34 241.6 422.3 180.7
07/30/09 6.34 320.0 406.0 86.0
09/23/09 6.32 300.0 551.5 251.5
7
Sys
tem
Ou
tlet
10/14/08 6.55 111.0 56.3 -54.7
12/01/08 6.23 5.0 51.5 46.5
01/22/09 5.66 32.0 134.1 102.1
03/22/09 5.72 82.4 90.6 8.2
04/30/09 5.25 6.4 49.3 42.9
07/30/09 7.45 36.0 64.7 28.7
09/23/09 7.22 56.0 33.7 -22.4

34
Figure 8. Sulfate, acidity and alkalinity values along the flow direction at the Tab-Simco site using average values in each sampling station.
from an average of 2,774 to 4,589 mg/l, was observed (Table 4, Fig. 8) and the
pH value reached its maximum measured average value along the flow path.
Then, between the main seep and the bioreactor inlet sampling stations, average
SO42- concentration displayed a relatively smaller decreased. On the other hand,
the average SO42- concentration in the AMD that seeped from groundwater was
similar to the average SO42- concentration in the acid mine pool (Table 4).
Therefore, as the AMD entered the bioreactor the average SO42- concentration of
the AMD from surface flow was higher compared to its concentration in the acid
groundwater seepage (Table 4).
Within the bioreactor, SO42- concentration decreased significantly from an
average of 3,830 to 2,119 mg/l. However, as the treated water flowed between
the bioreactor and the system outlet, SO42- concentration did not show significant
changes (Fig. 8).
0
500
1000
1500
2000
2500
3000
3500
4000
4500
5000
Av
era
ge
(m
g/l
)
Alkalinity
Acidity
Net Acidity
Sulfate
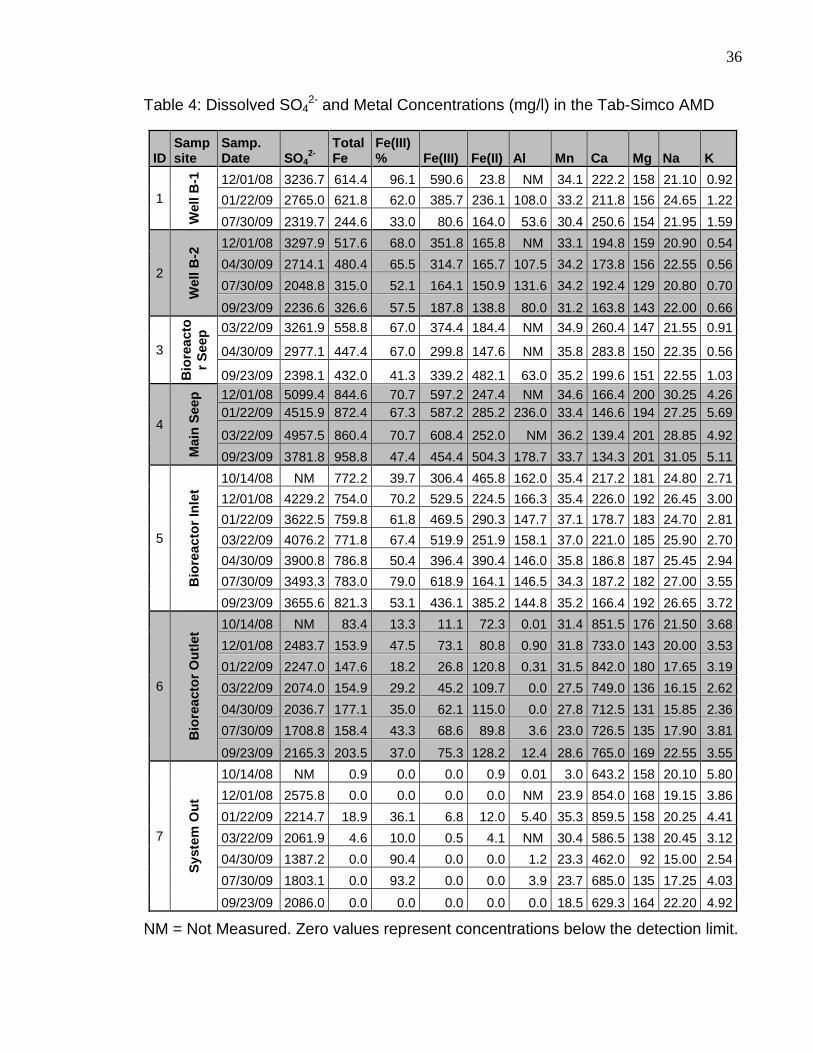
35
6.4 Metal Concentrations
Metal concentrations along the flow direction showed different patterns
(Fig. 9). Dissolved Fe and Al concentrations displayed similar patterns (Fig. 9a
and 9b), in which an increasing trend was first observed between the mine pool
and the main seep sampling station, and then the concentrations decreased
continuously to the system outlet. The highest Fe and Al concentration drops
along the flow path were measured within the bioreactor, where the average total
concentrations were decreased from 778 to 154 mg/l for Fe and from 153 mg/l to
below the detection limit for Al. Average dissolved Fe and Al concentrations in
the acid groundwater that seeped to the bioreactor were similar to their values in
the acid mine pool (Table 4). However, compared to the Fe and Al
concentrations in the AMD that entered through the bioreactor inlet, which had
average concentrations of 778 mg/l Fe and 153 mg/l Al, the Fe and Al
concentration values in the acid water that seeped from groundwater to the
bioreactor were much lower, 479 mg/l Fe and 106 mg/l Al.
As the AMD flowed from the acid mine pool to the bioreactor inlet,
dissolved Mg, Na and K concentration trends in the AMD showed similar patterns
with that of dissolved Fe and Al concentration trends (Table 4 and Fig. 9b and
9c). The average concentrations of the dissolved Mg, Na and K in the AMD
increased from 156, 23.6 and 1.2 mg/l at the acid mine pool (well B-1) to reach
their maximum measured values of 199, 29.4 and 5.0 mg/l at the main seep,
respectively. As the water flowed to the bioreactor inlet sampling station, the
concentration of these metals dropped slightly to reach 186, 25.9 and 3.1 mg/l,
36
Table 4: Dissolved SO42- and Metal Concentrations (mg/l) in the Tab-Simco AMD
ID Samp site
Samp. Date SO4
2- Total Fe
Fe(III) % Fe(III) Fe(II) Al Mn Ca Mg Na K
1 W
ell B
-1
12/01/08 3236.7 614.4 96.1 590.6 23.8 NM 34.1 222.2 158 21.10 0.92
01/22/09 2765.0 621.8 62.0 385.7 236.1 108.0 33.2 211.8 156 24.65 1.22
07/30/09 2319.7 244.6 33.0 80.6 164.0 53.6 30.4 250.6 154 21.95 1.59
2
Wel
l B-2
12/01/08 3297.9 517.6 68.0 351.8 165.8 NM 33.1 194.8 159 20.90 0.54
04/30/09 2714.1 480.4 65.5 314.7 165.7 107.5 34.2 173.8 156 22.55 0.56
07/30/09 2048.8 315.0 52.1 164.1 150.9 131.6 34.2 192.4 129 20.80 0.70
09/23/09 2236.6 326.6 57.5 187.8 138.8 80.0 31.2 163.8 143 22.00 0.66
3
Bio
reac
tor
See
p 03/22/09 3261.9 558.8 67.0 374.4 184.4 NM 34.9 260.4 147 21.55 0.91
04/30/09 2977.1 447.4 67.0 299.8 147.6 NM 35.8 283.8 150 22.35 0.56
09/23/09 2398.1 432.0 41.3 339.2 482.1 63.0 35.2 199.6 151 22.55 1.03
4
Mai
n S
eep
12/01/08 5099.4 844.6 70.7 597.2 247.4 NM 34.6 166.4 200 30.25 4.26 01/22/09 4515.9 872.4 67.3 587.2 285.2 236.0 33.4 146.6 194 27.25 5.69
03/22/09 4957.5 860.4 70.7 608.4 252.0 NM 36.2 139.4 201 28.85 4.92
09/23/09 3781.8 958.8 47.4 454.4 504.3 178.7 33.7 134.3 201 31.05 5.11
5
Bio
reac
tor
Inle
t
10/14/08 NM 772.2 39.7 306.4 465.8 162.0 35.4 217.2 181 24.80 2.71
12/01/08 4229.2 754.0 70.2 529.5 224.5 166.3 35.4 226.0 192 26.45 3.00
01/22/09 3622.5 759.8 61.8 469.5 290.3 147.7 37.1 178.7 183 24.70 2.81
03/22/09 4076.2 771.8 67.4 519.9 251.9 158.1 37.0 221.0 185 25.90 2.70
04/30/09 3900.8 786.8 50.4 396.4 390.4 146.0 35.8 186.8 187 25.45 2.94
07/30/09 3493.3 783.0 79.0 618.9 164.1 146.5 34.3 187.2 182 27.00 3.55
09/23/09 3655.6 821.3 53.1 436.1 385.2 144.8 35.2 166.4 192 26.65 3.72
6
Bio
reac
tor
Ou
tlet
10/14/08 NM 83.4 13.3 11.1 72.3 0.01 31.4 851.5 176 21.50 3.68
12/01/08 2483.7 153.9 47.5 73.1 80.8 0.90 31.8 733.0 143 20.00 3.53
01/22/09 2247.0 147.6 18.2 26.8 120.8 0.31 31.5 842.0 180 17.65 3.19
03/22/09 2074.0 154.9 29.2 45.2 109.7 0.0 27.5 749.0 136 16.15 2.62
04/30/09 2036.7 177.1 35.0 62.1 115.0 0.0 27.8 712.5 131 15.85 2.36
07/30/09 1708.8 158.4 43.3 68.6 89.8 3.6 23.0 726.5 135 17.90 3.81
09/23/09 2165.3 203.5 37.0 75.3 128.2 12.4 28.6 765.0 169 22.55 3.55
7
Sys
tem
Ou
t
10/14/08 NM 0.9 0.0 0.0 0.9 0.01 3.0 643.2 158 20.10 5.80
12/01/08 2575.8 0.0 0.0 0.0 0.0 NM 23.9 854.0 168 19.15 3.86
01/22/09 2214.7 18.9 36.1 6.8 12.0 5.40 35.3 859.5 158 20.25 4.41
03/22/09 2061.9 4.6 10.0 0.5 4.1 NM 30.4 586.5 138 20.45 3.12
04/30/09 1387.2 0.0 90.4 0.0 0.0 1.2 23.3 462.0 92 15.00 2.54
07/30/09 1803.1 0.0 93.2 0.0 0.0 3.9 23.7 685.0 135 17.25 4.03
09/23/09 2086.0 0.0 0.0 0.0 0.0 0.0 18.5 629.3 164 22.20 4.92
NM = Not Measured. Zero values represent concentrations below the detection limit.

37
respectively. In the acid groundwater that seeped into the bioreactor, the average
concentrations of dissolved Mg, Na and K measured at the bioreactor seep sampling
station were 149, 22.2 and 0.8 mg/l, respectively. The results indicated that the
concentrations of dissolved Mg, Na and K in the acid groundwater that seep into the
bioreactor were lower as compared to their values in the AMD that reaches the
bioreactor from surface flow through the bioreactor inlet. Within the bioreactor, a
slight decrease in Na and Mg concentration and significant increase in K were
observed. In the remaining course, K continued to increase at a lower rate.
Dissolved Mn concentrations showed relatively little changes along the flow
path (Table 4, Fig. 9c). A small increase in Mn concentration was observed as the
acid water flowed from the acid main pool to the bioreactor inlet sampling station.
Within the bioreactor, Mn concentration decreased from an average of 35.7 mg/l at
the bioreactor inlet to 28.8 mg/l at the bioreactor outlet (Table 4, Fig. 9c). However,
the amount of reduction in Mn concentration was very small compared to the
percentage reduction in Al and Fe concentrations. Unlike the other metals, average
Mn concentration in the AMD which seeped to the bioreactor was similar to its value
in the AMD from surface flow (Table 4). Between the bioreactor outlet and the
system outlet, average Mn concentration showed a slight decrease (Fig. 9c).
Calcium (Ca) concentration trend along the flow course displayed the
opposite of most other metals (Fig. 9a). First, the concentration decreased slightly as
the AMD flowed from the acid pool to the main seep, and then a small increase was
observed between the main seep and the bioreactor inlet (Fig. 9a). Within the
bioreactor, the average Ca concentration increased significantly from about 198 to

38
Figure 9. Metal concentrations along the flow direction at the Tab-Simco site using average values in each sampling station.
0
100
200
300
400
500
600
700
800
900
1000
Av
era
ge
(m
g/l
)
T. Fe
Ca
0
50
100
150
200
250
Av
era
ge
(m
g/l
)
Al
Mg
0
5
10
15
20
25
30
35
40
av
era
ge
(m
g/l
)
Mn
Na
K
a)
b)
c)
39
769 mg/l. Between the bioreactor outlet and the system outlet, average Ca
concentration remained almost constant with a slight tendency to decrease.
Comparison of Ca concentrations in the AMD from surface flow and groundwater
seepage into the bioreactor indicated that the Ca concentration in the water
which comes from groundwater seepage had a higher concentration than the
AMD from surface flow (Table 4).
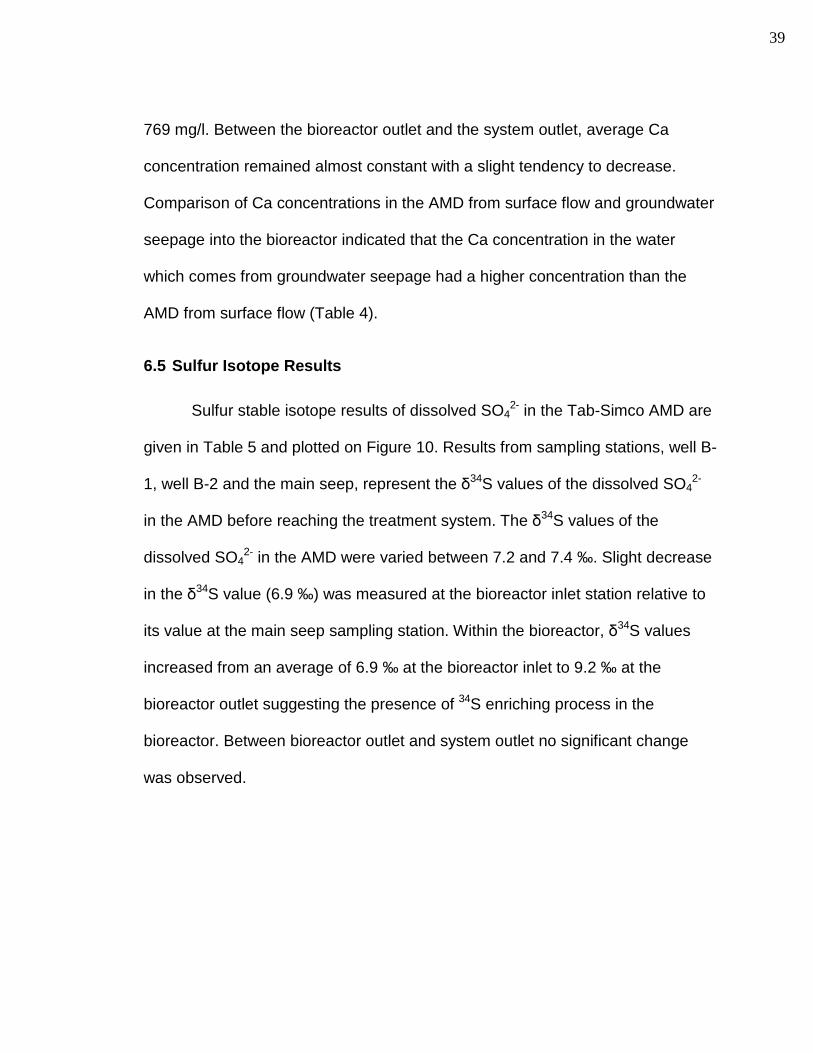
6.5 Sulfur Isotope Results
Sulfur stable isotope results of dissolved SO42- in the Tab-Simco AMD are
given in Table 5 and plotted on Figure 10. Results from sampling stations, well B-
1, well B-2 and the main seep, represent the δ34S values of the dissolved SO42-
in the AMD before reaching the treatment system. The δ34S values of the
dissolved SO42- in the AMD were varied between 7.2 and 7.4 ‰. Slight decrease
in the δ34S value (6.9 ‰) was measured at the bioreactor inlet station relative to
its value at the main seep sampling station. Within the bioreactor, δ34S values
increased from an average of 6.9 ‰ at the bioreactor inlet to 9.2 ‰ at the
bioreactor outlet suggesting the presence of 34S enriching process in the
bioreactor. Between bioreactor outlet and system outlet no significant change
was observed.

40
Table 5: Sulfur isotope values of the dissolved SO42- in the Tab-Simco AMD
Figure 10. The trend of δ34S value of dissolved SO42- in the Tab-Simco AMD
along the flow direction using average values in each sampling station.
0
2
4
6
8
10
12
δ3
4S
12/1/2008
1/22/2009
Sampling Date Sampling Station δ
34S
12/1/2008
Well B-1 7.403
Well B-2A 7.355
Main-Seep 7.314
Bioreactor-Inlet 6.979
Bioreactor-Outlet 9.578
System-Outlet 9.961
1/22/2009
Well B-1 7.347
Main-Seep 7.176
Bioreactor-Inlet 6.862
Bioreactor-Outlet 8.806
System-Outlet 7.880
41
7. DISCUSSION
7.1 The Tab-Simco AMD Water Chemistry
Field parameters and chemical analyses results from seven sampling
stations (well B-1, well B-2, main seep, bioreactor seep, bioreactor inlet,
bioreactor outlet, and system outlet) at the Tab-Simco site are given in Tables 1,
2, 3 and 4. The results from sampling stations, well B-1, well B-2, main seep, and
bioreactor inlet, represent the quality of the Tab-Simco AMD before it entered the
sulfate-reducing bioreactor. The results indicated that the Tab-Simco AMD is low
pH water with high concentrations of dissolved SO42- and metals. As the AMD
reached the surface at the main seep sampling station, average concentrations
of the parameters were about 3,386 mg/l of acidity, 4,589 mg/l of SO42-, 884 mg/l
of Fe, 207 mg/l of Al, 34.4 mg/l of Mn, with average pH of the water 2.8.
Variations along the flow path and possible processes: As the AMD flowed
between the acid mine pool and the Tab-Simco bioreactor, noticeable changes
were measured in the chemical characteristics of the AMD waters (Figures 7, 8
and 9). The results indicated that the concentrations of acidity, dissolved SO42-
and metals in the AMD were always higher at the main seep sampling station
than their values in the acid mine pool (well B-1). The increase in acidity,
dissolved SO42- and metal concentrations, as the acid water flowed from the acid
mine pool (W-B1) to the main seep sampling station could be due to (1) oxidation
of additional sulfide minerals as the water flows through the mine spoils and/or
42
(2) mixing of the AMD from W-B1, with AMD from other acid mine pools that
have higher concentrations of, acidity, dissolved metals and SO42-.
As the AMD flowed from the main seep to the bioreactor inlet sampling
station, acidity, SO42- and most metal concentrations dropped slightly, whereas
Ca2+ and Mn2+ concentration values showed a slight increase (Figures 7, 8, and
9). The drop in the concentrations of acidity, dissolved SO42- and most metals
could suggest dilution of the AMD by fresh water which contained lower
concentrations of these parameters. Furthermore, reddish precipitate, covering
the bottom bed of the trench through which the AMD flowed, was observed
during some of the sampling dates (at pH around 2.9), suggesting the presence
of Fe (oxy)hydroxides (e.g Fe(OH)3 and FeOOH) precipitating processes as the
AMD flowed between the main seep and bioreactor inlet sampling stations.
In addition to dilution, other possible factors which could have decreased
the concentration of SO42- as the AMD flowed to the bioreactor inlet are: (1) BSR
processes (Webb et al., 1998; Watzlaf et al., 2004) and (2) precipitation of SO42-
minerals such as gypsum (CaSO4.2H2O) and jarosite (KFe3(SO4)2(OH)6)
(Neculita, 2008a; Blowes et al., 2003; Willow and Cohen, 2003). During BSR,
SO42- molecules containing 32S are preferentially reduced over SO4
2- molecules
containing 34S. Consequently, BSR results in progressive enrichment in 34S value
of the dissolved SO42- (Ohmoto et al., 1997). However, the Tab-Simco sulfur
isotope results (Table 5, Fig. 10) showed a decreasing trend in δ34S value as the
water flowed from the main seep to the bioreactor inlet sampling station,
suggesting that BSR did not occur or was a minor process.
43
The increase in Ca2+ concentration and decrease in acidity of the AMD
could be due to limestone dissolution (reaction 3.7) as the water flowed toward
the bioreactor inlet. During reclamation work at the site, all the areas around the
bioreactor, both up and down gradient of the bioreactor, including the trenches
through which the AMD flow, were lined with limestone aggregates. Therefore,
limestone dissolution was the most probable cause for the increase in Ca2+
concentration and decrease in acidity.
On the other hand, the chemical characteristics of the acid groundwater
which seeped to the bioreactor showed similar chemical characteristics with the
water in the acid mine pool (Tables 1, 3 and 4). The groundwater seep had lower
acidity, SO42-, and metal concentrations than the AMD from surface flow at the
bioreactor inlet (Table 4). The slight improvement in the water quality from the
acid water that seeped from the groundwater to the bioreactor is mainly due to
the addition of alkalinity from limestone dissolution, and subsequent precipitation
of metals as the water continued towards the bioreactor. Overall, the acid water
that reached the bioreactor from groundwater seepage had slightly better water
quality than the surface flow influent (Tables 1, 3 and 4).
7.2 The Bioreactor and Overall System Performance and Treatment
Processes
The performance of the Tab-Simco bioreactor and the overall Tab-Simco
treatment system in removing acidity, dissolved SO42- and metals from the AMD,
which reached the treatment system, were evaluated by analyzing the measured
concentrations of the contaminants (acid, SO42- and metals) in the influent and

44
effluent. The performance results are summarized in Table 8a. The results are
expressed in terms of removal rates and percentage removals for both the
bioreactor and the overall treatment system. Overall, the Tab-Simco AMD
treatment system provided an excellent removal of acidity and most metals. In
the following sections, the performance of the bioreactor and overall treatment
system with respect to each parameter and the treatment processes are
discussed.
7.2.1 Field parameters
The Tab-Simco field measurement results, before and after passing
through the bioreactor, are given in Table 1 and Fig. 7. One of the most
significant changes in the AMD parameters was the increase in pH value as the
water passed through the bioreactor. As the AMD entered the bioreactor, the
average pH of the acid water that seeped from groundwater was 2.83, whereas
that of the AMD that reached from surface flow through the bioreactor inlet was
2.86. After passing through the bioreactor, the average pH of the water at the
bioreactor outlet increased up to 6.4. Within the bioreactor, a substantial amount
of alkalinity was produced from BSR and limestone dissolution. The increase in
the average pH value of the AMD within the bioreactor was, therefore, mainly
due to neutralization reaction. Between the bioreactor outlet and system outlet,
the average pH value of the treated water that left the bioreactor did not show
significant change (Fig. 7a).
Other than the increase in pH value, average ORP, Sc and DO values
were decreased within the bioreactor. The decrease in ORP and DO values can
45
be explained by the high O2 demand in the organic layer by certain bacteria,
whereas the Sc decrease was attributed to the precipitation of metals within the
bioreactor.
7.2.2 Acidity removal
The performance of the Tab-Simco treatment system in removing acidity
is shown in Table 6a. On average, the bioreactor received about 257 kg/day of
acidity as CaCO3 equivalent. The measured average acidity removal rate by the
bioreactor was 241 kg/day. This removal rate accounts for about 94% of the
acidity that reached the bioreactor. The large drop in acidity within the bioreactor
was mainly due to the neutralization of the acidity by alkalinity produced within
the bioreactor. The alkalinity production was due to BSR processes (reaction 3.6)
and limestone dissolution (reaction 3.7) within the bioreactor. This was revealed
from the considerable increase in the alkalinity of the AMD, from zero at
bioreactor outlet to an average of 292 mg/l at the bioreactor inlet (Table 2).
In contrast to the bioreactor behavior, as the treated water flowed from the
bioreactor outlet to the system outlet, a decline in the average amount of
alkalinity in the water was measured. This decline was because of the
consumption of alkalinity to neutralize the acidity released from hydrolysis and
precipitation of metal oxy-hydroxide (Reactions 3.3 and 3.10-3.12) (Neculita,
2008a). The average acidity removal rate by the entire treatment system from the
Tab-Simco AMD in this study was 98.5%.

46
7.2.3 Sulfate removal
The Tab-Simco bioreactor and the overall treatment system performance
in removing dissolved SO42- from the Tab-Simco AMD are shown in Table 6a.
The measured average mass rate of dissolved SO42- that reached the bioreactor
from surface flow and groundwater seepage was 366 kg/day, whereas the
bioreactor’s average SO42- removal rate for the period of study was 121 kg/day
(Table 6a). On average, the bioreactor removed about 35% of the dissolved
SO42- in the AMD. As the treated water flowed to the system outlet, an additional
drop in the concentration of SO42- was observed. Thus, the Tab-Simco AMD
treatment system removed, on average, 145 kg/day of dissolved SO42-, which
represents 39%. The dissolved SO42- removal rate measured at the Tab-Simco
AMD treatment system is similar to the rates of SO42- removal reported from
other passive AMD treatment sites (e.g. Barton et al., 1999).
There are different processes that can occur within the bioreactor which
can contribute to the decrease in SO42- concentration. One process that can
produce a decrease in SO42- concentration is BSR in the organic layer (Reaction
3.6). During BSR, sulfur isotopic fractionation can result in an increase of 2 to
46‰ in the δ34S values of the dissolved SO42- (Bruchert et al. 2001). In the Tab-
Simco, as the AMD passed through the bioreactor, the δ34S value of the
dissolved SO42- increased from an average of 6.9 to 9.2‰, suggesting that the
BSR processes were active. During sulfate mineral precipitation, the δ34S value
of the dissolved SO42- remains unchanged (Seal, 2003). The presence of a
strong hydrogen sulfide (H2S) smell and black sulfide sludge (precipitates) at the
47
bioreactor outlet was also another good indication of BSR processes within the
bioreactor.
Another process that can contribute to the decrease in SO42- concentration
within the bioreactor is the precipitation of sulfate minerals such as gypsum,
CaSO4.2H2O, and jarosite, KFe3(SO4)2.(OH)6 (Blowes et al., 2003; Thomas et al.,
2002b). To determine the possibility of gypsum precipitation within the bioreactor,
the gypsum saturation index within the bioreactor was calculated. The results
indicated that gypsum had an average saturation index of 24. A saturation index
of greater than one indicates that the solution is oversaturated with respect to the
ion under consideration. Thus, the saturation index for gypsum suggests that
gypsum precipitation occurs within the bioreactor.
However, studies reveal that gypsum precipitation in anaerobic conditions
is limited and that BSR is the main process that removes dissolved SO42- in
bioreactors (Barton et al, 1999). For this reason, and based on the sharp
increase in δ34S value within the bioreactor, the dominantly black sulfide sludge
observed and the strong sulfide smell detected at the bioreactor outlet, BSR was
considered as the main process that caused a decrease in dissolved SO42-
concentration in the Tab-Simco bioreactor.
The slight decrease in SO42- concentration between the bioreactor outlet
and the system outlet could be either due to dilution or precipitation of sulfate
minerals.

48
7.2.4 Metal removals
The Tab-Simco bioreactor removed a significant amount of the metals in
the AMD that reached the bioreactor (Table 6a). Previous studies have shown
that metal removal in bioreactors occurs mainly due to precipitation of metals in
the form of sulfides, (oxy)hydroxides and carbonates (Neculita et al., 2007).
Adsorption of dissolved metals onto the organic compounds is also an important
removal process during the initial stages of the bioreactor (Gibert et al., 2005a).
Finally, metals can also be co-precipitated with Fe and Mn (oxy)hydroxides
(Neculita et al 2008b).
Iron (Fe): On average, the Tab-Simco bioreactor received about 64
kg/day of dissolved Fe, both from surface flow and groundwater seepage (Table
6a). The measured Fe removal rate by the bioreactor for this study was about 46
kg/day. This rate accounts for 75% of the Fe received by the bioreactor.
Additional Fe was removed outside the bioreactor, as the treated water flowed
between the bioreactor outlet and the system outlet. At the system outlet, the
mean dissolved Fe concentration, for most of the sampling dates, was below the
detection limit. Overall, 99.5% of the Fe that reached the bioreactor was removed
by the Tab-Simco treatment system.
In passive treatment systems, Fe removal can occur through precipitation
of Fe in the form of sulfides (e.g FeS, FeS2), Fe (oxy)hydroxides (e.g. Fe
hydroxide, Fe(OH)3, goethite, FeOOH, and schwertmannite
(Fe8O8(OH)4.8(SO4)1.6), and/or carbonates (e.g FeCO3) (Hedin et al., 1994;
Riefler et al., 2008). The removal of Fe under oxidizing conditions is primarily
49
through oxidation of Fe2+ to Fe3+ followed by hydrolysis and precipitation of Fe
(oxy)hydroxides as shown in reactions 3.3 and 3.11 (Hedin et al., 1994). Fe
oxidation processes in oxidizing conditions can be abiotic or mediated by
bacteria depending on the pH level of the AMD. Bacterial Fe oxidation is the
dominant process in waters with pH levels between 2 and 3, whereas abiotic Fe
oxidation becomes the dominant process in waters with neutral pH values (Hedin
et al., 1994). Precipitation of Fe(OH)3 from AMD is also pH dependent and
occurs only when the pH is above ~3-3.5 (Pérez-López et al., 2007; Hedin et al.,
1994). In anaerobic systems that contain organic substrate, Fe oxidation is
limited by the absence of O2 and microorganisms (Fe oxidizing bacteria).
Consequently, precipitation of Fe in the form of Fe3+ (oxy)hydroxides can be
limited to the upper surface of the bioreactor (McCauley et al., 2009). In such
environments, Fe removal occurs mainly through precipitation of Fe
monosulfides (FeS), and to some extent, Fe disulfides such as pyrite (FeS2)
(Watzlaf et al., 2004).
At the Tab-Simco AMD treatment system, Fe removal within the bioreactor
was mainly through precipitation in the form of Fe sulfides. This was confirmed
by the predominantly black sulfide sludge observed in the discharge at the
bioreactor outlet.
After the treated water left the bioreactor, it entered the oxidation pond
where metal oxidation and precipitation took place (Neculita, 2008a), and then
flowed slowly to the system outlet. Fe removal between the bioreactor outlet and
50
system outlet was primarily due to precipitation of Fe in the form of Fe oxy-
hydroxide minerals.
Aluminum (Al): For most of the sampling period, Al was the only metal
which was removed to the level below the detection limit within the bioreactor.
Average Al mass rate into the Tab-Simco bioreactor during the study period was
about 14 kg/day (Table 6a). In most of the effluent samples (bioreactor outlet
station), the concentration of Al dropped below the detection limit. Overall, the
bioreactor removed 98% of the Al received.
In aquatic systems, Al is present in only one oxidation state, Al+3, and it
does not undergo an oxidation or reduction process (Hedin et al. 1994; Drever,
1997). As a result, Al removal in passive treatment systems does not need O2 or
oxidizing bacteria, and occurs mainly through hydrolysis reactions in the form of
aluminum hydroxide (gibbsite), Al(OH)3 (Hedin et al., 1994). To some extent, Al
can also be removed in the form of Al hydroxysulfates such as felsobanyaite
(basaluminite), Al4(SO4)(OH)10.4H2O, hydrobasaluminite, Al4(SO4)(OH)10.15H2O
and alunite, KAl3(SO4)2(OH)6 (Blowes et al., 2003; Bigham et al., 2000). The
main factor that determines the removal of Al is the pH of the AMD. At pH levels
between 5 and 8, Al(OH)3 is highly insoluble and usually precipitates to remove
the concentration of dissolved Al to below 1g/l (Hedin et al., 1994). However, at
lower pH levels, Al(OH)3 is highly soluble and most of the Al exists as ions in
solution and thus no significant Al precipitation occurs.
In the Tab-Simco bioreactor, the pH of the AMD that left the bioreactor
was always above 6. Therefore, the reduction of Al to below the detection limit
51
within the bioreactor can be attributed to the precipitation of Al in the form of
Al(OH3) and/or hydroxysulfates minerals.
Manganese (Mn): Mn retention in the bioreactor was very small
compared to Fe and Al. The bioreactor, on average, received ~3.6 kg/day of
dissolved Mn and dispatched ~0.58 kg/day of it (Table 6a). This means only
~15.1% of the dissolved Mn was removed from the AMD in the bioreactor.
Between the bioreactor outlet and the system outlet, no significant change was
observed in Mn concentrations. The overall system removal rate measured at the
system outlet was 22.5%. Low Mn removal rates by sulfate-reducing bioreactors,
similar to that of the Tab-Simco bioreactor, are widely reported in many previous
bioreactor performance studies (Neculita et al. 2008a; Zaluski et al., 2003;
Hallberg et al., 2005; Kuyucak et al., 2006).
Similar to Fe2+, dissolved Mn2+ in aerobic conditions undergoes oxidation
and hydrolysis reactions to precipitate in the form of Mn (oxy)hydroxide minerals
(Watzlaf et al., 2004). Mn2+ in AMD may be oxidized either to Mn+3 or Mn+4
through abiotic or bacterial processes. However, Mn2+ oxidation reactions are
highly pH dependent. The abiotic oxidation is very slow at the pH level below 8
(Hallberg et al., 2005). The biological oxidation of Mn2+ is limited to aerobic
conditions with a pH level greater than 6 (Nealson, 1983b). In addition, biological
oxidation of Mn2+ does not proceed rapidly in the presence of Fe2+, and thus no
significant Mn removal occurs where the concentration of Fe2+ exceeds 1 mg/l
(Nairn et al., 1993).
52
Mn removal in an aerobic environment occurs mainly through precipitation
of (oxy)hydroxides (e.g. MnO2 and MnOOH) and carbonates (e.g. MnCO3)
(Hedin et al., 1994). However, MnO2 solubility is highly pH dependent and it can
only precipitate from waters with pH values greater than 6 (Hedin et al., 1994).
MnCO3 can precipitate but only from alkaline waters (Watzlaf et al., 2004).
Moreover, the presence of a high Fe2+ concentration in an AMD inhibits the
precipitation of MnO2, and might dissolve what is already precipitated (Hedin et
al., 1994). In anaerobic conditions, Mn2+ oxidation is limited because of the lack
of oxidizing agents (O2 and Mn2+ oxidizing organisms). Thus, in anaerobic
conditions, Mn removal in the form of (oxy)hydroxides is insignificant (Watzlaf et
al., 2004). Because of their high solubility compared to other metal sulfides,
manganese sulfide minerals also do not form to a great extent in bioreactors until
the concentrations of the other metals become very low (Hallberg et al., 2005;
Gusek, 2002; Watzlaf et al., 2004). Therefore, Mn removal in anaerobic sulfate-
reducing bioreactors is often less efficient as compared to Fe and Al (Waybrant
et al., 2002).
Accordingly, the low Mn removal rate by the Tab-Simco anaerobic
bioreactor could be explained by the limitation in Mn2+ oxidation and the high
solubility of the potential manganese sulfide minerals. However, some Mn was
removed within the bioreactor possibly by (1) adsorption of Mn2+ onto the surface
of the substrate, (2) co-precipitation with Fe and Al hydroxides, and/or (3)
precipitation in the form of MnCO3.
53
Between the bioreactor outlet and the system outlet, despite aerobic
conditions and AMD pH levels above 6, no significant amount of Mn2+ was
removed from the AMD water. This could be due to the inhibition of the MnO2
precipitation process caused by high concentrations of Fe2+ or other metals in the
AMD.
Magnesium (Mg): In acid mine treatment systems, Mg can be considered
as a conservative ion and it’s concentration remains unaffected by treatment
processes (Hedin et al., 1994). This is because the potential solid precipitates of
Mg, such as magnesium sulfate (Epsom salt), MgSO4, magnesium hydroxide,
Mg(OH)2, magnesium carbonate (magnesite), MgCO3 and dolomite,
CaMg(CO3)2, are unlikely to form in the Mg concentrations and pH levels found in
AMD treatment systems (Hedin et al., 1994). Likewise, Mg concentration in the
Tab-Simco AMD did not show significant changes as the AMD passed through
the bioreactor. On average, the measured Mg mass rate that entered the Tab-
Simco bioreactor was 17.4 kg/day. The average calculated Mg removal rates
were 1.1 kg/day for the bioreactor and 2.7 kg/day for the entire treatment system
(Table 7a). These account for the removal of only 7.2% and 13.2% of the
received Mg mass rate, respectively.
Calcium (Ca) and Potassium (K): Unlike most other metals, Ca and K
concentration levels of the AMD increased within the bioreactor (Table 4 and Fig.
9c). On average, the mass rate of Ca that entered the bioreactor from the influent
was about 23 kg/day (Table 6b). After passing through the bioreactor, the mass
rate of Ca that left the bioreactor increased to 84 kg/day. The increase in the Ca
54
level was primarily attributed to limestone dissolution within the bioreactor. As the
AMD passed through the bioreactor, limestone dissolution released Ca2+ and
HCO3- to the AMD, increasing the Ca2+ concentration (Reaction 3.7). However,
Ca2+ can also be removed, to some extent, through precipitation of Ca2+
containing minerals such as gypsum (Neculita, 2008a; Blowes et al., 2003;
Willow et al., 2003). This was confirmed by the high gypsum saturation index, 24,
within the bioreactor. Also, some Ca2+ might have been added to the solution
from the organic substrate (Neculita, 2008a).
Despite the low K concentration in the Tab-Simco AMD, the mass rate of
K increased within the bioreactor. The average mass rate of K in the AMD that
reached and left the bioreactor was 0.21 and 0.35 kg/day, respectively (Table
6b). These results revealed a 60% increase in the mass rate of K. As the treated
water flowed between the bioreactor outlet and the system outlet, the K
concentration continued to increase. At the system outlet, the K mass rate was
increased to 0.42 kg/day.
Sodium (Na): Na flux in the AMD decreased by 20% as the AMD passed
through the bioreactor. The bioreactor received 2.5 kg/day of Na from the AMD
out of which the bioreactor removed 0.49 kg/day. One possible reason for the
decrease in Na concentration is the precipitation of Na containing minerals such
as natrojarosite, NaFe3(SO4)2(OH)6, which is frequently reported from AMD sites
(Blowes et al., 2003).

55
Table 6a: The performance of the Tab-Simco treatment system in removing, acidity, SO4
2- and metals
Ion Date Mass Rates (kg/day) Removal Rates (kg/d) Mass Removal %
Bio-In Bio-Out Sys-Out Bioreactor Ent. Syst Bioreactor Ent. Syst N
et A
cid
ity
12/1/08 156.45 3.05 2.68 153.40 153.77 98.05 98.29 1/22/09 163.61 8.51 6.62 155.10 156.99 94.80 95.96 3/12/09 212.11 6.74 0.71 205.37 211.40 96.82 99.67 4/30/09 404.87 44.62 10.59 360.25 394.28 88.98 97.38 7/30/09 405.66 15.93 5.32 389.73 400.34 96.07 98.69 9/23/09 201.24 21.73 -1.94 179.51 203.18 89.20 100.96
SO
42-
12/1/08 226.95 145.60 143.51 91.16 85.85 35.84 36.76 1/22/09 317.33 179.20 178.15 81.35 83.44 43.53 43.86 3/22/09 638.61 502.85 342.50 138.14 139.18 21.26 46.37 4/30/09 501.08 316.36 333.82 135.76 296.11 36.86 33.38 7/30/09 279.63 187.08 180.23 184.71 167.26 33.10 35.55 9/23/09 234.22 143.06 148.36 92.55 99.40 38.92 36.65
Fe
10/14/08 41.05 4.80 0.05 36.25 41.00 88.30 99.87 12/1/08 41.05 8.86 0.00 32.18 41.05 78.40 100.00 1/22/09 44.00 9.56 1.22 34.44 42.78 78.26 97.22 3/22/09 57.57 13.38 0.40 44.18 57.17 76.75 99.31 4/30/09 108.97 43.73 0.00 65.24 108.97 59.87 100.00 7/30/09 97.77 29.33 0.00 68.44 97.77 70.00 100.00 9/23/09 59.75 17.58 0.00 42.16 59.75 70.57 100.00
Al
10/14/08 8.67 0.00 0.00 8.67 8.67 99.99 99.99 12/1/08 8.87 0.05 0.00 8.82 8.75 99.42 98.64 1/22/09 8.71 0.02 0.35 8.69 8.36 99.77 95.98 3/22/09 11.01 0.00 0.00 11.01 10.83 100.00 98.35 4/30/09 23.39 0.00 0.30 23.39 23.10 100.00 98.73 7/30/09 25.62 0.67 0.72 24.95 24.90 97.40 97.18 9/23/09 10.15 1.07 0.00 9.08 10.15 89.45 100.00
Mn
10/14/08 2.01 1.81 1.73 0.198 0.280 9.86 13.94 12/1/08 2.02 1.83 1.37 0.185 0.645 9.16 31.93 1/22/09 2.33 2.04 2.29 0.290 0.040 12.46 1.72 3/22/09 3.11 2.38 2.62 0.731 0.482 23.53 15.52 4/30/09 6.95 6.87 5.75 0.086 1.202 1.23 17.28 7/30/09 6.36 4.27 4.38 2.092 1.974 32.91 31.04 9/23/09 2.96 2.47 1.59 0.487 1.363 16.47 46.09
Mg
10/14/08 10.12 10.14 9.10 -0.01 1.02 -0.14 10.10 12/1/08 10.73 8.24 9.68 2.49 1.05 23.21 9.79 1/22/09 11.08 11.66 10.24 -0.58 0.84 -5.26 7.60 3/22/09 14.36 11.75 11.92 2.61 2.43 18.16 16.96 4/30/09 31.56 32.34 22.72 -0.79 8.84 -2.49 28.02 7/30/09 28.35 24.99 24.99 3.36 3.36 11.84 11.84 9/23/09 15.41 14.60 14.17 0.81 1.24 5.23 8.04
Na
10/14/08 1.41 1.24 1.16 0.17 0.25 11.91 17.64 12/1/08 1.47 1.15 1.10 0.32 0.36 21.50 24.84 1/22/09 1.53 1.14 1.31 0.39 0.22 25.37 14.38 3/22/09 2.05 1.40 1.77 0.66 0.28 31.99 13.88 4/30/09 4.55 3.91 3.70 0.63 0.84 13.91 18.53 7/30/09 4.37 3.31 3.19 1.06 1.18 24.23 26.98 9/23/09 2.18 1.95 1.92 0.24 0.27 10.81 12.20

56
Table 6b: Dissolved Ca and K concentration increase at the Tab-Simco treatment system
Key: Bio-in = Bioreactor Inlet, Bio-Out = Bioreactor Outlet, and Sys-Out = System Outlet Sampling stations, Ent. Syst = Entire system.
7.3 Seasonal Variations in the Untreated AMD Chemistry and the Bioreactor
Performance
Variation in the chemistry of the untreated AMD: The chemical
characteristics of the Tab-Simco AMD through time are plotted in Figure 11. In
these graphs, most of the parameters (field parameters, acidity, SO42- and
metals) in the untreated AMD (Bio-In) display almost horizontal curves
throughout the study period. This illustrates that the chemical characteristics of
the untreated Tab-Simco AMD remained similar throughout the study period
without any noticeable seasonal variations.
Variations in the bioreactor performance: Previous studies reported
that the performance of anaerobic sulfate-reducing bioreactors decline
Ion Date Mass Rates (kg/day) Addition Rates
(kg/day) Mass Addition %
Bio-In
Bio-Out
Sys-Out Bioreactor Ent. Syst Bioreactor Ent.
Syst
Ca
10/14/08 12.33 49.05 37.05 36.713 24.713 297.67 200.37 12/1/08 12.70 42.22 49.19 29.520 36.487 232.38 287.23 1/22/09 13.34 54.56 55.70 41.217 42.351 308.87 317.37 3/12/09 20.78 64.71 50.67 43.933 29.893 211.41 143.85 4/30/09 48.89 175.92 114.07 127.033 65.184 259.86 133.34 7/30/09 35.18 134.50 126.82 99.322 91.639 282.30 260.46 9/23/09 15.33 66.10 54.37 50.763 39.034 331.07 254.57
K
10/14/08 0.14 0.21 0.33 0.073 0.195 52.32 140.07 12/1/08 0.15 0.20 0.22 0.055 0.074 37.38 50.22 1/22/09 0.14 0.21 0.29 0.066 0.145 46.55 102.60 3/22/09 0.16 0.23 0.27 0.070 0.113 44.48 72.06 4/30/09 0.26 0.58 0.63 0.320 0.364 121.48 138.37 7/30/09 0.37 0.71 0.75 0.336 0.376 90.72 101.74 9/23/09 0.24 0.31 0.43 0.063 0.181 25.74 74.26

57
significantly at low temperature conditions, which negatively affect the activities
of SRB (Tucker et al., 1998; Benner et al., 2002; Doshi, 2006; Neculita, 2007;
Tsukamoto et al., 2004). The low temperature inhibits the activities of SRB,
leading to a decrease in BSR, which in turn causes a decline in the bioreactor
treatment efficiency.
Results from this study indicate that the removal rates of the acidity,
dissolved SO42-, and metals, by the Tab-Simco bioreactor, were higher during the
spring and summer compared to the fall and winter (Table 6a). The
concentrations of different parameters (acidity, dissolved metals and sulfate) in
the effluent were more or less the same during the study period (Figure 11)
However, the flow rate of the AMD that enters the Tab-Simco bioreactor was
higher during spring and winter than its values during fall and winter (Table 2).
Consequently, when the removal rates of the parameters were calculated, by
multiplying the differences in the concentrations of each parameter in the influent
and effluent by the corresponding flow rates, higher removal rates for acidity,
dissolved metals and sulfate were obtained during spring and summer compared
to winter and fall (Table 6a).
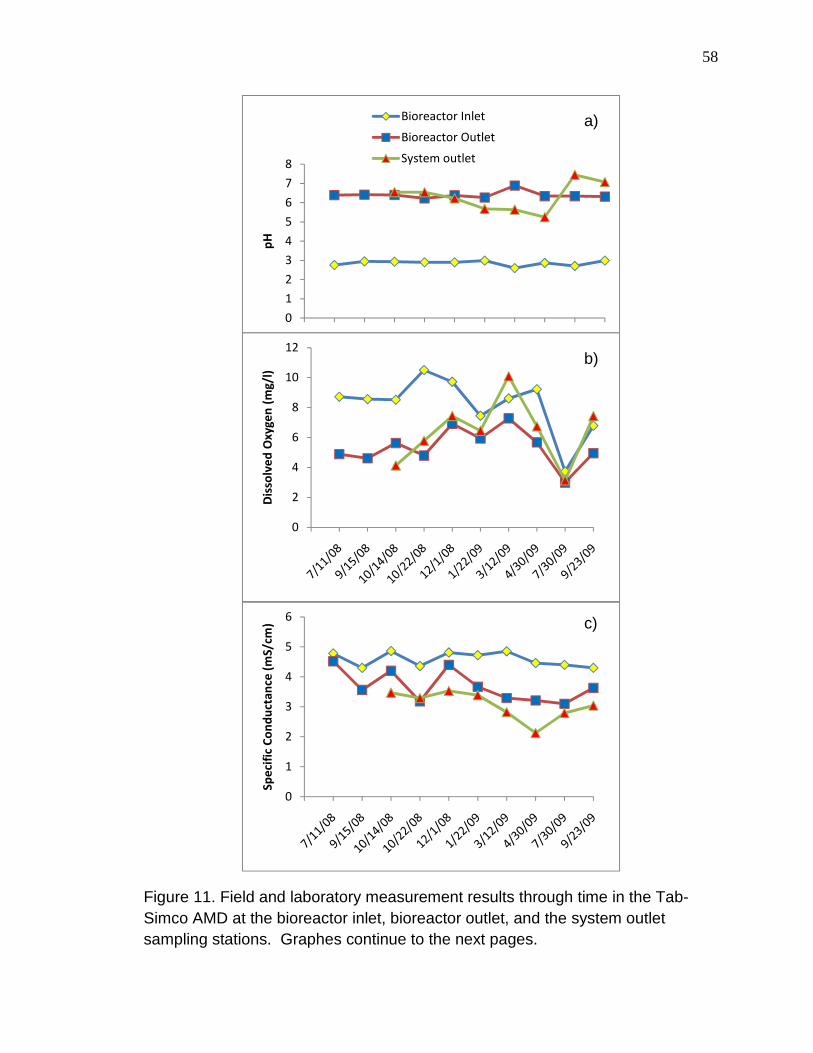
58
Figure 11. Field and laboratory measurement results through time in the Tab-Simco AMD at the bioreactor inlet, bioreactor outlet, and the system outlet sampling stations. Graphes continue to the next pages.
0
1
2
3
4
5
6
7
8
pH
Bioreactor Inlet
Bioreactor Outlet
System outlet
0
2
4
6
8
10
12
Dis
solv
ed
Ox
yg
en
(m
g/l
)
0
1
2
3
4
5
6
Sp
eci
fic
Co
nd
uct
an
ce (
mS
/cm
)
a)
b)
c)

59
Figure 11 (Continued) (Caption shown on the previous page).
0
500
1000
1500
2000
2500
3000
3500
Aci
dit
y (
mg
/l a
s C
aC
O3
eq
.)
Bioreactor Inlet
Bioreactor Outlet
System Outlet
0
50
100
150
200
250
300
350
400
Alk
ali
nit
y (
mg
/l a
s C
aC
O3
eq
.)
-500
0
500
1000
1500
2000
2500
3000
3500
Ne
t A
cid
ity
(m
g/l
as
Ca
CO
3 e
q.)
e)
d)
f)
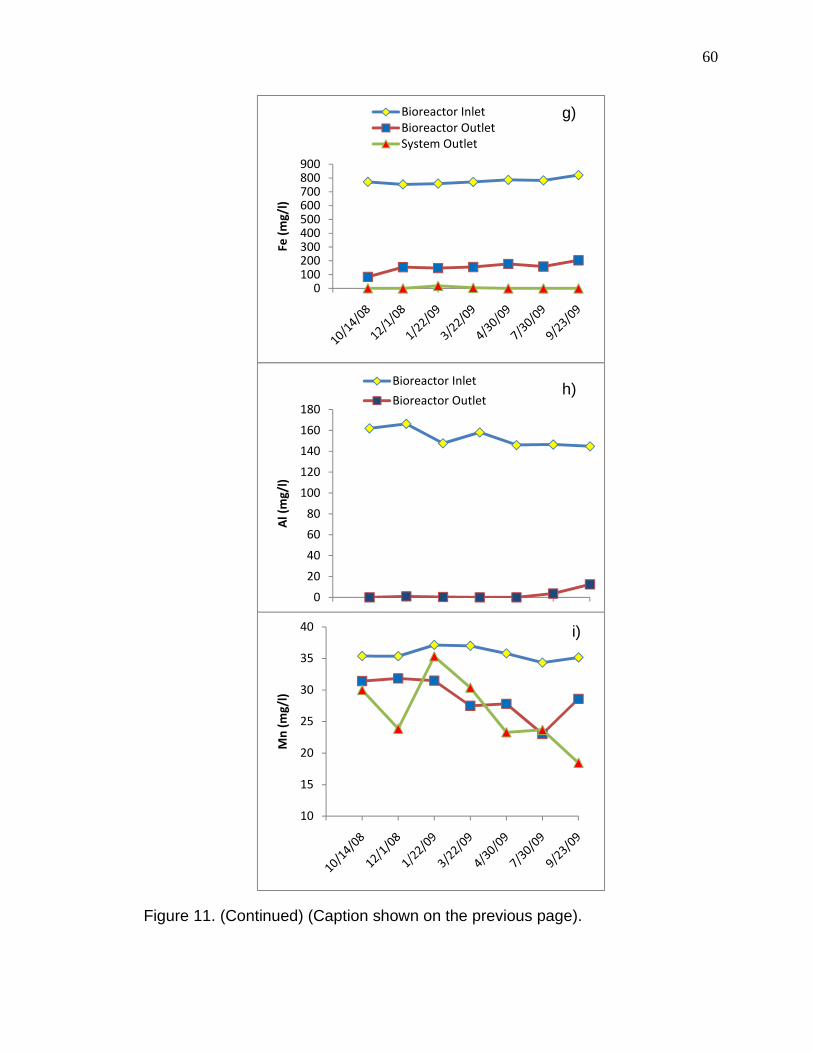
60
Figure 11. (Continued) (Caption shown on the previous page).
0100200300400500600700800900
Fe
(m
g/l
)
Bioreactor Inlet
Bioreactor Outlet
System Outlet
0
20
40
60
80
100
120
140
160
180
Al
(mg
/l)
Bioreactor Inlet
Bioreactor Outlet
10
15
20
25
30
35
40
Mn
(m
g/l
)
h)
g)
i)
61
Figure 11. (Continued) (Caption shown on the previous page).
0
100
200
300
400
500
600
700
800
900
1000
Ca
(m
g/l
)
0
50
100
150
200
250
Mg
(m
g/l
)
0
5
10
15
20
25
30
Na
(m
g/l
)
l)
k)
j)
62
Figure 11. (Continued) (Caption shown on the previous page).
7.4 Alkalinity Production in the Tab-Simco Bioreactor
In the Tab-Simco anaerobic sulfate-reducing bioreactor, alkalinity can be
produced by two main processes: (1) the BSR and (2) limestone dissolution. The
alkalinity production by BSR can be estimated using the decrease in dissolved
SO42- concentration as the AMD passes through the bioreactor (Barton et al.,
1999). The alkalinity produced from limestone dissolution can be determined by
1
2
3
4
5
6
7
K (
mg
/l)
Bioreactor Inlet
Bioreactor Outlet
System Outlet
0
500
1000
1500
2000
2500
3000
3500
4000
4500
Su
lfa
te (
mg
/l)
n)
m)
63
measuring the increase in Ca2+ concentration as the AMD passes through the
bioreactor (Hedin et al., 1994; Barton et al., 1999).
In anaerobic sulfate-reducing bioreactors, BSR is considered to be the
dominant process that decreases the amount of SO42- concentrations (Barton et
al., 1999; Riefler, 2008). To estimate the amount of alkalinity produced by BSR, it
was assumed that the decrease in SO42- concentration within the Tab-Simco
bioreactor was exclusively due to BSR. The decrease in the SO42- concentration,
as the AMD passed through the bioreactor, was then used to estimate the total
amount of alkalinity produced by BSR. The calculated rates of alkalinity
production by BSR are given in Table 7. Calculations indicated the bioreactor
produced an average of 147.3 kg/day of alkalinity from the BSR (Table 7).
On the other hand, limestone dissolution is the primary process that
increases the Ca2+ concentration of AMD in sulfate-reducing bioreactors. To
assess alkalinity production from limestone dissolution, the increase in the Ca2+
concentration within the bioreactor was considered to be caused solely by
limestone dissolution. The Ca2+ concentration differences between the influent
and effluent were then used to determine the amount of alkalinity produced from
the limestone dissolution. The calculated results indicate that limestone
dissolution in the Tab-Simco bioreactor produced on average about 99.6 kg/day
of HCO3- (Table 7).
In the above calculations, the decrease in SO42- and increase in the Ca2+
concentrations were assumed to be only from the BSR and limestone dissolution,
respectively. However, minor addition or removal of SO42- and Ca2+ could occur

64
Table 7: Alkalinity production rates (kg/day) at the Tab-Simco bioreactor
Date
Alkalinity from Limestone Dissolution
Alkalinity from Bacterial Sulfate Reduction (BSR)
Total Alkalinity from limestone Diss. and BSR
Total Alkalinity Determined using Net Acidity Removal Rate
12/1/08 45.02 115.85 160.86 153.40 1/22/09 62.86 103.38 166.23 155.10 3/22/09 67.00 175.55 242.55 205.37 4/30/09 193.73 172.52 366.25 360.25 7/30/09 151.47 234.74 386.21 389.73 9/23/09 77.41 81.67 159.09 179.51 Average 99.58 147.29 246.87 240.56
from other processes that take place within the bioreactor. For example SO42-
and Ca2+ can be removed in the form of insoluble minerals (Blowes et al., 2003;
Thomas et al., 2002b), or might be added from the organic substrate (Neculita,
2008a), or from dissolution of already precipitated minerals. To check the
accuracy of the alkalinity production rates from the above calculations, the sum
of the alkalinity production rates (from BSR and limestone dissolution) was
compared with the total alkalinity production rate for the bioreactor measured
using other independent method. The total alkalinity production rate of the
bioreactor was determined independently from the net acidity removal rate within
the bioreactor. Using this method, the total alkalinity production rate in the Tab-
Simco bioreactor was 241 kg/day as CaCO3 equivalent (Table 7). Comparison of
the sum of the alkalinity production rates from the BSR and limestone dissolution
(247 kg/day), with the total alkalinity production rate determined from the net
acidity removal rate (241 kg/day), shows that the total alkalinity production rate
values determined by the two different approaches are very close to each other.
65
7.5 Limestone Dissolution and Bioreactor Longevity
Determining the limestone dissolution rate in a bioreactor could be helpful
in estimating the amount of time before the limestone is dissolved completely,
which thereby estimates the lifetime of the bioreactor. However, the lifetime of a
bioreactor is affected by different factors, including the limitation of organic
matter, hydraulic retention, changes in the chemistry and flow rate of the AMD,
and hydraulic properties of the reactive mixture (such as clogging, armoring and
compaction of the substrate) (Neculita et al., 2008a). According to Lewis (2008),
about 1,500 tons (1,500,000 kg) of limestone was used in the construction of the
Tab-Simco bioreactor. Considering the average limestone dissolution rate for the
Tab-Simco bioreactor, which was 99.58 kg/day, it would take about 25 years for
the limestone within the bioreactor to dissolve completely. However, previous
studies have shown that complete limestone dissolution is not attainable because
of armoring effects on the limestone by precipitated materials such as Al(OH)3,
Fe(OH)3 and CaSO4.2H2O (Kalin et al., 2005; Ziemkiewicz,1997).
7.6 Source(s) of the Sulfide Minerals That Cause the Tab-Simco AMD
Identifying the source of AMD could be very important in preventing AMD
formation and predicting the amount of AMD to be produced. The source of AMD
can be investigated by studying the sulfur isotope values of dissolved SO42- in an
AMD, and relating it with sulfur isotope values of sulfide minerals at the site. The
oxidation of sulfide minerals to form SO42- is accompanied by minor or no sulfur
isotopic fractionation (Taylor et al., 1994; Taylor et al., 1984a; Toran et al., 1989).
Therefore, if the oxidation of sulfide minerals had been the only reason for the
66
formation of sulfate in AMD, a close correspondence between the sulfur isotopic
values of dissolved SO42- in the AMD and the sulfide minerals would be expected
(Knoller et al, 2004).
Sulfur isotope values of dissolved SO42- in the Tab-Simco AMD site for this
study period are given in Table 5. Results from sampling stations, well B-1, well
B-2 and the main seep, indicated that on average, the δ34S value of the Tab-
Simco dissolved SO42- was 7.3 ‰ before it entered the treatment system. The
source of the sulfide minerals that cause the AMD at the Tab-Simco site can be
the coal seams and/or the shale layer at the site. Recently, Lefticariu et al. (2009)
studied the sulfur isotope values of pyrite minerals in the Murphysboro and
Mount Rorah coal seams in the surroundings of the Tab-Simco site. The study
reported average δ34S values of 6.2‰ and 10.6‰ for pyrite in the Mount Rorah
and Murphysboro coal seams, respectively.
Comparisons between the average δ34S value of the dissolved SO42- and
the δ34S values of the pyrite in the Murphysboro and Mount Rorah coal seams
indicated that the δ34S value of the dissolved SO42- was between the δ34S values
of pyrites from the two coal seams. This suggests that the cause for the Tab-
Simco AMD was likely the oxidation of pyrite minerals both from the Murphysboro
and Mount Rorah coal seams that occur at the site.
67
8. CONCLUSIONS AND RECOMMENDATIONS
8.1 Conclusions
1. The Tab-Simco AMD is highly contaminated water with average
concentrations of acidity, 3,386 mg/l, dissolved SO42- 4,589 mg/l, Fe 884 mg/l,
Al 207 mg/l, Mn 34.5 mg/l and a pH level of 2.80 as the AMD reached the
surface at the main seep sampling station.
2. The chemical characteristics of the Tab-Simco AMD showed slight variations
as it flowed down gradient from the underground acid mine pool to the
bioreactor. Between the acid mine pool and the main seep sampling stations,
the concentrations of acidity, SO42-, and most metals increased, and pH
decreased slightly, indicating the possible presence of a sulfide mineral
oxidation process and/or mixing of AMD from different acid mine pools. As the
AMD flowed between the main seep and the bioreactor inlet sampling
stations, slight improvement in water quality was observed. Acidity, SO42- and
most metal concentrations decreased slightly. Possible processes that
caused the water quality changes in this part of the AMD system would be the
mixing of the AMD with fresh water and / or precipitation in the form of metal
(oxy)hydroxides and hydroxysulfates.
3. On average, the Tab-Simco treatment system removed 253 kg/day (98.5 %)
of acidity, 145 kg/day (39%) of SO42-, 64 kg/day (99.5%) of Fe, 13.5 kg/day
(98%) of Al, 0.86 kg/day (22.5%) of Mn. The pH of the AMD that entered the
bioreactor was increased from an average of 2.86 to 6.30. Measured
concentrations in the discharge at the Tab-Simco site indicated that the

68
treatment system successfully removed the acidity and most metals from the
AMD. However, the concentrations of Mn (26.4 mg/l) and SO42- (2,021 mg/l) in
the discharge were still elevated.
4. Treatment processes in the Tab-Simco bioreactor include production of
alkalinity through BSR, and limestone dissolution followed by metal
precipitation. The produced alkalinity neutralized the acidity, bringing it to
lower levels and increasing the pH of the water. The BSR also decreased the
SO42- concentration in the AMD. Upon pH increase, a metal in the AMD
precipitated mainly in the form of metal sulfides, oxides, and possibly
carbonate and hydroxysulfates. The existence of BSR within the bioreactor
was confirmed by an increase in δ34S values, a decrease in SO42-
concentration in the effluent, a strong H2S smell at the bioreactor outlet, and
an observation of black sulfide minerals coming out with the effluent. The
existence of limestone dissolution, on the other hand, was indicated by an
increase in Ca concentration in the effluent.
5. In the Tab-Simco bioreactor, alkalinity production was by BSR processes and
limestone dissolution. An attempt to determine the proportion of alkalinity
contributed by each process using the decrease in SO42- concentration and
increase in Ca concentration within the bioreactor indicated that in the Tab-
Simco bioreactor produced on average about 247 kg/day of alkalinity as
CaCO3 equivalent. Out of this, the 147.3 kg/day, 60% of the total alkalinity,
was produced by the BSR processes, whereas the remaining 99.6 kg/day
(40% of the total alkalinity) was produced from limestone dissolution.
69
6. A study for possible seasonal variations in the chemical characteristics of the
untreated Tab-Simco AMD indicated that the chemical characteristics of the
untreated Tab-Simco AMD measured at the bioreactor inlet sampling station
was similar throughout the study period, indicating no significant seasonal
variations in the untreated AMD existed. On the other hand, the bioreactor
performance results indicated that the Tab-Simco bioreactor removed greater
amount of acidity, SO42- and metal during spring and summer compared to
winter and fall.
7. Comparison of the δ34S value of dissolved SO42- in the Tab-Simco AMD with
δ34S values of pyrite minerals at the area indicated that the values are similar,
suggesting that oxidation of pyrite minerals in Murphysboro and Mount Rorah
coal seams was the most probable cause of the Tab-Simco AMD.
8.2 Recommendations
1. To avoid environmental impacts from high concentrations of Mn and SO42-,
the Tab-Simco treatment system could be amended to decrease the
concentrations of these ions to acceptable levels. For example, the treated
water that leaves the bioreactor could flow through a limestone bed
inoculated with Mn-oxidizing bacteria to facilitate the Mn oxidation and
precipitation by further increasing the pH level and introducing Mn-oxizing
bacteria (Rose et al., 2003). To facilitate a higher removal rate of SO42-, either
the thickness of the organic layer or the surface area of the bioreactor can be
increased. Increasing the thickness or surface area of the organic layer would
increase BSR process resulting to a higher SO42- removal rate which would

70
increase alkalinity production and pH level. An increase in pH level would in
turn increase the Mn removal rate.
2. Further study that involves solid phase analyses and biological diversity
should be undertaken to assess the conditions within the bioreactor, such as
depletion of organic matter and, armoring and clogging of substrate material
by precipitated metal oxides, which might affect its success rate and
longevity. Identifying the mineralogy of the precipitates within the bioreactor
using solid phase analyses is very helpful to understand the removal
mechanisms and the geochemical conditions inside the bioreactor.
Understanding the conditions inside the bioreactor in turn can be helpful in
amending the bioreactor in a way that can increase its longevity and
performance.
3. Periodic flushing of the bioreactor is also helpful in removing precipitates that
can cause clogging of the substrate and pipelines within the bioreactor.
4. Finally, additional stable isotope (sulfur and oxygen) and mineralogical study
of the sulfide minerals at the site is needed to identify the exact source and
amount of the AMD causing sulfide minerals. Because identifying the source
of the AMD causing sulfide minerals could be helpful in predicting and
protecting the AMD formation.
71
REFERENCES
1. American Public Health Association, 1998b. Alkalinity (2320)/ Titration
method, 20th ed. In: Clesceri, L.S., Greenberg, A.E., Eaton, A.D. (Eds.),
Standard Methods for the Examination of Water and Wastewater American
Public Health Association, Washington, DC, 2.26-2.29.
2. Appalachian Regional Commission, 1973. The Economic Impact of Public
Policy in the Appalachia Coal Industry and the Regional Economy. Charles
River Associates, Inc.
3. Barton, C.D., Karathanasis, A.D., 1999. Renovation of a failed constructed
wetland treating acid mine drainage. Environ Geol. 39, 39-50.
4. Benner, S.G., Blowes, D.W., Ptacek, C.J., Mayer, K.U., 2002. Rates of sulfate
reduction and metal sulfide precipitation in a permeable reactive barrier. Appl
Geoch. 17, 301-320.
5. Berghorn, G.H., G.R. Hunzeker., 2001. Passive treatment alternatives for
remediation abandoned-mine drainage. John Wiley & Sons, New York. 111-
127.
6. Bigham, J. M., Nordstrom, D. K., 2000. Iron and aluminum hydroxysulfates
from acid sulfate waters. In Sulfate Minerals- Crystallography, Geochemistry,
and Environmental Significance, Rev. Min. Geochem. (eds. C. N. Alpers, J. L.
Jambor and D. K. Nordstrom). Min. Soc. of Am., 40, 352-403.
7. Blowes, D.W., Ptacek, C.J., Jambor, J.L., Weisener, C.G., 2003. The
geochemistry of acid mine drainage. In: Lollar, B.S. (Ed.), Treatise on
72
Geochemistry 9 (Holland, H.D., Turekian, K.K., Exec. Eds.), Environ.
Geochem. Elsevier, 149-204.
8. Bonnissel-Gissinger, P., Alnot, M., Ehrhardt, J., Behra, P., 1998. Surface
Oxidation of Pyrite as a Function of pH. Environmental Science and Technol.
32, 2839-2845.
9. Brown, M., Barley, B., Wood, H., 2002. Mine water treatment. In M. Brown, B.
Barley, and H.Wood (ed.). The mine water problem. IWA Pub. Alliance
House, London. 1-31.
10. Bruchert, V., Knoblauch, C., Jørgensen, B. B., 2001. Controls on stable sulfur
isotope fractionation during bacterial sulfate reduction in Arctic sediments.
Geochim. Cosmochim. Acta 65, 763-776.
11. Craig, H., 1957. Isotopic standards for carbon and oxygen and correction
factors for mass-spectrometric analysis of carbon dioxide. Geochim.
Cosmochim. Acta, 12:133-149.
12. Doshi, S.M., 2006. Bioremediation of acid mine drainage using sulfate-
reducing bacteria. U.S. Environmental Protection Agency, Office of Solid
Waste and Emergency Response and Office of Superfund Remediation and
Technology Innovation, 65.
13. Drever, J.I., 1997. The Geochemistry of Natural Waters-Surface and
Groundwater Environments, third ed. Prentice-Hall Inc., Englewood Cliffs, NJ.
14. EPA, 2005. Management and Treatment of Water from Hard-Rock Mines.
Draft Engineering Issue.
73
15. Garrels, R.M., Thompson, M.E., 1960. Oxidation of pyrite by iron sulfate
solutions. Am. J. Sci. 258A, 57-67.
16. Gibert, O., de Pablo, J., Cortina, J.L., Ayora, C., 2005a. Sorption studies of
Zn(II) and Cu(II) onto vegetal compost used on reactive mixtures for in situ
treatment of acid mine drainage. Water Res. 39:2827-2838.
17. Gray, N. F., 1998. Acid mine drainage composition and the implications for its
impact on lotic systems. Water Res. 32(7), 2122-2134.
18. Gusek, J.J., 2004. Scaling up design challenges for large scale sulfate
reducing bioreactors. In: Proceedings of the 2004 National Meeting of the
American Society of Mining and Reclamation and the 25th West Virginia
Surface Mine Drainage Task Force. Morgantown, WV. 752 - 765.
19. Hallberg, K.B., Johnson, D.B., 2005. Biological manganese removal from acid
mine drainage in constructed wetlands and prototype bioreactors. Sci. Total
Environ. 338, 115-124.
20. Hedin, R.S., Nairn, R.W., Kleinmann, R.L.P., 1994. Passive treatment of coal
mine drainage. US, Bureau of Mines Information. Circular 9388, Pittsburgh,
PA.
21. Kalin, M., Fyson, A., Wheeler, W.N., 2005. The chemistry of conventional and
alternative treatment systems for the neutralization of acid mine drainage. Sci.
Total Environ. 366, 395-408.
22. Knoller, K., Fauville, A., Mayer, B., Strauch, G., Friese, K., Veizer, J., 2004.
Sulfur cycling in an acid mining lake and its vicinity in Lusatia, Germany.
Chem. Geol. 204, 303-323.
74
23. Kuyucak, N., Chabot, F., Martschuk, J., 2006. Successful implementation and
operation of a passive treatment system in an extremely cold climate,
northern Quebec, Canada. In: Barnhisel, R.I. (Ed.), Proc. 7th Internat. Conf.
Acid Rock Drainage (ICARD), American Society of Mining and Reclamation
(ASMR), 38, 3131-3138.
24. Lefticariu, L., Rahman, M.W., Singh R., 2009. Distribution and mode of
occurrence of mercury and sulfur in Illinois coal. Proceedings to the 26th
Annual International Pittsburgh Coal Conference, 10.
25. Lewis, L.L., 2008. Addressing acid mine drainage from complex conditions at
the Tab-Simco mine. Presented at the 30th annual National Association of
Abandoned Mines Land Programs Conference, Curango Colorado.
26. McCauley, C.A., O’Sullivan, A.D., Milke, M.W., Weber, P.A., Trumm, D.A.,
2009. Sulfate and metal removal in bioreactors treating acid mine drainage
dominated with iron and aluminum. Water Rer. 43, 961-970.
27. Nairn, B., Hedin, R.S., 1993. Contaminant removal capabilities of wetlands
constructed to treat coal mine drainage. In: Moshiri GA, editor. Constructed
Wetlands for Water Quality Improvement. Boca Raton (FL)7 Lewis Publ. 187-
95.
28. Nealson, K H. 1983b. The Microbial Manganese Cycle. Microbial
Geochemistry. W. E. Krumbein, Ed. Boston, MA: Blackwell Scientific. 159-
190.
75
29. Neculita, C.M., Zagury, G.J., Bussière, B., 2007. Passive treatment of acid
mine drainage in bioreactors using sulfate-reducing bacteria: critical review
and research needs. J. Environ. Qual. 36, 1-16.
30. Neculita, C.M., Zagury, G.J., Bussière, B., 2008a. Effectiveness of sulfate-
reducing passive bioreactors for treatment of a highly contaminated acid mine
drainage: I. Effect of hydraulic retention time. Appl. Geochem. 23(12), 3442-
3451.
31. Neculita, C.M., Zagury, G.J., Bussière, B., 2008b. Effectiveness of sulfate-
reducing passive bioreactors for treatment of highly contaminated acid mine
drainage: II. Metal removal mechanisms and potential mobility. Appl.
Geochem. 23 (12), 3545-3560.
32. Neculita, C.M., Zagury, G.J., Kulnieks, V., 2006. Short-term and long-term
bioreactors for acid mine drainage treatment. In: Proc. 22nd Conf. Soils,
Sediments and Water. Amherst, University of Massachusetts, MA.
33. Nordstrom D. K., 1982. Aqueous pyrite oxidation and the consequent
formation of secondary iron minerals. In Acid Sulfate Weathering (eds. J. A.
Kittrick, D. F. Fanning, and L. R. Hossner). Soil Sci. Soc. Am. Spec. Publ. 10,
37-56.
34. Ohmoto, H., Goldhaber, M., 1997. Sulfur and carbon isotopes. In Geoch of
Hydrothermal Ore Deposits Edited by: Barnes HL. John Wiley & Sons, New
York, 517-611.

76
35. Patric Engineering, Inc., 1998. Site Investigation report for Tab-Simco West
site, and the Ingram Hill-Bankston Creek site. Prepared for: Illinois
Department of Natural Resources, Office of Mines and Minerals.
36. Perez-Lopez, R., Neito, J.M., de Almodovar, G.R., 2007b. Immobilization of
toxic elements in mine residues derived from the mining activities in the
Iberian Pyrite Belt (SW Spain): laboratory experiments. Appl. Geochem. 22,
1919-1935.
37. Riefler, G.R., Krohn, J., Stuart, B., Socotch, C., 2008. Role of sulfur-reducing
bacteria in a wetland system treating acid mine drainage. Sci. Total Environ.
394, issues 2-3, 207-390.
38. Rimstidt, J.D., Vaughan D. J., 2003. Pyrite oxidation: A state-of-the-art
assessment of the reaction mechanism. Geochim. Cosmochim. Acta 67, 873-
880.
39. Rose, A.W., Cravotta, C.A., III, 1998. Geochemistry of Coal Mine Drainage.
Chapter 1 in Coal Mine Drainage Prediction and Pollution Prevention in
Pennsylvania. Edited by: K.B.C. Brady, M.W. Smith and J. Schueck,
Department of Environmental Protection: Harrisburg, PA. 1-1 to 1-22.
40. Rose, A.W., Means, B., Shah, P.J., 2003. Methods for passive removal of
manganese from acid mine drainage. In: West Virginia Mine Drainage Task
Force Symposium Papers. Available from: www.wvmdtaskforce.com.
41. Seal R. R. II. 2003. Stable-isotope geochemistry of mine waters and related
solids. In: Environmental Aspects of Mine Wastes (eds. J. L. Jambor, D. W.
Blowes, and A. I. M. Ritchie). Mineral. Assoc. Short Course 31, 303-334.
77
42. Singer, P.C., Stumm, W., 1970. Acidic mine drainage: the rate-determining
step. Science 167, 1121-1123.
43. Skousen, J., Ziemkiewicz, P., 2005. Performance of 116 passive treatment
systems for acid mine drainage. In: Proceedings, National Meeting of the
American Society of Mining and Reclamation.
44. Smith, P.A., 2002. Characterization of an acid mine drainage site in Southern
Illinois. Presented at the 2002 National Meeting of the American Society of
Mining and Reclamation, Lexington, KY. Published by ASMR, 3134
Montavesta Rd., Lexington, KY 40502.
45. Stumm, W., Morgan, J.J., 1996. Aquatic Chemistry. Willey-Interscience, 470.
46. Taylor, B.E., Wheeler, M.C., 1994. Sulfur- and oxygen-isotope geochemistry
of acid mine drainage in the western United States. In: Alpers, C.N., Blowes,
D.W. (Eds.), Environmental Geochemistry of Sulfide Oxidation. American
Chemical Society, Symposium Series 550, 481- 514.
47. Taylor, B.E., Wheeler, M.C., Nordstrom, D.K., 1984a. Stable isotope
geochemistry of acid mine drainage: experimental oxidation of pyrite.
Geochim. Cosmochim. Acta. 48, 2669-2678.
48. Thomas, R.C., Romanek, C.S., 2002b. Passive treatment of low-pH, ferric-
iron dominated acid rock drainage in a vertical flow wetland II: metal removal.
In: Proceedings of the 2002 National Meeting of the American Society of
Mining and Reclamation. Lexington, KY, 753-775.

78
49. Toran, L., Harris, R.F., 1989. Interpretation of sulfur and oxygen isotopes in
biological and abiological sulfide oxidation. Geochim. Cosmochim. Acta. 53,
2341-2348.
50. Tsukamoto, T.K., Killion, H.A., Miller, G.C., 2004. Column experiments for
microbiological treatment of acid mine drainage: Low-temperature, low-pH
and matrix investigations. Water Res. 38, 1405-1418.
51. Tucker, M.D., Barton, L.L., Thomson, B.M., 1998. Reduction of Cr, Mo, Se
and U by desulfovibrio desulfuricans immobilized in polyacrylamide gels. J Ind
Microbiol Biotechnol. 20, 13-9.
52. U.S. EPA, 1995. Streams with fisheries impacted by acid mine drainage in
Maryland, Ohio, Pennsylvania, Virginia and West Virginia. U.S. EPA,
Philadelphia, PA.
53. Watzlaf, G., Schroeder, K., Kleinmann, R., Kairies, C., Nairn, R., 2004. The
Passive Treatment of Coal Mine Drainage. National Energy Technology
Laboratory. US Department of Energy. Information circular.
54. Waybrant, K.R., Ptacek, C.J., Blowes, D.W., 2002. Treatment of mine
drainage using permeable reactive barriers: column experiments. Environ.
Sci. Technol. 36, 1349-1356.
55. Webb, J.S., McGuinnes, S., Lappin-Scott, H.M., 1998. Metal removal by
sulphate-reducing bacteria from natural and constructed wetlands. J Appl
Microbiol. 84, 240-8
79
56. Willow, M.A., Cohen, R.R.H., 2003. pH, dissolved oxygen, and adsorption
effects on metal removal in anaerobic bioreactors. J. Environ. Qual. 32, 1212-
1221.
57. Zagury, G.J., Colombano, S.M., Narasiah, K.S., Ballivy, G., 1997.
Neutralization of acid mine tailings by addition of alkaline sludge from pulp
and paper industry. Environ. Technol. 18, 959-973.
58. Zaluski, M.H., Trudnowski, J.M., Harrington-Baker, M.A., Bless, D.R., 2003.
Post-mortem findings on the performance of engineered SRB field bioreactors
for acid mine drainage control. In: Proc. 6th Internat. Conf. Acid Rock
Drainage. Cairns, QLD, 845-853.
59. Ziemkiewicz, P.F., Skousen, J.G., Simmons, J., 2003. Long-term
performance of passive acid mine drainage treatment systems. Mine Water
and the Environment. 22, 118-129 © IMWA Springer-Verlag.
60. Ziemkiewicz, P.F., Skousen, J.G., Brant, D.L., Sterner, P.L., Lovett, R.J.,
1997. Acid Mine Drainage Treatment with Armored Limestone in Open
Limestone Channels. J. Environ. Qual. 26, 1017-1024.

80
APPENDICES
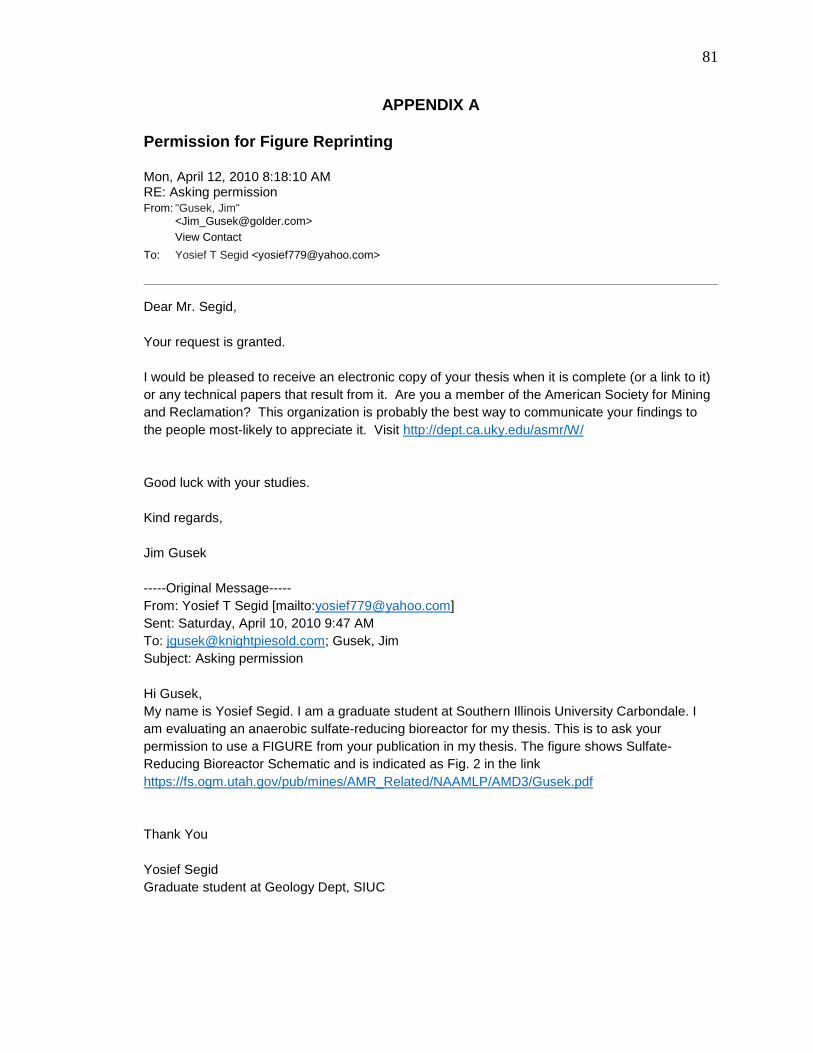
81
APPENDIX A
Permission for Figure Reprinting
Mon, April 12, 2010 8:18:10 AM RE: Asking permission From: "Gusek, Jim"
<[email protected]> View Contact
To: Yosief T Segid <[email protected]>
Dear Mr. Segid, Your request is granted. I would be pleased to receive an electronic copy of your thesis when it is complete (or a link to it) or any technical papers that result from it. Are you a member of the American Society for Mining and Reclamation? This organization is probably the best way to communicate your findings to the people most-likely to appreciate it. Visit http://dept.ca.uky.edu/asmr/W/ Good luck with your studies. Kind regards, Jim Gusek -----Original Message----- From: Yosief T Segid [mailto:[email protected]] Sent: Saturday, April 10, 2010 9:47 AM To: [email protected]; Gusek, Jim Subject: Asking permission Hi Gusek, My name is Yosief Segid. I am a graduate student at Southern Illinois University Carbondale. I am evaluating an anaerobic sulfate-reducing bioreactor for my thesis. This is to ask your permission to use a FIGURE from your publication in my thesis. The figure shows Sulfate-Reducing Bioreactor Schematic and is indicated as Fig. 2 in the link https://fs.ogm.utah.gov/pub/mines/AMR_Related/NAAMLP/AMD3/Gusek.pdf Thank You Yosief Segid Graduate student at Geology Dept, SIUC

82
VITA
Graduate School Southern Illinois University
Yosief T. Segid Date of Birth: February 16, 1976 115 Forest Ave, Carbondale, Illinois 62901 Yosief T Segid C/O Simret Hagos, P.O.Box 8823, Fort Worth, TX, 76124 [email protected] University of Asmara, Asmara, Eritrea Bachelor of Science, Geology, July 2001 Thesis Title: Evaluation of the Tab-Simco Acid Mine Drainage Treatment
System: Water Chemistry, Performance and Treatment Processes Major Professor: Liliana Lefticariu


![Electrostatic Effects on Particle Mobility [Read-Only] · PDF fileElectrostatic Effects on Particle Mobility Mark E. Hogsett Technology Group Simco-Ion mhogsett@simco-ion.com](https://img.pdfslide.us/doc/110x75/5a9db4b47f8b9a42488c726d/electrostatic-effects-on-particle-mobility-read-only-effects-on-particle-mobility.jpg)