Embed Size (px)
Citation preview
EVALUATION OF THE RISKS ASSOCIATED WITH THE USE OF ROOFTOP RAINWATER HARVESTING AND GROUNDWATER
FOR DOMESTIC USE AND LIVESTOCK WATERING
(VOLUME 2) Chemical Quality of Groundwater
For Potable Use and Livestock Watering
Report to the WATER RESEARCH COMMISSION
and
DEPARTMENT OF AGRICULTURE, FORESTRY AND FISHERIES
Edited by NH Casey1, L Korsten2 and L Chidamba2
University of Pretoria
1Department of Animal and Wildlife Sciences 2Department of Plant and Soil Sciences
WRC Report No. 2175/2/16
ISBN 978-1-4312-0875-3
December 2016
ii
Obtainable from Water Research Commission Private Bag X03 Gezina, 0031 [email protected] or download from www.wrc.org.za
DISCLAIMER
This report has been reviewed by the Water Research Commission (WRC) and approved for publication. Approval does not signify that the contents necessarily reflect the views
and policies of the WRC nor does mention of trade names or commercial products constitute endorsement or recommendation for use.
© Water Research Commission
iii
EXECUTIVE SUMMARY Background Water quality constituents (WQC) may be inorganic and organic chemicals, which occur either as natural features of all water sources, or as a result of non-natural features related to anthropogenic activities. This report deals with the potential risk to consumers associated with the ingestion of inorganic WQC that may either be of natural or non-natural origins. In the event of naturally occurring inorganic chemicals, the ranges and concentrations vary according to the nature of the geological and rainfall circumstances. The sources of non-natural WQC are associated with anthropogenic activities including agriculture and mining, manufacturing industries and the settling of people in towns and cities. The potential health risk to domestic consumers and livestock is determined by a complex interaction of parameters that include the concentrations of WQC, the ingestion rates via the water intake (WI) rates and the biological susceptibility of domestic consumers and livestock to a particular inorganic chemical WQC. Risks increase by increasing concentrations and/or WI rates, according to the fate of ingested WQC in the body and consumers’ biological characteristics. This research assesses the quality of water as a potential health risk in terms of inorganic WQC in rooftop harvested rainwater (RRWH), groundwater (GW), river water (RW) and municipal water (MW) sources to people and livestock due to an intake of WQC exceeding water quality guideline (WQG) values. The research is intended to propose changes to the WQG values on GW for domestic use and livestock watering. It is anticipated that the proposed study will generate new knowledge that will inform society of the potential risks associated with the use of these waters resources. In addition, the outcomes of such a study will promote the safe use and appropriate applications of these water resources. The knowledge will enable the relevant national, provincial and local government departments to develop effective intervention strategies and establish appropriate guidelines and regulations. Aims and objectives The overall aim of the project was to evaluate potential health risks associated with the use of rooftop harvested rainwater for domestic use and groundwater for domestic use and livestock watering. The research addressed the following specific objectives: 1. A review of literature on health, risks associated with rooftop harvested rainwater for
domestic use and for homestead gardens. 2. An optimising of microbiological techniques to monitor rooftop harvested rainwater and
groundwater.
iv
3. The characterising of planktonic and biofilm-forming microorganisms that develop in harvested and surface water stored in 750L low density polyethylene water storage tanks.
4. Determining the risk imposed on crops by planktonic forms of microbes and biofilms in storing and shedding of pathogens.
5. Determining fitness-for-use of rooftop harvested rainwater for homestead gardens. 6. Determining fitness-for-use of rooftop harvested rainwater for livestock production
systems and domestic use. 7. A proposed revision of the South African Water Quality Guidelines for Livestock
Watering. 8. A proposed refinement and upgrade of available water quality guidelines on groundwater
for domestic use and livestock watering. 9. Proposed guidelines and recommendations for the use of rooftop harvested rainwater in
tanks. Research findings Volume 1 contains objectives 1-4 and objective 5 was not addressed because people in water scarce areas do not use homestead food gardens. This report deals with objectives 6-9 and the extent to which the overall objective of the project was met. Monitoring of inorganic chemical water quality constituents in water The problem statement was to compare WQC in GW, RRWH, RW and MW. Samples were collected in the designated districts of Jericho district, Northern Province; Ga-Molepane district (GM), Limpopo Province; and Port St Johns (PSJ) district, Eastern Cape Province. The collecting tanks for RRHW were a range of vessels that included plastic and metal drums or tanks and Ferro-concrete tanks. The samples from these were taken as being rooftop harvested rainwater since it was not possible to distinguish between rainwater straight off the roof and that collected in the tanks in order to test for a tank-effect on the WQC. The samples were prepared, stored and then analysed by mass spectrometry for a semi-quantitative analysis providing the inorganic micro-water quality constituents and a standard analysis providing the macro-water quality constituents. The results showed distinct differences in the profiles of WQC between GW, RRWH, RW and MW samples drawn from various localities. Constituents of concern (COC) and potentially hazardous chemical constituents (PHCC) may occur in each of the sources. GW is likely to have the highest range of WQC and WQC that may be COC or PHCC. RRWH is likely to differ in the profile of WQC by locality, which is ascribed to wind-blown elements collecting on roofs; for example arsenic (As) that did not appear in the local GW was measured in RRWH. RRWH was characterised by high levels of zinc (Zn) that is ascribed to the zinc-galvanised sheet-iron used for roofing material. Zn in RRWH could be a source to supplement dietary Zn in humans. Seasonal changes measured were marginal, but the lack of consistent and repetitive data severely limited the interpretation of the analytical results. Bromine (Br), a halogen-class element, shown by controlled research

v
to become a potential endocrine disruptor, was measured in GW and RRWH at a locality close to the coast (PSJ). GW contained levels of Br exceeding the SAWQG no observed adverse effect level (NOAEL) value of 0.01 mg/L. International WQG, however, do not consider Br a potential risk factor in drinking water. Proposed revision to the Water Quality Guidelines for livestock production systems and guidelines on ground water quality The report considers the recommendations of the current South African Water Quality Guidelines: Volume 5 Agricultural Use: Livestock Watering (1996) against selected international published WQG on WQC and their applicability to groundwater. The moral philosophy and purpose of WQG is captured in our metaphorical language that is contained in the ancient reference text of the Bible. Each of the WQG reference documents cited set out the moral philosophy and application of guidelines. Guidelines on water quality are primarily aimed at assisting users in determining the fitness-for-use (FFU) of water. Since the circumstances in which water is used differ, WQG values cannot be stand-alone values, but must be interpreted and applied in terms of local conditions and the type and physiology of the livestock. The World Health Organisation (WHO) recommends this approach. Comparisons are made between the watering and published recommendation. In many cases, there is little consensus between the South African recommended values for NOAEL and recommendations of other countries or international organisations such as the WHO. The reason is the different environments, types of livestock and circumstances in which research was done. It is further evident that since the South African Water Quality Guidelines for Livestock Watering and the equivalent for human consumption were published in 1996, research has shown that elements not included in those documents such as Br pose a risk as endocrine disrupting chemicals. Surveys have shown that a large part of the livestock and rural human population may be exposed to Br occurring naturally in groundwater. The current South African Water Quality Guidelines for Livestock introduced variability and the probable sensitivity to WQC by classes and physiological ages of livestock. The South African Water Quality Guidelines for Human Consumption and the cited WQG of other countries and organisation differentiate between categories of people by age with reference body mass for each age group. The attempt to categorise people by these parameters does not take into account the wide variation in body size and environmental conditions of people. Likewise, the flaw is repeated with livestock. It is proposed in the document that a more consistent biological reference value be used in determining the likely susceptibility of people of different ages, body mass and activity. Metabolic body mass (MBM = body mass kg0.76) is introduced as the reference criterion. This principle can be applied equally successfully to livestock.
vi
Assessments of health risks due to WQC must form the basis of applying the WQG values in context. The document presents procedural steps in making such assessments. In this respect, WQC need not always be viewed as either being of no potential threat to health (NOAEL) or COC or PHCC. The vulnerability of livestock or humans to WQC as COC or PHCC is a factor of WI and turnover, metabolic body mass, demands of the environment and general body condition. However, the inorganic WQC are a source of dietary mineral supplementation, for example Zn. Conclusions and recommendations • It is concluded that due to differences in the profiles of WQC from RRWH, GW and RW
and the occurrence of inorganic WQC that are COC or PHCC, water from these sources should be monitored to assess their human and livestock health-related risk.
• The recommendations emanating from the report are text-based WQG systems using Target Water Quality Range (TWQR) values as handy quick reference systems, but have limited value. A WQG system should differentiate between types of livestock and people according to their vulnerability and that MBM be applied as the biological reference criterion. WQC previously excluded from the South African Water Quality Guidelines (SAWQG), must be included in a new text-based publication. The limitation of such a system must be recognised and a software-based interactive, health risk assessment system be developed.
• Update and published the 1996 SAWQG.
• Develop algorithms to determine critical parameters for risk assessment.
• Establish a National Water Quality Reference Centre. .
vii
ACKNOWLEDGEMENTS The authors would like to thank the Water Research Commission (WRC) and the Department of Agriculture, Forestry and Fisheries (DAFF) for funding the open call project WRC No K5/1875/4.The project was managed by the WRC. The authors of this report acknowledge inputs from the Reference Group which significantly contributed to supporting and guiding the project team. The Reference Group was comprised of the following members:
Dr GR Backeberg Water Research Commission (Chairman)
Dr AJ Sanewe Water Research Commission
Dr S Jooste Department of Water and Sanitation, Tshwane University of Technology
Prof FK Siebrits Tshwane University of Technology
Prof P S Dube International Livestock Research Institute (ILRI)
Ms P Mofokeng Department of Agriculture Forestry and Fisheries
Ms N Masemola Department of Agriculture Forestry and Fisheries
Dr GO Sigge Stellenbosch University
Mr JA Denison Umhlaba Consulting Group
In addition, the various households in Jericho, Ntembeni, Ga-Molepane, and Port St Johns villages are acknowledged for allowing access to their property for the purposes of sample collection. The following persons and organisations are acknowledged for their technical assistance in this part of the project: Technical assistance:
Lucht, HL (MSc (Agric) cum laude Reijnders, B (BSc (Animal Science); BSc Hon (Animal Science))
Organisations:
• Department of Animal and Wildlife Sciences, Faculty of Natural and Agricultural Sciences, University of Pretoria.
• Agricultural Research Council, Institute for Soils Climate and Water, Pretoria.
• Department of Plant and Soil Sciences, Faculty of Natural and Agricultural Sciences, University of Pretoria.

viii
This page was left blank intentionally

ix
CONTENTS
EXECUTIVE SUMMARY ...................................................................................................... III ACKNOWLEDGEMENTS ................................................................................................... VII LIST OF FIGURES ................................................................................................................ XII LIST OF TABLES ................................................................................................................ XIII LIST OF BOXES .................................................................................................................. XVI ACRONYMS ...................................................................................................................... XVII CHAPTER ONE ......................................................................................................................... 1 GENERAL INTRODUCTION .................................................................................................. 1
1.1 Introduction to water sources, usage and quality ................................................................. 1
1.2 Motivation for the focus of this project ................................................................................ 3
1.3 References ............................................................................................................................ 4 CHAPTER TWO ........................................................................................................................ 8 INORGANIC CHEMICAL QUALITY OF WATER ................................................................ 8
2.1 Introduction .......................................................................................................................... 8
2.2 Aim, hypothesis and problem statement .............................................................................. 9
2.3 Strategy towards developing water quality guidelines ....................................................... 10
2.4 Physiological risks associated with WQC .......................................................................... 11
2.5 Physiological advantages associated with water quality constituents in dietary mineral supplementation ........................................................................................................................ 12
2.6 Assessments of the interactions between water quality constituents and livestock ........... 14
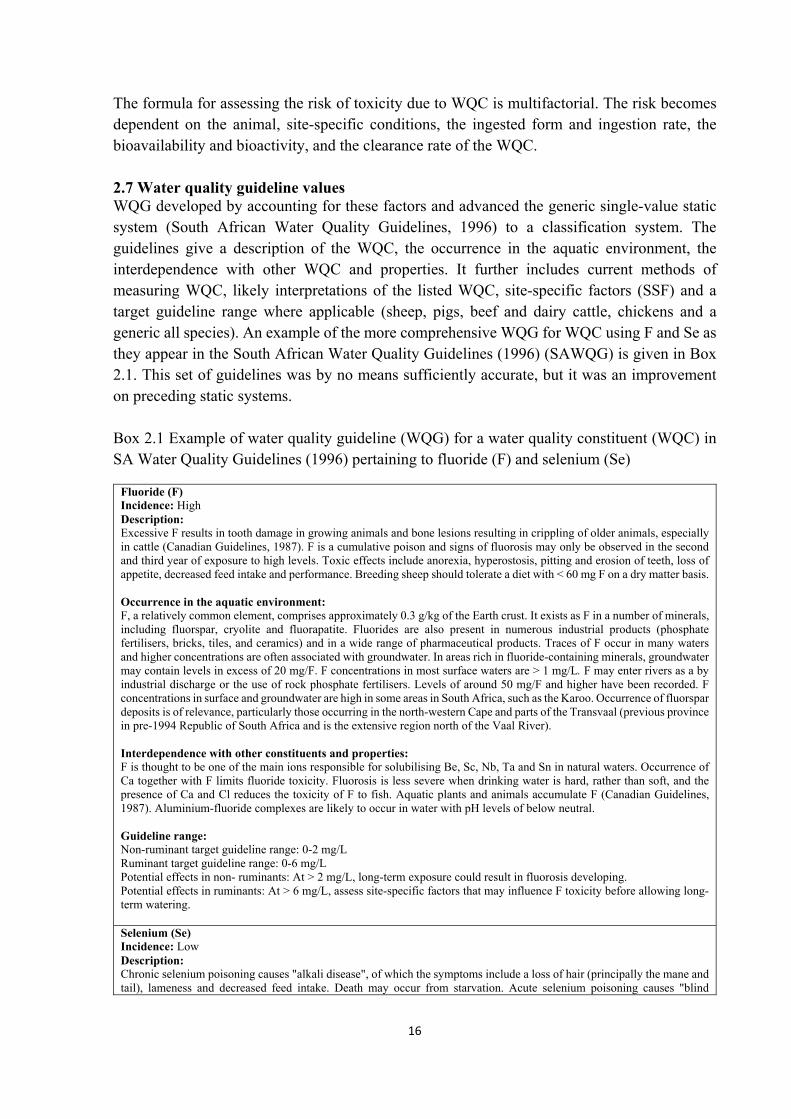
2.7 Water quality guideline values ........................................................................................... 16
2.8 Methodology: Water quality constituents: sampling and analysis of roof and ground harvested rainwater, groundwater and riverwater .................................................................... 19
2.9 Results and comments: Analyses for water quality constituents in rainwater, groundwater, riverwater and municipal water ................................................................................................ 20
2.10 Interpretation of the results ............................................................................................... 21
2.11 Seasonal comparisons between water sources.................................................................. 41
2.12 Discussion of analytical results ........................................................................................ 43
2.13 Conclusion ........................................................................................................................ 49
2.14 References ........................................................................................................................ 50

x
CHAPTER THREE .................................................................................................................. 54 PROPOSED CHANGES TO THE GUIDELINE ON GROUNDWATER FOR DOMESTIC USE AND LIVESTOCK WATERING ................................................................................... 54
3.1 Introduction ........................................................................................................................ 54
3.2 Moral philosophy and purpose water quality guidelines .................................................... 54
3.3 Published guidelines on water quality ................................................................................ 55
3.3.1 South African Water Quality Guidelines: Livestock Watering ....................................... 55
3.3.2 World Health Organisation Guidelines for Drinking Water Quality .............................. 56
3.3.3 Australian Drinking Water Guidelines ............................................................................ 57
3.3.4 Environmental Protection Agency Drinking Water Quality Guidelines ......................... 58
3.3.5 European Union Drinking Water Regulations ................................................................ 58
3.3.6 Canada, British Columbia, Water Quality Guidelines .................................................... 58
3.3.7 Food and Agricultural Organisation Water Quality for Agriculture ............................... 59
3.4 Inorganic, organic and biological water quality constituents ............................................. 60
3.5 Deductions .......................................................................................................................... 63
3.6 Problem statement on inorganic water quality constituents ............................................... 63
3.6.1 Defined user-group: Livestock ........................................................................................ 64
3.6.2 Defined user groups: Domestic use ................................................................................. 65
3.6.3 Pathogens and organic compounds in GW ...................................................................... 65
3.7 Problem statement and hypothesis ..................................................................................... 66
Hypothesis ................................................................................................................................ 66
3.8 Current water quality guidelines pertaining to inorganic water quality constituents ......... 66
3.9 Biological applications of water quality guidelines pertaining to inorganic wqc .............. 77
3.10 Application of water quality guidelines according to biological reference criteria ......... 79
3.10.1 Metabolic body mass (MBM) in mammals ................................................................... 79
3.10.2 Constituent Intake Rate Risk Assessment model (CIRRA) .......................................... 83
3.10.3 Assessment of health risks due to WQC ....................................................................... 84
3.11 Proposed revision of the South African Water Quality Guidelines: Volume 5 Agricultural use: Livestock watering, 1996 .................................................................................................. 85
3.11.1 Livestock watering ........................................................................................................ 85
3.11.2 Domestic use ................................................................................................................. 86
3.11.3 Pathogens ....................................................................................................................... 87
3.12 Discussion ......................................................................................................................... 87

xi
3.13 Conclusion and recommendation ..................................................................................... 88
3.14 References ........................................................................................................................ 89 CHAPTER FOUR .................................................................................................................... 92 CONCLUSIONS AND RECOMMENDATIONS ................................................................... 92
4.1 Introduction ........................................................................................................................ 92
4.2 Volume 1: Microbial quality of roof harvested rainwater .................................................. 93
4.3 Conclusions and recommendations on microbial quality of roof harvested rainwater ...... 95
4.4 Volume 2: Chemical quality of groundwater for potable use and livestock watering ....... 97
4.5 Conclusions and recommendations on chemical quality of groundwater for potable use and livestock watering .............................................................................................................. 98
4.6 Overall recommendations ................................................................................................... 98
References ................................................................................................................................ 99
xii
LIST OF FIGURES
Figure 1.1 The illustration shows a typical setup among rural household communities with a
rainwater harvesting system and factors critical in the safe use of harvested rainwater (see
Volume 1). .................................................................................................................................. 2
Figure 3.1 Level of confidence that 98% of water in a supply is free of faecal contamination for
different numbers of samples tested are free of faecal contamination. .................................... 62
Figure 3.2 Level of confidence that 98% of water in a supply is free of faecal contamination for
different numbers of samples when 1, 2, 3, or 4 samples give positive results........................ 62
Figure 3.3 Relationship between body mass (kg) and metabolic body mass (BM0.75). ........... 81
Figure 3.4 Relationship between body mass (kg) and log metabolic body mass (log BM0.75). 81
Figure 3.5 Relationship between body mass and metabolic body mass as percentage of body
mass. ......................................................................................................................................... 81

xiii
LIST OF TABLES
Table 2.1 Systematic procedures in determining health risk to livestock due to water quality
constituents (WQC) .................................................................................................................. 11
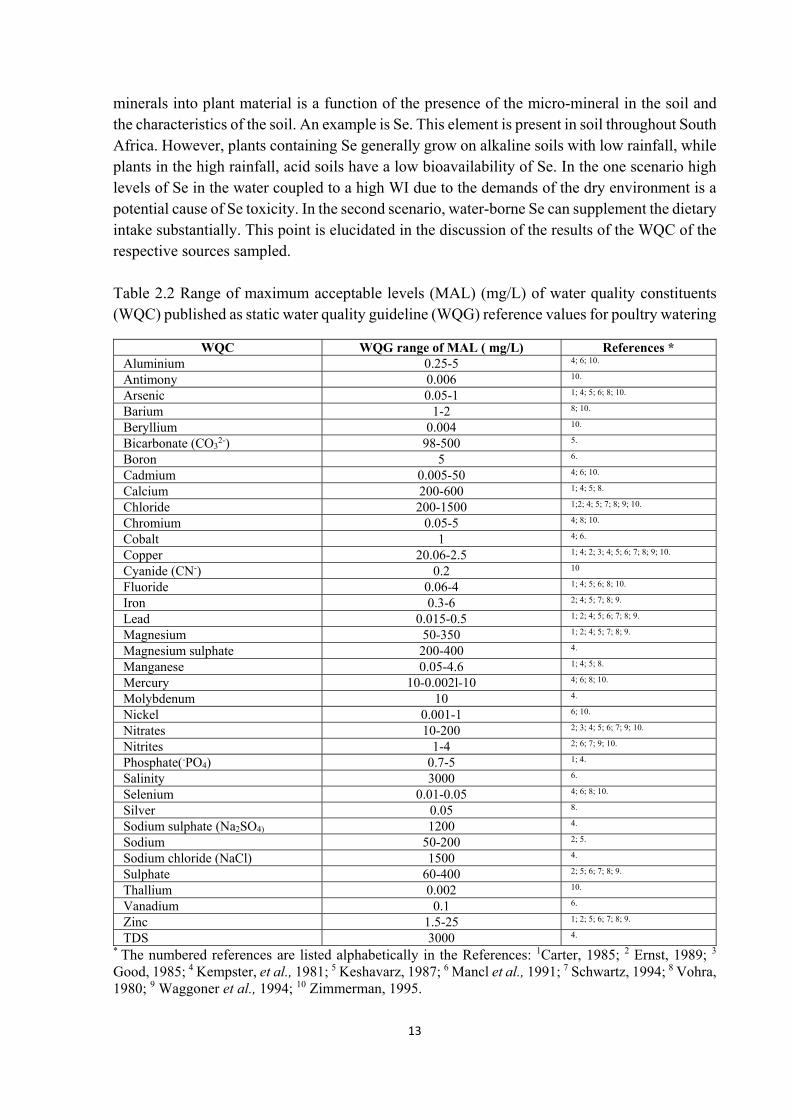
Table 2.2 Range of maximum acceptable levels (MAL) (mg/L) of water quality constituents
(WQC) published as static water quality guideline (WQG) reference values for poultry watering
.................................................................................................................................................. 13
Table 2.3 Water quality constituents (WQC) measured by the semi-quantitative analysis and
the standards analysis procedures ............................................................................................. 19
Table 2.4 Water sampling sites, schedules and water sources ................................................. 20
Table 2.5 Effects of copper on the health of livestock ............................................................. 23
Table 2.6 Target water quality range (TWQR) of lead (Pb) for livestock noted in the SAWQG
.................................................................................................................................................. 25
Table 2.7 Jericho, December 2013: Water quality constituents (WQC) (mg/L) in groundwater
(GW), riverwater (RW) and municipal water (MW) ................................................................ 26
Table 2.8 Jericho, January 2014: Water quality constituents (WQC) (mg/L) in groundwater
(GW) and riverwater (RW) ....................................................................................................... 27
Table 2.9 Jericho, January 2014: Water quality constituents (WQC) (mg/L) in rooftop harvested
rainwater (RRWH) ................................................................................................................... 28
Table 2.10 Jericho, March 2014: Water quality constituents (WQC) (mg/L) in rooftop harvested
rainwater (RRWH) ................................................................................................................... 29
Table 2.11 Jericho, July 2014: Water quality constituents (WQC) (mg/L) in groundwater (GW),
and riverwater (RW) ................................................................................................................. 30
Table 2.12 Jericho, December 2014: Water quality constituents (WQC) (mg/L) in groundwater
(GW) and riverwater (RW) ....................................................................................................... 31
Table 2.13. Jericho, December 2014: Water quality constituents (WQC) (mg/L) in groundwater
(GW) and riverwater (RW) ....................................................................................................... 32
Table 2.14 Ga-Molepane, December, 2013: Water quality constituents (WQC) (mg/L) in
rooftop harvested rainwater (RRWH) collected in Ferro-concrete tanks (F tanks) and plastic
tanks (P tanks) and riverwater (RW) ........................................................................................ 32
Table 2.15 Ga-Molepane, December 2013: Water quality constituents (WQC) (mg/L) in rooftop
harvested rainwater (RRWH) ................................................................................................... 33
xiv
Table 2.16 Port St Johns, December 2013: Water quality constituents (WQC) in ground
harvested rainwater (GHRnW), rooftop harvested rainwater (RRWH) and groundwater (GW)
.................................................................................................................................................. 34
Table 2.17 Port St Johns, March 2014: Water quality constituents (WQC) (mg/L) in ground
harvested rainwater (GHRnW) analysed by semi-quantitative analysis (SQA)....................... 35
Table 2.18 Port St Johns, March 2014: Water quality constituents (WQC) (mg/L) in rooftop
harvested rainwater (RRWH) ................................................................................................... 36
Table 2.19 Port St Johns, December 2014: Water quality constituents (WQC) (mg/L) in
groundwater (GW) .................................................................................................................... 37
Table 2.20 Port St Johns, December 2014: Water quality constituents (WQC) (mg/L) in rooftop
harvested rainwater (RRWH) ................................................................................................... 38
Table 2.21 Port St Johns, December 2014: Water quality constituents (WQC) (mg/L) in
riverwater (RW) ........................................................................................................................ 39
Table 2.22 Port St Johns, December 2014: Water quality constituents (WQC) (mg/L) in roof-
harvested rainwater (RRWH) ................................................................................................... 39
Table 2.23 Port St Johns, December 2014: Water quality constituents (WQC) (mg/L) in
groundwater (GW) .................................................................................................................... 40
Table 2.24 Port St Johns, December 2014: Water quality constituents (WQC) (mg/L) in rooftop
harvested rainwater (RRWH) ................................................................................................... 40
Table 2.25 Port St Johns, December 2014: WQC (mg/L) of riverwater (RW) samples analysed
by semi-quantitative (SQA) and standards analysis (SA) ........................................................ 41
Table 2.26 Port St Johns, December 2014: WQC (mg/L) of rooftop harvested rainwater
(RRWH) samples analysed by semi-quantitative (SQA) and standards analysis (SA) ............ 41
Table 2.27 Seasonal comparison the summer rainfall (2013) and dry winter (2014) periods of
mean values (µ) of WQC (mg/L) from respective water sources (groundwater, GW; riverwater,
RW; rainwater, RRWH, with municipal water (MW) (Control1) and deionised water (Control
2) in the Jericho district ............................................................................................................ 42
Table 2.28 Seasonal changes from summer rainfall (2013) to dry winter (2014) periods of mean
values (µ) of WQC (mg/L) from respective water sources (groundwater, GW; riverwater, RW;
rooftop harvested rainwater, RRWH) in the Jericho district where “-” indicates a decrease and
“+”, an increase ........................................................................................................................ 43
Table 2.29 Estimated intakes of bromine (Br) through water for categories of humans ......... 45
Table 2.30 Estimated Zinc (Zn) intake through water as a dietary supplement for humans .... 49
Table 3.1 An example of the Working Water Quality Guidelines (WWQG) .......................... 59

xv
Table 3.2 An example of the Working Sediment Quality Guidelines (WSQG)....................... 59
Table 3.3 Comparative water quality guidelines (WQG) for organoleptic and physical factors
and inorganic water quality constituents (WQC) referring to humans, livestock and irrigation
for selected WQC ..................................................................................................................... 67
Table 3.4 Collated TWQG values (mg/L) from the cited WQG documents ............................ 72
Table 3.5 Water quality guidelines (WQG) for livestock on magnesium (Mg) as a water quality
constituent (WQC) .................................................................................................................... 73
Table 3.6 Total water quality range (TWQR) for salinity applicable to livestock ................... 73
Table 3.7 Comparative water quality guidelines (WQG) for organic compound water quality
constituents (WQC) from selected published WQG sources ................................................... 77
Table 3.8 Estimated bromine (Br) intake through water .......................................................... 78
Table 3.9 Estimated Zinc (Zn) intake through water as a dietary supplement ......................... 79
Table 3.10 Body mass, metabolic body mass (MBM) and metabolic body mass as percentage
of body mass (MBM/BM)% ..................................................................................................... 80
Table 3.11 Water quality constituent (WQC) intake based on body mass (BM) and metabolic
body mass (MBM) and relative level of activity ...................................................................... 82
xvi
LIST OF BOXES
Box 2.1 Example of water quality guideline (WQG) for a water quality constituent (WQC) in
SA Water Quality Guidelines (1996) pertaining to fluoride (F) and selenium (Se)................. 16
Box 2.2 Examples using arsenic (As), boron (B) and cadmium (Cd) of generic target water
quality ranges (TWQR, mg/L) applicable to all livestock based on formats of the water quality
guidelines (WQG). ................................................................................................................... 17
Box 2.3 Examples using chloride (Cl), copper (Cu) and fluoride (F) of target water quality range
(TWQR, mg/L) differentiated by type of livestock and physiology based on formats of the water
quality guidelines (WQG). ....................................................................................................... 18
Box 3.1 Target water quality range (TWQR, mg/L) based formats of the water quality
guidelines .................................................................................................................................. 74
Box 3.2 Target water quality range (TWQR, mg/L) based formats of the water quality
guidelines .................................................................................................................................. 74
Box 3.3 Example of water quality guideline for a water quality constituent in South African
Water Quality Guidelines for Livestock Watering (1996) pertaining to fluoride (F) and selenium
(Se) ........................................................................................................................................... 76
Box 3.4 Procedural steps in assessing risk due to water quality constituents (WQC) ............. 84
Box 3.5 Health risk assessment by categories in terms of vulnerability .................................. 85
xvii
ACRONYMNS
µ Mean value ADWG Australian Drinking Water Guidelines AUS Australia BM Body mass (kg) CAN Canada CIRRA Constituent Ingestion Rate Risk Assessment COC Constituents of concern DRWH Domestic rainwater harvesting FAO Food and Agricultural Organisation, United Nations FFU Fitness-for-use water GM Ga-Molepane district, Limpopo Province GW Groundwater J Jericho district, Northern Province MAL Maximum allowable level MBM Metabolic body mass mg/L Milligrams per litre MOE Ministry of the Environment, British Columbia, Canada MRA Microbial risk assessment MW Municipal water NZ New Zealand PHCC WQC levels that exceeded designated WQG levels PSJ Port St Johns, Eastern Cape Province QMRA Quantitative microbial risk assessment RRWH Rooftop harvested rainwater RW Riverwater SA Standard analyses SAWQG South Africa Water Quality Guideline SQA Semi-quantitative analyses SSF Site-specific factors TDS Total dissolved solids TRAM Tiered risk assessment and management TWQR Target water quality range is the range of WQC in which adverse effects are not
likely to occur and that WQC within the range may be tolerated in either short-term or long-term exposure.
WHO World Health Organisation WQ Water quality WQC The inorganic elements in water that constitute the chemical and physical
characteristics of water, hence quality WQG Water quality guidelines WRC Water Research Commission WSQG Working Sediment Quality Guidelines, British Columbia, Canada WWQG Working Water Quality Guidelines, British Columbia, Canada

xviii
This page was left blank intentionally
1
CHAPTER ONE
GENERAL INTRODUCTION
Norman Casey1, Lise Korsten2 and Lizyben Chidamba2 1.1 Introduction to water sources, usage and quality The socio-geographical feature of South Africa is characterised by high density populations that are concentrated in a few large urban areas, an extensive rural population in regions that are traditionally homeland regions of various African ethnic entities, and an extensive commercial farming industry. Rainfall patterns over the region are seasonal with the South Western Cape experiencing a mediterranean winter rainfall and the eastern and north-eastern regions a summer rainfall. The southern coastal region has year-round rainfall. In addition the spatial distribution of the summer rainfall decreases from east to west and the temporal distributions are highly variable. As a result, South Africa has few perennial rivers with only one major river flowing from the eastern highlands westwards to the Atlantic Ocean, the Vaal-Gariep river system. Rivers flowing from the eastern highlands eastwards to the Indian Ocean that are perennial include the Pongola, Tugela, Umgeni, Umkomaas, Kei, Buffalo, Fish and Sundays rivers. Dams on these rivers supply water for the urban areas and irrigation for agriculture. The distribution of surface water and the possibility to harvest rainwater for domestic purposes and livestock across the country is limited by these factors. Rural communities and livestock farming enterprises become dependent on harvesting rainwater, drawing groundwater and when circumstances permit drawing water from river sources. The high demand for water for domestic, agricultural and industrial needs, coupled to the nature of rainfall and the availability of water in a limited number of river basins cause South Africa to be a water scarce country (Everson et al., 2011; Kahinda et al., 2009; Kahinda et al., 2010; Oberholster and Ashton, 2008; Ochse, 2007; Viljoen et al., 2012; Oberholster and Ashton, 2008; Roux et al., 2010; Stockholm Environment Institute, 2009; van Vuuren, 2008). The predominantly hard rock geology limits groundwater availability, which is frequently over-exploited in areas where groundwater is available, leaving surface water as the most significant resource (van der Merwe-, 2009). However, mining, industrial and agricultural activities and informal settlements next to riverbanks have contaminated surface water. Hence the need to evaluate other alternative sources of clean freshwater (Roux, Oelofse and De Lange 2010). Given the current patterns of water use and discharge, anticipated future population growth rates and expected socio-economic development trends, it is most likely that the available water resources will not be sufficient for future needs (Dalvie et al., 2003; van der Merwe-Botha 2009; Oberholster and Ashton 2008; Roux et al., 2010; Sibusiso and Mndaweni, 2008). It has been forecasted that freshwater resources in South Africa will be depleted and unable to meet the needs of industry and the people by the year 2030 (Postel, 2000; Turton, 2003). The South African government has made significant advances in providing clean domestic water though many poor and vulnerable inhabitants either have access to insufficient water or

2
the available water is not of suitable quality for drinking or personal hygiene (Statistics South Africa, 2010). The problems of inadequate supplies and insufficient treatment encourage searching for decentralised alternative approaches to access clean domestic and agricultural water, keeping in mind the technical and financial limitations of the poor living in under-developed areas (Alcock and Verste, 1987; Bulcock and Schulze, 2011; Kahinda et al., 2010; Kahinda et al., 2007; Kahinda and Taigbenu, 2011). Domestic rainwater harvesting (DRWH) describes the small-scale collection, storage, and use of rainwater runoff for production purposes. Rooftop rainwater harvesting (RRWH) is one of the broad categories of DRWH where water is collected from roofs, and stored in underground tanks (UGT) or above-ground tanks and used for domestic purposes, including small scale production activities such as garden watering (Kahinda et al., 2010; Kahinda et al., 2007). RRWH is one of the most appropriate alternative sources of potable and non-potable water supplies at household or community level as the world faces decreasing water sources and increasing energy crisis (Amin and Han, 2009). Prior to promoting RRWH, it is essential to determine potential chemical and microbiological risks that can be associated with such water collection systems (Figure 1.1).
Figure 1.1 The illustration shows a typical setup among rural household communities with a rainwater harvesting system and factors critical in the safe use of harvested rainwater (see Volume 1).
South Africa’s estimated GW reserve is 10 million cubic kilometres, which is >90% of the available freshwater resource. The quality of GW varies significantly from one area to another due to geological features and anthropogenic activities. The quality of GW in terms of inorganic WQC for domestic use and livestock watering has been investigated for more than 25 years through projects funded mainly by the Water Research Commission (WRC). Comparisons, however, have not been made between potable GW and RRWH, an important resource in rural
Air: dust, sand, organic matter, microbes
3
areas. By quantifying the WQC of both resources and the potential associated health risk, WQG can be refined and intervention strategies devised in the public interest and to support water quality managed. The risks posed by inorganic chemical WQC to livestock have been studied in various scenarios in South Africa since 1990 with the focus having been on GW (Casey et al., 1996a,b; Coetzee et al., 1997; Casey et al., 1998a,b,c; Casey, and Meyer, 2001; Casey et al., 2001; Casey and Meyer, 2006). The results showed the potential for a high risks to livestock and rural communities. However, the risks due to naturally occurring WQC in GW are not generic, but are associated with the type of livestock, the livestock production system, location, physiological condition of the livestock and the inorganic constituent being ingested. An assessment of the risks led to publishing the South African Water Quality Guidelines (First Edition), Volume 4, Agricultural Use: Section 4.4, Water Quality Guidelines for Livestock Watering, 1993 (Casey and Meyer, 1993) followed by a revision in 1996 (Casey et al., 1996a; Meyer et al., 1997) and an easy, handy reference document (Casey and Meyer, 1996b). Further research went into the development of a software system as a useful tool to assess risk by coupling the biological attributes of livestock, the physical attributes of the environment and the ingestion rate of the WQC that gave a constituent ingestion rate risk assessment (CIRRA). The process has recently been described (Meyer and Casey, 2012). Since the publication of the South African Water Quality Guidelines for Livestock Watering, 1996, and the development of the software system reported in 2001, research has progressed to the extent that the Water Quality Guidelines for Livestock Watering need to be updated and republished. This exercise should eventually lead to a revision of the CIRRA software programme. The risks posed by WQC to humans in rural areas who are dependent on GW were reported by Casey and Meyer (2001) and Casey and Meyer (2006). Since people in the rural areas and their livestock in most cases use the same GW sources, livestock are an acceptable gauge for assessing the risks to people. 1.2 Motivation for the focus of this project The basic human right of having access to potable water is often seriously compromised by ineffective water management systems and lack of adequate control of industrial and other environmental pollutants (Farahbakhsh et al., 2009; Yadav et al., 2007). It is incumbent on governments to provide safe quality water (van der Merwe-Botha, 2009; Gemmell and Schmidt, 2010; Viljoen et al., 2012). Poor management of water quality increases the risks posed by chemicals and microbes to consumers that may have long-term negative effects on the population, food security and sustainability (van der Merwe-Botha, 2009). The quantification of risks in context to the vulnerability of domestic consumers and livestock enables refining WQG and devising intervention strategies. Plant, animal and human health and well-being are important pillars in society and require effective regulation and enforcement. Although there are regular public notices of contamination taking place in South African rivers, GW monitoring in rural areas is lacking. In
4
these areas, water collection systems are also more commonly used for domestic consumption and livestock watering. Yet, little is known about the quality and safety of this valuable water resource. Water collection from roof tops also provides an alternative resource for domestic use and has increasingly been used in food gardens. Similarly little is known about the quality and safety of water collected from roof tops and stored for extended periods of time. This research assesses the quality of RRHW compared with GW, RW and MW sources in terms of inorganic WQC and whether risk to people and livestock might occur due to an intake of WQC exceeding guideline values. The research is intended also to propose changes to the guidelines on GW for domestic use and livestock watering. It is anticipated that the proposed study will generate new knowledge that will inform society of the potential risks associated with the use of these waters resources. In addition, the outcomes of such a study will promote the safe use and appropriate applications of these water resources. Furthermore, this knowledge will enable the relevant government department to develop effective intervention strategies and establish appropriate guidelines and regulations. 1.3 References Alcock, P.G. and Verste, E., 1987. Investigation into unconventional sources of water for a peri-urban/rural district of KwaZulu. South African Journal of Science, 83, 348-352. Amin, M.T. and Han, M.Y., 2009. Rooftop harvested rainwater for potable purposes: application of solar collector disinfection (SOCO-DIS). Water Research, 43, 5225-35. http://doi.org/10.1016/j.watres.2009.08.041 Bulcock, L.M., and Schulze, R. E., 2011. Climate Change and Rainwater Harvesting in South Africa : A Case Study. Pietermaritzburg, South Africa. Casey, N.H. and Meyer, J.A., 1993. South African Water Quality Guidelines (First Edition), Volume 4, Agricultural Use: Section 4.4, Water Quality Guidelines for Livestock Watering. Department of Water Affairs and Forestry. ISBN 0621154636. Casey, N.H. and Meyer, J.A., 1996b. Interim Water Quality Guidelines for Livestock Watering. WRC. TT 76/96. ISBN 1868452255. Casey, N.H. and Meyer, J.A., 2001. An extension to and further refinement of a water quality guideline index system for livestock watering: Rural communal livestock production systems and wildlife production systems. Volume 1. WRC Report No 857/1/01. ISBN 1868457133. Casey, N.H. and Meyer, J.A., 2006. The application of risk assessment modelling in groundwater for humans and livestock in rural, communal systems. WRC Report No 1175/1/06. ISBN 1770054677.
5
Casey, N.H., Meyer, J.A. and Coetzee, C.B., 1998a. An investigation into the quality of water for livestock production with the emphasis on subterranean water and the development of a water quality guideline index system. Volume 1. Development and modelling. WRC Report No 644/1/98. ISBN 1868457390. Casey, N.H., Meyer, J.A. and Coetzee, C.B., 1998b. An investigation into the quality of water for livestock production with the emphasis on subterranean water and the development of a water quality guideline index system: Volume 2. Research results. WRC Report No 644/1/98. ISBN 1868457391. Casey, N.H., Meyer, J.A. and Coetzee, C.B., 1998c. An investigation into the quality of water for livestock production with the emphasis on subterranean water and the development of a water quality guideline index system: Volume 3. Appendix of reference files calculations. WRC Report No 644/1/98. ISBN 1868457390. Casey, N.H., Meyer, J.A. and Coetzee, C.B., 2001. An extension to and further refinement of a water quality guideline index system for livestock watering. Volume 2: Poultry production systems and water quality for ostrich production. WRC Report No 857/2/00. ISBN 1868457141. Casey, N.H., Meyer, J.A. and Kempster, P.L., 1996b. Technical authors: South African Water Quality Guidelines (Second Edition), Volume 5, Agricultural Use: Section 4.4, Water Quality Guidelines for Livestock Watering. Department of Water Affairs and Forestry. ISBN 0798853433. Casey, N.H., Meyer, J.A. and van Niekerk, W.A., 1996a. An investigation into the quality of water for animal production: Supplementary Report. WRC Report No 301/02/96. ISBN 1868450813. Casey, N.H., Meyer, J.A., Coetzee, C.B. and van Niekerk, W.A., 1996c. An investigation into the quality of water for animal production. WRC Report No 301/01/96. ISBN 1868450805. Coetzee, C.B., Casey, N.H. and Meyer, J.A., 1997. Fluoride tolerance of laying hens. British. Poultry Science. 38:597-602. Coetzee, C.B., Casey, N.H. and Meyer, J.A., 2000. The effect of water-borne fluoride on the production of laying hens. Water SA. 26:115-118. Dalvie, M.A., Cairncross, E., Solomon, A. and London, L., 2003. Contamination of rural surface and ground water by endosulfan in farming areas of the Western Cape, South Africa. Environmental Health, 2(1), 1.
6
Everson, C., Everson, T.M., Modi1, A.T., Csiwila, D., Fanadzo, M., Naiken, V., and Dladla, R., 2011. Sustainable techniques and practices for water harvesting and conservation and their effective application in resource- poor agricultural production participatory adaptive research through participatory adaptive research. WRC REPORT NO. 1465/1/11. Water Research Commission, Pretoria, South Africa. Farahbakhsh, K., Despins, C. and Leidl, C., 2009. Developing capacity for large-scale rainwater harvesting in Canada. Water Quality Research Journal of Canada, 44, 92-102. Garrison, N., Resources, N., Council, D., Devine, J. and David, S., 2011. Capturing Rainwater from rooftops : An efficient water resource management strategy that increases supply and reduces pollution. Natural Resources Defense Council (NRDC), New York. Gemmell, M.E. and Schmidt, S., 2010. Potential links between irrigation water quality and microbiological quality of food in subsistence farming in KwaZulu-Natal, South Africa. Current Research, Technology and Education Topics in Applied Microbiology and Microbial Biotechnology, 1190-1195. Kahinda, J.M. and Taigbenu, A.E., 2011. Rainwater harvesting in South Africa: Challenges and opportunities. Physics and Chemistry of the Earth Parts ABC, 36, 968-976. http://doi.org/10.1016/j.pce.2011.08.011 Kahinda, J.M., Taigbenu, A.E. and Boroto, J.R., 2007. Domestic rainwater harvesting to improve water supply in rural South Africa. Physics and Chemistry of the Earth, Parts A/B/C, 32(15), 1050-1057. http://doi.org/10.1016/j.pce.2007.07.007 Kahinda, J.M., Taigbenu, A.E. and Boroto, R.J., 2010. Domestic rainwater harvesting as an adaptation measure to climate change in South Africa. Physics and Chemistry of the Earth Parts ABC, 35, 742-751. http://doi.org/10.1016/j.pce.2010.07.004 Kahinda, J.M., Taigbenua, A.E., Lillieb, E.S.B. and Boroto, R.J., 2009. A GIS-based decision support system for rainwater harvesting (RHADESS). Physics and Chemistry of the Earth Parts ABC, 34, 767-775. http://doi.org/10.1016/j.pce.2009.06.011 Meyer J.A. and Casey, N.H., 2012. Establishing risk assessment on water quality for livestock. Animal Frontiers 2, 2, 44-49. Oberholster, P.J. and Ashton, P.J., 2008. State of the Nation Report: An Overview of the Current Status of Water Quality and Eutrophication in South African Rivers and Reservoirs. Parliamentary Grant Deliverable – March 2008. Pretoria, South Africa.
7
Ochse, M., 2007. Seasonal rainfall influences on main pollutants in the Vaal river barrage reservoir : a temporal- spatial perspective. Dissertation Submitted in Partial Fulfilment of the Requirements for the Degree, MSc in Environmental Science, Faculty of Humanities, University of Johannesburg. Olem, H. and Berthouex, P.M., 1989. Acidic deposition and cistern drinking water supplies. Environmental Science and Technology, 23: 333-340. Postel, S.L., 2000. Entering an era of water scarcity: the challenges ahead. Ecological Applications, 10(4), 941-948. Roux, S., Oelofse, S., De Lange, W., 2010. Can SA afford to continue polluting its water resources ? – With special reference to water pollution in two important catchment areas. Science Real and Relevant, Conference 2010, CSIR, Pretoria. Sibusiso, S. and Mndaweni, E., 2008. Quantification of the Impacts of a Domestic Waste Site on a Karoo Aquifer By Sakhile Sibusiso Edwin Mndaweni May 2008 Supervisors : Dr PD Vermeulen Dr BH Usher. Statistics, South Africa, 2010. General household survey. Statistical Release, May 2007, Pretoria. Stockholm Environment Institute (SEI). 2009. Rainwater harvesting: a lifeline for human well-being. Job No. DEP/1162/NA UNEP. United Nations Environment Programme. Turton, A.R., 2003. The political aspects of institutional developments in the water sector: South Africa and its international river basins. PhD thesis submitted to the Faculty of Humanities, University of Pretoria, South Africa. Van der Merwe-Botha, M., 2009. Water Quality: A vital dimension of water security. Published by the Development Planning Division of the DBSA of South Africa. Working Paper Series No.14. Van Vuuren, L., 2008. Start saving or start paying, river studies warn : water resources planning. Water Wheel May/June 2008, 7(3), 14-18. Viljoen, M.F., Kundhlande, G., Baiphethi, M.N., Esterhuyse, P., Botha, J.J., Minkley, J.J. 2012. An assessment of the social and economic acceptability of rainwater harvesting and conservation practices in selected peri-urban and rural communities. WRC Report No. 1648/1/12. . Pretoria, South Africa. Yadav, S., Singhvi, R. and Sharma, B.K., 2007. Recharging of borewells and analysis of harvested rooftop rainwater in houses of Udaipur city. Journal of Environmental Science Engineering, 49, 225-228.
8
CHAPTER TWO
INORGANIC CHEMICAL QUALITY OF WATER
Norman Casey1 2.1 Introduction Inorganic chemicals in water, referred to as WQC, have variable potential effects on livestock and people ingesting these, whether through drinking water or water used for domestic purposes such as cooking or preparing beverages. Various factors determine the risks posed by WQC that will be elucidated further. Inorganic WQC occur naturally in water due to a range of conditions that could release molecules or dissociated molecules as anions and cations into the water. The primary conditions that determine this include the geology of the surface over which the water flows, whether it is surface or subterranean water and where surface elements are scoured off and enter the water. Through geothermal activity, the effects of heat and pressure change the chemical characteristics of the geological matter, resulting in the release of elements into the water. Sediments carried by rivers and wind action can add to the inorganic content and change the relative proportions. Evaporation and dry periods concentrate the WQC increasing the possibility of high concentrations of potentially hazardous WQC being ingested. Concentrations of salts concomitantly raise the total dissolved solids (TDS) value, which has been shown to have alleviating effects on the potentially hazardous effect of ingested WQC. This is noted in the literature. The variability of contributing factors to inorganic WQC in water results in a high variability of any constituent elements. Rivers have a distinctly different profile of WQC in a season of high flow rate compared with a season of low flow rate. In some areas, river flows drop below the river bed to a slow, percolated subterranean flow. Anthropogenic-induced presence of inorganic WQC or changes in the concentrations are due to exposing water sources directly to elements present in dumping waste, runoff from waste dumps, roads, concentrated livestock production systems and disturbances of the surface and geology through agricultural and mining activities. Indirect influences on WQC may be caused by diverting and interrupting the flow of water courses and pumping water from aquifers, which can cause a movement of water containing higher concentrations of WQC from deeper regions or the flow of water from interconnected aquifers. Changing relative concentrations of WQC are affected by the flow rates. Fast flowing water will have a different relative concentration of WQC to slow or static water, the conjugation of molecules, the relative density of the molecules, pH where acidity or alkalinity affects the dissociation of conjugated molecules and electrical conductivity. Speciation of elements may occur under the influence of temperature, pH and ranges of the light spectrum i.e. infrared or ultraviolet light.
9
The dynamics of WQC differ between ground and surface water. GW is less exposed to the factors including agriculture and mining than surface water. However, a high range of WQC occurs between GW sources to the extent that boreholes closely located can differ. The inorganic WQC concentrations of rainwater should also vary in association with the noted conditions. 2.2 Aim, hypothesis and problem statement Aim The aim of investigating the occurrence of inorganic WQC in roof and ground harvested rainwater, GW and RW is to estimate whether risk (due to WQC) to livestock and people might occur from these sources singularly or in combination, and to collate this information into the WQG for livestock and rural communities. Hypothesis The project attempts to test the H0 hypothesis that harvested rainwater, groundwater and riverwater should not differ significantly in a given area. Problem statement: Natural water supply for livestock and rural communities in South Africa
The southern African region has agro-ecological features that make it suitable for production of livestock in extensive systems. The natural rangeland (veld) is the sustaining nutrition source for livestock. It ranges from subtropical bush to vast stretches of grassland to harsh semi-desert and desert features (Tainton et al., 1993). The region’s rainfall extends from the east along the Indian Ocean (with an annual average rainfall of around 800 mm per annum) to the dry desert of the western regions along the Atlantic Ocean, where the annual rainfall becomes <10 mm. The central regions have between 300 and 400 mm per annum 90% of the time (De Jager, 1993). Precarious rainfall and the lack of natural perennial rivers and streams cause livestock farmers, rural farming communities and small towns to be reliant on GW sources. The Water Research Commission of South Africa (WRC) initiated the development of WQG for livestock watering from GW sources in 1989. Farmers were eligible for a conditional government subsidy on GW sources in designated water scarce regions, on condition that the water had to be fit-for-use for livestock watering. The dilemma was, firstly, the differing published WQG and secondly, the WQG for livestock in use in South Africa was a restrictive, single-value system, constructed around single-value reference criteria for maximum tolerable limits (MTL) or recommended maximum exposure concentrations (for example 0.03 mg/L of water). WQC levels and the identification of PHCC had not been considered scientifically and advice given and conclusions drawn were assumptions rather than facts (Casey et al., 1996b). The existing WQG were neither site-specific nor were the types of animals, their physiological status, and the environment and production systems taken into account, or supported by scientific evidence, which rendered the single-value system inappropriate in assessing fitness for use. The lack of certainty in the outcome following the exposure of livestock to WQC provided a motivation for a more accurate guideline format. A description of the development of the guidelines is important in order to grasp the need to scrutinise and update the existing WQG.
10
2.3 Strategy towards developing water quality guidelines The strategy followed in developing WQG for livestock focussed on producing an adaptable set of guidelines based on the principles of livestock production, i.e. that animal production is a function of the animal and the production environment. The animal factors should include: species, breed, genetics, physiology and production status; and the environment factors should include nutrition, humidity, temperature and altitude. The aims of such guidelines are to assess and minimise the risks posed to livestock by the ingestion of PHCC, defined as WQC levels that exceeded designated WQG levels, and to consumers of livestock products (Meyer et al., 1997). In the current project this theory is applied to people, though the restriction is that no quantitative research can be done using human subjects. The results previously formulated for livestock as the reference species are extrapolated to human consumers in the rural and village settings where equivalent references do not appear in WQG dealing with domestic usage or drinking water for human consumption. The WHO (2011) Guidelines for Drinking Water note that not all of the chemicals with WQG values will be present in all water sources or at levels of COC/PHCC. It notes further that chemicals without WQG values or that are not addressed in the WQG may be of legitimate local concern. The interpretation of these statements is that guideline values are not intended to provide a one-value-fits-all approach. Health risk management strategies must consider the chemicals (WQC) most likely to occur in water sources and that are to cause a debilitating condition due to acute exposure (for example methaemoglobinaemia or diarrhoea) or to chronic exposure (for example endocrine disruption). Differences in the approach to developing WQG for livestock and human consumers are the nature of keeping livestock and the probable exposure and mitigating circumstances compared with the domestic habits of people. Livestock are more likely to be kept in one place and the exposure to COC/ PHCC becomes chronic. However, by mitigating the effects with treatments either of the livestock or the water, such as by altering the TDS levels, this becomes manageable. The gregarious nature of people and the freedom to move about and make dietary choices can reduce exposure to WQC COC/PHCC. There are rural communities in South Africa, however, who are chronically exposed to water sources that have high levels of WQC in the categories of COC/PHCC. Under these circumstances, the interpretation of “chronic exposure” differs markedly between livestock and people. The lifespan of livestock in the different production phases ranging from young growing animals to mature breeders is a fraction of that of humans. Growing and developing people could be exposed to WQC as COC/PHCC in their most vulnerable life-period for as long as 20 years. Apart from an acute effect of nitrate (NO3) causing methaemoglobinaemia or sulphate (SO4) causing diarrhoea, other WQC may affect the endocrine system and metabolism leading to stunted growth, impaired cognitive development and compromised immunity. Developing health risk management strategies regarding WQC for human consumption, must account for the effects of physical activities (manual labour) and physical characteristics of the environment (temperature-humidity indices).

11
Two separate systematic approaches may be applied to determine health risks to livestock that may be associated with WQC. The one approach is by analysing water for the WQC, noting the concentrations that appear to be COC/PHCC in terms of WQG and to apply the procedural steps to estimate the risks due to the WQC. The second approach is to observe subclinical or clinical indicators of possible pathology that might be linked to WQC. This is followed by a systematic assessment of possible contributing factors. Table 2.1 Systematic procedures in determining health risk to livestock due to water quality constituents (WQC)
Water analysis Observations Measure concentrations of WQC (mg/L, g/L) Observe subclinical or clinical indicators of
possible pathology Procedural steps Procedural steps Review each of the WQC in the analysis
- Concentration (mg/L, μg/L) - The potential physiological effect of the
WQC - Possible alleviatory factors such as
TDS, competitive WQC
Note the source of the sample Note the water user group (sheep – lactating, broiler chickens – one week old, horses – endurance) Note the site-specific factors (SSF) that can influence water intake
- Dry rations - High physiological demand for a high
water intake as with young animals, lactation, high physical activity
- High altitude
Note the expected or given exposure time Repeat the sample and analysis for wet and dry seasons
Do a clinical examination of the single animal or user group and establish the incidence within the group or region Consider known causes of both a subclinical and clinical observation Eliminate known factors Do an analysis of the water Review each of the WQC in the analysis
- Concentration (mg/L) - The potential physiological effect of the
WQC - Possible alleviatory factors such as
TDS, competitive WQC
Note the source of the sample Note the water user group (sheep – lactating, broiler chickens – one week old, horses – endurance) Note the site-specific factors (SSF) that can influence water intake
- Dry rations - High physiological demand for a high
water intake as with young animals, lactation, high physical activity
- High altitude
Note the expected or given exposure time Repeat the sample and analysis for wet and dry seasons
2.4 Physiological risks associated with WQC Due to the nature of livestock production in southern Africa, the WQG were developed principally around GW, since the WQC in GW have the highest potential risk to livestock and rural communities. The principles apply equally to rainwater.
12
The extent of risk due to WQC in GW and the risks posed by PHCC were determined in a number of ways, beginning with a review of existing data of WQC in GW and supplemented by systematic sampling of boreholes, reservoirs and at the point of use, over seasons. Geo-hydrological data from the Department of Water Affairs and Forestry for the periods 1987 to 1994 were used to form the basis of the analysis. The data had been analysed for TDS, Na, Mg, Ca, F, Cl, NO3, SO4, PO4, TAL (total alkalinity), Si, K, and pH (Meyer, 1992; Casey et al., 1996b; Meyer et al., 1997). The PHCC were expressed as a percentage of the total number of recorded PHCC in a designated area. Of the WQC in the data reviewed F, TDS, Cl and SO4 were considered important variables in terms of existing WQG. The characteristics of the data did not allow for statistical analyses to establish correlations and trends between constituents. High risk areas were identified in the northern and northwest regions followed by surveys that are more extensive. The incidence of PHCC in the water showed F 38%, TDS 19.1%, and Cl 24.8% with Na, SO4, Mg, NO3 and Ca at < 10% (Casey, et al., 1996b). Of the samples that constitute the data, 37.2% of the boreholes were unfit for livestock watering and others had WQC close to the level for PHCC. Further surveys included trace minerals and were over a wider set of regions, including the Western Cape, the Great Karoo, the Little Karoo and the Kalahari region, and a more recent survey over a wider range across South Africa. The values, published by Coetzee et al. (2000), Casey et al. (2001) and Casey and Meyer (2006), show a high range of WQC throughout South Africa and that these can differ markedly between regions. It emerged that the mean values for As, F, Hg, NO3, Se, Sr, U, V and TDS are COC throughout South Africa, but not necessarily in the Western Cape. Static reference values for selected WQC shown in Table 2.2 illustrate the range of values, published as WQG, which complicates the interpretation and application of acceptable single reference values. 2.5 Physiological advantages associated with water quality constituents in dietary mineral supplementation People and livestock require a combination of essential micro-minerals (trace elements) and macro-minerals for numerous biochemical functions in the body. It is generally assumed these are acquired through food. Analyses of diets show that the micro and macro-mineral content are often unbalanced and do not provide the animals or people with the necessary intake of these minerals. The value of supplementation is well documented and animals may supplement their mineral requirements through geophagia especially by consuming concentrated minerals in salts such as those occurring in pans, dams, river banks and around windmills (where there is an overflow, the water evaporates and WQC form crystalline deposits). WQC are a potential source of supplementary micro and macro-minerals. Casey and van Ryssen (2013) described the extent to which micro-minerals occur abundantly in the environment and are contained in various herbages for livestock. The uptake of the micro-
13
minerals into plant material is a function of the presence of the micro-mineral in the soil and the characteristics of the soil. An example is Se. This element is present in soil throughout South Africa. However, plants containing Se generally grow on alkaline soils with low rainfall, while plants in the high rainfall, acid soils have a low bioavailability of Se. In the one scenario high levels of Se in the water coupled to a high WI due to the demands of the dry environment is a potential cause of Se toxicity. In the second scenario, water-borne Se can supplement the dietary intake substantially. This point is elucidated in the discussion of the results of the WQC of the respective sources sampled. Table 2.2 Range of maximum acceptable levels (MAL) (mg/L) of water quality constituents (WQC) published as static water quality guideline (WQG) reference values for poultry watering
WQC WQG range of MAL ( mg/L) References * Aluminium 0.25-5 4; 6; 10.
Antimony 0.006 10.
Arsenic 0.05-1 1; 4; 5; 6; 8; 10.
Barium 1-2 8; 10.
Beryllium 0.004 10.
Bicarbonate (CO32-) 98-500 5.
Boron 5 6.
Cadmium 0.005-50 4; 6; 10.
Calcium 200-600 1; 4; 5; 8.
Chloride 200-1500 1;2; 4; 5; 7; 8; 9; 10.
Chromium 0.05-5 4; 8; 10.
Cobalt 1 4; 6.
Copper 20.06-2.5 1; 4; 2; 3; 4; 5; 6; 7; 8; 9; 10.
Cyanide (CN-) 0.2 10
Fluoride 0.06-4 1; 4; 5; 6; 8; 10.
Iron 0.3-6 2; 4; 5; 7; 8; 9.
Lead 0.015-0.5 1; 2; 4; 5; 6; 7; 8; 9.
Magnesium 50-350 1; 2; 4; 5; 7; 8; 9.
Magnesium sulphate 200-400 4.
Manganese 0.05-4.6 1; 4; 5; 8.
Mercury 10-0.002l-10 4; 6; 8; 10.
Molybdenum 10 4.
Nickel 0.001-1 6; 10.
Nitrates 10-200 2; 3; 4; 5; 6; 7; 9; 10.
Nitrites 1-4 2; 6; 7; 9; 10.
Phosphate(-PO4) 0.7-5 1; 4.
Salinity 3000 6.
Selenium 0.01-0.05 4; 6; 8; 10.
Silver 0.05 8.
Sodium sulphate (Na2SO4) 1200 4.
Sodium 50-200 2; 5.
Sodium chloride (NaCl) 1500 4.
Sulphate 60-400 2; 5; 6; 7; 8; 9.
Thallium 0.002 10.
Vanadium 0.1 6.
Zinc 1.5-25 1; 2; 5; 6; 7; 8; 9.
TDS 3000 4.
* The numbered references are listed alphabetically in the References: 1Carter, 1985; 2 Ernst, 1989; 3 Good, 1985; 4 Kempster, et al., 1981; 5 Keshavarz, 1987; 6 Mancl et al., 1991; 7 Schwartz, 1994; 8 Vohra, 1980; 9 Waggoner et al., 1994; 10 Zimmerman, 1995.
14
2.6 Assessments of the interactions between water quality constituents and livestock WI is the most important determinant of potential adverse effects of WQC due to the direct relationship between WI and ingestion rates of WQC. WI is determined by chronological age where young animals accumulate water in tissues, especially muscle fibres undergoing hypertrophic development, the physiological state such as with lactation, the peripheral demands of the environment as in a dry climate or extremes in the temperature-humidity index, and the moisture content of rations. Palatability is a factor of the WQC that might influence WI. Consequently, the palatability of water can be manipulated by changing the relative content of WQC and the level of TDS (Meyer, 1992; Casey et al., 1996a and b; Meyer et al., 1997). The effects on palatability of NaCl, NaSO4, CaCl, and MgSO4 were determined in beef steers, dairy cows and S.A. Mutton Merino wethers. The animals adapted to incremental increases in TDS concentrations. The types and concentrations of salts and the ratios between salts (P > 0.05) influenced the WI of cattle and sheep. Palatability curves were developed that could be used to predict WI response to zones of preference and non-preference. This allowed an intervention to be made to improve the palatability of water, with one or more of the WQC > the recommended WQG levels. An example is that water with a SO4 concentration > 1000 mg/L is less palatable and could depress WI and have a roll-on effect on productivity. The palatability rating is moved into a zone of preference by changing the ratio of SO4: TDS. The results demonstrated the potential role of TDS as an alleviator for unpalatable water and possibly as an alleviator of the potential toxicity of a WQC that could be in the category of a PHCC. WQC have the potential for adverse physiological effects and become toxic under particular circumstances, including:
• Long-term, consistent intake of a WQC (chronic exposure) at levels below being classified a PHCC if it (1) has a propensity to accumulate in the body, (2) has a relatively slow clearance rate, (3) disrupts metabolic pathways, or (4) competes with other elements and in that way disrupts metabolic pathways.
• Short-term intake at levels exceeding the WQG values, i.e. a PHCC, if it has the propensity to interfere with the physiology, or may compete with or displace other elements and disrupt metabolism.
• Intake by animals in hypersensitive physiological stages especially during stages requiring high volumes of WI, such as early growth, lactation, a period of adverse temperature-humidity indices, or when fed a dry ration regime.
• Biologically inactive WQC may undergo speciation and become biologically active under conditions of storage in open, exposed reservoirs and when ingested. Various factors can initiate chemical speciation, including oxygen, solar radiation, pH, temperature, ionic strength and time.
• Clearance rate is a pharmacokinetic parameter that describes the dynamics of a substance from ingestion and absorption to a NOAEL in the body. Chronic exposure of low concentrations of WQC coupled to a low clearance rate can increase the residual concentration in the body and raise the risk level. In terms of WQC, acute

15
exposure of high concentrations WQC would at most have acute physiological reactions such as SO4 salts (e.g. MgSO4) causing diarrhoea.
Bioavailable WQC refers to WQC being taken up into the body from the digestive tract, but bioavailable does not necessarily imply that the WQC is bioactive The bioavailability of WQC and the effects of these on the physiology of an animal depend on interactive factors that include concentration, ingestion rate, length of exposure and the type of livestock. Speciation may also happen in the digestive tract that would make the WQC more or less bioavailable. A WQC may become bioactive if it enters the metabolic processes of the body through which it may disrupt a metabolic pathway, displace an element or become bonded within or deposited in a tissue. Ingested WQC that pass through the milk are bioavailable, but may not be bioactive. The competitiveness of elements to enter a metabolic process offers an opportunity to exploit this fact, and by careful reconstitution of WQC, both the bioavailability and the bioactivity can be influenced. A challenging aspect to the inter-relationships between elements relates to the potential element speciation. This is well documented for elements such as Cr (hexavalent) and As (trivalent versus pentavalent) that the oxidation state determines risk and therefore fitness-for-use. In the case of Se, these different oxidation states may result in an exposure concentration varying from having antioxidant to pro-oxidant effects. As TDS can be used to manipulate the palatability of water, likewise TDS may be an effective means of influencing the bioavailability and bioactivity of WQC. TDS effectively alleviated the accumulation of As, Pb and Br in tissues of broiler chickens (Mamabolo et al., 2009). Increasing the TDS of the water and subsequently causing a pressure diuresis, which increased renal clearance rates, achieved the reduction of clinical fluorosis in cattle, both in terms of dental enamel hypoplasia and skeletal exocytosis. Lowered whole blood Se values were also observed using this method (Casey and Meyer, 2006). Another outcome of interactions is that some exposure concentrations do not result in primary toxicity, but rather result in induced deficiencies of other elements that may complicate differential diagnoses. A simple example of this application may be found in dietary supplementation of iodine (I) as a mitigation measure for exposure to goitrogenic substances where Br and F may increase the requirement for I. This principle was demonstrated (Du Toit and Casey, 2010; Du Toit and Casey, 2011) where the interaction between Br and I had no significant effect on WI (P = 0.0928) or feed intake (P = 0.9593). However, although Br administered at 1 and 3 mg Br/L or at ingestion rates of 1.59 and 4.44 mg Br/day affected production and physiological parameters, I had an effective ameliorating effect on Br. The variability in exposure concentration and intake might alter ingestion of a WQC, and thereby induce variability in observed effects and concentrations. However, interactions with electrolytes that alter fluid balances can also change the outcome of exposure. An example of this relates to volume-loaded hypertension with neural endocrine homeostatic mechanisms able to alter the renal clearance rates. This may explain the reason for a tolerance of higher concentrations in some cases, but may also allow mitigating measures to be implemented based on manipulating water quality.
16
The formula for assessing the risk of toxicity due to WQC is multifactorial. The risk becomes dependent on the animal, site-specific conditions, the ingested form and ingestion rate, the bioavailability and bioactivity, and the clearance rate of the WQC. 2.7 Water quality guideline values WQG developed by accounting for these factors and advanced the generic single-value static system (South African Water Quality Guidelines, 1996) to a classification system. The guidelines give a description of the WQC, the occurrence in the aquatic environment, the interdependence with other WQC and properties. It further includes current methods of measuring WQC, likely interpretations of the listed WQC, site-specific factors (SSF) and a target guideline range where applicable (sheep, pigs, beef and dairy cattle, chickens and a generic all species). An example of the more comprehensive WQG for WQC using F and Se as they appear in the South African Water Quality Guidelines (1996) (SAWQG) is given in Box 2.1. This set of guidelines was by no means sufficiently accurate, but it was an improvement on preceding static systems. Box 2.1 Example of water quality guideline (WQG) for a water quality constituent (WQC) in SA Water Quality Guidelines (1996) pertaining to fluoride (F) and selenium (Se)
Fluoride (F) Incidence: High Description: Excessive F results in tooth damage in growing animals and bone lesions resulting in crippling of older animals, especially in cattle (Canadian Guidelines, 1987). F is a cumulative poison and signs of fluorosis may only be observed in the second and third year of exposure to high levels. Toxic effects include anorexia, hyperostosis, pitting and erosion of teeth, loss of appetite, decreased feed intake and performance. Breeding sheep should tolerate a diet with < 60 mg F on a dry matter basis. Occurrence in the aquatic environment: F, a relatively common element, comprises approximately 0.3 g/kg of the Earth crust. It exists as F in a number of minerals, including fluorspar, cryolite and fluorapatite. Fluorides are also present in numerous industrial products (phosphate fertilisers, bricks, tiles, and ceramics) and in a wide range of pharmaceutical products. Traces of F occur in many waters and higher concentrations are often associated with groundwater. In areas rich in fluoride-containing minerals, groundwater may contain levels in excess of 20 mg/F. F concentrations in most surface waters are > 1 mg/L. F may enter rivers as a by industrial discharge or the use of rock phosphate fertilisers. Levels of around 50 mg/F and higher have been recorded. F concentrations in surface and groundwater are high in some areas in South Africa, such as the Karoo. Occurrence of fluorspar deposits is of relevance, particularly those occurring in the north-western Cape and parts of the Transvaal (previous province in pre-1994 Republic of South Africa and is the extensive region north of the Vaal River). Interdependence with other constituents and properties: F is thought to be one of the main ions responsible for solubilising Be, Sc, Nb, Ta and Sn in natural waters. Occurrence of Ca together with F limits fluoride toxicity. Fluorosis is less severe when drinking water is hard, rather than soft, and the presence of Ca and Cl reduces the toxicity of F to fish. Aquatic plants and animals accumulate F (Canadian Guidelines, 1987). Aluminium-fluoride complexes are likely to occur in water with pH levels of below neutral. Guideline range: Non-ruminant target guideline range: 0-2 mg/L Ruminant target guideline range: 0-6 mg/L Potential effects in non- ruminants: At > 2 mg/L, long-term exposure could result in fluorosis developing. Potential effects in ruminants: At > 6 mg/L, assess site-specific factors that may influence F toxicity before allowing long-term watering. Selenium (Se) Incidence: Low Description: Chronic selenium poisoning causes "alkali disease", of which the symptoms include a loss of hair (principally the mane and tail), lameness and decreased feed intake. Death may occur from starvation. Acute selenium poisoning causes "blind
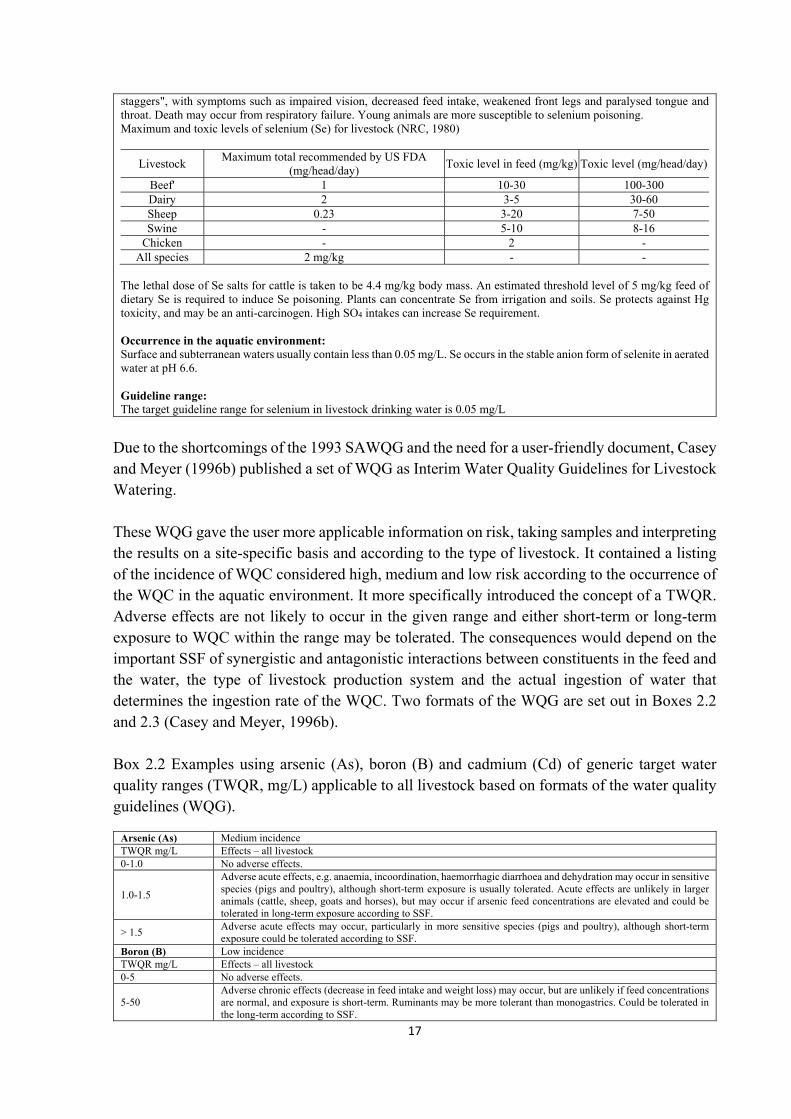
17
staggers", with symptoms such as impaired vision, decreased feed intake, weakened front legs and paralysed tongue and throat. Death may occur from respiratory failure. Young animals are more susceptible to selenium poisoning. Maximum and toxic levels of selenium (Se) for livestock (NRC, 1980)
Livestock Maximum total recommended by US FDA
(mg/head/day) Toxic level in feed (mg/kg) Toxic level (mg/head/day)
Beef' 1 10-30 100-300 Dairy 2 3-5 30-60 Sheep 0.23 3-20 7-50 Swine - 5-10 8-16
Chicken - 2 - All species 2 mg/kg - -
The lethal dose of Se salts for cattle is taken to be 4.4 mg/kg body mass. An estimated threshold level of 5 mg/kg feed of dietary Se is required to induce Se poisoning. Plants can concentrate Se from irrigation and soils. Se protects against Hg toxicity, and may be an anti-carcinogen. High SO4 intakes can increase Se requirement. Occurrence in the aquatic environment: Surface and subterranean waters usually contain less than 0.05 mg/L. Se occurs in the stable anion form of selenite in aerated water at pH 6.6. Guideline range: The target guideline range for selenium in livestock drinking water is 0.05 mg/L
Due to the shortcomings of the 1993 SAWQG and the need for a user-friendly document, Casey and Meyer (1996b) published a set of WQG as Interim Water Quality Guidelines for Livestock Watering. These WQG gave the user more applicable information on risk, taking samples and interpreting the results on a site-specific basis and according to the type of livestock. It contained a listing of the incidence of WQC considered high, medium and low risk according to the occurrence of the WQC in the aquatic environment. It more specifically introduced the concept of a TWQR. Adverse effects are not likely to occur in the given range and either short-term or long-term exposure to WQC within the range may be tolerated. The consequences would depend on the important SSF of synergistic and antagonistic interactions between constituents in the feed and the water, the type of livestock production system and the actual ingestion of water that determines the ingestion rate of the WQC. Two formats of the WQG are set out in Boxes 2.2 and 2.3 (Casey and Meyer, 1996b). Box 2.2 Examples using arsenic (As), boron (B) and cadmium (Cd) of generic target water quality ranges (TWQR, mg/L) applicable to all livestock based on formats of the water quality guidelines (WQG).
Arsenic (As) Medium incidence TWQR mg/L Effects – all livestock 0-1.0 No adverse effects.
1.0-1.5
Adverse acute effects, e.g. anaemia, incoordination, haemorrhagic diarrhoea and dehydration may occur in sensitive species (pigs and poultry), although short-term exposure is usually tolerated. Acute effects are unlikely in larger animals (cattle, sheep, goats and horses), but may occur if arsenic feed concentrations are elevated and could be tolerated in long-term exposure according to SSF.
> 1.5 Adverse acute effects may occur, particularly in more sensitive species (pigs and poultry), although short-term exposure could be tolerated according to SSF.
Boron (B) Low incidence TWQR mg/L Effects – all livestock 0-5 No adverse effects.
5-50 Adverse chronic effects (decrease in feed intake and weight loss) may occur, but are unlikely if feed concentrations are normal, and exposure is short-term. Ruminants may be more tolerant than monogastrics. Could be tolerated in the long-term according to SSF.
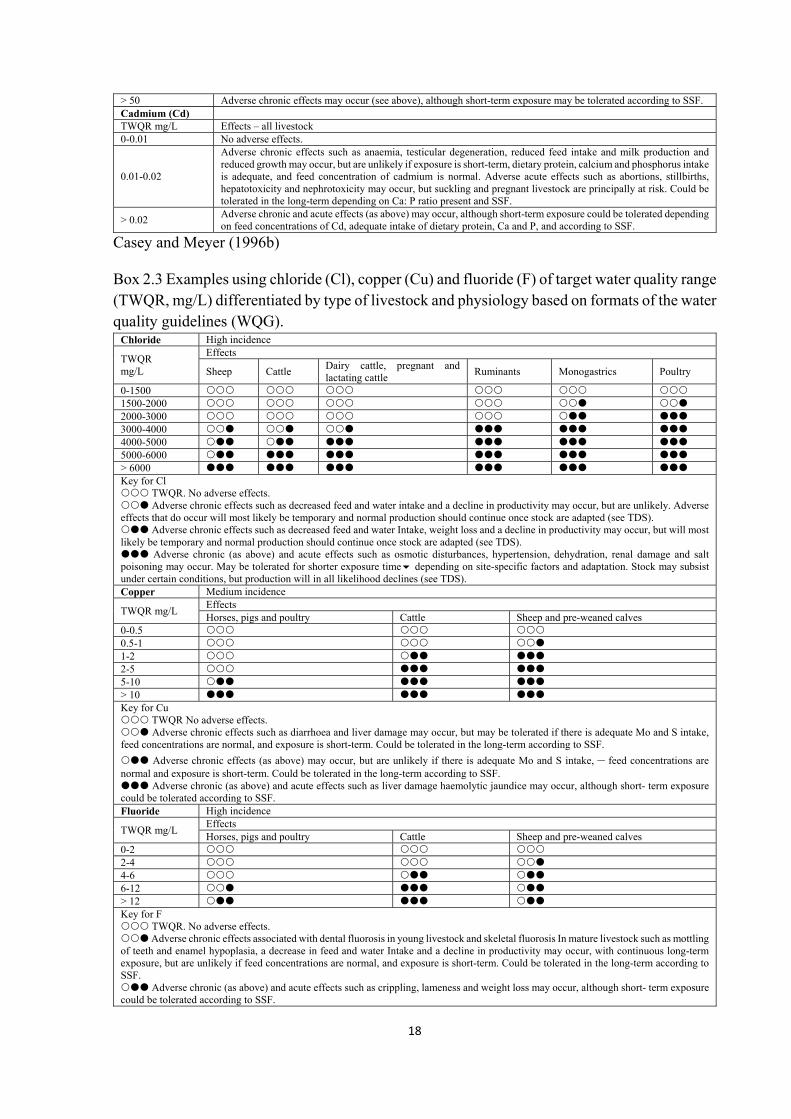
18
> 50 Adverse chronic effects may occur (see above), although short-term exposure may be tolerated according to SSF. Cadmium (Cd) TWQR mg/L Effects – all livestock 0-0.01 No adverse effects.
0.01-0.02
Adverse chronic effects such as anaemia, testicular degeneration, reduced feed intake and milk production and reduced growth may occur, but are unlikely if exposure is short-term, dietary protein, calcium and phosphorus intake is adequate, and feed concentration of cadmium is normal. Adverse acute effects such as abortions, stillbirths, hepatotoxicity and nephrotoxicity may occur, but suckling and pregnant livestock are principally at risk. Could be tolerated in the long-term depending on Ca: P ratio present and SSF.
> 0.02 Adverse chronic and acute effects (as above) may occur, although short-term exposure could be tolerated depending on feed concentrations of Cd, adequate intake of dietary protein, Ca and P, and according to SSF.
Casey and Meyer (1996b) Box 2.3 Examples using chloride (Cl), copper (Cu) and fluoride (F) of target water quality range (TWQR, mg/L) differentiated by type of livestock and physiology based on formats of the water quality guidelines (WQG).
Chloride High incidence
TWQR mg/L
Effects
Sheep Cattle Dairy cattle, pregnant and lactating cattle
Ruminants Monogastrics Poultry
0-1500 1500-2000 2000-3000 3000-4000 4000-5000 5000-6000 > 6000 Key for Cl TWQR. No adverse effects. Adverse chronic effects such as decreased feed and water intake and a decline in productivity may occur, but are unlikely. Adverse effects that do occur will most likely be temporary and normal production should continue once stock are adapted (see TDS). Adverse chronic effects such as decreased feed and water Intake, weight loss and a decline in productivity may occur, but will most likely be temporary and normal production should continue once stock are adapted (see TDS). Adverse chronic (as above) and acute effects such as osmotic disturbances, hypertension, dehydration, renal damage and salt poisoning may occur. May be tolerated for shorter exposure time depending on site-specific factors and adaptation. Stock may subsist under certain conditions, but production will in all likelihood declines (see TDS). Copper Medium incidence
TWQR mg/L Effects Horses, pigs and poultry Cattle Sheep and pre-weaned calves
0-0.5 0.5-1 1-2 2-5 5-10 > 10 Key for Cu TWQR No adverse effects. Adverse chronic effects such as diarrhoea and liver damage may occur, but may be tolerated if there is adequate Mo and S intake, feed concentrations are normal, and exposure is short-term. Could be tolerated in the long-term according to SSF.
Adverse chronic effects (as above) may occur, but are unlikely if there is adequate Mo and S intake, – feed concentrations are normal and exposure is short-term. Could be tolerated in the long-term according to SSF. Adverse chronic (as above) and acute effects such as liver damage haemolytic jaundice may occur, although short- term exposure could be tolerated according to SSF. Fluoride High incidence
TWQR mg/L Effects Horses, pigs and poultry Cattle Sheep and pre-weaned calves
0-2 2-4 4-6 6-12 > 12 Key for F TWQR. No adverse effects. Adverse chronic effects associated with dental fluorosis in young livestock and skeletal fluorosis In mature livestock such as mottling of teeth and enamel hypoplasia, a decrease in feed and water Intake and a decline in productivity may occur, with continuous long-term exposure, but are unlikely if feed concentrations are normal, and exposure is short-term. Could be tolerated in the long-term according to SSF. Adverse chronic (as above) and acute effects such as crippling, lameness and weight loss may occur, although short- term exposure could be tolerated according to SSF.
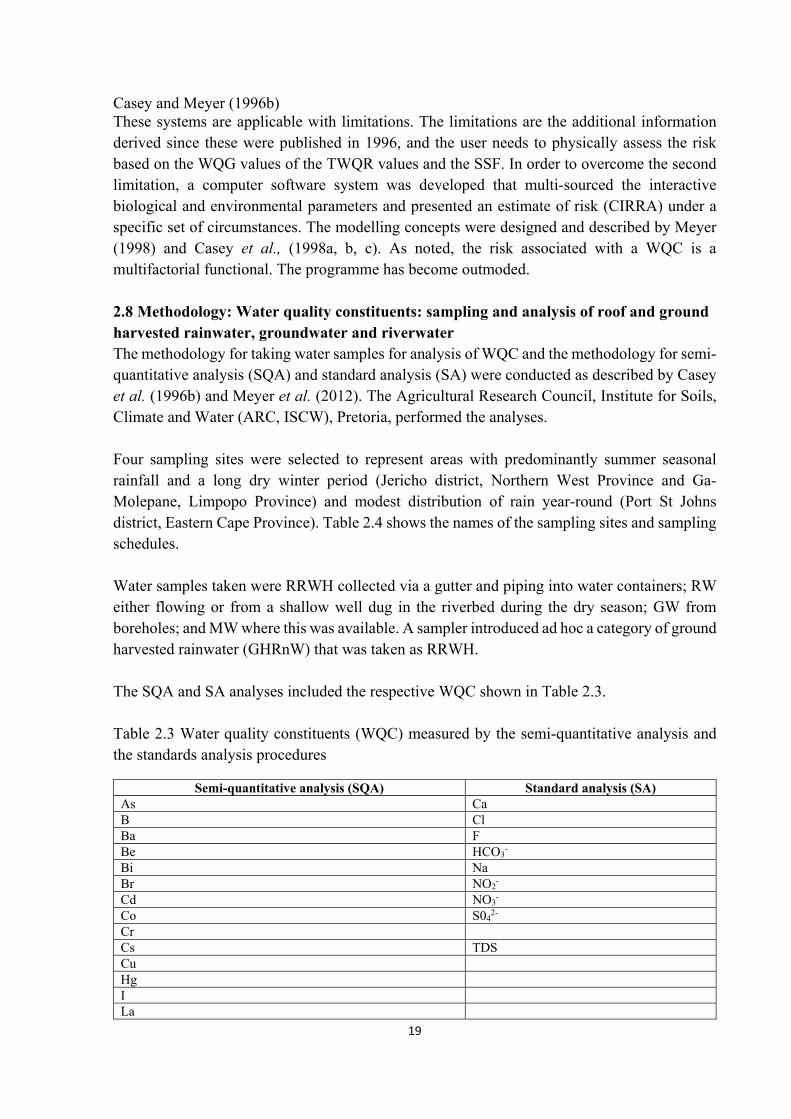
19
Casey and Meyer (1996b) These systems are applicable with limitations. The limitations are the additional information derived since these were published in 1996, and the user needs to physically assess the risk based on the WQG values of the TWQR values and the SSF. In order to overcome the second limitation, a computer software system was developed that multi-sourced the interactive biological and environmental parameters and presented an estimate of risk (CIRRA) under a specific set of circumstances. The modelling concepts were designed and described by Meyer (1998) and Casey et al., (1998a, b, c). As noted, the risk associated with a WQC is a multifactorial functional. The programme has become outmoded. 2.8 Methodology: Water quality constituents: sampling and analysis of roof and ground harvested rainwater, groundwater and riverwater The methodology for taking water samples for analysis of WQC and the methodology for semi-quantitative analysis (SQA) and standard analysis (SA) were conducted as described by Casey et al. (1996b) and Meyer et al. (2012). The Agricultural Research Council, Institute for Soils, Climate and Water (ARC, ISCW), Pretoria, performed the analyses. Four sampling sites were selected to represent areas with predominantly summer seasonal rainfall and a long dry winter period (Jericho district, Northern West Province and Ga-Molepane, Limpopo Province) and modest distribution of rain year-round (Port St Johns district, Eastern Cape Province). Table 2.4 shows the names of the sampling sites and sampling schedules. Water samples taken were RRWH collected via a gutter and piping into water containers; RW either flowing or from a shallow well dug in the riverbed during the dry season; GW from boreholes; and MW where this was available. A sampler introduced ad hoc a category of ground harvested rainwater (GHRnW) that was taken as RRWH. The SQA and SA analyses included the respective WQC shown in Table 2.3. Table 2.3 Water quality constituents (WQC) measured by the semi-quantitative analysis and the standards analysis procedures
Semi-quantitative analysis (SQA) Standard analysis (SA) As Ca B Cl Ba F Be HCO3
- Bi Na Br NO2
-
Cd NO3-
Co S042-
Cr Cs TDS Cu Hg I La
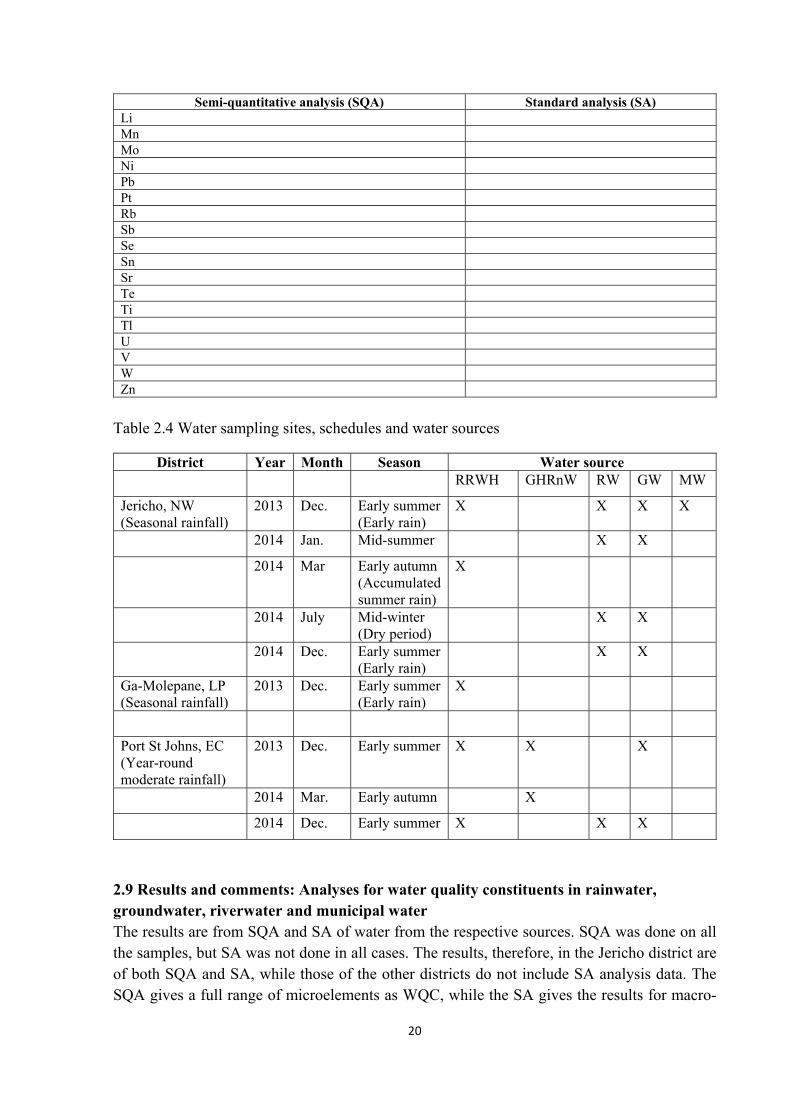
20
Semi-quantitative analysis (SQA) Standard analysis (SA) Li Mn Mo Ni Pb Pt Rb Sb Se Sn Sr Te Ti Tl U V W Zn
Table 2.4 Water sampling sites, schedules and water sources
District Year Month Season Water source RRWH GHRnW RW GW MW
Jericho, NW (Seasonal rainfall)
2013 Dec. Early summer (Early rain)
X X X X
2014 Jan. Mid-summer X X
2014 Mar Early autumn (Accumulated summer rain)
X
2014 July Mid-winter (Dry period)
X X
2014 Dec. Early summer (Early rain)
X X
Ga-Molepane, LP (Seasonal rainfall)
2013 Dec. Early summer (Early rain)
X
Port St Johns, EC (Year-round moderate rainfall)
2013 Dec. Early summer X X X
2014 Mar. Early autumn X
2014 Dec. Early summer X X X
2.9 Results and comments: Analyses for water quality constituents in rainwater, groundwater, riverwater and municipal water The results are from SQA and SA of water from the respective sources. SQA was done on all the samples, but SA was not done in all cases. The results, therefore, in the Jericho district are of both SQA and SA, while those of the other districts do not include SA analysis data. The SQA gives a full range of microelements as WQC, while the SA gives the results for macro-
21
elements, NO3/NO2 and TDS. This deficiency in the dataset was due to circumstances beyond the control of the research team. A further deficiency in the data is the lack of replicates in the respective districts and over time. 2.10 Interpretation of the results The results are presented as commentary notes on each WQC analysed by SQA and SA methodologies followed by the relevant tables. The WQC values are compared with the current South African Water Quality Guidelines Volume 1 for Domestic Use (SAWQG Dom, 1996) and the South African Water Quality Guidelines Volume 5 for Agriculture: Livestock Watering (SAWQG Livestock, 1996). In addition, international references are drawn from the Australia (AUS) and New Zealand (NZ) (ANZECC, 1992, NHMRC, NRMMC, 2011), Canada (CAN) (Olkowski, 2009) and the World Health Organisation Guidelines for Drinking Water (WHO, 2011). The discussion includes references to US Environmental Protection Agency (EPA) and the US Agency for Toxic Substances and Disease Registry (ATSDR). Certain elements, while they may or may not be present in international WQG, do not have guideline values for South African water sources. This fact presents a potential problem in that the SAWQG tend to be stricter than those of other countries; elements that may be within acceptable limits for other countries may be COC or even PHCC in South Africa. GPS co-ordinates are given where these were recorded. The following are comments on values of WQC in mg/L, unless noted as μg/L, in GW, RRWH, RW and MW of samples taken from the sources noted on each of the tables. Previously noted, a category of ground harvested rainwater was taken as RRWH. The SAWQG for Domestic Use are interpreted and applied as for human consumption. The results are direct comparisons of values. No statistical analyses were done on the results owing to the lack of replicates, which limited the estimation of the degree of significant difference between samples. Arsenic (As) The SAWGQ NOAEL value for human consumption is 0.1 mg/L, which is higher than that of AUS/NZ (0.01 mg/L) as well as that for livestock in CAN (0.025 mg/L). RRWH at Jericho (J): As in two samples of RW (0.183 and 0.218 mg/L) was PHCC for human consumption (Table 2.10). In terms of these results, As is a low incidence WQC. Barium (Ba) The SAWQG does not list Ba. Ba at 0-0.46 mg/L (across all measurements) is within recommended AUS/NZ guidelines for human consumption (0.0-2.0 mg/L)

22
with the values obtained from GW being higher than those of RW, which are higher than those of MW. In terms of these results, Ba is a low incidence WQC. Bromine (Br) The SAWQG NOAEL value is 0.01 mg/L, but Br does not appear in the AUS/NZ and CAN WQG. Concentrations exceeding the SAWQG value of 0.01 mg/L were measured in RRWH, GW and MW. GW had the highest value of 0.842 mg/L at Jericho (Table 2.8, 01/2014) and a repeat measure in 12/2014 recorded 1.51 mg/L (Table 2.12). At PSJ, concentrations > 0.01 mg/L were recorded in GW 1.38 mg/L (12/2013) (Table 2.16) and GHRnW as high as 0.915 mg/L (Table 2.16). In terms of these results, Br occurs at different concentrations in GW in the J and PSJ districts that may exceed the SAWQG value of 0.01 mg /L by 150 times. Cadmium (Cd) The SAWQG NOAEL value for Cd is 0.01 mg/L in all livestock. Recorded values exceeding this were in GW (0.0809 mg/L) at PSJ (12/13) (Table 2.16); in RRWH at PSJ up to 0.2567 mg/L Table 2.18), at GM up to 0.1738 mg/L (Table 2.14), in RW at GM 0.1438 mg/L (Table 2.14). Values > 0.08 mg/L are PHCC for livestock in CAN, and values > 0.01 mg/L are PHCC for livestock in AUS/NZ. Cd occurred in GW, RW and RRWH. The highest occurrence was in RRWH at values placing Cd as a PHCC. Calcium (Ca) The SA and AUS/NZ WQG level for NOAEL for livestock is 1000 mg/L and none of the samples exceeded this value. Chlorine (Cl) SAWQG NOAEL for Cl for livestock ranges from 1500 mg/L for monogastric animals and poultry to 3000 mg/L for ruminants, and for humans the TWQR value is 100 mg/L. In the J district (Tables 8 and 13) GW recorded a wide range with the upper end, 257.9-341.24 mg/L, surpassed the standard for humans by magnitudes 2.5 to 3.4 times. GW values at PSJ were 107 mg/L (Table 2.23). These high values place Cl in the PHCC category. The SAWQG for humans is more stringent than those of AUS/NZ. No WQG for livestock are available from AUS/NZ or CAN.
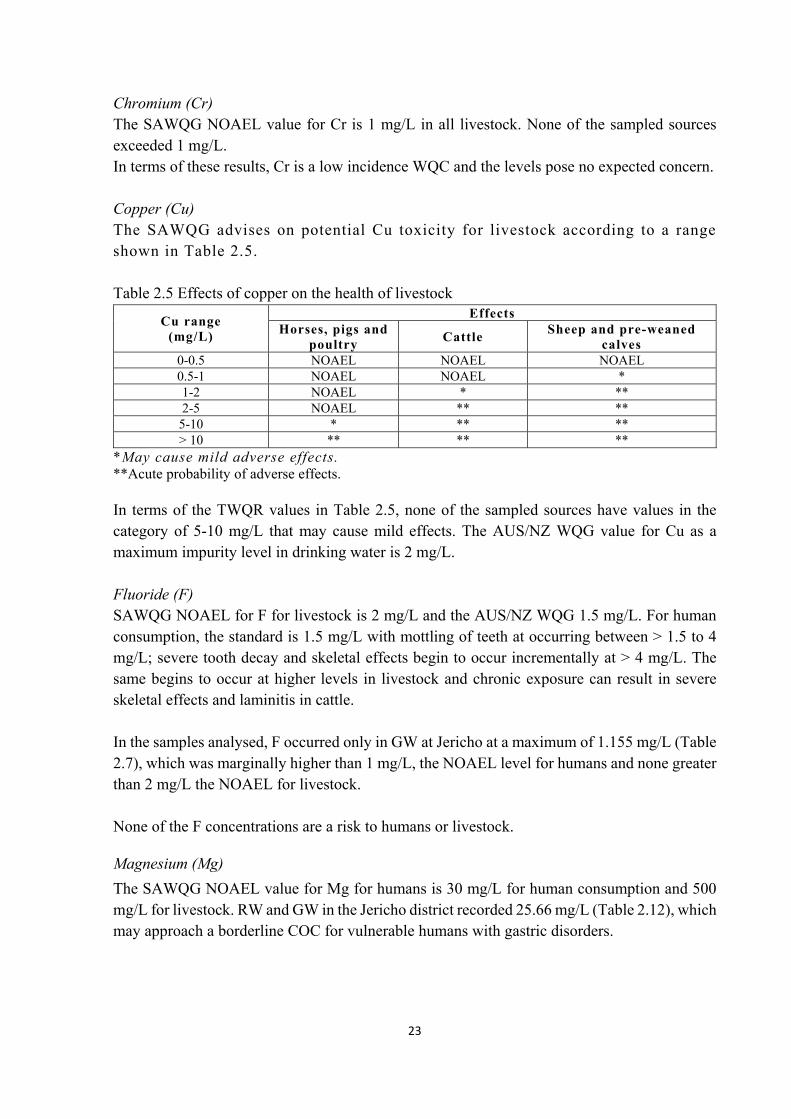
23
Chromium (Cr) The SAWQG NOAEL value for Cr is 1 mg/L in all livestock. None of the sampled sources exceeded 1 mg/L. In terms of these results, Cr is a low incidence WQC and the levels pose no expected concern. Copper (Cu) The SAWQG advises on potential Cu toxicity for livestock according to a range shown in Table 2.5. Table 2.5 Effects of copper on the health of livestock
Cu range (mg/L)
Effects Horses, pigs and
poultry Cattle
Sheep and pre-weaned calves
0-0.5 NOAEL NOAEL NOAEL 0.5-1 NOAEL NOAEL * 1-2 NOAEL * ** 2-5 NOAEL ** **
5-10 * ** ** > 10 ** ** **
*May cause mild adverse effects. **Acute probability of adverse effects. In terms of the TWQR values in Table 2.5, none of the sampled sources have values in the category of 5-10 mg/L that may cause mild effects. The AUS/NZ WQG value for Cu as a maximum impurity level in drinking water is 2 mg/L. Fluoride (F) SAWQG NOAEL for F for livestock is 2 mg/L and the AUS/NZ WQG 1.5 mg/L. For human consumption, the standard is 1.5 mg/L with mottling of teeth at occurring between > 1.5 to 4 mg/L; severe tooth decay and skeletal effects begin to occur incrementally at > 4 mg/L. The same begins to occur at higher levels in livestock and chronic exposure can result in severe skeletal effects and laminitis in cattle. In the samples analysed, F occurred only in GW at Jericho at a maximum of 1.155 mg/L (Table 2.7), which was marginally higher than 1 mg/L, the NOAEL level for humans and none greater than 2 mg/L the NOAEL for livestock. None of the F concentrations are a risk to humans or livestock.
Magnesium (Mg)
The SAWQG NOAEL value for Mg for humans is 30 mg/L for human consumption and 500 mg/L for livestock. RW and GW in the Jericho district recorded 25.66 mg/L (Table 2.12), which may approach a borderline COC for vulnerable humans with gastric disorders.
24
Manganese (Mn)
The SA and the AUS/NZ WQG NOAEL values for Mn for human consumption is 0.05 mg/L, while the WHO (2011) recommends 0.4 mg/L. It is noted that values > 0.01 may have effects on taste. The SAWQG NOAEL for livestock is 10 mg/L.
The concentrations exceeding the SAWQG values were recorded only in GW at PSJ, namely 0.062 mg/L (Table 2.19), GHRnW 0.2949 mg/L (Table 2.17) and 0.5796 mg/L (Table 2.16), which constitute the category PHCC for human consumption. Mn occurs primarily in GW in terms of these results and was measured only in the PSJ district.
Mercury (Hg)
The SAWQG NOAEL value for Hg for all livestock is 1 mg/L. Adverse chronic effects may occur at levels > 1 mg/L, with incremental probability of toxicity and related physiological effects ≥ 6 mg/L. The AUS/NZ WQG notes 0.001 mg/L as the maximum impurity level and the CAN WQG lists 0.003 mg/L as the Target Water Quality value for livestock. A discrepancy of magnitude appears between the SAWQG for livestock and for domestic use, and the AUS/NZ and CAN WQG. The SAWQG values are in mg/L given at the wrong concentration, and the AUS and CAN, in μg/L, while the WHO gives the values in μg/L. Standardising to mg/L, the recommended value is 0.001 mg/L. This error in the SAWQG must be corrected.
Concentrations > 0.001 mg/L were recorded in GW and RW with no potentially hazardous levels in RRWH. At Jericho, GW had up to 0.9445 mg/L (Table 2.7) and at PSJ 0.1239 mg/L and 0.6592 mg/L (Table16) and in RW at GM 0.9374 mg/L (Table 2.14). RRWH at GM recorded 0.1838 mg/L (Table 2.14) and GHRnW at PSJ 0.3296 mg/L (Table 2.17) making the element a PHCC to humans at these sources.
Nickel (Ni)
The SAWQG NOAEL for Ni for livestock is 1 mg/L, but may vary according to livestock type. Concentration from 2 to 5 mg/L may have mild effects in pigs, but no effect in other livestock. Concentration ≥ 6 mg/L may begin to cause adverse effects. The AUS/NZ WQG sets 0.02 mg/L for health in humans. The WHO (2011) lists the NOAEL at 0.07 mg/L, while the CAN WQG does not list Ni.
Nitrate/Nitrite (NO3 / NO2)
The SAWQG NOAEL value for NO3 for livestock is 100 mg/L and the AUS/NZ level is 50 mg/L. The SA NOAEL for humans is 6 mg/L with incrementally increasing probability of methaemoglobinaemia occurring in infants. The WHO (2011) guideline value is much higher at 50 mg/L. GW is the most likely source to contain high levels of NO3/NO2. GW samples from Jericho district had levels as high as 35.815 mg/L (Table 2.11), which while not a risk to livestock is a
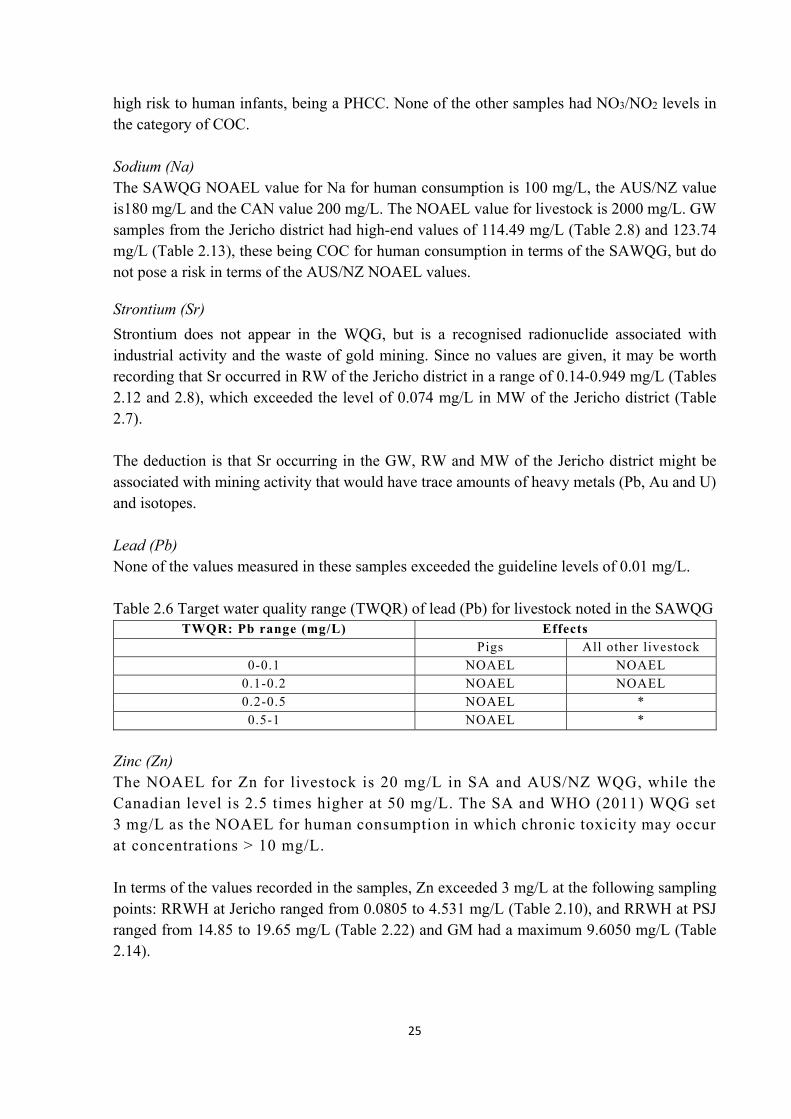
25
high risk to human infants, being a PHCC. None of the other samples had NO3/NO2 levels in the category of COC. Sodium (Na) The SAWQG NOAEL value for Na for human consumption is 100 mg/L, the AUS/NZ value is180 mg/L and the CAN value 200 mg/L. The NOAEL value for livestock is 2000 mg/L. GW samples from the Jericho district had high-end values of 114.49 mg/L (Table 2.8) and 123.74 mg/L (Table 2.13), these being COC for human consumption in terms of the SAWQG, but do not pose a risk in terms of the AUS/NZ NOAEL values.
Strontium (Sr)
Strontium does not appear in the WQG, but is a recognised radionuclide associated with industrial activity and the waste of gold mining. Since no values are given, it may be worth recording that Sr occurred in RW of the Jericho district in a range of 0.14-0.949 mg/L (Tables 2.12 and 2.8), which exceeded the level of 0.074 mg/L in MW of the Jericho district (Table 2.7). The deduction is that Sr occurring in the GW, RW and MW of the Jericho district might be associated with mining activity that would have trace amounts of heavy metals (Pb, Au and U) and isotopes. Lead (Pb) None of the values measured in these samples exceeded the guideline levels of 0.01 mg/L. Table 2.6 Target water quality range (TWQR) of lead (Pb) for livestock noted in the SAWQG
Zinc (Zn) The NOAEL for Zn for livestock is 20 mg/L in SA and AUS/NZ WQG, while the Canadian level is 2.5 times higher at 50 mg/L. The SA and WHO (2011) WQG set 3 mg/L as the NOAEL for human consumption in which chronic toxicity may occur at concentrations > 10 mg/L. In terms of the values recorded in the samples, Zn exceeded 3 mg/L at the following sampling points: RRWH at Jericho ranged from 0.0805 to 4.531 mg/L (Table 2.10), and RRWH at PSJ ranged from 14.85 to 19.65 mg/L (Table 2.22) and GM had a maximum 9.6050 mg/L (Table 2.14).
TWQR: Pb range (mg/L) Effects Pigs All other livestock
0-0.1 NOAEL NOAEL 0.1-0.2 NOAEL NOAEL 0.2-0.5 NOAEL * 0.5-1 NOAEL *

26
The high Zn values are associated with RRWH in terms of these results, which may be attributed to Zn-containing roofing material. Total Dissolved Solids (TDS) The SAWQG NOAEL value for TDS for livestock is a range according to the type of livestock. The lowest value is ≥ 2000 mg/L for dairy cows, pigs and poultry. In terms of risk to humans, SAWQG NOAEL value is 450 mg/L, while the AUS/NZ level is 600 mg/L. GW in the Jericho district recorded values 820 mg/L (Table 2.8) and 889 mg/L (Table 2.13) at the same boreholes, placing these water sources in the category of PHCC against the NOAEL value of the SA and AUS/NZ WQG. Table 2.7 Jericho, December 2013: Water quality constituents (WQC) (mg/L) in groundwater (GW), riverwater (RW) and municipal water (MW)
Water source GW1 GW2 RW MW
GPS S 25° 19.492 E 27° 49.767
S 25° 19.553 E 27° 49.894
S 25° 19.710 E 27° 49.650
House tap
WQC As 0.0012 0.0013 0.0015 0.0008 B 0.0053 0.0043 0.0043 0.0018 Ba 0.0590 0.0790 0.1335 0.0113 Be 0.0025 0.0035 0 0 Bi 0 0 0 0 Br (µg/L) 126 329.95 42.475 55 Br (mg/L) 0.1260 0.3300 0.0428 0.0550 Ca 96.405 116.48 32.2 34.455 Cd 0.00004 0.00003 0.0054 0.0005 Cl 77.825 107.57 23.63 25.825 Co 0.0017 0.0003 0.0001 0.0002 Cr 0.0064 0.0037 0.0032 0.0016 Cs 0.00003 0.00003 0.0002 0.00006 Cu 0.0023 0.0001 0.0038 0.0037 F 1.155 1.31 0.58 0.34 HCO3
- 289.445 346.175 146.705 174.155 Hg (μg) 0.9445 0.4205 0.2195 0.1460 I 0.0370 0.0191 0.0017 0.0098 La 0.00007 0.00005 0.0163 0.000004 Li 0.0037 0.0063 0.0007 0.0017 Mn 0.0209 0.00001 0.0045 0.0456 Mo 0.0015 0.0003 0.0016 0.0008 Na 70.29 89.645 31.64 26.61 Ni 0.0046 0.0028 0.00003 0.0010 NO2
1.775 0 0 0.52 NO3
7.695 26.945 9.59 0.86 Pb 0.0006 0.0004 0.0077 0.0042 Pt 0.00003 0.00002 0.0006 0.00002 Rb 0.0020 0.0029 0.0012 0.0048 SO4 43.56 25.225 21.205 23.305 Sb 0.0002 0.0003 0 0.0001 Se 0.0023 0.0037 0.0875 0.0016 Sn 0 0 0 0 Sr 0.3073 0.4286 0.0604 0.0741 Te 0.000002 0 0.00003 0
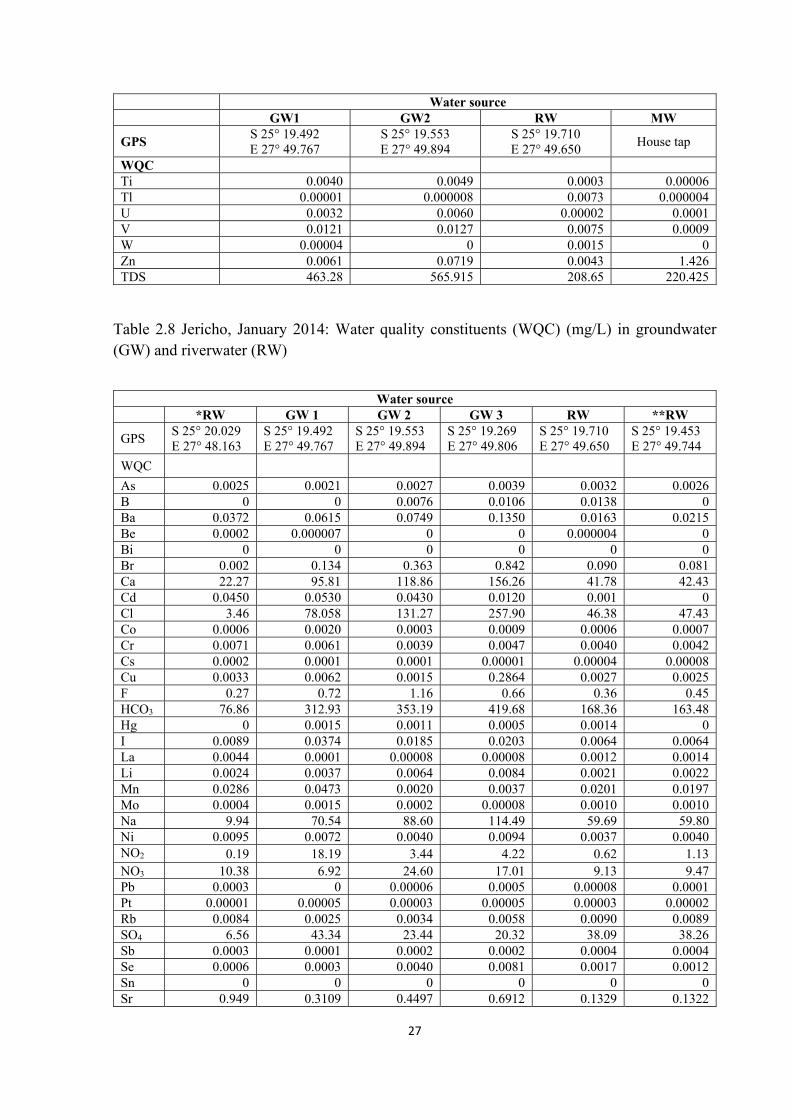
27
Water source GW1 GW2 RW MW
GPS S 25° 19.492 E 27° 49.767
S 25° 19.553 E 27° 49.894
S 25° 19.710 E 27° 49.650
House tap
WQC Ti 0.0040 0.0049 0.0003 0.00006 Tl 0.00001 0.000008 0.0073 0.000004 U 0.0032 0.0060 0.00002 0.0001 V 0.0121 0.0127 0.0075 0.0009 W 0.00004 0 0.0015 0 Zn 0.0061 0.0719 0.0043 1.426 TDS 463.28 565.915 208.65 220.425
Table 2.8 Jericho, January 2014: Water quality constituents (WQC) (mg/L) in groundwater (GW) and riverwater (RW)
Water source *RW GW 1 GW 2 GW 3 RW **RW
GPS S 25° 20.029 E 27° 48.163
S 25° 19.492 E 27° 49.767
S 25° 19.553 E 27° 49.894
S 25° 19.269 E 27° 49.806
S 25° 19.710 E 27° 49.650
S 25° 19.453 E 27° 49.744
WQC
As 0.0025 0.0021 0.0027 0.0039 0.0032 0.0026 B 0 0 0.0076 0.0106 0.0138 0 Ba 0.0372 0.0615 0.0749 0.1350 0.0163 0.0215 Be 0.0002 0.000007 0 0 0.000004 0 Bi 0 0 0 0 0 0 Br 0.002 0.134 0.363 0.842 0.090 0.081 Ca 22.27 95.81 118.86 156.26 41.78 42.43 Cd 0.0450 0.0530 0.0430 0.0120 0.001 0 Cl 3.46 78.058 131.27 257.90 46.38 47.43 Co 0.0006 0.0020 0.0003 0.0009 0.0006 0.0007 Cr 0.0071 0.0061 0.0039 0.0047 0.0040 0.0042 Cs 0.0002 0.0001 0.0001 0.00001 0.00004 0.00008 Cu 0.0033 0.0062 0.0015 0.2864 0.0027 0.0025 F 0.27 0.72 1.16 0.66 0.36 0.45 HCO3 76.86 312.93 353.19 419.68 168.36 163.48 Hg 0 0.0015 0.0011 0.0005 0.0014 0 I 0.0089 0.0374 0.0185 0.0203 0.0064 0.0064 La 0.0044 0.0001 0.00008 0.00008 0.0012 0.0014 Li 0.0024 0.0037 0.0064 0.0084 0.0021 0.0022 Mn 0.0286 0.0473 0.0020 0.0037 0.0201 0.0197 Mo 0.0004 0.0015 0.0002 0.00008 0.0010 0.0010 Na 9.94 70.54 88.60 114.49 59.69 59.80 Ni 0.0095 0.0072 0.0040 0.0094 0.0037 0.0040 NO2 0.19 18.19 3.44 4.22 0.62 1.13 NO3 10.38 6.92 24.60 17.01 9.13 9.47 Pb 0.0003 0 0.00006 0.0005 0.00008 0.0001 Pt 0.00001 0.00005 0.00003 0.00005 0.00003 0.00002 Rb 0.0084 0.0025 0.0034 0.0058 0.0090 0.0089 SO4 6.56 43.34 23.44 20.32 38.09 38.26 Sb 0.0003 0.0001 0.0002 0.0002 0.0004 0.0004 Se 0.0006 0.0003 0.0040 0.0081 0.0017 0.0012 Sn 0 0 0 0 0 0 Sr 0.949 0.3109 0.4497 0.6912 0.1329 0.1322
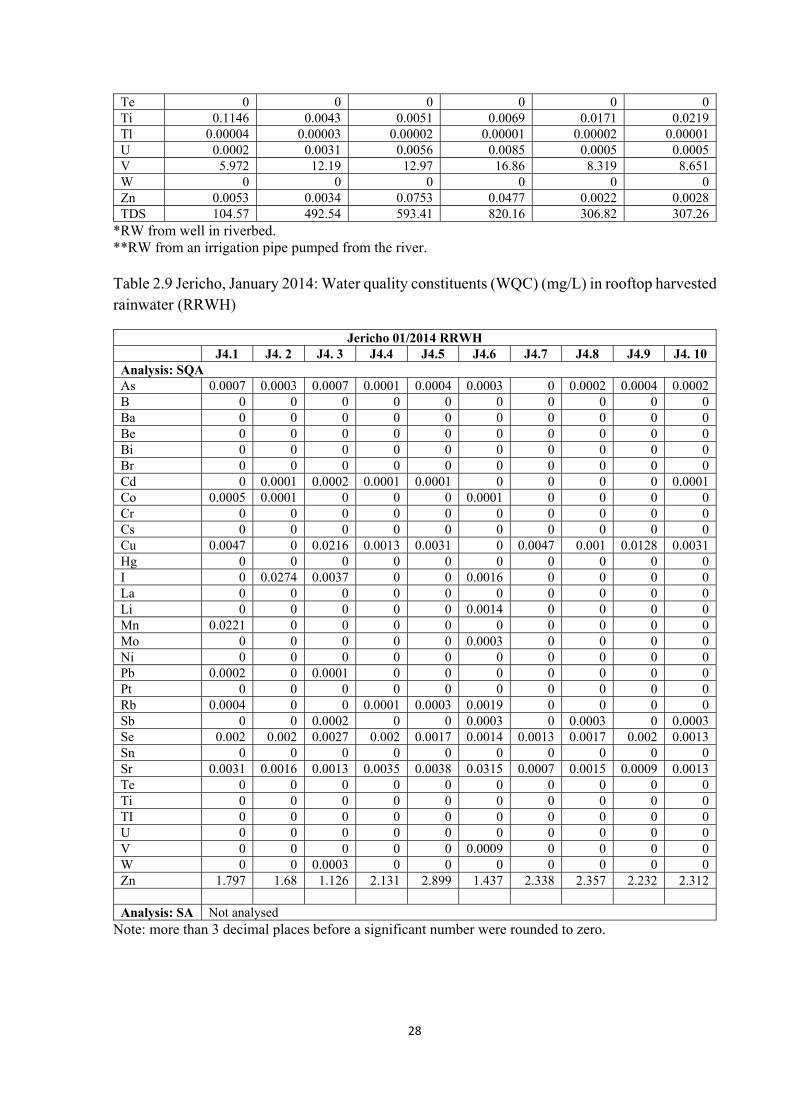
28
*RW from well in riverbed. **RW from an irrigation pipe pumped from the river. Table 2.9 Jericho, January 2014: Water quality constituents (WQC) (mg/L) in rooftop harvested rainwater (RRWH)
Jericho 01/2014 RRWH J4.1 J4. 2 J4. 3 J4.4 J4.5 J4.6 J4.7 J4.8 J4.9 J4. 10
Analysis: SQA As 0.0007 0.0003 0.0007 0.0001 0.0004 0.0003 0 0.0002 0.0004 0.0002 B 0 0 0 0 0 0 0 0 0 0 Ba 0 0 0 0 0 0 0 0 0 0 Be 0 0 0 0 0 0 0 0 0 0 Bi 0 0 0 0 0 0 0 0 0 0 Br 0 0 0 0 0 0 0 0 0 0 Cd 0 0.0001 0.0002 0.0001 0.0001 0 0 0 0 0.0001 Co 0.0005 0.0001 0 0 0 0.0001 0 0 0 0 Cr 0 0 0 0 0 0 0 0 0 0 Cs 0 0 0 0 0 0 0 0 0 0 Cu 0.0047 0 0.0216 0.0013 0.0031 0 0.0047 0.001 0.0128 0.0031 Hg 0 0 0 0 0 0 0 0 0 0 I 0 0.0274 0.0037 0 0 0.0016 0 0 0 0 La 0 0 0 0 0 0 0 0 0 0 Li 0 0 0 0 0 0.0014 0 0 0 0 Mn 0.0221 0 0 0 0 0 0 0 0 0 Mo 0 0 0 0 0 0.0003 0 0 0 0 Ni 0 0 0 0 0 0 0 0 0 0 Pb 0.0002 0 0.0001 0 0 0 0 0 0 0 Pt 0 0 0 0 0 0 0 0 0 0 Rb 0.0004 0 0 0.0001 0.0003 0.0019 0 0 0 0 Sb 0 0 0.0002 0 0 0.0003 0 0.0003 0 0.0003 Se 0.002 0.002 0.0027 0.002 0.0017 0.0014 0.0013 0.0017 0.002 0.0013 Sn 0 0 0 0 0 0 0 0 0 0 Sr 0.0031 0.0016 0.0013 0.0035 0.0038 0.0315 0.0007 0.0015 0.0009 0.0013 Te 0 0 0 0 0 0 0 0 0 0 Ti 0 0 0 0 0 0 0 0 0 0 TI 0 0 0 0 0 0 0 0 0 0 U 0 0 0 0 0 0 0 0 0 0 V 0 0 0 0 0 0.0009 0 0 0 0 W 0 0 0.0003 0 0 0 0 0 0 0 Zn 1.797 1.68 1.126 2.131 2.899 1.437 2.338 2.357 2.232 2.312 Analysis: SA Not analysed
Note: more than 3 decimal places before a significant number were rounded to zero.
Te 0 0 0 0 0 0 Ti 0.1146 0.0043 0.0051 0.0069 0.0171 0.0219 Tl 0.00004 0.00003 0.00002 0.00001 0.00002 0.00001 U 0.0002 0.0031 0.0056 0.0085 0.0005 0.0005 V 5.972 12.19 12.97 16.86 8.319 8.651 W 0 0 0 0 0 0 Zn 0.0053 0.0034 0.0753 0.0477 0.0022 0.0028 TDS 104.57 492.54 593.41 820.16 306.82 307.26
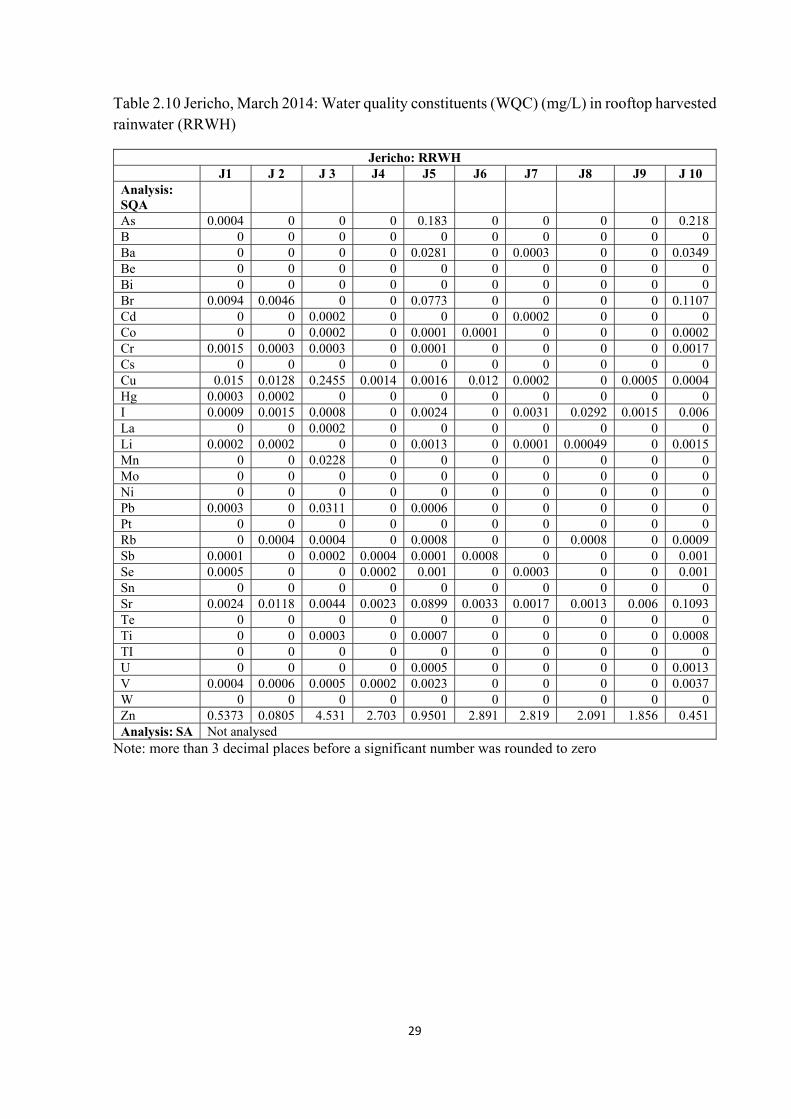
29
Table 2.10 Jericho, March 2014: Water quality constituents (WQC) (mg/L) in rooftop harvested rainwater (RRWH)
Jericho: RRWH J1 J 2 J 3 J4 J5 J6 J7 J8 J9 J 10
Analysis: SQA
As 0.0004 0 0 0 0.183 0 0 0 0 0.218 B 0 0 0 0 0 0 0 0 0 0 Ba 0 0 0 0 0.0281 0 0.0003 0 0 0.0349 Be 0 0 0 0 0 0 0 0 0 0 Bi 0 0 0 0 0 0 0 0 0 0 Br 0.0094 0.0046 0 0 0.0773 0 0 0 0 0.1107 Cd 0 0 0.0002 0 0 0 0.0002 0 0 0 Co 0 0 0.0002 0 0.0001 0.0001 0 0 0 0.0002 Cr 0.0015 0.0003 0.0003 0 0.0001 0 0 0 0 0.0017 Cs 0 0 0 0 0 0 0 0 0 0 Cu 0.015 0.0128 0.2455 0.0014 0.0016 0.012 0.0002 0 0.0005 0.0004 Hg 0.0003 0.0002 0 0 0 0 0 0 0 0 I 0.0009 0.0015 0.0008 0 0.0024 0 0.0031 0.0292 0.0015 0.006 La 0 0 0.0002 0 0 0 0 0 0 0 Li 0.0002 0.0002 0 0 0.0013 0 0.0001 0.00049 0 0.0015 Mn 0 0 0.0228 0 0 0 0 0 0 0 Mo 0 0 0 0 0 0 0 0 0 0 Ni 0 0 0 0 0 0 0 0 0 0 Pb 0.0003 0 0.0311 0 0.0006 0 0 0 0 0 Pt 0 0 0 0 0 0 0 0 0 0 Rb 0 0.0004 0.0004 0 0.0008 0 0 0.0008 0 0.0009 Sb 0.0001 0 0.0002 0.0004 0.0001 0.0008 0 0 0 0.001 Se 0.0005 0 0 0.0002 0.001 0 0.0003 0 0 0.001 Sn 0 0 0 0 0 0 0 0 0 0 Sr 0.0024 0.0118 0.0044 0.0023 0.0899 0.0033 0.0017 0.0013 0.006 0.1093 Te 0 0 0 0 0 0 0 0 0 0 Ti 0 0 0.0003 0 0.0007 0 0 0 0 0.0008 TI 0 0 0 0 0 0 0 0 0 0 U 0 0 0 0 0.0005 0 0 0 0 0.0013 V 0.0004 0.0006 0.0005 0.0002 0.0023 0 0 0 0 0.0037 W 0 0 0 0 0 0 0 0 0 0 Zn 0.5373 0.0805 4.531 2.703 0.9501 2.891 2.819 2.091 1.856 0.451 Analysis: SA Not analysed
Note: more than 3 decimal places before a significant number was rounded to zero
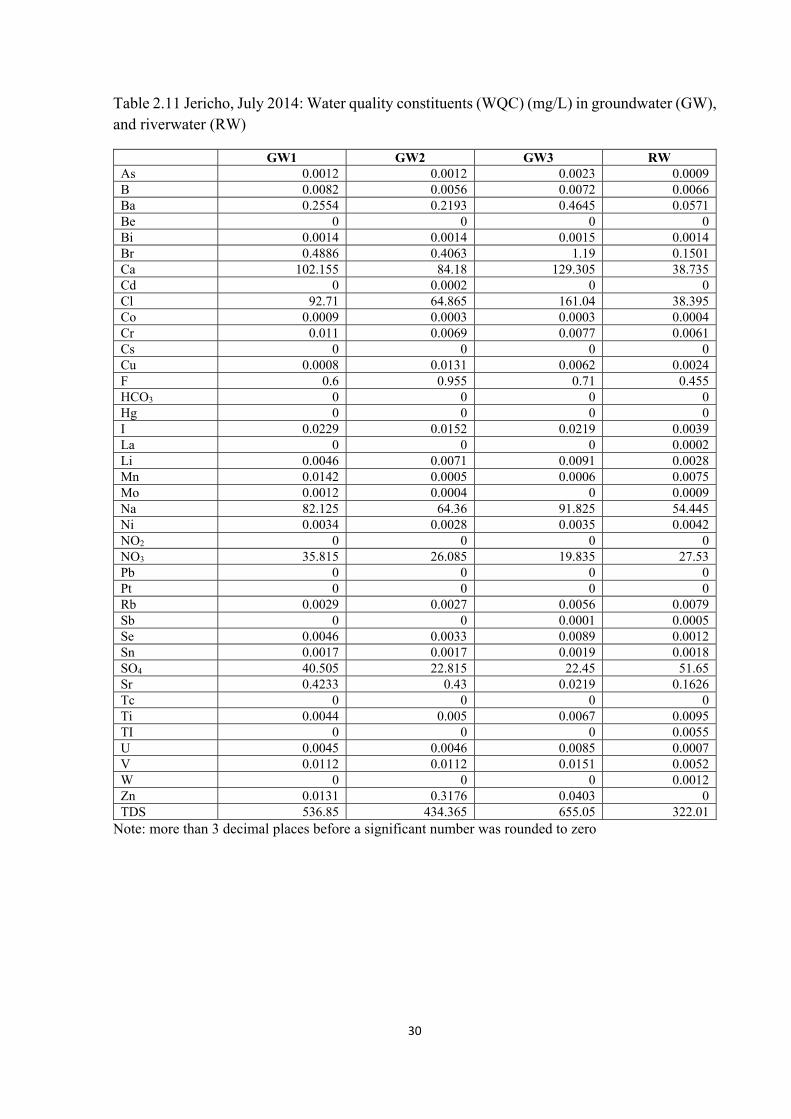
30
Table 2.11 Jericho, July 2014: Water quality constituents (WQC) (mg/L) in groundwater (GW), and riverwater (RW)
GW1 GW2 GW3 RW As 0.0012 0.0012 0.0023 0.0009 B 0.0082 0.0056 0.0072 0.0066 Ba 0.2554 0.2193 0.4645 0.0571 Be 0 0 0 0 Bi 0.0014 0.0014 0.0015 0.0014 Br 0.4886 0.4063 1.19 0.1501 Ca 102.155 84.18 129.305 38.735 Cd 0 0.0002 0 0 Cl 92.71 64.865 161.04 38.395 Co 0.0009 0.0003 0.0003 0.0004 Cr 0.011 0.0069 0.0077 0.0061 Cs 0 0 0 0 Cu 0.0008 0.0131 0.0062 0.0024 F 0.6 0.955 0.71 0.455 HCO3 0 0 0 0 Hg 0 0 0 0 I 0.0229 0.0152 0.0219 0.0039 La 0 0 0 0.0002 Li 0.0046 0.0071 0.0091 0.0028 Mn 0.0142 0.0005 0.0006 0.0075 Mo 0.0012 0.0004 0 0.0009 Na 82.125 64.36 91.825 54.445 Ni 0.0034 0.0028 0.0035 0.0042 NO2
0 0 0 0 NO3
35.815 26.085 19.835 27.53 Pb 0 0 0 0 Pt 0 0 0 0 Rb 0.0029 0.0027 0.0056 0.0079 Sb 0 0 0.0001 0.0005 Se 0.0046 0.0033 0.0089 0.0012 Sn 0.0017 0.0017 0.0019 0.0018 SO4
40.505 22.815 22.45 51.65 Sr 0.4233 0.43 0.0219 0.1626 Tc 0 0 0 0 Ti 0.0044 0.005 0.0067 0.0095 TI 0 0 0 0.0055 U 0.0045 0.0046 0.0085 0.0007 V 0.0112 0.0112 0.0151 0.0052 W 0 0 0 0.0012 Zn 0.0131 0.3176 0.0403 0 TDS 536.85 434.365 655.05 322.01
Note: more than 3 decimal places before a significant number was rounded to zero
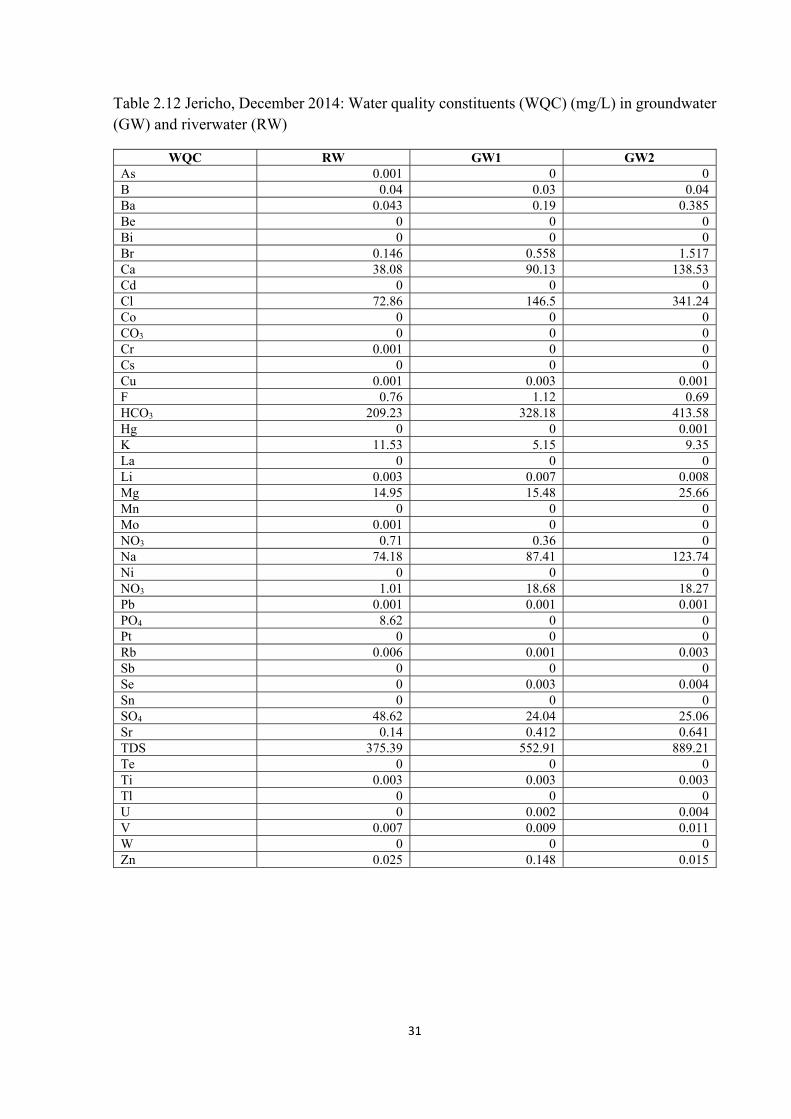
31
Table 2.12 Jericho, December 2014: Water quality constituents (WQC) (mg/L) in groundwater (GW) and riverwater (RW)
WQC RW GW1 GW2 As 0.001 0 0 B 0.04 0.03 0.04 Ba 0.043 0.19 0.385 Be 0 0 0 Bi 0 0 0 Br 0.146 0.558 1.517 Ca 38.08 90.13 138.53 Cd 0 0 0 Cl 72.86 146.5 341.24 Co 0 0 0 CO3 0 0 0 Cr 0.001 0 0 Cs 0 0 0 Cu 0.001 0.003 0.001 F 0.76 1.12 0.69 HCO3 209.23 328.18 413.58 Hg 0 0 0.001 K 11.53 5.15 9.35 La 0 0 0 Li 0.003 0.007 0.008 Mg 14.95 15.48 25.66 Mn 0 0 0 Mo 0.001 0 0 NO3 0.71 0.36 0 Na 74.18 87.41 123.74 Ni 0 0 0 NO3 1.01 18.68 18.27 Pb 0.001 0.001 0.001 PO4 8.62 0 0 Pt 0 0 0 Rb 0.006 0.001 0.003 Sb 0 0 0 Se 0 0.003 0.004 Sn 0 0 0 SO4 48.62 24.04 25.06 Sr 0.14 0.412 0.641 TDS 375.39 552.91 889.21 Te 0 0 0 Ti 0.003 0.003 0.003 Tl 0 0 0 U 0 0.002 0.004 V 0.007 0.009 0.011 W 0 0 0 Zn 0.025 0.148 0.015

32
Table 2.13. Jericho, December 2014: Water quality constituents (WQC) (mg/L) in groundwater (GW) and riverwater (RW)
WQC RW GW GW B 0.04 0.03 0.04 Ca 38.08 90.13 138.53 Cl 72.86 146.5 341.24 CO3 0 0 0 F 0.76 1.12 0.69 HCO3 209.23 328.18 413.58 K 11.53 5.15 9.35 Mg 14.95 15.48 25.66 NO3 0.71 0.36 0 Na 74.18 87.41 123.74 NO3 1.01 18.68 18.27 PO4 8.62 0 0 SO4 48.62 24.04 25.06 TDS 375.39 552.91 889.21
Table 2.14 Ga-Molepane, December, 2013: Water quality constituents (WQC) (mg/L) in rooftop harvested rainwater (RRWH) collected in Ferro-concrete tanks (F tanks) and plastic tanks (P tanks) and riverwater (RW)
WQC
mg/L RRWH F tanks P tanks RW
Max Min Mean Max Min Mean Max Min Mean As 0.0005 0.0000 0.0001 0.0003 0.0000 0.0001 0.0005 0.0000 0.0002 0.0008 B 0.0835 0.0082 0.0448 0.0772 0.0170 0.0390 0.0835 0.0082 0.0506 - Ba 0.0376 0.0000 0.0117 0.0285 0.0000 0.0138 0.0376 0.0000 0.0096 0.0097 Be 0.0001 0.0000 0.0000 0.0001 0.0000 0.0000 0.0001 0.0000 0.0000 - Bi 0.0000 0.0000 0.0000 0.0000 0.0000 0.0000 0.0000 0.0000 0.0000 - Br 0.0645 0.0038 0.0159 0.0546 0.0041 0.0184 0.0645 0.0038 0.0135 0.0321 Cd 0.1738 0.0020 0.0632 0.1139 0.0170 0.0484 0.1738 0.0020 0.0779 0.1438 Co 0.0010 0.0000 0.0002 0.0010 0.0000 0.0002 0.0004 0.0000 0.0001 0.0005 Cr 0.0222 0.0005 0.0025 0.0222 0.0006 0.0036 0.0030 0.0005 0.0014 0.0049 Cs 0.0001 0.0000 0.0000 0.0001 0.0000 0.0000 0.0001 0.0000 0.0000 - Cu 0.0505 0.0001 0.0116 0.0505 0.0001 0.0141 0.0221 0.0007 0.0091 0.0047 Hg 0.1838 0.0000 0.0102 0.0000 0.0000 0.0000 0.1838 0.0000 0.0204 0.9374 I 0.0013 0.0000 0.0005 0.0009 0.0000 0.0004 0.0013 0.0000 0.0006 0.0045 La 0.0000 0.0000 0.0000 0.0000 0.0000 0.0000 0.0000 0.0000 0.0000 0.0001 Li 0.0111 0.0003 0.0042 0.0103 0.0003 0.0050 0.0111 0.0005 0.0035 0.0007 Mn 0.0226 0.0001 0.0054 0.0099 0.0005 0.0039 0.0226 0.0001 0.0069 0.0027 Mo 0.0004 0.0000 0.0001 0.0004 0.0000 0.0001 0.0003 0.0000 0.0001 0.0002 Ni 0.0195 0.0000 0.0018 0.0195 0.0000 0.0024 0.0067 0.0000 0.0012 0.0256 Pb 0.0041 0.0000 0.0010 0.0041 0.0000 0.0012 0.0041 0.0001 0.0009 0.0003 Pt 0.0001 0.0000 0.0000 0.0000 0.0000 0.0000 0.0001 0.0000 0.0000 - Rb 0.0023 0.0002 0.0009 0.0023 0.0003 0.0010 0.0012 0.0002 0.0007 0.0017 Sb 0.0003 0.0000 0.0001 0.0002 0.0000 0.0001 0.0003 0.0000 0.0001 0.0003 Se 0.0010 0.0000 0.0002 0.0009 0.0000 0.0002 0.0010 0.0000 0.0002 0.0009 Sn 0.0008 0.0000 0.0001 0.0008 0.0000 0.0001 0.0007 0.0000 0.0001 - Sr 0.0539 0.0019 0.0156 0.0462 0.0019 0.0167 0.0539 0.0019 0.0145 0.0991 Ti 0.0029 0.0000 0.0011 0.0021 0.0000 0.0008 0.0029 0.0002 0.0014 0.0055 Tl 0.0000 0.0000 0.0000 0.0000 0.0000 0.0000 0.0000 0.0000 0.0000 - U 0.0003 0.0000 0.0001 0.0003 0.0000 0.0001 0.0003 0.0000 0.0000 0.0004 V 0.0048 0.0001 0.0016 0.0048 0.0002 0.0023 0.0023 0.0001 0.0008 0.0233

33
WQC
mg/L RRWH F tanks P tanks RW
W 0.0001 0.0000 0.0000 0.0001 0.0000 0.0000 0.0001 0.0000 0.0000 0.0005 Zn 9.6050 0.6462 2.7138 3.8706 0.6462 1.8133 9.6050 0.8920 3.6143 0.0001
Table 2.15 Ga-Molepane, December 2013: Water quality constituents (WQC) (mg/L) in rooftop harvested rainwater (RRWH)
WQC mg/L
RRWH
Min Max Mean As - 0.0002 0.0001 B 0.0099 0.0716 0.0308 Ba - 0.0264 0.0062 Be - 0.0001 0.0000 Bi - 0.0019 0.0002 Br 0.0029 0.0075 0.0046 Cd - 0.4695 0.0599 Co 0.0000 0.0010 0.0002 Cr 0.0002 0.0064 0.0043 Cs - 0.0001 0.0000 Cu - 0.0005 0.0002 Hg - - - I 0.0002 0.0006 0.0003 La - 0.0008 0.0001 Li 0.0004 0.0043 0.0029 Mn 0.0001 0.0468 0.0053 Mo - 0.0003 0.0001 Ni - 0.1051 0.0122 Pb 0.0001 0.0078 0.0011 Pt - 0.0000 0.0000 Rb 0.0001 0.0028 0.0017 Sb 0.0001 0.0002 0.0001 Se - 0.0002 0.0000 Sn - 0.0008 0.0001 Sr 0.0033 0.0204 0.0147 Ti - 0.0031 0.0011 Tl - - - U - 0.0001 0.0000 V 0.0002 0.0068 0.0045 W - 0.0001 0.0000 Zn - 0.0698 0.0160
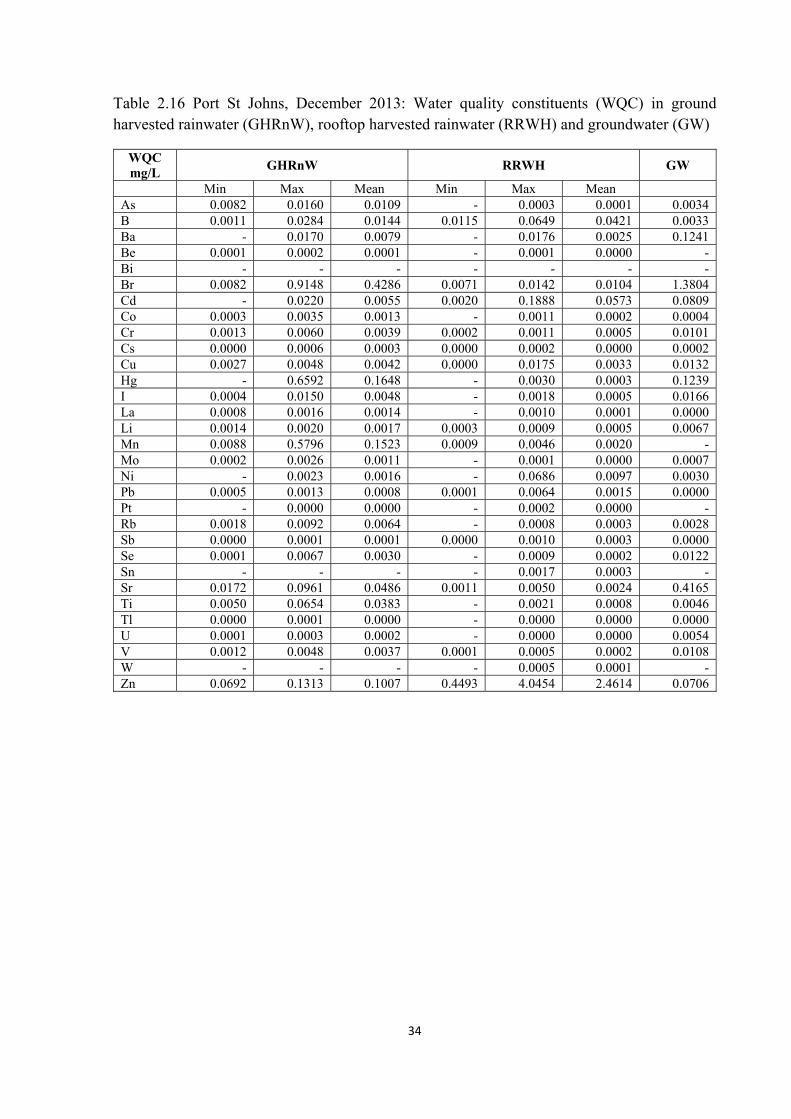
34
Table 2.16 Port St Johns, December 2013: Water quality constituents (WQC) in ground harvested rainwater (GHRnW), rooftop harvested rainwater (RRWH) and groundwater (GW)
WQC mg/L
GHRnW RRWH GW
Min Max Mean Min Max Mean As 0.0082 0.0160 0.0109 - 0.0003 0.0001 0.0034 B 0.0011 0.0284 0.0144 0.0115 0.0649 0.0421 0.0033 Ba - 0.0170 0.0079 - 0.0176 0.0025 0.1241 Be 0.0001 0.0002 0.0001 - 0.0001 0.0000 - Bi - - - - - - - Br 0.0082 0.9148 0.4286 0.0071 0.0142 0.0104 1.3804 Cd - 0.0220 0.0055 0.0020 0.1888 0.0573 0.0809 Co 0.0003 0.0035 0.0013 - 0.0011 0.0002 0.0004 Cr 0.0013 0.0060 0.0039 0.0002 0.0011 0.0005 0.0101 Cs 0.0000 0.0006 0.0003 0.0000 0.0002 0.0000 0.0002 Cu 0.0027 0.0048 0.0042 0.0000 0.0175 0.0033 0.0132 Hg - 0.6592 0.1648 - 0.0030 0.0003 0.1239 I 0.0004 0.0150 0.0048 - 0.0018 0.0005 0.0166 La 0.0008 0.0016 0.0014 - 0.0010 0.0001 0.0000 Li 0.0014 0.0020 0.0017 0.0003 0.0009 0.0005 0.0067 Mn 0.0088 0.5796 0.1523 0.0009 0.0046 0.0020 - Mo 0.0002 0.0026 0.0011 - 0.0001 0.0000 0.0007 Ni - 0.0023 0.0016 - 0.0686 0.0097 0.0030 Pb 0.0005 0.0013 0.0008 0.0001 0.0064 0.0015 0.0000 Pt - 0.0000 0.0000 - 0.0002 0.0000 - Rb 0.0018 0.0092 0.0064 - 0.0008 0.0003 0.0028 Sb 0.0000 0.0001 0.0001 0.0000 0.0010 0.0003 0.0000 Se 0.0001 0.0067 0.0030 - 0.0009 0.0002 0.0122 Sn - - - - 0.0017 0.0003 - Sr 0.0172 0.0961 0.0486 0.0011 0.0050 0.0024 0.4165 Ti 0.0050 0.0654 0.0383 - 0.0021 0.0008 0.0046 Tl 0.0000 0.0001 0.0000 - 0.0000 0.0000 0.0000 U 0.0001 0.0003 0.0002 - 0.0000 0.0000 0.0054 V 0.0012 0.0048 0.0037 0.0001 0.0005 0.0002 0.0108 W - - - - 0.0005 0.0001 - Zn 0.0692 0.1313 0.1007 0.4493 4.0454 2.4614 0.0706
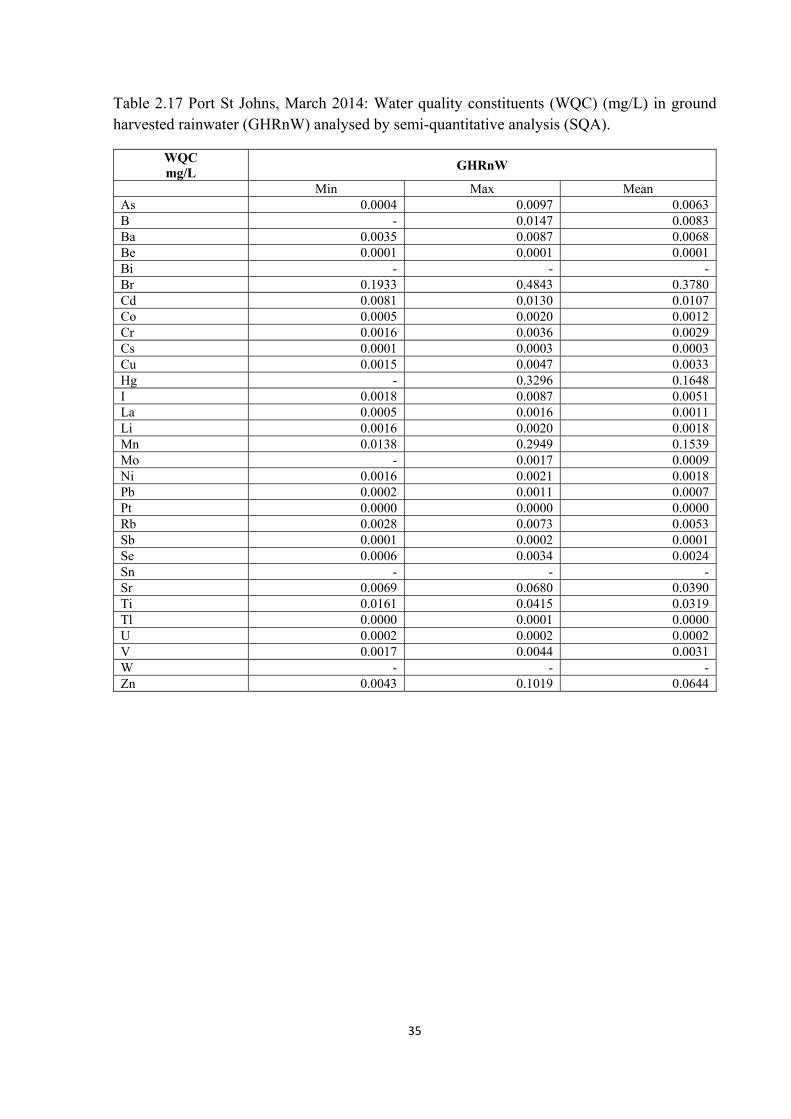
35
Table 2.17 Port St Johns, March 2014: Water quality constituents (WQC) (mg/L) in ground harvested rainwater (GHRnW) analysed by semi-quantitative analysis (SQA).
WQC mg/L
GHRnW
Min Max Mean As 0.0004 0.0097 0.0063 B - 0.0147 0.0083 Ba 0.0035 0.0087 0.0068 Be 0.0001 0.0001 0.0001 Bi - - - Br 0.1933 0.4843 0.3780 Cd 0.0081 0.0130 0.0107 Co 0.0005 0.0020 0.0012 Cr 0.0016 0.0036 0.0029 Cs 0.0001 0.0003 0.0003 Cu 0.0015 0.0047 0.0033 Hg - 0.3296 0.1648 I 0.0018 0.0087 0.0051 La 0.0005 0.0016 0.0011 Li 0.0016 0.0020 0.0018 Mn 0.0138 0.2949 0.1539 Mo - 0.0017 0.0009 Ni 0.0016 0.0021 0.0018 Pb 0.0002 0.0011 0.0007 Pt 0.0000 0.0000 0.0000 Rb 0.0028 0.0073 0.0053 Sb 0.0001 0.0002 0.0001 Se 0.0006 0.0034 0.0024 Sn - - - Sr 0.0069 0.0680 0.0390 Ti 0.0161 0.0415 0.0319 Tl 0.0000 0.0001 0.0000 U 0.0002 0.0002 0.0002 V 0.0017 0.0044 0.0031 W - - - Zn 0.0043 0.1019 0.0644
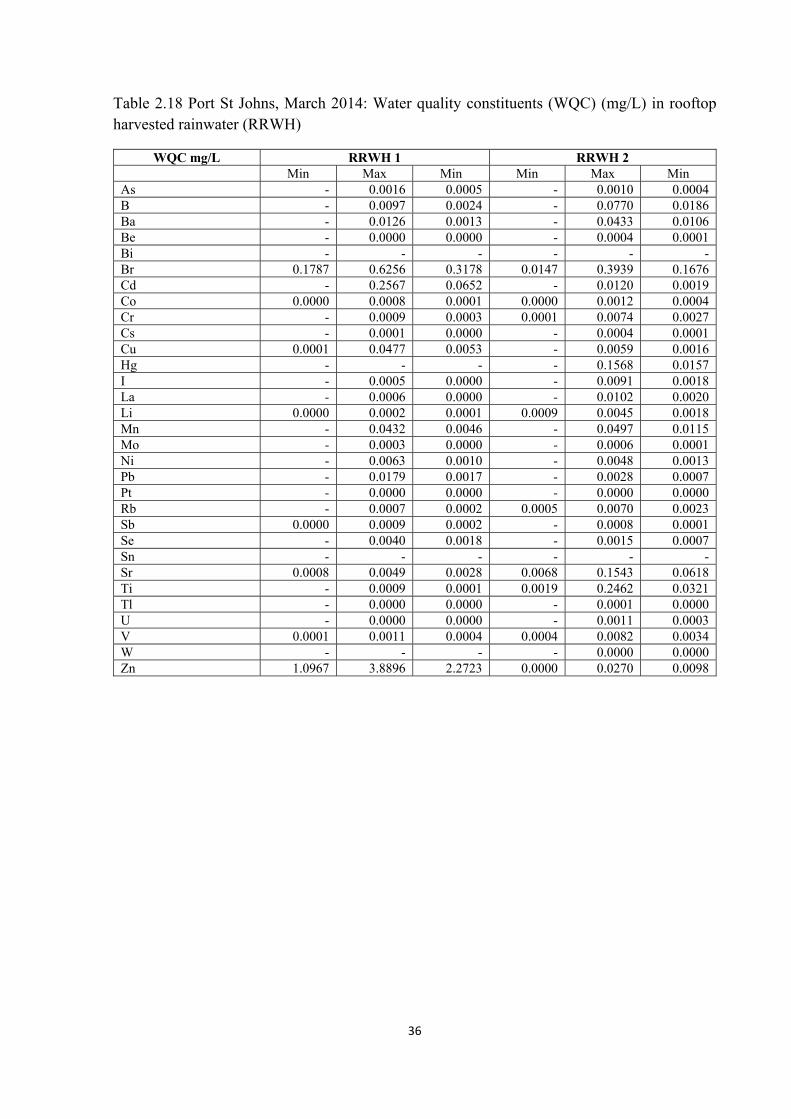
36
Table 2.18 Port St Johns, March 2014: Water quality constituents (WQC) (mg/L) in rooftop harvested rainwater (RRWH)
WQC mg/L RRWH 1 RRWH 2 Min Max Min Min Max Min
As - 0.0016 0.0005 - 0.0010 0.0004 B - 0.0097 0.0024 - 0.0770 0.0186 Ba - 0.0126 0.0013 - 0.0433 0.0106 Be - 0.0000 0.0000 - 0.0004 0.0001 Bi - - - - - - Br 0.1787 0.6256 0.3178 0.0147 0.3939 0.1676 Cd - 0.2567 0.0652 - 0.0120 0.0019 Co 0.0000 0.0008 0.0001 0.0000 0.0012 0.0004 Cr - 0.0009 0.0003 0.0001 0.0074 0.0027 Cs - 0.0001 0.0000 - 0.0004 0.0001 Cu 0.0001 0.0477 0.0053 - 0.0059 0.0016 Hg - - - - 0.1568 0.0157 I - 0.0005 0.0000 - 0.0091 0.0018 La - 0.0006 0.0000 - 0.0102 0.0020 Li 0.0000 0.0002 0.0001 0.0009 0.0045 0.0018 Mn - 0.0432 0.0046 - 0.0497 0.0115 Mo - 0.0003 0.0000 - 0.0006 0.0001 Ni - 0.0063 0.0010 - 0.0048 0.0013 Pb - 0.0179 0.0017 - 0.0028 0.0007 Pt - 0.0000 0.0000 - 0.0000 0.0000 Rb - 0.0007 0.0002 0.0005 0.0070 0.0023 Sb 0.0000 0.0009 0.0002 - 0.0008 0.0001 Se - 0.0040 0.0018 - 0.0015 0.0007 Sn - - - - - - Sr 0.0008 0.0049 0.0028 0.0068 0.1543 0.0618 Ti - 0.0009 0.0001 0.0019 0.2462 0.0321 Tl - 0.0000 0.0000 - 0.0001 0.0000 U - 0.0000 0.0000 - 0.0011 0.0003 V 0.0001 0.0011 0.0004 0.0004 0.0082 0.0034 W - - - - 0.0000 0.0000 Zn 1.0967 3.8896 2.2723 0.0000 0.0270 0.0098

37
Table 2.19 Port St Johns, December 2014: Water quality constituents (WQC) (mg/L) in groundwater (GW)
WQC EC3-GW1 EC3-GW2 EC3-GW3 EC3-GW4 EC3-GW5 EC3-GW6 As 0.002 0.002 0.001 0.002 0 0Ba 0.017 0.005 0.021 0.019 0.012 0.012Be 0 0 0 0 0 0Bi 0 0 0 0 0 0Br 0.235 0.243 0.371 0.341 0.064 0.055Cd 0 0 0 0 0 0Co 0.001 0.001 0 0 0 0Cr 0.001 0.001 0.003 0.002 0 0Cs 0 0 0 0 0 0Cu 0.004 0.003 0.003 0.003 0 0.001Hg 0.001 0.001 0.001 0 0.001 0La 0 0 0.001 0 0 0Li 0.001 0 0.004 0.004 0.002 0.002Mn 0.062 0.009 0.006 0.006 0.004 0.001Mo 0.002 0.001 0.001 0.001 0.004 0Ni 0 0 0 0 0 0Pb 0.001 0.002 0.003 0.002 0.001 0.001Pt 0 0 0 0 0 0Rb 0.002 0.002 0.002 0.002 0.001 0.001Sb 0 0 0 0 0 0Se 0.001 0.002 0.002 0.001 0 0Sn 0 0 0 0 0 0Sr 0.028 0.027 0.031 0.029 0.003 0.003Te 0 0 0 0 0 0Ti 0.011 0.009 0.058 0.056 0.006 0.005Tl 0 0 0 0 0 0U 0 0 0 0 0 0V 0.002 0.001 0.004 0.005 0 0W 0 0 0 0 0 0Zn 0.044 0.022 0.026 0.017 0.015 0.02

38
Table 2.20 Port St Johns, December 2014: Water quality constituents (WQC) (mg/L) in rooftop harvested rainwater (RRWH)
WQC EC3-
RRWH 2
EC3- RRWH
4
EC3- RRWH
4
EC3- RRWH
6
EC3- RRWH
7
EC3- RRWH
8
EC3- RRWH
9
EC3- RRWH
10
EC3- RRWH
11
EC3- RRWH
14 As 0 0 0 0 0 0 0 0 0 0 Ba 0.002 0.001 0.001 0.002 0 0.001 0.002 0.002 0.001 0.001 Be 0 0 0 0 0 0 0 0 0 0 Bi 0 0 0 0 0 0 0 0 0 0 Br 0.02 0.016 0.016 0.012 0.016 0.013 0.018 0.02 0.015 0.014 Cd 0 0 0 0 0 0 0 0 0 0 Co 0 0 0 0 0 0 0 0 0 0 Cr 0 0 0 0 0 0 0 0 0 0 Cs 0 0 0 0 0 0 0 0 0 0 Cu 0.005 0 0 0.002 0.001 0.001 0.001 0.001 0.001 0.001 Hg 0 0 0 0 0 0 0 0 0 0 La 0 0 0 0 0 0 0 0 0 0 Li 0 0 0 0 0 0 0 0 0 0 Mn 0 0.003 0.003 0.004 0.003 0 0.003 0.003 0 0.005 Mo 0 0 0 0 0 0 0 0 0 0 Ni 0 0 0 0 0 0 0 0 0 0 Pb 0.002 0.001 0.001 0.004 0.001 0.001 0.001 0.001 0.001 0.001 Pt 0 0 0 0 0 0 0 0 0 0 Rb 0 0 0 0 0 0 0 0 0 0 Sb 0 0 0 0 0 0 0 0 0 0 Se 0 0 0.002 0.001 0 0 0 0 0 0.001 Sn 0 0 0 0 0 0 0 0 0 0.001 Sr 0.002 0.001 0.002 0.001 0.002 0.004 0.004 0.004 0.004 0.001 Te 0 0 0 0 0 0 0 0 0 0 Ti 0 0 0 0 0 0 0.001 0.001 0 0 Tl 0 0 0 0 0 0 0 0 0 0 U 0 0 0 0 0 0 0 0 0 0 V 0 0 0 0 0 0 0 0 0 0 W 0 0 0 0 0 0 0 0 0 0 Zn 4.252 4.29 4.616 5.916 4.864 0.719 3.364 3.188 0.705 5.376
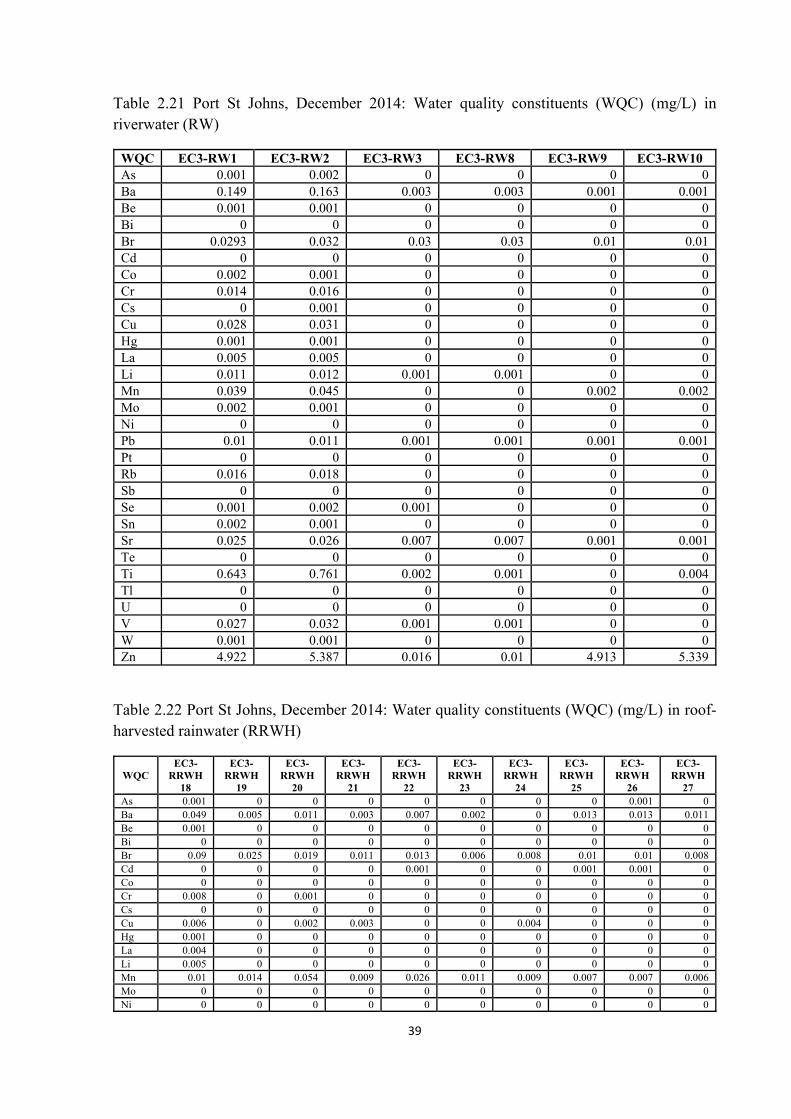
39
Table 2.21 Port St Johns, December 2014: Water quality constituents (WQC) (mg/L) in riverwater (RW)
WQC EC3-RW1 EC3-RW2 EC3-RW3 EC3-RW8 EC3-RW9 EC3-RW10 As 0.001 0.002 0 0 0 0Ba 0.149 0.163 0.003 0.003 0.001 0.001Be 0.001 0.001 0 0 0 0Bi 0 0 0 0 0 0Br 0.0293 0.032 0.03 0.03 0.01 0.01Cd 0 0 0 0 0 0Co 0.002 0.001 0 0 0 0Cr 0.014 0.016 0 0 0 0Cs 0 0.001 0 0 0 0Cu 0.028 0.031 0 0 0 0Hg 0.001 0.001 0 0 0 0La 0.005 0.005 0 0 0 0Li 0.011 0.012 0.001 0.001 0 0Mn 0.039 0.045 0 0 0.002 0.002Mo 0.002 0.001 0 0 0 0Ni 0 0 0 0 0 0Pb 0.01 0.011 0.001 0.001 0.001 0.001Pt 0 0 0 0 0 0Rb 0.016 0.018 0 0 0 0Sb 0 0 0 0 0 0Se 0.001 0.002 0.001 0 0 0Sn 0.002 0.001 0 0 0 0Sr 0.025 0.026 0.007 0.007 0.001 0.001Te 0 0 0 0 0 0Ti 0.643 0.761 0.002 0.001 0 0.004Tl 0 0 0 0 0 0U 0 0 0 0 0 0V 0.027 0.032 0.001 0.001 0 0W 0.001 0.001 0 0 0 0Zn 4.922 5.387 0.016 0.01 4.913 5.339
Table 2.22 Port St Johns, December 2014: Water quality constituents (WQC) (mg/L) in roof- harvested rainwater (RRWH)
WQC EC3-
RRWH 18
EC3-RRWH
19
EC3-RRWH
20
EC3-RRWH
21
EC3-RRWH
22
EC3-RRWH
23
EC3-RRWH
24
EC3-RRWH
25
EC3-RRWH
26
EC3-RRWH
27 As 0.001 0 0 0 0 0 0 0 0.001 0 Ba 0.049 0.005 0.011 0.003 0.007 0.002 0 0.013 0.013 0.011 Be 0.001 0 0 0 0 0 0 0 0 0 Bi 0 0 0 0 0 0 0 0 0 0 Br 0.09 0.025 0.019 0.011 0.013 0.006 0.008 0.01 0.01 0.008 Cd 0 0 0 0 0.001 0 0 0.001 0.001 0 Co 0 0 0 0 0 0 0 0 0 0 Cr 0.008 0 0.001 0 0 0 0 0 0 0 Cs 0 0 0 0 0 0 0 0 0 0 Cu 0.006 0 0.002 0.003 0 0 0.004 0 0 0 Hg 0.001 0 0 0 0 0 0 0 0 0 La 0.004 0 0 0 0 0 0 0 0 0 Li 0.005 0 0 0 0 0 0 0 0 0 Mn 0.01 0.014 0.054 0.009 0.026 0.011 0.009 0.007 0.007 0.006 Mo 0 0 0 0 0 0 0 0 0 0 Ni 0 0 0 0 0 0 0 0 0 0
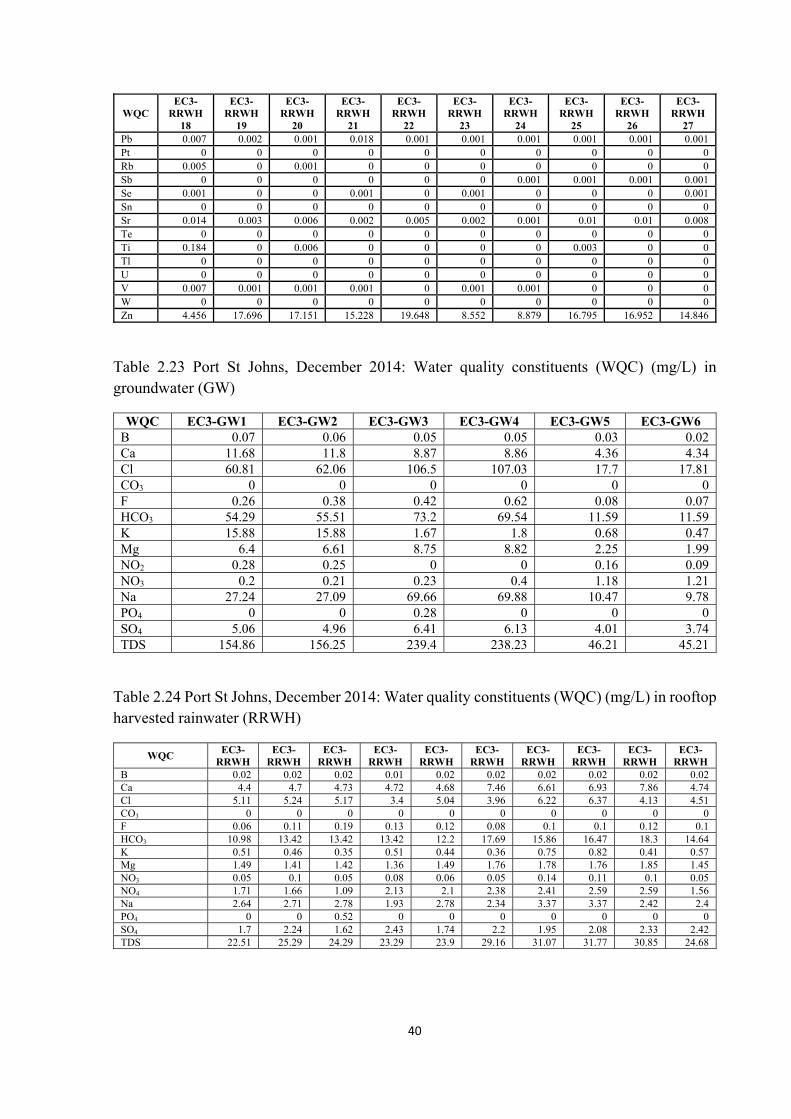
40
WQC EC3-
RRWH 18
EC3-RRWH
19
EC3-RRWH
20
EC3-RRWH
21
EC3-RRWH
22
EC3-RRWH
23
EC3-RRWH
24
EC3-RRWH
25
EC3-RRWH
26
EC3-RRWH
27 Pb 0.007 0.002 0.001 0.018 0.001 0.001 0.001 0.001 0.001 0.001 Pt 0 0 0 0 0 0 0 0 0 0 Rb 0.005 0 0.001 0 0 0 0 0 0 0 Sb 0 0 0 0 0 0 0.001 0.001 0.001 0.001 Se 0.001 0 0 0.001 0 0.001 0 0 0 0.001 Sn 0 0 0 0 0 0 0 0 0 0 Sr 0.014 0.003 0.006 0.002 0.005 0.002 0.001 0.01 0.01 0.008 Te 0 0 0 0 0 0 0 0 0 0 Ti 0.184 0 0.006 0 0 0 0 0.003 0 0 Tl 0 0 0 0 0 0 0 0 0 0 U 0 0 0 0 0 0 0 0 0 0 V 0.007 0.001 0.001 0.001 0 0.001 0.001 0 0 0 W 0 0 0 0 0 0 0 0 0 0 Zn 4.456 17.696 17.151 15.228 19.648 8.552 8.879 16.795 16.952 14.846
Table 2.23 Port St Johns, December 2014: Water quality constituents (WQC) (mg/L) in groundwater (GW)
WQC EC3-GW1 EC3-GW2 EC3-GW3 EC3-GW4 EC3-GW5 EC3-GW6 B 0.07 0.06 0.05 0.05 0.03 0.02 Ca 11.68 11.8 8.87 8.86 4.36 4.34 Cl 60.81 62.06 106.5 107.03 17.7 17.81 CO3 0 0 0 0 0 0 F 0.26 0.38 0.42 0.62 0.08 0.07 HCO3 54.29 55.51 73.2 69.54 11.59 11.59 K 15.88 15.88 1.67 1.8 0.68 0.47 Mg 6.4 6.61 8.75 8.82 2.25 1.99 NO2 0.28 0.25 0 0 0.16 0.09 NO3 0.2 0.21 0.23 0.4 1.18 1.21 Na 27.24 27.09 69.66 69.88 10.47 9.78 PO4 0 0 0.28 0 0 0 SO4 5.06 4.96 6.41 6.13 4.01 3.74 TDS 154.86 156.25 239.4 238.23 46.21 45.21
Table 2.24 Port St Johns, December 2014: Water quality constituents (WQC) (mg/L) in rooftop harvested rainwater (RRWH)
WQC EC3-
RRWH EC3-
RRWH EC3-
RRWH EC3-
RRWH EC3-
RRWH EC3-
RRWH EC3-
RRWH EC3-
RRWH EC3-
RRWH EC3-
RRWH B 0.02 0.02 0.02 0.01 0.02 0.02 0.02 0.02 0.02 0.02 Ca 4.4 4.7 4.73 4.72 4.68 7.46 6.61 6.93 7.86 4.74 Cl 5.11 5.24 5.17 3.4 5.04 3.96 6.22 6.37 4.13 4.51 CO3 0 0 0 0 0 0 0 0 0 0 F 0.06 0.11 0.19 0.13 0.12 0.08 0.1 0.1 0.12 0.1 HCO3 10.98 13.42 13.42 13.42 12.2 17.69 15.86 16.47 18.3 14.64 K 0.51 0.46 0.35 0.51 0.44 0.36 0.75 0.82 0.41 0.57 Mg 1.49 1.41 1.42 1.36 1.49 1.76 1.78 1.76 1.85 1.45 NO3 0.05 0.1 0.05 0.08 0.06 0.05 0.14 0.11 0.1 0.05 NO4 1.71 1.66 1.09 2.13 2.1 2.38 2.41 2.59 2.59 1.56 Na 2.64 2.71 2.78 1.93 2.78 2.34 3.37 3.37 2.42 2.4 PO4 0 0 0.52 0 0 0 0 0 0 0 SO4 1.7 2.24 1.62 2.43 1.74 2.2 1.95 2.08 2.33 2.42 TDS 22.51 25.29 24.29 23.29 23.9 29.16 31.07 31.77 30.85 24.68

41
Table 2.25 Port St Johns, December 2014: WQC (mg/L) of riverwater (RW) samples analysed by semi-quantitative (SQA) and standards analysis (SA)
WQC EC3-RW EC3-RW EC3-RW EC3-RW EC3-RW EC3-RW B 0.02 0.02 0.02 0.02 0.04 0.04 Ca 8.06 8.01 4.54 4.7 11.54 11.47 Cl 12.4 12.13 3.33 3.33 9.17 9.18 CO3 0 0 0 0 43.92 0 F 0.08 0.1 0.2 0.15 0.16 0.16 HCO3 34.16 34.77 14.64 14.64 60.15 42.7 K 0.36 0.16 0.44 0.48 7.08 7.88 Mg 4.93 5.04 1.48 1.39 5.49 5.64 NO2 0.06 0.13 0.05 0.07 0.16 0.09 NO3 0.05 0.12 1.1 1.02 3.74 3.18 Na 8.64 8.81 1.97 2.28 5.43 5.38 PO4 0 0 0 0.44 0 0 SO4 2.41 2.33 1.42 1.46 0 3.06 TDS 53.92 53.62 21.68 21.68 67.04 67.65
Table 2.26 Port St Johns, December 2014: WQC (mg/L) of rooftop harvested rainwater (RRWH) samples analysed by semi-quantitative (SQA) and standards analysis (SA)
WQC
EC3-RRWH
18
EC3- RRWH W 19
EC3- RRWH W 20
EC3- RRWH W 21
EC3- RRWH W 22
EC3- RRWH W 23
EC3- RRWH W 24
EC3- RRWH W 25
EC3- RRWH W 26
EC3- RRWH W 27
B 0.02 0.02 0.02 0.02 0.02 0.01 0.02 0.02 0.02 0.02 Ca 10.09 5.76 6.75 5.3 6.24 4.82 4.49 7.93 8.03 7.87 Cl 11.08 0.88 1.16 0.73 1.53 1.15 4.72 1.85 1.83 1.85 CO3 0 0 0 0 0 0 0 0 0 0 F 0.31 0.32 0.29 0.32 0.22 0.25 0.12 0.36 0.24 0.25 HCO3 21.35 12.81 10.37 9.76 15.86 9.15 6.1 20.13 20.74 21.35 K 2.01 0.55 0.89 0.73 0.74 0.47 0.27 0.81 0.69 0.62 Mg 2.59 1.27 1.55 1.17 1.27 1.15 1.19 1.34 1.34 1.34 NO2 0.07 0.18 0.08 0.15 0.25 0.21 0.12 0.15 0.13 0.13 NO3 3.71 4.29 9.04 4 5.75 2.71 4.13 4.59 4.48 4.49 Na 10.37 0.61 0.85 0.56 0.72 0.59 3.4 1.54 1.52 1.5 PO4 0 0 0 0 0 0.09 1.86 0.81 0.05 0 SO4 12.28 10.81 12.25 10.01 11.89 5.44 4.94 12.81 12.86 13.14 TDS 62.33 30.6 37.82 27.12 36.07 21.43 27.95 41.94 40.63 41.33
2.11 Seasonal comparisons between water sources Comparative values between water sources are shown in Tables 2.27 and 2.28. Seasonal changes in WQC (mg/L) (Table 2.28) occurred in the three sources GW, RW and RRWH. The symbol “+” signifies an increase and “–” a decrease. The greatest increases from summer to winter in GW were Br (+) and Zn (+), and decreases were Cd (-), Cu (-), Mn (-), Sr (-). RW remained quite stable with minor shifts in Se (-), Sr (-) and Ti (-). RRWH shifts from summer to winter were Hg (-), Mn (-), Sr (+) and Zn (-). GW showed major changes in Br, Cu, Hg, Sr and Zn. None of the changes in the WQC posed an increased risk.
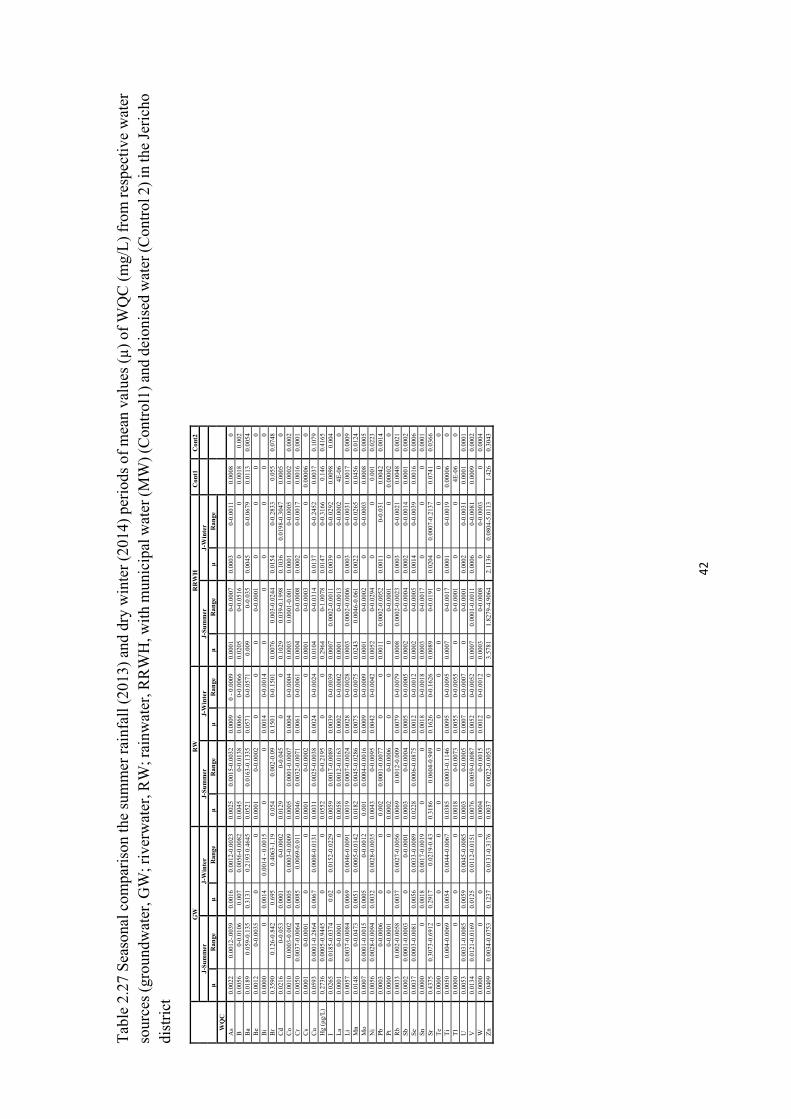
42
Tab
le 2
.27
Sea
sona
l com
pari
son
the
sum
mer
rai
nfal
l (20
13)
and
dry
win
ter
(201
4) p
erio
ds o
f m
ean
valu
es (
µ)
of W
QC
(m
g/L
) fr
om r
espe
ctiv
e w
ater
so
urce
s (g
roun
dwat
er, G
W; r
iver
wat
er, R
W; r
ainw
ater
, RR
WH
, wit
h m
unic
ipal
wat
er (M
W) (
Con
trol
1) a
nd d
eion
ised
wat
er (C
ontr
ol 2
) in
the
Jeri
cho
dist
rict
G
W
RW
R
RW
H
Con
t1
Con
t2
J-S
um
mer
J-
Win
ter
J-S
um
mer
J-
Win
ter
J-S
um
mer
J-
Win
ter
µ
Ran
ge
µ
Ran
ge
µ
Ran
ge
µ
Ran
ge
µ
Ran
ge
µ
Ran
ge
WQ
C
As
0.00
22
0.00
12-.
0039
0.
0016
0.
0012
-0.0
023
0.00
25
0.00
15-0
.003
2 0.
0009
0
- 0.
0009
0.
0001
0-
0.00
07
0.00
03
0-0.
0011
0.
0008
0
B
0.00
56
0-0.
0106
0.
007
0.00
56-0
.008
2 0.
0045
0-
0.01
38
0.00
66
0-0.
0066
0.
0205
0-
0.05
16
0 0
0.00
18
0.00
2 B
a 0.
0189
0.
059-
0.13
5 0.
3131
0.
2193
0.4
645
0.05
21
0.01
63-0
.133
5 0.
0571
0-
0.05
71
0.00
9 0-
0.03
5 0.
0045
0-
0.06
79
0.01
13
0.00
54
Be
0.00
12
0-0.
0035
0
0 0.
0001
0-
0.00
02
0 0
0 0-
0.00
01
0 0
0 0
Bi
0.00
00
0 0.
0014
0.
0014
- 0
.001
5 0
0 0.
0014
0-
0.00
14
0 0
0 0
0 0
Br
0.35
90
0.12
6-0.
842
0.69
5 0.
4063
-1.1
9 0.
054
0.00
2-0.
09
0.15
01
0-0.
1501
0.
0076
0.
003-
0.02
44
0.01
54
0-0.
2833
0.
055
0.07
48
Cd
0.02
16
0-0.
053
0.00
01
0-0.
0002
0.
0129
0-
0.04
5 0
0 0.
1029
0.
039-
0.19
98
0.10
36
0.01
98-0
.304
7 0.
0005
0
Co
0.00
10
0.00
03-0
.002
0.
0005
0.
0003
-0.0
009
0.00
05
0.00
01-0
.000
7 0.
0004
0-
0.00
04
0.00
03
0.00
01-0
.001
0.
0001
0-
0.00
05
0.00
02
0.00
02
Cr
0.00
50
0.00
37-0
.006
4 0.
0085
0.
0069
-0.0
11
0.00
46
0.00
32-0
.007
1 0.
0061
0-
0.00
61
0.00
04
0-0.
0008
0.
0002
0-
0.00
17
0.00
16
0.00
01
Cs
0.00
01
0-0.
0001
0
0 0.
0001
0-
0.00
02
0 0
0.00
01
0-0.
0003
0
0 0.
0000
6 0
Cu
0.05
93
0.00
01-0
.286
4 0.
0067
0.
0008
-0.0
131
0.00
31
0.00
25-0
.003
8 0.
0024
0-
0.00
24
0.01
04
0-0.
0314
0.
0137
0-
0.24
52
0.00
37
0.10
79
Hg
(μg/
L)
0.27
36
0.00
05-0
.944
5 0
0 0.
0552
0-
0.21
95
0 0
0.29
64
0-1.
0078
0.
0147
0-
0.31
66
0.14
6 0.
4165
I
0.02
65
0.01
85-0
.037
4 0.
02
0.01
52-0
.022
9 0.
0059
0.
0017
-0.0
089
0.00
39
0-0.
0039
0.
0007
0.
0002
-0.0
011
0.00
39
0-0.
0292
0.
0098
0.
004
La
0.00
01
0-0.
0001
0
0 0.
0058
0.
0012
-0.0
163
0.00
02
0-0.
0002
0.
0001
0-
0.00
13
0 0-
0.00
02
4E-0
6 0
Li
0.00
57
0.00
37-0
.008
4 0.
0069
0.
0046
-0.0
091
0.00
19
0.00
07-0
.002
4 0.
0028
0-
0.00
28
0.00
03
0.00
02-0
.000
6 0.
0003
0-
0.00
31
0.00
17
0.00
09
Mn
0.01
48
0-0.
0473
0.
0051
0.
0005
-0.0
142
0.01
82
0.00
45-0
.028
6 0.
0075
0-
0.00
75
0.02
43
0.00
46-0
.061
0.
0022
0-
0.02
65
0.04
56
0.01
24
Mo
0.00
07
0.00
01-0
.001
5 0.
0005
0-
0.00
12
0.00
1 0.
0004
-0.0
016
0.00
09
0-0.
0009
0.
0001
0-
0.00
02
0 0-
0.00
03
0.00
08
0.00
05
Ni
0.00
56
0.00
28-0
.009
4 0.
0032
0.
0028
-0.0
035
0.00
43
0-0.
0095
0.
0042
0-
0.00
42
0.00
52
0-0.
0294
0
0 0.
001
0.02
23
Pb
0.00
03
0-0.
0006
0
0 0.
002
0.00
01-0
.007
7 0
0 0.
0011
0.
0002
-0.0
052
0.00
11
0-0.
031
0.00
42
0.00
14
Pt
0.00
00
0-0.
0001
0
0 0.
0002
0-
0.00
06
0 0
0 0-
0.00
01
0 0
0.00
002
0 R
b 0.
0033
0.
002-
0.00
58
0.00
37
0.00
27-0
.005
6 0.
0069
0.
0012
-0.0
09
0.00
79
0-0.
0079
0.
0008
0.
0002
-0.0
023
0.00
03
0-0.
0021
0.
0048
0.
0021
S
b 0.
0002
0.
0001
-0.0
003
0 0-
0.00
01
0.00
03
0-0.
0004
0.
0005
0-
0.00
05
0.00
02
0-0.
0004
0.
0002
0-
0.00
14
0.00
01
0.00
02
Se
0.00
37
0.00
03-0
.008
1 0.
0056
0.
0033
-0.0
089
0.02
28
0.00
06-0
.087
5 0.
0012
0-
0.00
12
0.00
02
0-0.
0005
0.
0014
0-
0.00
39
0.00
16
0.00
06
Sn
0.00
00
0 0.
0018
0.
0017
-0.0
019
0 0
0.00
18
0-0.
0018
0.
0003
0-
0.00
17
0 0
0 0.
0001
S
r 0.
4375
0.
3073
-0.6
912
0.29
17
0.02
19-0
.43
0.31
86
0.06
04-0
.949
0.
1626
0-
0.16
26
0.00
89
0-0.
0191
0.
0204
0.
0007
-0.2
137
0.07
41
0.03
66
Te
0.00
00
0 0
0 0
0 0
0 0
0 0
0 0
0 T
i 0.
0050
0.
004-
0.00
69
0.00
54
0.00
44-0
.006
7 0.
0385
0.
0003
-0.1
146
0.00
95
0-0.
0095
0.
0007
0-
0.00
17
0.00
01
0-0.
0019
0.
0000
6 0
Tl
0.00
00
0 0
0 0.
0018
0-
0.00
73
0.00
55
0-0.
0055
0
0-0.
0001
0
0 4E
-06
0 U
0.
0053
0.
0031
-0.0
085
0.00
59
0.00
45-0
.008
5 0.
0003
0-
0.00
05
0.00
07
0-0.
0007
0
0-0.
0001
0.
0002
0-
0.00
31
0.00
01
0.00
01
V
0.01
34
0.01
21-0
.016
9 0.
0125
0.
0112
-0.0
151
0.00
76
0.00
59-0
.008
7 0.
0052
0-
0.00
52
0.00
07
0.00
01-0
.001
1 0.
0006
0-
0.00
81
0.00
09
0.00
02
W
0.00
00
0 0
0 0.
0004
0-
0.00
15
0.00
12
0-0.
0012
0.
0003
0-
0.00
08
0 0-
0.00
03
0 0.
0004
Z
n 0.
0409
0.
0034
-0.0
753
0.12
37
0.01
31-0
.317
6 0.
0037
0.
0022
-0.0
053
0 0
3.57
81
1.82
79-4
.906
4 2.
1136
0.
0804
-5.0
113
1.42
6 0.
3043

43
Table 2.28 Seasonal changes from summer rainfall (2013) to dry winter (2014) periods of mean values (µ) of WQC (mg/L) from respective water sources (groundwater, GW; riverwater, RW; rooftop harvested rainwater, RRWH) in the Jericho district where “-” indicates a decrease and “+”, an increase
GW RW RRWH
Summer Winter Summer Winter Summer Winter µ µ Δ µ µ Δ µ µ Δ
WQC As 0.0022 0.0016 - 0.0025 0.0009 - 0.0001 0.0003 + B 0.0056 0.007 - 0.0045 0.0066 + 0.0205 0 - Ba 0.0189 0.3131 + 0.0521 0.0571 + 0.009 0.0045 - Be 0.0012 0 - 0.0001 0 0 0 0 0 Bi 0.0000 0.0014 + 0 0.0014 + 0 0 0 Br 0.3590 0.695 + 0.054 0.1501 + 0.0076 0.0154 + Cd 0.0216 0.0001 - 0.0129 0 - 0.1029 0.1036 0 Co 0.0010 0.0005 - 0.0005 0.0004 0 0.0003 0.0001 0 Cr 0.0050 0.0085 + 0.0046 0.0061 + 0.0004 0.0002 0 Cs 0.0001 0 - 0.0001 0 0 0.0001 0 0 Cu 0.0593 0.0067 - 0.0031 0.0024 - 0.0104 0.0137 + Hg (μg/L) 0.2736 0 - 0.0552 0 - 0.2964 0.0147 - I 0.0265 0.02 - 0.0059 0.0039 - 0.0007 0.0039 + La 0.0001 0 - 0.0058 0.0002 - 0.0001 0 0 Li 0.0057 0.0069 + 0.0019 0.0028 + 0.0003 0.0003 0 Mn 0.0148 0.0051 - 0.0182 0.0075 - 0.0243 0.0022 - Mo 0.0007 0.0005 - 0.001 0.0009 - 0.0001 0 0 Ni 0.0056 0.0032 - 0.0043 0.0042 0 0.0052 0 - Pb 0.0003 0 - 0.002 0 - 0.0011 0.0011 0 Pt 0.0000 0 - 0.0002 0 0 0 0 0 Rb 0.0033 0.0037 + 0.0069 0.0079 + 0.0008 0.0003 0 Sb 0.0002 0 - 0.0003 0.0005 0 0.0002 0.0002 0 Se 0.0037 0.0056 + 0.0228 0.0012 - 0.0002 0.0014 + Sn 0.0000 0.0018 + 0 0.0018 + 0.0003 0 0 Sr 0.4375 0.2917 - 0.3186 0.1626 - 0.0089 0.0204 + Te 0.0000 0 0 0 0 0 0 0 0 Ti 0.0050 0.0054 + 0.0385 0.0095 - 0.0007 0.0001 - Tl 0.0000 0 0 0.0018 0.0055 + 0 0 0 U 0.0053 0.0059 + 0.0003 0.0007 + 0 0.0002 0 V 0.0134 0.0125 - 0.0076 0.0052 - 0.0007 0.0006 0 W 0.0000 0 0 0.0004 0.0012 + 0.0003 0 0 Zn 0.0409 0.1237 + 0.0037 0 - 3.5781 2.1136 -
2.12 Discussion of analytical results The results have been presented in terms of highlighting the anomalies of WQC that are potentially hazardous. The criteria used are the current South African Water Quality Guidelines Volume 1 for Domestic Use (SAWQG Dom, 1996) and the South African Water Quality Guidelines Volume 5 for Agriculture: Livestock Watering (SAWQG Livestock, 1996). International references come from WQG documents AUS and NZ (ANZECC, 1992, NHMRC, NRMMC, 2011), CAN (Olkowski, 2009) and the World Health Organisation Guidelines for Drinking Water (WHO, 2011). A clear difference exists between the WQG set out in the reference documents. In some instances the SAWQG are stricter and in other instances more lenient than the comparative references. This anomaly poses a questionable situation. In many instances, the source of the WQG cannot be found to corroborate the guideline value. Casey
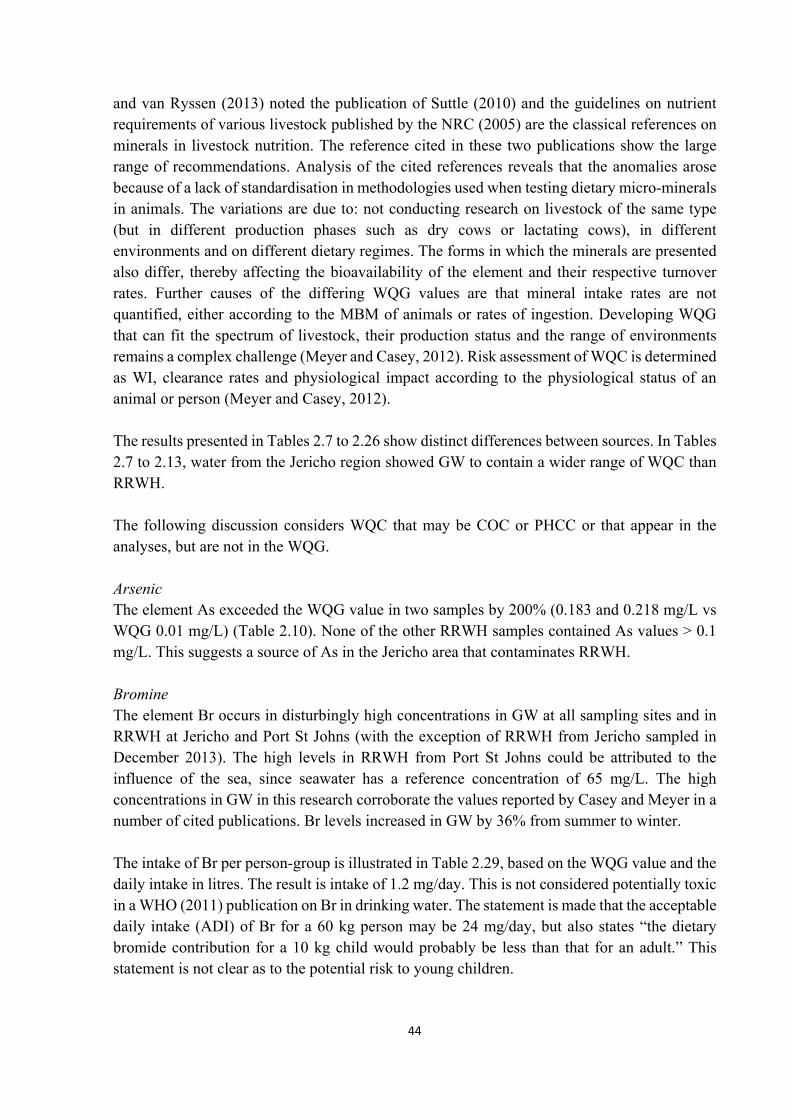
44
and van Ryssen (2013) noted the publication of Suttle (2010) and the guidelines on nutrient requirements of various livestock published by the NRC (2005) are the classical references on minerals in livestock nutrition. The reference cited in these two publications show the large range of recommendations. Analysis of the cited references reveals that the anomalies arose because of a lack of standardisation in methodologies used when testing dietary micro-minerals in animals. The variations are due to: not conducting research on livestock of the same type (but in different production phases such as dry cows or lactating cows), in different environments and on different dietary regimes. The forms in which the minerals are presented also differ, thereby affecting the bioavailability of the element and their respective turnover rates. Further causes of the differing WQG values are that mineral intake rates are not quantified, either according to the MBM of animals or rates of ingestion. Developing WQG that can fit the spectrum of livestock, their production status and the range of environments remains a complex challenge (Meyer and Casey, 2012). Risk assessment of WQC is determined as WI, clearance rates and physiological impact according to the physiological status of an animal or person (Meyer and Casey, 2012). The results presented in Tables 2.7 to 2.26 show distinct differences between sources. In Tables 2.7 to 2.13, water from the Jericho region showed GW to contain a wider range of WQC than RRWH. The following discussion considers WQC that may be COC or PHCC or that appear in the analyses, but are not in the WQG. Arsenic The element As exceeded the WQG value in two samples by 200% (0.183 and 0.218 mg/L vs WQG 0.01 mg/L) (Table 2.10). None of the other RRWH samples contained As values > 0.1 mg/L. This suggests a source of As in the Jericho area that contaminates RRWH. Bromine The element Br occurs in disturbingly high concentrations in GW at all sampling sites and in RRWH at Jericho and Port St Johns (with the exception of RRWH from Jericho sampled in December 2013). The high levels in RRWH from Port St Johns could be attributed to the influence of the sea, since seawater has a reference concentration of 65 mg/L. The high concentrations in GW in this research corroborate the values reported by Casey and Meyer in a number of cited publications. Br levels increased in GW by 36% from summer to winter. The intake of Br per person-group is illustrated in Table 2.29, based on the WQG value and the daily intake in litres. The result is intake of 1.2 mg/day. This is not considered potentially toxic in a WHO (2011) publication on Br in drinking water. The statement is made that the acceptable daily intake (ADI) of Br for a 60 kg person may be 24 mg/day, but also states “the dietary bromide contribution for a 10 kg child would probably be less than that for an adult.” This statement is not clear as to the potential risk to young children.
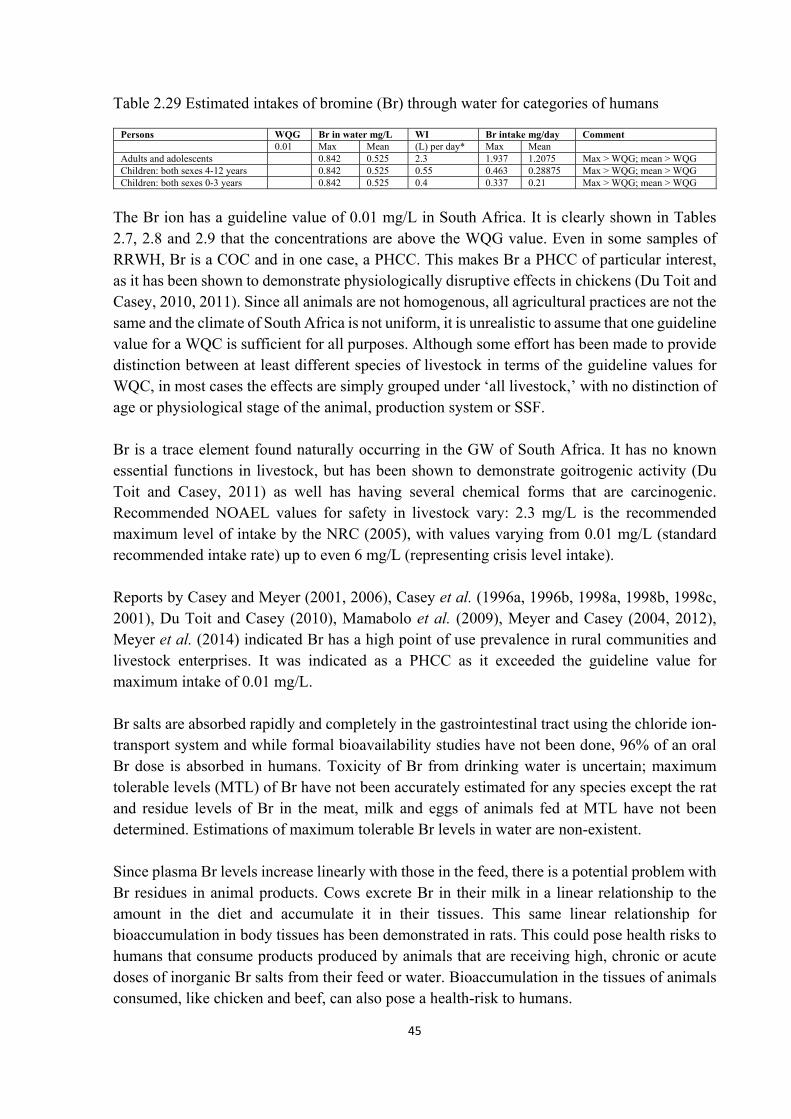
45
Table 2.29 Estimated intakes of bromine (Br) through water for categories of humans
Persons WQG Br in water mg/L WI Br intake mg/day Comment 0.01 Max Mean (L) per day* Max Mean
Adults and adolescents 0.842 0.525 2.3 1.937 1.2075 Max > WQG; mean > WQG Children: both sexes 4-12 years 0.842 0.525 0.55 0.463 0.28875 Max > WQG; mean > WQG Children: both sexes 0-3 years 0.842 0.525 0.4 0.337 0.21 Max > WQG; mean > WQG
The Br ion has a guideline value of 0.01 mg/L in South Africa. It is clearly shown in Tables 2.7, 2.8 and 2.9 that the concentrations are above the WQG value. Even in some samples of RRWH, Br is a COC and in one case, a PHCC. This makes Br a PHCC of particular interest, as it has been shown to demonstrate physiologically disruptive effects in chickens (Du Toit and Casey, 2010, 2011). Since all animals are not homogenous, all agricultural practices are not the same and the climate of South Africa is not uniform, it is unrealistic to assume that one guideline value for a WQC is sufficient for all purposes. Although some effort has been made to provide distinction between at least different species of livestock in terms of the guideline values for WQC, in most cases the effects are simply grouped under ‘all livestock,’ with no distinction of age or physiological stage of the animal, production system or SSF. Br is a trace element found naturally occurring in the GW of South Africa. It has no known essential functions in livestock, but has been shown to demonstrate goitrogenic activity (Du Toit and Casey, 2011) as well has having several chemical forms that are carcinogenic. Recommended NOAEL values for safety in livestock vary: 2.3 mg/L is the recommended maximum level of intake by the NRC (2005), with values varying from 0.01 mg/L (standard recommended intake rate) up to even 6 mg/L (representing crisis level intake). Reports by Casey and Meyer (2001, 2006), Casey et al. (1996a, 1996b, 1998a, 1998b, 1998c, 2001), Du Toit and Casey (2010), Mamabolo et al. (2009), Meyer and Casey (2004, 2012), Meyer et al. (2014) indicated Br has a high point of use prevalence in rural communities and livestock enterprises. It was indicated as a PHCC as it exceeded the guideline value for maximum intake of 0.01 mg/L. Br salts are absorbed rapidly and completely in the gastrointestinal tract using the chloride ion-transport system and while formal bioavailability studies have not been done, 96% of an oral Br dose is absorbed in humans. Toxicity of Br from drinking water is uncertain; maximum tolerable levels (MTL) of Br have not been accurately estimated for any species except the rat and residue levels of Br in the meat, milk and eggs of animals fed at MTL have not been determined. Estimations of maximum tolerable Br levels in water are non-existent. Since plasma Br levels increase linearly with those in the feed, there is a potential problem with Br residues in animal products. Cows excrete Br in their milk in a linear relationship to the amount in the diet and accumulate it in their tissues. This same linear relationship for bioaccumulation in body tissues has been demonstrated in rats. This could pose health risks to humans that consume products produced by animals that are receiving high, chronic or acute doses of inorganic Br salts from their feed or water. Bioaccumulation in the tissues of animals consumed, like chicken and beef, can also pose a health-risk to humans.
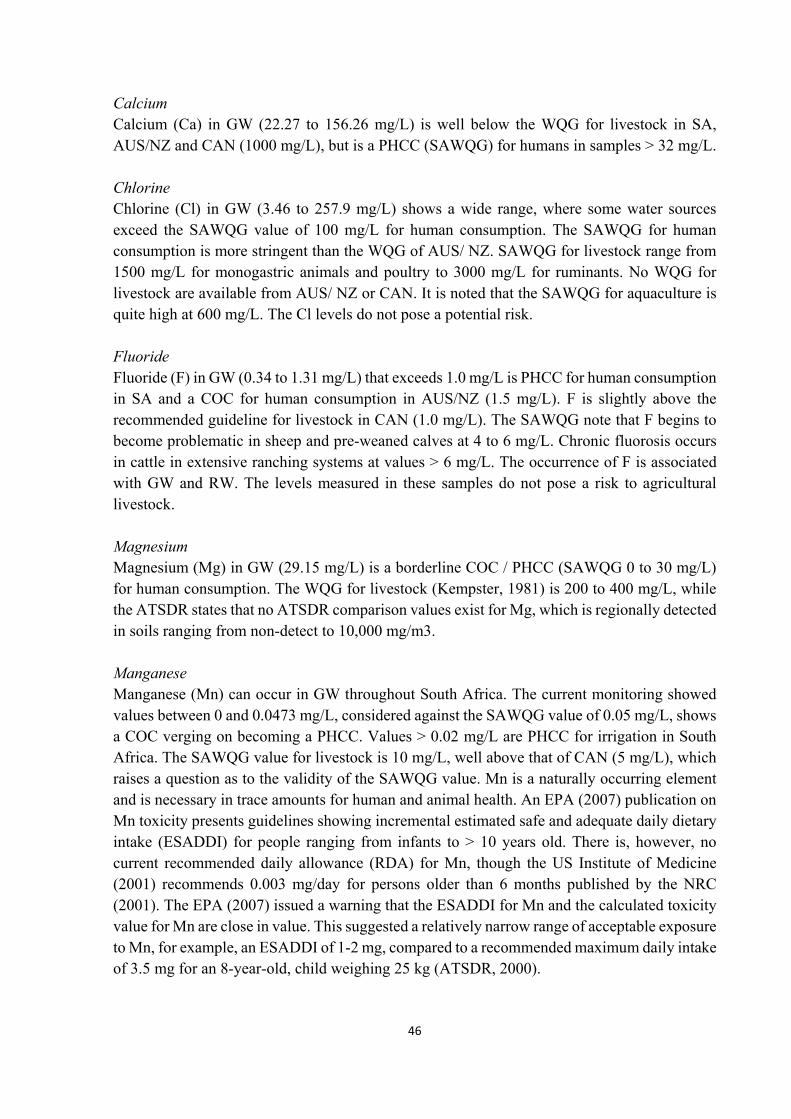
46
Calcium Calcium (Ca) in GW (22.27 to 156.26 mg/L) is well below the WQG for livestock in SA, AUS/NZ and CAN (1000 mg/L), but is a PHCC (SAWQG) for humans in samples > 32 mg/L. Chlorine Chlorine (Cl) in GW (3.46 to 257.9 mg/L) shows a wide range, where some water sources exceed the SAWQG value of 100 mg/L for human consumption. The SAWQG for human consumption is more stringent than the WQG of AUS/ NZ. SAWQG for livestock range from 1500 mg/L for monogastric animals and poultry to 3000 mg/L for ruminants. No WQG for livestock are available from AUS/ NZ or CAN. It is noted that the SAWQG for aquaculture is quite high at 600 mg/L. The Cl levels do not pose a potential risk. Fluoride Fluoride (F) in GW (0.34 to 1.31 mg/L) that exceeds 1.0 mg/L is PHCC for human consumption in SA and a COC for human consumption in AUS/NZ (1.5 mg/L). F is slightly above the recommended guideline for livestock in CAN (1.0 mg/L). The SAWQG note that F begins to become problematic in sheep and pre-weaned calves at 4 to 6 mg/L. Chronic fluorosis occurs in cattle in extensive ranching systems at values > 6 mg/L. The occurrence of F is associated with GW and RW. The levels measured in these samples do not pose a risk to agricultural livestock. Magnesium Magnesium (Mg) in GW (29.15 mg/L) is a borderline COC / PHCC (SAWQG 0 to 30 mg/L) for human consumption. The WQG for livestock (Kempster, 1981) is 200 to 400 mg/L, while the ATSDR states that no ATSDR comparison values exist for Mg, which is regionally detected in soils ranging from non-detect to 10,000 mg/m3. Manganese Manganese (Mn) can occur in GW throughout South Africa. The current monitoring showed values between 0 and 0.0473 mg/L, considered against the SAWQG value of 0.05 mg/L, shows a COC verging on becoming a PHCC. Values > 0.02 mg/L are PHCC for irrigation in South Africa. The SAWQG value for livestock is 10 mg/L, well above that of CAN (5 mg/L), which raises a question as to the validity of the SAWQG value. Mn is a naturally occurring element and is necessary in trace amounts for human and animal health. An EPA (2007) publication on Mn toxicity presents guidelines showing incremental estimated safe and adequate daily dietary intake (ESADDI) for people ranging from infants to > 10 years old. There is, however, no current recommended daily allowance (RDA) for Mn, though the US Institute of Medicine (2001) recommends 0.003 mg/day for persons older than 6 months published by the NRC (2001). The EPA (2007) issued a warning that the ESADDI for Mn and the calculated toxicity value for Mn are close in value. This suggested a relatively narrow range of acceptable exposure to Mn, for example, an ESADDI of 1-2 mg, compared to a recommended maximum daily intake of 3.5 mg for an 8-year-old, child weighing 25 kg (ATSDR, 2000).

47
Mercury Mercury (Hg) levels exceed the WQG of 0.001 μg/L in South Africa. The range extends from 0 to 0.9445 μg/L. Hg in groundwater in the Western Cape was noted by Casey et al. (2001) with levels as high as 4.1819 µg/L (Mean 0.7756, SD 1.0104, n=18 boreholes). These authors reported Hg in GW in the Klein Karoo and Kamanassie mountain region of levels high enough to have caused accumulation of Hg in the organs of ostriches. Hg has no beneficial physiological effect, but rather a disruptive one, causing reduced egg production and suppressed growth in chickens. There is a problem with the WQG in that the values are the same, but the unit of measurement in the SAWQG and CAN WQG is μg, while the AUS/NZ WQG presents the data in mg. This is a suspected error and should be in μg. Kempster et al. (1985) recommended 0.01 μg/L for South Africa. In terms of the SAWQG, Hg is a PHCC in GW, RRWH and in one MW sample. Hg, as a heavy metal, bioaccumulates and can result in chronic Hg toxicity. The level of exposure and intake via drinking water would likely have a marginal effect on livestock that have a short productive life. However, people exposed to consistent intake of inorganic Hg through water, and long living livestock such as horses are likely to develop toxicity symptoms. These are first expressed as dermatitis, neuro-dysfunction, gastrointestinal disorders and disrupted kidney function; these symptoms can become progressively worse. Organic Hg compounds are more readily absorbed, but the Hg measured in GW is inorganic. It is not certain the extent to which speciation of Hg can occur in storage, or be taken up by micro- and other organisms in reservoirs (that are incidentally consumed with the water) and thereby increasing the potential exposure. The WHO (2011) publication on Hg in drinking water notes that levels of Hg in rainwater are in the range 5 to 100 ng/L (0.005 to 0.1 μg/L), but mean levels as low as 1 ng/L have been reported (IPCS, 1990). Natural occurring levels of Hg in GW and surface water are less than 0.5 μg/L, although local mineral deposits may produce higher levels in GW. A small number of GWr and shallow wells surveyed in the USA were shown to have Hg levels that exceeded the maximum contaminant level of 2 μg/Lset by the US Environmental Protection Agency for drinking water (Ware, 1989). An increase in the Hg concentration up to 5.5 μg/L was reported for wells in Izu Oshima Island (Japan), where volcanic activity is frequent (Magara et al., 1989). The concentration range for Hg in drinking water is the same as in rain, with an average of about 25 ng/L (IPCS, 1990). The WHO (2011) document states further that in a contaminated lake system in Canada, methyl mercury was found to constitute a varying proportion of total Hg, depending on the lake (IPCS, 1990). There have been no reports of methyl mercury being found in drinking water. GW with high Hg levels should be noted and used with care. Nitrate NO3 in all GW samples (6.92 to 35.815 mg/L) exceeded the SAWQG of 6 mg/L, making NO3 a PHCC in all GW samples. The SAWQG for human consumption is very much lower than those of AUS/NZ (50 to 100 mg/L). A value of 50 mg/L is specified for infants < 3 months old, while the value of 100 mg/L is specified for adults and children > 3 months. WQG values for livestock in South Africa and Canada are the same, whereas the AUS/NZ WQG is much more

48
stringent in terms of absolute value and differentiation between WQG at species level. According to SAWQG, values > 0.05 mg/L are unsuitable for aquaculture. NO3 is a precursor to NH4 being formed in the rumen, with nitrite (NO2) a by-product that forms methaemoglobin restricting the blood oxygen capacity. Sodium Sodium (Na) in GW (9.94 to 114.49 mg/L) is generally below the SAWQG for human consumption (100 mg/L) and well below the AUS/NZ WQG (180 mg/L) and CAN (200 mg/L). Only values that exceed 70 mg/L are PHCC for irrigation in South Africa. TDS is shown to be an alleviator of potential toxicity in a number of water-borne elements (Du Toit and Casey, 2010). Strontium Strontium (Sr) levels exceeded 0.1 mg/L. This value is taken as a benchmark, since it is not listed and is not presently considered a potential risk in the stable, non-radioactive isotope form (ATSDR). One can note that RW (0.0219 to 0.949) generally exceeded those in MW (0.0741 mg/L) and RRWH (0.0007 to 0.1093 mg/L). Zinc Zinc (Zn) is an essential micro-mineral for humans and livestock. The deficiency of dietary Zn in South Africa is more likely a cause for concern than over exposure from natural occurring Zn. Zn toxicity results primarily from zinc metal fumes, i.e. persons working in industrial situations. Toxicity can result in a number of physiological dysfunctions that can include decreased growth, infertility and muscular dystrophy. The ATSDR found no conclusive results on Zn toxicity in animals other than research on the effects of metal fumes using laboratory animals. According to the SAWQG, Zn in RRWH up to 4.531 mg/L, with values greater than WQG of 3 mg/L are PHCC for human consumption, but not for livestock (20 mg/L in SA and AUS/NZ; CAN 50 mg/L). The values obtained in RRWH are generally higher than those obtained from GW (0 to 1.426 mg/L), presumably due to the nature of the roofing material from which the water is harvested. The question is whether the inorganic Zn could rather be considered a dietary supplement. Inorganic Zn has a low bioavailability, though a marginal retention could be a sufficient dietary supplement. Since the bioavailability of inorganic Zn is considerably lower than that of organic compounds, the tendency in animal nutrition is to supplement dietary Zn using organic compounds. Table 2.30 is constructed from RDA values for categories of people, the recorded Zn values in the data and WI per day of people according to categories. This construction shows the potential extent to which water might be a dietary supplementary source of micro-minerals.
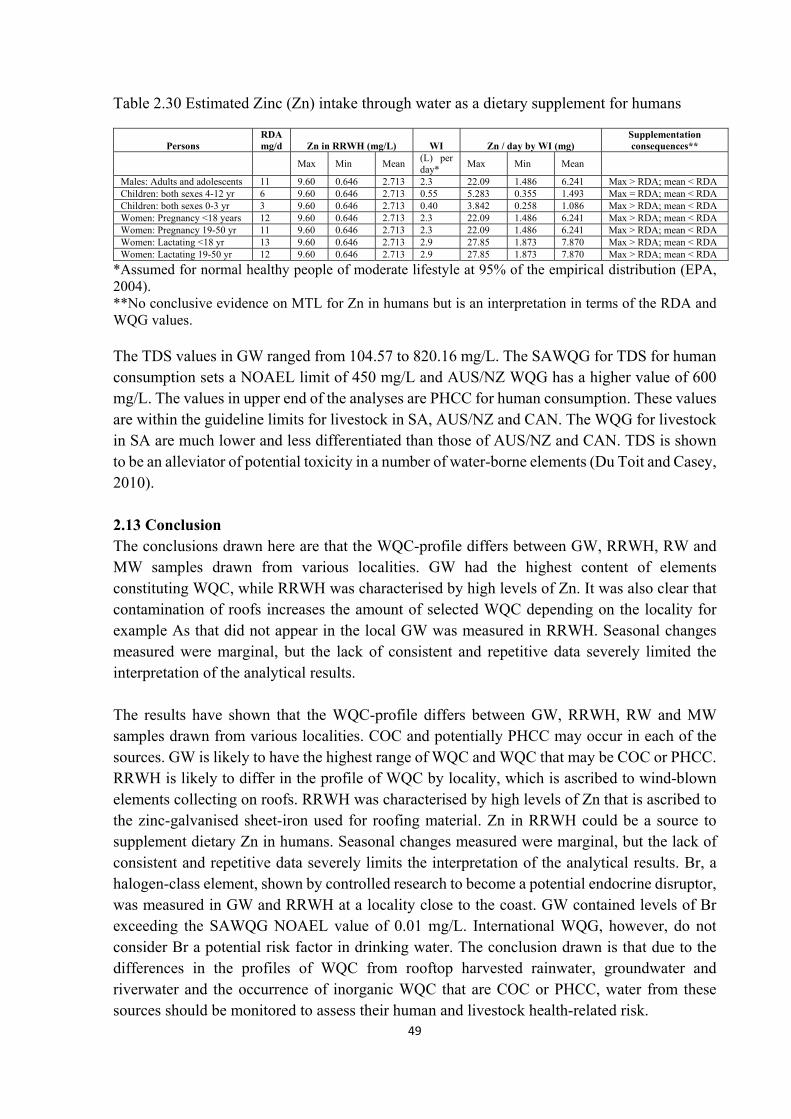
49
Table 2.30 Estimated Zinc (Zn) intake through water as a dietary supplement for humans
Persons RDA mg/d Zn in RRWH (mg/L) WI Zn / day by WI (mg)
Supplementation consequences**
Max Min Mean
(L) per day*
Max Min Mean
Males: Adults and adolescents 11 9.60 0.646 2.713 2.3 22.09 1.486 6.241 Max > RDA; mean < RDA Children: both sexes 4-12 yr 6 9.60 0.646 2.713 0.55 5.283 0.355 1.493 Max = RDA; mean < RDA Children: both sexes 0-3 yr 3 9.60 0.646 2.713 0.40 3.842 0.258 1.086 Max > RDA; mean < RDA Women: Pregnancy <18 years 12 9.60 0.646 2.713 2.3 22.09 1.486 6.241 Max > RDA; mean < RDA Women: Pregnancy 19-50 yr 11 9.60 0.646 2.713 2.3 22.09 1.486 6.241 Max > RDA; mean < RDA Women: Lactating <18 yr 13 9.60 0.646 2.713 2.9 27.85 1.873 7.870 Max > RDA; mean < RDA Women: Lactating 19-50 yr 12 9.60 0.646 2.713 2.9 27.85 1.873 7.870 Max > RDA; mean < RDA
*Assumed for normal healthy people of moderate lifestyle at 95% of the empirical distribution (EPA, 2004). **No conclusive evidence on MTL for Zn in humans but is an interpretation in terms of the RDA and WQG values. The TDS values in GW ranged from 104.57 to 820.16 mg/L. The SAWQG for TDS for human consumption sets a NOAEL limit of 450 mg/L and AUS/NZ WQG has a higher value of 600 mg/L. The values in upper end of the analyses are PHCC for human consumption. These values are within the guideline limits for livestock in SA, AUS/NZ and CAN. The WQG for livestock in SA are much lower and less differentiated than those of AUS/NZ and CAN. TDS is shown to be an alleviator of potential toxicity in a number of water-borne elements (Du Toit and Casey, 2010). 2.13 Conclusion The conclusions drawn here are that the WQC-profile differs between GW, RRWH, RW and MW samples drawn from various localities. GW had the highest content of elements constituting WQC, while RRWH was characterised by high levels of Zn. It was also clear that contamination of roofs increases the amount of selected WQC depending on the locality for example As that did not appear in the local GW was measured in RRWH. Seasonal changes measured were marginal, but the lack of consistent and repetitive data severely limited the interpretation of the analytical results. The results have shown that the WQC-profile differs between GW, RRWH, RW and MW samples drawn from various localities. COC and potentially PHCC may occur in each of the sources. GW is likely to have the highest range of WQC and WQC that may be COC or PHCC. RRWH is likely to differ in the profile of WQC by locality, which is ascribed to wind-blown elements collecting on roofs. RRWH was characterised by high levels of Zn that is ascribed to the zinc-galvanised sheet-iron used for roofing material. Zn in RRWH could be a source to supplement dietary Zn in humans. Seasonal changes measured were marginal, but the lack of consistent and repetitive data severely limits the interpretation of the analytical results. Br, a halogen-class element, shown by controlled research to become a potential endocrine disruptor, was measured in GW and RRWH at a locality close to the coast. GW contained levels of Br exceeding the SAWQG NOAEL value of 0.01 mg/L. International WQG, however, do not consider Br a potential risk factor in drinking water. The conclusion drawn is that due to the differences in the profiles of WQC from rooftop harvested rainwater, groundwater and riverwater and the occurrence of inorganic WQC that are COC or PHCC, water from these sources should be monitored to assess their human and livestock health-related risk.
50
2.14 References ANZECC, 1992. Australian water quality guidelines for fresh and marine waters. National Water Quality Management Strategy Paper No 4, Australian and New Zealand Environment and Conservation Council, Canberra. ATSDR, 2000. Toxicological Profile for Manganese. Agency for Toxic Substances and Disease Registry. 4770 Buford Hwy NE, Atlanta, GA 30341, United States. Canada, British Columbia, 2012. Guidance document for determining groundwater at risk of containing pathogens (GARP) including groundwater under direct influence of surface water (GWUDI). Version 1. Health Protection Branch, Population and Public Health Division, Ministry of Health. Sourced at: http://www.env.gov.bc.ca/wsd/plan_protect_sustain/groundwater/garp-gwudi-guidance.pdf Canada, British Columbia, Working Water Quality Guidelines, 2015. Ministry of Environment, British Columbia. Sourced at: http://www.env.gov.bc.ca/wat/wq/wq_guidelines.html. Carter, T.A., 1985. Drinking water quality for poultry. Poultry Digest 2:50. Casey, N.H. and Meyer, J. A. 2006. The application of risk assessment modelling in groundwater for humans and livestock in rural communal systems. WRC Report No 1175/1/06. ISBN 1770054677. Casey, N.H. and Meyer, J.A., 1993. South African Water Quality Guidelines (First Edition), Volume 4, Agricultural Use: Section 4.4, Water Quality Guidelines for Livestock Watering. Department of Water Affairs and Forestry. ISBN 0621154636. Casey, N.H. and Meyer, J.A., 1996b. Interim Water Quality Guidelines for Livestock Watering. WRC. TT 76/96. ISBN 1868452255. Casey, N.H. and Meyer, J.A., 2001. An extension to and further refinement of a water quality guideline index system for livestock watering: Rural communal livestock production systems and wildlife production systems. Volume 1. WRC Report No 857/1/01. ISBN 1868457133. Casey, N.H. and Meyer, J.A., 2001. An extension to and further refinement of a water quality guideline index system for livestock watering: Rural communal livestock production systems and wildlife production systems. Volume 1. WRC Report No 857/1/01. ISBN 1868457133. Casey, N.H., Meyer, J.A. and Coetzee, C.B., 1998a. An investigation into the quality of water for livestock production with the emphasis on subterranean water and the development of a water quality guideline index system. Volume 1. Development and modelling. WRC Report No 644/1/98. ISBN 1868457390. Casey, N.H., Meyer, J.A. and Coetzee, C.B., 1998b. An investigation into the quality of water for livestock production with the emphasis on subterranean water and the development of a water quality guideline index system: Volume 2. Research results. WRC Report No 644/1/98. ISBN 1868457391.
51
Casey, N.H., Meyer, J.A. and Coetzee, C.B., 1998c. An investigation into the quality of water for livestock production with the emphasis on subterranean water and the development of a water quality guideline index system: Volume 3. Appendix of reference files calculations. WRC Report No 644/1/98. ISBN 1868457390. Casey, N.H., Meyer, J.A. and Coetzee, C.B., 2001. An extension to and further refinement of a water quality guideline index system for livestock watering. Volume 2: Poultry production systems and water quality for ostrich production. WRC Report No 857/2/00. ISBN 1868457141. Casey, N.H., Meyer, J.A., Coetzee, C.B. and van Niekerk, W.A., 1996a. An investigation into the quality of water for animal production. WRC Report No 301/01/96. ISBN 1868450805. Casey, N.H., Meyer, J.A. and Kempster, P.L. 1996a. Technical authors: South African Water Quality Guidelines (Second Edition), Volume 5, Agricultural Use: Section 4.4, Water Quality Guidelines for Livestock Watering. Department of Water Affairs and Forestry. ISBN 0798853433. Casey, N.H., Meyer, J.A. and van Niekerk, W.A., 1996b. An investigation into the quality of water for animal production: Supplementary Report. WRC Report No 301/02/96. ISBN 1868450813. Casey, N.H., Meyer, J.A. and van Niekerk, W.A., 1996c. An investigation into the quality of water for animal production: Supplementary Report. WRC Report No 301/02/96. ISBN 1-86-845-081-3. Casey, N.H., van Ryssen and J.B.J. 2013. Risks associated with naturally occurring elements to extensive livestock production. Plenary paper. 11th World Conference on Animal Production, 17 to 20 October 2013, Beijing, China. Coetzee, C.B., Casey, N.H. and Meyer, J.A., 2000. The effect of water-borne fluoride on the production of laying hens. Water SA. 26:115-118. De Jager, J.M., 1993. Geographical and agro-ecological features of Southern Africa. In Livestock Production Systems – principles and practice. Ed C. Maree and N.H. Casey ©. ISBN 062017126. Du Toit, J. and Casey, N.H., 2010. Effect of bromine and iodine in drinking water on production parameters of broilers. S Afr Jnl Anim Sci 40(4): 301-310. Du Toit, J., Casey and N.H., 2011. Iodine as an alleviator of bromine toxicity in thyroid, liver and kidney of broiler chickens. Livestock Science (Elsevier) 144 (2012) 269-274. EPA, 2007. Manganese TEACH Chemical Summary, Toxicity and Exposure Assessment for Children’s Health. US Environmental Protection Agency, 1200 Pennsylvania Avenue, N.W., Washington, DC 20460. Ernst, R., 1989. Water quality guidelines. Poultry Inter. 6:40-42. European Union (Drinking Water) Regulations 2014 (EU[DW]R 2014). Statutory Instrument No 122 of 2014.
52
Food and Agricultural Organisation, United Nations: Water quality for agriculture, 1985. ISBN 9251022631. Good, B., 1985. Water quality affects poultry production. Poultry Digest 3:108-109. IPCS (1990) Methylmercury. Geneva, World Health Organization, International Programme on Chemical Safety (Environmental Health Criteria 101). Kempster, P.L., Hattingh, W.H.J. and van Vliet, H.R., 1981. Summarised water quality criteria. Department of Agriculture and Water affairs, Hydrological Research Institute. Technical Report TR 108. Keshavarz, K., 1987. Proper water management for poultry. Poultry Digest 1:12-22. Magara Y., Kunikane, S., Furuichi, T. and Kondo, J., 1989. Effects of volcanic activity on heavy metal concentration in deep well water. In Technical Papers, Water Nagoya ’89; 7th Regional Conference and Exhibition of Asia-Pacific, Nagoya, Japan. International Water Supply Association, pp. 411-419. Mamabolo, M.C., Meyer, J.A. and Casey, N.H., 2009. Effects of total dissolved solids on the accumulation of Br, As and Pb from drinking water in tissues of selected organs in broilers. S Afr Jnl Anim Sci 39, 169-172. Mancl, M., Sauis, M. and Wagert, L., 1991. Private drinking water supplies. NRAES-47, Cooperative Extension. Ithaca. NY 14853. Meyer, J.A., 1992. Potentially toxic variables in water for livestock and the physiological impact of fluoride and total dissolved salts on sheep. MSc (Agric) cum laude. Meyer, J.A., 1998. Modelling for the prediction of water quality guidelines for livestock in southern Africa. PhD Thesis. University of Pretoria, South Africa. Meyer, J.A. and Casey, N.H., 2004. Exposure assessment of potentially toxic trace elements in indigenous goats in rural communal production systems of the northern region of South Africa. S Afr Jnl Anim Sci 34, 219-222. Meyer, J.A. and Casey, N.H., 2012 Establishing risk assessment on water quality for livestock. Animal Frontiers 2, 2, 44-49. Meyer, J.A., Genthe, B., Chamier, J., 2014. Monitoring and Assessment of Endocrine Disrupting Chemicals. WRC Project K5/1915: Deliverable 7. Meyer, J.A., N.H. Casey and Coetzee, C.B., 1997. Water quality guidelines for livestock watering in Southern Africa. Water. SA 23:7-12. NHMRC, NRMMC, 2011. Australian Drinking Water Guidelines Paper 6 National Water Quality Management Strategy. National Health and Medical Research Council, National Resource Management Ministerial Council, Commonwealth of Australia, Canberra. ISBN Online: 1864965118.
53
NRC, 2001. Dietary reference intakes for Vitamin A, Vitamin K, Arsenic, Boron, Chromium, Copper, Iodine, Iron, Manganese, Molybdenum, Nickel, Silicon, Vanadium, and Zinc. Published by National Academy Press, Washington, DC. ISBN 0-309-07279-4 (pbk.)—ISBN 0-309-07290-5 (hc.). Source at http://www.nap.edu/read/10026/chapter/1 NRC, 2005. Mineral Tolerance of Animals: Second Revised Edition. Committee on Minerals and Toxic Substances in Diets and Water for Animals, National Research Council, ISBN: 978-0-309-09654-6. Olkowski, A.A., 2009. Livestock water quality: a field guide for cattle, horses, poultry and swine. First Ed 2009. Library and Archives Canada Cataloguing in Publication. Canada. ISBN 978-1-100-12443-8. Schwartz, D.L., 1994. Water quality. VSE 81c. Penn. State U. In: Proceedings AVMA Annual Conference. 7. South African Water Quality Guidelines: Volume 5 Agricultural use: Livestock watering, 1996. Department of Water Affairs and Forestry, South Africa. ISBN 0798853387 (Set of volumes); ISBN 0798853433. Suttle, N.F., 2010. Mineral nutrition of livestock, 4th Ed. CABI. ISBN-13: 9781845934729. Tainton, N.M., Hardy, M.B., Aucamp, A.J. and Danckwerts, J. E., 1993. The range environment. In Livestock Production Systems – principles and practice. Ed C. Maree and N.H. Casey ©. ISBN 062017126. US Environmental Protection Agency Drinking Water Quality Guidelines, 2007. Publication EPA 816-F-09-004, Environmental Protection Agency, United States Government. Sourced at: http://www.epa/safewater/ Vohra, P.N., 1980. Water quality for poultry use. Feedstuffs, July 7, 1980. Waggoner, R.E., 1986. Tyson Foods. Inc. Quoted by Keshavarz, 1987 Ware GW, ed. (1989) Mercury. USEPA Office of Drinking Water health advisories. Reviews of Environmental Contamination and Toxicology, 107:93-102. World Health Organisation (WHO), 2005. Mercury in drinking water: Background document for development of WHO Guidelines for Drinking-water Quality. Reference WHO/SDE/WSH/05.08/10. World Health Organisation (WHO), 2011. Guidelines for Drinking Water Quality (4th Ed, 2011). ISBN 978 92 4 154815 1. Zimmerman, N.G., 1995. Relationship of drinking water quality and broiler performance. Proc. Delmarva Broiler Housing and Flock Supervisors’ Conference, University of DE and MD Cooperative Extension and DPI, Inc.
54
CHAPTER THREE
PROPOSED CHANGES TO THE GUIDELINE ON GROUNDWATER FOR DOMESTIC USE AND LIVESTOCK WATERING
Norman H Casey1
3.1 Introduction WQG are intended to provide the public with information on the quality of water acceptable for a specific use. The quality parameters are constituents (WQC) and the physical properties of water. The constituents may be inorganic elements and molecules, organic compounds and biological matter. The quality of GW is important in the South African context because the seasonal and erratic nature of rainfall limits the availability of surface water with GW being the alternative for farms, small towns and villages across the country. Inorganic WQC are the main determinants of GW quality. In terms of health risks, some inorganic WQC can have negative affects on people and livestock under specific conditions, hence the need for WQG that assist in managing the health risks associated with inorganic WQC. In most cases, however, WQG are presented in a generic format, whereas susceptibilities to risk depend on user-specific factors and environmental influences. The South African Water Quality Guidelines for Domestic Use and for Livestock Watering were published in 1996 (SAWQG Dom; SA WQG LW, 1996). Since 1996, the Food and Agricultural Organisation of the United Nations (FAO), the World Health Organisation (WHO), Canada, European Union, Australia and the Environmental Protection Agency of the USA (EPA) published new versions of WQG documents. The WQG are text-based with notes for application where applicable. In general, differentiating biological references in terms of WQC becoming COC PHCC are chronological and based on body mass. A software-based system that estimates the CIRRA for assessing the risk of WQC to livestock had been developed, but has since become obsolete. In addition, subsequent observations have been made on WQC not included in the guidelines. This report considers the published WQG values, proposes MBM as a biological reference and notes the advantages of an interactive metric assessment of health risk. 3.2 Moral philosophy and purpose water quality guidelines Noting the good and the bad, the threats and opportunities of life is fundamental to survival. People have developed moral philosophies throughout history in dealing with these by advancing favourable situations and taking steps to deal with threats. Moral philosophies became rules of conduct written into legislation. In terms of water quality, legislation has set parameters on standards for drinking water and on polluting water to the extent of it being unsafe to drink and harmful to industry, including agriculture.
55
The value of good water and the need not to spoil the environment is set deep in our cultural literature. Water is not only the essence of biological life on earth, but our metaphorical language captures the value of water for everyday living. If water were not the physical state of a simple composite inorganic molecule of two hydrogen molecules and an oxygen molecule (H2O), it might conform to the requirements of being classified as a living entity. Water has often been invested with metaphysical power because of its overwhelming necessity and significance in our lives. The essence of water for sustenance is reflected in ancient texts: the Bible has 617 uses of the word water. These include the waters being parted from the land and to “teem with living creatures” (Genesis 1:20). Agricultural use is illustrated as in “a river watering the garden flowed from Eden” (Genesis 2:10), and the reference to GW and benevolence in: “then God opened her eyes and she saw a well of water... and filled the skin with water and gave the boy a drink” (Genesis 21:19). Moral behaviour is linked to respecting feed and water in “Is it not enough for you to feed on the good pasture? Must you also trample the rest of your pasture with your feet? Is it not enough for you to drink clear water? Must you also muddy the rest with your feet?” (Ezekiel 34:18), while quality as in drinkable water is brought to the fore in “when they came to Marah, they could not drink its water because it was bitter” (Exodus 15:23) with another seven connotations between “bitter water” and hardship or vileness. The metaphor of “living water” relates to a way of life and spiritual well-being (John 4:10, 11 and other references). These foregoing references to water in the biosphere, respecting its value, using water for agriculture and households (and associated industries) and noting its quality and value-categories, all underscore the need for distinct WQG. The moral philosophy of a set of WQG should be primarily to assist the user category in determining the FFU of water, which would include untreated water direct from the source; water treated to comply with WQG values; untreated water exposed to sunlight, which can cause changes in the nature and concentration of inorganic and organic WQC. 3.3 Published guidelines on water quality Various government and international agencies have published WQG. Six published WQG documents from prominent countries and entities were selected to compare with South African Water Quality Guidelines for Livestock Watering (1996). The first comparison is the justification as set out in the document as follows: 3.3.1 South African Water Quality Guidelines: Livestock Watering The South African Water Quality Guidelines for Livestock Watering (1996) is essentially a user needs specification of the quality of water required for different livestock production systems. The following aspects can be highlighted from this document
• The Department of Water Affairs and Forestry (former) uses the Water Quality Guidelines (1996) as its primary source of information and decision-support to judge
56
the FFU of water and for other water quality management purposes. The information is more detailed (than the international literature), and not only provides information on the ideal water quality for water uses, but in addition provides background information to help users of the guidelines make informed judgments about the FFU of water.
• The South African Water Quality Guidelines (1996) were developed as an important information resource, primarily for water quality managers. Nevertheless, educators and other interested and affected members of the public are likely to find them a valuable source of information for many aspects of water quality and its management.
3.3.2 World Health Organisation Guidelines for Drinking Water Quality The key aspects of the World Health Organisation (WHO) Guidelines for Drinking Water Quality 4th Edition includes the following:
• The moral philosophy of the WHO is contained in the following statement “The primary purpose of the Guidelines for drinking water quality is the protection of public health. The Guidelines provide the recommendations of the World Health Organisation (WHO) for managing the risk from hazards that may compromise the safety of drinking water. The recommendations should be considered in the context of managing the risk from other sources of exposure to these hazards, such as waste, air, food and consumer products.”
• The WHO (2011) WQG considers that safe drinking water does not represent any significant risk to health over a lifetime of consumption, including different sensitivities that may occur between life stages. Persons at greatest risk of water-borne disease are infants and young children, people who are debilitated and the elderly, especially when living under unsanitary conditions. This stated principle of the WHO (2011) WQG is equally applicable to livestock.
• The WHO (2011) WQG is intended to support the development and implementation of strategies for risk management that would ensure the safety of drinking water through the control of hazardous constituents. These strategies may include national or regional standards developed from the scientific basis provided in the WHO (2011) WQG.
• The approach to a NOAEL describes reasonable minimum requirements of safe practice to protect the health of consumers and derive numerical “guideline values” for constituents of water or indicators of water quality.
• The WHO guidelines should be considered in the context of local or national environmental, social, economic, cultural conditions and user in deriving local guideline values.
• The WHO (2011) notes that the WQG should be part of an overall health-protection strategy. This would include sanitation and other strategies such as managing the contamination of foods.
• Since the nature and form of drinking water standards may vary among countries and regions, no single approach is universally applicable. The WHO (2011) does not encourage countries or regions to adopt international standards for drinking water quality purely for the advantage provided by a risk-benefit approach (qualitative or
57
quantitative) in establishing national standards and regulations.
• The numeric guideline values should not form a standard to which water quality might be degraded.
• The WHO (2011) guidelines advocate implementing the guidelines in terms of a conceptual framework with three key components.
o Health-based targets based on an evaluation of health risks. o Water safety plans (WSP), comprising:
An assessment system to determine whether the drinking water supply (from source through treatment to the point of consumption) as a whole can deliver water of a quality that meets the health-based targets;
Operational monitoring of the control measures in the drinking water supply that are particularly important in securing drinking water safety;
Management plans that (1) document the system assessment, (2) monitor and describe actions to be taken in normal operation and incident conditions, (3) include upgrading and improving systems, documentation and communication.
o An independent surveillance system, which can verify the above is operating properly.
o In terms of a guiding principle, the WHO (2011) considers that most chemicals in water become hazardous to humans after prolonged exposure.
3.3.3 Australian Drinking Water Guidelines The Australian Drinking Water Guidelines (ADWG, 2011, updated 2016) are intended to provide a framework for good management of drinking water supplies that, if implemented, will assure safety at point of use. The key aspects of the Guidelines include the following:
• The ADWG (2011) have been developed after consideration of the best available scientific evidence, are designed to provide an authoritative reference on what defines safe, good quality water, how it can be achieved and how it can be assured, and are concerned with health safety and with aesthetic quality.
• The ADWG (2011) are not mandatory standards. They provide a basis for determining the quality of water to be supplied to consumers in all parts of Australia. These determinations need to consider the diverse array of regional or local factors, and take into account economic, political and cultural issues, including customer expectations and willingness and ability to pay.
• The Australian community and all agencies intend the ADWG (2011) for use with responsibilities associated with the supply of drinking water, including catchment and water resource managers, drinking water suppliers, water regulators and health authorities.
• ADWG (2011) considers GW of shallow aquifers to be at greater risk of adverse chemical constituents originating from industrial and agricultural activity than deep

58
aquifers, which in certain areas may be prone to seawater incursion.
• Key characteristics in drinking water supply systems pertaining to GW are among others:
o Geology. o Agricultural surface irrigation. o Topography and drainage patterns. o Depth to aquifer. o Flow rates and directions.
• Associated with the moral philosophy are storage and delivery facilities. 3.3.4 Environmental Protection Agency Drinking Water Quality Guidelines The Environmental Protection Agency Drinking Water Quality Guidelines (EPA, USA) (2009) has a comprehensive moral philosophy on water quality that addresses every user category and potential sources of pollution. The EPA, representing the federal state, issues guidelines on assessing water quality by state or by county. The latest guidelines for drinking water quality posted on 01/04/2015 are the WHO guidelines of 2008.
3.3.5 European Union Drinking Water Regulations European Union (Drinking Water) Regulations 2014 (EU [DW] R 2014) do not express a moral philosophy other than “protection of human health”, but are statutory regulations regarding:
o Duties of suppliers, point of compliance and duties in relation to water on premises;
o Monitoring, records, protection of human health, remedial action, departures from standards and intervention by supervisory authority;
o Quality of treatment, equipment and materials, information in case of exempted supplies, quality to be maintained, directions and performance verification;
o Injunctive relief, powers of authorised persons, charges by supervisory authorities, offences by bodies corporate and prosecutions and penalties.
3.3.6 Canada, British Columbia, Water Quality Guidelines The Canada, British Columbia, Water Quality Guidelines (2015) cover the following key aspects:
• The moral philosophy of the Canadian, B.C. (CAN, 2015) WQG is to represent safe levels of substances that protect different water uses, including: drinking water, recreation, aquatic life, wildlife and agriculture which, the document notes, is not the approach of many authorities that develop WQG to protect water quality.
• WQG provide policy direction to those making decisions affecting water quality. It notes that although WQG do not have any direct legal standing, CAN (2015) WQG must be considered in any decision affecting water quality made within the Ministry of the Environment (MOE) once the CCME has approved the WQG.
• Water quality is assessed according to the WQG, which may be used as a reference for determining the allowable limits in waste discharge.
• WQG applies to approved criteria; two approaches apply in the event of non-approved
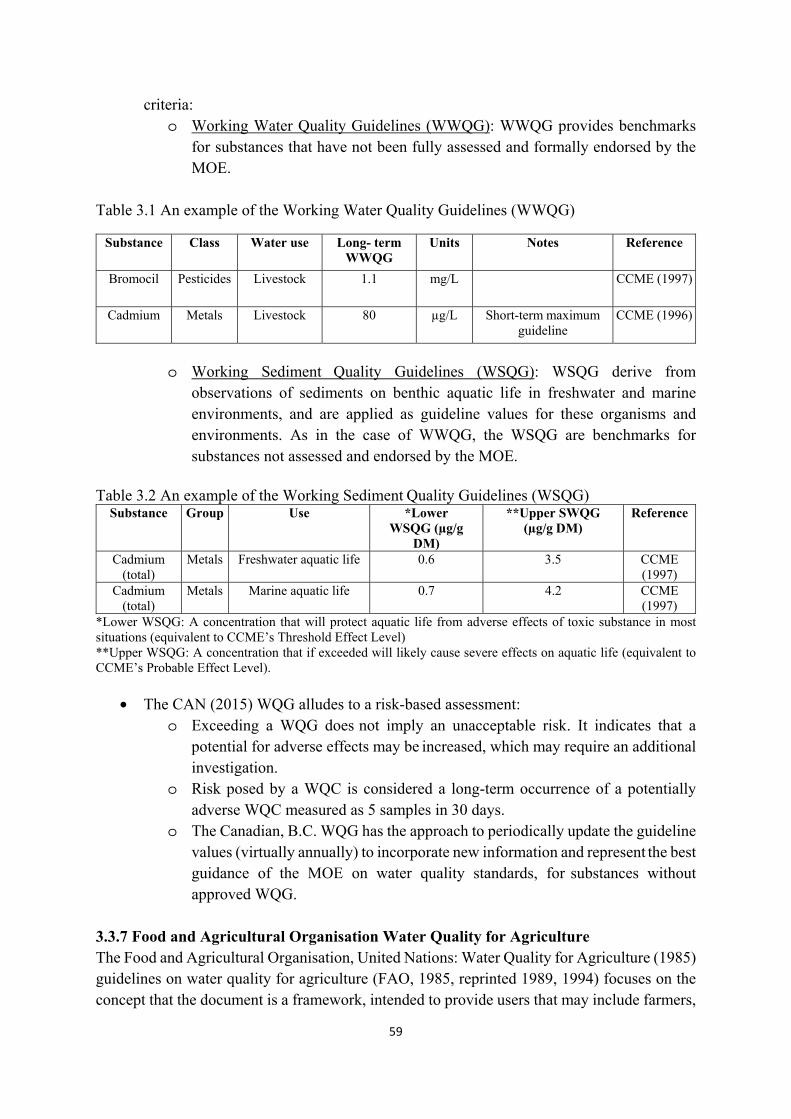
59
criteria: o Working Water Quality Guidelines (WWQG): WWQG provides benchmarks
for substances that have not been fully assessed and formally endorsed by the MOE.
Table 3.1 An example of the Working Water Quality Guidelines (WWQG)
Substance Class Water use Long- term WWQG
Units Notes Reference
Bromocil Pesticides Livestock 1.1 mg/L CCME (1997)
Cadmium Metals Livestock 80 µg/L Short-term maximum guideline
CCME (1996)
o Working Sediment Quality Guidelines (WSQG): WSQG derive from
observations of sediments on benthic aquatic life in freshwater and marine environments, and are applied as guideline values for these organisms and environments. As in the case of WWQG, the WSQG are benchmarks for substances not assessed and endorsed by the MOE.
Table 3.2 An example of the Working Sediment Quality Guidelines (WSQG)
Substance Group Use *Lower WSQG (µg/g
DM)
**Upper SWQG (µg/g DM)
Reference
Cadmium (total)
Metals Freshwater aquatic life 0.6 3.5 CCME (1997)
Cadmium (total)
Metals Marine aquatic life 0.7 4.2 CCME (1997)
*Lower WSQG: A concentration that will protect aquatic life from adverse effects of toxic substance in most situations (equivalent to CCME’s Threshold Effect Level) **Upper WSQG: A concentration that if exceeded will likely cause severe effects on aquatic life (equivalent to CCME’s Probable Effect Level).
• The CAN (2015) WQG alludes to a risk-based assessment:
o Exceeding a WQG does not imply an unacceptable risk. It indicates that a potential for adverse effects may be increased, which may require an additional investigation.
o Risk posed by a WQC is considered a long-term occurrence of a potentially adverse WQC measured as 5 samples in 30 days.
o The Canadian, B.C. WQG has the approach to periodically update the guideline values (virtually annually) to incorporate new information and represent the best guidance of the MOE on water quality standards, for substances without approved WQG.
3.3.7 Food and Agricultural Organisation Water Quality for Agriculture The Food and Agricultural Organisation, United Nations: Water Quality for Agriculture (1985) guidelines on water quality for agriculture (FAO, 1985, reprinted 1989, 1994) focuses on the concept that the document is a framework, intended to provide users that may include farmers,
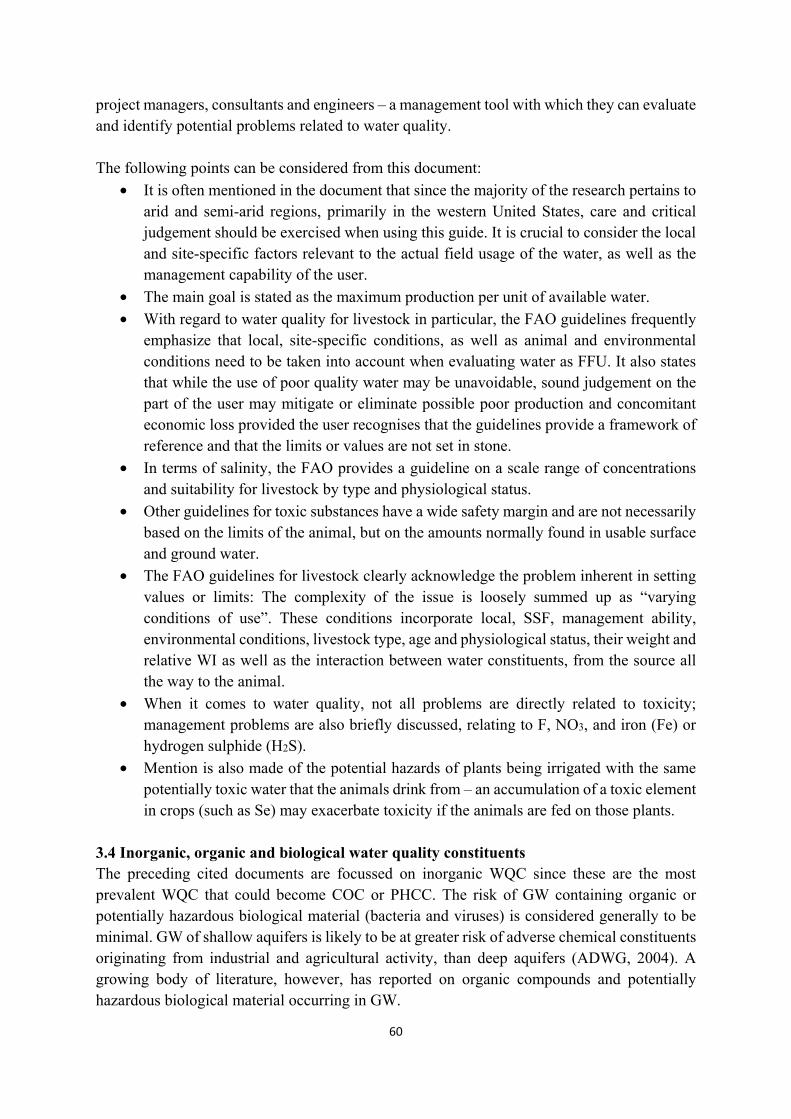
60
project managers, consultants and engineers – a management tool with which they can evaluate and identify potential problems related to water quality. The following points can be considered from this document:
• It is often mentioned in the document that since the majority of the research pertains to arid and semi-arid regions, primarily in the western United States, care and critical judgement should be exercised when using this guide. It is crucial to consider the local and site-specific factors relevant to the actual field usage of the water, as well as the management capability of the user.
• The main goal is stated as the maximum production per unit of available water.
• With regard to water quality for livestock in particular, the FAO guidelines frequently emphasize that local, site-specific conditions, as well as animal and environmental conditions need to be taken into account when evaluating water as FFU. It also states that while the use of poor quality water may be unavoidable, sound judgement on the part of the user may mitigate or eliminate possible poor production and concomitant economic loss provided the user recognises that the guidelines provide a framework of reference and that the limits or values are not set in stone.
• In terms of salinity, the FAO provides a guideline on a scale range of concentrations and suitability for livestock by type and physiological status.
• Other guidelines for toxic substances have a wide safety margin and are not necessarily based on the limits of the animal, but on the amounts normally found in usable surface and ground water.
• The FAO guidelines for livestock clearly acknowledge the problem inherent in setting values or limits: The complexity of the issue is loosely summed up as “varying conditions of use”. These conditions incorporate local, SSF, management ability, environmental conditions, livestock type, age and physiological status, their weight and relative WI as well as the interaction between water constituents, from the source all the way to the animal.
• When it comes to water quality, not all problems are directly related to toxicity; management problems are also briefly discussed, relating to F, NO3, and iron (Fe) or hydrogen sulphide (H2S).
• Mention is also made of the potential hazards of plants being irrigated with the same potentially toxic water that the animals drink from – an accumulation of a toxic element in crops (such as Se) may exacerbate toxicity if the animals are fed on those plants.
3.4 Inorganic, organic and biological water quality constituents The preceding cited documents are focussed on inorganic WQC since these are the most prevalent WQC that could become COC or PHCC. The risk of GW containing organic or potentially hazardous biological material (bacteria and viruses) is considered generally to be minimal. GW of shallow aquifers is likely to be at greater risk of adverse chemical constituents originating from industrial and agricultural activity, than deep aquifers (ADWG, 2004). A growing body of literature, however, has reported on organic compounds and potentially hazardous biological material occurring in GW.

61
Mader and Merkle (2000) reported on microbial pathogens in GW increasing in the United States. Approximately 5.9 million illnesses were associated over the review period with biologically contaminated GW, and mortalities in the order of 1.4 million occurred. The most common biological contaminant was faecal material. Straus and Griebler (2011) present the following summary of their paper on Pathogenic Microorganisms and Viruses in GW: “GW represents the quantitative most important freshwater resource on our planet. Generally well protected by overlaying soil and sediment layers, it is a valued source for drinking water. Along with demographic development and global change, the quality of groundwater is increasingly challenged by anthropogenic impacts including the direct and indirect introduction of potentially harmful pathogenic microorganisms and viruses. Does this pose a new risk to human health?” McKay (2010) and Morris et al. (2003) emphasize the view of increasing contamination of GW by pathogens. The CAN (2012) guidance document for determining GW at risk of containing pathogens (GARP) including GW under direct influence of surface water (GWUDI), Version 1, 2012, (CAN, 2012), addresses the probability of pathogen contamination of GW. The document sets out possible routes of contamination and methods of sampling for water-borne pathogens. The guidelines are based on confidence levels published in the Australian Drinking Water Guidelines (2016). These consider that if results of 150 samples showed no faecal bacteria, there would be a 95% confidence level that 98% of the well water is free of microbial contamination (see reference graphs below). The CAN (2012) WQG proposed “this level of confidence (95%) to be met in order to support an opinion that the GW source is at low risk of containing pathogens and therefore will not require treatment, under current conditions”. This is illustrated in the Figures 3.1 and 3.2 below (CAN, 2012):
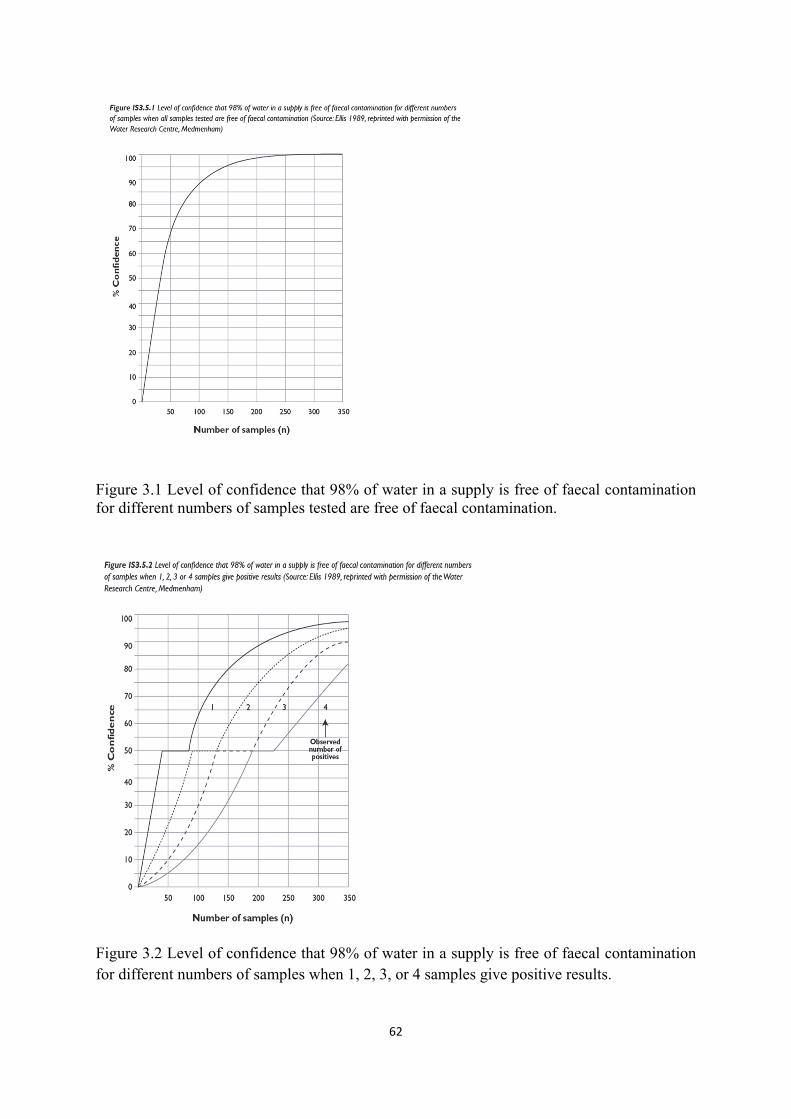
62
Figure 3.1 Level of confidence that 98% of water in a supply is free of faecal contamination for different numbers of samples tested are free of faecal contamination.
Figure 3.2 Level of confidence that 98% of water in a supply is free of faecal contamination for different numbers of samples when 1, 2, 3, or 4 samples give positive results.
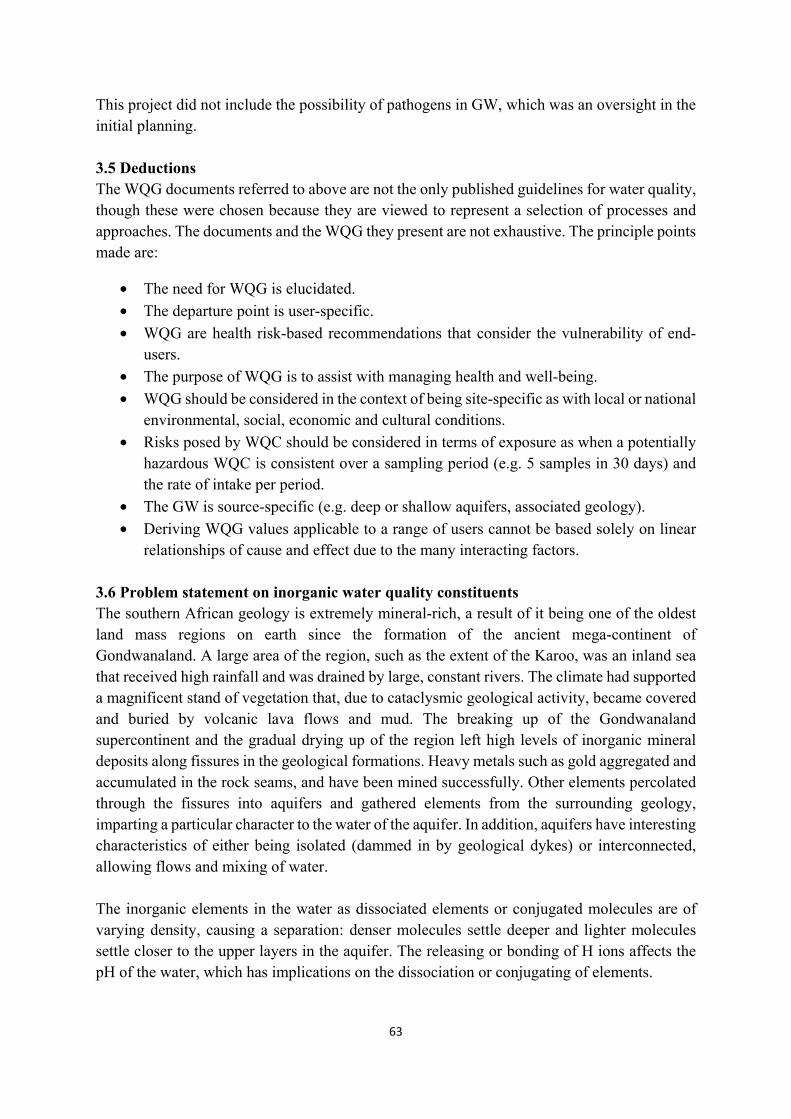
63
This project did not include the possibility of pathogens in GW, which was an oversight in the initial planning. 3.5 Deductions The WQG documents referred to above are not the only published guidelines for water quality, though these were chosen because they are viewed to represent a selection of processes and approaches. The documents and the WQG they present are not exhaustive. The principle points made are:
• The need for WQG is elucidated.
• The departure point is user-specific.
• WQG are health risk-based recommendations that consider the vulnerability of end-users.
• The purpose of WQG is to assist with managing health and well-being.
• WQG should be considered in the context of being site-specific as with local or national environmental, social, economic and cultural conditions.
• Risks posed by WQC should be considered in terms of exposure as when a potentially hazardous WQC is consistent over a sampling period (e.g. 5 samples in 30 days) and the rate of intake per period.
• The GW is source-specific (e.g. deep or shallow aquifers, associated geology).
• Deriving WQG values applicable to a range of users cannot be based solely on linear relationships of cause and effect due to the many interacting factors.
3.6 Problem statement on inorganic water quality constituents The southern African geology is extremely mineral-rich, a result of it being one of the oldest land mass regions on earth since the formation of the ancient mega-continent of Gondwanaland. A large area of the region, such as the extent of the Karoo, was an inland sea that received high rainfall and was drained by large, constant rivers. The climate had supported a magnificent stand of vegetation that, due to cataclysmic geological activity, became covered and buried by volcanic lava flows and mud. The breaking up of the Gondwanaland supercontinent and the gradual drying up of the region left high levels of inorganic mineral deposits along fissures in the geological formations. Heavy metals such as gold aggregated and accumulated in the rock seams, and have been mined successfully. Other elements percolated through the fissures into aquifers and gathered elements from the surrounding geology, imparting a particular character to the water of the aquifer. In addition, aquifers have interesting characteristics of either being isolated (dammed in by geological dykes) or interconnected, allowing flows and mixing of water. The inorganic elements in the water as dissociated elements or conjugated molecules are of varying density, causing a separation: denser molecules settle deeper and lighter molecules settle closer to the upper layers in the aquifer. The releasing or bonding of H ions affects the pH of the water, which has implications on the dissociation or conjugating of elements.
64
As a result, water from the upper layers in still aquifers can have a different inorganic WQC profile than the deeper water as well as a differing TDS reading. As the upper water is pumped out, an influx of water from adjoining aquifers can change the WQC profile and the TDS. Similarly, as the upper water is used and the replenishment rate cannot balance the abstraction of water, either the water table drops and a deeper well is required (that could have an altered WQC profile and TDS), or as has been found in Australia, an influx of seawater into aquifers close to the coast. The Overstrand Municipality around Hermanus where several subterranean water well fields supplement the water to Hermanus and the adjoining localities closely monitors this phenomenon. These conditions of varying WQC of groundwater gave rise to the high range of inorganic WQC that might affect livestock and rural human populations (Casey et al., 1996a, 1996b, 1996c, 1998a, 1998b, 1998c, 2001, 2006; WRC 2175 Volume 1: Part 2). 3.6.1 Defined user-group: Livestock The agro-ecological features of southern Africa determine the suitability of ecological regions to types of livestock farming (Tainton et al., 1993; De Jager, 1993). Extensive livestock farming across the country, with the exception of some communal systems, is not entirely free-range. Extensive livestock enterprises are therefore often restricted to limited use of the natural veld and are dependent on seasonal rainfall with precarious distribution. In intensive systems, such as pig, poultry and ostrich production, the possibility to move animals in the dry season or times of drought is virtually impossible. GW is the obvious alternative across the region in all aspects of livestock production. The extent of health and production risks due to WQC in GW and the risks posed by COC/PHCC have been shown through surveys and controlled experiments. The most likely factors to predispose livestock to inorganic WQC becoming hazardous are:
• Exposure: The exposure of animals to the WQC where exposure is: o Concentration (WQC mg/L) x Time (period of exposure) x Intake (L/period).
• Chronological age: The physiological age of animals is important where young animals with a high growth rate of muscle have relatively high WI. An example is the high rate of WI of chickens in the first week may be equivalent to 73.5% of live mass (Casey et al., 1998a).
• Production status/Physiological stage: The production status of the animal, such as lactation, that requires a high WI.
• Environment: Demands of the environment where temperatures are high and feed is dry.
• Physiological water conservation: The inherent water turnover rates of the species or breed within species that includes the physiological capability to conserve water.
• Health: Animals in poor health as with digestive disturbances (scours) or a fever have higher demands for WI.
65
• Interactions between WQC: WQC such as MgSO4 can cause diarrhoea and high TDS values can be diuretic and stimulate increased WI.
• Bioavailability of WQC: The bioavailability of WQC may be influenced by TDS, the pH of the digestive tract, and by dissociation and speciation under the influence of sunlight in open reservoirs or water troughs.
The exposure of livestock to WQC that might be potentially hazardous varies:
• Short-term exposure is associated with young growing animals, where the stock turnover is high.
• Long-term exposure is associated with breeding animals, where the replacement rates are slower.
Short-term exposure however of young growing animals to PHCC may affect the animals’ physiology as an endocrine disruptor and limit the production, hence profitability (Du Toit and Casey, 2010; 2012). A survey of GW revealed that 37.2% of the boreholes could be considered unfit for livestock watering due to WQC being in the category of PHCC, while other WQC had levels close to the level for PHCC. A typical incidence of PHCC in GW could be F 38%, TDS 19.1%, and Cl 24.8 with Na, SO4, Mg, NO3 and Ca at < 10% (Casey, et al., 1996). Further surveys included trace minerals and were over a wider set of regions, including the Western Cape, the Great Karoo, the Little Karoo and the Kalahari region, and a more recent survey over a wider range across South Africa. Values published by Coetzee et al. (2000), Casey et al., (2001) and Casey and Meyer (2006), show a high range of WQC throughout South Africa and that these can differ markedly between regions. It emerged that the mean values for As, F, Hg, NO3, Se, Sr, U, V and TDS are COC throughout South Africa, but not necessarily in the Western Cape. 3.6.2 Defined user groups: Domestic use Similar biological and environmental factors to those that can influence WQC being potentially hazardous to livestock prevail regarding humans. Humans are monogastric, as are pigs and with similar kidney functions. An exception would be ruminants that have a digestive system different to humans. Humans are more likely to be sensitive to aesthetic parameters such as smell caused by H2S, soapy feel of water with high carbonate levels (2-CO3) and metallic taste due to Fe, compared to livestock. In considering domestic use in general and not as potable water, inorganic WQC can contribute to degradation of appliances, as with the precipitation of CaCO3 when heated causing clogging of hot water systems, or Fe in both the ferrous and ferric states reacting with metal surfaces. Water with CaCO3 will not lather with soaps, but cause a scum, which is mainly aesthetically unacceptable. 3.6.3 Pathogens and organic compounds in GW Pathogens in GW present a health risk for humans and livestock, in particular monogastric livestock, pigs and poultry. Livestock have been shown to be vectors of pathogens (E. coli
66
bacteria for example) that are documented causes of critical outbreaks of illness and mortalities. In the South African context, GW is susceptible to contamination by pathogens due to the large number of informal settlements and the lack of sewage services in these settlements and on farms. Since investigating pathogens in GW was not an objective of this project, no problem statement is formulated. However, an opinion is given in the Discussion. 3.7 Problem statement and hypothesis Problem statement The problem statement, therefore, is that a single value WQG system for inorganic WQC is restrictive and ineffective in accommodating the complex, multiple conditions and interactions that prevail in livestock, people and household settings. Hypothesis The hypothesis is that a variable WQG system that is user and site-specific has the greatest probability of alleviating the effects of PHCC in water. 3.8 Current water quality guidelines pertaining to inorganic water quality constituents Published WQG include single value systems, a range for specified users, a TWQR and a risk-based structured system, which are illustrated in the tables and text boxes. Table 3.3 shows comparative WQG for organoleptic and physical factors and inorganic WQC in the seven WQG documents referred to above. Table 3.4 is a collated presentation of these WQG values for humans and livestock. Table 3.5 presents WQG for livestock on magnesium (Mg) as WQC. Table 3.6 shows comparative WQG for salinity as it may affect livestock. Models for WQG are presented in Box 3.1 to 3.3.

67
Tab
le 3
.3 C
ompa
rati
ve w
ater
qua
lity
gui
deli
nes
(WQ
G)
for
orga
nole
ptic
and
phy
sica
l fa
ctor
s an
d in
orga
nic
wat
er q
uali
ty c
onst
itue
nts
(WQ
C)
refe
rrin
g to
hum
ans,
live
stoc
k an
d ir
riga
tion
for
sel
ecte
d W
QC
WQ
C
Val
ue
mg/
L (
un
less
oth
erw
ise
stat
ed)
A
ustr
alia
200
4
Can
ada
2015
E
PA
19
86
EP
A (
1)
EP
A (
2)
EU
20
14
FA
O
1985
NR
C,
2001
. (M
AL
, d
airy
ca
ttle
)
WH
O W
QG
4th
ed
.
Sou
th A
fric
a T
WQ
R
Mis
cell
aneo
us
refe
renc
es
Sh
ort-
term
L
ong-
term
H
um
an
Liv
esto
ck
WQ
G r
ange
of
max
imu
m a
ccep
tab
le
leve
ls
Org
anol
epti
c an
d p
hys
ical
fac
tors
Alk
alin
ity
Ele
ctri
cal C
ond
uct
ivit
y S/
m
Col
our
(tru
e)
15 H
U M
AL
<
15
HU
15 H
U
Con
sum
er
depe
nden
t
<
15
TC
U
Dis
solv
ed o
xyge
n >
85%
sat
urat
ion
N/E
, but
not
"to
o hi
gh o
r to
o lo
w"
Har
dne
ss (
Cal
ciu
m
carb
onat
e, C
aCo3
) 20
0
<
300
N
OA
EL
N
/E*
n/a
n/a
pH
6.
5-8.
5 5-
9 6.
5-8.
5 6.
5-9.
5
N/A
6.
5-8.
5 6-
9 n/
a
Sal
init
y
See
T
abl
e 6
3000
6
Tas
te a
nd o
dou
r S
houl
d be
ac
cept
able
3
TO
N
Con
sum
er
depe
nden
t
1 T
ON
n/
a
TD
S
500
1 00
0-
3 00
0 –
Liv
esto
ck,
spec
ies
depe
nden
t
<
500
500
< 5
000
N/E
*
0-45
0
0 –
1000
(a
)
500-
3 50
0 –
Irri
ga-
tion
, cro
p to
lera
nce
> 7
000
Uns
uita
ble
for
catt
le
< 1
000
Tas
te
0-2
000
(b)
0-3
000
(c)
Tu
rbid
ity
5 N
TU
10
NT
U –
Wil
dlif
e
C
onsu
mer
de
pend
ent
< 5
NT
U (
MA
L)
0-1
NT
U
n/a
5
NT
U –
Liv
esto
ck
<
1 N
TU
P
refe
rabl
e
Inor
gani
c W
QC
Mac
ro-m
iner
als
/ An
ions
Bic
arbo
nat
e (H
CO
3-)
Cal
ciu
m (
Ca)
60
0- 2
00
1; 4
; 5; 8
.
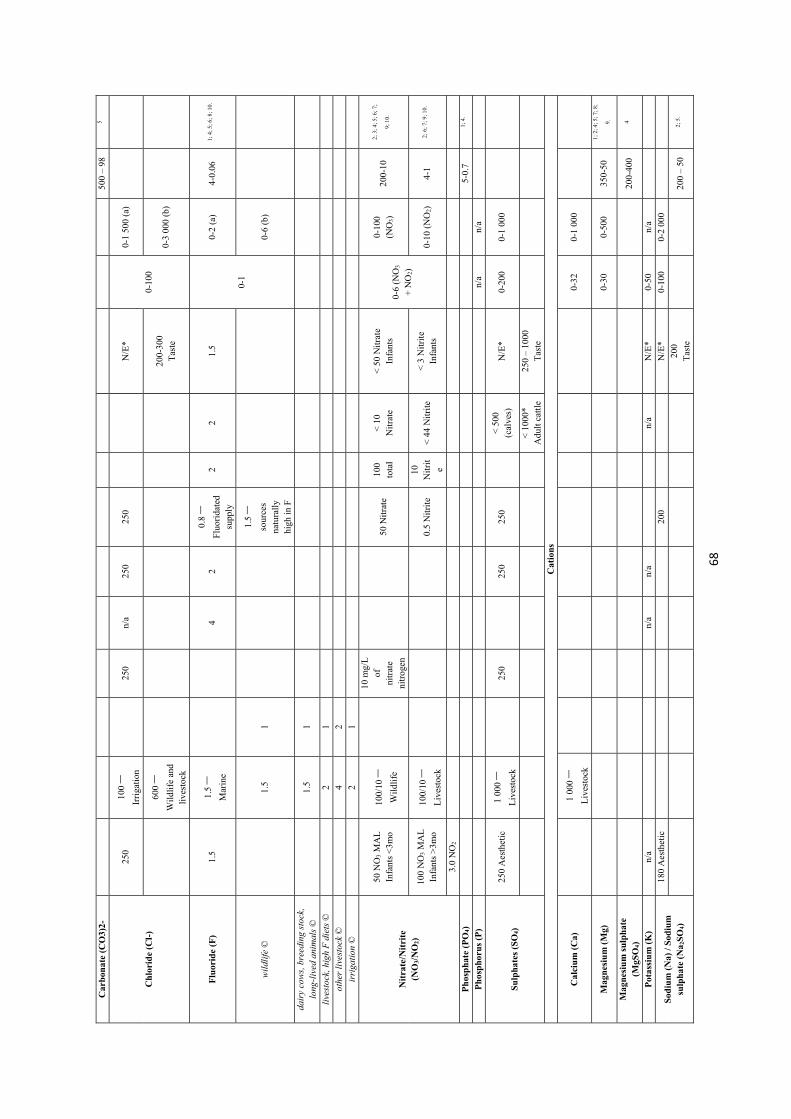
68
Car
bon
ate
(CO
3)2-
50
0 –
98
5
Ch
lori
de
(Cl-
)
250
100 –
Irri
gati
on
25
0 n/
a 25
0 25
0
N
/E*
0-10
0
0-1
500
(a)
60
0 –
Wil
dlif
e an
d li
vest
ock
20
0-30
0 T
aste
0-
3 00
0 (b
)
Flu
orid
e (F
) 1.
5 1.
5 –
Mar
ine
4 2
0.8 –
Fluo
rida
ted
supp
ly
2 2
1.5
0-1
0-2
(a)
4-0.
06
1; 4
; 5; 6
; 8; 1
0.
wil
dlif
e ©
1.5
1
1.5 –
sour
ces
natu
rall
y hi
gh in
F
0-
6 (b
)
dair
y co
ws,
bre
edin
g st
ock,
lo
ng-l
ived
ani
mal
s ©
1.5
1
live
stoc
k, h
igh
F d
iets
©
2
1
othe
r li
vest
ock
©
4
2
irri
gatio
n ©
2 1
Nit
rate
/Nit
rite
(N
O3/
NO
2)
50 N
O3
MA
L
Infa
nts
<3m
o 10
0/10
–
Wil
dlif
e
10 m
g/L
of
ni
trat
e ni
trog
en
50 N
itra
te
100
tota
l <
10
Nit
rate
<
50
Nit
rate
In
fant
s 0-
6 (N
O3
+ N
O2)
0-10
0 (N
O3)
20
0-10
2;
3; 4
; 5; 6
; 7;
9; 1
0.
100
NO
3 M
AL
In
fant
s >
3mo
100/
10 –
Liv
esto
ck
0.5
Nit
rite
10
N
itri
te
< 4
4 N
itri
te
< 3
Nit
rite
In
fant
s 0-
10 (
NO
2)
4-1
2; 6
; 7; 9
; 10.
3.0
NO
2
Ph
osp
hate
(P
O4)
5-
0.7
1; 4
.
Ph
osp
horu
s (P
)
n/
a n/
a
Su
lpha
tes
(SO
4)
250
Aes
thet
ic
1 00
0 –
Liv
esto
ck
25
0
250
250
<
500
(c
alve
s)
N/E
* 0-
200
0-1
000
< 1
000*
A
dult
cat
tle
250
– 10
00
Tas
te
Cat
ions
Cal
ciu
m (
Ca)
1 00
0 –
Liv
esto
ck
0-32
0-
1 00
0
Mag
nesi
um
(M
g)
0-30
0-
500
350-
50
1; 2
; 4; 5
; 7; 8
;
9.
Mag
nesi
um
su
lpha
te
(MgS
O4)
20
0-40
0 4
Pot
assi
um
(K
) n/
a n/
a n/
a
n/a
N/E
* 0-
50
n/a
Sod
ium
(N
a) /
Sod
ium
su
lph
ate
(Na 2
SO
4)
180
Aes
thet
ic
200
N
/E*
0-10
0 0-
2 00
0
20
0 T
aste
20
0 –
50
2; 5
.
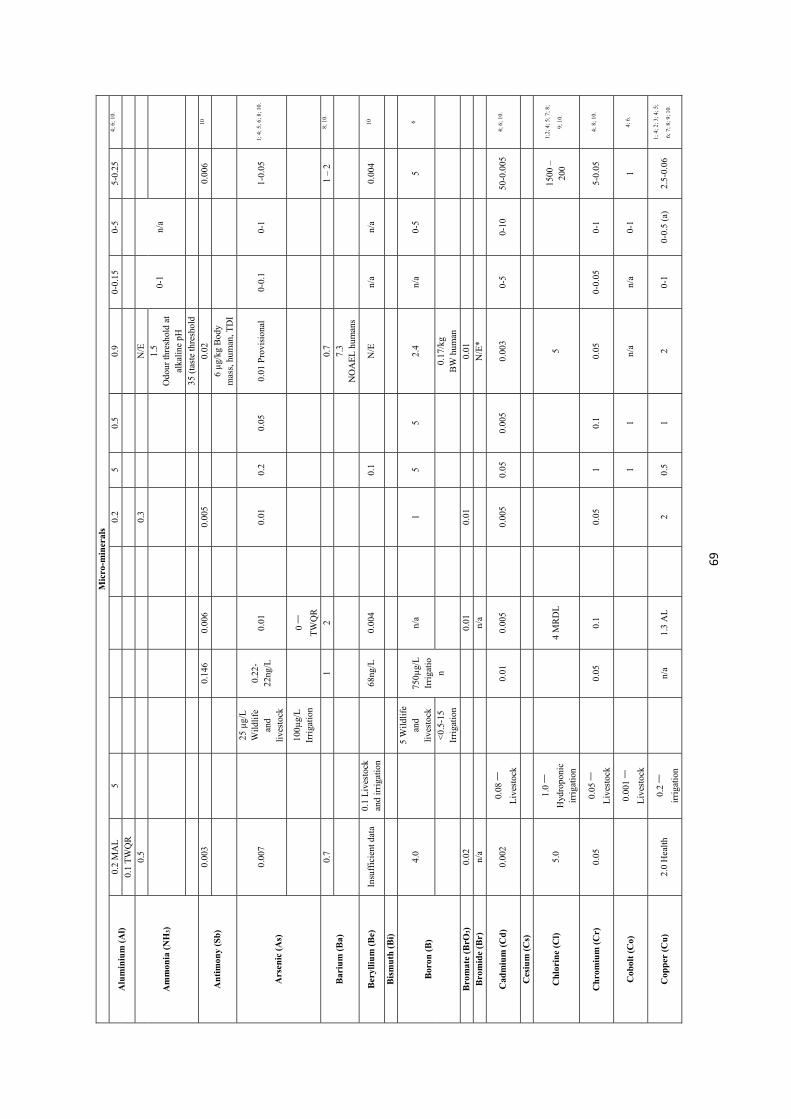
69
Mic
ro-m
iner
als
Alu
min
ium
(A
l)
0.2
MA
L
5 0.
2 5
0.5
0.9
0-0.
15
0-5
5-0.
25
4; 6
; 10.
0.1
TW
QR
Am
mon
ia (
NH
3)
0.5
0.3
N
/E
0-1
n/a
1.
5 O
dour
thre
shol
d at
al
kalin
e pH
35 (
tast
e th
resh
old
An
tim
ony
(Sb
) 0.
003
0.14
6 0.
006
0.00
5
0.02
0.
006
10
6
µg/
kg B
ody
mas
s, h
uman
, TD
I
Ars
enic
(A
s)
0.00
7
25 µ
g/L
W
ildl
ife
and
live
stoc
k
0.22
-22
ng/L
0.
01
0.
01
0.2
0.05
0.
01 P
rovi
sion
al
0-0.
1 0-
1 1-
0.05
1;
4; 5
; 6; 8
; 10.
100µ
g/L
Ir
riga
tion
0 –
TW
QR
Bar
ium
(B
a)
0.7
1 2
0.
7 1
– 2
8; 1
0.
7.
3 N
OA
EL
hum
ans
Ber
ylli
um
(B
e)
Insu
ffic
ient
dat
a 0.
1 L
ives
tock
an
d ir
riga
tion
68
ng/L
0.
004
0.1
N
/E
n/a
n/a
0.00
4 10
Bis
mu
th (
Bi)
Bor
on (
B)
4.0
5
Wil
dlif
e an
d li
vest
ock
750µ
g/L
Ir
riga
tio
n
n/a
1
5 5
2.4
n/a
0-5
5 6
<0.
5-15
Ir
riga
tion
0.17
/kg
BW
hum
an
Bro
mat
e (B
rO3)
0.
02
0.01
0.
01
0.
01
Bro
mid
e (B
r)
n/a
n/a
N
/E*
Cad
miu
m (
Cd
) 0.
002
0.08
–
Liv
esto
ck
0.
01
0.00
5
0.00
5 0.
05
0.00
5 0.
003
0-5
0-10
50
-0.0
05
4; 6
; 10.
Ces
ium
(C
s)
Ch
lori
ne
(Cl)
5.
0 1.
0 –
Hyd
ropo
nic
irri
gati
on
4 M
RD
L
5
15
00 –
20
0
1;2;
4; 5
; 7; 8
;
9; 1
0.
Ch
rom
ium
(C
r)
0.05
0.
05 –
Liv
esto
ck
0.
05
0.1
0.
05
1 0.
1 0.
05
0-0.
05
0-1
5-0.
05
4; 8
; 10.
Cob
olt
(Co)
0.00
1 –
Liv
esto
ck
1
1 n/
a n/
a 0-
1 1
4; 6
.
Cop
per
(C
u)
2.0
Hea
lth
0.2 –
irri
gati
on
n/
a 1.
3 A
L
2
0.5
1 2
0-1
0-0.
5 (a
) 2.
5-0.
06
1; 4
; 2; 3
; 4; 5
;
6; 7
; 8; 9
; 10.
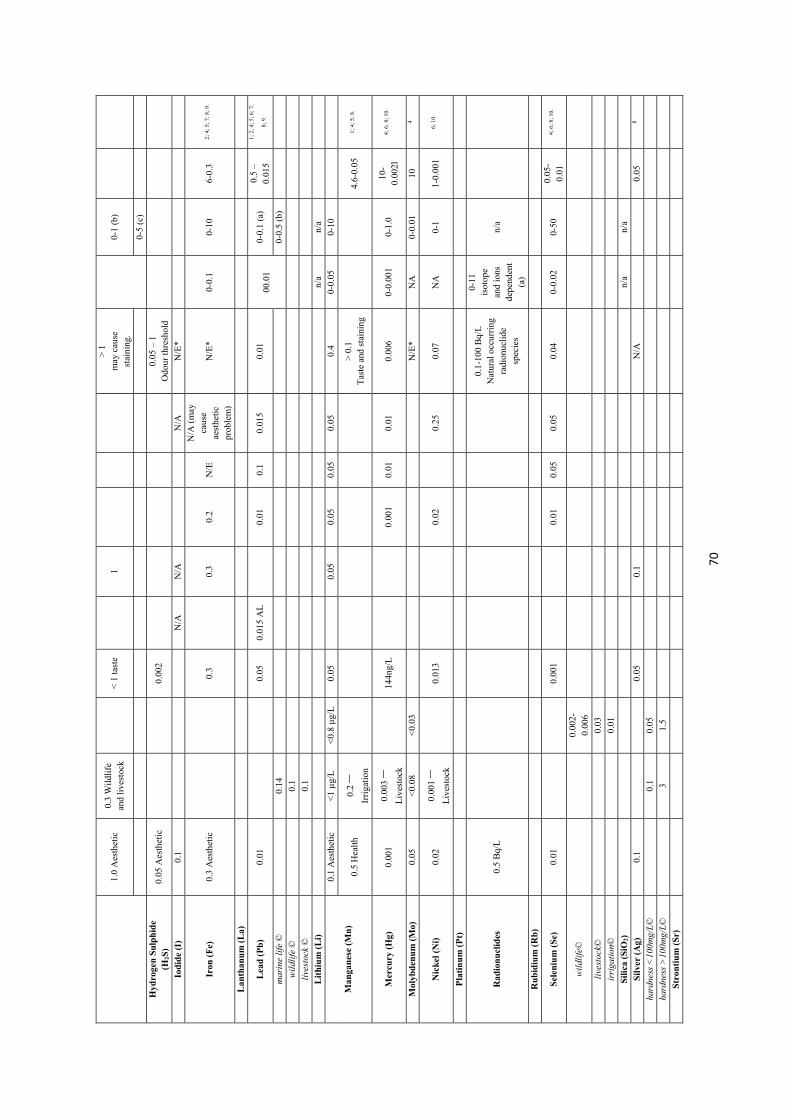
70
1.0
Aes
thet
ic
0.3
Wil
dlif
e an
d li
vest
ock
<
1 ta
ste
1
>
1
may
cau
se
stai
ning
. 0-
1 (b
)
0-5
(c)
Hyd
roge
n S
ulp
hid
e (H
2S)
0.05
Aes
thet
ic
0.00
2
0.05
– 1
O
dour
thre
shol
d
Iodi
de
(I)
0.1
N/A
N
/A
N
/A
N/E
*
Iron
(F
e)
0.3
Aes
thet
ic
0.3
0.
3 0.
2 N
/E
N/A
(m
ay
caus
e ae
sthe
tic
prob
lem
)
N/E
* 0-
0.1
0-10
6-
0.3
2; 4
; 5; 7
; 8; 9
.
Lan
than
um
(L
a)
Lea
d (
Pb
) 0.
01
0.05
0.
015
AL
0.01
0.
1 0.
015
0.01
00
.01
0-0.
1 (a
) 0.
5 –
0.01
5
1; 2
; 4; 5
; 6; 7
;
8; 9
.
mar
ine
life
©
0.
14
0-
0.5
(b)
wil
dlif
e ©
0.1
live
stoc
k ©
0.1
Lit
hiu
m (
Li)
n/
a n/
a
Man
gan
ese
(Mn
)
0.1
Aes
thet
ic
<1
µg/
L
<0.
8 µ
g/L
0.
05
0.05
0.
05
0.05
0.
05
0.4
0-0.
05
0-10
0.5
Hea
lth
0.2 –
Irri
gati
on
>
0.1
T
aste
and
sta
inin
g
4.
6-0.
05
1; 4
; 5; 8
.
Mer
cury
(H
g)
0.00
1 0.
003 –
Liv
esto
ck
14
4ng/
L
0.00
1 0.
01
0.01
0.
006
0-0.
001
0-1.
0 10
-0.
002l
4;
6; 8
; 10.
Mol
ybd
enu
m (
Mo)
0.
05
<0.
08
<0.
03
N
/E*
NA
0-
0.01
10
4
Nic
kel (
Ni)
0.
02
0.00
1 –
Liv
esto
ck
0.
013
0.02
0.25
0.
07
NA
0-
1 1-
0.00
1 6;
10.
Pla
tin
um
(P
t)
Rad
ion
ucl
ides
0.
5 B
q/L
0.1-
100
Bq/
L
Nat
ural
occ
urri
ng
radi
onuc
lide
spec
ies
0-11
is
otop
e an
d io
ns
depe
nden
t (a
)
n/a
Ru
bid
ium
(R
b)
Sel
eniu
m (
Se)
0.
01
0.00
1
0.
01
0.05
0.
05
0.04
0-
0.02
0-
50
0.05
-0.
01
4; 6
; 8; 1
0.
wil
dlif
e©
0.00
2-0.
006
live
stoc
k©
0.
03
irri
gatio
n©
0.
01
Sili
ca (
SiO
2)
n/a
n/a
Sil
ver
(Ag)
0.
1 0.
05
0.1
N
/A
0.05
8
hard
ness
<10
0mg/
L©
0.
1 0.
05
hard
ness
>10
0mg/
L©
3
1.5
Str
onti
um
(S
r)
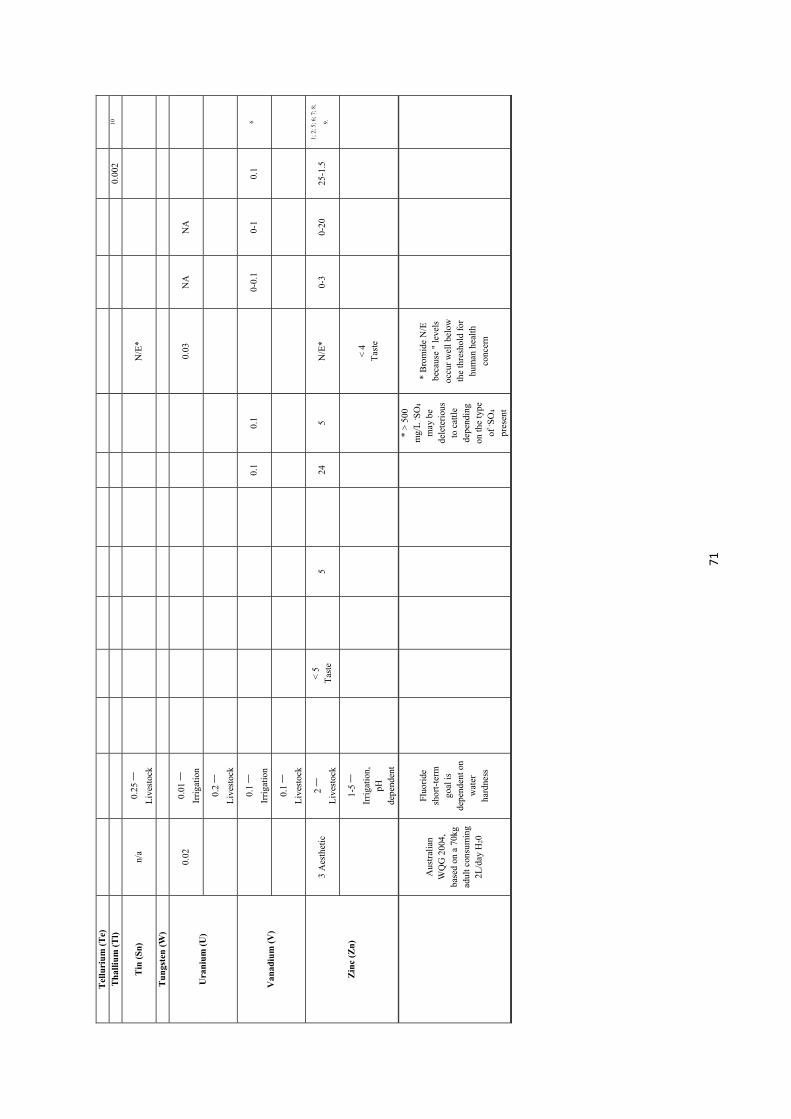
71
Tel
luri
um
(T
e)
Th
alli
um
(T
l)
0.00
2 10
Tin
(S
n)
n/a
0.25
–
Liv
esto
ck
N
/E*
Tu
ngs
ten
(W
)
Ura
niu
m (
U)
0.02
0.
01 –
Irri
gati
on
0.
03
NA
N
A
0.
2 –
Liv
esto
ck
Van
adiu
m (
V)
0.
1 –
Irri
gati
on
0.
1 0.
1
0-0.
1 0-
1 0.
1 6
0.
1 –
Liv
esto
ck
Zin
c (Z
n)
3 A
esth
etic
2 –
Liv
esto
ck
<
5
Tas
te
5
24
5
N/E
* 0-
3 0-
20
25-1
.5
1; 2
; 5; 6
; 7; 8
;
9.
1-5 –
Irri
gati
on,
pH
depe
nden
t
<
4
Tas
te
Aus
tral
ian
WQ
G 2
004,
ba
sed
on a
70k
g ad
ult c
onsu
min
g 2L
/day
H20
Fluo
ride
sh
ort-
term
go
al is
de
pend
ent o
n w
ater
ha
rdne
ss
* >
500
m
g/L
- SO
4 m
ay b
e de
lete
riou
s to
cat
tle
depe
ndin
g on
the
type
of
- SO
4 pr
esen
t
* B
rom
ide
N/E
be
caus
e "
leve
ls
occu
r w
ell b
elow
th
e th
resh
old
for
hum
an h
ealt
h co
ncer
n
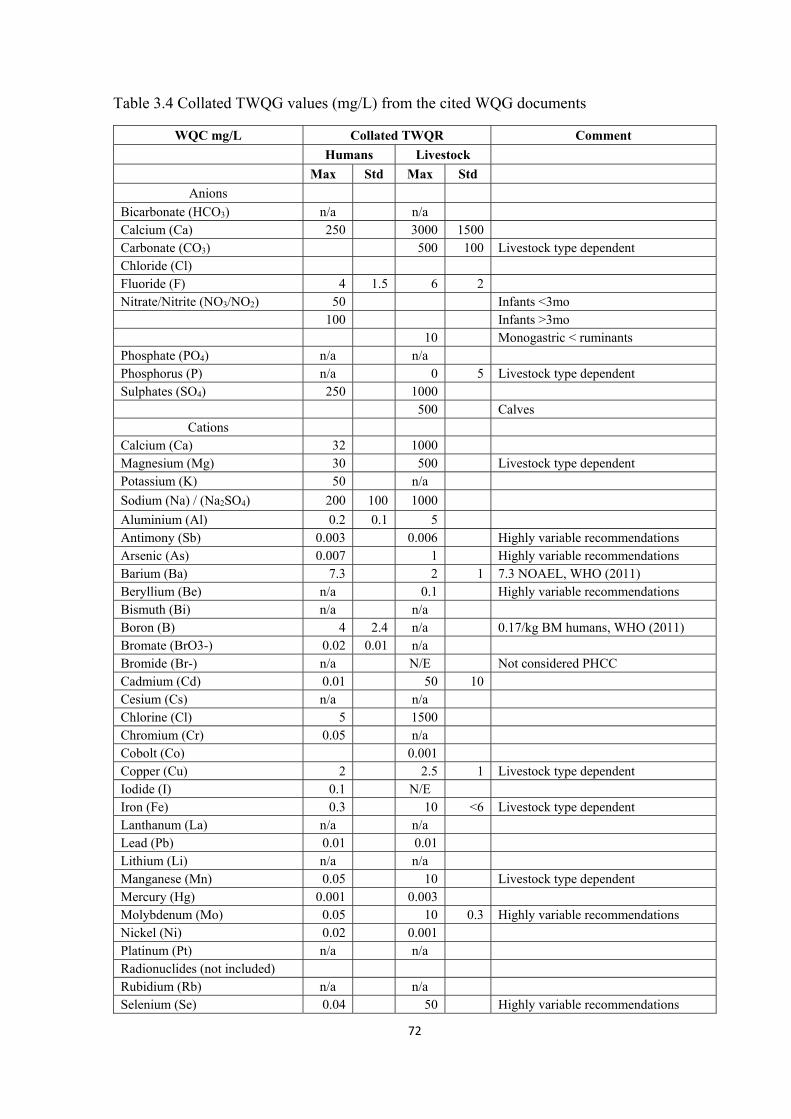
72
Table 3.4 Collated TWQG values (mg/L) from the cited WQG documents
WQC mg/L Collated TWQR Comment
Humans Livestock
Max Std Max Std
Anions
Bicarbonate (HCO3) n/a n/a Calcium (Ca) 250 3000 1500 Carbonate (CO3) 500 100 Livestock type dependent Chloride (Cl) Fluoride (F) 4 1.5 6 2 Nitrate/Nitrite (NO3/NO2) 50 Infants <3mo 100 Infants >3mo 10 Monogastric < ruminants Phosphate (PO4) n/a n/a Phosphorus (P) n/a 0 5 Livestock type dependent Sulphates (SO4) 250 1000 500 Calves
Cations Calcium (Ca) 32 1000 Magnesium (Mg) 30 500 Livestock type dependent Potassium (K) 50 n/a
Sodium (Na) / (Na2SO4) 200 100 1000
Aluminium (Al) 0.2 0.1 5 Antimony (Sb) 0.003 0.006 Highly variable recommendations Arsenic (As) 0.007 1 Highly variable recommendations Barium (Ba) 7.3 2 1 7.3 NOAEL, WHO (2011) Beryllium (Be) n/a 0.1 Highly variable recommendations Bismuth (Bi) n/a n/a Boron (B) 4 2.4 n/a 0.17/kg BM humans, WHO (2011) Bromate (BrO3-) 0.02 0.01 n/a Bromide (Br-) n/a N/E Not considered PHCC Cadmium (Cd) 0.01 50 10 Cesium (Cs) n/a n/a Chlorine (Cl) 5 1500 Chromium (Cr) 0.05 n/a Cobolt (Co) 0.001 Copper (Cu) 2 2.5 1 Livestock type dependent Iodide (I) 0.1 N/E Iron (Fe) 0.3 10 <6 Livestock type dependent Lanthanum (La) n/a n/a Lead (Pb) 0.01 0.01 Lithium (Li) n/a n/a Manganese (Mn) 0.05 10 Livestock type dependent Mercury (Hg) 0.001 0.003 Molybdenum (Mo) 0.05 10 0.3 Highly variable recommendations Nickel (Ni) 0.02 0.001 Platinum (Pt) n/a n/a Radionuclides (not included) Rubidium (Rb) n/a n/a Selenium (Se) 0.04 50 Highly variable recommendations
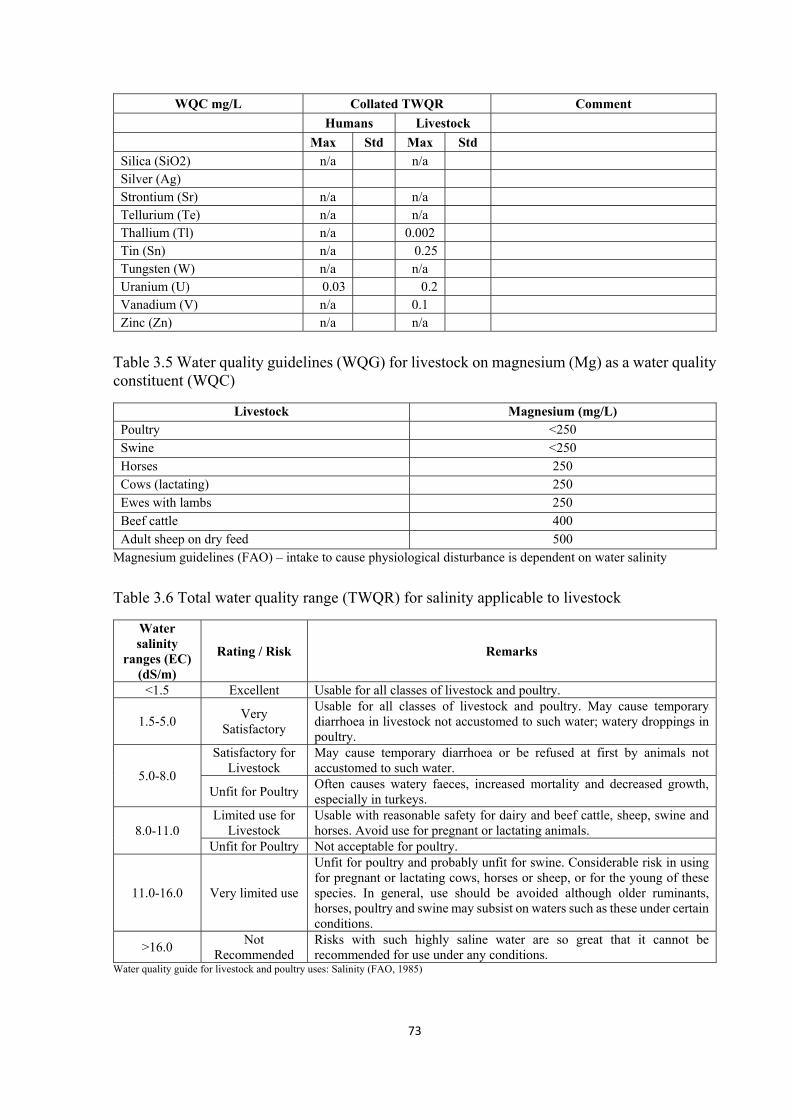
73
WQC mg/L Collated TWQR Comment
Humans Livestock
Max Std Max Std
Silica (SiO2) n/a n/a Silver (Ag) Strontium (Sr) n/a n/a Tellurium (Te) n/a n/a Thallium (Tl) n/a 0.002 Tin (Sn) n/a 0.25 Tungsten (W) n/a n/a Uranium (U) 0.03 0.2 Vanadium (V) n/a 0.1 Zinc (Zn) n/a n/a
Table 3.5 Water quality guidelines (WQG) for livestock on magnesium (Mg) as a water quality constituent (WQC)
Livestock Magnesium (mg/L) Poultry <250 Swine <250 Horses 250 Cows (lactating) 250 Ewes with lambs 250 Beef cattle 400 Adult sheep on dry feed 500
Magnesium guidelines (FAO) – intake to cause physiological disturbance is dependent on water salinity
Table 3.6 Total water quality range (TWQR) for salinity applicable to livestock
Water salinity
ranges (EC) (dS/m)
Rating / Risk Remarks
<1.5 Excellent Usable for all classes of livestock and poultry.
1.5-5.0 Very
Satisfactory
Usable for all classes of livestock and poultry. May cause temporary diarrhoea in livestock not accustomed to such water; watery droppings in poultry.
5.0-8.0
Satisfactory for Livestock
May cause temporary diarrhoea or be refused at first by animals not accustomed to such water.
Unfit for Poultry Often causes watery faeces, increased mortality and decreased growth, especially in turkeys.
8.0-11.0 Limited use for
Livestock Usable with reasonable safety for dairy and beef cattle, sheep, swine and horses. Avoid use for pregnant or lactating animals.
Unfit for Poultry Not acceptable for poultry.
11.0-16.0 Very limited use
Unfit for poultry and probably unfit for swine. Considerable risk in using for pregnant or lactating cows, horses or sheep, or for the young of these species. In general, use should be avoided although older ruminants, horses, poultry and swine may subsist on waters such as these under certain conditions.
>16.0 Not
Recommended Risks with such highly saline water are so great that it cannot be recommended for use under any conditions.
Water quality guide for livestock and poultry uses: Salinity (FAO, 1985)

74
Box 3.1 Target water quality range (TWQR, mg/L) based formats of the water quality guidelines
Arsenic Medium incidence TWQR mg/L
Effects – all livestock
0-1.0 No adverse effects.
1.0-1.5
Adverse acute effects, e.g. anaemia, incoordination, haemorrhagic diarrhoea and dehydration may occur in sensitive species (pigs and poultry), although short-term exposure is usually tolerated. Acute effects are unlikely in larger animals (cattle, sheep, goats and horses), but may occur if arsenic feed concentrations are elevated and could be tolerated in long-term exposure according to SSF.
> 1.5 Adverse acute effects may occur, particularly in more sensitive species (pigs and poultry), although short-term exposure could be tolerated according to SSF.
Boron Low incidence TWQR mg/L
Effects – all livestock
0-5 No adverse effects.
5-50 Adverse chronic effects (decrease in feed intake and weight loss) may occur, but are unlikely if feed concentrations are normal, and exposure is short-term. Ruminants may be more tolerant than monogastrics. Could be tolerated in the long-term according to SSF.
> 50 Adverse chronic effects may occur (see above), although short-term exposure may be tolerated according to SSF.
Cadmium TWQR mg/L
Effects – all livestock
0-0.01 No adverse effects.
0.01-0.02
Adverse chronic effects such as anaemia, testicular degeneration, reduced feed intake and milk production and reduced growth may occur, but are unlikely if exposure is short-term, dietary protein, calcium and phosphorus intake is adequate, and feed concentration of cadmium is normal. Adverse acute effects such as abortions, still births, hepatotoxicity and nephrotoxicity may occur, but suckling and pregnant livestock are principally at risk. Could be tolerated in the long-term depending on Ca: P ratio present and SSF.
> 0.02 Adverse chronic and acute effects (as above) may occur, although short-term exposure could be tolerated depending on feed concentrations of Cd, adequate intake of dietary protein, Ca and P, and according to SSF.
(Casey and Meyer, 1996d)
Box 3.2 Target water quality range (TWQR, mg/L) based formats of the water quality guidelines
Chloride High incidence TWQR mg/L
Effects
Sheep Cattle Dairy cattle, pregnant and lactating cattle
Ruminants Monogastrics Poultry
0-1500
1500-2000
2000-3000
3000-4000
4000-5000
5000-6000
> 6000 Key for Cl TWQR. No adverse effects.

75
Adverse chronic effects such as decreased feed and WI and a decline in productivity may occur, but are unlikely. Adverse effects that do occur will most likely be temporary and normal production should continue once stock are adapted (see TDS). Adverse chronic effects such as decreased feed and WI, weight loss and a decline in productivity may occur, but will most likely be temporary and normal production should continue once stock are adapted (see TDS). Adverse chronic (as above) and acute effects such as osmotic disturbances, hypertension, dehydration, renal damage and salt poisoning may occur. May be tolerated for shorter exposure time depending on site-specific factors and adaptation. Stock may subsist under certain conditions, but production will in all likelihood declines (see TDS).
Copper Medium incidence
TWQR mg/L Effects
Horses, pigs and poultry Cattle Sheep and pre-weaned calves
0-0.5
0.5-1
1-2
2-5
5-10
> 10
Key for Cu TWQR No adverse effects. Adverse chronic effects such as diarrhoea and liver damage may occur, but may be tolerated if there is adequate Mo and S intake, feed concentrations are normal, and exposure is short-term. Could be tolerated in the long-term according to SSF.
Adverse chronic effects (as above) may occur, but are unlikely if there is adequate Mo and S intake, – feed concentrations are
normal and exposure is short-term. Could be tolerated in the long-term according to SSF. Adverse chronic (as above) and acute effects such as liver damage haemolytic jaundice may occur, although short-term exposure could be tolerated according to SSF.
Fluoride High incidence
TWQR mg/L Effects
Horses, pigs and poultry Cattle Sheep and pre-weaned calves
0-2
2-4
4-6
6-12
> 12
Key for F TWQR. No adverse effects. Adverse chronic effects associated with dental fluorosis in young livestock and skeletal fluorosis In mature livestock such as mottling of teeth and enamel hypoplasia, a decrease in feed and WI and a decline in productivity may occur, with continuous long-term exposure, but are unlikely if feed concentrations are normal, and exposure is short-term. Could be tolerated in the long-term according to SSF. Adverse chronic (as above) and acute effects such as crippling, lameness and weight loss may occur, although short-term exposure could be tolerated according to SSF.
(Casey and Meyer, 1996d)
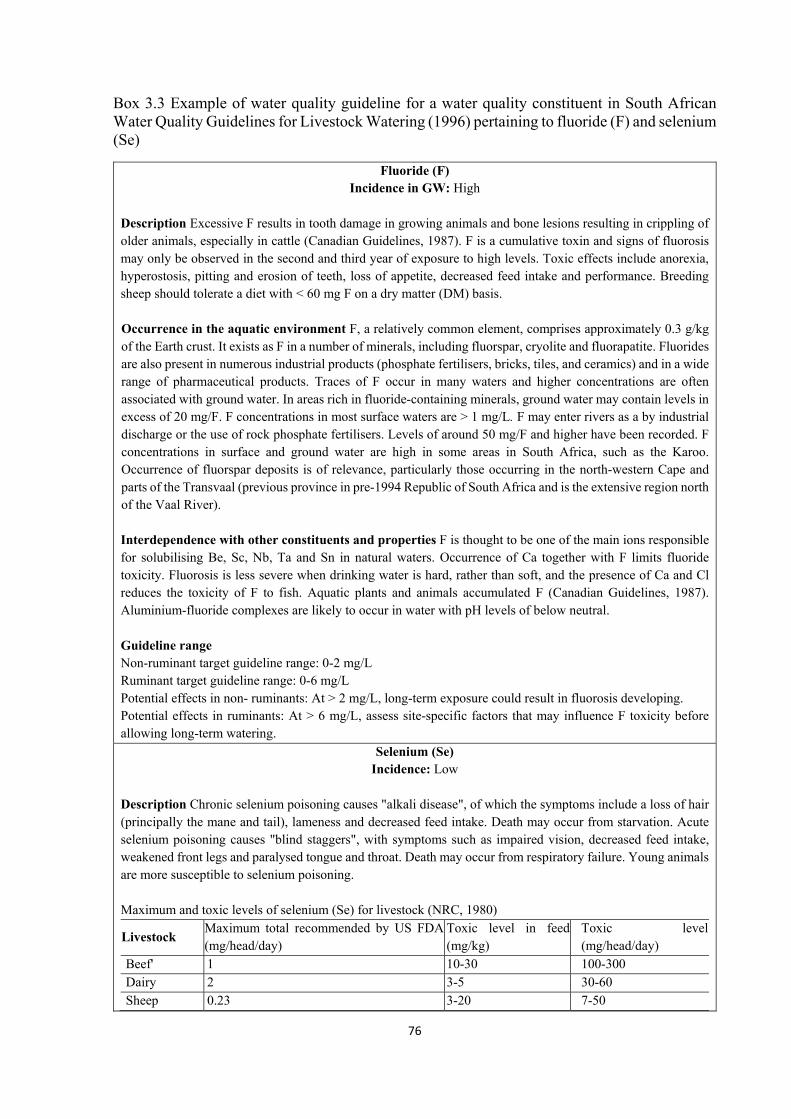
76
Box 3.3 Example of water quality guideline for a water quality constituent in South African Water Quality Guidelines for Livestock Watering (1996) pertaining to fluoride (F) and selenium (Se)
Fluoride (F) Incidence in GW: High
Description Excessive F results in tooth damage in growing animals and bone lesions resulting in crippling of older animals, especially in cattle (Canadian Guidelines, 1987). F is a cumulative toxin and signs of fluorosis may only be observed in the second and third year of exposure to high levels. Toxic effects include anorexia, hyperostosis, pitting and erosion of teeth, loss of appetite, decreased feed intake and performance. Breeding sheep should tolerate a diet with < 60 mg F on a dry matter (DM) basis. Occurrence in the aquatic environment F, a relatively common element, comprises approximately 0.3 g/kg of the Earth crust. It exists as F in a number of minerals, including fluorspar, cryolite and fluorapatite. Fluorides are also present in numerous industrial products (phosphate fertilisers, bricks, tiles, and ceramics) and in a wide range of pharmaceutical products. Traces of F occur in many waters and higher concentrations are often associated with ground water. In areas rich in fluoride-containing minerals, ground water may contain levels in excess of 20 mg/F. F concentrations in most surface waters are > 1 mg/L. F may enter rivers as a by industrial discharge or the use of rock phosphate fertilisers. Levels of around 50 mg/F and higher have been recorded. F concentrations in surface and ground water are high in some areas in South Africa, such as the Karoo. Occurrence of fluorspar deposits is of relevance, particularly those occurring in the north-western Cape and parts of the Transvaal (previous province in pre-1994 Republic of South Africa and is the extensive region north of the Vaal River). Interdependence with other constituents and properties F is thought to be one of the main ions responsible for solubilising Be, Sc, Nb, Ta and Sn in natural waters. Occurrence of Ca together with F limits fluoride toxicity. Fluorosis is less severe when drinking water is hard, rather than soft, and the presence of Ca and Cl reduces the toxicity of F to fish. Aquatic plants and animals accumulated F (Canadian Guidelines, 1987). Aluminium-fluoride complexes are likely to occur in water with pH levels of below neutral. Guideline range Non-ruminant target guideline range: 0-2 mg/L Ruminant target guideline range: 0-6 mg/L Potential effects in non- ruminants: At > 2 mg/L, long-term exposure could result in fluorosis developing. Potential effects in ruminants: At > 6 mg/L, assess site-specific factors that may influence F toxicity before allowing long-term watering.
Selenium (Se) Incidence: Low
Description Chronic selenium poisoning causes "alkali disease", of which the symptoms include a loss of hair (principally the mane and tail), lameness and decreased feed intake. Death may occur from starvation. Acute selenium poisoning causes "blind staggers", with symptoms such as impaired vision, decreased feed intake, weakened front legs and paralysed tongue and throat. Death may occur from respiratory failure. Young animals are more susceptible to selenium poisoning. Maximum and toxic levels of selenium (Se) for livestock (NRC, 1980)
Livestock Maximum total recommended by US FDA (mg/head/day)
Toxic level in feed (mg/kg)
Toxic level (mg/head/day)
Beef' 1 10-30 100-300 Dairy 2 3-5 30-60 Sheep 0.23 3-20 7-50
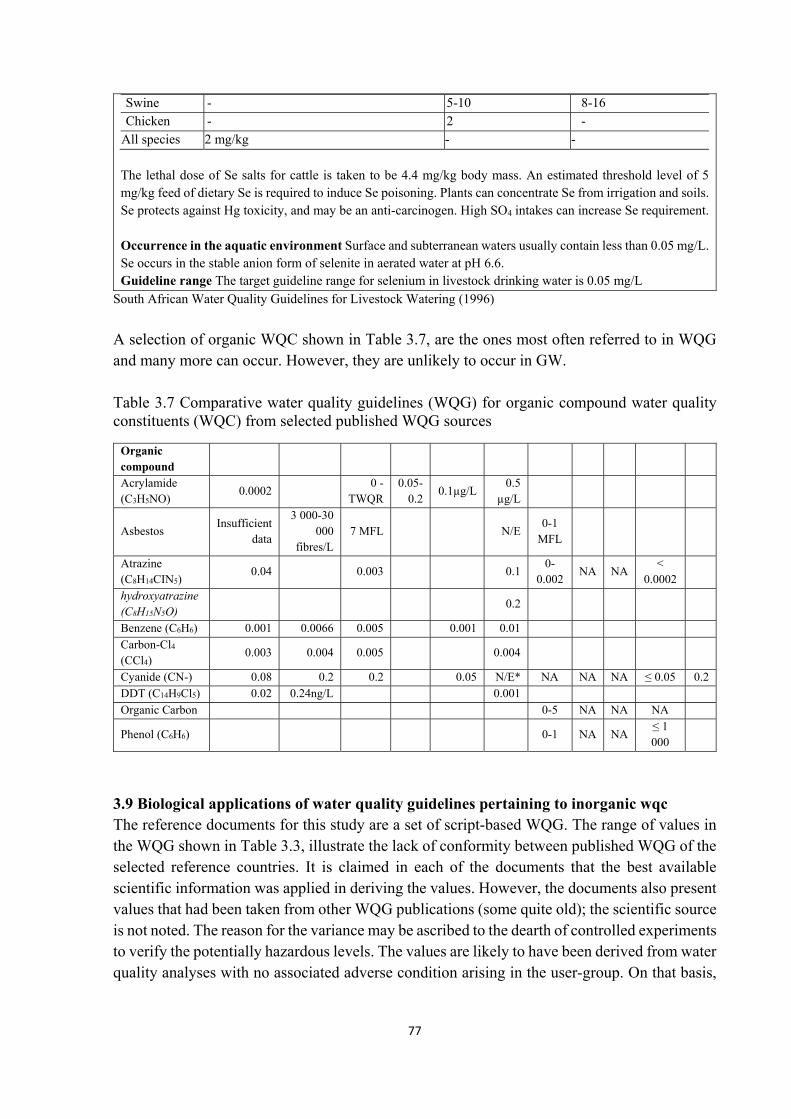
77
Swine - 5-10 8-16 Chicken - 2 -
All species 2 mg/kg - - The lethal dose of Se salts for cattle is taken to be 4.4 mg/kg body mass. An estimated threshold level of 5 mg/kg feed of dietary Se is required to induce Se poisoning. Plants can concentrate Se from irrigation and soils. Se protects against Hg toxicity, and may be an anti-carcinogen. High SO4 intakes can increase Se requirement. Occurrence in the aquatic environment Surface and subterranean waters usually contain less than 0.05 mg/L. Se occurs in the stable anion form of selenite in aerated water at pH 6.6. Guideline range The target guideline range for selenium in livestock drinking water is 0.05 mg/L
South African Water Quality Guidelines for Livestock Watering (1996)
A selection of organic WQC shown in Table 3.7, are the ones most often referred to in WQG and many more can occur. However, they are unlikely to occur in GW. Table 3.7 Comparative water quality guidelines (WQG) for organic compound water quality constituents (WQC) from selected published WQG sources
Organic compound
Acrylamide (C3H5NO)
0.0002 0 -
TWQR 0.05-
0.2 0.1µg/L
0.5 µg/L
Asbestos Insufficient
data
3 000-30 000
fibres/L 7 MFL N/E
0-1 MFL
Atrazine (C8H14CIN5)
0.04 0.003 0.1 0-
0.002 NA NA
< 0.0002
hydroxyatrazine (C8H15N5O)
0.2
Benzene (C6H6) 0.001 0.0066 0.005 0.001 0.01 Carbon-Cl4 (CCl4)
0.003 0.004 0.005 0.004
Cyanide (CN-) 0.08 0.2 0.2 0.05 N/E* NA NA NA ≤ 0.05 0.2 DDT (C14H9Cl5) 0.02 0.24ng/L 0.001 Organic Carbon 0-5 NA NA NA
Phenol (C6H6) 0-1 NA NA ≤ 1 000
3.9 Biological applications of water quality guidelines pertaining to inorganic wqc The reference documents for this study are a set of script-based WQG. The range of values in the WQG shown in Table 3.3, illustrate the lack of conformity between published WQG of the selected reference countries. It is claimed in each of the documents that the best available scientific information was applied in deriving the values. However, the documents also present values that had been taken from other WQG publications (some quite old); the scientific source is not noted. The reason for the variance may be ascribed to the dearth of controlled experiments to verify the potentially hazardous levels. The values are likely to have been derived from water quality analyses with no associated adverse condition arising in the user-group. On that basis,
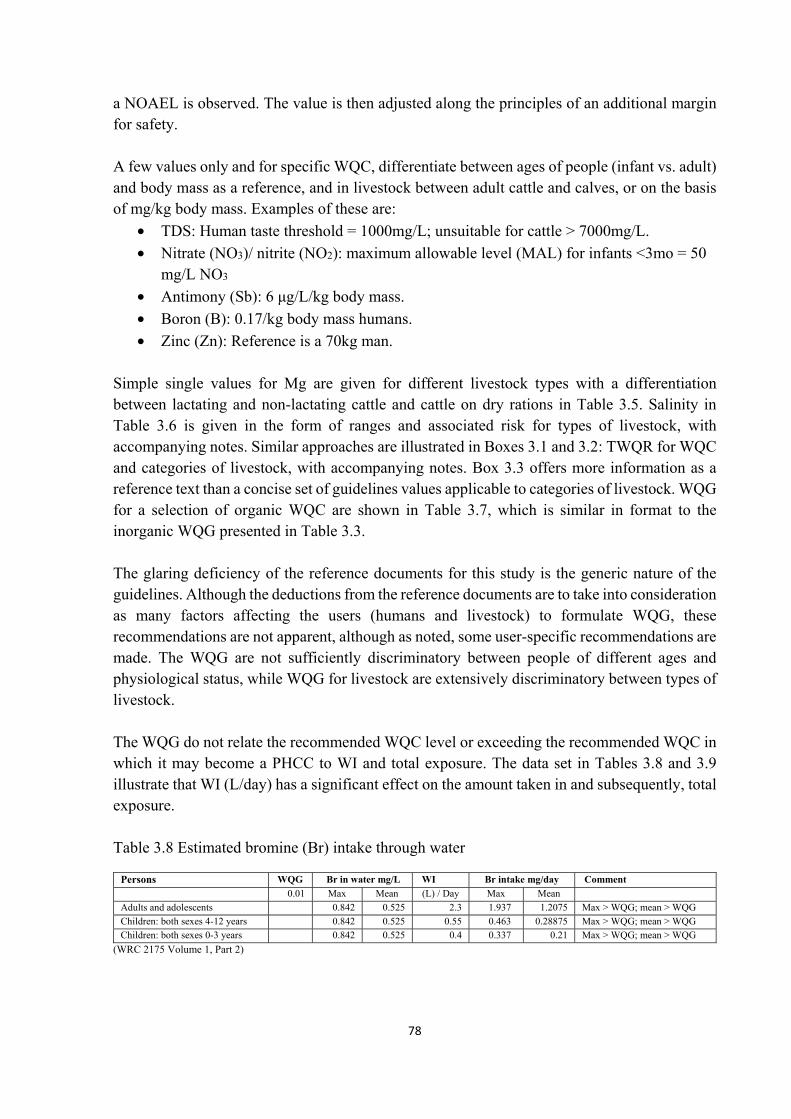
78
a NOAEL is observed. The value is then adjusted along the principles of an additional margin for safety. A few values only and for specific WQC, differentiate between ages of people (infant vs. adult) and body mass as a reference, and in livestock between adult cattle and calves, or on the basis of mg/kg body mass. Examples of these are:
• TDS: Human taste threshold = 1000mg/L; unsuitable for cattle > 7000mg/L.
• Nitrate (NO3)/ nitrite (NO2): maximum allowable level (MAL) for infants <3mo = 50 mg/L NO3
• Antimony (Sb): 6 μg/L/kg body mass.
• Boron (B): 0.17/kg body mass humans.
• Zinc (Zn): Reference is a 70kg man. Simple single values for Mg are given for different livestock types with a differentiation between lactating and non-lactating cattle and cattle on dry rations in Table 3.5. Salinity in Table 3.6 is given in the form of ranges and associated risk for types of livestock, with accompanying notes. Similar approaches are illustrated in Boxes 3.1 and 3.2: TWQR for WQC and categories of livestock, with accompanying notes. Box 3.3 offers more information as a reference text than a concise set of guidelines values applicable to categories of livestock. WQG for a selection of organic WQC are shown in Table 3.7, which is similar in format to the inorganic WQG presented in Table 3.3. The glaring deficiency of the reference documents for this study is the generic nature of the guidelines. Although the deductions from the reference documents are to take into consideration as many factors affecting the users (humans and livestock) to formulate WQG, these recommendations are not apparent, although as noted, some user-specific recommendations are made. The WQG are not sufficiently discriminatory between people of different ages and physiological status, while WQG for livestock are extensively discriminatory between types of livestock. The WQG do not relate the recommended WQC level or exceeding the recommended WQC in which it may become a PHCC to WI and total exposure. The data set in Tables 3.8 and 3.9 illustrate that WI (L/day) has a significant effect on the amount taken in and subsequently, total exposure. Table 3.8 Estimated bromine (Br) intake through water
Persons WQG Br in water mg/L WI Br intake mg/day Comment
0.01 Max Mean (L) / Day Max Mean
Adults and adolescents 0.842 0.525 2.3 1.937 1.2075 Max > WQG; mean > WQG
Children: both sexes 4-12 years 0.842 0.525 0.55 0.463 0.28875 Max > WQG; mean > WQG
Children: both sexes 0-3 years 0.842 0.525 0.4 0.337 0.21 Max > WQG; mean > WQG
(WRC 2175 Volume 1, Part 2)

79
Table 3.9 Estimated Zinc (Zn) intake through water as a dietary supplement
Persons RDA mg/d
Zn in RRWH (mg/L) WI Zn / day by WI (mg) Supplementation consequences**
Max Min Mea
n (L) per day*
Max Min Mean
Males: Adults and adolescents 11 9.60 0.646 2.713 2.3 22.09 1.486 6.241 Max > RDA; mean < RDA
Children: both sexes 4-12 yr 6 9.60 0.646 2.713 0.55 5.283 0.355 1.493 Max = RDA; mean < RDA
Children: both sexes 0-3 yr 3 9.60 0.646 2.713 0.40 3.842 0.258 1.086 Max > RDA; mean < RDA
Women: Pregnancy <18 years 12 9.60 0.646 2.713 2.3 22.09 1.486 6.241 Max > RDA; mean < RDA
Women: Pregnancy 19-50 yr 11 9.60 0.646 2.713 2.3 22.09 1.486 6.241 Max > RDA; mean < RDA
Women: Lactating <18 yr 13 9.60 0.646 2.713 2.9 27.85 1.873 7.870 Max > RDA; mean < RDA
Women: Lactating 19-50 yr 12 9.60 0.646 2.713 2.9 27.85 1.873 7.870 Max > RDA; mean < RDA
*Assumed for normal healthy people of moderate lifestyle at 95% of the empirical distribution (EPA, 2004). **No conclusive evidence on MTL for Zn in humans but is an interpretation in terms of the RDA and WQG values. (WRC 2175 Volume 1, Part 2)
It is deduced that the WQG in the given format, with the exception of those illustrated in Table 3.5 and Boxes 3.1 and 3.2, have limited application value. As noted in the WHO (2011) WQG, the guideline values must not be interpreted as the MAL or threshold value to which WQC could be lowered in order to comply. 3.10 Application of water quality guidelines according to biological reference criteria It is noted in the text that the WQG documents referred to are limited in recommending WQG in terms of biological reference criteria. The preceding text shows that linear discrimination between people of different ages and physiological status (e.g. pregnant and lactating women and the level of physical activity can be included) are subjected to different potential total exposures of WQC. In humans, the reference body mass (BM) is standardised at 70kg for men and 60kg for women. This is applied to estimate the NOAEL for adults and various chemicals. A number of biases are in the BM reference since it does not accommodate accurately differences in MBM in relation to BM. 3.10.1 Metabolic body mass (MBM) in mammals In mammals, basal metabolic rate (BMR) is proportional to body mass (kg0.76). The relationship is allometric and applies to humans and livestock. MBM is the proportion of BM reliably related to energy metabolism of the body in a resting state (BMR). The relationship is exponential where MBM = BMkg0.76. Table 3.10 and Figure 3.3 illustrate the relationship between BM and MBM. Figure 3.4 illustrates the log relationship between MBM and BM and Figure 3.5 illustrates the relationship between MBM as percentage of BM.
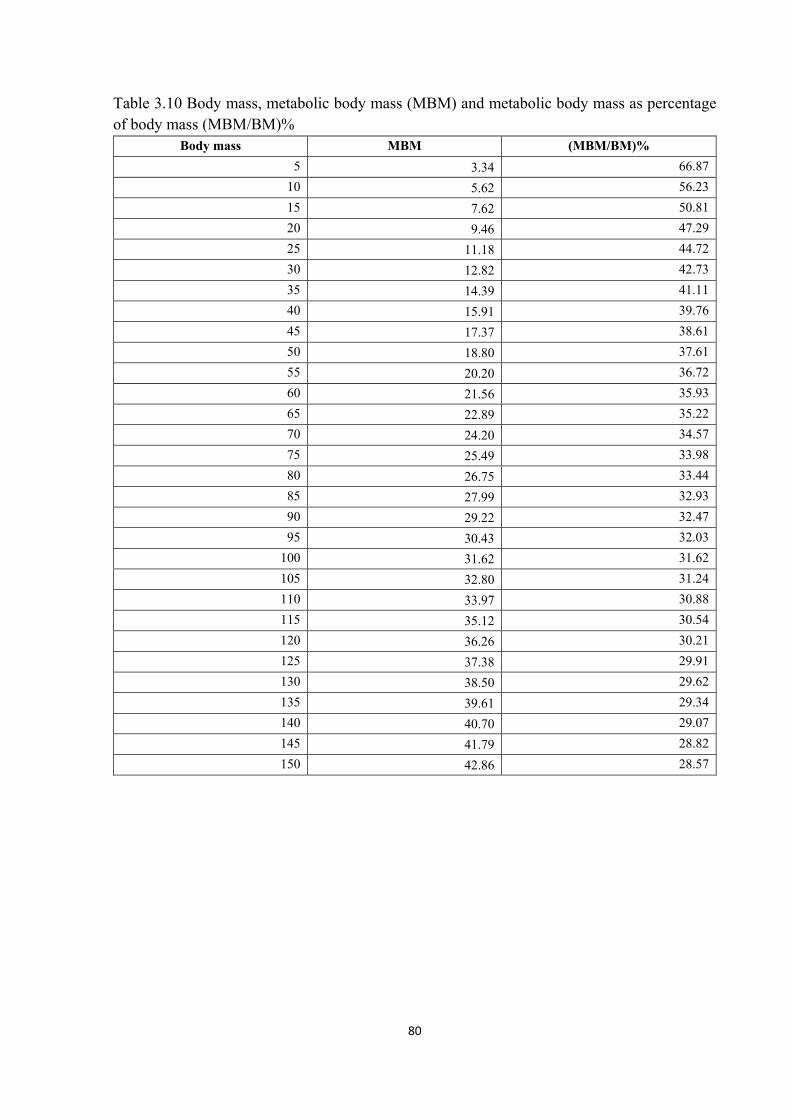
80
Table 3.10 Body mass, metabolic body mass (MBM) and metabolic body mass as percentage of body mass (MBM/BM)%
Body mass MBM (MBM/BM)%
5 3.34 66.87
10 5.62 56.23
15 7.62 50.81
20 9.46 47.29
25 11.18 44.72
30 12.82 42.73
35 14.39 41.11
40 15.91 39.76
45 17.37 38.61
50 18.80 37.61
55 20.20 36.72
60 21.56 35.93
65 22.89 35.22
70 24.20 34.57
75 25.49 33.98
80 26.75 33.44
85 27.99 32.93
90 29.22 32.47
95 30.43 32.03
100 31.62 31.62
105 32.80 31.24
110 33.97 30.88
115 35.12 30.54
120 36.26 30.21
125 37.38 29.91
130 38.50 29.62
135 39.61 29.34
140 40.70 29.07
145 41.79 28.82
150 42.86 28.57
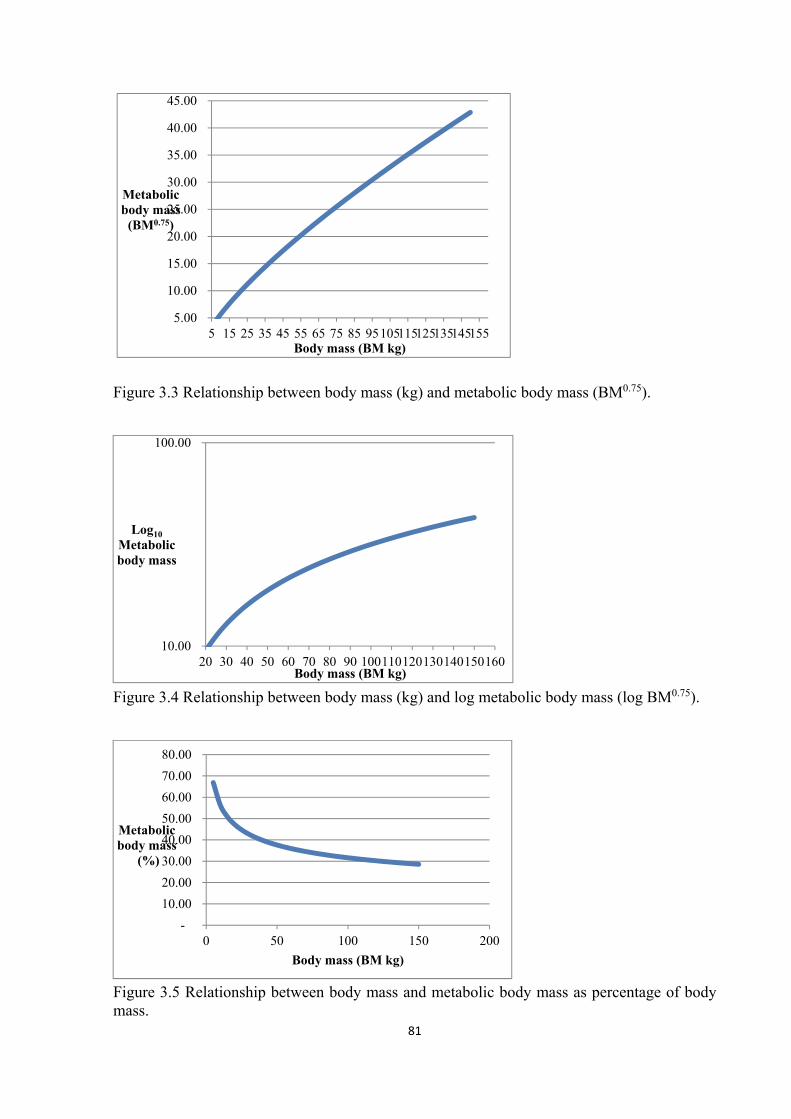
81
Figure 3.3 Relationship between body mass (kg) and metabolic body mass (BM0.75).
Figure 3.4 Relationship between body mass (kg) and log metabolic body mass (log BM0.75).
Figure 3.5 Relationship between body mass and metabolic body mass as percentage of body mass.
5.00
10.00
15.00
20.00
25.00
30.00
35.00
40.00
45.00
5 15 25 35 45 55 65 75 85 95105115125135145155
Metabolic body mass
(BM0.75)
Body mass (BM kg)
10.00
100.00
20 30 40 50 60 70 80 90 100110120130140150160
Log10Metabolic body mass
Body mass (BM kg)
-
10.00
20.00
30.00
40.00
50.00
60.00
70.00
80.00
0 50 100 150 200
Metabolic body mass
(%)
Body mass (BM kg)

82
The guidelines give WQC values of mg/L, but do not place this in relation to BM or MBM. Tables 3.8 and 3.9 show the estimated relative WI rates of various categories of people without a reference to metabolic rates. The WI rates in Table 3.9 show differences between women in different physiological states. The estimates are very broad assumptions. If the WI, and thereby exposure to WQC, were calculated in terms of BM or MBM, the potential of a WQC being considered a COC or PHCC is more accurate, since it is assessed against a biological standard. Table 3.11 illustrates that based on the standard WI of 2.3 L/d for adults and adolescents the exposure to a WQC is linear between BM categories. If the WI is related to activity level, for example, low and high at 80% and 120% of the standard, respectively, the relationships decrease or increase linearly. Calculating the intake and exposure per MBM, the relationship is exponential decreasing. Since MBM decreases exponentially against BM, the risk associated with a WQC decreases exponentially. The calculated MBM for very young children of 5 kg BM is 3.34 or 66.87% of BM; in a teenager of 45 kg, MBM is 17.37 with the ratio decreasing to 38.61%, and in an adult of 80 kg, MBM is 26.75, which is 33.44% of BM. The assumption is based on MBM calculated on a BMR. Activity and muscle type influence MBM, which could be taken into consideration, but would add a more complex dimension to the assessment of risk. Activity is taken into account in the illustration as a factor of WI, where low activity is calculated at 80% of the reference value (2.3 L/d) and the high activity at 120% of the reference value. The principles illustrated would apply to mammalian livestock (cattle, sheep, goats, pigs, horses and others).
Table 3.11 Water quality constituent (WQC) intake based on body mass (BM) and metabolic body mass (MBM) and relative level of activity
Persons WQG value for a WQC
BM kg WI L/d
WI L/kg BM/d
WQC intake mg/d
WQC intake/kg
BM/d
Based on BM 0.01
Adults and adolescents 50kg (Average, index 1) 50 2.3 0.0460 0.0230 0.00046
Adults and adolescents 50kg (Low activity, index 0.8) 50 1.84 0.0368 0.0184 0.00037
Adults and adolescents 50kg (High activity, index 1.2) 50 2.76 0.0552 0.0276 0.00055
Adults and adolescents 80kg (Average, index 1) 80 3.68 0.0460 0.0230 0.00046
Adults and adolescents 80kg (Low activity, index 0.8) 80 2.94 0.0368 0.0184 0.00037
Adults and adolescents 80kg (High activity, index 1.2) 80 4.42 0.0552 0.0276 0.00055
Based on MBM WQG value for a WQC
MBM WI L/d
WI L/MBM/d
WQC intake mg/d
WQC intake/MBM/d
Adults and adolescents 50kg (Average, index 1) 18.80 2.3 0.1223 0.0230 0.00122
Adults and adolescents 50kg (Low activity, index 0.8) 18.80 1.84 0.0979 0.0184 0.00098
Adults and adolescents 50kg (High activity, index 1.2) 18.80 2.76 0.1468 0.0276 0.00147
Adults and adolescents 80kg (Average, index 1) 26.75 3.68 0.0860 0.0230 0.00086
Adults and adolescents 80kg (Low activity, index 0.8) 26.75 2.94 0.0688 0.0184 0.00069
Adults and adolescents 80kg (High activity, index 1.2) 26.75 4.42 0.1032 0.0276 0.00103
83
3.10.2 Constituent Intake Rate Risk Assessment model (CIRRA) The CIRRA model was proposed in 1989 for the WRC project. It took much research into WI studies and the responses of various categories of livestock to WQC as well as extensive literature studies to set the foundations contained in WRC reports to develop the CIRRA model (Meyer, 1998; Casey and Meyer, 1998d; Meyer and Casey, 2012). The model is based on Equation 1:
Y (risk factor) = X1[Animal (or person) type] * X2[Animal (or person)’s physiological
status] * X3[environmental demands] * X4[water (PHCC) intake and turnover rate] * X5[level of PHCC] * X6[physiological effect of PHCC] * …. Xn x e
The CIRRA model is based on biological reference criteria such as animal type, physiological status, WI and turnover rates; and then evaluates the risk imposed by other factors that are either aggravating or mitigating. This is essentially a metric system to estimate more accurately the probability of a WQC becoming a PHCC. The publication of Meyer and Casey (2012) follows on the preceding publications noted and describes the development of risk assessment. It was noted that even with a software-based tool for risk assessment, general preceding observations are made. A risk assessment is generally done either when (i) an analysis of water has revealed a COC or PHCC, or (ii) either subclinical (loss in production) or clinical (pathological condition) toxicity symptoms have been observed. For the latter, before starting the risk assessment, the user would first need to (i) do a clinical examination of the affected animals and to establish the incidence of the problem within the group or region and (ii) eliminate other known causes of both subclinical and clinical observations (See (WRC 2175 Volume 1, Part 2). The risk assessment would be conducted as described in Boxes 3.4 and 3.5. The CIRRA model would ask the user to enter choices for each variable, such as the livestock type, the physiological status of the animal, the type of ration fed, the characteristics of the range, the season, etc. The system uses algorithms to estimate the risk for each of the constituents in the sample. The reference values in the model are published values obtained, for example, from the National Research Council (USA) tables or based on published studies. The assessment is within an accuracy range of > 70%, but is largely depend on the accuracy of the information provided by the user. Application of the CIRRA model was limited however. The model had emerged from WRC-funded projects and used as a tool by the developers in helping the livestock industry, including farmers, veterinarians and feed companies in water quality management for livestock. The risk is not updating the model or its perpetuity on a national scale.

84
Box 3.4 Procedural steps in assessing risk due to water quality constituents (WQC)
Procedural steps 1. Sample water at the source and at the point of use 2. Use correct preservation methods for water samples 3. Use standardised analytical techniques 4. Focus analyses on constituents that have a bearing on livestock (e.g. F, Se) and watering facilities (e.g. Fe) 5. Review each of the constituents in the analysis
- Concentration (mg /L) - Potential physiological effect of the constituent - Possible alleviatory factors such as total dissolved solids, competitive constituents
6. Note the source of the sample
7. Note the water user-group (example: sheep – lactating, broiler chickens – one week old, horses – endurance). 8. Note the site-specific factors that can influence WI
- Dry matter content of the rations - High physiological demand increasing WI as with young animals, lactation, high physical activity,
etc. - Environmental factors such as high altitude, etc.
Meyer and Casey, 2012.
3.10.3 Assessment of health risks due to WQC Health risk assessment for inorganic WQC is aimed at setting TWQR values for risk categories shown in Box 3.5. Risk assessment is done at the generic level similar to the WQG cited. Assessment in terms of biological impact of WQC can be expanded to include exposure rates to WQC, with subdivisions, speciation and bioavailability of ingested WQC, environmental effects, nutritional sources of elements ingested via water, clinical effects and in the case of livestock, transfer to consumer of animals’ products of chemicals that had been retained in organs and tissues. Health risk assessment for pathogens would be based in the 98% confidence level of samples being free of pathogens. The vulnerability of humans and livestock to pathogens would be constructed as shown in Box 3.5. An important aspect, however, of vulnerability is physiological adaptation to potential pathogens where chronic exposure may contribute to a tolerance. Exposure exceeding tolerances, or other pathogenic conditions, might tip the balance towards the negative, initiating an expressed pathogenic effect.

85
Box 3.5 Health risk assessment by categories in terms of vulnerability
Health risk assessment is aimed at setting TWQR values for the risk categories Livestock watering Domestic use
Generic: WQC as COC and PHCC Biological impact: Exposure rates to WQC Categories of livestock
Metabolic mass criterion Proportional water intake Gender, age Suckling Growing Adult Production status
Lactation Growing young Conception / fertility Gestation
Teratogenesis Epigenetic effects Transplacental effect on foetus
Speciation and bioavailability of ingested WQC Environment effects Nutritional sources Clinical effect:
Diarrhoea, etc. Subclinical effect
Unthriftiness Growth, milk, wool, etc. Immunity Metabolic effect
Skeletal abnormalities Teeth, hooves (laminitis) EDC effects on TSH, GH, androgens oestrogens, cortisols, etc.
Transfer to consumers of animal products
Generic: WQC as COC and PHCC Biological impact: Exposure rates to WQC Categories of consumer
Metabolic mass criterion Proportional water intake Gender, age Adults, M and F Young adults Prime adults Seniors (60+) Juveniles (12 to 20) Children (4-11) Toddlers (2 to 3) Infants (0 to 24 mo) Physiological status
Sedentary vs Active Lactating Conception rates / fertility Gestation
Teratogenesis Epigenetic effects Transplacental effects on foetus
Speciation and bioavailability of ingested WQC Environment effects Nutritional sources Clinical effect:
Diarrhoea, etc. Mental impairment
Subclinical effect Unthriftiness Growth Immunity Metabolic effect
Skeletal abnormalities Hairs, skin, nails, teeth EDC effects on TSH, GH, androgens, oestrogens, cortisols, etc.
3.11 Proposed revision of the South African Water Quality Guidelines: Volume 5 Agricultural use: Livestock watering, 1996 3.11.1 Livestock watering The SAWQG Vol. 5: Livestock watering (1996) was presented as comprehensive document in a generic approach to water quality for livestock. The proposed changes to WQG are aimed at GW, which would exclude only the biological WQC noted in the 1996 WQG, namely algae. The 1996 WQG were part of a set of 8 volumes:
• Volume 1: South African Water Quality Guidelines – Domestic Water Use
• Volume 2: South African Water Quality Guidelines – Recreational Water Use
• Volume 3: South African Water Quality Guidelines – Industrial Water Use
• Volume 4: South African Water Quality Guidelines – Agricultural Water Use: Irrigation

86
• Volume 5: South African Water Quality Guidelines – Agricultural Water Use: Livestock Watering.
• Volume 6: South African Water Quality Guidelines – Agricultural Water Use: Aquaculture
• Volume 7: South African Water Quality Guidelines –Aquatic Ecosystems
• Volume 8: South African Water Quality Guidelines – Field Guide Any critique on Vol.5: Livestock Watering, would invariably apply to the whole set. Considered, however, as a stand-alone volume aimed at a defined user-group, the comments are intended to improve WQG for livestock, with the particular emphasis on GW. Positives are that the 1996 WQG document explained the application of the concept of water quality. Background information was given to inform users of characteristics of each WQC in the guideline. These include occurrence, interactions, measurement, data interpretation and treatment options, and the effects in terms of norms, possible mitigation and TWQR as the criterion. The assumption of treatment is that if the WQC exceeds the TWQR and becomes a PHCC, treatment options can be exercised by changing the character of the water or by changing the way in which the water is used. These are useful to have in a guideline. Negatives of the 1996 WQG Livestock Watering are the cumbersome extended layout and the continuous repetition of the bibliography at each WQC. Up to seventeen repetitions occurred. These references were highly relevant at the time, but in most cases, revised editions of reference books have been published. An example is the NRC (2005) standards for Mineral Tolerance of Domestic Animals. An update of the literature would be needed. Research on micro-minerals and macro-minerals that have relevance on GW has advanced considerably since the 1996 WQG. Examples are the effects of TDS on WQC becoming PHCC and links between WQC in GW and the geology of regions with the potential to predict the occurrence of specific WQC from the geology. Other examples of additional information are the effects of WQC on species of livestock not listed such as ostriches; and the spatial distribution of WQC that was gained from sampling GW in many regions of the country. Information has been gained on the distribution, risk and biological effects of WQC occurring in GW that were not included in the 1996 WQG such as F (Coetzee et al., 1997; 2000) and Br (Du Toit and Casey, 2010; 2012; Meyer (2015). This new South Africa-generated knowledge would make the WQG more applicable to livestock production in South Africa. 3.11.2 Domestic use The 1996 WQG Vol. 1 Domestic Use follows the same format as Vol. 5 for Livestock. The bibliography is similar and the same form of repetition occurs. Comments in this regard are therefore the same as for livestock.

87
The data gained on spatial distribution of WQC and the effects noted on livestock can be extrapolated to humans as a moral imperative. Many people share the same GW sources as livestock, and the sensitivity of livestock can be interpolated to humans. The MBM biological reference would be applicable to humans and form a common denominator. 3.11.3 Pathogens The current WQG do not address potential pathogens in GW, which should be included given the health risk posed by settlement conditions lacking sewage services around South Africa. 3.12 Discussion The problem statement that a single value WQG system is restrictive and ineffective in accommodating the complex, multiple conditions and interactions that prevail in livestock, people and household settings is elucidated. A WQG cannot be a stand-alone approach to managing health risks pertaining to water – my statement. However, it seems that single value WQG systems are the norm in the WQG of the countries and organisations reviewed. The reason is the relative simplicity of producing single value guidelines. In order to reduce risk to vulnerable users, some differentiation was introduced. Examples of these are: TDS: Threshold value for human taste is 1000 mg/L; the threshold unsuitable for cattle is 7000 mg/L; Nitrate (NO3)/ Nitrite (NO2): The MAL for infants <3 mo is 50 mg/L NO3; Antimony (Sb): 6 μg/L/kg body mass; Boron (B): 0.17/kg body mass humans; Zinc (Zn): Reference is a 70 kg man. The recommended WI (WI L/d) for people of different ages and physiological status shown in Tables 3.8 and 3.9, show that people can be exposed in varying degrees to WQC. The duration of the exposure may then become critical, noted in the WHO (2011) WQG. This would also apply to livestock. The single value system was expanded to a risk-based TWQR shown in Tables 3.4 and 3.5 and Boxes 3.1 and 3.2. The TWQR would appear to be close to the most applicable user-friendly, scientific, text-based system. However, as noted by Meyer and Casey (2012), it would still require that the user must assess other factors subjectively to complete the assessment. Age and BM are limiting biological reference criteria due to their variability. Estimation of health risk depends on how the body deals with the foreign or excess chemicals ingested into the digestive tract and, if this occurs, absorbed into the circulatory system. Once in the system, the chemical might enter the metabolic pathway or becomes competitive with essential elements in metabolism. An example is Br becoming a thyroid endocrine disruptor by displacing I and affecting the physiological function determined by thyroid hormone (Du Toit and Casey (2010, 2012). Table 3.9 demonstrates a case in which GW can be a conduit for dietary supplementation of elements. Figures 3.1 and 3.2 show the allometric relationship between BM and MBM and Figure 3.5 shows MBM decreases as a percentage of BM with increasing BM. MBM is an accurate estimation of the true of metabolic mass of mammals. This is based on the BMR (ml O2/h) (White and Seymour, 2003). Table 3.10 shows (1) the linear relationship between BM and
88
intake or exposure even when the variance of activity is introduced, and (2) the nonlinear relationship when intake is calculated against MBM (L/MBM/d). The latter demonstrates that lighter (and younger) animals and people might be at higher risk to PHCC than heavier (and more adult) people and animals. The CIRRA model is built on Equation 1, accommodating variables that contribute in the multi-factorial assessment of health risk. The model has been shown to effectively accommodate animal and site-specific variables. MBM would fit into the model. Box 3.5 illustrates an expansion into categories for health risk assessment, which can be accommodated in an expanded text-based WQG. The cited WQG have limited divisioning of this nature. According to the WQG reviewed, these list the most likely WQC to appear in water and most likely to be PHCC under specified circumstances and users. As noted, a new text-based compilation of WQG for livestock would bring updated and new information to the attention of livestock producers and professional persons. The possible effect of climate change on GW is not yet clear. What remains clear and of growing concern is the continued exposure of livestock and people to PHCC. A new text-based system should address this from a health risk aspect. The more interactive system CIRRA would be complementary management tool. Regarding potential pathogens in GW, this would require urgent attention. The reason is that and the fast expanding informal highly concentrated human settlements where no sewage services are available pose a threat to the quality and health-risk of GW. A search of the WRC website a search of the WRC’s Knowledge Hub revealed no projects on the topic. 3.13 Conclusion and recommendation The hypothesis that a variable WQG system, which is user and site-specific, has the greatest probability of alleviating the effects of PHCC in water is sustained. There appear to be two practical options, however. Option 1 is to develop WQG as shown in Tables 3.4 and 3.5 and Boxes 3.1, 3.2 and 3.5. Option 2 is to follow a software-based system similar to the CIRRA model. The information captured in the text-based system should include data on spatial distribution of WQC, alleviatory mechanisms for PHCC and data on WQC that were not in the 1996 WQG. PHCC in RRWH and GW and the development of standards require urgent attention. The CIRRA model should be revised and made available on a national
scale. This may best be achieved through a centralised reference centre for water quality management.

89
3.14 References Australian Drinking Water Guidelines 6, version 3.2, 2016. National Water Quality Management Strategy 2011, version 3.2 updated February 2016. National Health and Medical Research Council and the Natural Resource Management Ministerial Council, Australian Government. ISBN Online: 1864965118. Canada, British Columbia, 2012. Guidance document for determining groundwater at risk of containing pathogens (GARP) including groundwater under direct influence of surface water (GWUDI). Version 1. Health Protection Branch, Population and Public Health Division, Ministry of Health. Sourced at: http://www.env.gov.bc.ca/wsd/plan_protect_sustain/GW/garp-gwudi-guidance.pdf Canada, British Columbia, Working Water Quality Guidelines, 2015. Ministry of Environment, British Columbia. Sourced at: http://www.env.gov.bc.ca/wat/wq/wq_guidelines.html. Casey, N.H. and Meyer, J.A., 1996. Interim Water Quality Guidelines for Livestock Watering. Published by Water Research Commission, PO Box 824, Pretoria, 0001. ISBN 1868452255. Casey, N.H. and Meyer J. A., 1998. Software programme that assesses the risk of constituent ingestion (Water Quality Guideline Index System) that will be known as CIRRA for Animal Watering where CIRRA is the acronym for Constituent Ingestion Rate Risk Assessment. Casey, N.H. and Meyer J.A., 2001. An extension to and the further refinement of a water quality guideline index system for livestock watering: Volume 1: Rural communal livestock production systems and wildlife production systems. WRC Report No 857/1/01, ISBN 1868457133 Casey, N.H. and Meyer, J.A., 2006. The application of risk assessment modelling in ground water for humans and livestock in rural, communal systems. WRC Report No 1175/1/06. ISBN 1770054677. Casey, N.H., Meyer, J.A. and Kempster, P.L., 1996a. Technical authors: South African Water Quality Guidelines (Second Edition), Volume 5, Agricultural Use: Section 4.4, Water Quality Guidelines for Livestock Watering. Department of Water Affairs and Forestry. ISBN 0798853433. Casey, N.H., Meyer, J.A. and van Niekerk, W.A., 1996b. An investigation into the quality of water for animal production: Supplementary Report. WRC Report No 301/02/96. ISBN 1868450813. Casey, N.H., Meyer, J.A., Coetzee, C.B. and van Niekerk, W.A., 1996c. An investigation into the quality of water for animal production. WRC Report No 301/01/96. ISBN 1868450805.

90
Casey, N.H., Meyer, J.A. and Coetzee, C.B., 1998a. An investigation into the quality of water for livestock production with the emphasis on subterranean water and the development of a water quality guideline index system. Volume 1. Development and modelling. WRC Report No 644/1/98. ISBN 1868457390. Casey, N.H., Meyer, J.A. and Coetzee, C.B., 1998b. An investigation into the quality of water for livestock production with the emphasis on subterranean water and the development of a water quality guideline index system: Volume 2. Research Results. WRC Report No 644/1/98. ISBN 1868457391. Casey, N.H., Meyer, J.A. and Coetzee, C.B., 1998c. An investigation into the quality of water for livestock production with the emphasis on subterranean water and the development of a water quality guideline index system: Volume 3. Appendix of reference files calculations. WRC Report No 644/1/98. ISBN 1868457390. Casey, N.H., Meyer, J.A. and Coetzee, C.B., 2001. An extension to and further refinement of a water quality guideline index system for livestock watering. Volume 2: Poultry production systems and water quality for ostrich production. WRC Report No 857/2/00. ISBN 1868457141. CCME, 1996, Canadian Council of Ministers of the Environment (CCME). Coetzee, C.B., Casey, N.H. and Meyer, J.A., 1997. Fluoride tolerance of laying hens. British Poultry Science 38:597-602. Coetzee, C.B., Casey, N.H. and Meyer, J.A., 2000. The effect of water-borne fluoride on the production of laying hens. Water SA. 26:115-118. De Jager, J.M., 1993. Geographical and agro-ecological features of Southern Africa. In Livestock Production Systems – principles and practice. Ed. C. Maree and N.H. Casey ©. ISBN 062017126. Du Toit, J. and Casey, N.H., 2010. Effect of bromine and iodine in drinking water on production parameters of broilers. South African Journal of Animal Science 40(4): 301-310. Du Toit, J. and Casey, N.H., 2012. Iodine as an alleviator of bromine toxicity in thyroid, liver and kidney of broiler chickens. Livestock Science (Elsevier) 144 (2012) 269-274. Environmental Protection Agency Drinking Water Quality Guidelines, 2009. Publication EPA 816-F-09-004, Environmental Protection Agency, United States Government. Sourced at: http://www.epa/safewater/. European Union (Drinking Water) Regulations, 2014. (EU[DW]R 2014). Statutory Instrument No 122 of 2014.

91
Food and Agricultural Organisation, 1985. United Nations: Water quality for agriculture. ISBN 9251022631. Mader, B.A. and Merkle, J.C., 2000. Current knowledge of groundwater pathogens and their control. Geohydrology J, 8, 29-40. McKay, L.D., 2010. Foreword: Pathogens and fecal indicators in GW. Ground Water 49:1:1-3. Meyer, J. A. and Casey, N. H., 2012. Establishing risk assessment on water quality for livestock. Animal Frontiers 2, 2, 44-49. Meyer, J.A., 1998. Modelling for the prediction of water quality guidelines for livestock in southern Africa. PhD Thesis. University of Pretoria, South Africa. Meyer, J.A., 2015. Animal health assessment. Chapter 5: An investigation of the contamination of water resources by agricultural chemicals and the impact on the environmental health: Volume 1: Risk Assessment of Agricultural Chemicals to Human and Animal Health. Ed. J.M. Dabrowski. WRC Report No. 1956/1/15. Morris, B.L., Lawrence, A.R.L., Chilton, P.J.C., Adams, B., Calow, R.C. and Klinck, B.A., 2003. Groundwater and its Susceptibility to Degradation: A Global Assessment of the Problem and Options for Management. Early Warning and Assessment Report Series, RS. 03-3. United Nations Environment Programme, Nairobi, Kenya. ISBN: 9280722972. National Research Council, 2005. Mineral Tolerance of Animals: Second Revised Edition. Committee on Minerals and Toxic Substances in Diets and Water for Animals, National Research Council, ISBN: 9780309096546. South African Water Quality Guidelines, 1996. Volume 5 Agricultural Use: Livestock Watering. Department of Water Affairs and Forestry, South Africa. ISBN 0798853387 (Set of volumes); ISBN 0798853433. Straus, S. and Griebler, C., 2011. Pathogenic microorganisms and viruses in GW. Deutsche Akademie der Technikwissenschaften. ISBN 9783942044226. Sourced at: http://www.acatech.de. Tainton, N.M., Hardy, M.B., Aucamp, A.J. and Danckwerts, J.E., 1993. The range environment. In Livestock Production Systems – principles and practice. Ed. C. Maree and N.H. Casey ©. ISBN 062017126. White, C.R. and Seymour, R.S., 2003. Mammalian basal metabolic rate is proportional to body mass2/3. World Health Organisation, 2011. Guidelines for Drinking Water Quality (4th Ed, 2011).

92
CHAPTER FOUR
CONCLUSIONS AND RECOMMENDATIONS Norman Casey1 4.1 Introduction The project assessed the potential for using two important water sources, RRWH and GW, in domestic settings and for livestock watering. Using either of these water sources in the context noted is not new: Harvesting rainwater from roofs for domestic purposes and using groundwater for domestic purposes and livestock watering are well-established practices. In an overall water-scarce country such as South Africa, rural and farming communities who do not have water utility services are reliant on these sources. In addition, the inability of some local authorities to manage and supply water to communities necessitates that local residents seek alternative water sources. The questions that arose regard the safety of the water in terms of microbial and inorganic chemical standards. The concept of safety, however, has broad parameters. Water becomes unsafe when it poses a potential health risk to consumers, whether people or livestock. In both cases, ensuring minimum risk to health and wellbeing is a moral imperative. For people, safety and minimum exposures to health risks are basic human rights, while for livestock safety and minimum exposure to health risk are both of primary and secondary concerns. Primary concerns relate to livestock developing debilitating sub-clinical and clinical physiological and anatomical pathologies that can reduce the production potential of the livestock. The consequences would be the economic viability of farming enterprises. Secondary concerns are where the livestock products become conduits for the transfer of potentially hazardous inorganic water quality constituents (WQC) to consumers of livestock products. Determining risks to health and wellbeing by biological or chemical WQC does not depend on simple linear relationships between a constituent in water and the consumer. The expression of risk or the expression of either sub-clinical or clinical pathology is the subject of multifactorial interactions, and within these, the weighting or relative contribution of a constituent is either mitigated or aggravated by the consumer’s physiological condition or by environmental influences. An example would be that children or lactating mothers are in different physiological states compared with adults or non-lactating mothers and hence children and lactating mothers would have higher risk profiles to potentially hazardous water constituents. Biological adaptation to potentially hazardous biological constituents (e.g. E. coli bacteria) could mitigate the debilitating responses of consumers to ingested organisms whereas un-adapted persons are highly susceptible to ingested potentially hazardous biological constituents. In terms of inorganic WQC, the potential effect on consumers may be acute such as the ingestion of MgSO4 causing digestive disturbances or may be chronic as in the case of ingesting endocrine disrupting chemicals over a long period. The effect of the latter is at first sub-clinical and not easily observed until clinical conditions begin to emerge.
93
The challenge therefore is to construct WQG that are either generic in their application or are specific taking into account the physiological conditions of consumers or contributing environmental conditions. According to the WHO (2011), guidelines should be considered in the context of local or national environmental, social, economic, cultural conditions and user in deriving local guideline values. The Australian Drinking Water Guidelines (ADWG, 2011, updated 2016), are intended to provide a framework for good management of drinking water supplies. The ADWG notes that WQG are not mandatory standards, but are intended provide references for determining the quality of water for consumers taking into consideration the diverse array of regional or local factors, and economic, political and cultural issues, including consumer expectations. The overall aim of the project was to evaluate risks associated with the use of RRWH for domestic use and homestead food gardens; and GW for domestic use and livestock watering. The aspect of evaluating RRWH for food gardens was not addressed largely because this water source is considered too scarce and precious to use directly on household gardens. The aims were accomplished by addressing specific objectives as reported in Volume 1, Chapters 4 to 9 and in the present Volume 2, Chapters 2 and 3. 4.2 Volume 1: Microbial quality of roof harvested rainwater The results noted the potential health risks associated with pathogens in RRWH are either due to contamination of the roof-surfaces from animal sources such as birds and livestock, or due to organisms in the rainwater tanks. Despite the reports from research projects done elsewhere on the levels of contamination that may give rise to or are associated with health risks, no consensus has been reached on standards. However, pathogens that are transferred into rainwater storage tanks can survive and persist in biofilms and shed into the water. Potentially pathogenic bacteria were detected in stored RRWH that had been presumed to have been decontaminated by traditional methods such as exposure to UV-sunlight. Although a total microbial count has value, it is important to differentiate between indicator species of faecal pollution and other potential pathogens. For example, E. coli may be outlived by a number of pathogens including Salmonella, Campylobacter and Enterococcus species, which means risk assessment should not be based on E. coli and extrapolated to the generic presence of pathogens, which is the practice regarding RW systems. A quantitative microbial risk assessment would be determined by the abundance of individual pathogenic bacterial species. Faeces were a major source of microbial contamination. The most prevalent faecal indicators in 365 water samples from various water sources (3 GW, 5 ground harvested rainwater tanks, 5 RW, 80 RRWH and 1 spring) were measured as concentrations of E. coli (29.1%) and enterococci (19.5%) within 1-10 cfu/100mℓ, whereas that for faecal coliforms was (36.6%) were within 100-1000 cfu/100mℓ. Evaluation of the microbial quality of RW used by the villagers as an alternative water source revealed that 79% had enterococcus, 39% E. coli and all samples had faecal coliforms. The majority of the samples that tested positive for
94
enterococcus (32%) and E. coli (16%) had a concentration of 10-100 cfu/100mℓ. However the majority of the concentrations for faecal coliforms detected (48%) were of concentrations greater than 1000 cfu/100mℓ. As indicators of microbial quality RRWH and ground surface runoff, the concentrations of Escherichia coli, faecal coliforms, enterococci and Pseudomonas aeruginosa. E. coli and enterococci were detected in 44.8% of the RRWH tanks although enterococci concentrations were several times higher than those for E. coli. Urban pigeons are the likely sources of contamination since enterococci were detected in pigeon faecal samples. Of the various enterococci detected, the four dominant species in faecal samples were E. faecalis (20.5%), E. mundtii (20.51%), E. faecium (23.1%) and E. casseliflavus (17.3%) and the dominant species in RRWH were E. casseliflavus (34.6%) and E. mundtii (33.2%). Pathogen detection remains critical in determining the fitness-for-use of water sources. The prevalence of pathogenic bacteria and specific virulence genes were detected in samples of the water sources using Real-Time PCR. All the samples tested negative for the Shigella spp. ipaH gene, while five tested positive for Salmonella ipaB gene. No samples tested positive for stx1 and stx2, and only two tested positive for the eaeA gene. The formation of biofilms in water storage tanks may become causes for concern due to the biofilms having the potential to be sinks for pathogens, while the formation of biofilms are associated with the characteristics of the tank. Water stored in low-density polyethylene storage tanks had deteriorated microbiologically to levels considered unfit for human consumption within 15 days, which was associated with the formation of biofilms. Imperfections in the UV resistant inner lining of the tanks revealed to be ecological niches for microbial colonisation and biofilm development. Establishing the microbial populations, their diversity and detecting pathogens are essential in establishing WQG control measures. In this research, bacterial diversity in RRWH and RW was determined through pyrosequencing. The structure of bacterial communities clearly showed significant similarities between RRWH and differences with the RW, suggesting different levels and/or sources of contamination and environmental factors affecting the various water sources. Signatures of potential pathogens included Legionella, Acinetobacter, Pseudomonas, Clostridia, Chromobacterium, Yersinia, Serratia and Legionella suggesting a potential health risk to households using RRWH. The MALDI-TOF-MS technique characterised Escherichia coli isolated from RRWH and distinguished 31 strain groups. The global concern for anti-biotic resistance in human and animal health management programmes should be extended to the prevailing microbial populations in animal contamination sources to comprehend the risks in microbial water quality management. The current research showed that in a total of 239 Escherichia coli isolated from fresh pigeon faecal samples (130 isolates), resistances to anti-biotic were: ampicillin (27.9%), gentamicin (23.6%), amikacin (24%), tetracycline (17.4) and amoxicillin (16.9%). The highest number of phenotypes was observed for single antibiotics and no single antibiotic resistance was observed
95
for chloramphenicol, ceftriaxone, gentamicin, cefoxitin, cotrimoxazole, although they were detected in multiple antibiotic resistance (MAR) phenotypes. The highest multiple antibiotic resistance (MAR) phenotypes were observed for a combination of four antibiotics, on isolates from JHB (18.8%), pigeon faeces (15.2%) and Pretoria (5.1%). The most abundant resistance phenotype to four antibiotics, Ak-Gm-Cip-T was dominated by isolates from pigeon faeces (6.8%) with Pretoria and Johannesburg isolates having low proportions of 1.3% and 3.1%, respectively. It would appear that various environmental settings where RRWH is practiced might affect the characterisation of the antibiotic resistance determinant genes among the isolates. WQG for microbial risk assessment need to include the source of water, the collection system, the characteristics of the storage tanks, especially in terms of biofilm formation, and the potential for contamination prior to harvesting and post-harvesting. The microbial risk assessment (MRA) procedure was applied to compile guidelines on rainwater harvesting and the use of harvested rainwater. The guidelines identify critical practices or points of concern that may serve as a source of contamination and suggests the appropriate mitigation strategies to minimise adverse health effects. 4.3 Conclusions and recommendations on microbial quality of roof harvested rainwater The following recommendations are formulated from the research results: The contamination of RRWH appears to be strongly influenced by environmental settings especially the presence of a faecal source in the form of nearby animal housing. While little can be done to the presence of a faecal source around rural households, practicing good animal husbandry and ensuring appropriate RRWH-system maintenance should be some of the minim aspects put in place to lessen the levels of contamination. This should also include regular cleaning of the roofs and gutters especially before rainfall events or prior to the start of the rainfall season. Although the levels of contamination in RRWH were significant, some levels of indicator bacterial presence in such sources may be tolerated. However, tolerable levels of contamination will depend on water use and can only be established where good RRWH practices are being implemented. That is, after all has been done to harvest clean rainwater, contaminant levels detected in the water may be normal for the area. Since the presence of pathogens cannot be correlated to faecal indicators in RRWH, the recommendation is to develop a system based on the dual prevalence of E. coli and enterococci as sanitary indicator bacteria. Further research should focus on establishing the applicabilities of E. coli and enterococci to show levels of contamination and potential health-risk as applied to stored harvested rainwater. Biofilms can develop in both untreated and treated water sources on the interior of low density polyethylene water storage tanks as early as one day after collection. However, the storage period and the microbial quality of the source water influences water quality deterioration and the rate of biofilm formation. Biofilm development is further enhanced by crevices in the
96
interior surface of storage tanks. Effective management of biofilms in water storage systems is a critical part of RRWH quality management. Given the lack of standards, knowledge of contamination and complexity of the problem with RRWH, guidance information is required on best practices and risks associated with harvesting rainwater. The guidance information should give a description of the chemical and biological constituents that can potentially affect water quality, their occurrence in the harvest water interdependence with other constituents, and their properties. These should also include standardised methods for measurement. For each contaminant, the guidance information on risks that are site-specific should be provided in addition to generic guidance information for RRWH practices. While the guidance information may not be completely accurate, it should provide improvement over the current non-specific systems. The information should allow users to obtain information on risks more easily by explaining RRWH sampling procedures and how to interpret the results according to the RHRnW system, general environment, and site or homestead specific factors. This guidance information more specifically should specify the TWQR in which infection or adverse effects are unlikely to occur. Current Australian data suggests that even when concentrations exceed the upper safety limit and are likely to result in infection, diseases may not always develop in the prevailing community. The response to risks depend on site-specific factors, synergistic and antagonistic interactions between food and water contaminants, the age of the person, and the actual water intake that determines the ingestion rate of the contaminant. However, a precise way to evaluate the risk has limitations in that tools to measure RRWH specific factors may not be easily available. In this case, impact factors may have to be estimated, making it still precarious. Given this scenario, an interactive WQG in the form of computer software system that would have programmed references, by which risk assessment could be done for a specific RRWH system, environment, site or homestead specific factors and extent of exposure, should be developed. In an attempt to mitigate these risk factors, the government has embarked on distribution of RRWH systems to communities without access to piped water. Rainwater harvesting has traditionally been practiced by a number of households in these communities without any reports of diseases emanating from its use. It cannot be ignored that there is a body of evidence, which undoubtedly shows the link between diseases associated with the use of harvested rainwater. In order to empower communities and counter the potential negative effects of contaminated water, community-based workers should be trained on how to advise rural communities in the maintenance of RRWH systems. The knowledge package should incorporate cultural norms and practices in RRWH and handling within the communities. The challenge in most of these communities is the presence of animal faeces in close proximity to the households. This may be in the form of animal housing, of which for security reasons are built near households. Research in South Africa on harvested rainwater in rural settings is limited. Data from other situations cannot be directly extrapolated to rural settings. Research is required on the actual levels of risks in these communities.
97
Data is required on the reliability of the various water sources including chemical and microbiological safety from which algorithms can be constructed to determine critical parameters for risk assessment. These would be useful tools for following or predicting trends, real-time scenario analyses and for developing appropriate management strategies and treatment systems. 4.4 Volume 2: Chemical quality of groundwater for potable use and livestock watering In complementing the objectives of Volume 1, Volume 2 focused on the inorganic WQC with the aim of investigating the occurrence of inorganic WQC in RRWH, ground harvested rainwater, GW and RW to estimate whether risk to livestock and people might occur from these sources singularly or in combination. This information were intended to be collated into the WQG for livestock and rural communities. The WQC-profiles differed between GW, RRWH, RW and MW samples drawn from various localities. GW had the highest content of inorganic elements. Contamination of roofs mainly by wind increases the amount of selected inorganic WQC in RRWH depending on the locality. Household settings close to mining activities have a high probability of PHCC (for example Cd or Cr) contaminating RRWH. WQG should include measures to limit the contamination such as discarding the first flushes after the dry period. Apart from risks associated with the presence of inorganic PHCC, the research showed water sources may be supplementary dietary sources for various essential elements. It occurred that RRWH was characterised by high levels of Zn that is ascribed to the zinc-galvanised sheet-iron used for roofing material. Zn in RRWH could be a source to supplement dietary Zn in humans. The inorganic WQC in the water sources varied marginally over season. An important result was the presence of Br, a halogen-class element. Controlled research has revealed that Br may become a potential endocrine disruptor. Levels of Br exceeding the current WQG value of 0.01 mg/l were measured in GW and in RRWH at a locality close to the coast, which means those communities and their livestock are exposed to Br as a PHCC. Br is currently not in the SA WQG. The results elucidated the problem that a single value WQG system is restrictive and ineffective in accommodating the complex, multiple conditions and interactions that prevail in livestock, people and household settings. A WQG cannot be a stand-alone approach to managing health risks pertaining to water. However, it seems that single value WQG systems are the norm in the WQG of the countries and organisations reviewed. The reason is the relative simplicity of producing single value guidelines. In order to reduce risk to vulnerable users, some differentiation was introduced in livestock according to type and physiological status. In terms of people, the published recommended WI (WI L/d) for people of different ages and physiological status showed that people could be exposed in varying degrees to WQC, which may become critical. In a similar context, chronological age and BM could be limiting biological reference criteria due to their variability.
98
Considering the relationships between BM and MBM based on the BMR (ml O2/h), lighter (and younger) animals and people might be at higher risk to PHCC than heavier (and more adult) people and animals. 4.5 Conclusions and recommendations on chemical quality of groundwater for potable use and livestock watering Due to differences in the profiles of WQC from RRWH, GW and RW and the occurrence of inorganic WQC that are COC or PHCC, water from these sources should be monitored to assess their human and livestock health-related risk. The WQG and recommendations for these emanating from the report are text-based WQG systems using Target Water Quality Range (TWQR) values as handy quick reference systems, but have limited value. A WQG system should differentiate between types of livestock and people according to their vulnerability and that MBM be applied as the biological reference criterion. WQC previously excluded from the South African Water Quality Guidelines (SAWQG), (e.g. Br) must be included in a new text-based publication. The limitations of such systems must be recognised and a software-based interactive, health risk assessment system be developed. It remains challenging to manage an interactive software-based system as was experienced with the CIRRA model. This could be overcome with the development of a centralised reference centre for water quality management. 4.6 Overall recommendations The project addressed the aspect of water quality from two diverse positions: microbiological WQC and inorganic WQC. The commonalities that emerged are:
• Contamination (biological or chemical) may be a random or predictable, consistent event.
• WQC undoubtedly determine the status of water quality.
• The presence of a WQC does not necessarily indicate that the WQC is potentially hazardous to people in a domestic setting or to livestock.
• Environmental factors could determine the nature of a contaminant.
• The relationship between the ingestion of a contaminant and the expression of a pathological condition, whether sub-clinical or clinical, is multifactorial.
• The susceptibilities of people and livestock to potentially hazardous WQC are dependent on their physiological status.
• WQG are presented in text-based format either as recommended values that exceed the NOAEL, moving towards COC and PHCC, or as the more accommodating TWQR-values.
The overall recommendations are therefore:
• Maintain research on PHCC WQC to people and livestock.
• Update and published the 1996 SAWQG.
99
• Develop algorithms to determine critical parameters for risk assessment.
• Establish a National Water Quality Reference Centre. References Australian Drinking Water Guidelines 6, version 3.2, 2016. National Water Quality Management Strategy 2011, version 3.2 updated February 2016. National Health and Medical Research Council and the Natural Resource Management Ministerial Council, Australian Government. ISBN Online: 1864965118. World Health Organisation, 2011. Guidelines for Drinking Water Quality (4th Ed, 2011).