Embed Size (px)
Citation preview
Evaluation of Microbiological Risks Associated with
Direct Potable Reuse (DPR) STAR Grant Kickoff Meeting
October 2016
Jeff Soller1, Sorina Eftim2, Isaac Warren2 and Sharon Nappier3
1 Soller Environmental 2 ICF 3 USEPA OW OST HECD
Outline
Objectives QMRA Methods Results Base Analyses Sensitivity Analyses
Conclusions

Objectives
Conduct a microbial risk evaluation to understand the potential public health implications of various DPR options
conduct a literature review of ranges of reference pathogens in raw sewage and of their removal in various unit treatment processes develop a risk assessment approach that can be used by
managers to assess the risk associated with a proposed DPR treatment project
Background
Currently there are no federal recommendations for direct potable reuse DPR treated (or “finished”) water could be:
– introduced directly into a potable water supply distribution system OR
– circulated into a conventional drinking water treatment facility before entering distribution system
Pathogen control critically important due to immediate health effects

Overview of Analysis
Evaluate four DPR treatment trains (consistent with WaterReuse Research, 2015)
– with and without reverse osmosis – with and without circulation through drinking
water treatment – with high and low UV dose applications
(illustrative of operational/design choices)
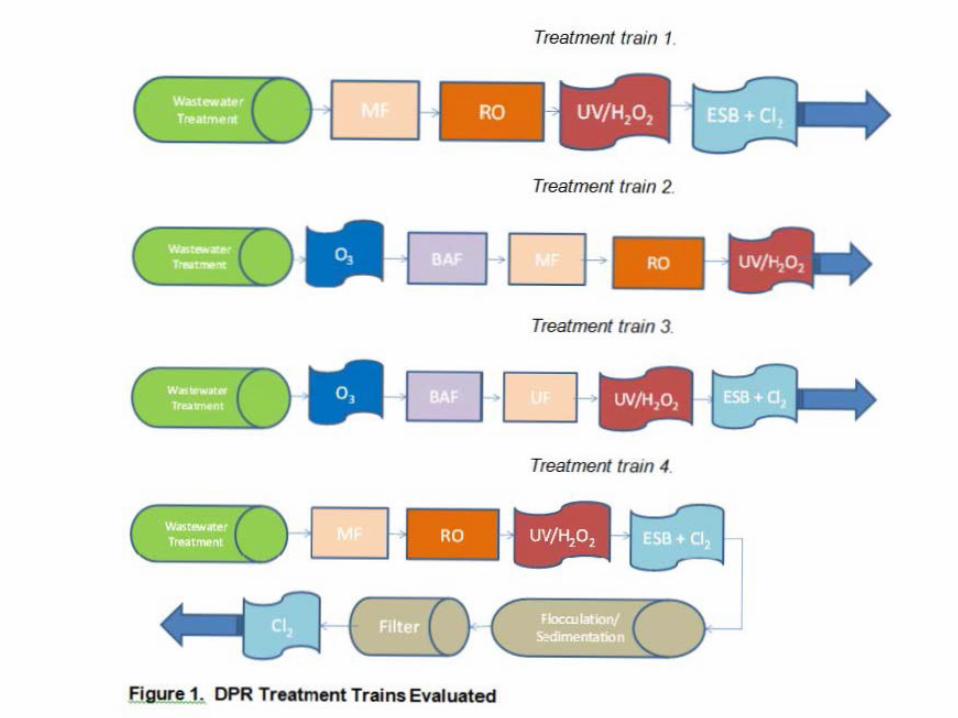
Treatment train 1.
c ()0 Treatment train 2.
Treatment train 3.
c~c) Treatment train 4.
( ()0
( i:Jgure 1. DPR Treatment Trains Evaluated

Methods (1) Use previously published statistical methods coupled with QMRA to
estimate infection via ingestion of water from DPR treatment trains Assume ingestion of “finished” water for each scenario Reference Pathogens
– Adenovirus – Norovirus – Cryptosporidium – Giardia – Salmonella enterica – Campylobacter spp. o representative of other pathogens potentially of concern from the
waterborne exposure route o represent major portion of illnesses from known pathogens in the US o published dose-response relationships

Methods (2) Conduct literature review to characterize:
– distribution of each reference pathogen in raw sewage – reduction of each reference pathogen across each of the
individual unit treatment processes Use Monte Carlo numerical simulation
– cumulative daily risk estimates based on daily risk estimates for each of the reference pathogens for each treatment train
– distribution of estimated annual risks for each treatment train
Conduct sensitivity analysis to evaluate impact of alternative dose-response models and treatment approaches
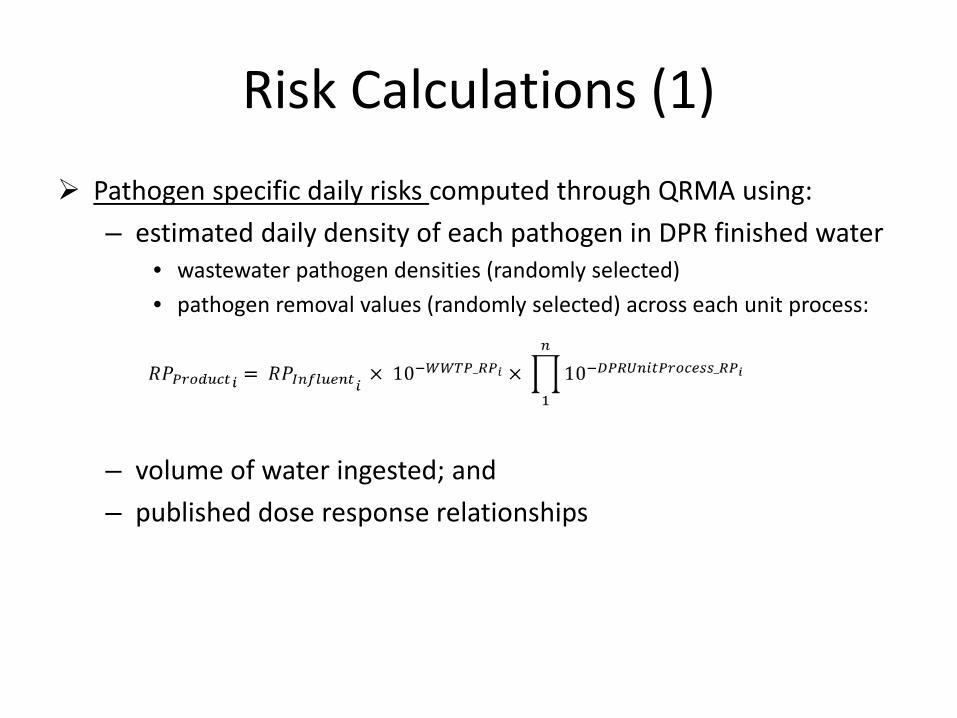
Risk Calculations (1) Pathogen specific daily risks computed through QRMA using:
– estimated daily density of each pathogen in DPR finished water • wastewater pathogen densities (randomly selected) • pathogen removal values (randomly selected) across each unit process:
– volume of water ingested; and – published dose response relationships

Risk Calculations (2)
Cumulative daily risks from all of the evaluated pathogens were then computed as
Daily risks are combined to generate a cumulative annual risk estimate
Repeat all of the above 1000 times to get a distribution of annual risks
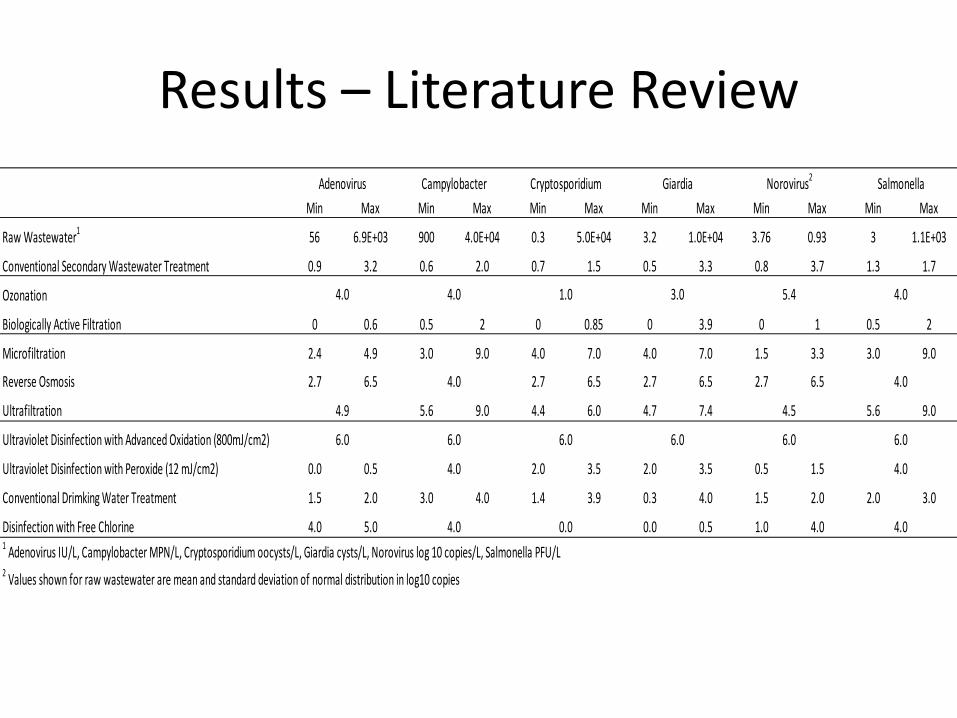
Results – Literature Review Adenovirus Campylobacter Cryptosporidium Giardia Norovirus2 Salmonella
Min Max Min Max Min Max Min Max Min Max Min Max
Raw Wastewater1 56 6.9E+03 900 4.0E+04 0.3 5.0E+04 3.2 1.0E+04 3.76 0.93 3 1.1E+03
Conventional Secondary Wastewater Treatment 0.9 3.2 0.6 2.0 0.7 1.5 0.5 3.3 0.8 3.7 1.3 1.7
Ozonation 4.0 4.0 1.0 3.0 5.4 4.0
Biologically Active Filtration 0 0.6 0.5 2 0 0.85 0 3.9 0 1 0.5 2
Microfiltration 2.4 4.9 3.0 9.0 4.0 7.0 4.0 7.0 1.5 3.3 3.0 9.0
Reverse Osmosis 2.7 6.5 4.0 2.7 6.5 2.7 6.5 2.7 6.5 4.0
Ultrafiltration 4.9 5.6 9.0 4.4 6.0 4.7 7.4 4.5 5.6 9.0
Ultraviolet Disinfection with Advanced Oxidation (800mJ/cm2) 6.0 6.0 6.0 6.0 6.0 6.0
Ultraviolet Disinfection with Peroxide (12 mJ/cm2) 0.0 0.5 4.0 2.0 3.5 2.0 3.5 0.5 1.5 4.0
Conventional Drimking Water Treatment 1.5 2.0 3.0 4.0 1.4 3.9 0.3 4.0 1.5 2.0 2.0 3.0
Disinfection with Free Chlorine 4.0 5.0 4.0 0.0 0.0 0.5 1.0 4.0 4.0 1 Adenovirus IU/L, Campylobacter MPN/L, Cryptosporidium oocysts/L, Giardia cysts/L, Norovirus log 10 copies/L, Salmonella PFU/L 2 Values shown for raw wastewater are mean and standard deviation of normal distribution in log10 copies
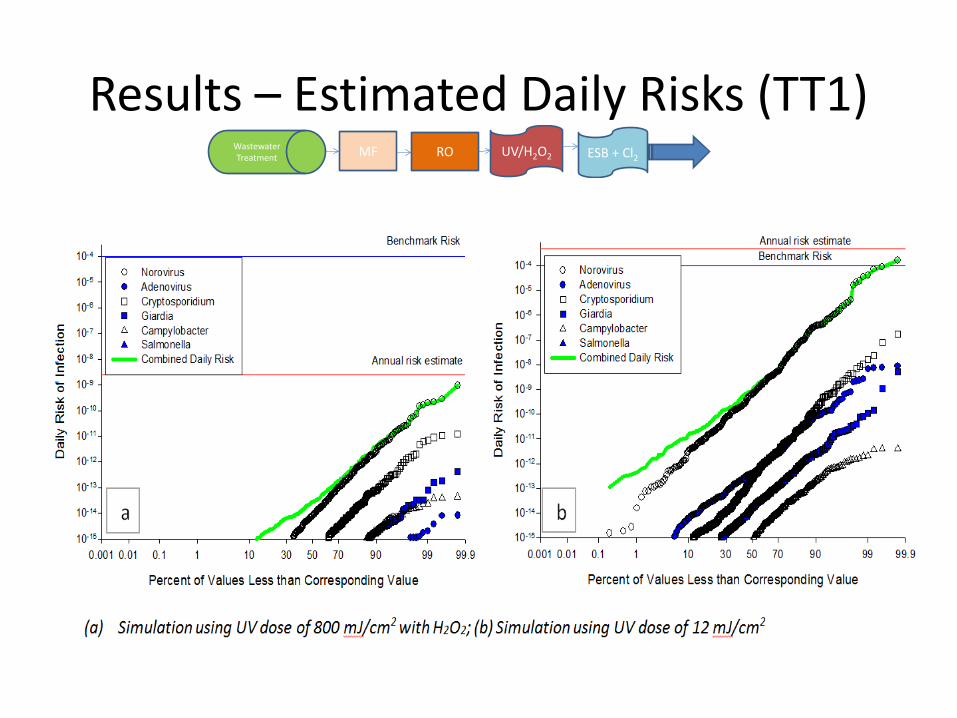
Results – Estimated Daily Risks (TT1) MF UV/H2O2ROWastewater
Treatment ESB + Cl2
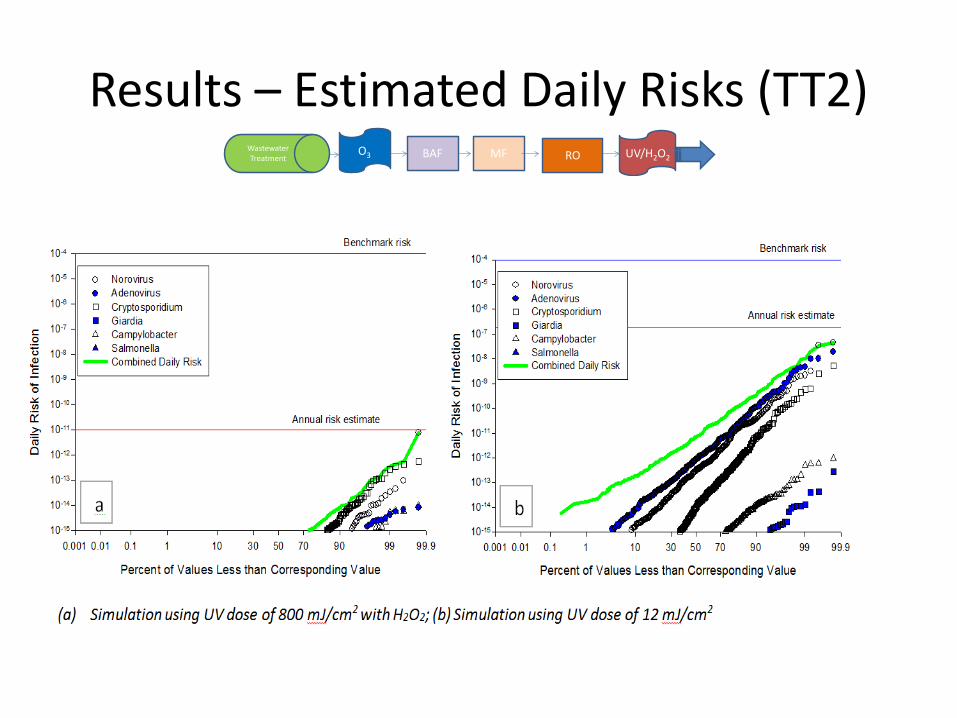
Results – Estimated Daily Risks (TT2) MF BAF O3 UV/H2O2
Wastewater Treatment RO

Results – Estimated Daily Risks (TT3) UFBAF O3 ESB + Cl2Wastewater
Treatment UV/H2O2
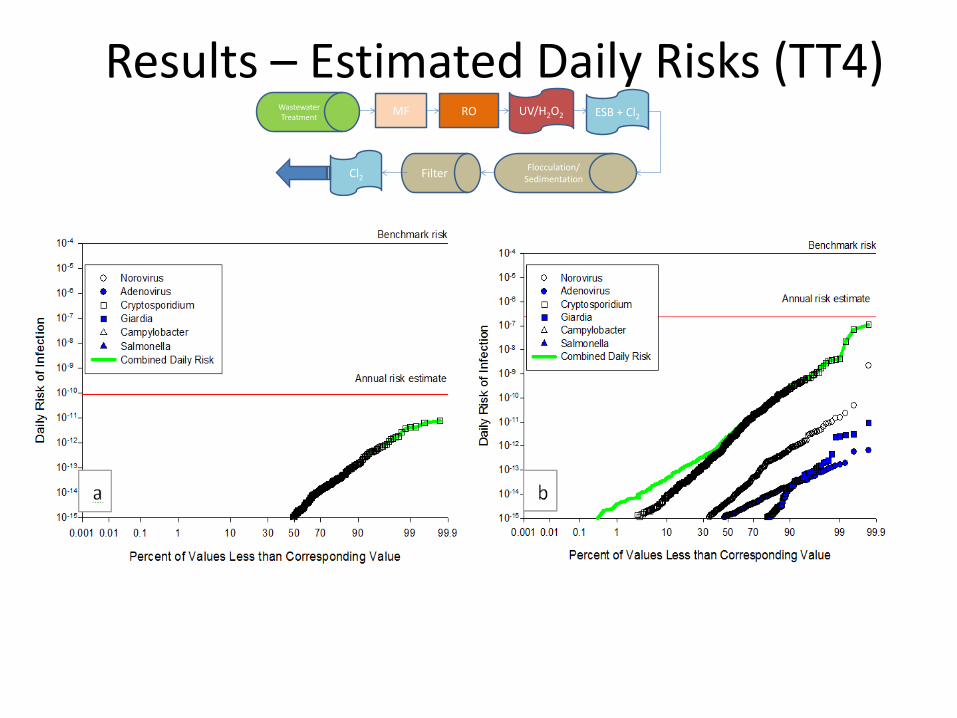
Results – Estimated Daily Risks (TT4)
Flocculation/ Sedimentation Filter Cl2
MF UV/H2O2RO ESB + Cl2 Wastewater Treatment

Results – Annual Risks
Overall Conclusions
Annual risk estimates for any treatment train are driven by the highest daily risks for any of the reference pathogens
In designing DPR systems, reduction of both Cryptosporidium and human enteric viruses are important • understanding NoV presence and removal across individual unit treatment
processes is important in developing DPR projects • treatment trains (TT3) without RO may not achieve the benchmark protection
due to risks from Cryptosporidium unless upstream of a conventional drinking water treatment facility or using high UV AOP doses
Clear quantitative risk-based advantages for DPR projects to circulate “finished water” into the drinking water treatment plant
Findings highlight the need to understand the meaning of “log removal credits” States use to determine the adequacy of a proposed DPR project
Take Away Message
This work provides insights about the relative level of public health protection provided by DPR treatment trains – resulted in several important insights for DPR implementation – could easily be adapted for other DPR treatment trains – could be iteratively refined as additional data become available for any
of the reference pathogen / unit treatment processes evaluated This approach will be useful for
– federal and state regulators considering DPR as source water – state and local decision makers as they consider whether to permit a
particular DPR project – design engineers as they consider which unit treatment processes
should be employed for particular projects – risk managers determining the impact of a treatment failure
• For all the gory details, refer to – Soller et al. (2016), Microbial RiskAnalysis, In Press, http://dx.doi.org/10.1016/j.mran.2016.08.003
Disclaimer
The views expressed in this presentation are those of the authors and do not necessarily reflect the views or policies of the U.S. Environmental Protection Agency. The work described here was funded by the U.S. EPA Office of Water, Office of Science and Technology. No official endorsement should be inferred.

Supplemental Slides
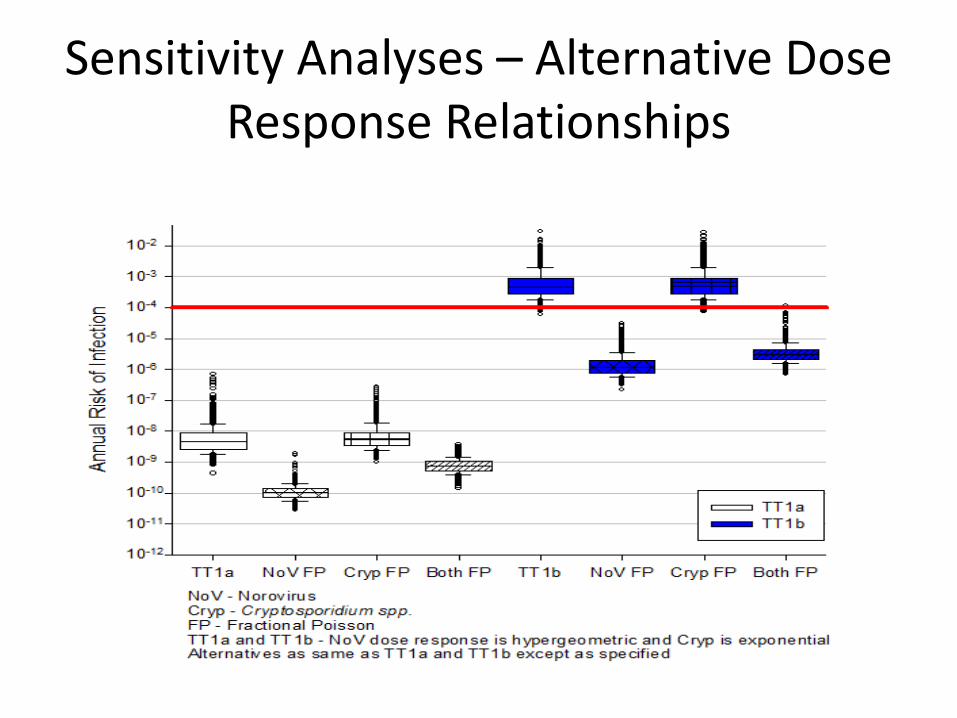
Sensitivity Analyses – Alternative Dose Response Relationships
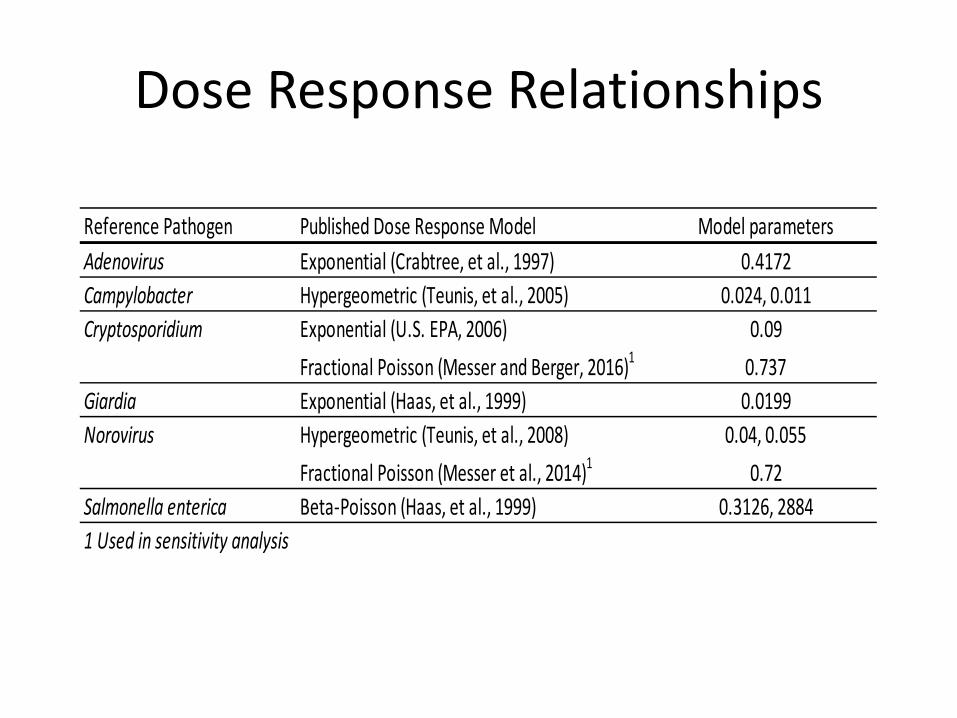
Dose Response Relationships
Reference Pathogen Published Dose Response Model Model parameters Adenovirus Exponential (Crabtree, et al., 1997) 0.4172 Campylobacter Hypergeometric (Teunis, et al., 2005) 0.024, 0.011 Cryptosporidium Exponential (U.S. EPA, 2006) 0.09
Fractional Poisson (Messer and Berger, 2016)1 0.737 Giardia Exponential (Haas, et al., 1999) 0.0199 Norovirus Hypergeometric (Teunis, et al., 2008) 0.04, 0.055
Fractional Poisson (Messer et al., 2014)1 0.72 Salmonella enterica Beta-Poisson (Haas, et al., 1999) 0.3126, 2884 1 Used in sensitivity analysis