Embed Size (px)
Citation preview

RESEARCH ARTICLE
Shilei LU, Zhe CAI, Li ZHANG, Yiran LI
Evaluation of the performance of a centralized ground-waterheat pump system in cold climate region
© Higher Education Press and Springer-Verlag Berlin Heidelberg 2014
Abstract The aim of this study is to evaluate theperformance of a centralized open-loop ground-waterheat pump (GWHP) system for climate conditioning inBeijing with a cold climate in China. Thus, a long-time testwas conducted on a running GWHP system for the heatingseason from December 2011 to March 2012. The analysisof the testing data indicates that the average heat-pumpcoefficient of performance (COP) and the COP of thesystem (COPs) are 4.27 and 2.59. The low value and largefluctuation in the range of COP are found to be caused bythe heat transfixion in the aquifer and the bypass in thecirculation loop. Therefore, some suggestions are proposedto improve the performance for GWHPs in the cold climateregion in China.
Keywords ground-water heat pump (GWHP), actualcoefficient of performance, heat transfixion
1 Introduction
In the future, the global energy supply must become moresustainable. This can be achieved both by a more efficientuse of energy and by relying on renewable sources ofenergy, particularly wind, hydropower, solar and geother-mal energy [1]. A ground-water heat pump (GWHP)system achieves energy conversion by using the solarenergy stored in the aquifer as the heat source and sink.This offers many advantages, such as high energyefficiency, and stable operation with minimal impact on
environment. Through the use of a small amount of high-grade energy (e.g. electricity), the GWHP unit transfers thelow-grade thermal energy to high temperature energy. Thetemperature of ground water remains 8°C–20°C insummer, and is higher than that of air in winter. Therefore,the GWHP system is the most energy-efficient system inall heat pump systems [2,3].Many investigations have been proceeding in the design,
modeling and testing of GWHP systems. Mustafa Omer[4] has provided a detailed literature-based review ofground-source heat-pump technology, concentrating onloops, ground systems, and presented more briefly atapplications, costs and benefits. Stefano Lo Russo et al. [5]carried out numerical simulations and a sensitivity analysisfor the subsurface parameters affecting the thermallyaffected zone. Xue et al. [6] have presented a three-dimensional aquifer thermal energy storage model coupledwith a groundwater flow model and a heat transfer model.Presently, ground-source heat pump systems have been
widely used in all 31 provinces in China. More than 500GWHP projects have been constructed in Beijing till 2007[7]. Different from the distributed systems in America, themost popular kind of ground-source heat-pump systems isthe centralized system in China.This paper intended to find out the actual operation
conditions of GWHP by site test on a commercial buildingin Beijing, China. The actual energy efficiency level wasobtained, and the problems appeared during operationwere analyzed and discussed. Then, some suggestions forimproving the energy efficiency ratio were proposed.
2 Project introduction
2.1 Project overview
The project is located in Changping District in Beijing. Thebuilding, covering an area of 28000 m2, with 3 floors and 1
Received November 28, 2013; accepted January 16, 2014
Shilei LU (✉), Zhe CAI, Yiran LISchool of Environmental Science and Engineering, Tianjin University,Tianjin 300072, ChinaE-mail: [email protected]
Li ZHANGChina Aerospace Construction Group Co., Ltd., Beijing 100071, China
Front. Energy 2014, 8(3): 394–402DOI 10.1007/s11708-014-0310-1

basement whose gross floor area is 40883 m2, is acommercial building for car exhibition and spot sale.Beijing, the capital of China, belongs to the cold climatezone in terms of Building Climate Demarcation. Table 1lists the climatic conditions in Beijing whose annualheating and cooling degree-days are found to be 2794.8and 70.9 respectively with a base temperature of 18 °C and22°C.According to the calculation, the heating and cooling
loads of the building are 4258 kW and 5579 kW,respectively. The calculations were conducted under thedesign outdoor condition and the design indoor tempera-ture of 26°C–27°C in summer and 20°C in winter. AGWHP system was constructed for both heating andcooling. The corrosive nature of the ground water in thearea is quite low. The water temperature is 15°C–18°C andremains constant. Therefore, an air conditioning systemusing underground constant temperature water as the heatsource and sink was adopted. The mechanical room was inthe basement. The main devices in the system are threelarge-scale screw-type GWHP units. The terminal units arecombination air conditioning units.
2.2 Introduction of heat-pump system
Through the exploration and pumping test, groundwaterburied depth was found to be 22 m. The yield of a singlewell is 80 m3/h when the drawdown is 5 m, and thereinjection capacity of a single well is 40 m3/h. In total, 6wells support the GWHP system, of which, well 1# and 2#are used as the main pumping wells for cooling andheating, respectively. Well 3#, 5# and 6# are used as therecharge wells. Well 4# is a pumping and recharge well(PRW), which is used as the subsidiary pumping wellwhen the building load is comparatively large. Figure 1shows the schematic diagram of the distribution of thewells.Three screw-type heat pump units are utilized in this
project, whose type and parameters are tabulated inTable 2.The schematic diagram of the GWHP system is depicted
in Fig. 2.The operation of the underground water source heat
pump was as follows. In summer, the underground water of18°C was extracted by a submersible pump and separated
Table 1 Climate conditions in Beijing for long-term average values
Climate values Jan Feb Mar Apr May Jun Jul Aug Sep Oct Nov Dec
Average outdoor temp./°C – 3.8 – 1.6 7.7 14.4 19.4 24.5 26.5 25.6 20.4 12.9 5.4 – 0.5
Maximum outdoor temp./°C 0.8 4.0 11.9 21.4 23.4 29 30.6 31.3 28.1 18.1 9.9 5.6
Minimum outdoor temp./°C – 9.9 – 7.7 0.2 7.0 13.1 15.9 23.2 22.6 15.6 6.9 – 0.1 – 7.1
Average relative humidity/% 42.7 39.4 34.7 49.9 58.9 56.6 79.1 74.1 65.5 55.6 55.6 45.4
Total solar radiation/(MJ$m–2$d–1) 253.4 336.3 463.6 542.5 594.5 567.1 531.4 513.6 400.8 357.8 263.8 217.3
Average wind velocity/(m$s–1) 2.6 2.4 3.0 2.8 2.4 2.4 2.0 1.9 2.0 2.0 2.1 2.5
Fig. 1 Schematic diagram of the distribution of wells
Table 2 Type and parameters of ground water heat pump unit
NameSemi-hermetic screw ground water
heat pump unit
Product type LSBLGR-1400M
Refrigerating capacity/kW 1104
Input power of cooling/kW 220
Flow of chilled water/(m3$h–1) 220
Flow of cooling water/(m3$h–1) 251
Heating capacity/kW 1569
Power input of heating/kW 279
Flow of cold water/(m3$h–1) 194
Flow of hot water/(m3$h–1) 243
Unit dimension/cm 4465�1640�2118
Shilei LU et al. Performance of a centralized ground-water heat pump system in cold climate region 395

from sand by a hydrocyclone desander. Then it was heatedin the condenser of the heat pump unit to 22°C. After that,the water was recharged into the same aquifer. And finally,the cooling water of 7°C produced by heat pumpevaporator side was transported to end users. In winter,the underground water was extracted and transported to theheat pump evaporator where the temperature of the waterwas decreased to 10°C and recharged into the same aquifer.At the same time, the hot water of 45°C produced by thecondenser was transported to end users. Four fixedfrequency pumps were used as circulating water pumpsfor the user side and three submersed pumps were used forthe well circulation. The parameters of equipment arepresented in Table 3.
2.3 Measurement system
The test apparatus were set before the heating season in
2011–2012, and the testing data was collected fromDecember 2012 to March 2013. The operating parameterssuch as the temperatures, flow rates and energy consump-tions listed in Table 4 were measured by appropriateinstruments.
3 Results and discussion
The testing data for the whole heating season was obtainedby a long-term field test. The operating parameters werearranged and listed in Table 5.Figure 3 demonstrates the testing data and power
consumption data in the cooling season in 2012.The total power consumption in the cooling season was
252786 kWh and in the heating season was 402069 kWh.Because the heat load is dominating in Beijing, the powerconsumption in winter is much larger than that in summer.
Fig. 2 Schematic diagram of the ground water heat pump system
Table 3 Auxiliary equipment lists
Name Type and specification Number Note
Circulating looppumps
Type: QPG200-315Flow: 242 m3/hPump head: 27 mPower: 37 kW
4 Totally 4 pumps are installed, of which 1 is a spare unit
Immersible pump Type: KQL200/285-37/4Flow: 362 m3/hPump head: 24 mPower: 37 kW
3 Installed in well 1#、2#、4#
396 Front. Energy 2014, 8(3): 394–402

The energy consumption per building area is 6.18 kWh/m2
and 9.83 kWh/m2, respectively in summer and winter.Besides, it was found that the energy consumption ofpumps accounted for 32.11% and 38.59% respectively inthe cooling and the heating season.The energy consumption of the water transportation
system should account for 21% to 25% when adoptingvariable frequency pumps for the well water side [8]. Theenergy consumption of the transportation system in thisproject is relatively larger than the reference value. The
circulation loop pumps are fixed frequency pumps, whilethe submersible pumps are manual control variablefrequency pumps. The flow control of the circulationloop depends on the numbers of running pumps. This kindof adjustment not only increases the workload, but alsoleads to high energy consumption in the delivery system.The heating effect of the heat-pump system could be
evaluated by the air temperature in the air-conditioningrooms as
Tr,s ¼b1n1
Xn1
i¼1
Tr,i þb2n2
Xn2
i¼1
Tr,i þb3n3
Xn3
i¼1
Tr,i
þ b4n4
Xn4
i¼1
Tr,i, (1)
where b1, b2, b3, and b4 are the weighting coefficients ofthe four directions which is east, west, south and north; bystatistical analysis, b1 = b2 = 16.7%, b3 = 41.6%, b4 = 25%;n1, n2. n3, and n4 are the numbers of temperature sensors inthe four directions; and Tr,i is the daily average value ofindoor air temperature.The weighted mean temperature calculated from Eq. (1)
was illustrated in Fig. 4. As shown in Fig. 4, the indoor airtemperature was increasing along with the environmenttemperature. The average temperature was approximately20.6°C and covered the basic needs.
Table 4 Measurement items and device parameters
Measurementitems
Test interval Test devices Range Measurement accuracy
Watertemperature
Inlet and outlet of the evaporator 10 min TR004 temperature sensor – 30°C – 125°C �0.5°C
Inlet and outlet of the condenser
Inlet and outlet of the circulation loop
Inlet and outlet of the ground water loop
Flow Evaporator 10 min ZRN-100 ultrasonic flow-meter
1%
Condenser
Circulation loop
Ground water loop
Airtemperature
Indoor air 10 min TR002 temperature sensor – 20°C – 70°C �0.7°C
Outdoor air
Powerconsumption
Heat-pump unit 10 min Power meter
System 1day
Table 5 Operating parameters
Temperature ofground water/°C
Temperature difference ofground water loop/°C
Flow of groundwater
/(m3$h–1)
Temperature ofsupply water/°C
Temperature differenceof circulation water loop
/°C
Flow of circulationwater loop/(m3$h–1)
Average value 14–19 4–8 60–150 44 1.5–4.5 210–230
Design value 15 5 194 45 5 243
Fig. 3 Power consumption proportion
Shilei LU et al. Performance of a centralized ground-water heat pump system in cold climate region 397

3.1 Analysis of heat-pump unit
The main indexes to evaluate the energy-saving perfor-mance of ground water heat pump systems are coefficientof performance (COP), seasonal energy efficiency ratio(SEER), and primary energy ratio etc. of which, COP is themost important one.The useful heat produced by the heat pump unit during
the testing period is calculated as
Q ¼ �CpGðTc,o – Tc,iÞ, (2)
where ρ is the density of water, Cp is the specific heat ofwater, G is the water flow in the condenser (m3/h), and Tc,oand Tc,i are the water temperatures of the outlet and inlet ofthe condenser.The COP of heat pump unit is calculated as
COP ¼ Q=N , (3)
where N stands for the input power during the test period.January is the coldest month of the year, so the analysis
was made for one day in January. Figure 5 shows theamount of energy extracted from the groundwater (Qg),produced by the heat pump unit (Qh) and inputted to thecompressor (P) versus the time in one day. It can be seenfrom Fig. 5 that the fluctuation range of Qg and Qh is 350–450 kW and 450–550 kW while the power input Pmaintained around 100 kW.After arranging the hourly testing data of the tempera-
ture, the flow rate and power, the hourly COP wascalculated according to Eqs. (2) and (3) and exhibited inFig. 6. It can be seen that the discrete degree of COP wasvery large. The average value was 4.27, the maximumvalue was 6.12, and the minimum value was 1.99. Furtheranalysis showed that the sample range was 4.13, thevariance was 0.38, the standard deviation was 0.61, and thevariation coefficient was 0.14. The minimum COP of theunit was around 9:20, February 27. The reason for such asudden drop was the increased circulation loop flow.
Therefore, the water temperature of the condenser outletdecreased, and the COP significantly dropped. Themaximum COP appeared around 10:00 in the morningon March 1st. At that time, the outdoor temperaturesomewhat rose thus only one unit was in operation. Theload factor was as high as 75%. On the other hand, theunderground water temperature rose to 18°C, while thesupply water temperature dropped to 37°C. These alsocontributed to the higher level of COP.
Thus, many factors such as the temperature of groundwater and supply water could influence the COP of the heatpump unit. Besides, the COP even fluctuated a lot in oneday. As shown in Fig. 7, the COP increased to 5.57gradually, and dropped to a minimum of 3.89 in one day.During the actual operation, the COP of the GWHP unit
was influenced by many factors, including compressorload factor, water temperature of evaporator and con-denser, etc. The relationship between the COP and the
Fig. 4 Weighted mean temperature of indoor air and outdoor airtemperature Fig. 5 Amount of energy extracted from the groundwater (Qg),
produced by the heat pump unit (Qh) and inputted to thecompressor (P) versus time in one day
Fig. 6 Heat-pump COP in heating season
398 Front. Energy 2014, 8(3): 394–402

water temperature of the condenser and the evaporator wasindicated in Ref. [9] as
COP ¼ a – bTcd – cTev, (4)
where Tcd and Tev are the average water temperatures in thecondenser and evaporator. respectively, and a, b and c arethe regression coefficients.Thus the temperature of the evaporator and the
condenser has a great impact on the COP. When the loadfactor was 100%, the COP value for different supplytemperatures and flow rates were listed in Table 6.As displayed in Fig. 6, when the temperature of supply
water remains the same, the COP decreased with theincrease of cooling water flow. Because of the decrease ofcooling water flow, the average temperature of coolingwater decreased and thus the condensing temperaturedecreased.Table 7 shows the variation of COP along with the
temperature of evaporator inlet (that is, the well watertemperature). It is indicated that the evaporating tempera-ture decreased when well water temperature graduallydropped. Thus the COP of the unit was decreasinggradually.This GWHP system is a direct system. The groundwater
enters the unit after a simple treatment and is directlyinjected into the same aquifer after the heat transfer. As
described above, the PRW 4# started to draw water andreplenish the groundwater flow when the building load waslarge. So there existed a heat transfixion. The injectionwater was pumped out again without complete heattransfer with the soil. The observation suggested that thevariation in the temperature of well water could reach 2°Cin summer and 3.5°C in winter in one day.
3.2 Analysis of system
The high energy efficiency of GWHP systems depends onnot only the high COP of the single heat pump unit, butalso the great performance of other components. Incontrast to traditional central air conditioning systems, anextra ground water system for heat extracting andexhausting increases not only the initial investment, butalso the energy consumption in the delivery system.Therefore, the COP of the whole system was influenced.The COP of the whole system is defined as the ratio of
the refrigerating/heating capacity of the GSHP system tothe input power. The input power was generated from theGSHP units and pumps in the system, not including theterminal units.
COPS ¼QsX
Ni þX
Nj
, (5)
where COPS is the COP of the whole GSHP system, Qs isthe heating capacity (kWh), and Nj is the powerconsumption of pumps during the test (kWh).The hourly heating capacity could be calculated by
using the hourly average value of the temperatures ofsupply and return water and circulation loop flow. Byadding up the heating capacity of the 24 h, the daily COPswere obtained, as shown in Fig. 8.As seen in Fig. 8, the COPS were generally low and
fluctuated remarkably. The maximal value could reach4.13 while the minimal value was only 0.91, with anaverage of 2.59. A further analysis of the dispersion ofsamples showed that the range value of the sample was3.18, the variance value was 0.58, the standard deviationwas 0.76, and the variation coefficient was 0.31. Theminimal value appeared on Feb.14. The system wasoperated at a lower load ratio during the end of the SpringFestival to prevent the circulation loop water from bursting
Fig. 7 Heat-pump COP in one day
Table 6 Influence of condenser flow rate and outlet water temperature on COP
Gc/(m3$h–1) Ge/(m
3$h–1) Tc,o/°C Te,i/°C COP
220 50 40 14.5 4.41
158 50 40 14.5 4.46
220 50 38 14.5 4.70
158 50 38 14.5 4.72
220 50 36 14.5 4.99
158 50 36 14.5 5.03
Shilei LU et al. Performance of a centralized ground-water heat pump system in cold climate region 399

the pipes in severe coldness. Thus, the temperature of thesupply and the return water was lower and the loop flowwas large.In general, the COP at partial load is lower than that at
full load. Different kinds of units have different COP-loadratio curves. Besides, when several units operate in acombination, the COPS-load ratio curve is more uncertaindue to different operation models and load allocation. TheCOPS-load ratio curve for this GWHP system is shown inFig. 9.
As shown in Fig. 9, the COP of the whole systemincreased with the load ratio. Thus the lower load factor isone of the main factors causing the low COPS. In addition,the maximal load factor of this system is only 0.4. It wasproved that the design capacity of the GWHP system wasquite large.The generally low and remarkably fluctuated COPS of
this project were found to be caused by the heat transfixionin the aquifer and the bypass in circulation. The heattransfixion in the aquifer has been discussed in Subsection3.1.The bypass in the circulation loop was a prominent issue
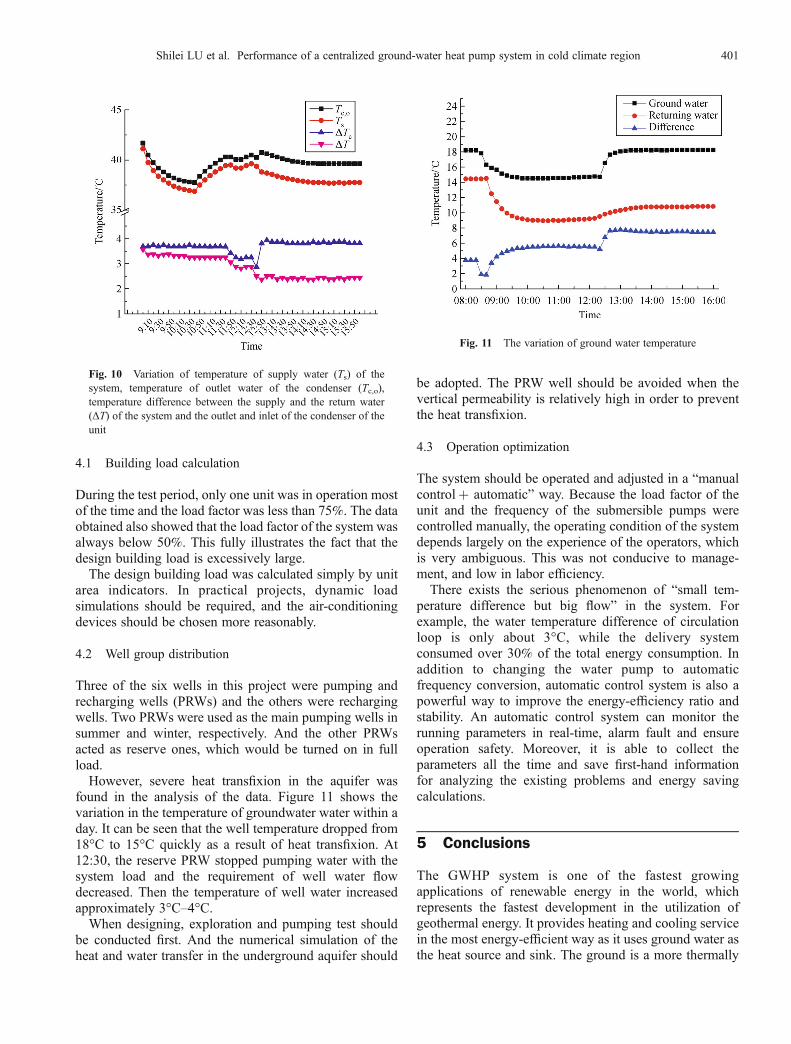
in this project. Beijing is located in the cold climate region,but the heating load is still a little lower than the coolingload. The circulation loop is often designed based on theconditions in summer. Therefore the flow demand inwinter is smaller. It was found that the circulation loop flowwas always fixed to ensure stable water pressure duringoperation. The existence of the bypass in the circulationloop caused a certain temperature disparity between thewater of the main water supply pipe and the condenseroutlet (evaporator outlet in summer). In winter, theexistence of the bypass in the circulation loop decreasedthe temperature of supply water and the temperaturedifference between the supply and the return water. It alsoincreased the flow rate at lower load ratio, thus the COPS ofthe whole system further deteriorated.Figure 10 shows the temperature of supply water (Ts)
and the temperature of condenser outlet water (Tc,o) of thesystem. As can be observed from Fig. 10, the watertemperature difference between the supply water of thesystem and condenser outlet of the unit was very small.When another heat-pump unit was shut down at noonbecause of lower load, the temperature of supply water ofthe system declined significantly. At the same time,temperature difference between the supply and the returnwater of the system (ΔT) declined to approximately 2.5°Cwhile the temperature difference between the outlet and theinlet of the condenser of the unit (ΔTc) remained to be 4°C.
4 Suggestions for GWHP system
According to the conclusions in Section 2, the COP of theheat pump unit and the system were both relatively low andfluctuated. To improve the energy efficiency and save moreenergy, some suggestions are proposed.
Table 7 Influence of evaporator inlet water temperature on COP
Gc/(m3$h–1) Ge/(m
3$h–1) Tc,o/°C Te,i/°C COP
220 50 40 18.0 5.02
220 50 40 16.5 4.80
220 50 40 14.5 4.41
Fig. 8 Performance coefficient of whole system (COPS) versusthe day
Fig. 9 Relationship between COPS and load factor
400 Front. Energy 2014, 8(3): 394–402
4.1 Building load calculation
During the test period, only one unit was in operation mostof the time and the load factor was less than 75%. The dataobtained also showed that the load factor of the system wasalways below 50%. This fully illustrates the fact that thedesign building load is excessively large.The design building load was calculated simply by unit
area indicators. In practical projects, dynamic loadsimulations should be required, and the air-conditioningdevices should be chosen more reasonably.
4.2 Well group distribution
Three of the six wells in this project were pumping andrecharging wells (PRWs) and the others were rechargingwells. Two PRWs were used as the main pumping wells insummer and winter, respectively. And the other PRWsacted as reserve ones, which would be turned on in fullload.However, severe heat transfixion in the aquifer was
found in the analysis of the data. Figure 11 shows thevariation in the temperature of groundwater water within aday. It can be seen that the well temperature dropped from18°C to 15°C quickly as a result of heat transfixion. At12:30, the reserve PRW stopped pumping water with thesystem load and the requirement of well water flowdecreased. Then the temperature of well water increasedapproximately 3°C–4°C.When designing, exploration and pumping test should
be conducted first. And the numerical simulation of theheat and water transfer in the underground aquifer should
be adopted. The PRW well should be avoided when thevertical permeability is relatively high in order to preventthe heat transfixion.
4.3 Operation optimization
The system should be operated and adjusted in a “manualcontrol+ automatic” way. Because the load factor of theunit and the frequency of the submersible pumps werecontrolled manually, the operating condition of the systemdepends largely on the experience of the operators, whichis very ambiguous. This was not conducive to manage-ment, and low in labor efficiency.There exists the serious phenomenon of “small tem-
perature difference but big flow” in the system. Forexample, the water temperature difference of circulationloop is only about 3°C, while the delivery systemconsumed over 30% of the total energy consumption. Inaddition to changing the water pump to automaticfrequency conversion, automatic control system is also apowerful way to improve the energy-efficiency ratio andstability. An automatic control system can monitor therunning parameters in real-time, alarm fault and ensureoperation safety. Moreover, it is able to collect theparameters all the time and save first-hand informationfor analyzing the existing problems and energy savingcalculations.
5 Conclusions
The GWHP system is one of the fastest growingapplications of renewable energy in the world, whichrepresents the fastest development in the utilization ofgeothermal energy. It provides heating and cooling servicein the most energy-efficient way as it uses ground water asthe heat source and sink. The ground is a more thermally
Fig. 10 Variation of temperature of supply water (Ts) of thesystem, temperature of outlet water of the condenser (Tc,o),temperature difference between the supply and the return water(ΔT) of the system and the outlet and inlet of the condenser of theunit
Fig. 11 The variation of ground water temperature
Shilei LU et al. Performance of a centralized ground-water heat pump system in cold climate region 401

stable heat exchange medium, particularly unlimited andalways available.In this paper, a long-term field test was conducted in a
centralized GWHP system in Beijing, China. The actualperformance of a centralized GWHP system in coldclimate region was evaluated. The following conclusionscan be reached from the analysis in the paper.1) GWHP systems can provide adequate heat in heating
season. The heating effect of GWHP systems is satisfac-tory. The fluctuation in room temperature is within anacceptable level.2) The heat-pump COP and the COP of the system are
approximately 4.27 and 2.59, respectively. And thedistribution of COP value is discrete. This indicates thatthe operating state of the heat pump system is not steadyenough.3) The heat transfixion and the bypass in the circulation
loop are the main problems appeared in operation. The heattransfixion can result in a 3°C–4°C temperature drop inwell water supply in winter, and the bypass in thecirculation loop can lead to the “small temperaturedifference and large flow rate” phenomenon.4) Taking the actual conditions into consideration,
dynamic load simulations, well designed well distribution,and optimized control of operating parameters are threeeffective ways to improve the performance of centralizedGWHP systems.5) The GWHP system is an appropriate heating method.
It could be widely used in the cold climate region in China.
Acknowledgements This work is supported by the China-US CleanEnergy Research Center for Building Energy Efficiency (No.2010DFA72740-05-03).
References
1. Bilen K, Ozyurt O,Bakirci K, Karsli S, Erdogan S, Yilmaz M,
Comakli O. Energy production, consumption, and environmental
pollution for sustainable development: a case study in Turkey.
Renewable and Sustainable Energy Reviews, 2008, 12(6), 1529–
1561
2. Sun X G. Engineering Technology and Management of Ground
Source Heat Pump. Beijing: China Architecture & Building Press,
2009 (in Chinese)
3. Zhang Y A, Li B. Application analysis on open-loop surface water-
source heat-pump systems. Heating Ventilating & Air Conditioning,
2007, 37(9): 99–104 (in Chinese)
4. Mustafa Omer A. Ground-source heat pumps systems and applica-
tions. Renewable and Sustainable Energy Reviews, 2008, 12(2):
344–371
5. Stefano Lo Russoa, Glenda Taddiaa , Vittorio Verdab. Development
of the thermally affected zone (TAZ) around a groundwater heat
pump (GWH. P) system: a sensitivity analysis. Geothermics, 2012,
(7): 66–74
6. Xue Y Q, Xie C H, Zhang Z H, Wu J C. Study on numerical modeling
of 3-D aquifer thermal energy storage with transient flow. Geological
Review, 1994, 40(1): 74–81(in Chinese)
7. Lv Y, Mo R, Zhou M, Deng H Y. China GSHP technology
application development report (2005–2006). Construction & Design
for Project China, 2007, (9): 4–11(in Chinese)
8. Bai X L, Zhang Y J, Wang H H. Energy efficiency of water
transportation system for surface water source heat pump. Journal of
Civil, Architectural & Environmental Engineering, 2010, 32(6): 86–
91(in Chinese)
9. Lei F, Hu P F, Huang S Y, Sun Q M. Energy and exergy analysis of a
ground water heat pump system. Fluid Machinery, 2012, (2): 57–62
(in Chinese)
402 Front. Energy 2014, 8(3): 394–402