Embed Size (px)
Citation preview
Illinois State Water SurveyWatershed Science SectionChampaign, Illinois
A Division of the Illinois Department of Natural Resources
Contract Report 2003-05
Evaluation of the Illinois StreamflowGaging Network
by
H. Vernon Knapp and Momcilo Markus
Prepared for theIllinois Department of Natural Resources
April 2003
Evaluation of the
Illinois Streamflow Gaging Network
by H. Vernon Knapp and Momcilo Markus
Illinois State Water Survey Illinois Department of Natural Resources
Prepared for the Illinois Department of Natural Resources
Office of Water Resources
April 2003

Evaluation of the Illinois Streamflow Gaging Network
by H. Vernon Knapp and Momcilo Markus
Executive Summary
The Illinois Streamflow Gaging Network has been operated by the U.S. Geological Survey (USGS) since the early 1900s. From its inception, the operation of the network has been maintained through a cooperative partnership between the USGS and state and federal agencies. Hydrologic information provided by the network is vital for the general management of Illinois’ water resources. Streamflow data are continually used for forecasting floods and droughts; assessing the biological and chemical health of our streams; operating reservoirs, water supply facilities, wastewater treatment facilities, and hydroelectric plants; assessing and predicting the long-term impacts of climate and land-use trends on our streams; and numerous other important uses. The purpose of this study was to conduct a comprehensive evaluation of the use of Illinois streamflow data, with the goal that this information and analysis will be used by the network’s cooperating agencies and others for current and future decisions related to funding and content of the network. Evaluations such as this have been conducted in the past, and should continue to be conducted periodically to assess whether the network meets the data needs of users in an effective manner, to assess emerging needs, and to anticipate needed programmatic changes to the network.
This report identifies several emerging applications for which more and additional types of stream data likely will be needed, including applications related to stream and watershed restoration and water quality load assessment. However, in general, it is not possible to anticipate many of the future needs of the streamflow gaging program. More often than not, emerging issues will need to use streamflow data far before there is sufficient time to collect data for that specific use. The only way to have adequate data when these needs arise is to maintain a base network at locations that are representative of the streams of Illinois, such that these long-term data are available to meet a broad range of potential needs.
This base network of gaging stations also is needed to provide general streamflow information for ungaged streams throughout Illinois. There are thousands of streams in Illinois, whereas the network currently includes roughly 160 continuous-streamflow gages on fewer than 110 of these streams. For other streams, flow characteristics must be estimated from the available gaging records using regional hydrologic principles. Various methods are available to evaluate the effectiveness of specific gaging records for use in this regional transfer of information. This report includes several descriptive measures of the regional value of gage information and also summarizes a numerical evaluation based on information transfer theory. No single approach can effectively describe the broad range of considerations needed to evaluate the regional value of gages. However, it is clear that applications in regional hydrology will need additional data beyond those which are currently supported by the network. Specifically,
iii
the base network is noticeably lacking data from small watersheds in rural Illinois. In addition, several hydrologic regions in Illinois have a limited number of gages for use in regional analysis.
Two questionnaires were developed to ascertain the importance and uses of the data from the streamflow gaging network. The first questionnaire was distributed to all agencies that provide cooperative funding to the network. The second questionnaire was developed on an Internet Web site to be accessed and filled out by all interested users of Illinois streamflow data. In both questionnaires, the respondents were asked to identify: 1) the types of data that they most frequently use and/or are most critical for their needs; 2) categories of data applications and their relative importance; and 3) the importance of specific gages for their applications. The report provides a ranking of the relative importance of individual gages based on the responses from the questionnaires. The users indicate that river forecasting/flood warning is the overall most important category of application of streamflow data, followed by long-term flow statistics for analyzing hydrologic trends and determining human impacts to streams. However, the majority of users are more likely to use streamflow data for individual project needs such as those related to hydrologic-hydraulic modeling and design, and biological and conservation assessment.
Analysis of gaging records indicates that streamflow conditions are not stationary, and vary not only from year to year but also from decade to decade as influenced by climate variability and other factors. More than half of the long-term flow records in rural areas show statistically significant increases in average and low-flow conditions that appear to occur as a result of climate variability. Statewide, over the past 25 years, there has also been an average increase of 18 percent in the estimates of the 100-year flood peak discharge as represented by long-term records. With the decline in the number of crest-stage peak-flow gages and small watershed gages, many of the records available for certain types of hydrologic analysis are older, discontinued gaging records that may not accurately represent the expected present-day, long-term hydrologic conditions. Shorter gaging records, regardless of period of record, also may not fully represent the expected long-term conditions. There is a need for analytical techniques to assess inherent differences in streamflow records and characteristics such as flood frequency that are caused by climatic variability and other factors. The network appears to be meeting most traditional current-use needs. However, there is a need to reinforce the base network, specifically regarding data for relatively small rural watersheds that are needed to address various emerging issues, long-term regional assessment, and peak flood estimation. The size of the overall network would have to be increased an additional 15-20 percent to more effectively address data needs related to small to medium-sized rural watersheds. Also, there is a growing need for new types of stream data to address specific biological and conservation issues such as stream and watershed restoration. This report only addresses streamgaging issues related to flow quantity, and thus there are no conclusions or recommendations related to water quality, precipitation, or other types of hydrologic data.
Funding for the Illinois Streamflow Gaging Network is subject to uncertainties, and this is especially the case regarding potential growth or changes to the network. The National Streamflow Information Program (NSIP), initiated by the USGS in 1999, proposed that the USGS eventually would assume the costs of gages that directly meet specific federal interests. However, it is uncertain whether this or other initiatives from traditional funding sources will
iv

produce a prominent change in the size and character of the network. More likely, gaging needs for emerging issues will need to be funded from new sources currently not participating in the network. By its nature, it is essential that the base network be funded mainly through state or federal agencies with a long-term commitment to the streamflow gaging program.
v

Contents Page Introduction..........................................................................................................................1 Study Components ........................................................................................................2 Acknowledgments..........................................................................................................2 Background Information and Network Description ............................................................3 Streamflow Trends and Variability................................................................................3 Reduction in Number of Gages in Small Watersheds ...................................................8 Advances in Streamflow Data Products ........................................................................9 Review of Streamflow Gaging Network Studies and Methods .........................................13 National Streamflow Gaging Evaluation Studies ........................................................13 Network Design Techniques........................................................................................16 Previous Evaluations of the Illinois Streamflow Gaging Network..............................17 Impact of Previous Evaluations on Changes to the Streamflow Gaging Network ......21 Importance of Streamgaging Data to Cooperating Agencies ............................................23 Type of Data Used .......................................................................................................24 Categories of Applications...........................................................................................25 Overall Importance of Data to Agencies .....................................................................36 Additional Gaging Needs.............................................................................................36 Importance of Streamgaging Data to Individual Data Users .............................................41 Importance and Frequency of Data Use.......................................................................41 Data Applications.........................................................................................................45 Importance of Specific Streamflow Gages to Data Users ...........................................48 Additional Comments from Respondents....................................................................48 Regional Value of Streamflow Gages................................................................................55 Quantitative Assessments of Regional Value ..............................................................55 Descriptive Assessments of Regional Value ...............................................................60 Future Needs for Characterizing Flows at Ungaged Sites ...........................................69 Ranking of Relative Importance of Individual Gages .......................................................71 Assignment of Primary Points .....................................................................................83 Assignment of Secondary Points .................................................................................83 Additional Issues and Potential Directions for Streamflow Gaging in Illinois .................85 Emerging Data Needs ..................................................................................................85 Data Needed on Small Watersheds..............................................................................88 Potential Role of NSIP.................................................................................................88 Summary and Conclusions ................................................................................................89 References..........................................................................................................................93
vii
Tables Page
1 Changes in Network Size since 1971 ................................................................................... 4 2 Analysis of Streamflow Trends and Changes in Flood Frequency Estimates...................... 5 3 Standard Error of Estimate Associated with Using a 30-Year Flow Record to Estimate the Long-term Mean Flow ........................................................................ 7 4 Number of Gages in Small Watersheds (< 30 square miles).............................................. 11 5 Total Number of gages Used by Each Agency, Indicating General Importance of Data Types............................................................................................................. 25 6 Summary of Responses for Various Data Types ................................................................ 26 7 Importance of Each Gage to Agencies and Categories of Data Application...................... 27 8 Categories of Survey Respondents ..................................................................................... 41 9 Importance of Various Data Types to Individual Users ..................................................... 42 10 Frequency of Use for Various Data Types ......................................................................... 43 11 Group Perception of the Importance of Various Data Types for All Users ....................... 44 12 Importance of Data by Category of User............................................................................ 46 13 Importance of Various Applications to Individual Users ................................................... 47 14 Types of Data Used for Various Applications.................................................................... 49 15 Group Perception of the Importance of Various Applications for All Users ..................... 50 16 Number of Responses Identifying the Importance of Individual Gages to Users .............. 51 17 Gages with Highest and Lowest Overall Entropy .............................................................. 59 18 Category of Gages Based on Extent of Hydrologic Modification and Their Usefulness for Regional Analysis.............................................................................. 62 19 Continuous Discharge Gages for Regional Analysis (Categories A-E), Listed by Physiographic Region and Ranked by Drainage Area............................................... 66 20 Ranking of Relative Importance of Individual Streamflow Gages..................................... 72 21 Attributes Used to Assign Primary and Secondary Points ................................................. 76
viii
Figures Page
1 Source of funding for the USGS Streamflow Gaging Program in Illinois (Water Year 2001) ....................................................................................................... 4 2 Comparison of average precipitation and streamflow, Rock River Watershed, 1900-2000 .................................................................................................................... 7 3 Locations of continuous discharge gages in Illinois, 1971 and 2001 ................................... 8 4 Distribution of gages in rural watersheds by drainage area, 1971 and 2001: (a) all of Illinois, and (b) Illinois River basin ............................................................ 10 5 Locations of continuous discharge and crest-stage peak-flow gages in Illinois, 1971 and 2001............................................................................................................ 11 6 Type of data used, importance of data, and total number of responses for all agencies .... 26 7 Applications of data by streamgage cooperating agencies and number of gages associated with each application type ........................................................................ 37 8 Collective use of data by all agencies for specific categories of applications.................... 38 9 Importance of gages used by each agency.......................................................................... 39 10 Physiographic Divisions of Illinois (after Leighton et al., 1948) ....................................... 57
ix

Introduction
Hydrologic information provided by the Illinois Streamflow Gaging Network is vital for the general management of Illinois’ water resources. Streamflow data are continually used for forecasting floods and droughts; assessing the biological and chemical health of streams; operating reservoirs, water supply facilities, wastewater treatment facilities, and hydroelectric plants; assessing and predicting long-term impacts of climate and land-use trends on streams; and numerous other important uses.
The U.S. Geological Survey (USGS) first began operating streamflow gages in Illinois in 1903 to monitor flows in the Illinois Waterway downstream of the Lake Michigan diversion. Over the next 10 years, gages were operated intermittently on various rivers throughout Illinois. In 1914, streamgages were established at 20 regional sites throughout Illinois, creating a network that has operated continuously since that time. From the start, the operation of the Illinois Streamflow Gaging Network has been maintained through a cooperative partnership between the USGS, state, and other federal agencies.
Since the network was established, the primary product of the program has been the development of continuous records of stream discharge. From the mid-1950s to early 1980s, an additional program focus was to estimate annual peak flows for a large number of crest-stage gages located primarily on small watersheds throughout Illinois. Additional stream data resulting from the program are continuous stage records (i.e., those without estimates of discharge), annual peak stage, measurements of low flow at partial record sites, water quality and suspended sediment measurements, and miscellaneous discharge measurements. The present evaluation focuses on stream records associated with flow quantity and does not attempt to examine those portions of the network dealing with either water quality and sediment data or precipitation data recorded at certain gages. Only those gages in Illinois operated by the USGS are included in the evaluation. Gages operated by other federal, state, and local agencies either have stage-only records, as yet have comparatively short records, or, in some cases, have flow records that lack the same quality or consistency as the USGS records.
General reductions in the level of support for the USGS Streamflow Gaging Network, particularly at the national level have prompted concern and awareness of the need for redefining and prioritizing our needs for streamflow information. During the past 30 years, the total number of active USGS streamflow stations across the nation has been reduced by roughly 15 percent (Lanfear and Hirsch, 1999). Lanfear and Hirsch also report a decline in the number of long-term streamflow gages, with greater than 30 years of record, being those gages needed to study critical issues such as climate change and long-term impacts of land-use change. Clark et al. (2001) observed that there has been a 22 percent nationwide reduction in the number of gages that record flow on small rivers and note a potential negative impact on our ability to anticipate and evaluate impacts to many environmental indicators. The character of the Illinois Streamflow Gaging Network also has changed considerably over this time, as will be discussed in the section “Background Information and Network Description.”
Many decision-makers and most of the public are generally unaware of the overall socioeconomic benefits of streamflow gaging data for management of water resources. In a
1
number of publications over the past five years, the USGS and other organizations have actively communicated the uses and benefits of streamflow gaging (USGS, 1998; TEWWMN, 1998; Dragonetti, 1999), and also to establish needs and goals of the network (USGS, 1999; ICWP, 2002). The present evaluation will not attempt to reiterate discussions related to the overall benefits of streamflow gaging, but instead will focus more on the importance of specific gages and data uses to meet Illinois’ needs. The reader is referred to these and other publications for more general information on the benefits of streamflow gaging.
Study Components
The purpose of this study was to conduct a comprehensive evaluation of the Illinois Streamflow Gaging Network. This evaluation had various components, including:
• A review of previous network evaluation studies and methods.
• An evaluation of present uses of streamflow information in Illinois, identifying the importance of data for cooperating agencies and individual users.
• An analysis of the statistical content and regional value of gage records for use in determining gages most useful in establishing regional hydrologic relationships.
• Identification of emerging data needs in Illinois and the most desirable and most critical components of the network to meet these emerging and present data needs.
For the second component, two user surveys were conducted to assess the use and importance of streamflow data, and to assess which individual gage records were of particular use and importance to cooperating agencies.
Acknowledgments
This study was supported by the Illinois Department of Natural Resources, Office of Water Resources (IDNR-OWR), under Award No. IDNR WR09911 S99-273. The Illinois State Water Survey (ISWS), a Division of IDNR, also provided support. Arlan Juhl, IDNR-OWR, served as project liaison. The study was conducted under the general supervision of Mike Demissie, head of the ISWS Watershed Science Section. Other ISWS staff, Karla Andrew, Bill Saylor, and Susan Shaw, assisted in the preparation and tabulation of the questionnaires and in contacting data users and cooperating agencies. Patti Hill and Becky Howard prepared the camera-ready copy of the report and Eva Kingston edited the report. The authors thank the U.S. Geological Survey, Illinois District, and all cooperating agencies to the Illinois Streamflow Gaging Network for their cooperation and input in this study.
Any opinions, findings, and conclusion or recommendations expressed in this report are those of the authors and do not necessarily reflect those of the U.S. Geological Survey, Office of Water Resources, or the Illinois State Water Survey.
2
Background Information and Network Description
The size of the Illinois Streamflow Gaging Network grew steadily throughout its first 50 years. Two of the largest growth periods came in Water Years 1940-1941 and Water Years 1948-1952, when the network grew by 41 and 46 gages, respectively. The latter period of growth came as a result of the “small streams” program cooperatively funded by the State of Illinois, which placed emphasis on determining flood characteristics of streams in smaller watersheds. Forty of the new gages installed between 1948 and 1952 were on streams with watershed areas less than 60 square miles, and 17 of these gages were located in the developing suburban areas of metropolitan Chicago. The small streams program was expanded to include the use of crest-stage gages, with the number of crest-stage gages eventually growing to more than 160 gages in 1955. From 1963 to 1973, a program of low-flow measurements also was conducted at selected ungaged sites throughout Illinois.
The size of the network in Illinois reached its maximum in 1971, when there were 171 continuous discharge gages, 163 crest-stage gages, 7 continuous stage gages, and 17 low-flow partial-record stations. Budget cuts in the early 1970s and early 1980s reduced network size considerably, and by 1983 had reduced the number of continuous discharge gages by roughly 20 percent and peak-flow crest-stage gages by more than 80 percent (see table 1). Since 1983, support from local agencies in and near the Chicago metropolitan area has allowed the network to grow, even while general financial support for gages in the remainder of the State has continued to decline. Local agencies now support 28 continuous discharge gages, almost 20 percent of the network. Most gages supported by local and state agencies also receive matching funding from the USGS through the Federal-State Cooperative Water Program. Figure 1 shows an approximate breakdown of the source of funding for the Illinois Streamflow Gaging Network. The gaging network in 2001 included 153 continuous discharge gages, 22 continuous stage gages, and 9 crest-stage gages (table 1).
In the history of the network, continuous discharge gages have been operated at almost 300 different locations. Of these, 230 gages have at least 10 years of record, 155 gages have more than 25 years of record, 83 gages have more than 50 years of record, and 18 gages have more than 75 years of record. The average duration (length) of record is roughly 46 years (active gages) and 15 years (discontinued gages). While the Illinois network has operated gages at fewer locations than networks in nearby states, it has more gages with longer periods of record. For example, the Wisconsin network has gages at almost 400 different locations, but more than half of these have less than 10 years of record, and the average length of record for active gages is 36 year. Streamflow Trends and Variability
There are 83 active gages with record lengths in excess of 50 years. Thirty of these gages are located on streams with noticeable flow impacts from human modification in the form of urbanization, reservoir construction, diversion of flows, or other factors. Impacts from these activities on the remaining 53 gages are minimal, except for releases from wastewater treatment plants that may have impacts on flow.
3
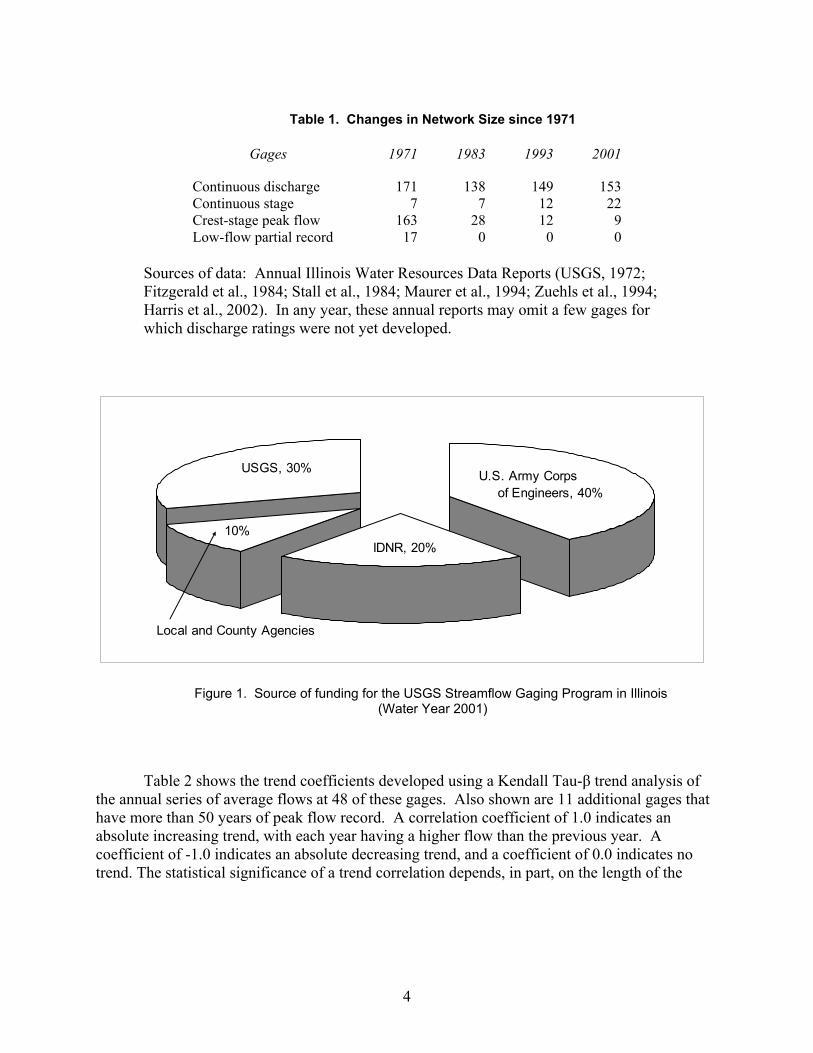
Table 1. Changes in Network Size since 1971
Gages 1971 1983 1993 2001
Continuous discharge 171 138 149 153 Continuous stage 7 7 12 22 Crest-stage peak flow 163 28 12 9 Low-flow partial record 17 0 0 0
Sources of data: Annual Illinois Water Resources Data Reports (USGS, 1972; Fitzgerald et al., 1984; Stall et al., 1984; Maurer et al., 1994; Zuehls et al., 1994; Harris et al., 2002). In any year, these annual reports may omit a few gages for which discharge ratings were not yet developed.
USGS, 30% U.S. Army Corpsof Engineers, 40%
IDNR, 20%10%
Local and County Agencies
Figure 1. Source of funding for the USGS Streamflow Gaging Program in Illinois (Water Year 2001)
Table 2 shows the trend coefficients developed using a Kendall Tau-β trend analysis of the annual series of average flows at 48 of these gages. Also shown are 11 additional gages that have more than 50 years of peak flow record. A correlation coefficient of 1.0 indicates an absolute increasing trend, with each year having a higher flow than the previous year. A coefficient of -1.0 indicates an absolute decreasing trend, and a coefficient of 0.0 indicates no trend. The statistical significance of a trend correlation depends, in part, on the length of the
4
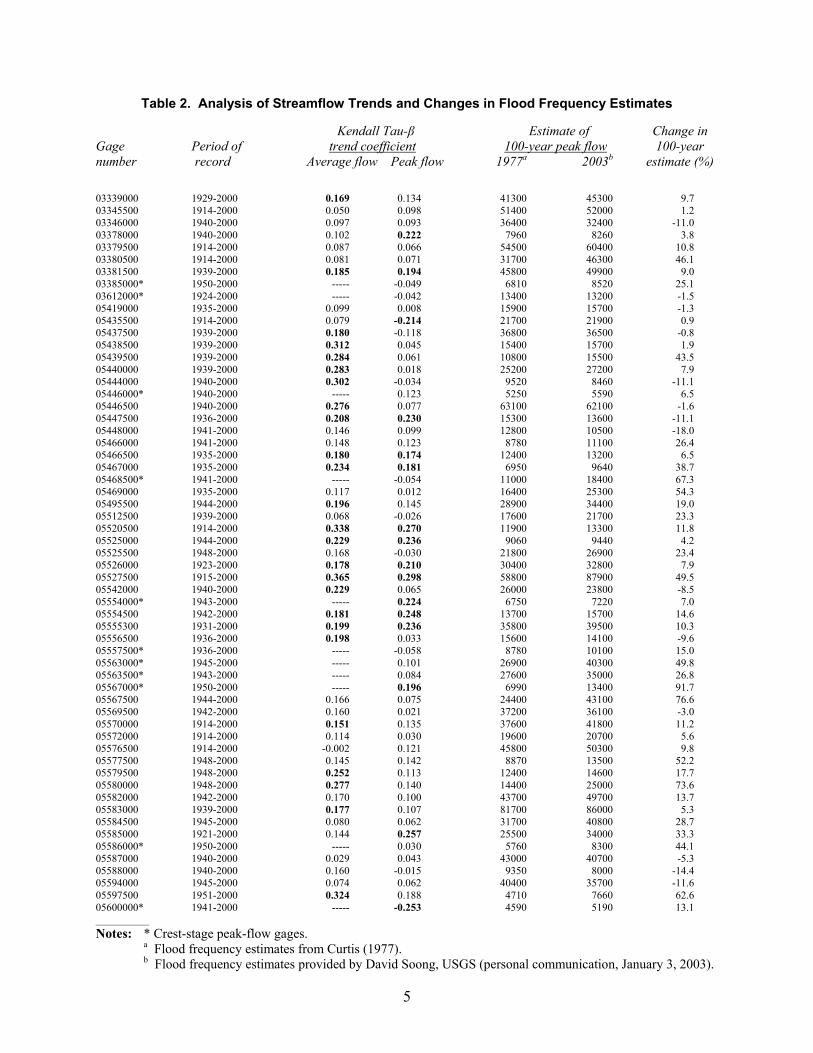
Table 2. Analysis of Streamflow Trends and Changes in Flood Frequency Estimates Kendall Tau-β Estimate of Change in Gage Period of trend coefficient 100-year peak flow 100-year number record Average flow Peak flow 1977a 2003b estimate (%) 03339000 1929-2000 0.169 0.134 41300 45300 9.7 03345500 1914-2000 0.050 0.098 51400 52000 1.2 03346000 1940-2000 0.097 0.093 36400 32400 -11.0 03378000 1940-2000 0.102 0.222 7960 8260 3.8 03379500 1914-2000 0.087 0.066 54500 60400 10.8 03380500 1914-2000 0.081 0.071 31700 46300 46.1 03381500 1939-2000 0.185 0.194 45800 49900 9.0 03385000* 1950-2000 ----- -0.049 6810 8520 25.1 03612000* 1924-2000 ----- -0.042 13400 13200 -1.5 05419000 1935-2000 0.099 0.008 15900 15700 -1.3 05435500 1914-2000 0.079 -0.214 21700 21900 0.9 05437500 1939-2000 0.180 -0.118 36800 36500 -0.8 05438500 1939-2000 0.312 0.045 15400 15700 1.9 05439500 1939-2000 0.284 0.061 10800 15500 43.5 05440000 1939-2000 0.283 0.018 25200 27200 7.9 05444000 1940-2000 0.302 -0.034 9520 8460 -11.1 05446000* 1940-2000 ----- 0.123 5250 5590 6.5 05446500 1940-2000 0.276 0.077 63100 62100 -1.6 05447500 1936-2000 0.208 0.230 15300 13600 -11.1 05448000 1941-2000 0.146 0.099 12800 10500 -18.0 05466000 1941-2000 0.148 0.123 8780 11100 26.4 05466500 1935-2000 0.180 0.174 12400 13200 6.5 05467000 1935-2000 0.234 0.181 6950 9640 38.7 05468500* 1941-2000 ----- -0.054 11000 18400 67.3 05469000 1935-2000 0.117 0.012 16400 25300 54.3 05495500 1944-2000 0.196 0.145 28900 34400 19.0 05512500 1939-2000 0.068 -0.026 17600 21700 23.3 05520500 1914-2000 0.338 0.270 11900 13300 11.8 05525000 1944-2000 0.229 0.236 9060 9440 4.2 05525500 1948-2000 0.168 -0.030 21800 26900 23.4 05526000 1923-2000 0.178 0.210 30400 32800 7.9 05527500 1915-2000 0.365 0.298 58800 87900 49.5 05542000 1940-2000 0.229 0.065 26000 23800 -8.5 05554000* 1943-2000 ----- 0.224 6750 7220 7.0 05554500 1942-2000 0.181 0.248 13700 15700 14.6 05555300 1931-2000 0.199 0.236 35800 39500 10.3 05556500 1936-2000 0.198 0.033 15600 14100 -9.6 05557500* 1936-2000 ----- -0.058 8780 10100 15.0 05563000* 1945-2000 ----- 0.101 26900 40300 49.8 05563500* 1943-2000 ----- 0.084 27600 35000 26.8 05567000* 1950-2000 ----- 0.196 6990 13400 91.7 05567500 1944-2000 0.166 0.075 24400 43100 76.6 05569500 1942-2000 0.160 0.021 37200 36100 -3.0 05570000 1914-2000 0.151 0.135 37600 41800 11.2 05572000 1914-2000 0.114 0.030 19600 20700 5.6 05576500 1914-2000 -0.002 0.121 45800 50300 9.8 05577500 1948-2000 0.145 0.142 8870 13500 52.2 05579500 1948-2000 0.252 0.113 12400 14600 17.7 05580000 1948-2000 0.277 0.140 14400 25000 73.6 05582000 1942-2000 0.170 0.100 43700 49700 13.7 05583000 1939-2000 0.177 0.107 81700 86000 5.3 05584500 1945-2000 0.080 0.062 31700 40800 28.7 05585000 1921-2000 0.144 0.257 25500 34000 33.3 05586000* 1950-2000 ----- 0.030 5760 8300 44.1 05587000 1940-2000 0.029 0.043 43000 40700 -5.3 05588000 1940-2000 0.160 -0.015 9350 8000 -14.4 05594000 1945-2000 0.074 0.062 40400 35700 -11.6 05597500 1951-2000 0.324 0.188 4710 7660 62.6 05600000* 1941-2000 ----- -0.253 4590 5190 13.1 __________ Notes: * Crest-stage peak-flow gages. a Flood frequency estimates from Curtis (1977). b Flood frequency estimates provided by David Soong, USGS (personal communication, January 3, 2003).
5
record being analyzed. Trend coefficients in table 2 listed in bold represent trends that are statistically significant with a 95 percent level of confidence. More than half of these 48 gage records show statistically significant increasing trends in average flow, and roughly 25 percent show increasing trends in peak flows.
Table 2 also compares estimates of the 100-year peak flow for each of the long-term gages based on results from Curtis (1977) and Soong, USGS (personal communication, January 3, 2003). For roughly half of the gages, the additional 25 years of data has resulted in at least a 10 percent increase in the estimate of the 100-year peak flow. This suggests that peak flows have increased for many areas of Illinois, even ones not indicated by the Kendall Tau-β trend analysis. The average increase over the last 25 years in the 100-year peak flow is 18 percent for long-term gages in the State and 25 percent for long-term gages in the Illinois River basin. Thus, there is the possibility that older peak flow records may underestimate flood frequency when compared to more recent records.
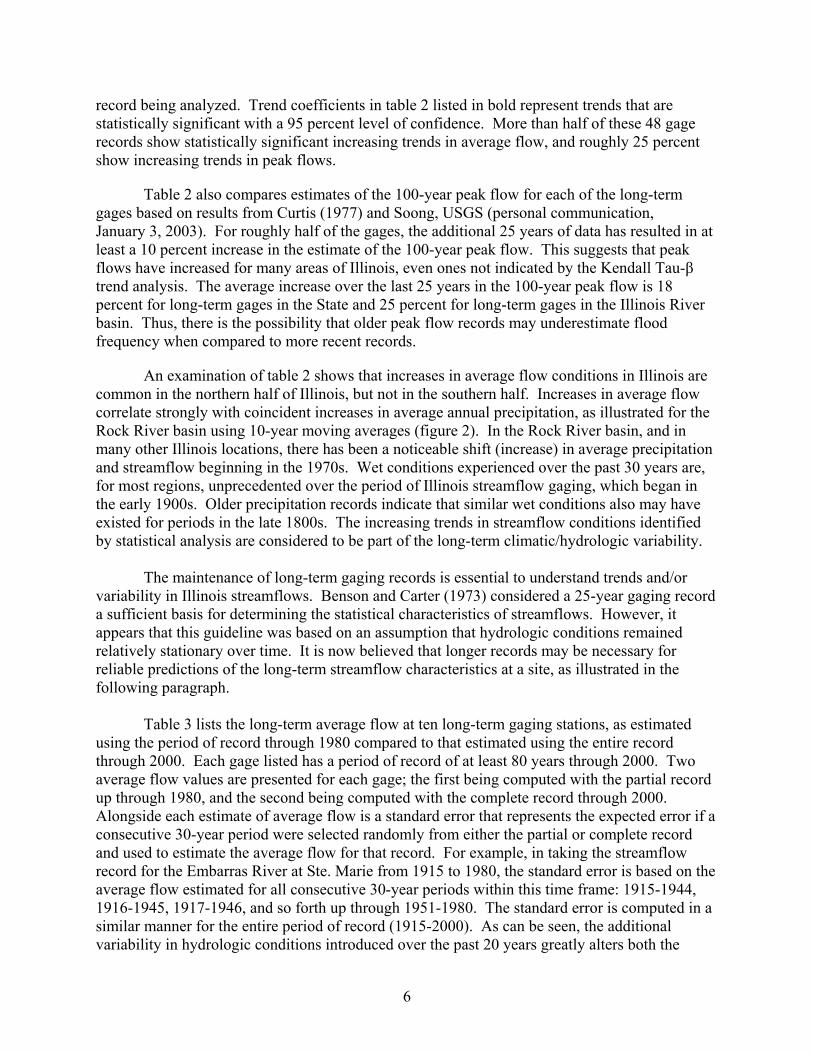
An examination of table 2 shows that increases in average flow conditions in Illinois are common in the northern half of Illinois, but not in the southern half. Increases in average flow correlate strongly with coincident increases in average annual precipitation, as illustrated for the Rock River basin using 10-year moving averages (figure 2). In the Rock River basin, and in many other Illinois locations, there has been a noticeable shift (increase) in average precipitation and streamflow beginning in the 1970s. Wet conditions experienced over the past 30 years are, for most regions, unprecedented over the period of Illinois streamflow gaging, which began in the early 1900s. Older precipitation records indicate that similar wet conditions also may have existed for periods in the late 1800s. The increasing trends in streamflow conditions identified by statistical analysis are considered to be part of the long-term climatic/hydrologic variability.
The maintenance of long-term gaging records is essential to understand trends and/or
variability in Illinois streamflows. Benson and Carter (1973) considered a 25-year gaging record a sufficient basis for determining the statistical characteristics of streamflows. However, it appears that this guideline was based on an assumption that hydrologic conditions remained relatively stationary over time. It is now believed that longer records may be necessary for reliable predictions of the long-term streamflow characteristics at a site, as illustrated in the following paragraph.
Table 3 lists the long-term average flow at ten long-term gaging stations, as estimated using the period of record through 1980 compared to that estimated using the entire record through 2000. Each gage listed has a period of record of at least 80 years through 2000. Two average flow values are presented for each gage; the first being computed with the partial record up through 1980, and the second being computed with the complete record through 2000. Alongside each estimate of average flow is a standard error that represents the expected error if a consecutive 30-year period were selected randomly from either the partial or complete record and used to estimate the average flow for that record. For example, in taking the streamflow record for the Embarras River at Ste. Marie from 1915 to 1980, the standard error is based on the average flow estimated for all consecutive 30-year periods within this time frame: 1915-1944, 1916-1945, 1917-1946, and so forth up through 1951-1980. The standard error is computed in a similar manner for the entire period of record (1915-2000). As can be seen, the additional variability in hydrologic conditions introduced over the past 20 years greatly alters both the
6
28
29
30
31
32
33
34
35
36
1900 1910 1920 1930 1940 1950 1960 1970 1980 1990 2000
10-Y
ear A
vera
ge A
nnua
l Pre
cipi
tatio
n (in
ches
)
6
7
8
9
10
11
12
13
14
10-Y
ear A
vera
ge A
nnua
l Stre
amflo
w (i
nche
s)
precipitation
streamflow
Figure 2. Comparison of average precipitation and streamflow,
Rock River Watershed, 1900-2000
Table 3. Standard Error of Estimate Associated with Using a 30-year Flow Record
to Estimate the Long-term Mean Flow
Estimates based on Estimates based on data through 1980 data through 2000 Long-term Standard Long-term Standard
Gage location mean flow (cfs) error (%) mean flow (cfs) error (%) Embarras River at Ste.Marie 1210 4.8 1255 7.1 Little Wabash River below Clay City 875 3.5 937 7.0 Rock River at Afton, WI 1774 3.8 1912 11.3 Pecatonica River at Freeport 889 3.2 947 7.8 Kankakee River at Momence 1928 2.9 2081 10.9 Fox River at Algonquin 822 7.3 896 16.3 Spoon River at Seville 1026 5.5 1104 11.5 Sangamon River at Monticello 398 6.4 417 8.7 LaMoine River at Ripley 774 4.7 842 12.0 Kaskaskia River at Vandalia 1464 3.7 1517 6.8 __________ Note: The long-term mean flow is computed using the entire flow record through 1980 or 2000.
The standard error is the expected difference between the mean flow for any given 30-year period and the long-term mean flow.
7
estimates of the long-term average flow conditions and the ability to accurately predict it using a 30-year record. Specifically, it is now apparent that a 25- or 30-year record is much less capable of providing the accuracy standards in the long-term mean suggested by Sieber (1970) for Illinois; and, in many cases, a 40- to 50-year record may be necessary to achieve the same level of accuracy in the estimate of the mean flow and other flow statistics. Long-term climate records indicate that interdecadal climate variability has occurred throughout recorded history, and thus likely will continue to occur and affect the uncertainty of estimating streamflow characteristics such as low flows and flood magnitudes.
Reduction in Number of Gages in Small Watersheds
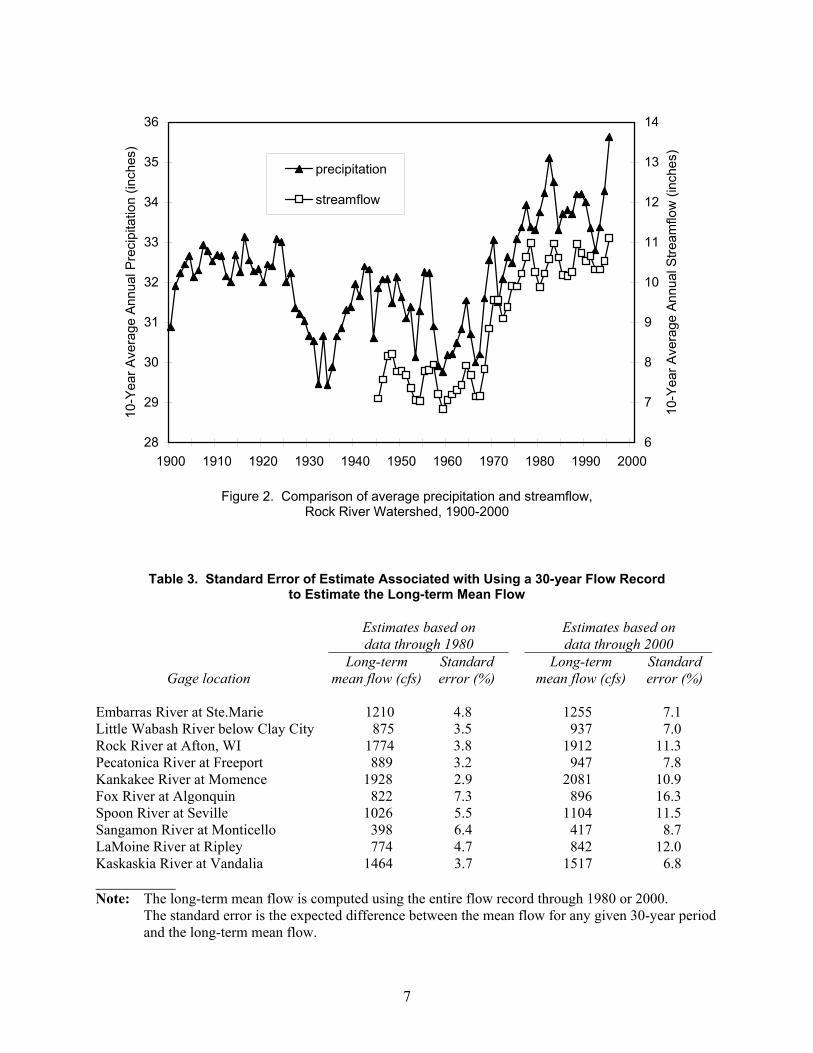
Figure 3 shows the location of continuous discharge gages during Water Years 1971 and 2001. Examination of figure 3 shows a general reduction in gages in rural areas of Illinois, and a corresponding increase in gages in the six-county metropolitan area of Chicago. Most dramatic
20011971
Figure 3. Locations of continuous discharge gages in Illinois, 1971 and 2001
8
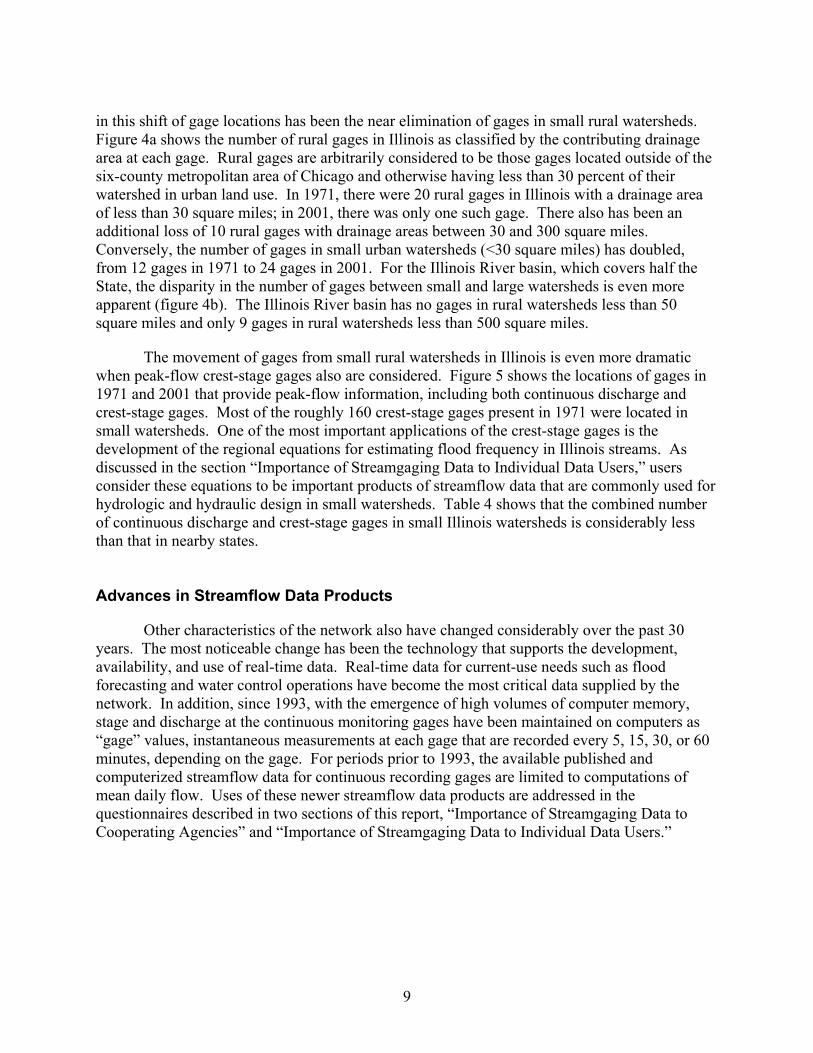
in this shift of gage locations has been the near elimination of gages in small rural watersheds. Figure 4a shows the number of rural gages in Illinois as classified by the contributing drainage area at each gage. Rural gages are arbitrarily considered to be those gages located outside of the six-county metropolitan area of Chicago and otherwise having less than 30 percent of their watershed in urban land use. In 1971, there were 20 rural gages in Illinois with a drainage area of less than 30 square miles; in 2001, there was only one such gage. There also has been an additional loss of 10 rural gages with drainage areas between 30 and 300 square miles. Conversely, the number of gages in small urban watersheds (<30 square miles) has doubled, from 12 gages in 1971 to 24 gages in 2001. For the Illinois River basin, which covers half the State, the disparity in the number of gages between small and large watersheds is even more apparent (figure 4b). The Illinois River basin has no gages in rural watersheds less than 50 square miles and only 9 gages in rural watersheds less than 500 square miles.
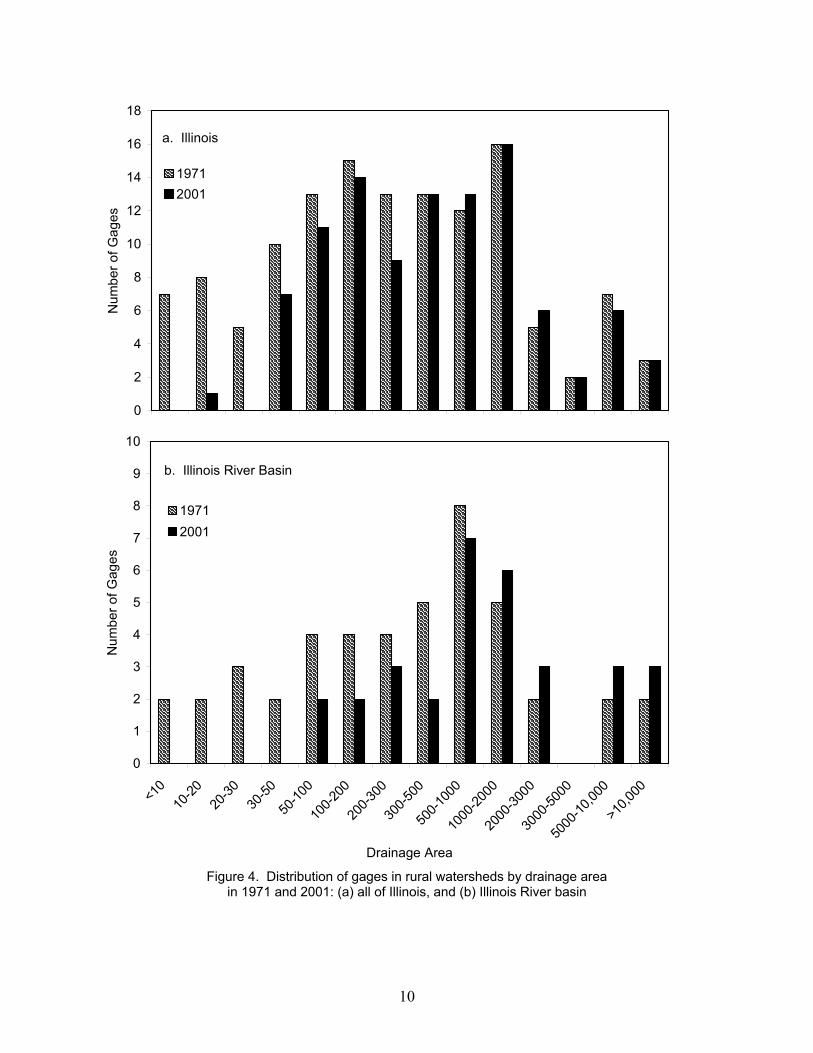
The movement of gages from small rural watersheds in Illinois is even more dramatic when peak-flow crest-stage gages also are considered. Figure 5 shows the locations of gages in 1971 and 2001 that provide peak-flow information, including both continuous discharge and crest-stage gages. Most of the roughly 160 crest-stage gages present in 1971 were located in small watersheds. One of the most important applications of the crest-stage gages is the development of the regional equations for estimating flood frequency in Illinois streams. As discussed in the section “Importance of Streamgaging Data to Individual Data Users,” users consider these equations to be important products of streamflow data that are commonly used for hydrologic and hydraulic design in small watersheds. Table 4 shows that the combined number of continuous discharge and crest-stage gages in small Illinois watersheds is considerably less than that in nearby states. Advances in Streamflow Data Products
Other characteristics of the network also have changed considerably over the past 30 years. The most noticeable change has been the technology that supports the development, availability, and use of real-time data. Real-time data for current-use needs such as flood forecasting and water control operations have become the most critical data supplied by the network. In addition, since 1993, with the emergence of high volumes of computer memory, stage and discharge at the continuous monitoring gages have been maintained on computers as “gage” values, instantaneous measurements at each gage that are recorded every 5, 15, 30, or 60 minutes, depending on the gage. For periods prior to 1993, the available published and computerized streamflow data for continuous recording gages are limited to computations of mean daily flow. Uses of these newer streamflow data products are addressed in the questionnaires described in two sections of this report, “Importance of Streamgaging Data to Cooperating Agencies” and “Importance of Streamgaging Data to Individual Data Users.”
9
0
2
4
6
8
10
12
14
16
18N
umbe
r of G
ages
19712001
a. Illinois
0
1
2
3
4
5
6
7
8
9
10
<10
10-20
20-30
30-50
50-10
0
100-2
00
200-3
00
300-5
00
500-1
000
1000
-2000
2000
-3000
3000
-5000
5000
-10,00
0
>10,0
00
Drainage Area
Num
ber o
f Gag
es
19712001
b. Illinois River Basin
Figure 4. Distribution of gages in rural watersheds by drainage area
in 1971 and 2001: (a) all of Illinois, and (b) Illinois River basin
10
20011971
Figure 5. Locations of continuous discharge and crest-stage peak-flow gages
in Illinois, 1971 and 2001
Table 4. Number of Gages in Small Watersheds (< 30 square miles)
State Continuous discharge gages Crest-stage gages
Illinois (rural) 1 2 Illinois (rural and urban) 25 2 Indiana 34 0 Iowa 8 67 Kentucky 34 0 Wisconsin 41 59
11

Review of Streamflow Gaging Network Studies and Methods
National Streamflow Gaging Evaluation Studies
Network evaluations for the national streamflow gaging program were first initiated in the late 1960s by the U.S. Geological Survey (USGS). These earlier studies, including those by Hardison (1969) and Benson and Carter (1973), focused on estimating streamflow characteristics for ungaged sites using regional data, specifically dealing with the statistical methods related to regional hydrology. In a national assessment, Benson and Carter (1973) proposed accuracy goals for regional hydrologic analysis, suggesting that regional methods should have a goal of predicting streamflow characteristics on “minor streams” to the same level of accuracy attained by a gage record of 10 years. They proposed that regional methods should predict flow characteristics for “principal streams” with an accuracy comparable to a 25-year flow record. The designation of “principal” and “minor” streams as defined by Benson and Carter (1973) was indistinct and could vary regionally. Seiber (1970) considered principal streams in Illinois to be those having drainage areas in excess of 500 square miles. Benson and Carter (1973) indicated that, if a gaging network met this accuracy goal, then it might be reasonable to reduce some portion of the gaging network in favor of other types of data needs.
Throughout the 1970s and early 1990s, USGS scientists produced a variety of research on streamflow gaging networks. Langford and Kapinos (1979) presented an outline of federal and nonfederal water data collection activities and proposed the implementation of a national water data network to be coordinated by the USGS. Moss (1979) emphasized a need to integrate engineering into economics, as well as into planning and politics. Network design was described as an iterative process, that includes reevaluating and updating any design periodically. Data collected change the designer’s perception of the hydrologic system and processes; the data user may modify procedures for data use; the information flow from an associated data network may change because of changes in that network; and a better technique for network design may become available.
Langbein (1979) indicated that network design need not necessarily be based on formal schemes of optimization, such as the minimum cost of attaining data accuracy. A design may be based upon judgmental analyses to accommodate a mix of design criteria. Analyses showing the sensitivity of the error variance to such factors as the number of observations, the frequency or length of the period of observations, and the nature of the model provide insight as to tactics for improving the network even though an explicit optimum is not sought.
Dawdy (1979) suggested using the value of hydrologic data for individual gages as a factor in network analyses. Wahl and Crippen (1984) defined factors to evaluate the relative worth of gage data to that of other gages based on various site characteristics, and uses of water and economic considerations, with each factor having a possible point range. Gages with the maximum score were considered most important. The method, which is somewhat subjective, requires a thorough knowledge of each particular gage.
The National Research Council or NRC (1992) assessed the makeup of the USGS streamflow gaging network with respect to how it supports analyses of “regional hydrology”; i.e., assessing whether the present network sufficiently supports the estimation of streamflow
13
characteristics at ungaged sites and the definition of long-term hydrologic trends. One of the major issues addressed by the NRC was the assumption of hydrologic stationarity, which is basic to most traditional procedures concerning regional analysis in hydrology. Stationarity is a statistical property related to a series of data (or events). A stationary series is one where the mean and variance of that series do not change over time. The NRC concluded that it is inappropriate to assume that hydrologic processes are stationary, and note that changes in land surface characteristics and the potential for climate change may impose the need to reexamine the basis for present regional hydrology data collection and analyses.
The NRC suggested examining detrending techniques to analyze nonstationary hydrologic series. Two possible ways of doing this are: 1) including variables in the statistical analysis that may cause the hydrology to be nonstationary (for example, changes in precipitation, water use, or land use); and 2) use of hydrologic modeling. Despite advances in hydrologic modeling, the NRC indicated that some problems remained, and models lacked the “fundamental ingredient needed for regionalization under nonstationarity, the ability to specify changes in parameter values with changes in land use or climate” (NRC, 1992, page 13). The NRC suggested that, for hydrologic modeling to be effectively used for regional hydrology, the USGS would need to make some modest alterations in gaging networks, which primarily would require a shift to monitoring a greater number of small basins. They added that modeling was not a replacement for observation; in fact, it increases the amount of data required.
The USGS conducted a national assessment of the streamflow gaging program in the mid-1980s, centering on cost-effectiveness of the program, which is summarized in Thomas and Wahl (1993). A study for the Illinois streamflow gaging network by Mades and Oberg (1984), discussed later, also was part of this national assessment. The national assessment indicated that most gages in the network were being used for multiple purposes; and alternative methods for developing daily flow records, such as the use of models and statistical methods, were not sufficiently accurate for most uses. Wahl et al. (1995) presented an overview of the streamflow gaging program, discussing current and future needs of the USGS streamflow gaging program, and providing specific categories of data uses.
The USGS (1999) presented the goals and priorities of the newly established National Streamflow Information Program (NSIP) and sought input regarding that program. The NSIP identified five primary federal interests or goals in streamflow information:
1) Providing streamflow information for use by the National Weather Service in flood forecasts.
2) Providing streamflow information for international and interstate compact requirements.
3) Quantifying flows for major river basins for use in national water assessments, planning studies, and policy decisions.
4) Analyzing long-term trends and estimating streamflow characteristics at ungaged sites (regional hydrology).
5) Monitoring water quality.
In addition to maintaining a network of gages, the NSIP also includes four other data-collection and data-support components: intensive data collection in response to major floods
14
and droughts; periodic assessments and interpretation of streamflow gaging data to determine trends and statistical characteristics; providing real-time information to users; and research and development of hydrologic techniques.
For Illinois, 120 streamgage locations are identified as eligible for NSIP support (USGS, 2002), i.e., supporting one or more of the five major NSIP goals. Roughly 100 of these 120 locations are active discharge or stage-only gages within the Illinois network, with a few of the stage gages being operated by the U.S. Army Corps of Engineers. By far, the highest priority goal in Illinois is in support of National Weather Service flood forecasting activities, representing 98 of the 120 locations.
The Interstate Council on Water Policy (ICWP, 2002) presents a critique of NSIP and proposes a number of additional recommendations for a national streamflow gaging network. The ICWP review process included four regional workshops that were designed to gain input from network cooperators, water resource managers, and other users of streamflow data. Cooperative sponsorship for these workshops was provided by the USGS, which has been responsive to many of the issues discussed in the ICWP report, particularly those related to cooperative funding of NSIP gages and the unique streamgaging needs of individual states (Personal communication, R. Holmes, October 24, 2002).
In addition to the five federal goals proposed by NSIP, the ICWP proposes nine additional national goals, to be supported by a mix of users representing federal, state, tribal, and local interests. These nine goals are to collect streamflow gaging data for use in supporting or assessing: 1) the National Flood Insurance Program, 2) watersheds with impaired water quality, 3) major National Pollutant Discharge Elimination System (NPDES) sites, 4) river recreation and safety, 5) rivers draining federal lands, 6) major diversions, 7) large reservoirs, 8) migratory fish, and 9) navigation.
The ICWP document produced 21 findings related to gaging goals and funding. Most of the findings center around three topics: 1) differing needs and priorities among states, 2) stability of the network, and 3) cooperative funding of the network. Whereas the basic principles and goals for NSIP are identified by the USGS on a national scale, specific needs and priorities can vary between states. For this reason, the ICWP recommends a flexible configuration for NSIP-qualified gages in each state with state and local input, so that sites selected can meet multiple federal, state, and local goals, rather than just a single federal goal.
The ICWP (2002) indicates that stability is the top priority for the present network and suggests that greater stability can be achieved with financial participation of multiple users in each gage, thus reducing the unit cost of gages for cooperating agencies. One ICWP concern is that the NSIP program will fully fund gages at the expense of matching funds that otherwise would go into the USGS Federal-State Cooperative Water Resources program. Additional concerns are that: 1) by losing a financial stake in the NSIP gages, the cooperators’ power to influence decisions concerning that gage also will be lost; and 2) nonfederal dollars freed up by moving gages into the NSIP may not be redirected back into the network, but rather may be reallocated to meet other State and local water resource needs. For this reason, the ICWP proposes using a portion of NSIP dollars to replace losses in the Federal-State match.
15
Among other items, the ICWP findings also indicate that there should be greater overall support for water quality assessment and monitoring of small watersheds. If the NSIP program results in funding for additional gages, the ICWP prefers the reactivation of old gages rather than installation of new gages so that historic records can be reclaimed.
Network Design Techniques
Streamflow gaging network design has been an active area of research since the 1960s. For example, an optimal interpolation developed by Gandin (1963) was used to specify a minimum spatial density of observation stations for a given accuracy of estimation. Karasev (1968) proposed a technique that specifies the number of streamgages required to estimate runoff within a given accuracy.
Moss and Karlinger (1974) outlined the Network Analysis for Regional Information (NARI) method for network design based on Monte-Carlo simulation, regression analysis, and Bayesian analysis. Moss et al. (1982) described the NARI technique in more detail. A description of the technique also is provided in Mades and Oberg (1986), who applied the NARI method to the Illinois Streamflow Gaging Network.
NAUGLS
Network Analysis Using Generalized Least Squares (NAUGLS) as described by Tasker (1986) was used to identify an efficient gaging plan for a specific operating budget and provide insight into the amount of regional information lost or gained by reducing or increasing the operating budget. Moss and Tasker (1991) compared NAUGLS and NARI techniques and demonstrated superiority of NAUGLS over a wide range of data availabilities and design constraints. The NAUGLS method can be applied using GLSNET (Generalized Least Squares NETwork), a software package developed by the USGS for network design.
Entropy
Yang and Burn (1994) described an entropy-based approach to gage network design. Their approach is based on a directional informational transfer (DIT) index, which in their study compared favorably with the traditional correlation coefficient. Entropy, as defined in information theory, is a measure of the uncertainty of a particular outcome in a random process, and provides an objective criterion in selecting the mathematical model. Entropy of a model output can be computed from historical data and thus characterize the variability inherent in the process. Linfoot (1957) defined the informational coefficient of correlation and demonstrated its advantage over the classical correlation coefficient. Entropy-based techniques also have been used in various other studies for gage network design. Husain (1989) proposed a network design method based on entropy; and Harmanciouglu and Alpaslan (1992) used the information-based uncertainty measure in water quality monitoring network design. A more detailed review of the entropy-based approach for network design is included in Markus and Knapp (2003, in preparation).
16
Previous Evaluations of the Illinois Streamflow Gaging Network
Sieber (1970)
Sieber (1970) applied methodology later summarized by Benson and Carter (1973) to the Illinois Streamflow Gaging Network. Sieber’s analysis indicated that regionalization methods were not capable of meeting the accuracy goals proposed by Benson and Carter, and that the network would need to be evaluated and designed to better meet those goals. To meet the accuracy goals for regionalization, Sieber believed that the network would need a higher proportion of gages on streams with watersheds of less than 60 square miles.
Sieber classified streamflow data uses into four data categories: current use, planning and design, long-term trends, and stream environments. Data for current use were further divided into assessment, operations, forecasting, disposal, water quality, compact or legal, and research or special studies. The general objective of the program, as defined by Benson and Carter (1973) was to provide flow information at any point on any stream. This is based on the concept that streamflow information may be needed for any stream, and that the program must be designed to accommodate this need. Within this general objective, there are goals to meet the four basic data uses described above:
1. Provide flow information at specific sites as needed for current uses. 2. Be able to define, at any site and with reasonable accuracy, statistical flow properties of
streams for planning and design. Specific flow properties defined by Sieber (1970) were the mean annual discharge and its standard deviation, mean monthly discharges and their standard deviations, the 50-year flood, the 7-day, 50-year high flow, the 7-day, 2-year low flow, and the 7-day, 20-year low flow.
3. Operate a small number of gages for an indefinite period to determine long-term trends. Gages selected should be minimally affected by human-made changes.
4. Conduct stream surveys of time-of-travel, flood profiles, and channel parameters such as velocities, depths, bed material, water quality, etc.; and research the effect of human-made changes on streamflow environments.
Sieber’s analysis focuses on the second goal listed above and attempts to evaluate
whether the network has met this goal. To evaluate success, Sieber specified a level of accuracy for the regression equations to estimate flows at ungaged sites, defined separately for principal streams (defined by Sieber as having watershed areas greater than 500 square miles), and minor streams (watershed areas less than 500 square miles). On the basis of this approach, Sieber reached two conclusions:
• The accuracy goal was attained at many larger, principal streams. • The regression equations did not give results within accuracy goals for minor streams
with natural flow. Because the regression equations did not give accurate results for minor streams, Sieber recommended that gaging of minor streams must be continued, specifically:
• The future network should have a higher proportion of gages on streams with drainage areas of less than 60 square miles.
17
Sieber identified 69 gages for current uses and 26 gages (10 of which also provided current-use data) to provide regional information for the evaluation of long-term trends in streamflows. For the remaining 81 gages in the network, Sieber suggested sweeping changes in the Illinois Streamflow Gaging Network. He recommended discontinuing all gages on minor streams with at least 19 years of record and all gages on principal streams with at least 25 years of record, and substituting gages at new sites that would continue to add information for regional analysis. Clearly, Sieber’s approach did not consider the possibility that hydrologic conditions could change over time, requiring continuing streamflow gages for longer periods of time, as may be required for future regional analysis.
Of the 54 gages recommended to be cut, 26 gages still exist and now have gaging records in excess of 50 years. Twenty-one gages that were proposed to be cut were discontinued during 1971-1978; ten of these gages were in smaller watersheds (<30 square miles). It does not appear that there were any direct replacements for these gages, although other gages were installed during these eight years for current use. Gages never were installed at any of 11 specific locations proposed by Sieber. Mades and Oberg (1984, 1986)
A pair of studies by Mades and Oberg (1984, 1986) provides the most comprehensive examination of the Illinois streamflow gaging program in terms of the range and types of analyses employed. As described in Mades and Oberg (1986, page 10), the studies had three major approaches:
“1) Identify the principal uses of streamflow data collected at stream-gaging stations; 2) Evaluate less costly alternative methods, such as flow-routing techniques, for
furnishing streamflow data; and 3) Define strategies for operating the network that minimize the average error of
streamflow data for a given operating budget.”
Mades and Oberg (1984) described two alternative methods for developing streamflow information, flow-routing models and statistical models, which potentially could provide estimates of daily streamflow for less cost than that of operating streamflow gages. The study showed that these methods, in general, do not produce accurate estimates of daily streamflow, although they may provide effective alternatives to gaging in special cases where two gages are located near each other on the same stream.
Mades and Oberg (1986) evaluated the network using four methods:
• Data-use survey • Network analysis of regional information • Kalman filter analysis of uncertainty • Relative worth analysis
Data-Use Survey. The survey of data usage was sent to federal, state, and local
organizations involved in water resources planning and management in Illinois. Respondents
18
included 12 federal offices, 4 state agencies, and 2 local organizations. Three general categories of gage data use were defined in the questionnaire:
• current purpose • long-term trends • planning and design
Survey respondents indicated that 142 gages provided data for current purposes. This response marked a sizeable increase from the 69 gages identified by Sieber (1970) for current use.
Survey respondents also were asked to specify the degree of their need for data. Thirteen specific uses of data were designated, including determining rainfall-runoff relations, satisfying legal requirements, two uses related to flood forecasting, four uses related to reservoir monitoring and operation, and five uses related to water quality and sediment.
Network Analysis of Regional Information (NARI). The NARI method was used to evaluate the accuracy of statistical models that estimate selected flow characteristics at ungaged sites in a region. These statistical models, based on multiple-regression analysis, are commonly used to transfer information from gages to ungaged sites because it is not economically feasible to collect streamflow data at every site for which data are needed.
Regression models were developed for average annual flow; high flows, including flood quantiles; and low flows. The most accurate statistical models were those that estimated average annual discharge at ungaged sites, and the least accurate were those that estimated low flows. Equations were based on regions defined by the boundaries of major watersheds.
The primary conclusion of the NARI analysis was that the accuracy of the statistical models would not improve considerably with either a denser gaging network or longer flow records at each gage (Mades and Oberg, 1986, page 34). The relative insensitivity of the standard error to changes in gage density and period of record can be related to one of two factors: 1) shortcomings in the statistical models related to incomplete or incorrect formulation of the models, and errors in the measurement of the independent variables; or 2) the gage density and number of years are already adequate to make accurate determinations of streamflow characteristics at many gages (Mades and Oberg, 1986, page 34).
Kalman Filter Analysis of Uncertainty. Kalman filter analysis was used to evaluate the stability of the stage-discharge relationship for each gage by identifying the standard error of the deviations in instantaneous discharge from a long-term rating for the gage. Error estimates were used as indicators of the apparent accuracy of the daily discharges at each gage. The study also related the frequency of discharge measurements to the expected error at the gages. Eleven continuous discharge gages identified by Mades and Oberg (1986) had poor estimates of low and medium discharges, with standard errors of 40 percent or more. These gages were: Lusk Creek near Eddyville, Hadley Creek near Kinderhook, Bay Creek at Pittsfield, Weller Creek at Des Plaines, Farm Creek at Farmdale, Crab Orchard Creek near Marion, Sangamon River at Decatur, Cahokia Creek at Edwardsville, Indian Creek at Wanda, Little Crooked Creek near New Minden, and East Fork Shoal Creek near Coffeen. Mades and Oberg (1986, page 30) indicate that “agencies that participate in funding these gaging stations should critically evaluate the need for streamflow data at these sites.” All but one of these gages have continued to operate since the Mades and Oberg (1986) study.
19
Relative Worth Analysis. A relative worth analysis was employed to evaluate the usefulness of a gage by rating a set of gage characteristics. Factors and point values used in this analysis included:
1) Mean annual flow unmeasured by upstream gages (1-3 points) 2) Area coverage (1-6 points) 3) Data accuracy (1-8 points) 4) Length of record (2-6 points) 5) Correlation efficiency, based on NARI analysis (0-4 points) 6) Diversity of interest in data, based on results from the data-use survey (0-10 points) 7) Data uses for planning, based on results from the data-use survey (0-15 points) 8) Data uses for management, based on results from the data-use survey (0-15 points)
These factors were modified from a set of factors presented by Wahl and Crippen (1984).
The relative worth analysis by its nature is subject to a certain amount of personal judgment. Although eight different factors were used in the analysis, many of the available points are related to an evaluation of the importance of the data for use in planning and management (factors 7 and 8). It is clear from the range of point values given in Mader and Oberg (1986) that these two factors have a dominant role in the overall results of the analysis. Points assigned for these factors appear to be based on an interpretation of the results from the data-use survey.
Points assigned for the first five factors in the relative worth analysis gave higher priority to gages in larger watersheds, gages with small measurement errors (which also often favors gages on larger streams), gages with very short or very long records, and gages with low error when fitted to statistical regional equations. Although Singh et al. (1986) later questioned the assignment of these points, the total points assigned to these five factors suggest their relatively minor role in the overall ranking of the relative worth of network gages.
Gages that received the lowest total scores in the relative worth analysis were identified as possible candidates for discontinuance if budgetary considerations required such an action. Of the 26 gages identified for possible discontinuance, 17 gages were continuous discharge gages, and 9 gages were peak-flow gages. Basically, the list of 26 gages includes all gages for which data: 1) were used by only one agency, and 2) were not identified as serving current-use needs.
Singh et al. (1986)
Singh et al. (1986) examined the importance of gages based primarily on: 1) a questionnaire sent to general users of gaging information, and 2) extensive regional analysis done by the Illinois State Water Survey. The questionnaire developed by Singh et al. (1986) was sent to 158 users of streamflow data, including consulting firms, planning commissions, state and federal agencies, public utilities, university professors, and others. There were 54 respondents.
Survey results indicated that most users used historical data, while cooperating agencies in the streamflow gaging program most often used data for current-use needs. Respondents most frequently used peak annual flows, followed by daily mean flows. The most common data
20
applications were hydrologic/hydraulic design and general background. The questionnaire also asked how data could be most useful to users. Forty percent of the respondents indicated that processed data, such as low-flow and water-quality statistics, flood frequency, flood stages, and flood forecasts, are the most valuable additional information for their uses. Twenty-five percent of the respondents expressed interest in using real-time data.
Singh et al. (1986) presented results of regional regression analyses over a wide range of streamflow characteristics for selected hydrologic regions, which were defined by physiography and watershed characteristics of Illinois. With respect to developing and verifying regional equations, Singh et al. provided general guidelines for selecting gages of value in regional analyses. Among the recommendations were:
• More gages are needed for drainage areas less than 100 square miles, a recommendation consistent with that of Sieber (1970).
• A uniform distribution of the drainage areas of gages in terms of their logarithms may be the most desirable for developing regional equations. Regression graphs indicate potential locations of new gages to achieve a satisfactory areal distribution.
• New gages should be established in areas for which hydrologic data are lacking, even if it involves discontinuing some existing gages.
• Gages that correlate poorly with present regression analyses should be retained until the hydrologic record can be better explained in terms of relevant physical factors.
• Within a hydrologically homogeneous region, some gages may exhibit similar behavior for some of the desired hydrologic parameters. Some of these gages can be discontinued without significant loss of information, particularly if more than 25 years of data are available.
• Regional analyses can be improved by locating new gages to either avoid or directly estimate the impacts of wastewater treatment plants, reservoirs, and other extraneous factors.
Singh et al. provided specific recommendations for discontinuing and/or activating new gages at three funding levels: 1) sufficient financial support, reflecting an overall increase in the size of the network by three continuous discharge gages; 2) moderate budgetary constraints, reflecting an overall reduction of six continuous discharge gages; and 3) severe budget constraints, reflecting an overall reduction of 29 continuous discharge gages. For the desired top level network, Singh et al. recommended discontinuing 17 active continuous discharge gages and installing 20 new (or reactivated) gages. Although Singh et al. also recommended more gages in small watersheds, the proposed network at the desired top level, with sufficient financial support, represented a net reduction of five gages for watersheds of less than 100 square miles.
Impact of Previous Evaluations on Changes to the Streamflow Gaging Network
All three previous network evaluation studies for Illinois preceded or accompanied periods during which budget cuts required a reduction in network size. Each study provided a list of gages to be considered for discontinuation if budget cuts required such action. Sieber (1970) and Singh et al. (1986) also provided a list of recommended locations for possible new gage sites. Of these recommended additions to the network, gages eventually were installed at
21
only two sites on the Embarras River (Diona and Oakland) that were recommended by Sieber. Both new gages were soon discontinued because of budget restrictions. Mades and Oberg (1986) provided no recommendations for either network design or potential new network sites.
Sieber’s recommendations played a prominent role in the selection of continuous discharge gages to be discontinued in the early 1970s. At the end of the 1971 water year, 17 gages were cut from the network, 16 of which were in the list of 54 gages proposed by Sieber to be discontinued. In the following seven years (1971–1978), eight additional gages from Sieber’s list also were cut. Ironically, most of the discontinued gages selected from Sieber’s list were from small watersheds, even though one of Sieber’s recommendations was to increase the number of gages in small watersheds.
In comparison, the recommendation of the Mades and Oberg (1986) study had considerably less impact on the selection of gages that were discontinued in the 1980s. It appears that most changes to the gaging network since the early 1980s have come much more as a result of changes in the current-use needs of the cooperating agencies rather than through the results of a network design or evaluation. Fourteen gages were eliminated from the Illinois Streamflow Gaging Network from 1985 to 1992, and only seven of these gages were listed by Mades and Oberg as having low relative worth. Recommendations by Singh et al. (1986) had little impact on gage network decisions.
22
Importance of Streamgaging Data to Cooperating Agencies
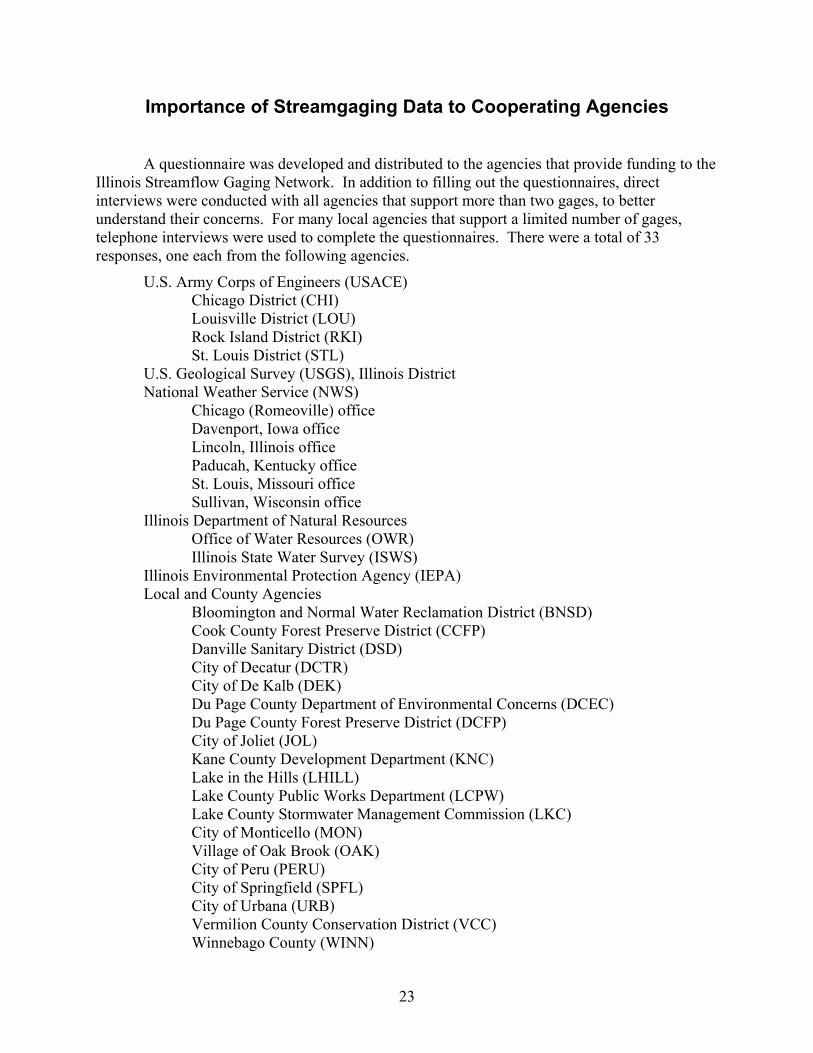
A questionnaire was developed and distributed to the agencies that provide funding to the
Illinois Streamflow Gaging Network. In addition to filling out the questionnaires, direct interviews were conducted with all agencies that support more than two gages, to better understand their concerns. For many local agencies that support a limited number of gages, telephone interviews were used to complete the questionnaires. There were a total of 33 responses, one each from the following agencies.
U.S. Army Corps of Engineers (USACE) Chicago District (CHI) Louisville District (LOU) Rock Island District (RKI) St. Louis District (STL) U.S. Geological Survey (USGS), Illinois District National Weather Service (NWS) Chicago (Romeoville) office Davenport, Iowa office Lincoln, Illinois office
Paducah, Kentucky office St. Louis, Missouri office Sullivan, Wisconsin office
Illinois Department of Natural Resources Office of Water Resources (OWR) Illinois State Water Survey (ISWS) Illinois Environmental Protection Agency (IEPA) Local and County Agencies Bloomington and Normal Water Reclamation District (BNSD)
Cook County Forest Preserve District (CCFP) Danville Sanitary District (DSD) City of Decatur (DCTR) City of De Kalb (DEK) Du Page County Department of Environmental Concerns (DCEC) Du Page County Forest Preserve District (DCFP) City of Joliet (JOL) Kane County Development Department (KNC) Lake in the Hills (LHILL) Lake County Public Works Department (LCPW) Lake County Stormwater Management Commission (LKC) City of Monticello (MON) Village of Oak Brook (OAK) City of Peru (PERU) City of Springfield (SPFL) City of Urbana (URB) Vermilion County Conservation District (VCC) Winnebago County (WINN)
23
For the remainder of this report, the responses from the 19 county and local agencies will be presented collectively, with the exception of the responses from the Du Page County Department of Environmental Concerns and the Kane County Development Department, each of which support a minimum of four gages.
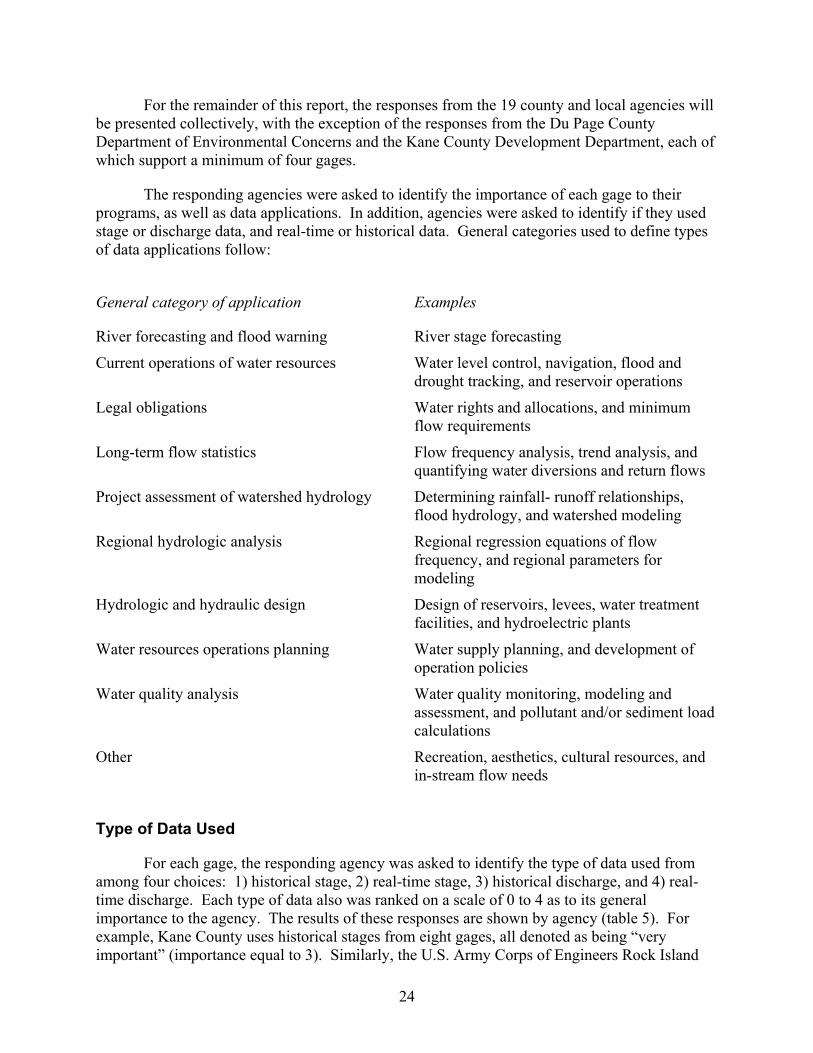
The responding agencies were asked to identify the importance of each gage to their programs, as well as data applications. In addition, agencies were asked to identify if they used stage or discharge data, and real-time or historical data. General categories used to define types of data applications follow:
General category of application Examples
River forecasting and flood warning River stage forecasting
Current operations of water resources Water level control, navigation, flood and drought tracking, and reservoir operations
Legal obligations Water rights and allocations, and minimum flow requirements
Long-term flow statistics Flow frequency analysis, trend analysis, and quantifying water diversions and return flows
Project assessment of watershed hydrology Determining rainfall- runoff relationships, flood hydrology, and watershed modeling
Regional hydrologic analysis Regional regression equations of flow frequency, and regional parameters for modeling
Hydrologic and hydraulic design Design of reservoirs, levees, water treatment facilities, and hydroelectric plants
Water resources operations planning Water supply planning, and development of operation policies
Water quality analysis Water quality monitoring, modeling and assessment, and pollutant and/or sediment load calculations
Other Recreation, aesthetics, cultural resources, and in-stream flow needs
Type of Data Used
For each gage, the responding agency was asked to identify the type of data used from among four choices: 1) historical stage, 2) real-time stage, 3) historical discharge, and 4) real-time discharge. Each type of data also was ranked on a scale of 0 to 4 as to its general importance to the agency. The results of these responses are shown by agency (table 5). For example, Kane County uses historical stages from eight gages, all denoted as being “very important” (importance equal to 3). Similarly, the U.S. Army Corps of Engineers Rock Island
24
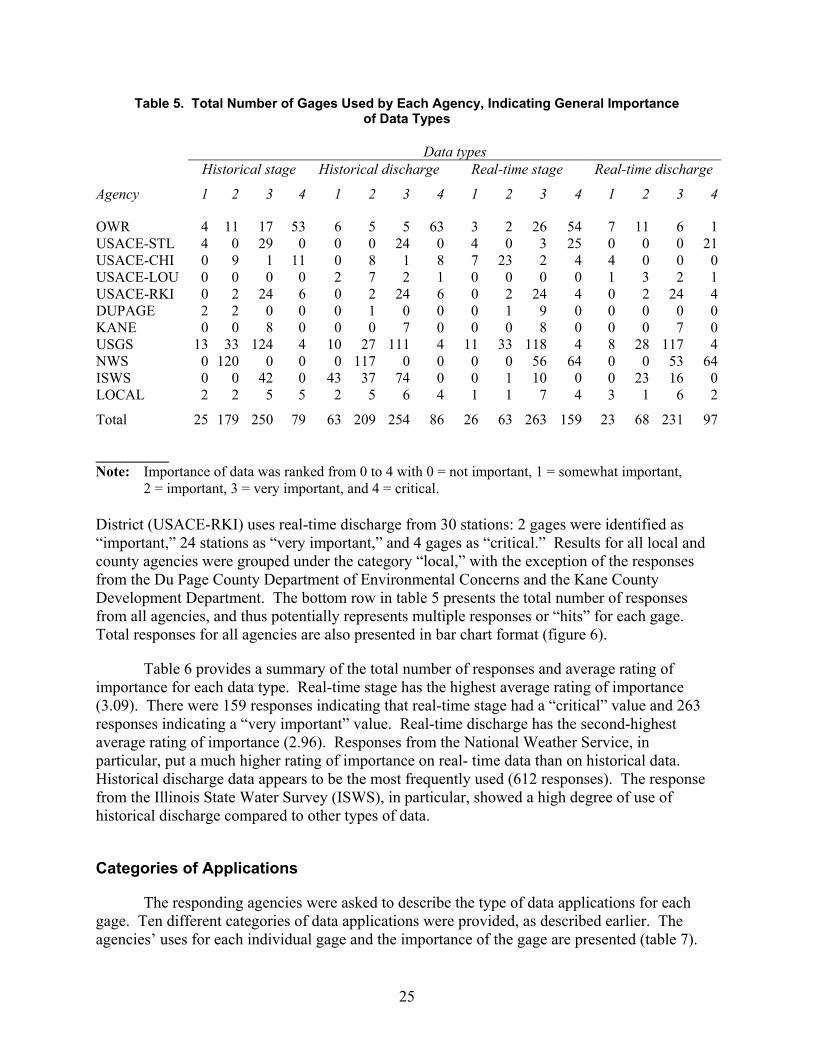
Table 5. Total Number of Gages Used by Each Agency, Indicating General Importance of Data Types
Data types Historical stage Historical discharge Real-time stage Real-time discharge
Agency 1 2 3 4 1 2 3 4 1 2 3 4 1 2 3 4
OWR 4 11 17 53 6 5 5 63 3 2 26 54 7 11 6 1USACE-STL 4 0 29 0 0 0 24 0 4 0 3 25 0 0 0 21USACE-CHI 0 9 1 11 0 8 1 8 7 23 2 4 4 0 0 0USACE-LOU 0 0 0 0 2 7 2 1 0 0 0 0 1 3 2 1USACE-RKI 0 2 24 6 0 2 24 6 0 2 24 4 0 2 24 4DUPAGE 2 2 0 0 0 1 0 0 0 1 9 0 0 0 0 0KANE 0 0 8 0 0 0 7 0 0 0 8 0 0 0 7 0USGS 13 33 124 4 10 27 111 4 11 33 118 4 8 28 117 4NWS 0 120 0 0 0 117 0 0 0 0 56 64 0 0 53 64ISWS 0 0 42 0 43 37 74 0 0 1 10 0 0 23 16 0LOCAL 2 2 5 5 2 5 6 4 1 1 7 4 3 1 6 2
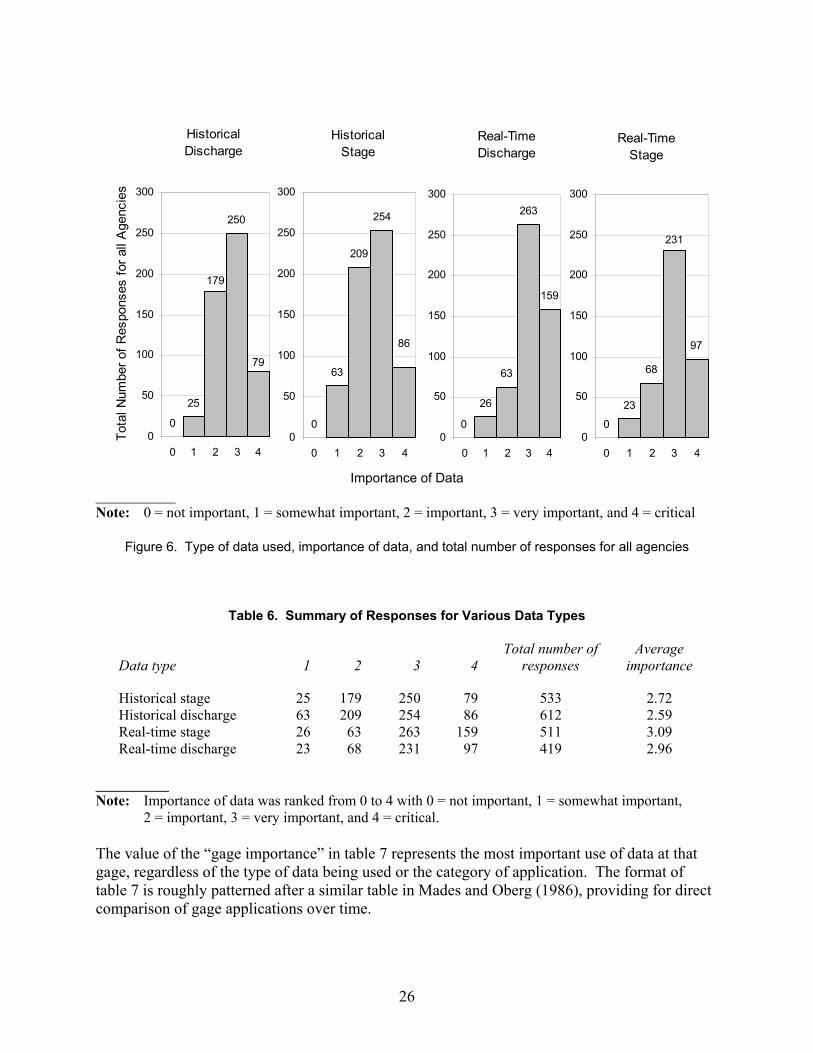
Total 25 179 250 79 63 209 254 86 26 63 263 159 23 68 231 97 __________ Note: Importance of data was ranked from 0 to 4 with 0 = not important, 1 = somewhat important,
2 = important, 3 = very important, and 4 = critical. District (USACE-RKI) uses real-time discharge from 30 stations: 2 gages were identified as “important,” 24 stations as “very important,” and 4 gages as “critical.” Results for all local and county agencies were grouped under the category “local,” with the exception of the responses from the Du Page County Department of Environmental Concerns and the Kane County Development Department. The bottom row in table 5 presents the total number of responses from all agencies, and thus potentially represents multiple responses or “hits” for each gage. Total responses for all agencies are also presented in bar chart format (figure 6).
Table 6 provides a summary of the total number of responses and average rating of importance for each data type. Real-time stage has the highest average rating of importance (3.09). There were 159 responses indicating that real-time stage had a “critical” value and 263 responses indicating a “very important” value. Real-time discharge has the second-highest average rating of importance (2.96). Responses from the National Weather Service, in particular, put a much higher rating of importance on real- time data than on historical data. Historical discharge data appears to be the most frequently used (612 responses). The response from the Illinois State Water Survey (ISWS), in particular, showed a high degree of use of historical discharge compared to other types of data.
Categories of Applications
The responding agencies were asked to describe the type of data applications for each gage. Ten different categories of data applications were provided, as described earlier. The agencies’ uses for each individual gage and the importance of the gage are presented (table 7).
25
HistoricalStage
0
63
209
254
86
0
50
100
150
200
250
300
0 1 2 3 4
HistoricalDischarge
0
25
250
179
79
0
50
100
150
200
250
300
0 1 2 3 4
Tota
l Num
ber o
f Res
pons
es fo
r all
Age
ncie
s
Real-TimeDischarge
0
26
63
263
159
0
50
100
150
200
250
300
0 1 2 3 4
Real-Time Stage
0
23
68
97
231
0
50
100
150
200
250
300
0 1 2 3 4
Importance of Data __________ Note: 0 = not important, 1 = somewhat important, 2 = important, 3 = very important, and 4 = critical
Figure 6. Type of data used, importance of data, and total number of responses for all agencies
Table 6. Summary of Responses for Various Data Types
Data type
1 2 3 4
Total number of responses
Average importance
Historical stage 25 179 250 79 533 2.72 Historical discharge 63 209 254 86 612 2.59 Real-time stage 26 63 263 159 511 3.09 Real-time discharge 23 68 231 97 419 2.96
__________ Note: Importance of data was ranked from 0 to 4 with 0 = not important, 1 = somewhat important,
2 = important, 3 = very important, and 4 = critical. The value of the “gage importance” in table 7 represents the most important use of data at that gage, regardless of the type of data being used or the category of application. The format of table 7 is roughly patterned after a similar table in Mades and Oberg (1986), providing for direct comparison of gage applications over time.
26
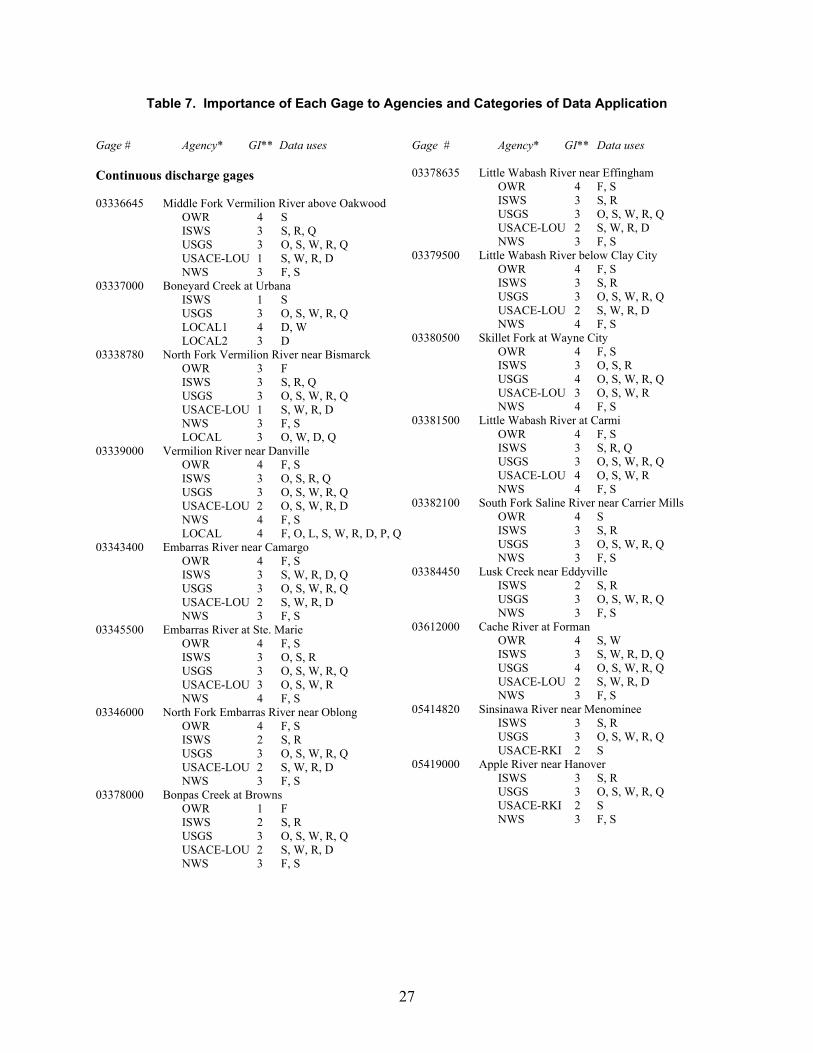
Table 7. Importance of Each Gage to Agencies and Categories of Data Application
Gage # Agency* GI** Data uses Gage # Agency* GI** Data uses
03378635 Little Wabash River near Effingham Continuous discharge gages OWR 4 F, S ISWS 3 S, R 03336645 Middle Fork Vermilion River above Oakwood USGS 3 O, S, W, R, Q OWR 4 S USACE-LOU 2 S, W, R, D ISWS 3 S, R, Q NWS 3 F, S USGS 3 O, S, W, R, Q 03379500 Little Wabash River below Clay City USACE-LOU 1 S, W, R, D OWR 4 F, S NWS 3 F, S ISWS 3 S, R 03337000 Boneyard Creek at Urbana USGS 3 O, S, W, R, Q ISWS 1 S USACE-LOU 2 S, W, R, D USGS 3 O, S, W, R, Q NWS 4 F, S LOCAL1 4 D, W 03380500 Skillet Fork at Wayne City LOCAL2 3 D OWR 4 F, S 03338780 North Fork Vermilion River near Bismarck ISWS 3 O, S, R OWR 3 F USGS 4 O, S, W, R, Q ISWS 3 S, R, Q USACE-LOU 3 O, S, W, R USGS 3 O, S, W, R, Q NWS 4 F, S USACE-LOU 1 S, W, R, D 03381500 Little Wabash River at Carmi NWS 3 F, S OWR 4 F, S LOCAL 3 O, W, D, Q ISWS 3 S, R, Q 03339000 Vermilion River near Danville USGS 3 O, S, W, R, Q OWR 4 F, S USACE-LOU 4 O, S, W, R ISWS 3 O, S, R, Q NWS 4 F, S USGS 3 O, S, W, R, Q 03382100 South Fork Saline River near Carrier Mills USACE-LOU 2 O, S, W, R, D OWR 4 S NWS 4 F, S ISWS 3 S, R LOCAL 4 F, O, L, S, W, R, D, P, Q USGS 3 O, S, W, R, Q 03343400 Embarras River near Camargo NWS 3 F, S OWR 4 F, S 03384450 Lusk Creek near Eddyville ISWS 3 S, W, R, D, Q ISWS 2 S, R USGS 3 O, S, W, R, Q USGS 3 O, S, W, R, Q USACE-LOU 2 S, W, R, D NWS 3 F, S NWS 3 F, S 03612000 Cache River at Forman 03345500 Embarras River at Ste. Marie OWR 4 S, W OWR 4 F, S ISWS 3 S, W, R, D, Q ISWS 3 O, S, R USGS 4 O, S, W, R, Q USGS 3 O, S, W, R, Q USACE-LOU 2 S, W, R, D USACE-LOU 3 O, S, W, R NWS 3 F, S NWS 4 F, S 05414820 Sinsinawa River near Menominee 03346000 North Fork Embarras River near Oblong ISWS 3 S, R OWR 4 F, S USGS 3 O, S, W, R, Q ISWS 2 S, R USACE-RKI 2 S USGS 3 O, S, W, R, Q 05419000 Apple River near Hanover USACE-LOU 2 S, W, R, D ISWS 3 S, R NWS 3 F, S USGS 3 O, S, W, R, Q 03378000 Bonpas Creek at Browns USACE-RKI 2 S OWR 1 F NWS 3 F, S ISWS 2 S, R USGS 3 O, S, W, R, Q
USACE-LOU 2 S, W, R, D NWS 3 F, S
27
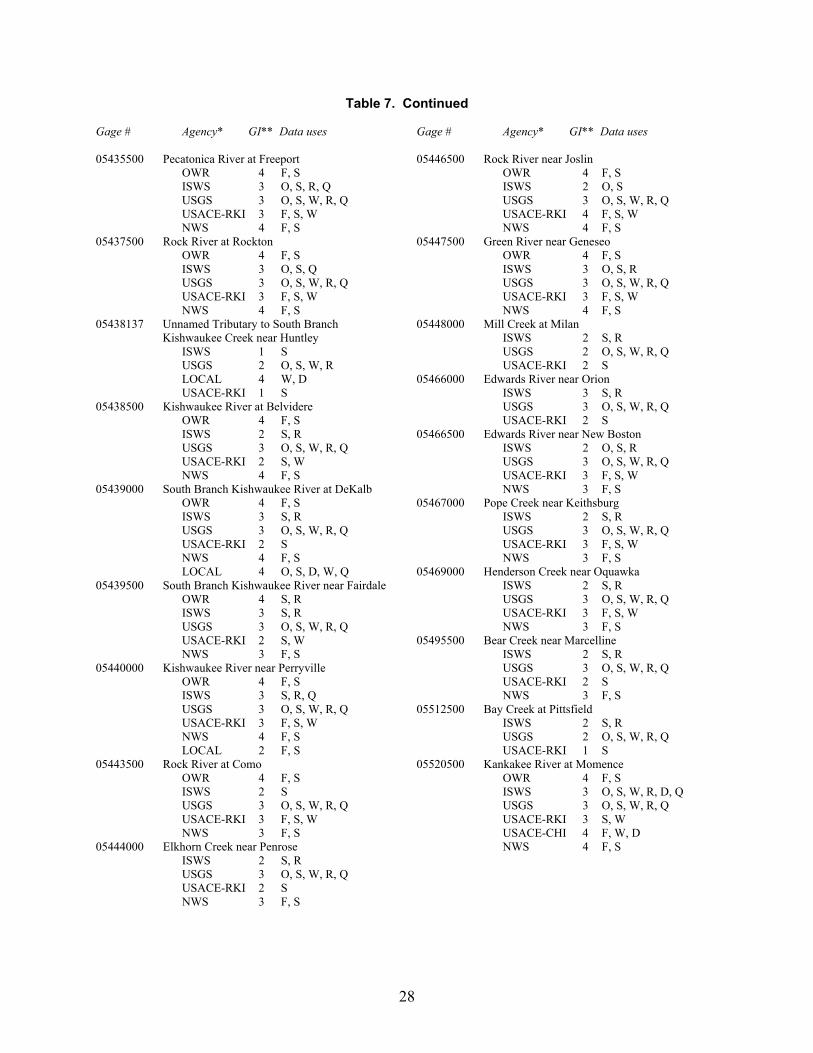
Table 7. Continued Gage # Agency* GI** Data uses 05435500 Pecatonica River at Freeport OWR 4 F, S ISWS 3 O, S, R, Q USGS 3 O, S, W, R, Q USACE-RKI 3 F, S, W NWS 4 F, S 05437500 Rock River at Rockton OWR 4 F, S ISWS 3 O, S, Q USGS 3 O, S, W, R, Q USACE-RKI 3 F, S, W NWS 4 F, S 05438137 Unnamed Tributary to South Branch
Kishwaukee Creek near Huntley ISWS 1 S USGS 2 O, S, W, R LOCAL 4 W, D USACE-RKI 1 S 05438500 Kishwaukee River at Belvidere OWR 4 F, S ISWS 2 S, R USGS 3 O, S, W, R, Q USACE-RKI 2 S, W NWS 4 F, S 05439000 South Branch Kishwaukee River at DeKalb OWR 4 F, S ISWS 3 S, R USGS 3 O, S, W, R, Q USACE-RKI 2 S NWS 4 F, S LOCAL 4 O, S, D, W, Q 05439500 South Branch Kishwaukee River near Fairdale OWR 4 S, R ISWS 3 S, R USGS 3 O, S, W, R, Q USACE-RKI 2 S, W NWS 3 F, S 05440000 Kishwaukee River near Perryville OWR 4 F, S ISWS 3 S, R, Q USGS 3 O, S, W, R, Q USACE-RKI 3 F, S, W NWS 4 F, S LOCAL 2 F, S 05443500 Rock River at Como OWR 4 F, S
ISWS 2 S USGS 3 O, S, W, R, Q
USACE-RKI 3 F, S, W NWS 3 F, S 05444000 Elkhorn Creek near Penrose ISWS 2 S, R USGS 3 O, S, W, R, Q USACE-RKI 2 S NWS 3 F, S
Gage # Agency* GI** Data uses 05446500 Rock River near Joslin OWR 4 F, S ISWS 2 O, S USGS 3 O, S, W, R, Q USACE-RKI 4 F, S, W NWS 4 F, S 05447500 Green River near Geneseo OWR 4 F, S ISWS 3 O, S, R USGS 3 O, S, W, R, Q USACE-RKI 3 F, S, W NWS 4 F, S 05448000 Mill Creek at Milan ISWS 2 S, R USGS 2 O, S, W, R, Q USACE-RKI 2 S 05466000 Edwards River near Orion ISWS 3 S, R USGS 3 O, S, W, R, Q USACE-RKI 2 S 05466500 Edwards River near New Boston ISWS 2 O, S, R USGS 3 O, S, W, R, Q USACE-RKI 3 F, S, W NWS 3 F, S 05467000 Pope Creek near Keithsburg ISWS 2 S, R USGS 3 O, S, W, R, Q USACE-RKI 3 F, S, W NWS 3 F, S 05469000 Henderson Creek near Oquawka ISWS 2 S, R USGS 3 O, S, W, R, Q USACE-RKI 3 F, S, W NWS 3 F, S 05495500 Bear Creek near Marcelline ISWS 2 S, R USGS 3 O, S, W, R, Q USACE-RKI 2 S NWS 3 F, S 05512500 Bay Creek at Pittsfield ISWS 2 S, R USGS 2 O, S, W, R, Q USACE-RKI 1 S 05520500 Kankakee River at Momence OWR 4 F, S ISWS 3 O, S, W, R, D, Q USGS 3 O, S, W, R, Q USACE-RKI 3 S, W USACE-CHI 4 F, W, D NWS 4 F, S
28
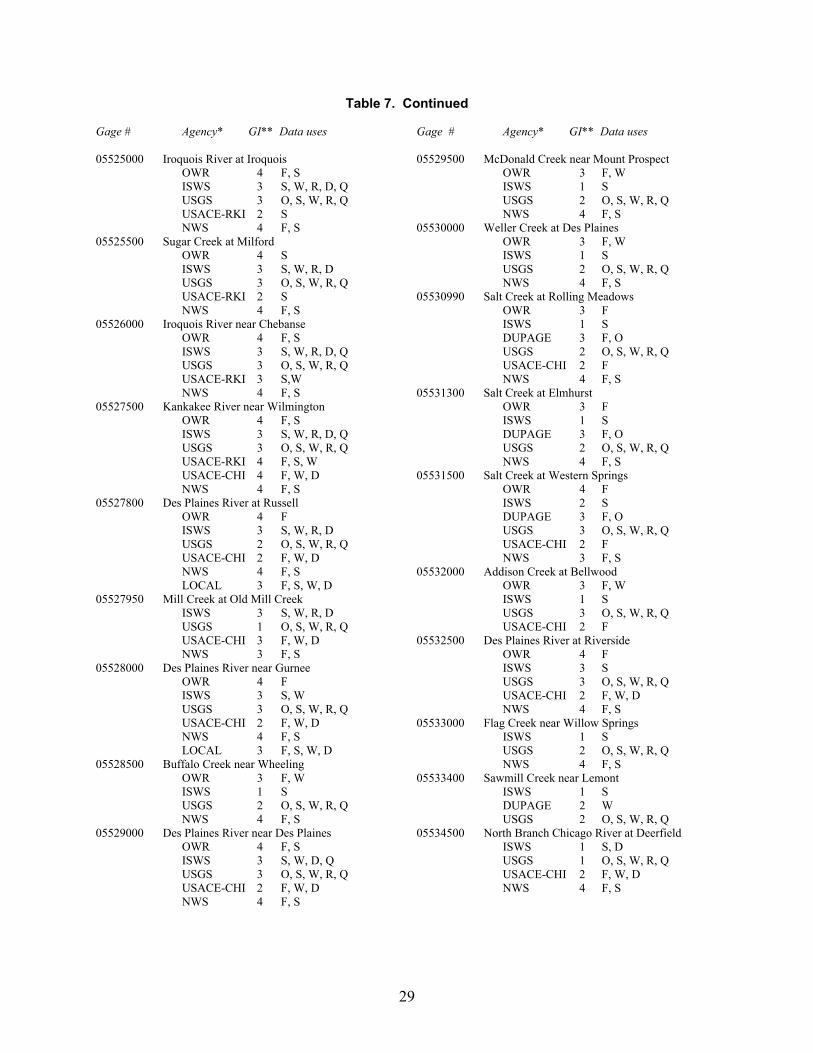
Table 7. Continued Gage # Agency* GI** Data uses 05525000 Iroquois River at Iroquois OWR 4 F, S ISWS 3 S, W, R, D, Q USGS 3 O, S, W, R, Q USACE-RKI 2 S NWS 4 F, S 05525500 Sugar Creek at Milford OWR 4 S ISWS 3 S, W, R, D USGS 3 O, S, W, R, Q USACE-RKI 2 S NWS 4 F, S 05526000 Iroquois River near Chebanse OWR 4 F, S ISWS 3 S, W, R, D, Q USGS 3 O, S, W, R, Q USACE-RKI 3 S,W NWS 4 F, S 05527500 Kankakee River near Wilmington OWR 4 F, S ISWS 3 S, W, R, D, Q USGS 3 O, S, W, R, Q USACE-RKI 4 F, S, W USACE-CHI 4 F, W, D NWS 4 F, S 05527800 Des Plaines River at Russell OWR 4 F ISWS 3 S, W, R, D USGS 2 O, S, W, R, Q USACE-CHI 2 F, W, D NWS 4 F, S LOCAL 3 F, S, W, D 05527950 Mill Creek at Old Mill Creek ISWS 3 S, W, R, D USGS 1 O, S, W, R, Q USACE-CHI 3 F, W, D NWS 3 F, S 05528000 Des Plaines River near Gurnee OWR 4 F ISWS 3 S, W USGS 3 O, S, W, R, Q USACE-CHI 2 F, W, D NWS 4 F, S LOCAL 3 F, S, W, D 05528500 Buffalo Creek near Wheeling OWR 3 F, W ISWS 1 S USGS 2 O, S, W, R, Q NWS 4 F, S 05529000 Des Plaines River near Des Plaines OWR 4 F, S ISWS 3 S, W, D, Q USGS 3 O, S, W, R, Q USACE-CHI 2 F, W, D NWS 4 F, S
Gage # Agency* GI** Data uses 05529500 McDonald Creek near Mount Prospect OWR 3 F, W ISWS 1 S USGS 2 O, S, W, R, Q NWS 4 F, S 05530000 Weller Creek at Des Plaines OWR 3 F, W ISWS 1 S USGS 2 O, S, W, R, Q NWS 4 F, S 05530990 Salt Creek at Rolling Meadows OWR 3 F ISWS 1 S DUPAGE 3 F, O USGS 2 O, S, W, R, Q USACE-CHI 2 F NWS 4 F, S 05531300 Salt Creek at Elmhurst OWR 3 F ISWS 1 S DUPAGE 3 F, O USGS 2 O, S, W, R, Q NWS 4 F, S 05531500 Salt Creek at Western Springs OWR 4 F ISWS 2 S DUPAGE 3 F, O USGS 3 O, S, W, R, Q USACE-CHI 2 F NWS 3 F, S 05532000 Addison Creek at Bellwood OWR 3 F, W ISWS 1 S USGS 3 O, S, W, R, Q USACE-CHI 2 F 05532500 Des Plaines River at Riverside OWR 4 F ISWS 3 S USGS 3 O, S, W, R, Q USACE-CHI 2 F, W, D NWS 4 F, S 05533000 Flag Creek near Willow Springs ISWS 1 S USGS 2 O, S, W, R, Q NWS 4 F, S 05533400 Sawmill Creek near Lemont ISWS 1 S DUPAGE 2 W USGS 2 O, S, W, R, Q 05534500 North Branch Chicago River at Deerfield ISWS 1 S, D USGS 1 O, S, W, R, Q USACE-CHI 2 F, W, D NWS 4 F, S
29
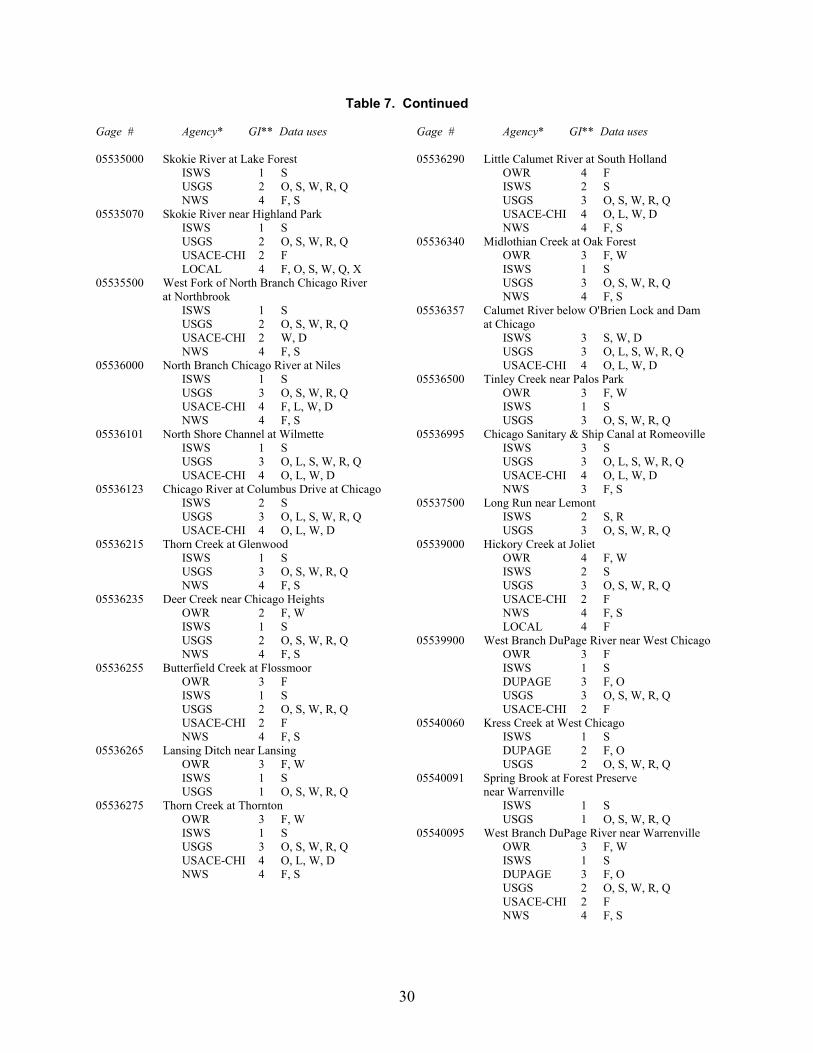
Table 7. Continued Gage # Agency* GI** Data uses 05535000 Skokie River at Lake Forest ISWS 1 S USGS 2 O, S, W, R, Q NWS 4 F, S 05535070 Skokie River near Highland Park ISWS 1 S USGS 2 O, S, W, R, Q USACE-CHI 2 F LOCAL 4 F, O, S, W, Q, X 05535500 West Fork of North Branch Chicago River
at Northbrook ISWS 1 S USGS 2 O, S, W, R, Q USACE-CHI 2 W, D NWS 4 F, S 05536000 North Branch Chicago River at Niles ISWS 1 S USGS 3 O, S, W, R, Q USACE-CHI 4 F, L, W, D NWS 4 F, S 05536101 North Shore Channel at Wilmette ISWS 1 S USGS 3 O, L, S, W, R, Q USACE-CHI 4 O, L, W, D 05536123 Chicago River at Columbus Drive at Chicago ISWS 2 S USGS 3 O, L, S, W, R, Q USACE-CHI 4 O, L, W, D 05536215 Thorn Creek at Glenwood ISWS 1 S USGS 3 O, S, W, R, Q NWS 4 F, S 05536235 Deer Creek near Chicago Heights OWR 2 F, W ISWS 1 S USGS 2 O, S, W, R, Q NWS 4 F, S 05536255 Butterfield Creek at Flossmoor OWR 3 F ISWS 1 S USGS 2 O, S, W, R, Q USACE-CHI 2 F NWS 4 F, S 05536265 Lansing Ditch near Lansing OWR 3 F, W ISWS 1 S USGS 1 O, S, W, R, Q 05536275 Thorn Creek at Thornton OWR 3 F, W ISWS 1 S USGS 3 O, S, W, R, Q USACE-CHI 4 O, L, W, D NWS 4 F, S
Gage # Agency* GI** Data uses 05536290 Little Calumet River at South Holland OWR 4 F ISWS 2 S USGS 3 O, S, W, R, Q USACE-CHI 4 O, L, W, D NWS 4 F, S 05536340 Midlothian Creek at Oak Forest OWR 3 F, W ISWS 1 S USGS 3 O, S, W, R, Q NWS 4 F, S 05536357 Calumet River below O'Brien Lock and Dam at Chicago ISWS 3 S, W, D USGS 3 O, L, S, W, R, Q USACE-CHI 4 O, L, W, D 05536500 Tinley Creek near Palos Park OWR 3 F, W ISWS 1 S USGS 3 O, S, W, R, Q 05536995 Chicago Sanitary & Ship Canal at Romeoville ISWS 3 S USGS 3 O, L, S, W, R, Q USACE-CHI 4 O, L, W, D NWS 3 F, S 05537500 Long Run near Lemont ISWS 2 S, R USGS 3 O, S, W, R, Q 05539000 Hickory Creek at Joliet OWR 4 F, W ISWS 2 S USGS 3 O, S, W, R, Q USACE-CHI 2 F NWS 4 F, S LOCAL 4 F 05539900 West Branch DuPage River near West Chicago OWR 3 F ISWS 1 S DUPAGE 3 F, O USGS 3 O, S, W, R, Q USACE-CHI 2 F 05540060 Kress Creek at West Chicago ISWS 1 S DUPAGE 2 F, O USGS 2 O, S, W, R, Q 05540091 Spring Brook at Forest Preserve
near Warrenville ISWS 1 S USGS 1 O, S, W, R, Q 05540095 West Branch DuPage River near Warrenville OWR 3 F, W ISWS 1 S DUPAGE 3 F, O USGS 2 O, S, W, R, Q USACE-CHI 2 F NWS 4 F, S
30
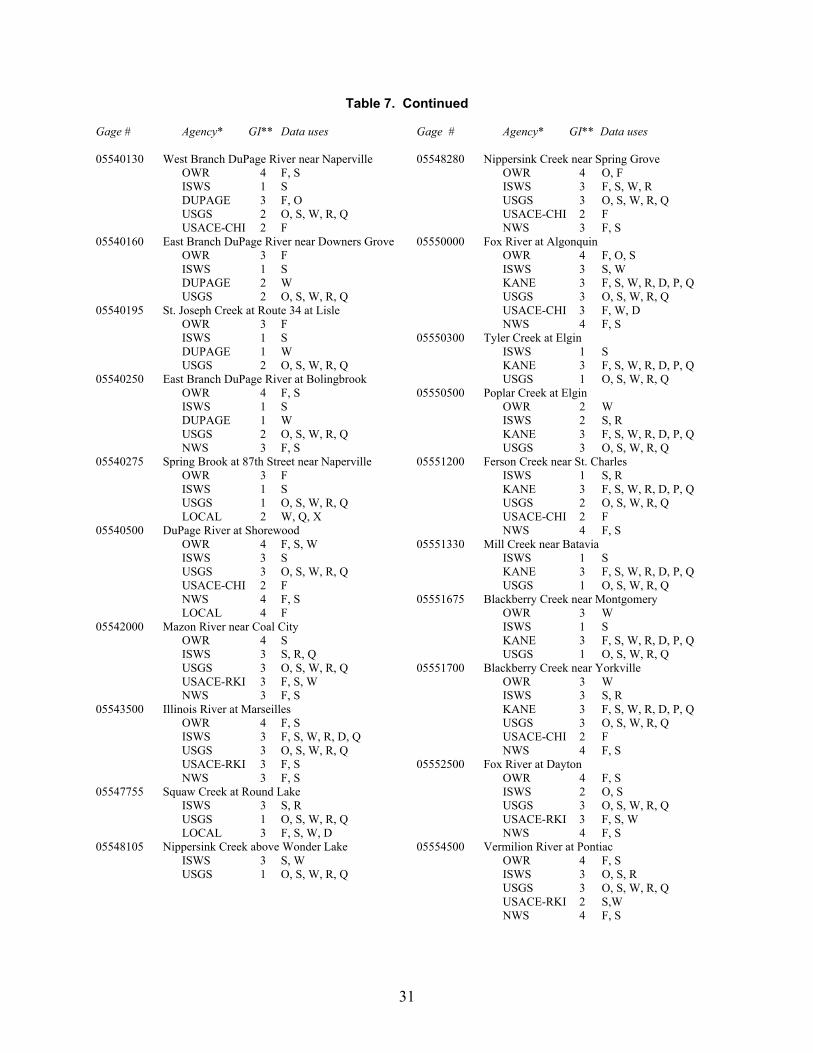
Table 7. Continued Gage # Agency* GI** Data uses 05540130 West Branch DuPage River near Naperville OWR 4 F, S ISWS 1 S DUPAGE 3 F, O USGS 2 O, S, W, R, Q USACE-CHI 2 F 05540160 East Branch DuPage River near Downers Grove OWR 3 F ISWS 1 S DUPAGE 2 W USGS 2 O, S, W, R, Q 05540195 St. Joseph Creek at Route 34 at Lisle OWR 3 F ISWS 1 S DUPAGE 1 W USGS 2 O, S, W, R, Q 05540250 East Branch DuPage River at Bolingbrook OWR 4 F, S ISWS 1 S DUPAGE 1 W USGS 2 O, S, W, R, Q NWS 3 F, S 05540275 Spring Brook at 87th Street near Naperville OWR 3 F ISWS 1 S USGS 1 O, S, W, R, Q LOCAL 2 W, Q, X 05540500 DuPage River at Shorewood OWR 4 F, S, W ISWS 3 S USGS 3 O, S, W, R, Q USACE-CHI 2 F NWS 4 F, S LOCAL 4 F 05542000 Mazon River near Coal City OWR 4 S ISWS 3 S, R, Q USGS 3 O, S, W, R, Q USACE-RKI 3 F, S, W NWS 3 F, S 05543500 Illinois River at Marseilles OWR 4 F, S ISWS 3 F, S, W, R, D, Q USGS 3 O, S, W, R, Q USACE-RKI 3 F, S NWS 3 F, S 05547755 Squaw Creek at Round Lake ISWS 3 S, R USGS 1 O, S, W, R, Q LOCAL 3 F, S, W, D 05548105 Nippersink Creek above Wonder Lake ISWS 3 S, W USGS 1 O, S, W, R, Q
Gage # Agency* GI** Data uses 05548280 Nippersink Creek near Spring Grove OWR 4 O, F ISWS 3 F, S, W, R USGS 3 O, S, W, R, Q USACE-CHI 2 F NWS 3 F, S 05550000 Fox River at Algonquin OWR 4 F, O, S ISWS 3 S, W KANE 3 F, S, W, R, D, P, Q USGS 3 O, S, W, R, Q USACE-CHI 3 F, W, D NWS 4 F, S 05550300 Tyler Creek at Elgin ISWS 1 S KANE 3 F, S, W, R, D, P, Q USGS 1 O, S, W, R, Q 05550500 Poplar Creek at Elgin OWR 2 W ISWS 2 S, R KANE 3 F, S, W, R, D, P, Q USGS 3 O, S, W, R, Q 05551200 Ferson Creek near St. Charles ISWS 1 S, R KANE 3 F, S, W, R, D, P, Q USGS 2 O, S, W, R, Q USACE-CHI 2 F NWS 4 F, S 05551330 Mill Creek near Batavia ISWS 1 S KANE 3 F, S, W, R, D, P, Q USGS 1 O, S, W, R, Q 05551675 Blackberry Creek near Montgomery OWR 3 W ISWS 1 S KANE 3 F, S, W, R, D, P, Q USGS 1 O, S, W, R, Q 05551700 Blackberry Creek near Yorkville OWR 3 W ISWS 3 S, R KANE 3 F, S, W, R, D, P, Q USGS 3 O, S, W, R, Q USACE-CHI 2 F NWS 4 F, S 05552500 Fox River at Dayton OWR 4 F, S ISWS 2 O, S USGS 3 O, S, W, R, Q USACE-RKI 3 F, S, W NWS 4 F, S 05554500 Vermilion River at Pontiac OWR 4 F, S ISWS 3 O, S, R USGS 3 O, S, W, R, Q USACE-RKI 2 S,W NWS 4 F, S
31
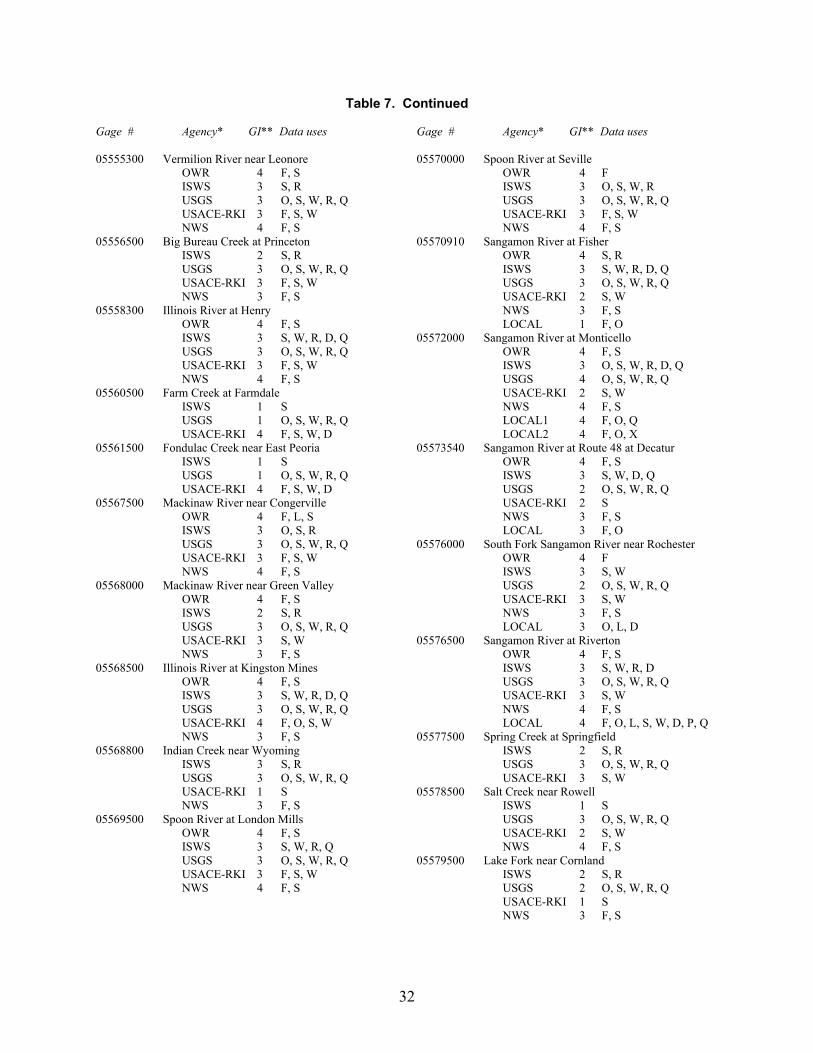
Table 7. Continued Gage # Agency* GI** Data uses 05555300 Vermilion River near Leonore OWR 4 F, S ISWS 3 S, R USGS 3 O, S, W, R, Q USACE-RKI 3 F, S, W NWS 4 F, S 05556500 Big Bureau Creek at Princeton ISWS 2 S, R USGS 3 O, S, W, R, Q USACE-RKI 3 F, S, W NWS 3 F, S 05558300 Illinois River at Henry OWR 4 F, S ISWS 3 S, W, R, D, Q USGS 3 O, S, W, R, Q USACE-RKI 3 F, S, W NWS 4 F, S 05560500 Farm Creek at Farmdale ISWS 1 S USGS 1 O, S, W, R, Q USACE-RKI 4 F, S, W, D 05561500 Fondulac Creek near East Peoria ISWS 1 S USGS 1 O, S, W, R, Q USACE-RKI 4 F, S, W, D 05567500 Mackinaw River near Congerville OWR 4 F, L, S ISWS 3 O, S, R USGS 3 O, S, W, R, Q USACE-RKI 3 F, S, W NWS 4 F, S 05568000 Mackinaw River near Green Valley OWR 4 F, S ISWS 2 S, R USGS 3 O, S, W, R, Q USACE-RKI 3 S, W NWS 3 F, S 05568500 Illinois River at Kingston Mines OWR 4 F, S ISWS 3 S, W, R, D, Q USGS 3 O, S, W, R, Q USACE-RKI 4 F, O, S, W NWS 3 F, S 05568800 Indian Creek near Wyoming ISWS 3 S, R USGS 3 O, S, W, R, Q USACE-RKI 1 S NWS 3 F, S 05569500 Spoon River at London Mills OWR 4 F, S ISWS 3 S, W, R, Q USGS 3 O, S, W, R, Q USACE-RKI 3 F, S, W NWS 4 F, S
Gage # Agency* GI** Data uses 05570000 Spoon River at Seville OWR 4 F ISWS 3 O, S, W, R USGS 3 O, S, W, R, Q USACE-RKI 3 F, S, W NWS 4 F, S 05570910 Sangamon River at Fisher OWR 4 S, R ISWS 3 S, W, R, D, Q USGS 3 O, S, W, R, Q USACE-RKI 2 S, W NWS 3 F, S LOCAL 1 F, O 05572000 Sangamon River at Monticello OWR 4 F, S ISWS 3 O, S, W, R, D, Q USGS 4 O, S, W, R, Q USACE-RKI 2 S, W NWS 4 F, S LOCAL1 4 F, O, Q LOCAL2 4 F, O, X 05573540 Sangamon River at Route 48 at Decatur OWR 4 F, S ISWS 3 S, W, D, Q USGS 2 O, S, W, R, Q USACE-RKI 2 S NWS 3 F, S LOCAL 3 F, O 05576000 South Fork Sangamon River near Rochester OWR 4 F ISWS 3 S, W USGS 2 O, S, W, R, Q USACE-RKI 3 S, W NWS 3 F, S LOCAL 3 O, L, D 05576500 Sangamon River at Riverton OWR 4 F, S ISWS 3 S, W, R, D USGS 3 O, S, W, R, Q USACE-RKI 3 S, W NWS 4 F, S LOCAL 4 F, O, L, S, W, D, P, Q 05577500 Spring Creek at Springfield ISWS 2 S, R USGS 3 O, S, W, R, Q USACE-RKI 3 S, W 05578500 Salt Creek near Rowell ISWS 1 S USGS 3 O, S, W, R, Q USACE-RKI 2 S, W NWS 4 F, S 05579500 Lake Fork near Cornland ISWS 2 S, R USGS 2 O, S, W, R, Q USACE-RKI 1 S NWS 3 F, S
32
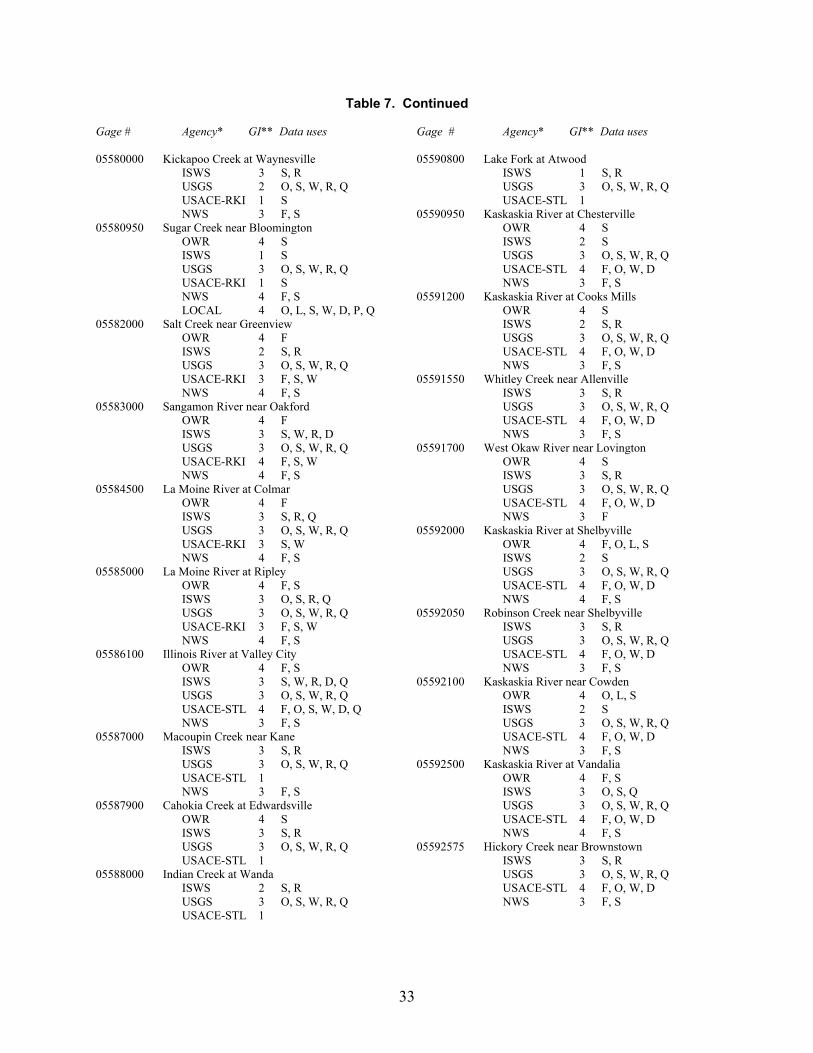
Table 7. Continued Gage # Agency* GI** Data uses 05580000 Kickapoo Creek at Waynesville ISWS 3 S, R USGS 2 O, S, W, R, Q USACE-RKI 1 S NWS 3 F, S 05580950 Sugar Creek near Bloomington OWR 4 S ISWS 1 S USGS 3 O, S, W, R, Q USACE-RKI 1 S NWS 4 F, S LOCAL 4 O, L, S, W, D, P, Q 05582000 Salt Creek near Greenview OWR 4 F ISWS 2 S, R USGS 3 O, S, W, R, Q USACE-RKI 3 F, S, W NWS 4 F, S 05583000 Sangamon River near Oakford OWR 4 F ISWS 3 S, W, R, D USGS 3 O, S, W, R, Q USACE-RKI 4 F, S, W NWS 4 F, S 05584500 La Moine River at Colmar OWR 4 F ISWS 3 S, R, Q USGS 3 O, S, W, R, Q USACE-RKI 3 S, W NWS 4 F, S 05585000 La Moine River at Ripley OWR 4 F, S ISWS 3 O, S, R, Q USGS 3 O, S, W, R, Q USACE-RKI 3 F, S, W NWS 4 F, S 05586100 Illinois River at Valley City OWR 4 F, S ISWS 3 S, W, R, D, Q USGS 3 O, S, W, R, Q USACE-STL 4 F, O, S, W, D, Q NWS 3 F, S 05587000 Macoupin Creek near Kane ISWS 3 S, R USGS 3 O, S, W, R, Q USACE-STL 1 NWS 3 F, S 05587900 Cahokia Creek at Edwardsville OWR 4 S ISWS 3 S, R USGS 3 O, S, W, R, Q USACE-STL 1 05588000 Indian Creek at Wanda ISWS 2 S, R USGS 3 O, S, W, R, Q USACE-STL 1
Gage # Agency* GI** Data uses 05590800 Lake Fork at Atwood ISWS 1 S, R USGS 3 O, S, W, R, Q USACE-STL 1 05590950 Kaskaskia River at Chesterville OWR 4 S ISWS 2 S USGS 3 O, S, W, R, Q USACE-STL 4 F, O, W, D NWS 3 F, S 05591200 Kaskaskia River at Cooks Mills OWR 4 S ISWS 2 S, R USGS 3 O, S, W, R, Q USACE-STL 4 F, O, W, D NWS 3 F, S 05591550 Whitley Creek near Allenville ISWS 3 S, R USGS 3 O, S, W, R, Q USACE-STL 4 F, O, W, D NWS 3 F, S 05591700 West Okaw River near Lovington OWR 4 S ISWS 3 S, R USGS 3 O, S, W, R, Q USACE-STL 4 F, O, W, D NWS 3 F 05592000 Kaskaskia River at Shelbyville OWR 4 F, O, L, S ISWS 2 S USGS 3 O, S, W, R, Q USACE-STL 4 F, O, W, D NWS 4 F, S 05592050 Robinson Creek near Shelbyville ISWS 3 S, R USGS 3 O, S, W, R, Q USACE-STL 4 F, O, W, D NWS 3 F, S 05592100 Kaskaskia River near Cowden OWR 4 O, L, S ISWS 2 S USGS 3 O, S, W, R, Q USACE-STL 4 F, O, W, D NWS 3 F, S 05592500 Kaskaskia River at Vandalia OWR 4 F, S ISWS 3 O, S, Q USGS 3 O, S, W, R, Q USACE-STL 4 F, O, W, D NWS 4 F, S 05592575 Hickory Creek near Brownstown ISWS 3 S, R USGS 3 O, S, W, R, Q USACE-STL 4 F, O, W, D NWS 3 F, S
33
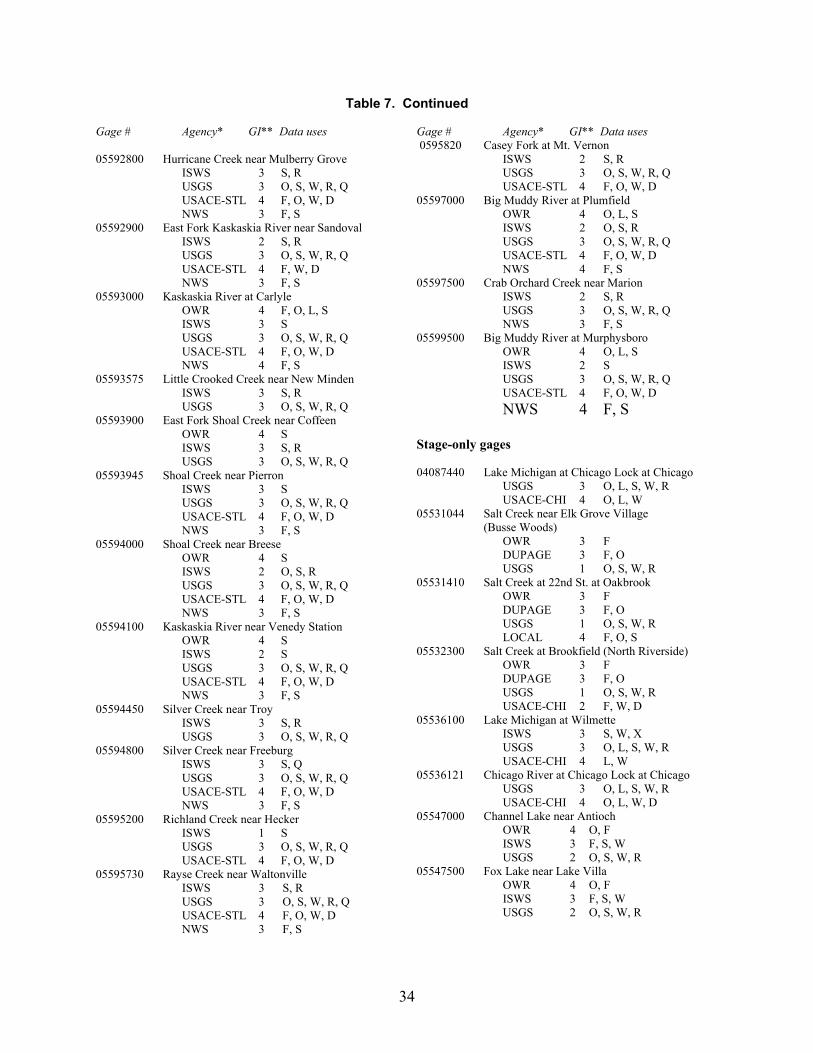
Table 7. Continued Gage # Agency* GI** Data uses 05592800 Hurricane Creek near Mulberry Grove ISWS 3 S, R USGS 3 O, S, W, R, Q USACE-STL 4 F, O, W, D NWS 3 F, S 05592900 East Fork Kaskaskia River near Sandoval ISWS 2 S, R USGS 3 O, S, W, R, Q USACE-STL 4 F, W, D NWS 3 F, S 05593000 Kaskaskia River at Carlyle OWR 4 F, O, L, S ISWS 3 S USGS 3 O, S, W, R, Q USACE-STL 4 F, O, W, D NWS 4 F, S 05593575 Little Crooked Creek near New Minden ISWS 3 S, R USGS 3 O, S, W, R, Q 05593900 East Fork Shoal Creek near Coffeen OWR 4 S ISWS 3 S, R USGS 3 O, S, W, R, Q 05593945 Shoal Creek near Pierron ISWS 3 S USGS 3 O, S, W, R, Q USACE-STL 4 F, O, W, D NWS 3 F, S 05594000 Shoal Creek near Breese OWR 4 S ISWS 2 O, S, R USGS 3 O, S, W, R, Q USACE-STL 4 F, O, W, D NWS 3 F, S 05594100 Kaskaskia River near Venedy Station OWR 4 S ISWS 2 S USGS 3 O, S, W, R, Q USACE-STL 4 F, O, W, D NWS 3 F, S 05594450 Silver Creek near Troy ISWS 3 S, R USGS 3 O, S, W, R, Q 05594800 Silver Creek near Freeburg ISWS 3 S, Q USGS 3 O, S, W, R, Q USACE-STL 4 F, O, W, D NWS 3 F, S 05595200 Richland Creek near Hecker ISWS 1 S USGS 3 O, S, W, R, Q USACE-STL 4 F, O, W, D 05595730 Rayse Creek near Waltonville ISWS 3 S, R USGS 3 O, S, W, R, Q USACE-STL 4 F, O, W, D NWS 3 F, S
Gage # Agency* GI** Data uses 0595820 Casey Fork at Mt. Vernon ISWS 2 S, R USGS 3 O, S, W, R, Q USACE-STL 4 F, O, W, D 05597000 Big Muddy River at Plumfield OWR 4 O, L, S ISWS 2 O, S, R USGS 3 O, S, W, R, Q USACE-STL 4 F, O, W, D NWS 4 F, S 05597500 Crab Orchard Creek near Marion ISWS 2 S, R USGS 3 O, S, W, R, Q NWS 3 F, S 05599500 Big Muddy River at Murphysboro OWR 4 O, L, S ISWS 2 S USGS 3 O, S, W, R, Q USACE-STL 4 F, O, W, D NWS 4 F, S Stage-only gages 04087440 Lake Michigan at Chicago Lock at Chicago USGS 3 O, L, S, W, R USACE-CHI 4 O, L, W 05531044 Salt Creek near Elk Grove Village (Busse Woods) OWR 3 F DUPAGE 3 F, O USGS 1 O, S, W, R 05531410 Salt Creek at 22nd St. at Oakbrook OWR 3 F DUPAGE 3 F, O USGS 1 O, S, W, R LOCAL 4 F, O, S 05532300 Salt Creek at Brookfield (North Riverside) OWR 3 F DUPAGE 3 F, O USGS 1 O, S, W, R USACE-CHI 2 F, W, D 05536100 Lake Michigan at Wilmette ISWS 3 S, W, X USGS 3 O, L, S, W, R USACE-CHI 4 L, W 05536121 Chicago River at Chicago Lock at Chicago USGS 3 O, L, S, W, R USACE-CHI 4 O, L, W, D 05547000 Channel Lake near Antioch OWR 4 O, F ISWS 3 F, S, W USGS 2 O, S, W, R 05547500 Fox Lake near Lake Villa OWR 4 O, F ISWS 3 F, S, W USGS 2 O, S, W, R
34
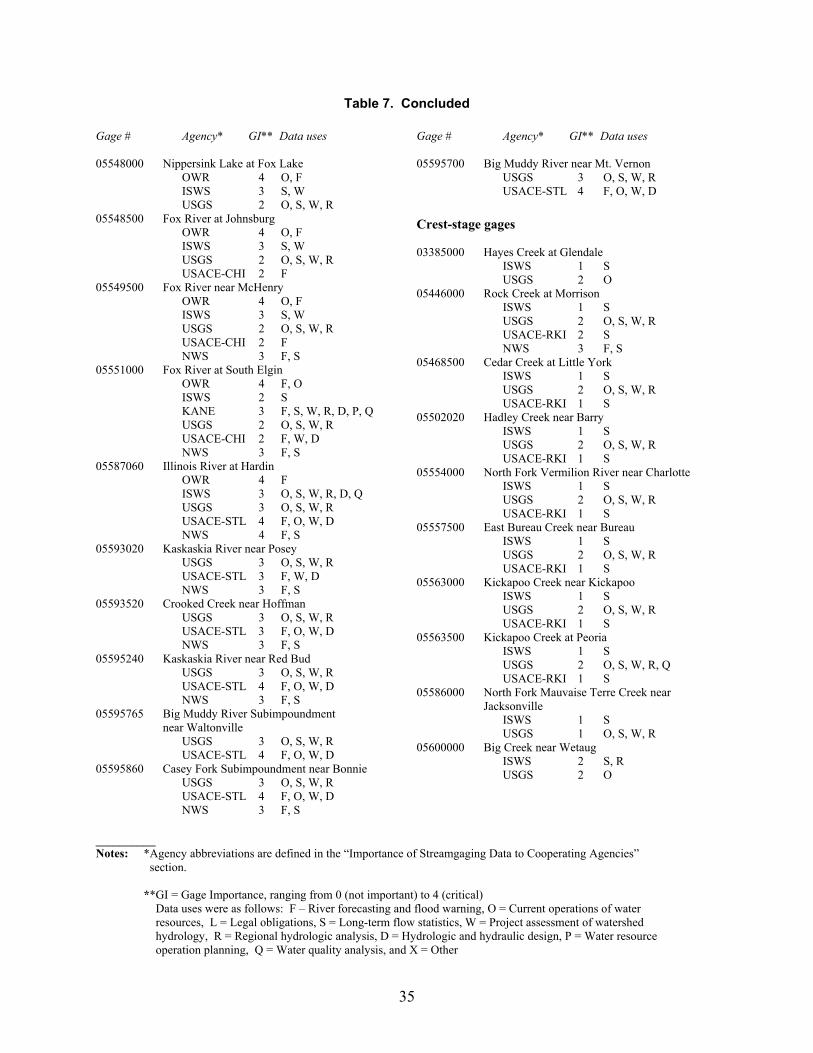
Table 7. Concluded Gage # Agency* GI** Data uses 05548000 Nippersink Lake at Fox Lake OWR 4 O, F ISWS 3 S, W USGS 2 O, S, W, R 05548500 Fox River at Johnsburg OWR 4 O, F ISWS 3 S, W USGS 2 O, S, W, R USACE-CHI 2 F 05549500 Fox River near McHenry OWR 4 O, F ISWS 3 S, W USGS 2 O, S, W, R USACE-CHI 2 F NWS 3 F, S 05551000 Fox River at South Elgin OWR 4 F, O ISWS 2 S KANE 3 F, S, W, R, D, P, Q USGS 2 O, S, W, R USACE-CHI 2 F, W, D NWS 3 F, S 05587060 Illinois River at Hardin OWR 4 F ISWS 3 O, S, W, R, D, Q USGS 3 O, S, W, R USACE-STL 4 F, O, W, D NWS 4 F, S 05593020 Kaskaskia River near Posey USGS 3 O, S, W, R USACE-STL 3 F, W, D NWS 3 F, S 05593520 Crooked Creek near Hoffman USGS 3 O, S, W, R USACE-STL 3 F, O, W, D NWS 3 F, S 05595240 Kaskaskia River near Red Bud USGS 3 O, S, W, R USACE-STL 4 F, O, W, D NWS 3 F, S 05595765 Big Muddy River Subimpoundment near Waltonville USGS 3 O, S, W, R USACE-STL 4 F, O, W, D 05595860 Casey Fork Subimpoundment near Bonnie USGS 3 O, S, W, R USACE-STL 4 F, O, W, D NWS 3 F, S
Gage # Agency* GI** Data uses 05595700 Big Muddy River near Mt. Vernon USGS 3 O, S, W, R USACE-STL 4 F, O, W, D Crest-stage gages 03385000 Hayes Creek at Glendale ISWS 1 S USGS 2 O 05446000 Rock Creek at Morrison ISWS 1 S USGS 2 O, S, W, R USACE-RKI 2 S NWS 3 F, S 05468500 Cedar Creek at Little York ISWS 1 S USGS 2 O, S, W, R USACE-RKI 1 S 05502020 Hadley Creek near Barry ISWS 1 S USGS 2 O, S, W, R USACE-RKI 1 S 05554000 North Fork Vermilion River near Charlotte ISWS 1 S USGS 2 O, S, W, R USACE-RKI 1 S 05557500 East Bureau Creek near Bureau ISWS 1 S USGS 2 O, S, W, R USACE-RKI 1 S 05563000 Kickapoo Creek near Kickapoo ISWS 1 S USGS 2 O, S, W, R USACE-RKI 1 S 05563500 Kickapoo Creek at Peoria ISWS 1 S USGS 2 O, S, W, R, Q USACE-RKI 1 S 05586000 North Fork Mauvaise Terre Creek near Jacksonville ISWS 1 S USGS 1 O, S, W, R 05600000 Big Creek near Wetaug ISWS 2 S, R USGS 2 O
__________ Notes: *Agency abbreviations are defined in the “Importance of Streamgaging Data to Cooperating Agencies” section. **GI = Gage Importance, ranging from 0 (not important) to 4 (critical) Data uses were as follows: F – River forecasting and flood warning, O = Current operations of water resources, L = Legal obligations, S = Long-term flow statistics, W = Project assessment of watershed hydrology, R = Regional hydrologic analysis, D = Hydrologic and hydraulic design, P = Water resource operation planning, Q = Water quality analysis, and X = Other
35
Figure 7 presents a summary of the total number of gages identified for each data application by the state and federal agencies, and the collective amount for all county and local agencies, including Du Page and Kane Counties, under the term “local.” The two primary uses by the USACE are for project assessment and river forecasting. Follow-up discussions with the USACE representatives suggest that the use of data for project assessment, when compared to other agency responses, possibly also could be interpreted as “current operations” use of data. The two primary uses of data by both the NWS and the IDNR Office of Water Resources are for river forecasting and long-term statistics. The two primary uses by the ISWS are for long-term statistics and regional hydrology. The USGS indicated data uses for current operations, long-term statistics, project assessment, and regional hydrology for every gage in the network, as well as a water quality use for most gages. Local agencies have the most varied use of data, with river forecasting and project assessment being the two most common uses.
Figure 8 shows the collective use of data for each of the ten categories of applications. The five most common categories are long-term statistics, project assessment, river forecasting, current operations, and regional hydrology.
Overall Importance of Data to Agencies
Figure 9 shows the rating of overall importance of the gages in the network by agency. Again, the value of importance for each gage represents the most important use of data at that gage, regardless of the type of data being used or the category of application. Three agencies, the USACE, IDNR Office of Water Resources, and the NWS, have identified the greatest number of gages as being of “critical” importance to their work. Most gages identified by county and local agencies, USGS, and ISWS are considered to be “very important.”
The importance of each individual gage to the agencies was given in table 7. A ranking of the collective importance of each individual gage based on responses from all agencies also was developed. These rankings are presented later in the section “Ranking of Relative Importance of Individual Gages.”
Additional Gaging Needs
Each agency was asked to identify key locations that would be important for additional streamgaging needs, and the potential uses of the new data. The following list provides the proposed locations and the agency that proposed the location:
Beaver Creek above confluence with Shoal Creek (USACE-STL) Embarras River at Diona (NWS) Embarras River at Lawrenceville (NWS) Fox River at Oswego (NWS) Fox River at Burlington, Wisconsin (NWS) Galena River at Galena (NWS) Illinois River near Hardin (NWS) Ohio River at Shawneetown (NWS) Pecatonica River at Shirland (NWS)
36
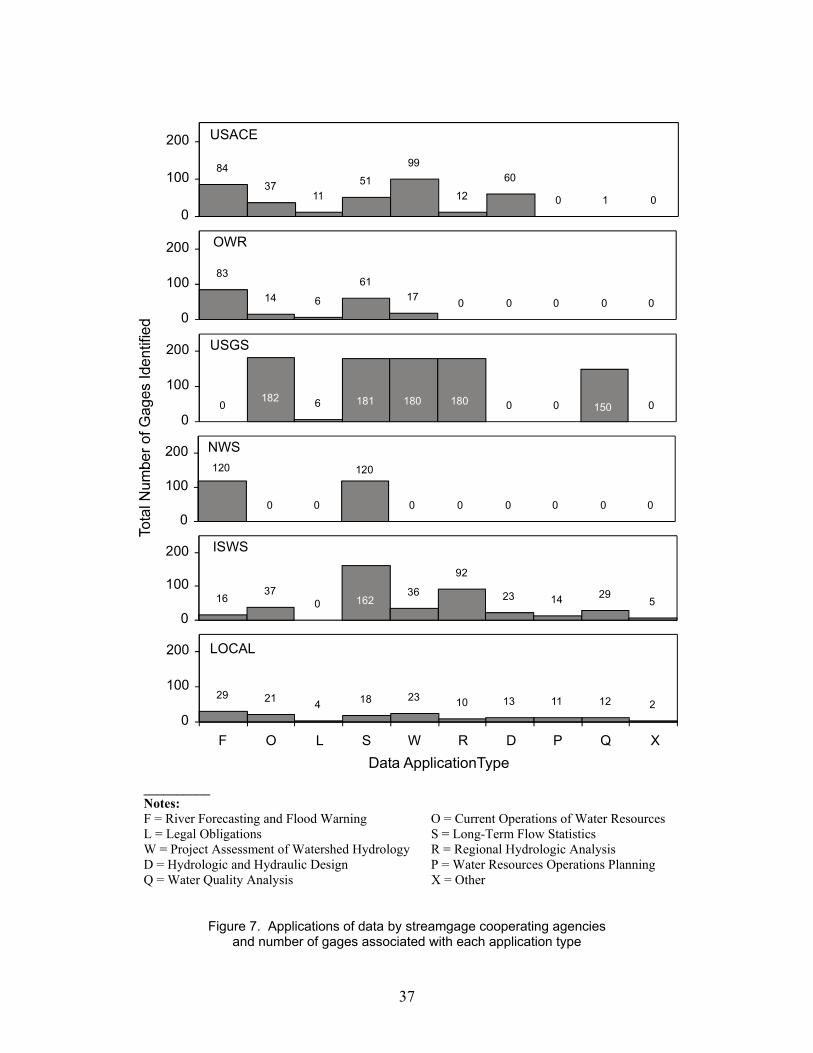
00060 150180182 180181
0
100
200 USGS
8437
1151
99
12
60
0 1 00
100
200 USACE
83
14 6
6117 0 0 0 0 0
0
100
200 OWR
0 0 0 0 0 0 0 0
120120
0
100
200 NWS
1637
036
92
23 14 295162
0
100
200 ISWS
29 21 4 18 23 10 13 11 12 20
100
200
F O L S W R D P Q X
LOCAL
Data ApplicationType __________ Notes: F = River Forecasting and Flood Warning O = Current Operations of Water Resources L = Legal Obligations S = Long-Term Flow Statistics W = Project Assessment of Watershed Hydrology R = Regional Hydrologic Analysis D = Hydrologic and Hydraulic Design P = Water Resources Operations Planning Q = Water Quality Analysis X = Other
Figure 7. Applications of data by streamgage cooperating agencies and number of gages associated with each application type
37
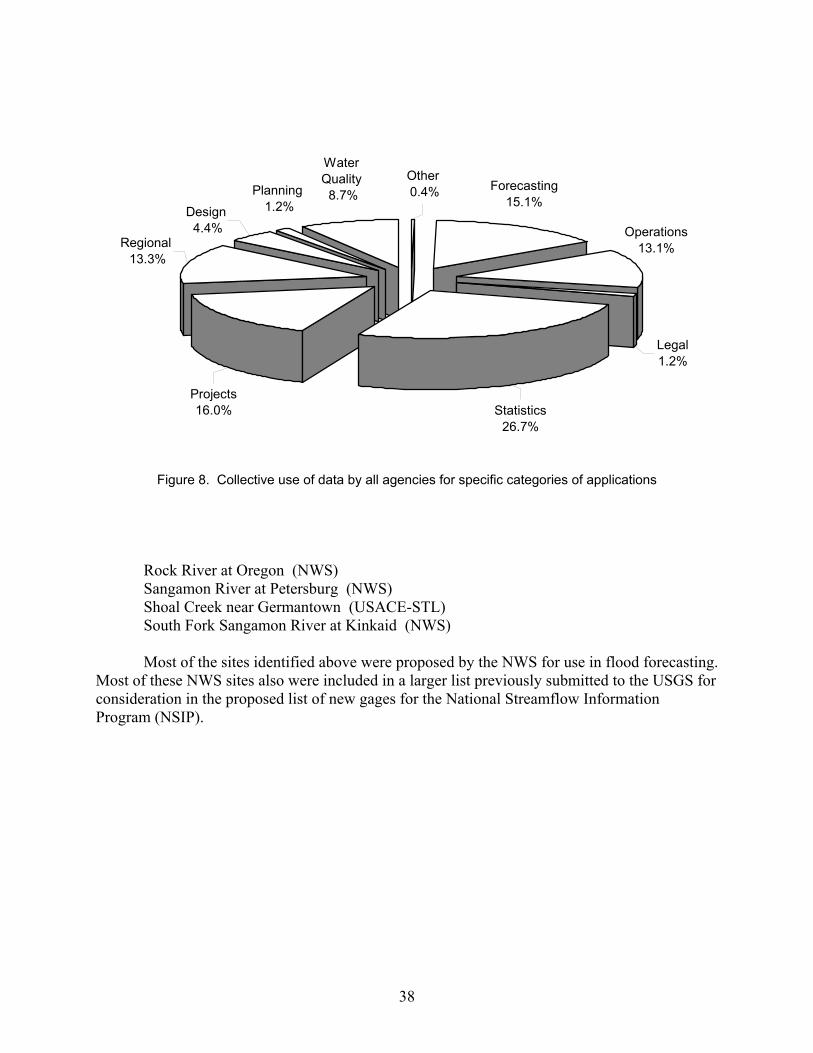
Regional 13.3%
Design 4.4%
Other 0.4%
Legal1.2%
Statistics26.7%
WaterQuality 8.7%Planning
1.2%
Projects16.0%
Operations13.1%
Forecasting15.1%
Figure 8. Collective use of data by all agencies for specific categories of applications
Rock River at Oregon (NWS) Sangamon River at Petersburg (NWS) Shoal Creek near Germantown (USACE-STL) South Fork Sangamon River at Kinkaid (NWS)
Most of the sites identified above were proposed by the NWS for use in flood forecasting.
Most of these NWS sites also were included in a larger list previously submitted to the USGS for consideration in the proposed list of new gages for the National Streamflow Information Program (NSIP).
38
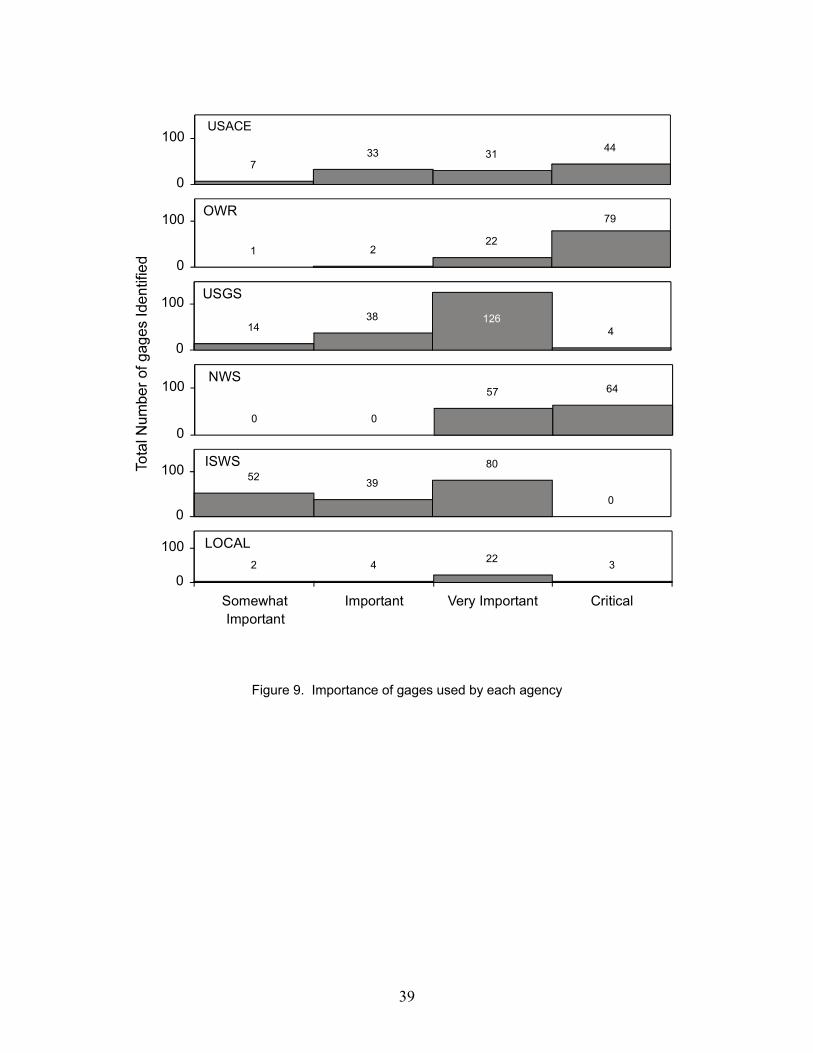
733 31 44
0
100USACE
1 222
79
0
100 OWR
1438
4126
0
100 USGS
0 0
57 64
0
100NWS
52 39
80
00
100 ISWS
2 4 22 30
100
SomewhatImportant
Important Very Important Critical
LOCAL
Figure 9. Importance of gages used by each agency
39

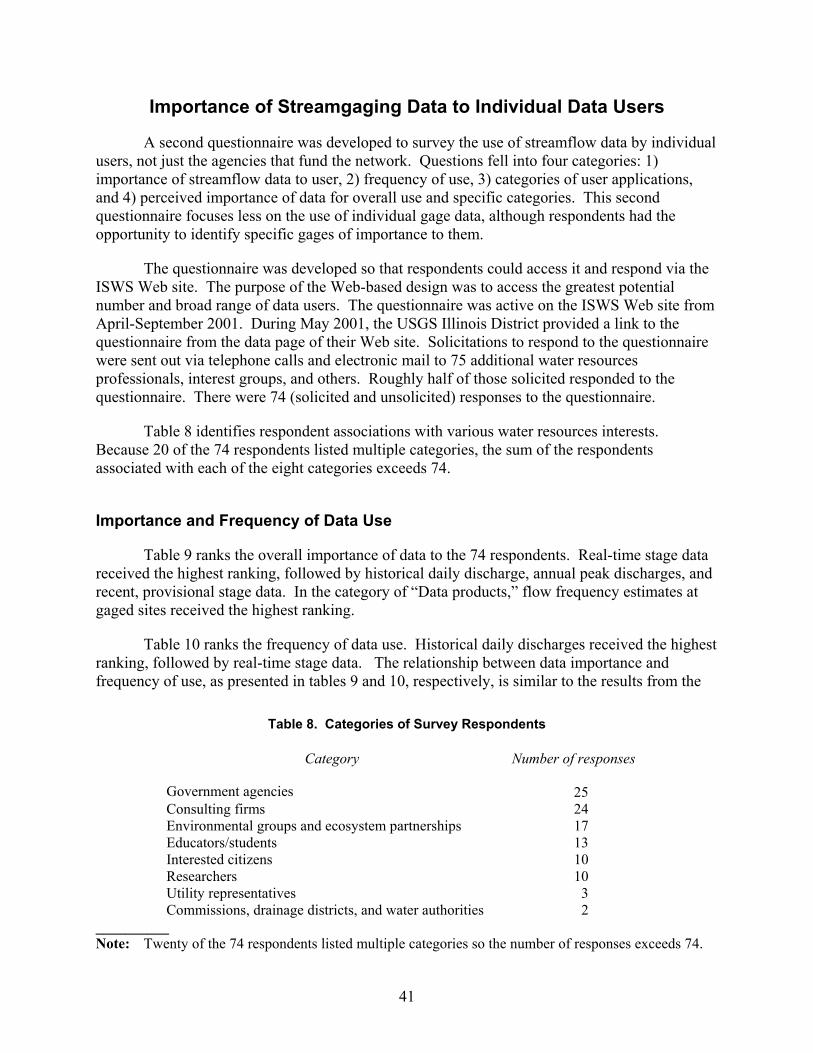
Importance of Streamgaging Data to Individual Data Users
A second questionnaire was developed to survey the use of streamflow data by individual users, not just the agencies that fund the network. Questions fell into four categories: 1) importance of streamflow data to user, 2) frequency of use, 3) categories of user applications, and 4) perceived importance of data for overall use and specific categories. This second questionnaire focuses less on the use of individual gage data, although respondents had the opportunity to identify specific gages of importance to them.
The questionnaire was developed so that respondents could access it and respond via the ISWS Web site. The purpose of the Web-based design was to access the greatest potential number and broad range of data users. The questionnaire was active on the ISWS Web site from April-September 2001. During May 2001, the USGS Illinois District provided a link to the questionnaire from the data page of their Web site. Solicitations to respond to the questionnaire were sent out via telephone calls and electronic mail to 75 additional water resources professionals, interest groups, and others. Roughly half of those solicited responded to the questionnaire. There were 74 (solicited and unsolicited) responses to the questionnaire.
Table 8 identifies respondent associations with various water resources interests. Because 20 of the 74 respondents listed multiple categories, the sum of the respondents associated with each of the eight categories exceeds 74.
Importance and Frequency of Data Use
Table 9 ranks the overall importance of data to the 74 respondents. Real-time stage data received the highest ranking, followed by historical daily discharge, annual peak discharges, and recent, provisional stage data. In the category of “Data products,” flow frequency estimates at gaged sites received the highest ranking.
Table 10 ranks the frequency of data use. Historical daily discharges received the highest ranking, followed by real-time stage data. The relationship between data importance and frequency of use, as presented in tables 9 and 10, respectively, is similar to the results from the
Table 8. Categories of Survey Respondents
Category Number of responses
Government agencies
25 Consulting firms 24 Environmental groups and ecosystem partnerships 17 Educators/students 13 Interested citizens 10 Researchers 10 Utility representatives 3 Commissions, drainage districts, and water authorities 2
__________ Note: Twenty of the 74 respondents listed multiple categories so the number of responses exceeds 74.
41
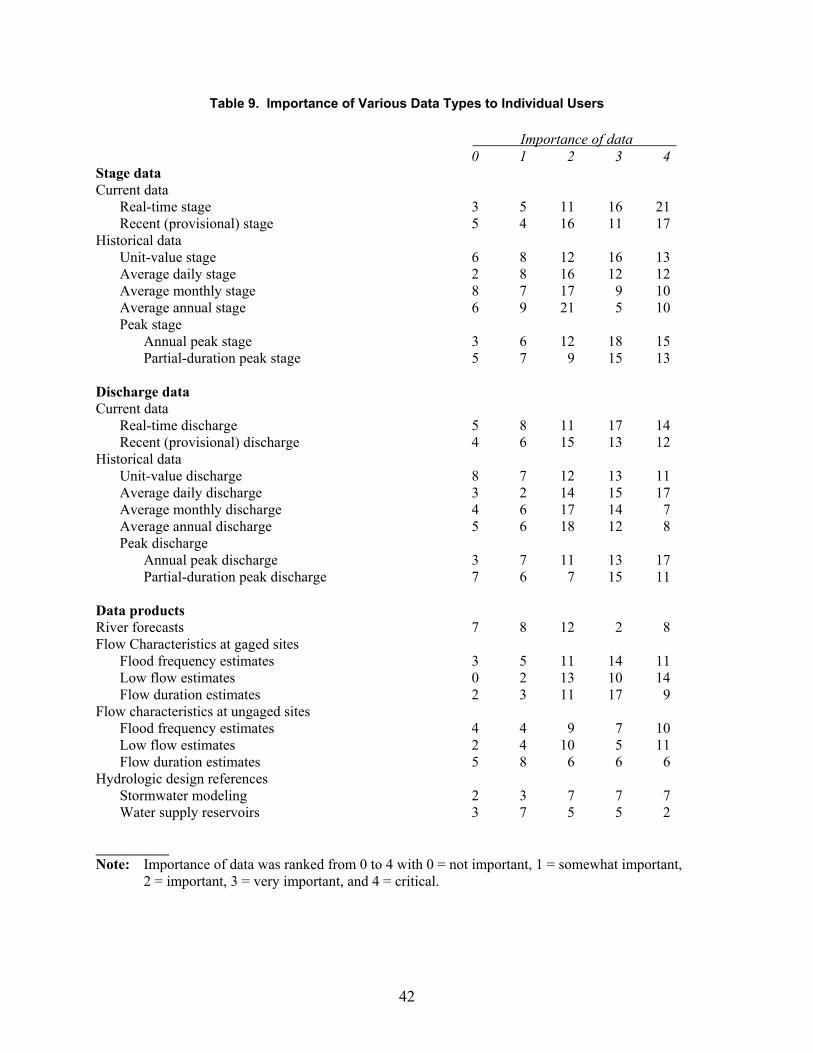
Table 9. Importance of Various Data Types to Individual Users Importance of data 0 1 2 3 4 Stage data Current data Real-time stage 3 5 11 16 21 Recent (provisional) stage 5 4 16 11 17 Historical data Unit-value stage 6 8 12 16 13 Average daily stage 2 8 16 12 12 Average monthly stage 8 7 17 9 10 Average annual stage 6 9 21 5 10 Peak stage Annual peak stage 3 6 12 18 15 Partial-duration peak stage 5 7 9 15 13 Discharge data Current data Real-time discharge 5 8 11 17 14 Recent (provisional) discharge 4 6 15 13 12 Historical data Unit-value discharge 8 7 12 13 11 Average daily discharge 3 2 14 15 17 Average monthly discharge 4 6 17 14 7 Average annual discharge 5 6 18 12 8 Peak discharge Annual peak discharge 3 7 11 13 17 Partial-duration peak discharge 7 6 7 15 11 Data products River forecasts 7 8 12 2 8 Flow Characteristics at gaged sites Flood frequency estimates 3 5 11 14 11 Low flow estimates 0 2 13 10 14 Flow duration estimates 2 3 11 17 9 Flow characteristics at ungaged sites Flood frequency estimates 4 4 9 7 10 Low flow estimates 2 4 10 5 11 Flow duration estimates 5 8 6 6 6 Hydrologic design references Stormwater modeling 2 3 7 7 7 Water supply reservoirs 3 7 5 5 2 __________ Note: Importance of data was ranked from 0 to 4 with 0 = not important, 1 = somewhat important,
2 = important, 3 = very important, and 4 = critical.
42
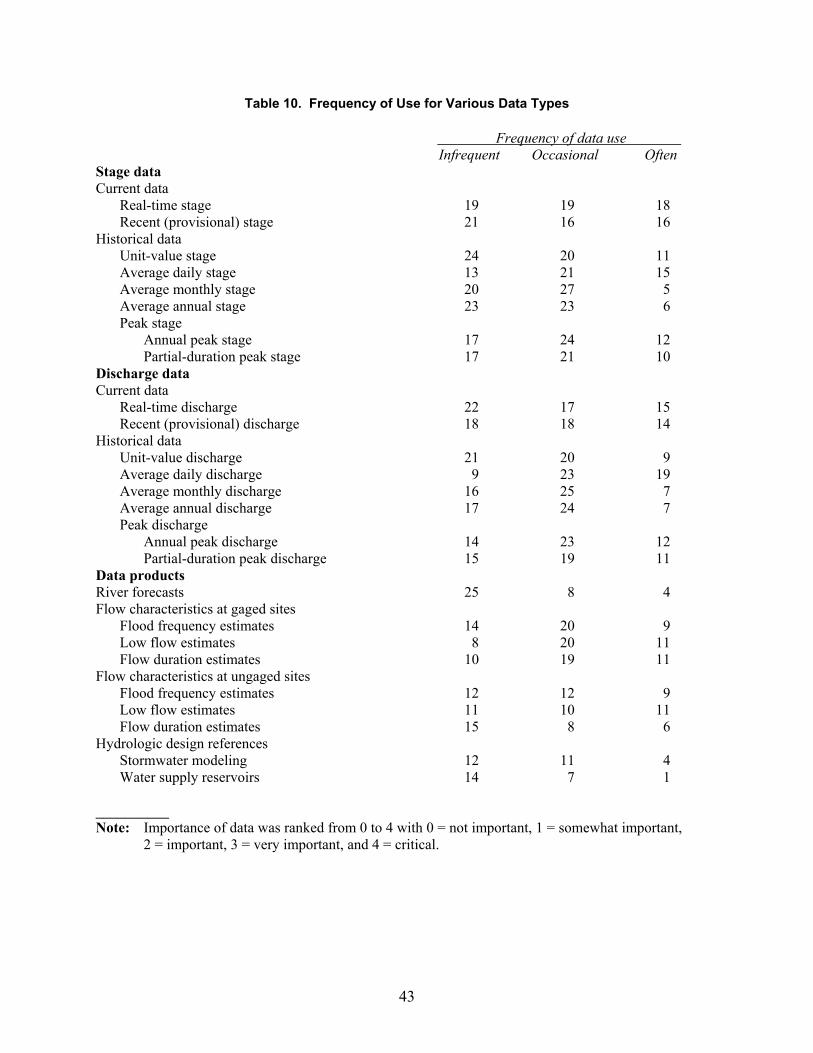
Table 10. Frequency of Use for Various Data Types Frequency of data use Infrequent Occasional Often Stage data Current data Real-time stage 19 19 18 Recent (provisional) stage 21 16 16 Historical data Unit-value stage 24 20 11 Average daily stage 13 21 15 Average monthly stage 20 27 5 Average annual stage 23 23 6 Peak stage Annual peak stage 17 24 12 Partial-duration peak stage 17 21 10 Discharge data Current data Real-time discharge 22 17 15 Recent (provisional) discharge 18 18 14 Historical data Unit-value discharge 21 20 9 Average daily discharge 9 23 19 Average monthly discharge 16 25 7 Average annual discharge 17 24 7 Peak discharge Annual peak discharge 14 23 12 Partial-duration peak discharge 15 19 11 Data products River forecasts 25 8 4 Flow characteristics at gaged sites Flood frequency estimates 14 20 9 Low flow estimates 8 20 11 Flow duration estimates 10 19 11 Flow characteristics at ungaged sites Flood frequency estimates 12 12 9 Low flow estimates 11 10 11 Flow duration estimates 15 8 6 Hydrologic design references Stormwater modeling 12 11 4 Water supply reservoirs 14 7 1 __________ Note: Importance of data was ranked from 0 to 4 with 0 = not important, 1 = somewhat important,
2 = important, 3 = very important, and 4 = critical.
43
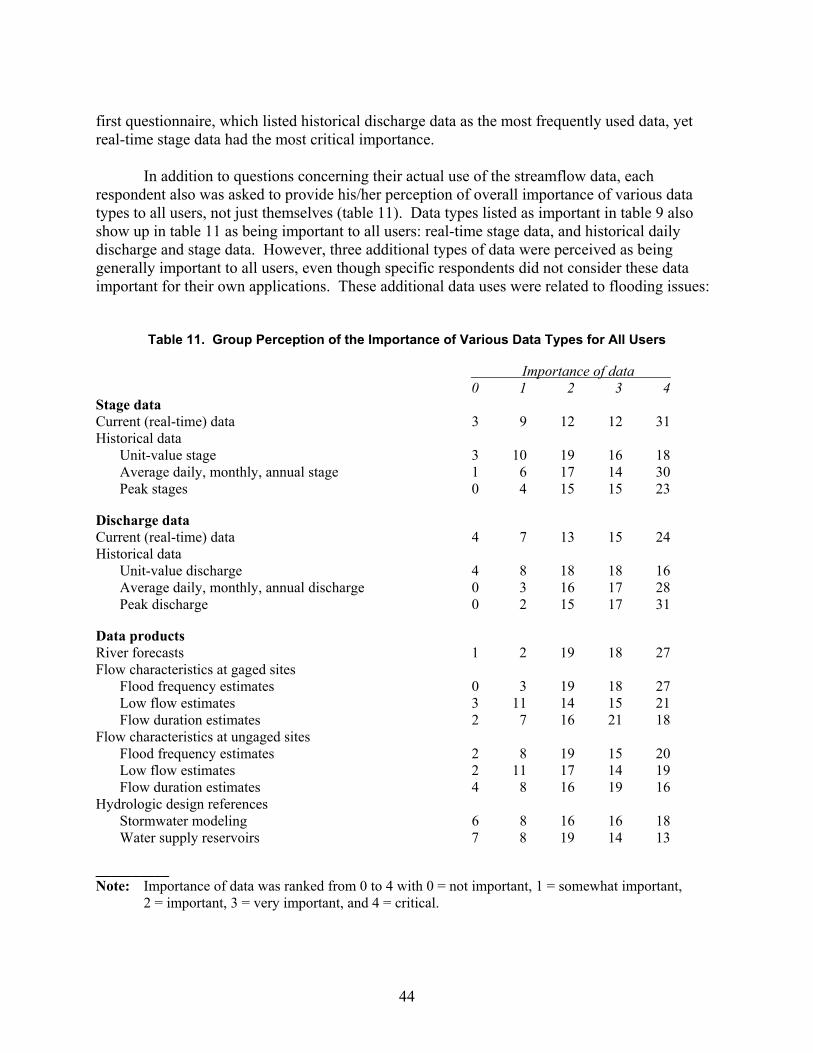
first questionnaire, which listed historical discharge data as the most frequently used data, yet real-time stage data had the most critical importance.
In addition to questions concerning their actual use of the streamflow data, each respondent also was asked to provide his/her perception of overall importance of various data types to all users, not just themselves (table 11). Data types listed as important in table 9 also show up in table 11 as being important to all users: real-time stage data, and historical daily discharge and stage data. However, three additional types of data were perceived as being generally important to all users, even though specific respondents did not consider these data important for their own applications. These additional data uses were related to flooding issues:
Table 11. Group Perception of the Importance of Various Data Types for All Users Importance of data 0 1 2 3 4 Stage data Current (real-time) data 3 9 12 12 31 Historical data Unit-value stage 3 10 19 16 18 Average daily, monthly, annual stage 1 6 17 14 30 Peak stages 0 4 15 15 23 Discharge data Current (real-time) data 4 7 13 15 24 Historical data Unit-value discharge 4 8 18 18 16 Average daily, monthly, annual discharge 0 3 16 17 28 Peak discharge 0 2 15 17 31 Data products River forecasts 1 2 19 18 27 Flow characteristics at gaged sites Flood frequency estimates 0 3 19 18 27 Low flow estimates 3 11 14 15 21 Flow duration estimates 2 7 16 21 18 Flow characteristics at ungaged sites Flood frequency estimates 2 8 19 15 20 Low flow estimates 2 11 17 14 19 Flow duration estimates 4 8 16 19 16 Hydrologic design references Stormwater modeling 6 8 16 16 18 Water supply reservoirs 7 8 19 14 13 __________ Note: Importance of data was ranked from 0 to 4 with 0 = not important, 1 = somewhat important,
2 = important, 3 = very important, and 4 = critical.
44
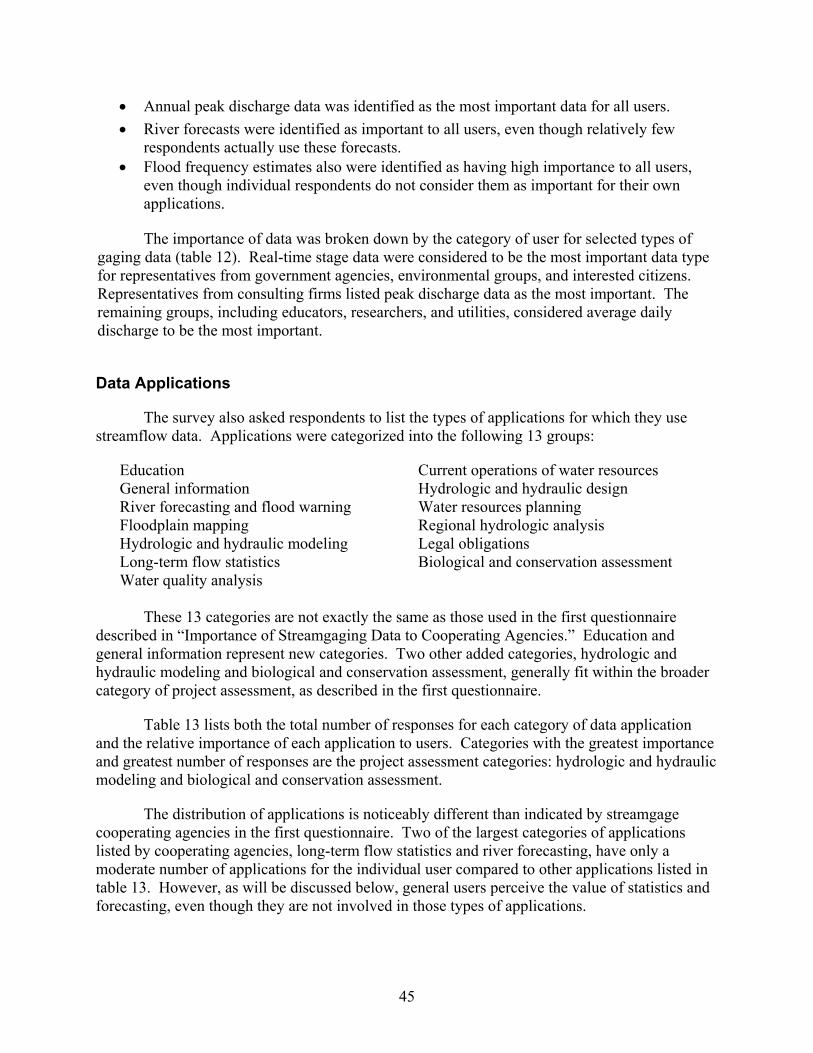
• Annual peak discharge data was identified as the most important data for all users. • River forecasts were identified as important to all users, even though relatively few
respondents actually use these forecasts. • Flood frequency estimates also were identified as having high importance to all users,
even though individual respondents do not consider them as important for their own applications.
The importance of data was broken down by the category of user for selected types of
gaging data (table 12). Real-time stage data were considered to be the most important data type for representatives from government agencies, environmental groups, and interested citizens. Representatives from consulting firms listed peak discharge data as the most important. The remaining groups, including educators, researchers, and utilities, considered average daily discharge to be the most important.
Data Applications
The survey also asked respondents to list the types of applications for which they use streamflow data. Applications were categorized into the following 13 groups:
Education Current operations of water resources General information Hydrologic and hydraulic design River forecasting and flood warning Water resources planning Floodplain mapping Regional hydrologic analysis Hydrologic and hydraulic modeling Legal obligations Long-term flow statistics Biological and conservation assessment Water quality analysis
These 13 categories are not exactly the same as those used in the first questionnaire
described in “Importance of Streamgaging Data to Cooperating Agencies.” Education and general information represent new categories. Two other added categories, hydrologic and hydraulic modeling and biological and conservation assessment, generally fit within the broader category of project assessment, as described in the first questionnaire.
Table 13 lists both the total number of responses for each category of data application and the relative importance of each application to users. Categories with the greatest importance and greatest number of responses are the project assessment categories: hydrologic and hydraulic modeling and biological and conservation assessment.
The distribution of applications is noticeably different than indicated by streamgage cooperating agencies in the first questionnaire. Two of the largest categories of applications listed by cooperating agencies, long-term flow statistics and river forecasting, have only a moderate number of applications for the individual user compared to other applications listed in table 13. However, as will be discussed below, general users perceive the value of statistics and forecasting, even though they are not involved in those types of applications.
45
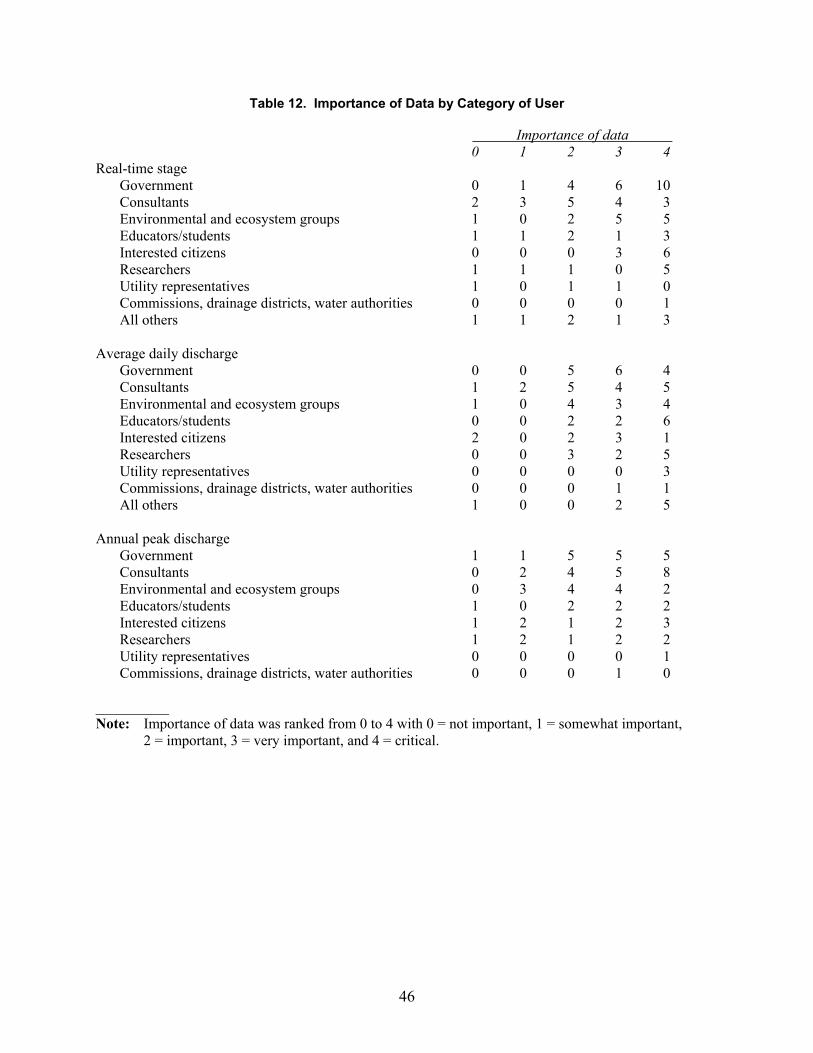
Table 12. Importance of Data by Category of User Importance of data 0 1 2 3 4 Real-time stage Government 0 1 4 6 10 Consultants 2 3 5 4 3 Environmental and ecosystem groups 1 0 2 5 5 Educators/students 1 1 2 1 3 Interested citizens 0 0 0 3 6 Researchers 1 1 1 0 5 Utility representatives 1 0 1 1 0 Commissions, drainage districts, water authorities 0 0 0 0 1 All others 1 1 2 1 3
Average daily discharge Government 0 0 5 6 4 Consultants 1 2 5 4 5 Environmental and ecosystem groups 1 0 4 3 4 Educators/students 0 0 2 2 6 Interested citizens 2 0 2 3 1 Researchers 0 0 3 2 5 Utility representatives 0 0 0 0 3 Commissions, drainage districts, water authorities 0 0 0 1 1 All others 1 0 0 2 5 Annual peak discharge Government 1 1 5 5 5 Consultants 0 2 4 5 8 Environmental and ecosystem groups 0 3 4 4 2 Educators/students 1 0 2 2 2 Interested citizens 1 2 1 2 3 Researchers 1 2 1 2 2 Utility representatives 0 0 0 0 1 Commissions, drainage districts, water authorities 0 0 0 1 0 __________ Note: Importance of data was ranked from 0 to 4 with 0 = not important, 1 = somewhat important,
2 = important, 3 = very important, and 4 = critical.
46
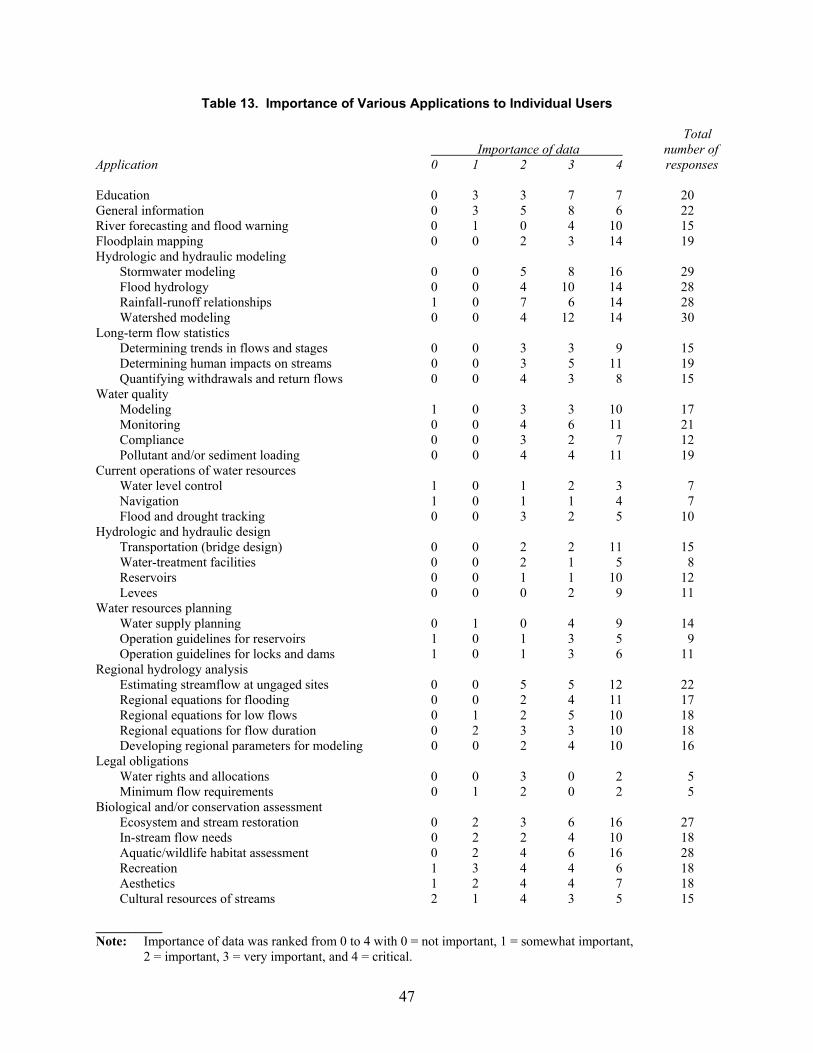
Table 13. Importance of Various Applications to Individual Users Total Importance of data number of Application 0 1 2 3 4 responses Education 0 3 3 7 7 20 General information 0 3 5 8 6 22 River forecasting and flood warning 0 1 0 4 10 15 Floodplain mapping 0 0 2 3 14 19 Hydrologic and hydraulic modeling Stormwater modeling 0 0 5 8 16 29 Flood hydrology 0 0 4 10 14 28 Rainfall-runoff relationships 1 0 7 6 14 28 Watershed modeling 0 0 4 12 14 30 Long-term flow statistics Determining trends in flows and stages 0 0 3 3 9 15 Determining human impacts on streams 0 0 3 5 11 19 Quantifying withdrawals and return flows 0 0 4 3 8 15 Water quality Modeling 1 0 3 3 10 17 Monitoring 0 0 4 6 11 21 Compliance 0 0 3 2 7 12 Pollutant and/or sediment loading 0 0 4 4 11 19 Current operations of water resources Water level control 1 0 1 2 3 7 Navigation 1 0 1 1 4 7 Flood and drought tracking 0 0 3 2 5 10 Hydrologic and hydraulic design Transportation (bridge design) 0 0 2 2 11 15 Water-treatment facilities 0 0 2 1 5 8 Reservoirs 0 0 1 1 10 12 Levees 0 0 0 2 9 11 Water resources planning Water supply planning 0 1 0 4 9 14 Operation guidelines for reservoirs 1 0 1 3 5 9 Operation guidelines for locks and dams 1 0 1 3 6 11 Regional hydrology analysis Estimating streamflow at ungaged sites 0 0 5 5 12 22 Regional equations for flooding 0 0 2 4 11 17 Regional equations for low flows 0 1 2 5 10 18 Regional equations for flow duration 0 2 3 3 10 18 Developing regional parameters for modeling 0 0 2 4 10 16 Legal obligations Water rights and allocations 0 0 3 0 2 5 Minimum flow requirements 0 1 2 0 2 5 Biological and/or conservation assessment Ecosystem and stream restoration 0 2 3 6 16 27 In-stream flow needs 0 2 2 4 10 18 Aquatic/wildlife habitat assessment 0 2 4 6 16 28 Recreation 1 3 4 4 6 18 Aesthetics 1 2 4 4 7 18 Cultural resources of streams 2 1 4 3 5 15 __________ Note: Importance of data was ranked from 0 to 4 with 0 = not important, 1 = somewhat important,
2 = important, 3 = very important, and 4 = critical.
47
Table 14 shows the types of data used for different applications. The most common data type used for almost all types of applications is historical discharge. As listed by the respondents, current (real-time) stage data are most commonly used for general information, current discharge data are most commonly used for river forecasting, and historical stage and flood peaks are most commonly used for floodplain mapping. The predominant use of historical discharge data (table 14) does not appear to be totally consistent with the responses in tables 9-12, which indicate that other data types such as real-time stage and peak stage/flow have similar levels of use to those for historical discharge.
Table 15 shows the overall perception by data users of the importance of various applications to all users, not just themselves Users perceive that river forecasting and flood warning is the most important category of application, followed by use of long-term flow statistics for analyzing hydrologic trends and determining human impacts to streams. Uses of streamflow data for general information and education are considered the least important uses. Users consider most remaining data uses to have a similar, relatively high level of importance.
Importance of Specific Streamflow Gages to Data Users
Respondents to the second questionnaire also were given the opportunity to identify specific gages important for their uses. The number of respondents identifying each particular gage in the network is listed (table 16). The gages with the highest number of responses (eight per gage) are located in the Fox and Des Plaines River basins. There were five or more responses for most gages in the Fox, Des Plaines, Mackinaw, and North Branch Chicago River basins. There was at least one response for most gages; however, generally no interest was expressed in either far western Illinois gages on tributaries to the Mississippi River or crest stage gages.
The interest level for gages in the DuPage and Little Calumet basins was highest among representatives from consulting firms. Representatives from government agencies expressed the greatest interest in gages in the Des Plaines and North Branch Chicago River basins. Environmental groups and ecosystem partnerships expressed the greatest interest in gages in the Kankakee, Kaskaskia, and Vermilion (Wabash) basins and the Fox Chain of Lakes region.
Additional Comments from Respondents
Several respondents referred to the importance of the data for water quality uses, specifically in relationship to the assessment, modeling, and compliance associated with the Total Maximum Daily Load (TMDL) process. Four respondents also voiced concern that support of the current set of gages should be continued, including the following two statements:
48
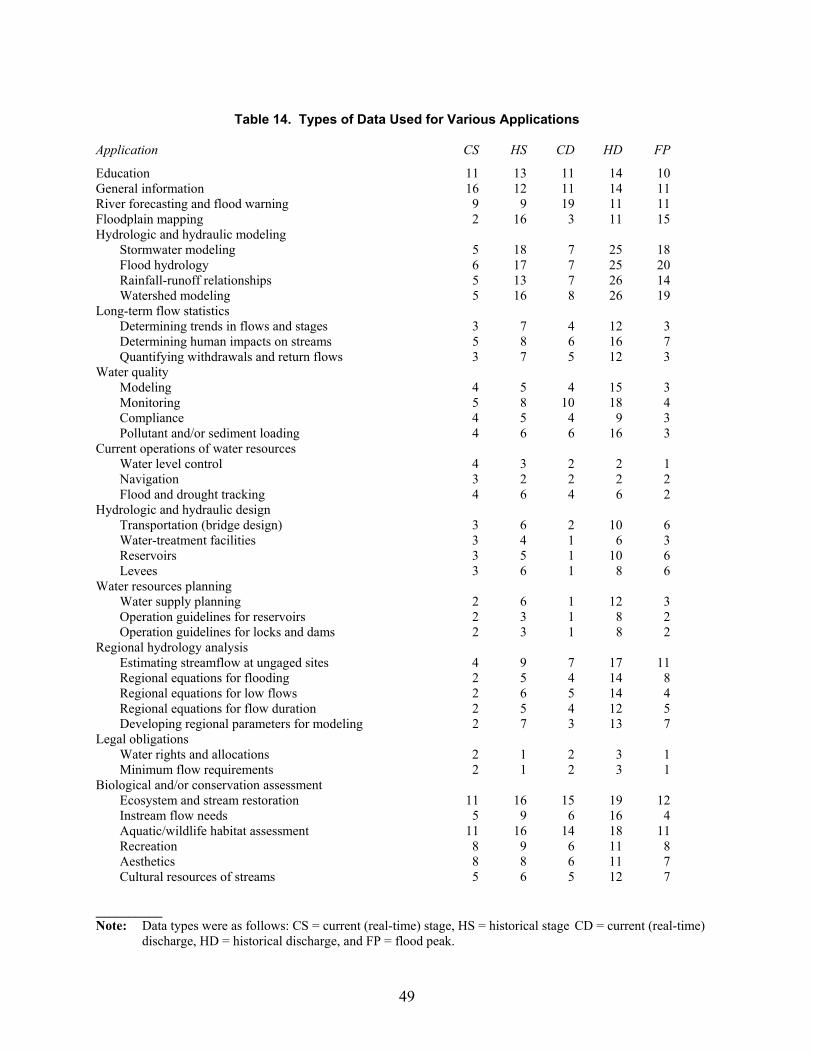
Table 14. Types of Data Used for Various Applications Application CS HS CD HD FP
Education 11 13 11 14 10 General information 16 12 11 14 11 River forecasting and flood warning 9 9 19 11 11 Floodplain mapping 2 16 3 11 15 Hydrologic and hydraulic modeling Stormwater modeling 5 18 7 25 18 Flood hydrology 6 17 7 25 20 Rainfall-runoff relationships 5 13 7 26 14 Watershed modeling 5 16 8 26 19 Long-term flow statistics Determining trends in flows and stages 3 7 4 12 3 Determining human impacts on streams 5 8 6 16 7 Quantifying withdrawals and return flows 3 7 5 12 3 Water quality Modeling 4 5 4 15 3 Monitoring 5 8 10 18 4 Compliance 4 5 4 9 3 Pollutant and/or sediment loading 4 6 6 16 3 Current operations of water resources Water level control 4 3 2 2 1 Navigation 3 2 2 2 2 Flood and drought tracking 4 6 4 6 2 Hydrologic and hydraulic design Transportation (bridge design) 3 6 2 10 6 Water-treatment facilities 3 4 1 6 3 Reservoirs 3 5 1 10 6 Levees 3 6 1 8 6 Water resources planning Water supply planning 2 6 1 12 3 Operation guidelines for reservoirs 2 3 1 8 2 Operation guidelines for locks and dams 2 3 1 8 2 Regional hydrology analysis Estimating streamflow at ungaged sites 4 9 7 17 11 Regional equations for flooding 2 5 4 14 8 Regional equations for low flows 2 6 5 14 4 Regional equations for flow duration 2 5 4 12 5 Developing regional parameters for modeling 2 7 3 13 7 Legal obligations Water rights and allocations 2 1 2 3 1 Minimum flow requirements 2 1 2 3 1 Biological and/or conservation assessment Ecosystem and stream restoration 11 16 15 19 12 Instream flow needs 5 9 6 16 4 Aquatic/wildlife habitat assessment 11 16 14 18 11 Recreation 8 9 6 11 8 Aesthetics 8 8 6 11 7 Cultural resources of streams 5 6 5 12 7 __________ Note: Data types were as follows: CS = current (real-time) stage, HS = historical stage CD = current (real-time)
discharge, HD = historical discharge, and FP = flood peak.
49
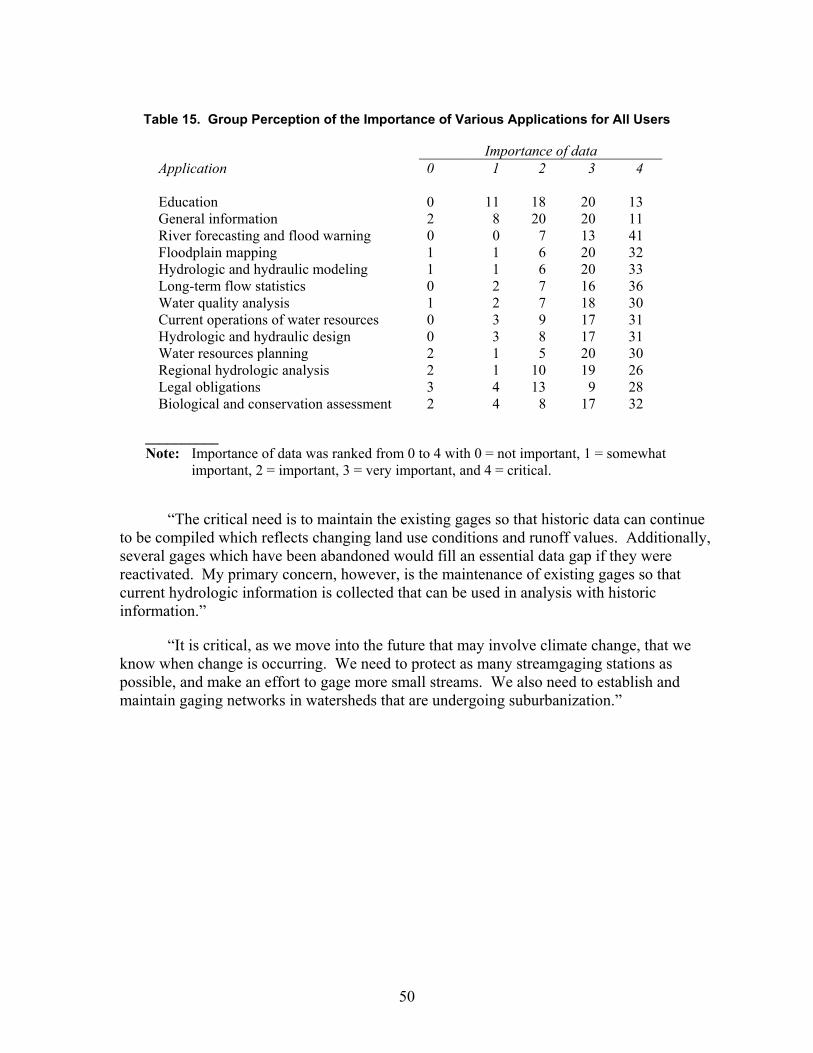
Table 15. Group Perception of the Importance of Various Applications for All Users
Importance of data Application 0 1 2 3 4 Education 0 11 18 20 13 General information 2 8 20 20 11 River forecasting and flood warning 0 0 7 13 41 Floodplain mapping 1 1 6 20 32 Hydrologic and hydraulic modeling 1 1 6 20 33 Long-term flow statistics 0 2 7 16 36 Water quality analysis 1 2 7 18 30 Current operations of water resources 0 3 9 17 31 Hydrologic and hydraulic design 0 3 8 17 31 Water resources planning 2 1 5 20 30 Regional hydrologic analysis 2 1 10 19 26 Legal obligations 3 4 13 9 28 Biological and conservation assessment 2 4 8 17 32
__________ Note: Importance of data was ranked from 0 to 4 with 0 = not important, 1 = somewhat
important, 2 = important, 3 = very important, and 4 = critical.
“The critical need is to maintain the existing gages so that historic data can continue to be compiled which reflects changing land use conditions and runoff values. Additionally, several gages which have been abandoned would fill an essential data gap if they were reactivated. My primary concern, however, is the maintenance of existing gages so that current hydrologic information is collected that can be used in analysis with historic information.”
“It is critical, as we move into the future that may involve climate change, that we know when change is occurring. We need to protect as many streamgaging stations as possible, and make an effort to gage more small streams. We also need to establish and maintain gaging networks in watersheds that are undergoing suburbanization.”
50
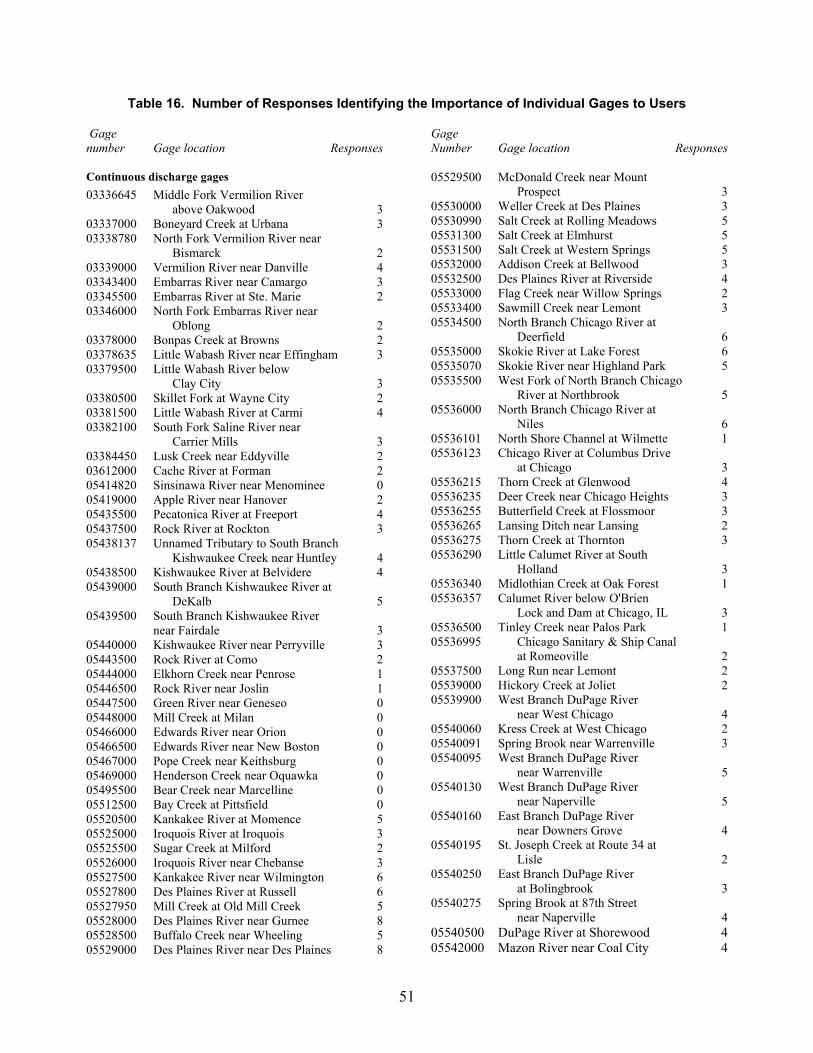
Table 16. Number of Responses Identifying the Importance of Individual Gages to Users
Gage Gage number Gage location Responses Number Gage location Responses Continuous discharge gages 05529500 McDonald Creek near Mount
Prospect 3 03336645 Middle Fork Vermilion River above Oakwood 3 05530000 Weller Creek at Des Plaines 3
05530990 Salt Creek at Rolling Meadows 5 03337000 Boneyard Creek at Urbana 3 05531300 Salt Creek at Elmhurst 5 03338780 North Fork Vermilion River near
Bismarck 2 05531500 Salt Creek at Western Springs 5 05532000 Addison Creek at Bellwood 3 03339000 Vermilion River near Danville 4 05532500 Des Plaines River at Riverside 4 03343400 Embarras River near Camargo 3 05533000 Flag Creek near Willow Springs 2 03345500 Embarras River at Ste. Marie 2 05533400 Sawmill Creek near Lemont 3 03346000 North Fork Embarras River near
Oblong 2 05534500 North Branch Chicago River at Deerfield 6 03378000 Bonpas Creek at Browns 2 05535000 Skokie River at Lake Forest 6 03378635 Little Wabash River near Effingham 3 05535070 Skokie River near Highland Park 5 03379500 Little Wabash River below
Clay City 3 05535500 West Fork of North Branch Chicago River at Northbrook 5 03380500 Skillet Fork at Wayne City 2 05536000 North Branch Chicago River at 03381500 Little Wabash River at Carmi 4 Niles 6 03382100 South Fork Saline River near
Carrier Mills 3 05536101 North Shore Channel at Wilmette 1 05536123 Chicago River at Columbus Drive 03384450 Lusk Creek near Eddyville 2 at Chicago 3 03612000 Cache River at Forman 2 05536215 Thorn Creek at Glenwood 4 05414820 Sinsinawa River near Menominee 0 05536235 Deer Creek near Chicago Heights 3 05419000 Apple River near Hanover 2 05536255 Butterfield Creek at Flossmoor 3 05435500 Pecatonica River at Freeport 4 05536265 Lansing Ditch near Lansing 2 05437500 Rock River at Rockton 3 05536275 Thorn Creek at Thornton 3 05438137 Unnamed Tributary to South Branch 05536290 Little Calumet River at South Kishwaukee Creek near Huntley 4 Holland 3 05438500 Kishwaukee River at Belvidere 4 05536340 Midlothian Creek at Oak Forest 1 05439000 South Branch Kishwaukee River at
DeKalb 5 05536357 Calumet River below O'Brien Lock and Dam at Chicago, IL 3 05439500 South Branch Kishwaukee River
near Fairdale 3 05536500 Tinley Creek near Palos Park 1 05536995 Chicago Sanitary & Ship Canal 05440000 Kishwaukee River near Perryville 3 at Romeoville 2 05443500 Rock River at Como 2 05537500 Long Run near Lemont 2 05444000 Elkhorn Creek near Penrose 1 05539000 Hickory Creek at Joliet 2 05446500 Rock River near Joslin 1 05539900 West Branch DuPage River 05447500 Green River near Geneseo 0 near West Chicago 4 05448000 Mill Creek at Milan 0 05540060 Kress Creek at West Chicago 2 05466000 Edwards River near Orion 0 05540091 Spring Brook near Warrenville 3 05466500 Edwards River near New Boston 0 05540095 West Branch DuPage River 05467000 Pope Creek near Keithsburg 0 near Warrenville 5 05469000 Henderson Creek near Oquawka 0 05540130 West Branch DuPage River 05495500 Bear Creek near Marcelline 0 near Naperville 5 05512500 Bay Creek at Pittsfield 0 05540160 East Branch DuPage River 05520500 Kankakee River at Momence 5 near Downers Grove 4 05525000 Iroquois River at Iroquois 3 05540195 St. Joseph Creek at Route 34 at 05525500 Sugar Creek at Milford 2 Lisle 2 05526000 Iroquois River near Chebanse 3 05540250 East Branch DuPage River 05527500 Kankakee River near Wilmington 6 at Bolingbrook 3 05527800 Des Plaines River at Russell 6 05540275 Spring Brook at 87th Street 05527950 Mill Creek at Old Mill Creek 5 near Naperville 4 05528000 Des Plaines River near Gurnee 8 05540500 DuPage River at Shorewood 4 05528500 Buffalo Creek near Wheeling 5 05542000 Mazon River near Coal City 4 05529000 Des Plaines River near Des Plaines 8
51
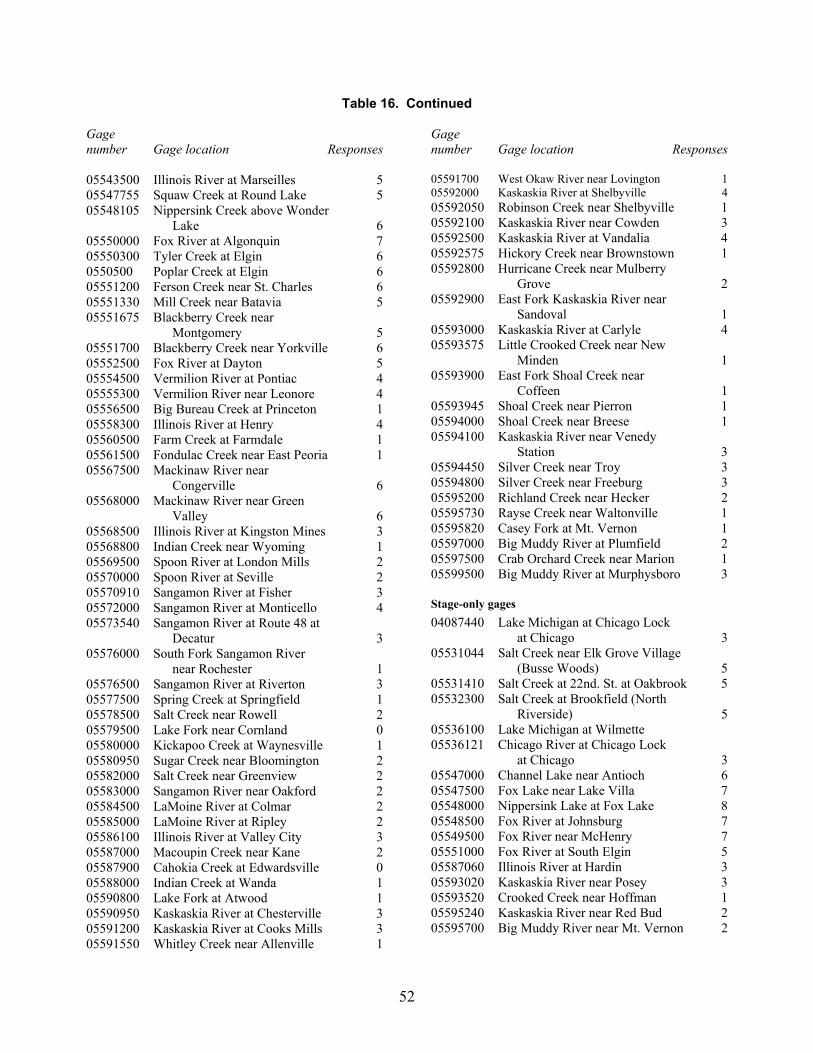
Table 16. Continued
Gage number Gage location Responses 05543500 Illinois River at Marseilles 5 05547755 Squaw Creek at Round Lake 5 05548105 Nippersink Creek above Wonder Lake 6 05550000 Fox River at Algonquin 7 05550300 Tyler Creek at Elgin 6 0550500 Poplar Creek at Elgin 6 05551200 Ferson Creek near St. Charles 6 05551330 Mill Creek near Batavia 5 05551675 Blackberry Creek near Montgomery 5 05551700 Blackberry Creek near Yorkville 6 05552500 Fox River at Dayton 5 05554500 Vermilion River at Pontiac 4 05555300 Vermilion River near Leonore 4 05556500 Big Bureau Creek at Princeton 1 05558300 Illinois River at Henry 4 05560500 Farm Creek at Farmdale 1 05561500 Fondulac Creek near East Peoria 1 05567500 Mackinaw River near Congerville 6 05568000 Mackinaw River near Green Valley 6 05568500 Illinois River at Kingston Mines 3 05568800 Indian Creek near Wyoming 1 05569500 Spoon River at London Mills 2 05570000 Spoon River at Seville 2 05570910 Sangamon River at Fisher 3 05572000 Sangamon River at Monticello 4 05573540 Sangamon River at Route 48 at Decatur 3 05576000 South Fork Sangamon River near Rochester 1 05576500 Sangamon River at Riverton 3 05577500 Spring Creek at Springfield 1 05578500 Salt Creek near Rowell 2 05579500 Lake Fork near Cornland 0 05580000 Kickapoo Creek at Waynesville 1 05580950 Sugar Creek near Bloomington 2 05582000 Salt Creek near Greenview 2 05583000 Sangamon River near Oakford 2 05584500 LaMoine River at Colmar 2 05585000 LaMoine River at Ripley 2 05586100 Illinois River at Valley City 3 05587000 Macoupin Creek near Kane 2 05587900 Cahokia Creek at Edwardsville 0 05588000 Indian Creek at Wanda 1 05590800 Lake Fork at Atwood 1 05590950 Kaskaskia River at Chesterville 3 05591200 Kaskaskia River at Cooks Mills 3 05591550 Whitley Creek near Allenville 1
Gage number Gage location Responses 05591700 West Okaw River near Lovington 1 05592000 Kaskaskia River at Shelbyville 4 05592050 Robinson Creek near Shelbyville 1 05592100 Kaskaskia River near Cowden 3 05592500 Kaskaskia River at Vandalia 4 05592575 Hickory Creek near Brownstown 1 05592800 Hurricane Creek near Mulberry Grove 2 05592900 East Fork Kaskaskia River near Sandoval 1 05593000 Kaskaskia River at Carlyle 4 05593575 Little Crooked Creek near New Minden 1 05593900 East Fork Shoal Creek near Coffeen 1 05593945 Shoal Creek near Pierron 1 05594000 Shoal Creek near Breese 1 05594100 Kaskaskia River near Venedy Station 3 05594450 Silver Creek near Troy 3 05594800 Silver Creek near Freeburg 3 05595200 Richland Creek near Hecker 2 05595730 Rayse Creek near Waltonville 1 05595820 Casey Fork at Mt. Vernon 1 05597000 Big Muddy River at Plumfield 2 05597500 Crab Orchard Creek near Marion 1 05599500 Big Muddy River at Murphysboro 3 Stage-only gages 04087440 Lake Michigan at Chicago Lock at Chicago 3 05531044 Salt Creek near Elk Grove Village (Busse Woods) 5 05531410 Salt Creek at 22nd. St. at Oakbrook 5 05532300 Salt Creek at Brookfield (North Riverside) 5 05536100 Lake Michigan at Wilmette 05536121 Chicago River at Chicago Lock at Chicago 3 05547000 Channel Lake near Antioch 6 05547500 Fox Lake near Lake Villa 7 05548000 Nippersink Lake at Fox Lake 8 05548500 Fox River at Johnsburg 7 05549500 Fox River near McHenry 7 05551000 Fox River at South Elgin 5 05587060 Illinois River at Hardin 3 05593020 Kaskaskia River near Posey 3 05593520 Crooked Creek near Hoffman 1 05595240 Kaskaskia River near Red Bud 2 05595700 Big Muddy River near Mt. Vernon 2
52
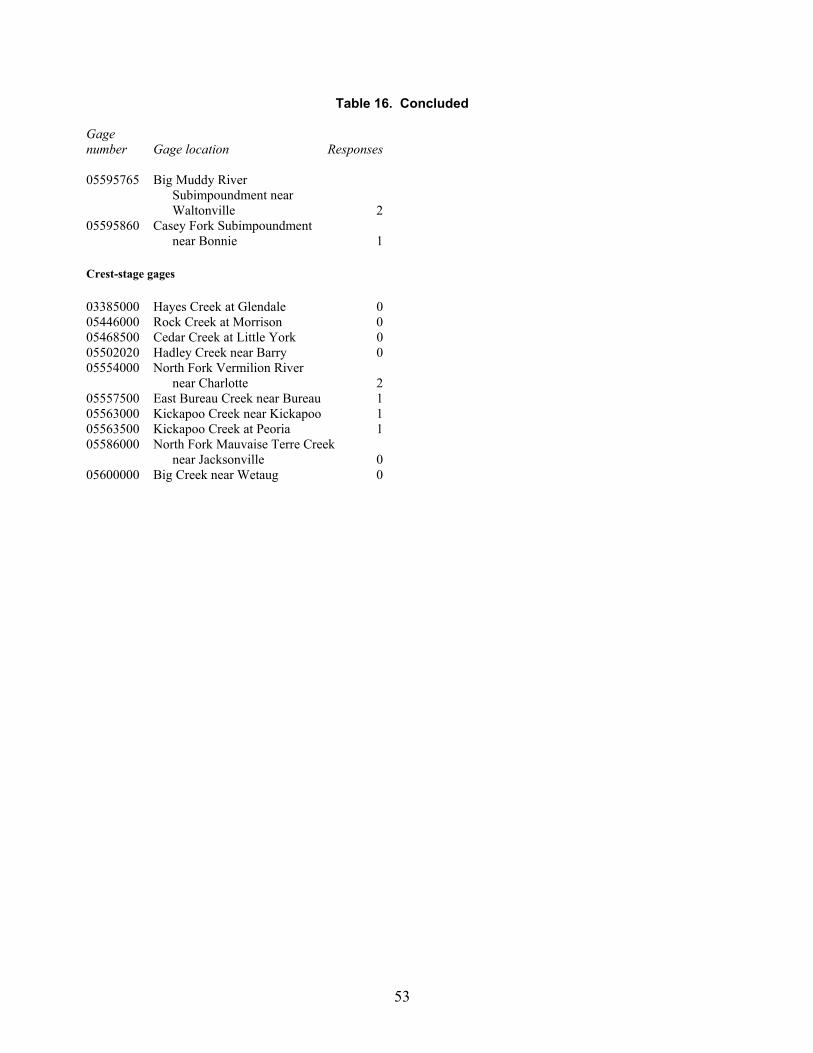
Table 16. Concluded Gage number Gage location Responses 05595765 Big Muddy River Subimpoundment near Waltonville 2 05595860 Casey Fork Subimpoundment near Bonnie 1 Crest-stage gages 03385000 Hayes Creek at Glendale 0 05446000 Rock Creek at Morrison 0 05468500 Cedar Creek at Little York 0 05502020 Hadley Creek near Barry 0 05554000 North Fork Vermilion River near Charlotte 2 05557500 East Bureau Creek near Bureau 1 05563000 Kickapoo Creek near Kickapoo 1 05563500 Kickapoo Creek at Peoria 1 05586000 North Fork Mauvaise Terre Creek near Jacksonville 0 05600000 Big Creek near Wetaug 0
53

Regional Value of Streamflow Gages
“The general objective of the streamflow data program is to provide information on flow characteristics at any point on any stream” (Benson and Carter, 1973, page 9).
There are thousands of streams and rivers in Illinois. However, gages are currently
located on only 107 of these streams, and, historically, gages have been located at some time on roughly 170 streams in Illinois. For the remaining ungaged streams, flow characteristics must be estimated from gaged locations using regional hydrologic principles. The estimation of streamflow characteristics at ungaged locations continues to be cited as a long-term goal of the USGS Streamflow Gaging Network, just as it was by Benson and Carter (1973). The NRC (1992) describes that hydrologic regionalization remains a central challenge of hydrology, with a wide range of applications. Among the applications listed by the NRC are floodplain mapping and management, design of highway bridges and culverts, design of water-supply reservoirs, analysis of dam safety, wastewater treatment plant design, and effluent permitting.
The regional value of a gage is a measure of its relative importance in the process of defining regional relationships for use in estimating flow characteristics at ungaged sites. Determining the overall value of a particular gage in establishing regional relationships can be complex. For example, it is possible for a particular gage to provide data important for determining flood frequency relationships within a region, but also offer data of lesser importance for establishing low-flow relationships. Gage location and period of record are also important considerations. To a certain extent, the importance of a gage in a regional analysis also depends on the type of algorithm or modeling used in the analysis. Both quantitative measures and descriptive assessments can be used to assess regional value, and both types of approaches are important. Quantitative Assessments of Regional Value
A quantitative assessment of the regional value of the streamflow gaging program was conducted using a method based on the concept of entropy and information transfer. This assessment is addressed in a related report: Use of Information Transfer Methods in Evaluating the Regional Value of Illinois Streamflow Gages (Markus and Knapp, 2003, in preparation).
The general purpose of regional analysis is to estimate the characteristics of a certain
event at one location using information from events at other locations. For example, data on the magnitudes of annual peak flood at five gages in a region can be used to predice the annual peak flood at a sixth location for which no previous information is available. Using regional analysis, the five locations essentially “send” information concerning their flood events to the sixth location, which “receives” the information and processes it to estimate or gain knowledge concerning its own flood events.
Within a gaging network, each gage has the potential to send information to any of the other network gages. The concept of entropy attempts to measure the information sent and received by all network gages. A “net” value of entropy can be estimated as the difference between the information sent and received by any one gage, such that gages with a large net
55
entropy send more information to other gages than they potentially receive. In the entropy analysis, gages with a large net entropy are considered the most valuable for regional analysis.
For purposes of measuring the information transfer among gages in Illinois, the State was
divided into four regions related to the physiographic divisions of Illinois, as defined by Leighton et al. (1948) and shown in figure 10. The four regions are listed as follows: East Region South Region Bloomington Ridged Plain Springfield Plain Kankakee Plain Mt. Vernon Hill Country West Region North Region Galesburg Plain Rock River Hill Country Lincoln Hills Section Green River Lowland Wisconsin Driftless Section Gages in another smaller physiographic region in the State, the Shawnee Hills Section in southern Illinois, were not included in the analysis because the hydrologic character of this region is distinctly different than that of other nearby regions. Also not included in the analysis were gages with flows impaired to a large degree by human modifications. Consequently, no gages in the six-county area of northeastern Illinois (Wheaton Morainal Country and Chicago Lake Plain physiographic regions) were included in the analysis.
As part of the entropy analysis, it was necessary to define a concurrent period of gaging for analysis. Three separate gaging period were used for each region, generally being the periods from 1950-1998, 1979-1998, and 1950-1970. Adjustments were made in the period of records for each region to maximize both the number of years and the number of gages with concurrent records. Analysis periods for each region were as follows:
East region: 1949-1998 1950-1971 1979-1998 South region: 1952-1998 1952-1970 1978-1998 West region: 1945-1998 1945-1970 1979-1998 North region: 1940-1998 1940-1957 1979-1998
To be included in the analysis, the period of record for each gage had to cover the entire period being analyzed. For this reason, a number of gages with short periods of record or interrupted records were not evaluated by entropy analysis.
The estimates of a gage’s entropy can differ from one analysis period to the next. This difference occurs not only because of natural variability in flows, but also because of changes over time in the number and location of gages within a region. Surrounding gages have impacts on a gage’s entropy, and there is interplay in the information transfer between various gages. Thus, it is possible for the entropy at a given gage to change dramatically if a nearby gage is discontinued or established.
56
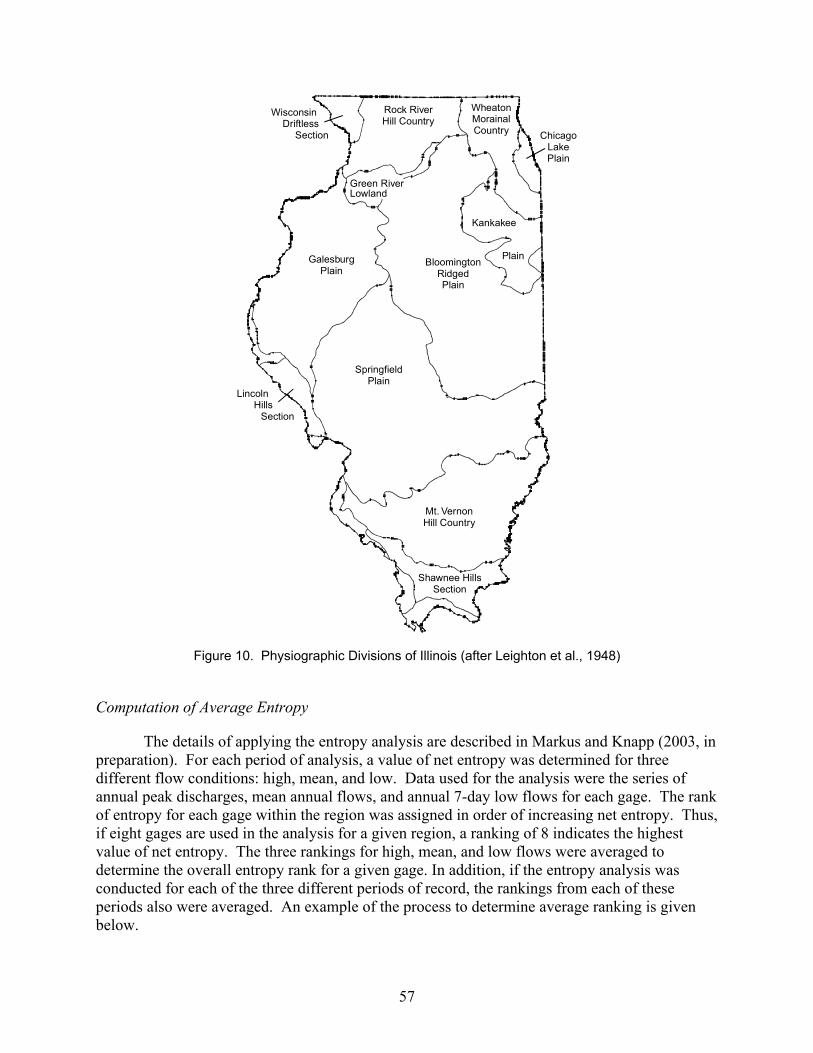
WisconsinDriftless Section
Lincoln Hills Section
Rock RiverHill Country
WheatonMorainalCountry Chicago
LakePlain
Kankakee
PlainBloomingtonRidgedPlain
GalesburgPlain
SpringfieldPlain
Mt. VernonHill Country
Shawnee HillsSection
Green RiverLowland
Figure 10. Physiographic Divisions of Illinois (after Leighton et al., 1948)
Computation of Average Entropy
The details of applying the entropy analysis are described in Markus and Knapp (2003, in preparation). For each period of analysis, a value of net entropy was determined for three different flow conditions: high, mean, and low. Data used for the analysis were the series of annual peak discharges, mean annual flows, and annual 7-day low flows for each gage. The rank of entropy for each gage within the region was assigned in order of increasing net entropy. Thus, if eight gages are used in the analysis for a given region, a ranking of 8 indicates the highest value of net entropy. The three rankings for high, mean, and low flows were averaged to determine the overall entropy rank for a given gage. In addition, if the entropy analysis was conducted for each of the three different periods of record, the rankings from each of these periods also were averaged. An example of the process to determine average ranking is given below.
57
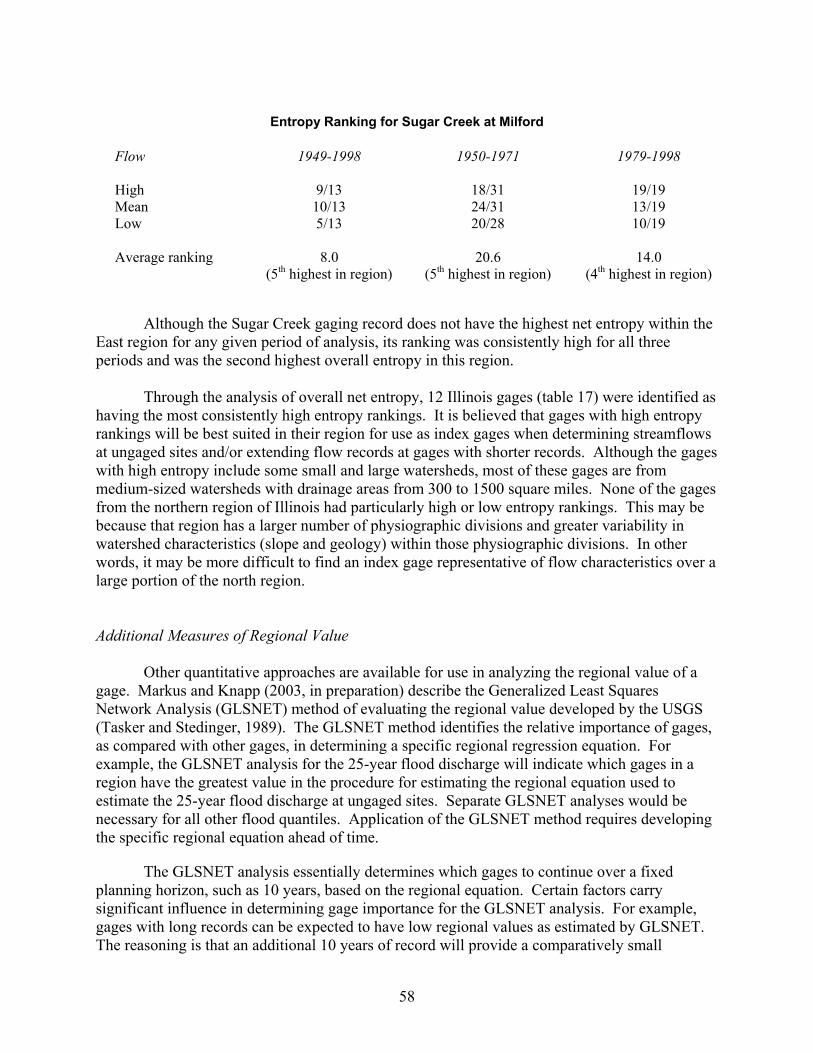
Entropy Ranking for Sugar Creek at Milford
Flow 1949-1998 1950-1971 1979-1998 High 9/13 18/31 19/19 Mean 10/13 24/31 13/19 Low 5/13 20/28 10/19 Average ranking 8.0 20.6 14.0 (5th highest in region) (5th highest in region) (4th highest in region)
Although the Sugar Creek gaging record does not have the highest net entropy within the East region for any given period of analysis, its ranking was consistently high for all three periods and was the second highest overall entropy in this region.
Through the analysis of overall net entropy, 12 Illinois gages (table 17) were identified as having the most consistently high entropy rankings. It is believed that gages with high entropy rankings will be best suited in their region for use as index gages when determining streamflows at ungaged sites and/or extending flow records at gages with shorter records. Although the gages with high entropy include some small and large watersheds, most of these gages are from medium-sized watersheds with drainage areas from 300 to 1500 square miles. None of the gages from the northern region of Illinois had particularly high or low entropy rankings. This may be because that region has a larger number of physiographic divisions and greater variability in watershed characteristics (slope and geology) within those physiographic divisions. In other words, it may be more difficult to find an index gage representative of flow characteristics over a large portion of the north region.
Additional Measures of Regional Value
Other quantitative approaches are available for use in analyzing the regional value of a gage. Markus and Knapp (2003, in preparation) describe the Generalized Least Squares Network Analysis (GLSNET) method of evaluating the regional value developed by the USGS (Tasker and Stedinger, 1989). The GLSNET method identifies the relative importance of gages, as compared with other gages, in determining a specific regional regression equation. For example, the GLSNET analysis for the 25-year flood discharge will indicate which gages in a region have the greatest value in the procedure for estimating the regional equation used to estimate the 25-year flood discharge at ungaged sites. Separate GLSNET analyses would be necessary for all other flood quantiles. Application of the GLSNET method requires developing the specific regional equation ahead of time.
The GLSNET analysis essentially determines which gages to continue over a fixed planning horizon, such as 10 years, based on the regional equation. Certain factors carry significant influence in determining gage importance for the GLSNET analysis. For example, gages with long records can be expected to have low regional values as estimated by GLSNET. The reasoning is that an additional 10 years of record will provide a comparatively small
58
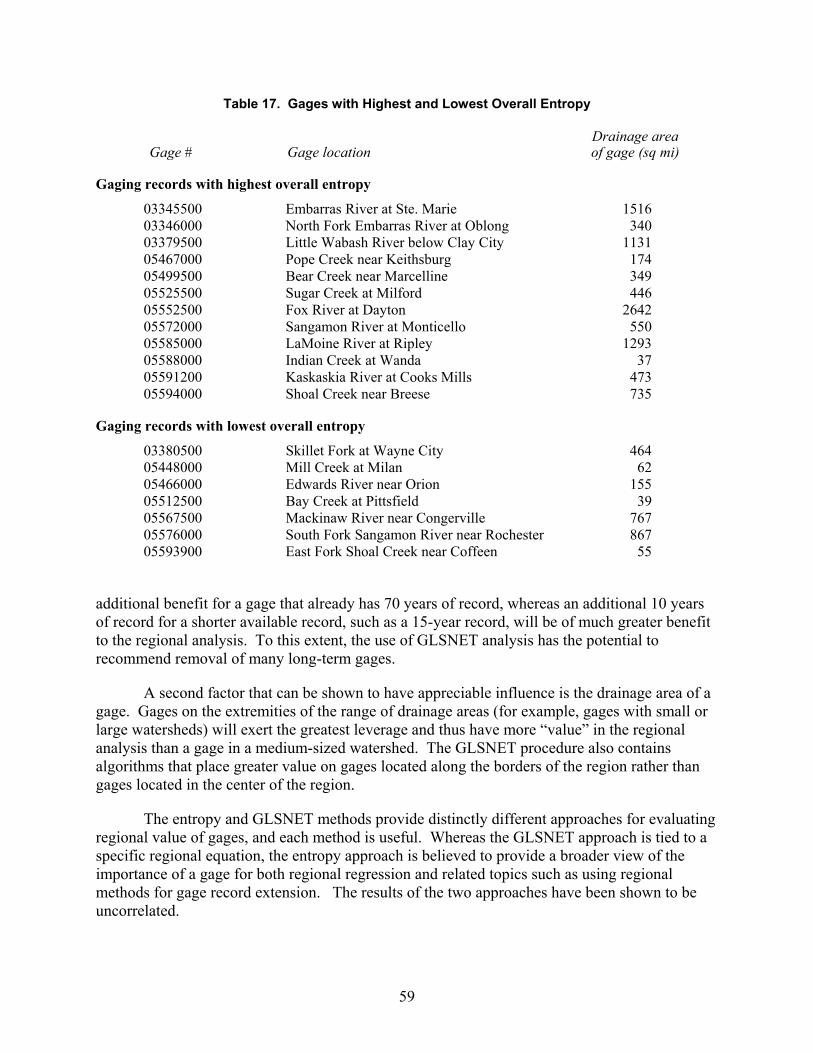
Table 17. Gages with Highest and Lowest Overall Entropy Drainage area Gage # Gage location of gage (sq mi) Gaging records with highest overall entropy
03345500 Embarras River at Ste. Marie 1516 03346000 North Fork Embarras River at Oblong 340 03379500 Little Wabash River below Clay City 1131 05467000 Pope Creek near Keithsburg 174 05499500 Bear Creek near Marcelline 349 05525500 Sugar Creek at Milford 446 05552500 Fox River at Dayton 2642 05572000 Sangamon River at Monticello 550 05585000 LaMoine River at Ripley 1293 05588000 Indian Creek at Wanda 37 05591200 Kaskaskia River at Cooks Mills 473 05594000 Shoal Creek near Breese 735 Gaging records with lowest overall entropy
03380500 Skillet Fork at Wayne City 464 05448000 Mill Creek at Milan 62 05466000 Edwards River near Orion 155 05512500 Bay Creek at Pittsfield 39 05567500 Mackinaw River near Congerville 767 05576000 South Fork Sangamon River near Rochester 867 05593900 East Fork Shoal Creek near Coffeen 55
additional benefit for a gage that already has 70 years of record, whereas an additional 10 years of record for a shorter available record, such as a 15-year record, will be of much greater benefit to the regional analysis. To this extent, the use of GLSNET analysis has the potential to recommend removal of many long-term gages.
A second factor that can be shown to have appreciable influence is the drainage area of a gage. Gages on the extremities of the range of drainage areas (for example, gages with small or large watersheds) will exert the greatest leverage and thus have more “value” in the regional analysis than a gage in a medium-sized watershed. The GLSNET procedure also contains algorithms that place greater value on gages located along the borders of the region rather than gages located in the center of the region.
The entropy and GLSNET methods provide distinctly different approaches for evaluating regional value of gages, and each method is useful. Whereas the GLSNET approach is tied to a specific regional equation, the entropy approach is believed to provide a broader view of the importance of a gage for both regional regression and related topics such as using regional methods for gage record extension. The results of the two approaches have been shown to be uncorrelated.
59
Although the entropy analysis and GLSNET method provide sound scientific approaches, the authors do not recommend developing a gage ranking by one of these methods as the only criterion for determining regional value. Choosing which gages to continue or discontinue for their regional value can involve a considerably greater number of factors than are included in these mathematical/statistical methods. Some other important factors are still perhaps best addressed in descriptive assessments. Descriptive Assessments of Regional Value
Several basic qualities of the regional value of a gage or network can be evaluated in a descriptive or qualitative manner. Four important qualities of gages, streams, and watersheds are related to regional value:
1. Extent of human modifications in a gage’s watershed 2. Geographic coverage of gages within a region 3. Watershed characteristics 4. Length and period of record at a gage
Hydrologic Modifications to the Watershed
Many Illinois streams have been impacted by various types of hydrologic changes within their watershed. Construction of a reservoir, a water use diversion, or a wastewater treatment facility are examples of changes that can impact streamflow quantity. When there have been noticeable impacts from modifications of this type, streamflows usually give limited information on the flow conditions for other streams within the region. Substantial changes in land-use changes, such as urbanization, also may render a gage’s record useless in regional analysis.
Table 18 provides a list of gages categorized by the extent of hydrologic change in their watersheds, and the expected usefulness of these records for regional analysis. Categories are defined in table 18 and are assigned a letter from A to J:
Category Description A Rural or mostly rural watershed: Minimal modification of flows.
B Rural or mostly rural watershed: Comparatively small modification of low flows by upstream water use. Appropriate for regional studies, but some adjustment may be advisable for low-flow studies.
C Rural or mostly rural watershed: Comparatively small modification of flows. Appropriate for regional studies, but as yet may be limited for some drought or low-flow studies by a comparatively short record (<30 years).
D Rural or mostly rural watershed: Upstream water use has had moderate impacts on low flows. For regional analysis, low-flow records should be adjusted to account for water use.
E Rural or mostly rural watershed: There have been appreciable impacts on low-flows from wastewater effluents, water-supply withdrawals, or reservoirs. Appropriate for regional studies of high and medium flows.
60
Category Description F Crest-stage gages: Appropriate for regional studies of flood frequency.
G Watershed spans two or more physiographic regions: May limit use of the gage for regional studies. Many gages are in larger watersheds, and upstream water use has had impacts on flows of several gages, which also should be examined before using them for regional studies.
H Watershed on fringes of an urbanizing (or suburbanizing) area and likely to be subject to future land-use changes and flow modification: Wastewater discharges already have impacts on some locations, as noted. Some locations may be appropriate for use in regional analysis, but this use likely will be compromised over time.
I Mostly urban, suburban, or urbanizing watershed: Flows are appreciably altered from their natural condition.
J Appreciable modification of all flow conditions by diversion, water use, or reservoir(s): Not appropriate for regional analysis.
The 29 gages listed in category A (table 18) have the least overall impairment from
human modifications and thus can be expected to be the most consistently useful for regional analysis. Flow records for 14 other gages in category C have minimal hydrologic modification, are generally appropriate for regional studies, but have less than 30 years of record. Their record length may limit their usefulness for regional studies of low flow and drought frequency (see “Lengths and Period of Record”).
Sixty-three gages in categories I and J, roughly 40 percent of the network, are not considered appropriate for most regional analyses due to flow impacts from urbanization or reservoirs. A large number of gages in the remaining categories may have limited use for some regional studies either because there is some watershed or water-use modification or because the watershed being gaged spans two or more physiographic regions. Many water-use modifications may affect low-flow analysis for a gage record, but not impair its use for high-flow analysis. Thus, a larger number of gages in the network have records considered useful for regional flood studies.
Water-use and land-use modification within watersheds also impair the use of gaging records for the analysis of long-term statistics and trends analyses. The Hydro-Climatic Data Network (HCDN), developed by Slack and Landwehr (1992), identifies gaging records that are appropriate for use in analyzing long-term hydrologic trends related to climate variability. The Illinois gages included in the HCDN generally fall within categories A, B, and G (table 18).
Geographic Coverage of Gages
In conducting regional analysis, gages are separated into geographic regions in which the streams display (or are believed to have) similar hydrologic characteristics. Even within a homogeneous region, there will be variability in streamflow characteristics due to watershed size, length, channel slope, etc. For the development of equations to predict streamflow at ungaged sites, a network should represent the full range of geographic conditions in the State, including soil types, land uses, topography, and a range of watershed sizes (Preston, 1997).
61
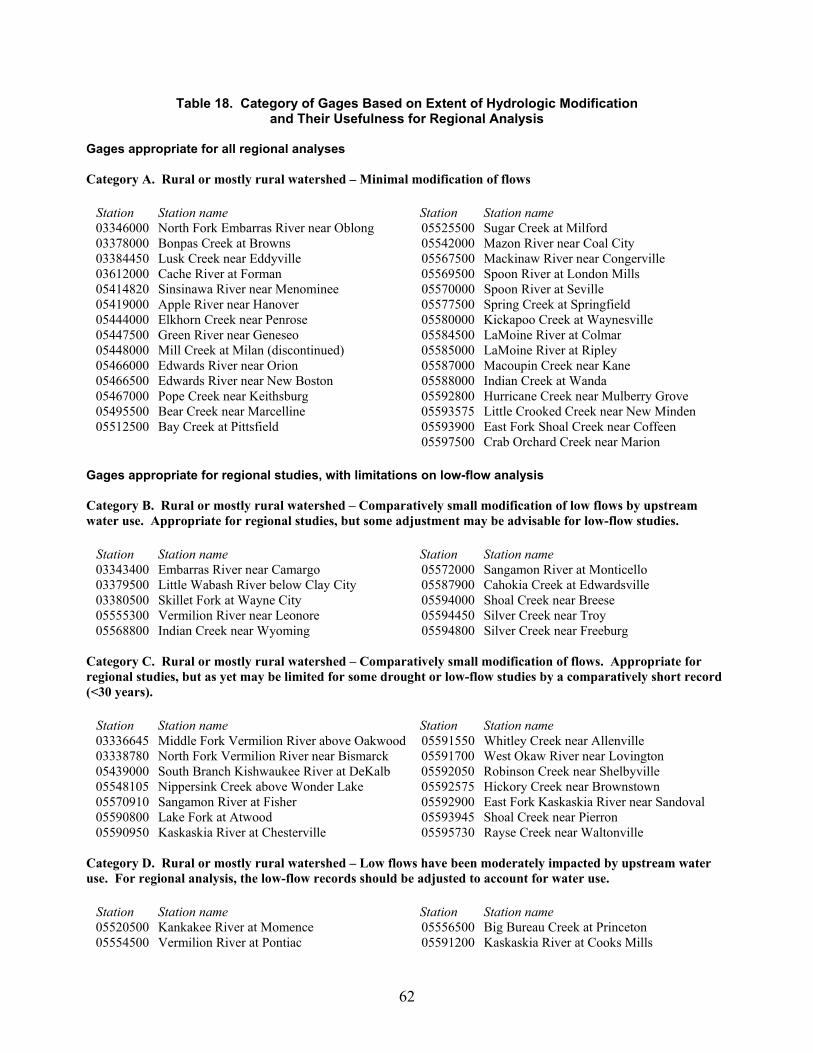
Table 18. Category of Gages Based on Extent of Hydrologic Modification and Their Usefulness for Regional Analysis
Gages appropriate for all regional analyses Category A. Rural or mostly rural watershed – Minimal modification of flows Station Station name Station Station name 03346000 North Fork Embarras River near Oblong 05525500 Sugar Creek at Milford 03378000 Bonpas Creek at Browns 05542000 Mazon River near Coal City 03384450 Lusk Creek near Eddyville 05567500 Mackinaw River near Congerville 03612000 Cache River at Forman 05569500 Spoon River at London Mills 05414820 Sinsinawa River near Menominee 05570000 Spoon River at Seville 05419000 Apple River near Hanover 05577500 Spring Creek at Springfield 05444000 Elkhorn Creek near Penrose 05580000 Kickapoo Creek at Waynesville 05447500 Green River near Geneseo 05584500 LaMoine River at Colmar 05448000 Mill Creek at Milan (discontinued) 05585000 LaMoine River at Ripley 05466000 Edwards River near Orion 05587000 Macoupin Creek near Kane 05466500 Edwards River near New Boston 05588000 Indian Creek at Wanda 05467000 Pope Creek near Keithsburg 05592800 Hurricane Creek near Mulberry Grove 05495500 Bear Creek near Marcelline 05593575 Little Crooked Creek near New Minden 05512500 Bay Creek at Pittsfield 05593900 East Fork Shoal Creek near Coffeen 05597500 Crab Orchard Creek near Marion Gages appropriate for regional studies, with limitations on low-flow analysis Category B. Rural or mostly rural watershed – Comparatively small modification of low flows by upstream water use. Appropriate for regional studies, but some adjustment may be advisable for low-flow studies. Station Station name Station Station name 03343400 Embarras River near Camargo 05572000 Sangamon River at Monticello 03379500 Little Wabash River below Clay City 05587900 Cahokia Creek at Edwardsville 03380500 Skillet Fork at Wayne City 05594000 Shoal Creek near Breese 05555300 Vermilion River near Leonore 05594450 Silver Creek near Troy 05568800 Indian Creek near Wyoming 05594800 Silver Creek near Freeburg Category C. Rural or mostly rural watershed – Comparatively small modification of flows. Appropriate for regional studies, but as yet may be limited for some drought or low-flow studies by a comparatively short record (<30 years). Station Station name Station Station name 03336645 Middle Fork Vermilion River above Oakwood 05591550 Whitley Creek near Allenville 03338780 North Fork Vermilion River near Bismarck 05591700 West Okaw River near Lovington 05439000 South Branch Kishwaukee River at DeKalb 05592050 Robinson Creek near Shelbyville 05548105 Nippersink Creek above Wonder Lake 05592575 Hickory Creek near Brownstown 05570910 Sangamon River at Fisher 05592900 East Fork Kaskaskia River near Sandoval 05590800 Lake Fork at Atwood 05593945 Shoal Creek near Pierron 05590950 Kaskaskia River at Chesterville 05595730 Rayse Creek near Waltonville Category D. Rural or mostly rural watershed – Low flows have been moderately impacted by upstream water use. For regional analysis, the low-flow records should be adjusted to account for water use. Station Station name Station Station name 05520500 Kankakee River at Momence 05556500 Big Bureau Creek at Princeton 05554500 Vermilion River at Pontiac 05591200 Kaskaskia River at Cooks Mills
62
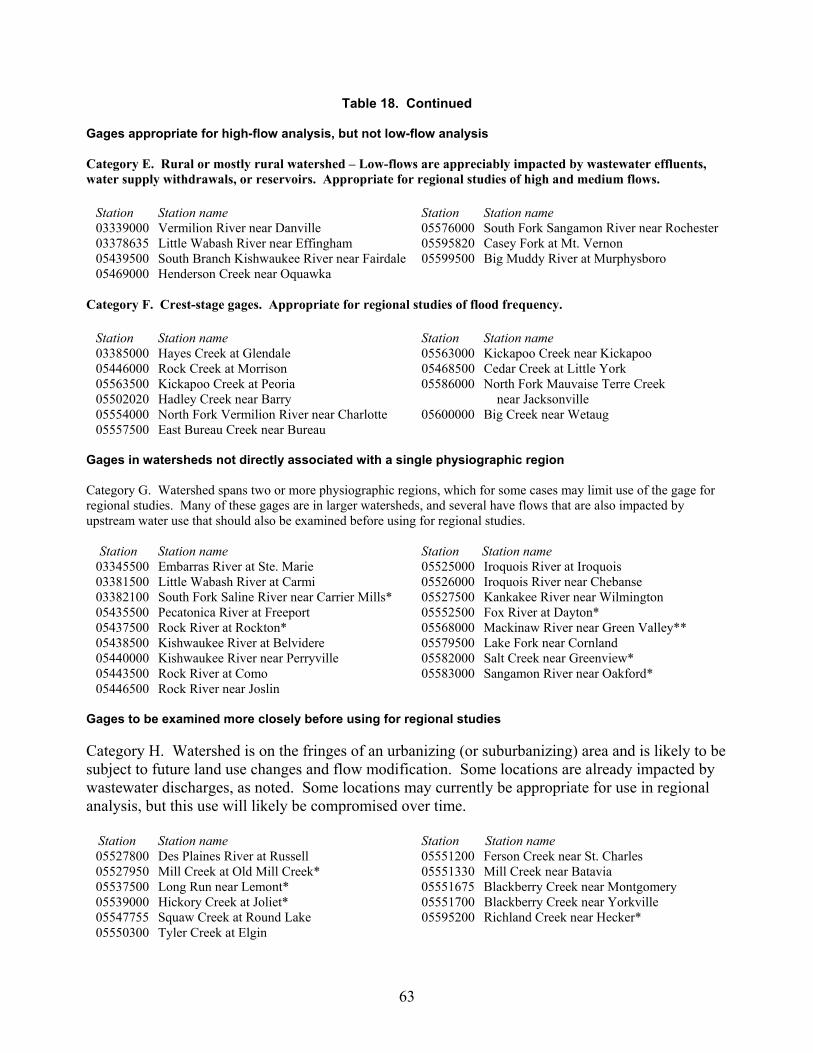
Table 18. Continued Gages appropriate for high-flow analysis, but not low-flow analysis Category E. Rural or mostly rural watershed – Low-flows are appreciably impacted by wastewater effluents, water supply withdrawals, or reservoirs. Appropriate for regional studies of high and medium flows. Station Station name Station Station name 03339000 Vermilion River near Danville 05576000 South Fork Sangamon River near Rochester 03378635 Little Wabash River near Effingham 05595820 Casey Fork at Mt. Vernon 05439500 South Branch Kishwaukee River near Fairdale 05599500 Big Muddy River at Murphysboro 05469000 Henderson Creek near Oquawka Category F. Crest-stage gages. Appropriate for regional studies of flood frequency. Station Station name Station Station name 03385000 Hayes Creek at Glendale 05563000 Kickapoo Creek near Kickapoo 05446000 Rock Creek at Morrison 05468500 Cedar Creek at Little York 05563500 Kickapoo Creek at Peoria 05586000 North Fork Mauvaise Terre Creek 05502020 Hadley Creek near Barry near Jacksonville 05554000 North Fork Vermilion River near Charlotte 05600000 Big Creek near Wetaug 05557500 East Bureau Creek near Bureau Gages in watersheds not directly associated with a single physiographic region Category G. Watershed spans two or more physiographic regions, which for some cases may limit use of the gage for regional studies. Many of these gages are in larger watersheds, and several have flows that are also impacted by upstream water use that should also be examined before using for regional studies. Station Station name Station Station name 03345500 Embarras River at Ste. Marie 05525000 Iroquois River at Iroquois 03381500 Little Wabash River at Carmi 05526000 Iroquois River near Chebanse 03382100 South Fork Saline River near Carrier Mills* 05527500 Kankakee River near Wilmington 05435500 Pecatonica River at Freeport 05552500 Fox River at Dayton* 05437500 Rock River at Rockton* 05568000 Mackinaw River near Green Valley** 05438500 Kishwaukee River at Belvidere 05579500 Lake Fork near Cornland 05440000 Kishwaukee River near Perryville 05582000 Salt Creek near Greenview* 05443500 Rock River at Como 05583000 Sangamon River near Oakford* 05446500 Rock River near Joslin Gages to be examined more closely before using for regional studies Category H. Watershed is on the fringes of an urbanizing (or suburbanizing) area and is likely to be subject to future land use changes and flow modification. Some locations are already impacted by wastewater discharges, as noted. Some locations may currently be appropriate for use in regional analysis, but this use will likely be compromised over time. Station Station name Station Station name 05527800 Des Plaines River at Russell 05551200 Ferson Creek near St. Charles 05527950 Mill Creek at Old Mill Creek* 05551330 Mill Creek near Batavia 05537500 Long Run near Lemont* 05551675 Blackberry Creek near Montgomery 05539000 Hickory Creek at Joliet* 05551700 Blackberry Creek near Yorkville 05547755 Squaw Creek at Round Lake 05595200 Richland Creek near Hecker* 05550300 Tyler Creek at Elgin
63
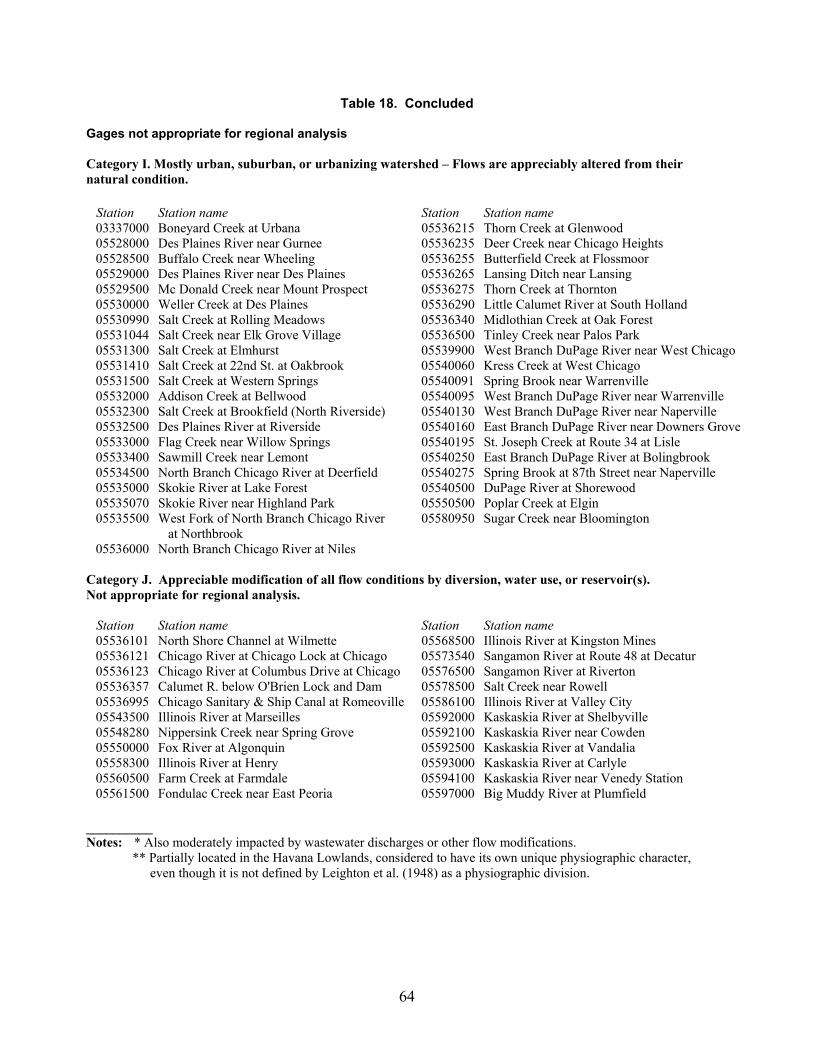
Table 18. Concluded Gages not appropriate for regional analysis Category I. Mostly urban, suburban, or urbanizing watershed – Flows are appreciably altered from their natural condition. Station Station name Station Station name 03337000 Boneyard Creek at Urbana 05536215 Thorn Creek at Glenwood 05528000 Des Plaines River near Gurnee 05536235 Deer Creek near Chicago Heights 05528500 Buffalo Creek near Wheeling 05536255 Butterfield Creek at Flossmoor 05529000 Des Plaines River near Des Plaines 05536265 Lansing Ditch near Lansing 05529500 Mc Donald Creek near Mount Prospect 05536275 Thorn Creek at Thornton 05530000 Weller Creek at Des Plaines 05536290 Little Calumet River at South Holland 05530990 Salt Creek at Rolling Meadows 05536340 Midlothian Creek at Oak Forest 05531044 Salt Creek near Elk Grove Village 05536500 Tinley Creek near Palos Park 05531300 Salt Creek at Elmhurst 05539900 West Branch DuPage River near West Chicago 05531410 Salt Creek at 22nd St. at Oakbrook 05540060 Kress Creek at West Chicago 05531500 Salt Creek at Western Springs 05540091 Spring Brook near Warrenville 05532000 Addison Creek at Bellwood 05540095 West Branch DuPage River near Warrenville 05532300 Salt Creek at Brookfield (North Riverside) 05540130 West Branch DuPage River near Naperville 05532500 Des Plaines River at Riverside 05540160 East Branch DuPage River near Downers Grove 05533000 Flag Creek near Willow Springs 05540195 St. Joseph Creek at Route 34 at Lisle 05533400 Sawmill Creek near Lemont 05540250 East Branch DuPage River at Bolingbrook 05534500 North Branch Chicago River at Deerfield 05540275 Spring Brook at 87th Street near Naperville 05535000 Skokie River at Lake Forest 05540500 DuPage River at Shorewood 05535070 Skokie River near Highland Park 05550500 Poplar Creek at Elgin 05535500 West Fork of North Branch Chicago River 05580950 Sugar Creek near Bloomington at Northbrook 05536000 North Branch Chicago River at Niles Category J. Appreciable modification of all flow conditions by diversion, water use, or reservoir(s). Not appropriate for regional analysis. Station Station name Station Station name 05536101 North Shore Channel at Wilmette 05568500 Illinois River at Kingston Mines 05536121 Chicago River at Chicago Lock at Chicago 05573540 Sangamon River at Route 48 at Decatur 05536123 Chicago River at Columbus Drive at Chicago 05576500 Sangamon River at Riverton 05536357 Calumet R. below O'Brien Lock and Dam 05578500 Salt Creek near Rowell 05536995 Chicago Sanitary & Ship Canal at Romeoville 05586100 Illinois River at Valley City 05543500 Illinois River at Marseilles 05592000 Kaskaskia River at Shelbyville 05548280 Nippersink Creek near Spring Grove 05592100 Kaskaskia River near Cowden 05550000 Fox River at Algonquin 05592500 Kaskaskia River at Vandalia 05558300 Illinois River at Henry 05593000 Kaskaskia River at Carlyle 05560500 Farm Creek at Farmdale 05594100 Kaskaskia River near Venedy Station 05561500 Fondulac Creek near East Peoria 05597000 Big Muddy River at Plumfield
__________ Notes: * Also moderately impacted by wastewater discharges or other flow modifications.
** Partially located in the Havana Lowlands, considered to have its own unique physiographic character, even though it is not defined by Leighton et al. (1948) as a physiographic division.
64
There is no definitive rule on how many gages are necessary in each region to develop predictive equations. Singh et al. (1986) recommended that the number of gages should be distributed proportionally to the logarithms of their drainage areas and, to relate the impact of watershed size on flows, at least three gages for every logarithmic cycle (base 10) seems advisable. Thus, if an equation were to be applied to watersheds from 1 to 1000 square miles, then at least 9 gages of varying watershed size should be used for regional analysis. If the watershed is geographically large, if there is considerable hydrologic variability in the region, or if more than one physical factor is used as an independent variable in the predictive equation, then the number of gages in the region should be even greater.
Table 19 lists gages that are, to various degrees, appropriate for use in regional analysis as designated by categories A-E (table 18). The gages in table 19 are classified by physiographic divisions in Illinois, as shown in figure 10 and are also ranked by drainage area. There are a comparatively large number of gages in the three largest physiographic divisions in the State, the Bloomington Ridged Plain, Springfield Plain, and Galesburg Plain; however, some gages in these regions have limited value because of flow modification or a short period of record. Some smaller physiographic divisions have only one or two gages, which is insufficient for developing separate sets of predictive equations for these regions, but understandable given the sizes of these divisions.
Of all the physiographic divisions, there is an obvious shortcoming in the number of gages in the Rock River Hill Country, the fifth largest physiographic division in Illinois but with only one gage listed in table 19. Many gages are on the large rivers that flow through this region, including seven gages on the Rock, Pecatonica, and Kishwaukee Rivers, but these large rivers span several physiographic boundaries, and have limited use for most regional analyses. Clearly, there should be more gages in this portion of Illinois for regional analyses. Gages located on the same stream in close proximity can be expected to provide duplicate information for use in regional analysis, trend analysis, and use in developing long-term statistics. Examples of gages that may provide duplicate data include the two gages on Shoal Creek near Breese and near Pierron, and the two gages on the Kaskaskia River at Cooks Mills and at Chesterville. If both gages within these pairs are to be retained, there should be distinct current-use needs for each gage.
Watershed Characteristics
In the development of regional regression equations or other methods used to predict streamflows at ungaged sites, a select set of watershed characteristics is used to explain the difference in flow conditions among various locations.
These equations are appropriate for a given site only when its watershed characteristics fall within the range of characteristics exhibited by the gage locations used to develop the equations. Thus, it is generally not appropriate to use a regional equation to estimate streamflow characteristics for a 10-square-mile watershed when the only gage records in that region are from watersheds greater than 50 square miles. The most common applications for regional analysis are related to the estimation of flood and low-flow frequency characteristics for comparatively
65
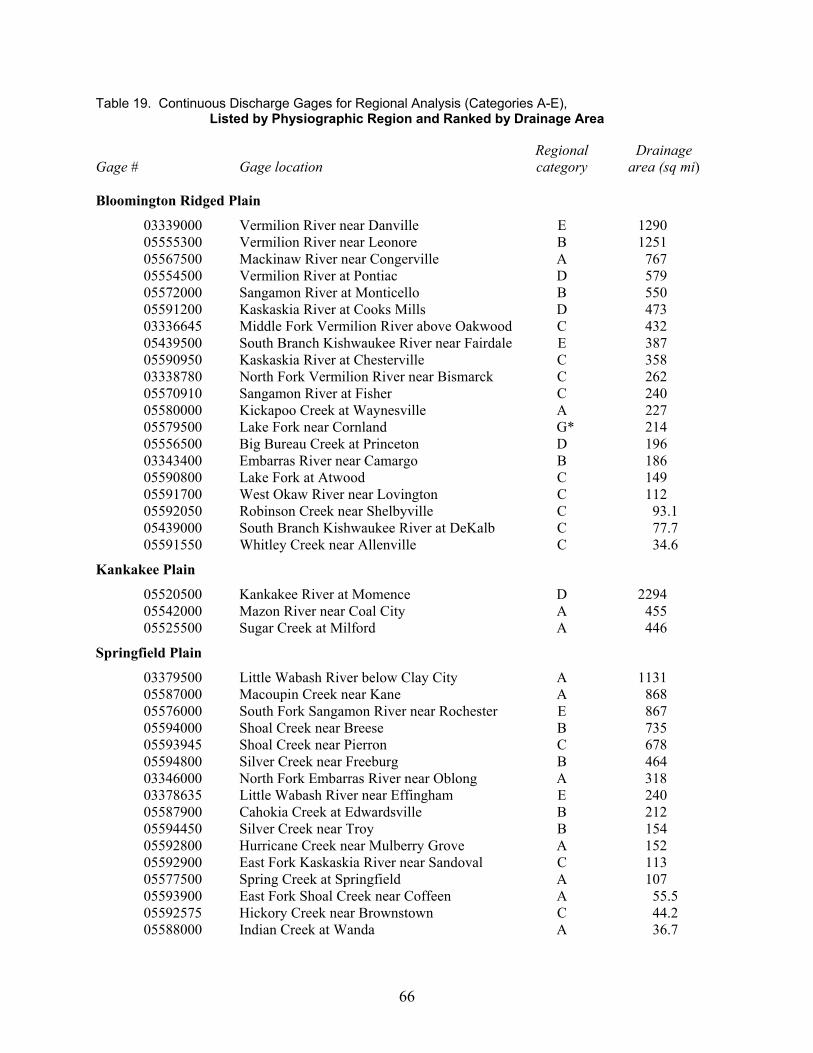
Table 19. Continuous Discharge Gages for Regional Analysis (Categories A-E), Listed by Physiographic Region and Ranked by Drainage Area
Regional Drainage Gage # Gage location category area (sq mi) Bloomington Ridged Plain
03339000 Vermilion River near Danville E 1290 05555300 Vermilion River near Leonore B 1251 05567500 Mackinaw River near Congerville A 767 05554500 Vermilion River at Pontiac D 579 05572000 Sangamon River at Monticello B 550 05591200 Kaskaskia River at Cooks Mills D 473 03336645 Middle Fork Vermilion River above Oakwood C 432 05439500 South Branch Kishwaukee River near Fairdale E 387 05590950 Kaskaskia River at Chesterville C 358 03338780 North Fork Vermilion River near Bismarck C 262 05570910 Sangamon River at Fisher C 240 05580000 Kickapoo Creek at Waynesville A 227 05579500 Lake Fork near Cornland G* 214 05556500 Big Bureau Creek at Princeton D 196 03343400 Embarras River near Camargo B 186 05590800 Lake Fork at Atwood C 149 05591700 West Okaw River near Lovington C 112 05592050 Robinson Creek near Shelbyville C 93.1 05439000 South Branch Kishwaukee River at DeKalb C 77.7 05591550 Whitley Creek near Allenville C 34.6
Kankakee Plain
05520500 Kankakee River at Momence D 2294 05542000 Mazon River near Coal City A 455 05525500 Sugar Creek at Milford A 446
Springfield Plain
03379500 Little Wabash River below Clay City A 1131 05587000 Macoupin Creek near Kane A 868 05576000 South Fork Sangamon River near Rochester E 867 05594000 Shoal Creek near Breese B 735 05593945 Shoal Creek near Pierron C 678 05594800 Silver Creek near Freeburg B 464 03346000 North Fork Embarras River near Oblong A 318 03378635 Little Wabash River near Effingham E 240 05587900 Cahokia Creek at Edwardsville B 212 05594450 Silver Creek near Troy B 154 05592800 Hurricane Creek near Mulberry Grove A 152 05592900 East Fork Kaskaskia River near Sandoval C 113 05577500 Spring Creek at Springfield A 107 05593900 East Fork Shoal Creek near Coffeen A 55.5 05592575 Hickory Creek near Brownstown C 44.2 05588000 Indian Creek at Wanda A 36.7
66
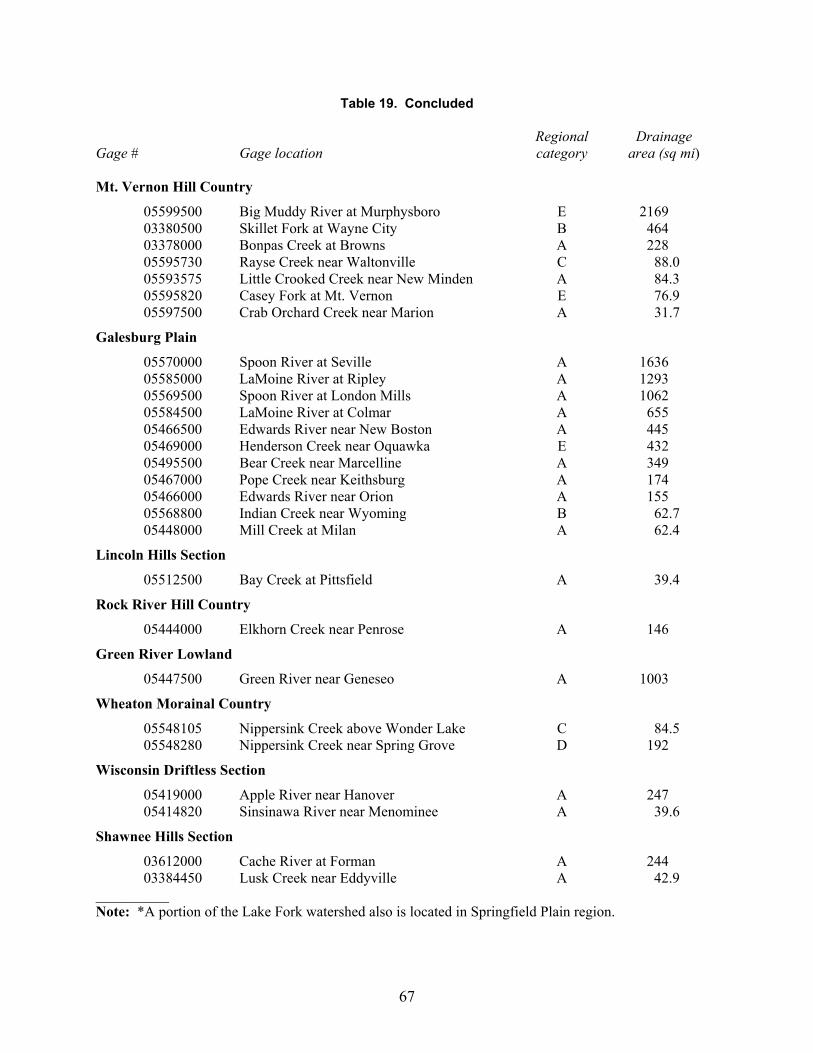
Table 19. Concluded Regional Drainage Gage # Gage location category area (sq mi) Mt. Vernon Hill Country
05599500 Big Muddy River at Murphysboro E 2169 03380500 Skillet Fork at Wayne City B 464 03378000 Bonpas Creek at Browns A 228 05595730 Rayse Creek near Waltonville C 88.0 05593575 Little Crooked Creek near New Minden A 84.3 05595820 Casey Fork at Mt. Vernon E 76.9 05597500 Crab Orchard Creek near Marion A 31.7
Galesburg Plain
05570000 Spoon River at Seville A 1636 05585000 LaMoine River at Ripley A 1293 05569500 Spoon River at London Mills A 1062 05584500 LaMoine River at Colmar A 655 05466500 Edwards River near New Boston A 445 05469000 Henderson Creek near Oquawka E 432 05495500 Bear Creek near Marcelline A 349 05467000 Pope Creek near Keithsburg A 174 05466000 Edwards River near Orion A 155 05568800 Indian Creek near Wyoming B 62.7 05448000 Mill Creek at Milan A 62.4
Lincoln Hills Section
05512500 Bay Creek at Pittsfield A 39.4
Rock River Hill Country
05444000 Elkhorn Creek near Penrose A 146
Green River Lowland
05447500 Green River near Geneseo A 1003
Wheaton Morainal Country
05548105 Nippersink Creek above Wonder Lake C 84.5 05548280 Nippersink Creek near Spring Grove D 192
Wisconsin Driftless Section
05419000 Apple River near Hanover A 247 05414820 Sinsinawa River near Menominee A 39.6
Shawnee Hills Section
03612000 Cache River at Forman A 244 03384450 Lusk Creek near Eddyville A 42.9 __________ Note: *A portion of the Lake Fork watershed also is located in Springfield Plain region.
67
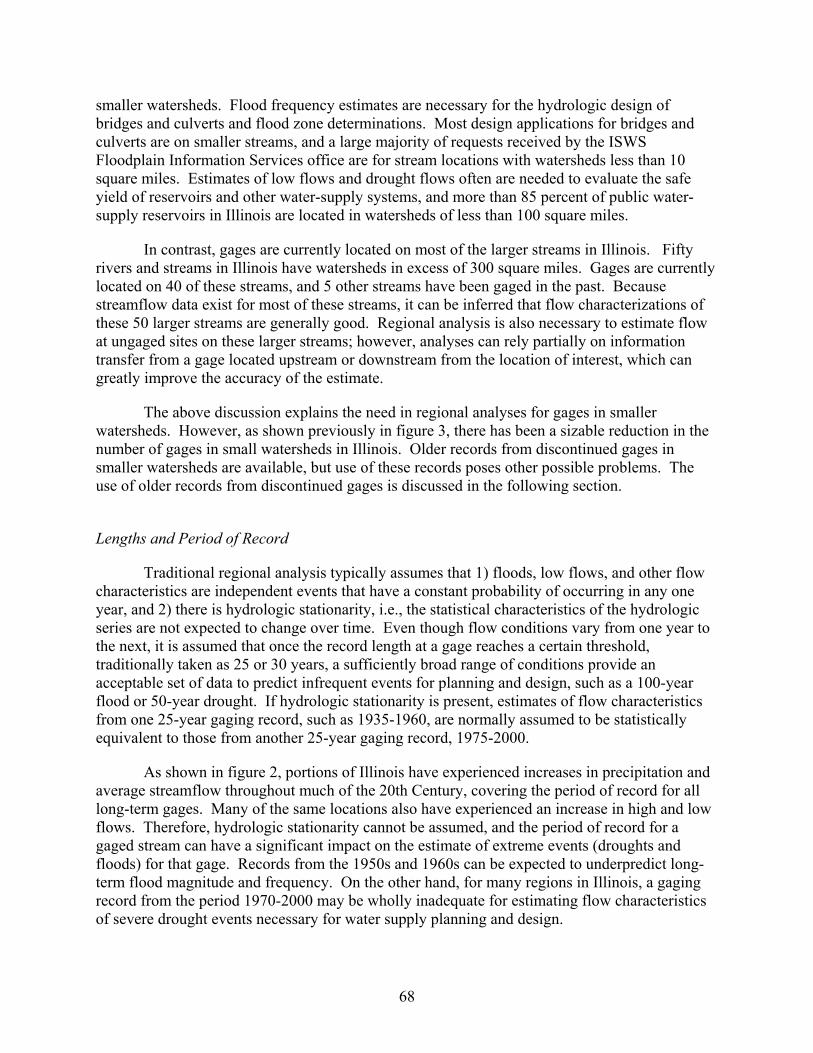
smaller watersheds. Flood frequency estimates are necessary for the hydrologic design of bridges and culverts and flood zone determinations. Most design applications for bridges and culverts are on smaller streams, and a large majority of requests received by the ISWS Floodplain Information Services office are for stream locations with watersheds less than 10 square miles. Estimates of low flows and drought flows often are needed to evaluate the safe yield of reservoirs and other water-supply systems, and more than 85 percent of public water-supply reservoirs in Illinois are located in watersheds of less than 100 square miles.
In contrast, gages are currently located on most of the larger streams in Illinois. Fifty rivers and streams in Illinois have watersheds in excess of 300 square miles. Gages are currently located on 40 of these streams, and 5 other streams have been gaged in the past. Because streamflow data exist for most of these streams, it can be inferred that flow characterizations of these 50 larger streams are generally good. Regional analysis is also necessary to estimate flow at ungaged sites on these larger streams; however, analyses can rely partially on information transfer from a gage located upstream or downstream from the location of interest, which can greatly improve the accuracy of the estimate.
The above discussion explains the need in regional analyses for gages in smaller watersheds. However, as shown previously in figure 3, there has been a sizable reduction in the number of gages in small watersheds in Illinois. Older records from discontinued gages in smaller watersheds are available, but use of these records poses other possible problems. The use of older records from discontinued gages is discussed in the following section.
Lengths and Period of Record
Traditional regional analysis typically assumes that 1) floods, low flows, and other flow characteristics are independent events that have a constant probability of occurring in any one year, and 2) there is hydrologic stationarity, i.e., the statistical characteristics of the hydrologic series are not expected to change over time. Even though flow conditions vary from one year to the next, it is assumed that once the record length at a gage reaches a certain threshold, traditionally taken as 25 or 30 years, a sufficiently broad range of conditions provide an acceptable set of data to predict infrequent events for planning and design, such as a 100-year flood or 50-year drought. If hydrologic stationarity is present, estimates of flow characteristics from one 25-year gaging record, such as 1935-1960, are normally assumed to be statistically equivalent to those from another 25-year gaging record, 1975-2000.
As shown in figure 2, portions of Illinois have experienced increases in precipitation and average streamflow throughout much of the 20th Century, covering the period of record for all long-term gages. Many of the same locations also have experienced an increase in high and low flows. Therefore, hydrologic stationarity cannot be assumed, and the period of record for a gaged stream can have a significant impact on the estimate of extreme events (droughts and floods) for that gage. Records from the 1950s and 1960s can be expected to underpredict long-term flood magnitude and frequency. On the other hand, for many regions in Illinois, a gaging record from the period 1970-2000 may be wholly inadequate for estimating flow characteristics of severe drought events necessary for water supply planning and design.
68
Because hydrologic conditions are not stationary, gaging records covering periods of 50 years or more are extremely valuable for both the evaluation of hydrologic trends and regional analysis for the prediction of long-term flow frequencies. Thus, priority also should be placed on maintaining long-term gages that continue to be appropriate for regional analysis (table 18).
Future Needs for Characterizing Flows at Ungaged Sites
Although the estimation of flow characteristics at ungaged sites continues to be a stated goal of the USGS Streamflow Gaging Network, it appears that regionalization has not been a priority of the Illinois network in recent years. The erosion of streamflow gaging in small watersheds and the crest-stage peak-flow network have greatly reduced the amount of data available for regional analysis in many regions of Illinois. As noted by Benson and Carter (1973), the funding of gages for current-use needs provides a high and more direct payback, and thus it is more likely that current-use needs will take precedence over the needs for regionalization. Sizable reductions in the number of gages currently supported in the network almost certainly would continue to further reduce the network’s ability to estimate flow at ungaged sites. Small reductions in the network could possibly occur without noticeable impacts on the regional value of the network, depending on the choices made for gage termination. A small number of gages appear to have limited value for both current-use needs and regionalization.
Flood Frequency
Regional equations for the prediction of flood magnitude and frequency continue to be based to a large degree on data from the crest-stage peak-flow gages on small watersheds, most of which were operated between the late 1950s and late 1970s. There have been significant trends in flood magnitudes over portions of Illinois since that time. These older historical data may not give a complete representation of long-term flood frequency and may underpredict the magnitude of floods for planning and design. The amount of underprediction potentially could increase in the future, depending on climatic trends. The crest-stage network should be reactivated. Over time, the failure to update the peak-flow database with more recent flow records will invalidate the use of these older records and the equations based upon them. Monitoring issues related to the crest-stage network, such as improving in the accuracy of rating curves for these gages, will require additional consideration.
Detrending Techniques and the Estimation of Long-term Flow Conditions
Illinois is fortunate that its streamflow gaging network has been managed to retain long-term gages, with 78 gages having a length of record of 50 years or more. However, these long-term gages are located mostly on larger watersheds, and, by themselves, do not exhibit a broad enough range of watershed conditions for developing regional equations for prediction at ungaged sites. Numerous gage records for smaller watersheds have 15-25 years of record that may not reasonably portray long-term conditions. There is a need for more analysis to determine how hydrologic nonstationarity affects the estimation of flow frequency, and investigation also is
69
needed into techniques to detrend or extend gage records, so that shorter gaging records can be interpreted to more accurately estimate the expected long-term conditions on streams. The development of detrending techniques was identified by the NRC (1992) as one of the future needs for regional hydrology.
Gaging in Small Watersheds
Streamflow gages should be reestablished in smaller rural watersheds, particularly watersheds in the range of 10-50 square miles in which there are currently few gages. Ideally, these gages would be located in physiographic regions that currently have poor data coverage, or at sites that provide data for multiple uses, not simply regional analysis. For example, it may be advisable to locate gages upstream of either a public water-supply reservoir or a community that has experienced flooding problems. Other small watershed gaging needs, such as those related to stream and watershed restoration, are discussed in the upcoming section “Additional Issues and Potential Directions for Streamflow Gaging in Illinois.” For many cases it may be most beneficial to reactivate older discontinued gages, which already may have experienced a significant hydrologic event, such as a major drought, and, combined with the additional 10-20 years of historical data, will more quickly provide a gage record that can be used to represent long-term flow conditions.
It is roughly estimated that 25-30 additional gages would be needed in small watersheds to adequately support the estimation of regional equations for predicting long-term flow conditions for watersheds greater than 10 square miles throughout Illinois. This action would increase the number of gages in small watersheds to an amount equivalent to that present in 1970. The ISWS presently operates 10 streamflow gages in watersheds smaller than 50 square miles, most of which have flow records of less than 5 years. Some of these gages, if continued to provide long-term flow records, partially would satisfy the need for small watershed gaging in Illinois.
70
Ranking of Relative Importance of Individual Gages
Responses from streamgage cooperating agencies, results from the user survey, and the evaluation of regional value were used to rank the importance of each gage. Two separate sets of points were assigned: 1) primary points based on the importance of gages to the streamgage cooperating agencies, and 2) secondary points based on all other considerations, including quantitative and descriptive evaluations of regional value, and the responses from the Web-based questionnaire on data uses. The primary points are emphasized because current-use needs are the dominant factor in deciding whether or not to retain a gage. The secondary points are based on a number of other factors that also may be considered in deciding whether to retain or discontinue a gage.
Assignment of both primary and secondary points is subjective in nature and likely to change over time as the needs of individual cooperating agencies change. It is recommended that a detailed list or database of any additional pertinent factors be developed for use in discussions related to gages considered for potential discontinuation. Thus, the ranking of gages is provided mostly as a guide for discussion.
Other factors also potentially could be considered in selecting gages for retention or discontinuation. For example, the two gages on Shoal Creek near Breese and near Pierron are both ranked as relatively important, but are located close together with less than a 10 percent difference in their watershed areas. Even though the score for both gages is relatively high, it is possible that one of these gages could be discontinued without appreciable loss in the overall information provided by the gages.
It also should be noted that the importance of a current-use gage and the assignment of its primary points can change over time. As long as the gage remains valuable to the agency funding the gage, it likely will be continued. However, if the funding agency or other agencies no longer need the gage, its relative value can change substantially. This occurrence is less likely for gages used by a multiple agencies. Secondary points are based on factors that are likely to be more stable over time. The retention of gages with lowest ranking should be discussed in more detail by appropriate cooperating agencies. Unless these gages are being retained for some unstated purpose or some future use, potentially these gages could be discontinued in favor or reactivating a gage, or installing a new gage, at a location that could provide more valuable data and perhaps serve multiple purposes.
Table 20 ranks the gages in order of importance from most points to least points. The ranking is based on a hierarchical sorting, first by primary points and then by secondary points. The primary and secondary categories are presented below, and individual gage attributes are given in table 21. In general, it is expected that gages with the lowest number of primary points would be potential candidates for gage discontinuation (assuming that the cooperating agency agreed). However, additional consideration may be given to retaining gages that have at least 10 secondary points, even if their ranking based on primary points is low, since these gages are likely to have additional value for regional analysis.
71
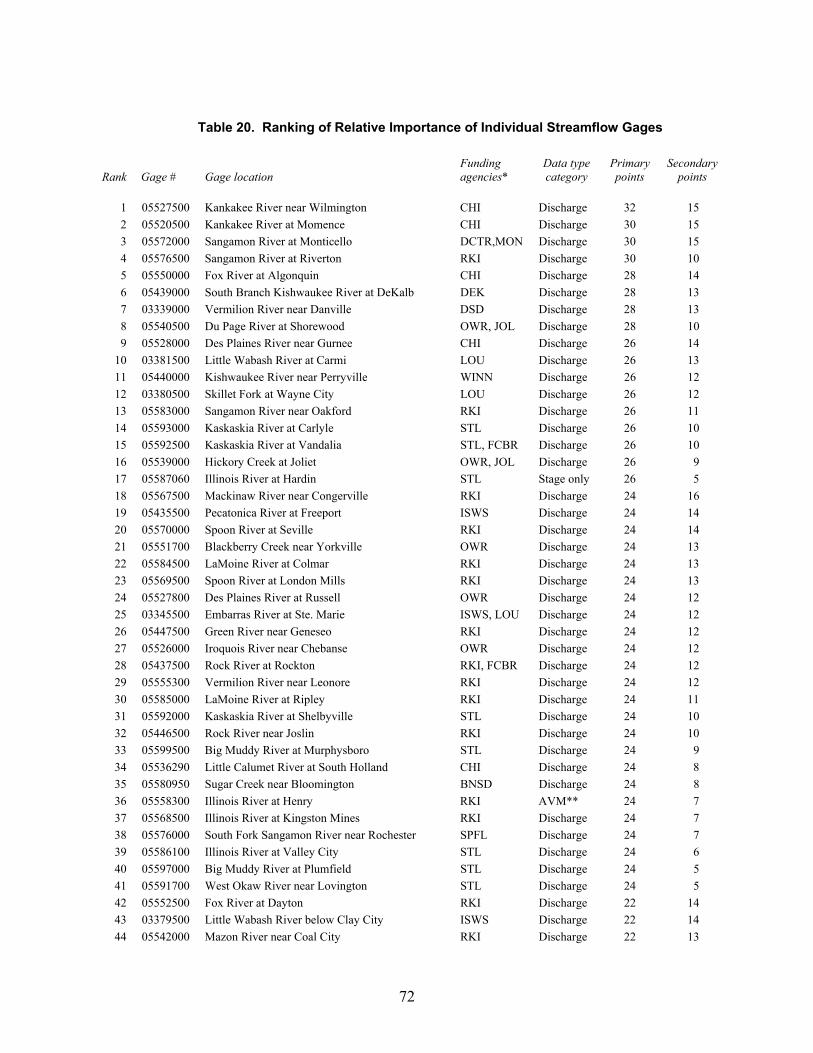
Table 20. Ranking of Relative Importance of Individual Streamflow Gages
Rank Gage # Gage location Funding agencies*
Data type category
Primary points
Secondary points
1 05527500 Kankakee River near Wilmington CHI Discharge 32 15 2 05520500 Kankakee River at Momence CHI Discharge 30 15 3 05572000 Sangamon River at Monticello DCTR,MON Discharge 30 15 4 05576500 Sangamon River at Riverton RKI Discharge 30 10 5 05550000 Fox River at Algonquin CHI Discharge 28 14 6 05439000 South Branch Kishwaukee River at DeKalb DEK Discharge 28 13 7 03339000 Vermilion River near Danville DSD Discharge 28 13 8 05540500 Du Page River at Shorewood OWR, JOL Discharge 28 10 9 05528000 Des Plaines River near Gurnee CHI Discharge 26 14
10 03381500 Little Wabash River at Carmi LOU Discharge 26 13 11 05440000 Kishwaukee River near Perryville WINN Discharge 26 12 12 03380500 Skillet Fork at Wayne City LOU Discharge 26 12 13 05583000 Sangamon River near Oakford RKI Discharge 26 11 14 05593000 Kaskaskia River at Carlyle STL Discharge 26 10 15 05592500 Kaskaskia River at Vandalia STL, FCBR Discharge 26 10 16 05539000 Hickory Creek at Joliet OWR, JOL Discharge 26 9 17 05587060 Illinois River at Hardin STL Stage only 26 5 18 05567500 Mackinaw River near Congerville RKI Discharge 24 16 19 05435500 Pecatonica River at Freeport ISWS Discharge 24 14 20 05570000 Spoon River at Seville RKI Discharge 24 14 21 05551700 Blackberry Creek near Yorkville OWR Discharge 24 13 22 05584500 LaMoine River at Colmar RKI Discharge 24 13 23 05569500 Spoon River at London Mills RKI Discharge 24 13 24 05527800 Des Plaines River at Russell OWR Discharge 24 12 25 03345500 Embarras River at Ste. Marie ISWS, LOU Discharge 24 12 26 05447500 Green River near Geneseo RKI Discharge 24 12 27 05526000 Iroquois River near Chebanse OWR Discharge 24 12 28 05437500 Rock River at Rockton RKI, FCBR Discharge 24 12 29 05555300 Vermilion River near Leonore RKI Discharge 24 12 30 05585000 LaMoine River at Ripley RKI Discharge 24 11 31 05592000 Kaskaskia River at Shelbyville STL Discharge 24 10 32 05446500 Rock River near Joslin RKI Discharge 24 10 33 05599500 Big Muddy River at Murphysboro STL Discharge 24 9 34 05536290 Little Calumet River at South Holland CHI Discharge 24 8 35 05580950 Sugar Creek near Bloomington BNSD Discharge 24 8 36 05558300 Illinois River at Henry RKI AVM** 24 7 37 05568500 Illinois River at Kingston Mines RKI Discharge 24 7 38 05576000 South Fork Sangamon River near Rochester SPFL Discharge 24 7 39 05586100 Illinois River at Valley City STL Discharge 24 6 40 05597000 Big Muddy River at Plumfield STL Discharge 24 5 41 05591700 West Okaw River near Lovington STL Discharge 24 5 42 05552500 Fox River at Dayton RKI Discharge 22 14 43 03379500 Little Wabash River below Clay City ISWS Discharge 22 14 44 05542000 Mazon River near Coal City RKI Discharge 22 13
72
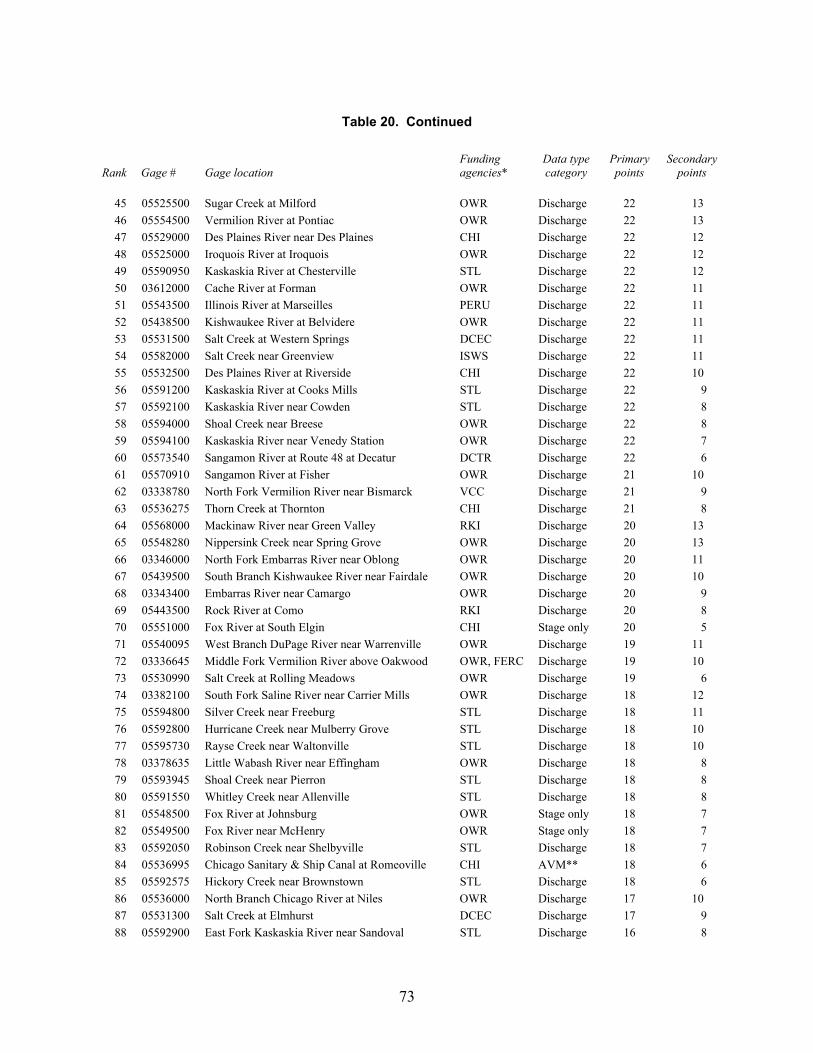
Table 20. Continued
Rank Gage # Gage location Funding agencies*
Data type category
Primary points
Secondary points
45 05525500 Sugar Creek at Milford OWR Discharge 22 13 46 05554500 Vermilion River at Pontiac OWR Discharge 22 13 47 05529000 Des Plaines River near Des Plaines CHI Discharge 22 12 48 05525000 Iroquois River at Iroquois OWR Discharge 22 12 49 05590950 Kaskaskia River at Chesterville STL Discharge 22 12 50 03612000 Cache River at Forman OWR Discharge 22 11 51 05543500 Illinois River at Marseilles PERU Discharge 22 11 52 05438500 Kishwaukee River at Belvidere OWR Discharge 22 11 53 05531500 Salt Creek at Western Springs DCEC Discharge 22 11 54 05582000 Salt Creek near Greenview ISWS Discharge 22 11 55 05532500 Des Plaines River at Riverside CHI Discharge 22 10 56 05591200 Kaskaskia River at Cooks Mills STL Discharge 22 9 57 05592100 Kaskaskia River near Cowden STL Discharge 22 8 58 05594000 Shoal Creek near Breese OWR Discharge 22 8 59 05594100 Kaskaskia River near Venedy Station OWR Discharge 22 7 60 05573540 Sangamon River at Route 48 at Decatur DCTR Discharge 22 6 61 05570910 Sangamon River at Fisher OWR Discharge 21 10 62 03338780 North Fork Vermilion River near Bismarck VCC Discharge 21 9 63 05536275 Thorn Creek at Thornton CHI Discharge 21 8 64 05568000 Mackinaw River near Green Valley RKI Discharge 20 13 65 05548280 Nippersink Creek near Spring Grove OWR Discharge 20 13 66 03346000 North Fork Embarras River near Oblong OWR Discharge 20 11 67 05439500 South Branch Kishwaukee River near Fairdale OWR Discharge 20 10 68 03343400 Embarras River near Camargo OWR Discharge 20 9 69 05443500 Rock River at Como RKI Discharge 20 8 70 05551000 Fox River at South Elgin CHI Stage only 20 5 71 05540095 West Branch DuPage River near Warrenville OWR Discharge 19 11 72 03336645 Middle Fork Vermilion River above Oakwood OWR, FERC Discharge 19 10 73 05530990 Salt Creek at Rolling Meadows OWR Discharge 19 6 74 03382100 South Fork Saline River near Carrier Mills OWR Discharge 18 12 75 05594800 Silver Creek near Freeburg STL Discharge 18 11 76 05592800 Hurricane Creek near Mulberry Grove STL Discharge 18 10 77 05595730 Rayse Creek near Waltonville STL Discharge 18 10 78 03378635 Little Wabash River near Effingham OWR Discharge 18 8 79 05593945 Shoal Creek near Pierron STL Discharge 18 8 80 05591550 Whitley Creek near Allenville STL Discharge 18 8 81 05548500 Fox River at Johnsburg OWR Stage only 18 7 82 05549500 Fox River near McHenry OWR Stage only 18 7 83 05592050 Robinson Creek near Shelbyville STL Discharge 18 7 84 05536995 Chicago Sanitary & Ship Canal at Romeoville CHI AVM** 18 6 85 05592575 Hickory Creek near Brownstown STL Discharge 18 6 86 05536000 North Branch Chicago River at Niles OWR Discharge 17 10 87 05531300 Salt Creek at Elmhurst DCEC Discharge 17 9 88 05592900 East Fork Kaskaskia River near Sandoval STL Discharge 16 8
73
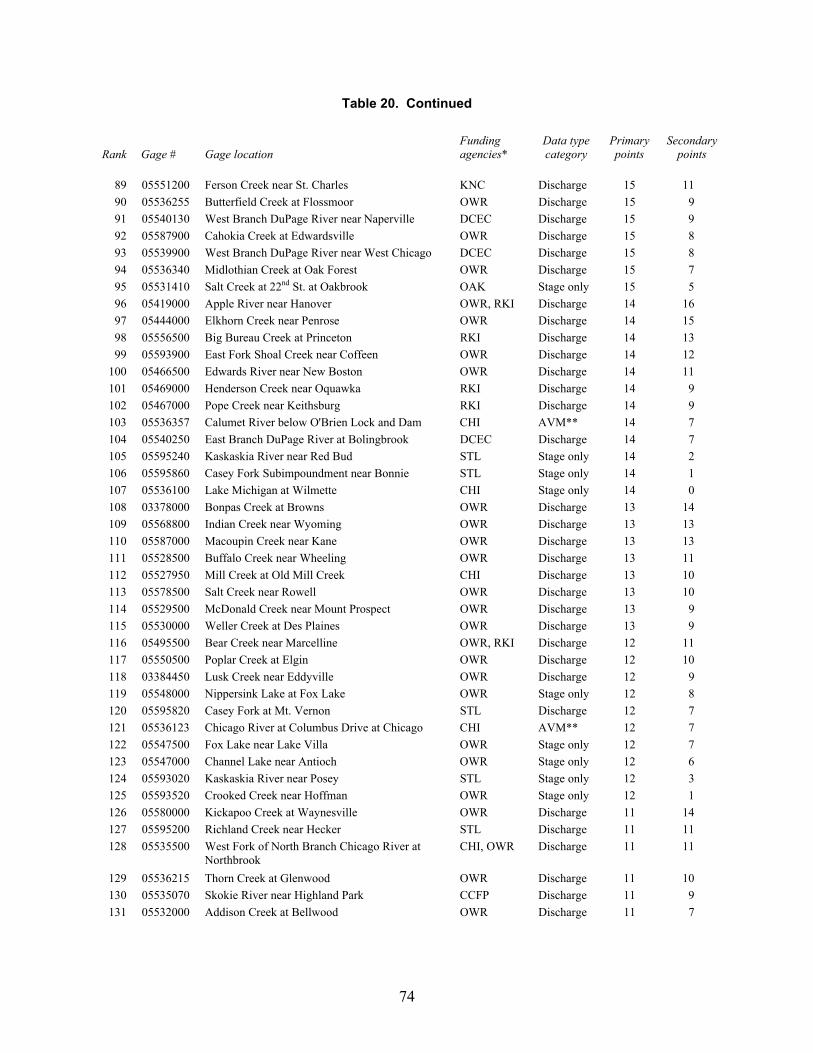
Table 20. Continued
Rank Gage # Gage location Funding agencies*
Data type category
Primary points
Secondary points
89 05551200 Ferson Creek near St. Charles KNC Discharge 15 11 90 05536255 Butterfield Creek at Flossmoor OWR Discharge 15 9 91 05540130 West Branch DuPage River near Naperville DCEC Discharge 15 9 92 05587900 Cahokia Creek at Edwardsville OWR Discharge 15 8 93 05539900 West Branch DuPage River near West Chicago DCEC Discharge 15 8 94 05536340 Midlothian Creek at Oak Forest OWR Discharge 15 7 95 05531410 Salt Creek at 22nd St. at Oakbrook OAK Stage only 15 5 96 05419000 Apple River near Hanover OWR, RKI Discharge 14 16 97 05444000 Elkhorn Creek near Penrose OWR Discharge 14 15 98 05556500 Big Bureau Creek at Princeton RKI Discharge 14 13 99 05593900 East Fork Shoal Creek near Coffeen OWR Discharge 14 12
100 05466500 Edwards River near New Boston OWR Discharge 14 11 101 05469000 Henderson Creek near Oquawka RKI Discharge 14 9 102 05467000 Pope Creek near Keithsburg RKI Discharge 14 9 103 05536357 Calumet River below O'Brien Lock and Dam CHI AVM** 14 7 104 05540250 East Branch DuPage River at Bolingbrook DCEC Discharge 14 7 105 05595240 Kaskaskia River near Red Bud STL Stage only 14 2 106 05595860 Casey Fork Subimpoundment near Bonnie STL Stage only 14 1 107 05536100 Lake Michigan at Wilmette CHI Stage only 14 0 108 03378000 Bonpas Creek at Browns OWR Discharge 13 14 109 05568800 Indian Creek near Wyoming OWR Discharge 13 13 110 05587000 Macoupin Creek near Kane OWR Discharge 13 13 111 05528500 Buffalo Creek near Wheeling OWR Discharge 13 11 112 05527950 Mill Creek at Old Mill Creek CHI Discharge 13 10 113 05578500 Salt Creek near Rowell OWR Discharge 13 10 114 05529500 McDonald Creek near Mount Prospect OWR Discharge 13 9 115 05530000 Weller Creek at Des Plaines OWR Discharge 13 9 116 05495500 Bear Creek near Marcelline OWR, RKI Discharge 12 11 117 05550500 Poplar Creek at Elgin OWR Discharge 12 10 118 03384450 Lusk Creek near Eddyville OWR Discharge 12 9 119 05548000 Nippersink Lake at Fox Lake OWR Stage only 12 8 120 05595820 Casey Fork at Mt. Vernon STL Discharge 12 7 121 05536123 Chicago River at Columbus Drive at Chicago CHI AVM** 12 7 122 05547500 Fox Lake near Lake Villa OWR Stage only 12 7 123 05547000 Channel Lake near Antioch OWR Stage only 12 6 124 05593020 Kaskaskia River near Posey STL Stage only 12 3 125 05593520 Crooked Creek near Hoffman OWR Stage only 12 1 126 05580000 Kickapoo Creek at Waynesville OWR Discharge 11 14 127 05595200 Richland Creek near Hecker STL Discharge 11 11 128 05535500 West Fork of North Branch Chicago River at
Northbrook CHI, OWR Discharge 11 11
129 05536215 Thorn Creek at Glenwood OWR Discharge 11 10 130 05535070 Skokie River near Highland Park CCFP Discharge 11 9 131 05532000 Addison Creek at Bellwood OWR Discharge 11 7
74
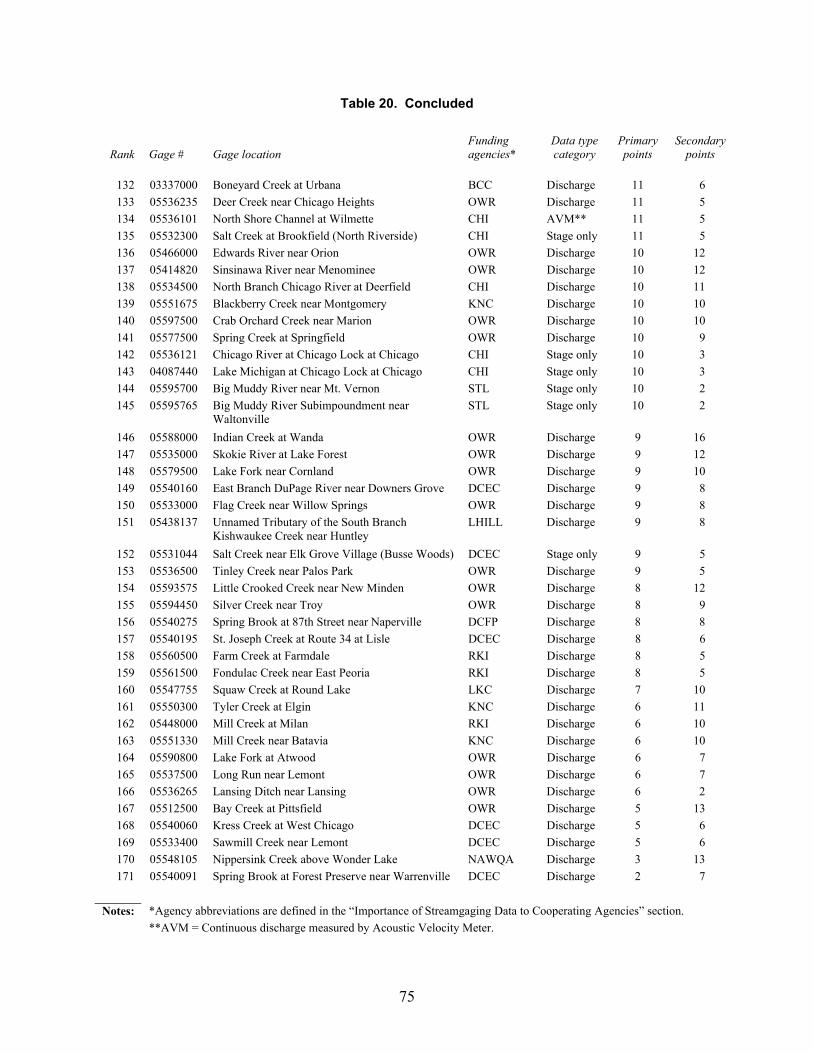
Table 20. Concluded
Rank Gage # Gage location Funding agencies*
Data type category
Primary points
Secondary points
132 03337000 Boneyard Creek at Urbana BCC Discharge 11 6 133 05536235 Deer Creek near Chicago Heights OWR Discharge 11 5 134 05536101 North Shore Channel at Wilmette CHI AVM** 11 5 135 05532300 Salt Creek at Brookfield (North Riverside) CHI Stage only 11 5 136 05466000 Edwards River near Orion OWR Discharge 10 12 137 05414820 Sinsinawa River near Menominee OWR Discharge 10 12 138 05534500 North Branch Chicago River at Deerfield CHI Discharge 10 11 139 05551675 Blackberry Creek near Montgomery KNC Discharge 10 10 140 05597500 Crab Orchard Creek near Marion OWR Discharge 10 10 141 05577500 Spring Creek at Springfield OWR Discharge 10 9 142 05536121 Chicago River at Chicago Lock at Chicago CHI Stage only 10 3 143 04087440 Lake Michigan at Chicago Lock at Chicago CHI Stage only 10 3 144 05595700 Big Muddy River near Mt. Vernon STL Stage only 10 2 145 05595765 Big Muddy River Subimpoundment near
Waltonville STL Stage only 10 2
146 05588000 Indian Creek at Wanda OWR Discharge 9 16 147 05535000 Skokie River at Lake Forest OWR Discharge 9 12 148 05579500 Lake Fork near Cornland OWR Discharge 9 10 149 05540160 East Branch DuPage River near Downers Grove DCEC Discharge 9 8 150 05533000 Flag Creek near Willow Springs OWR Discharge 9 8 151 05438137 Unnamed Tributary of the South Branch
Kishwaukee Creek near Huntley LHILL Discharge 9 8
152 05531044 Salt Creek near Elk Grove Village (Busse Woods) DCEC Stage only 9 5 153 05536500 Tinley Creek near Palos Park OWR Discharge 9 5 154 05593575 Little Crooked Creek near New Minden OWR Discharge 8 12 155 05594450 Silver Creek near Troy OWR Discharge 8 9 156 05540275 Spring Brook at 87th Street near Naperville DCFP Discharge 8 8 157 05540195 St. Joseph Creek at Route 34 at Lisle DCEC Discharge 8 6 158 05560500 Farm Creek at Farmdale RKI Discharge 8 5 159 05561500 Fondulac Creek near East Peoria RKI Discharge 8 5 160 05547755 Squaw Creek at Round Lake LKC Discharge 7 10 161 05550300 Tyler Creek at Elgin KNC Discharge 6 11 162 05448000 Mill Creek at Milan RKI Discharge 6 10 163 05551330 Mill Creek near Batavia KNC Discharge 6 10 164 05590800 Lake Fork at Atwood OWR Discharge 6 7 165 05537500 Long Run near Lemont OWR Discharge 6 7 166 05536265 Lansing Ditch near Lansing OWR Discharge 6 2 167 05512500 Bay Creek at Pittsfield OWR Discharge 5 13 168 05540060 Kress Creek at West Chicago DCEC Discharge 5 6 169 05533400 Sawmill Creek near Lemont DCEC Discharge 5 6 170 05548105 Nippersink Creek above Wonder Lake NAWQA Discharge 3 13 171 05540091 Spring Brook at Forest Preserve near Warrenville DCEC Discharge 2 7
Notes: *Agency abbreviations are defined in the “Importance of Streamgaging Data to Cooperating Agencies” section. **AVM = Continuous discharge measured by Acoustic Velocity Meter.
75
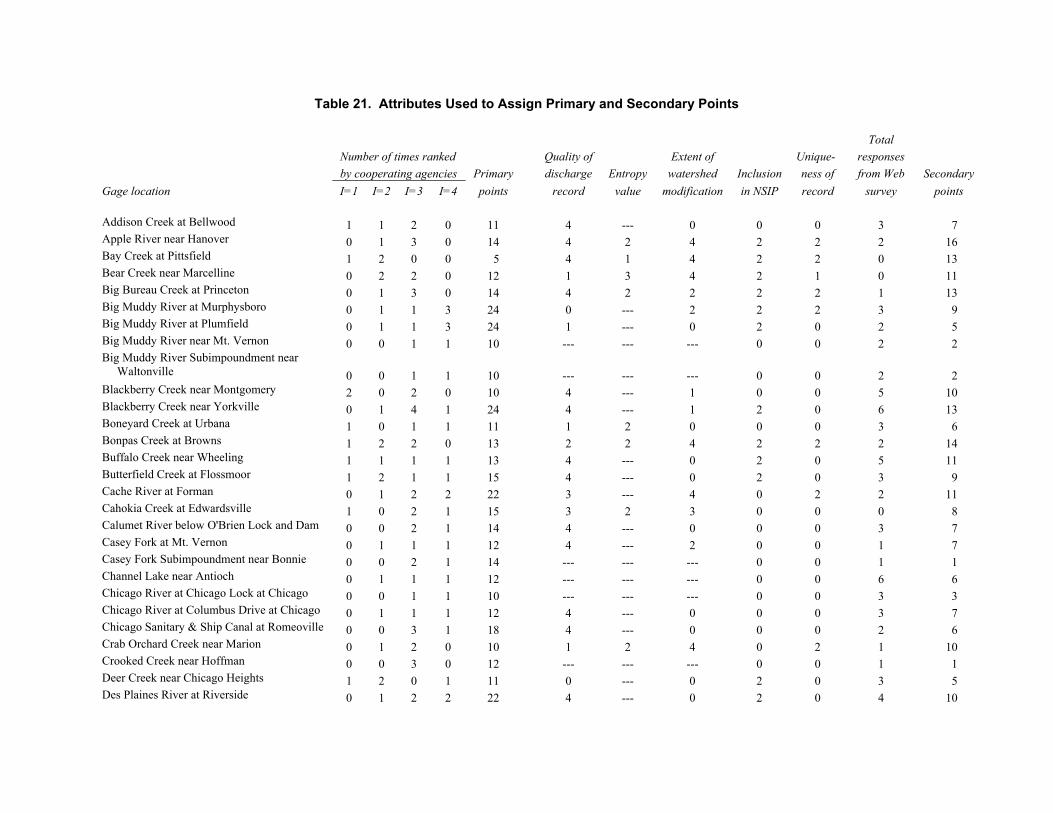
Table 21. Attributes Used to Assign Primary and Secondary Points
Total Number of times ranked Quality of Extent of Unique- responses by cooperating agencies Primary discharge Entropy watershed Inclusion
ness of from Web Secondary
Gage location I=1 I=2 I=3 I=4 points record value modification in NSIP record survey points
Addison Creek at Bellwood 1 1 2 0 11 4 --- 0 0 0 3 7Apple River near Hanover 0 1 3 0 14 4 2 4 2 2 2 16Bay Creek at Pittsfield 1 2 0 0 5 4 1 4 2 2 0 13 Bear Creek near Marcelline 0 2 2 0 12 1 3 4 2 1 0 11Big Bureau Creek at Princeton 0 1 3 0 14 4 2 2 2 2 1 13Big Muddy River at Murphysboro 0 1 1 3 24 0 --- 2 2 2 3 9Big Muddy River at Plumfield 0 1 1 3 24 1 --- 0 2 0 2 5Big Muddy River near Mt. Vernon 0 0 1 1 10 --- --- --- 0 0 2 2Big Muddy River Subimpoundment near Waltonville 0 0 1 1 10 --- --- --- 0 0 2 2Blackberry Creek near Montgomery 2 0 2 0 10 4 --- 1 0 0 5 10Blackberry Creek near Yorkville 0 1 4 1 24 4 --- 1 2 0 6 13Boneyard Creek at Urbana 1 0 1 1 11 1 2 0 0 0 3 6Bonpas Creek at Browns 1 2 2 0 13 2 2 4 2 2 2 14Buffalo Creek near Wheeling 1 1 1 1 13 4 --- 0 2 0 5 11Butterfield Creek at Flossmoor 1 2 1 1 15 4 --- 0 2 0 3 9Cache River at Forman 0 1 2 2 22 3 --- 4 0 2 2 11Cahokia Creek at Edwardsville 1 0 2 1 15 3 2 3 0 0 0 8Calumet River below O'Brien Lock and Dam 0 0 2 1 14 4 --- 0 0 0 3 7Casey Fork at Mt. Vernon 0 1 1 1 12 4 --- 2 0 0 1 7Casey Fork Subimpoundment near Bonnie 0 0 2 1 14 --- --- --- 0 0 1 1Channel Lake near Antioch 0 1 1 1 12 --- --- --- 0 0 6 6Chicago River at Chicago Lock at Chicago 0 0 1 1 10 --- --- --- 0 0 3 3Chicago River at Columbus Drive at Chicago 0 1 1 1 12 4 --- 0 0 0 3 7Chicago Sanitary & Ship Canal at Romeoville 0 0 3 1 18 4 --- 0 0 0 2 6Crab Orchard Creek near Marion 0 1 2 0 10 1 2 4 0 2 1 10Crooked Creek near Hoffman 0 0 3 0 12 --- --- --- 0 0 1 1Deer Creek near Chicago Heights 1 2 0 1 11 0 --- 0 2 0 3 5Des Plaines River at Riverside 0 1 2 2 22 4 --- 0 2 0 4 10
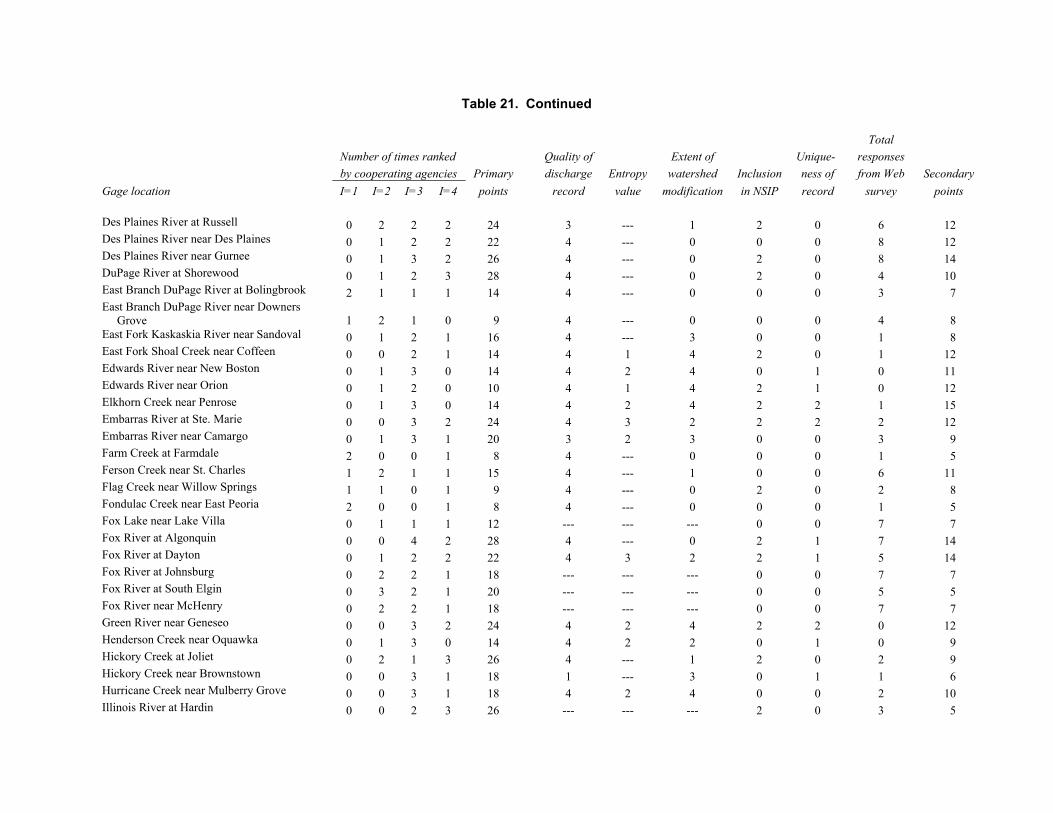
Table 21. Continued
Total Number of times ranked Quality of Extent of Unique- responses by cooperating agencies Primary discharge Entropy watershed Inclusion
ness of from Web Secondary
Gage location I=1 I=2 I=3 I=4 points record value modification in NSIP record survey points
2 0 12
Oquawka 3 0 14 4 2 2 0 1 0 9 Hickory Creek at Joliet 0 2 1 3 26 4 --- 1 2 0 2 9 Hickory Creek near Brownstown 0 0 3 1 18 1 --- 3 0 1 1 6 Hurricane Creek near Mulberry Grove 0 0 3 1 18 4 2 4 0 0 2 10 Illinois River at Hardin 0 0 2 3 26 --- --- --- 2 0 3 5
Des Plaines River at Russell 0 2 2 2 24 3 --- 1 2 0 6 12Des Plaines River near Des Plaines 0 1 2 2 22 4 --- 0 0 0 8 12Des Plaines River near Gurnee 0 1 3 2 26 4 --- 0 2 0 8 14DuPage River at Shorewood 0 1 2 3 28 4 --- 0 2 0 4 10East Branch DuPage River at Bolingbrook 2 1 1 1 14 4 --- 0 0 0 3 7East Branch DuPage River near Downers Grove 1 2 1 0 9 4 --- 0 0 0 4 8 East Fork Kaskaskia River near Sandoval 0 1 2 1 16 4 --- 3 0 0 1 8East Fork Shoal Creek near Coffeen 0 0 2 1 14 4 1 4 2 0 1 12Edwards River near New Boston 0 1 3 0 14 4 2 4 0 1 0 11Edwards River near Orion 0 1 2 0 10 4 1 4 2 1 0 12Elkhorn Creek near Penrose 0 1 3 0 14 4 2 4 2 2 1 15Embarras River at Ste. Marie 0 0 3 2 24 4 3 2 2 2 2 12Embarras River near Camargo 0 1 3 1 20 3 2 3 0 0 3 9Farm Creek at Farmdale 2 0 0 1 8 4 --- 0 0 0 1 5 Ferson Creek near St. Charles 1 2 1 1 15 4 --- 1 0 0 6 11Flag Creek near Willow Springs 1 1 0 1 9 4 --- 0 2 0 2 8 Fondulac Creek near East Peoria 2 0 0 1 8 4 --- 0 0 0 1 5 Fox Lake near Lake Villa 0 1 1 1 12 --- --- --- 0 0 7 7Fox River at Algonquin 0 0 4 2 28 4 --- 0 2 1 7 14Fox River at Dayton 0 1 2 2 22 4 3 2 2 1 5 14Fox River at Johnsburg 0 2 2 1 18 --- --- --- 0 0 7 7Fox River at South Elgin 0 3 2 1 20 --- --- --- 0 0 5 5Fox River near McHenry 0 2 2 1 18 --- --- --- 0 0 7 7Green River near Geneseo Henderson Creek near
0 00 1
3 2 24 4 2 4 2
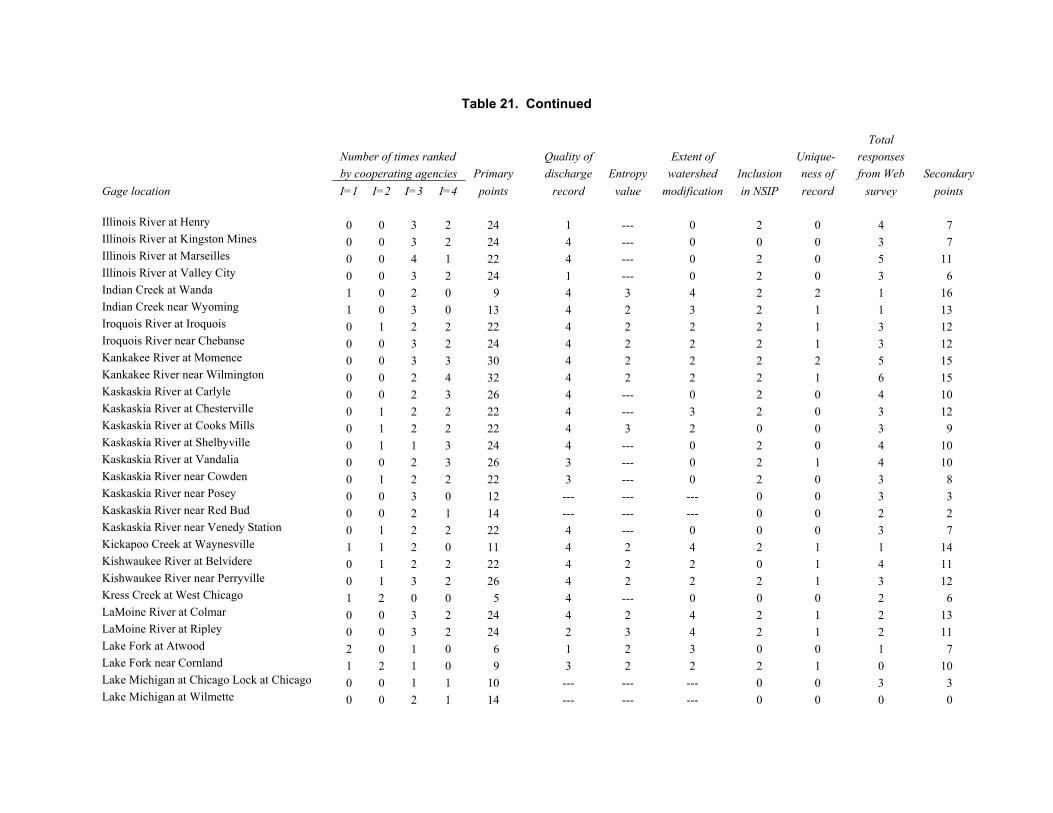
Table 21. Continued
Total Number of times ranked Quality of Extent of Unique- responses by cooperating agencies Primary discharge Entropy watershed Inclusion ness of from Web Secondary Gage location I=1 I=2 I=3 I=4 points record value modification in NSIP record survey points Illinois River at Henry 0 0 3 2 24 1 --- 0 2 0 4 7 Illinois River at Kingston Mines 0 0 3 2 24 4 --- 0 0 0 3 7 Illinois River at Marseilles 0 0 4 1 22 4 --- 0 2 0 5 11 Illinois River at Valley City 0 0 3 2 24 1 --- 0 2 0 3 6 Indian Creek at Wanda 1 0 2 0 9 4 3 4 2 2 1 16 Indian Creek near Wyoming 1 0 3 0 13 4 2 3 2 1 1 13 Iroquois River at Iroquois 0 1 2 2 22 4 2 2 2 1 3 12 Iroquois River near Chebanse 0 0 3 2 24 4 2 2 2 1 3 12 Kankakee River at Momence 0 0 3 3 30 4 2 2 2 2 5 15 Kankakee River near Wilmington 0 0 2 4 32 4 2 2 2 1 6 15 Kaskaskia River at Carlyle 0 0 2 3 26 4 --- 0 2 0 4 10 Kaskaskia River at Chesterville 0 1 2 2 22 4 --- 3 2 0 3 12 Kaskaskia River at Cooks Mills 0 1 2 2 22 4 3 2 0 0 3 9 Kaskaskia River at Shelbyville 0 1 1 3 24 4 --- 0 2 0 4 10 Kaskaskia River at Vandalia 0 0 2 3 26 3 --- 0 2 1 4 10 Kaskaskia River near Cowden 0 1 2 2 22 3 --- 0 2 0 3 8 Kaskaskia River near Posey 0 0 3 0 12 --- --- --- 0 0 3 3 Kaskaskia River near Red Bud 0 0 2 1 14 --- --- --- 0 0 2 2 Kaskaskia River near Venedy Station 0 1 2 2 22 4 --- 0 0 0 3 7 Kickapoo Creek at Waynesville 1 1 2 0 11 4 2 4 2 1 1 14 Kishwaukee River at Belvidere 0 1 2 2 22 4 2 2 0 1 4 11 Kishwaukee River near Perryville 0 1 3 2 26 4 2 2 2 1 3 12 Kress Creek at West Chicago 1 2 0 0 5 4 --- 0 0 0 2 6 LaMoine River at Colmar 0 0 3 2 24 4 2 4 2 1 2 13 LaMoine River at Ripley 0 0 3 2 24 2 3 4 2 1 2 11 Lake Fork at Atwood 2 0 1 0 6 1 2 3 0 0 1 7 Lake Fork near Cornland 1 2 1 0 9 3 2 2 2 1 0 10 Lake Michigan at Chicago Lock at Chicago 0 0 1 1 10 --- --- --- 0 0 3 3 Lake Michigan at Wilmette 0 0 2 1 14 --- --- --- 0 0 0 0
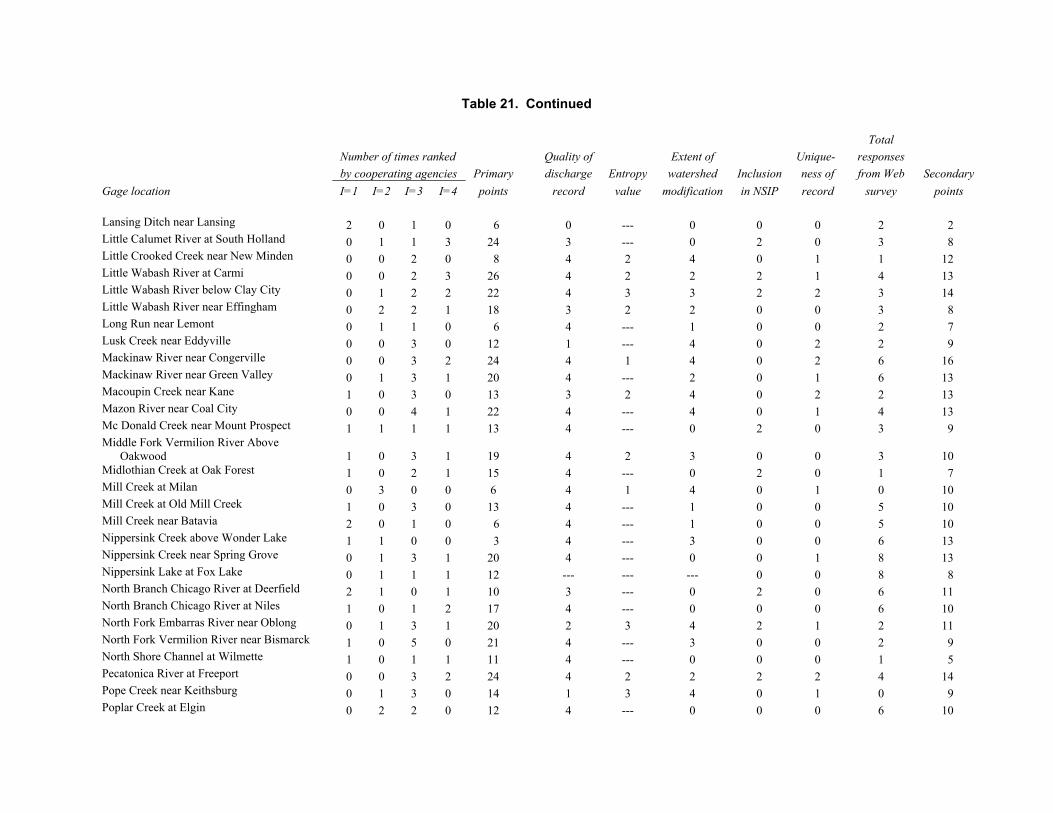
Table 21. Continued
Total Number of times ranked Quality of Extent of Unique- responses by cooperating agencies Primary discharge Entropy watershed Inclusion ness of from Web Secondary Gage location I=1 I=2 I=3 I=4 points record value modification in NSIP record survey points Lansing Ditch near Lansing 2 0 1 0 6 0 --- 0 0 0 2 2 Little Calumet River at South Holland 0 1 1 3 24 3 --- 0 2 0 3 8 Little Crooked Creek near New Minden 0 0 2 0 8 4 2 4 0 1 1 12 Little Wabash River at Carmi 0 0 2 3 26 4 2 2 2 1 4 13 Little Wabash River below Clay City 0 1 2 2 22 4 3 3 2 2 3 14 Little Wabash River near Effingham 0 2 2 1 18 3 2 2 0 0 3 8 Long Run near Lemont 0 1 1 0 6 4 --- 1 0 0 2 7 Lusk Creek near Eddyville 0 0 3 0 12 1 --- 4 0 2 2 9 Mackinaw River near Congerville 0 0 3 2 24 4 1 4 0 2 6 16 Mackinaw River near Green Valley 0 1 3 1 20 4 --- 2 0 1 6 13 Macoupin Creek near Kane 1 0 3 0 13 3 2 4 0 2 2 13 Mazon River near Coal City 0 0 4 1 22 4 --- 4 0 1 4 13 Mc Donald Creek near Mount Prospect 1 1 1 1 13 4 --- 0 2 0 3 9 Middle Fork Vermilion River Above Oakwood 1 0 3 1 19 4 2 3 0 0 3 10 Midlothian Creek at Oak Forest 1 0 2 1 15 4 --- 0 2 0 1 7 Mill Creek at Milan 0 3 0 0 6 4 1 4 0 1 0 10 Mill Creek at Old Mill Creek 1 0 3 0 13 4 --- 1 0 0 5 10 Mill Creek near Batavia 2 0 1 0 6 4 --- 1 0 0 5 10 Nippersink Creek above Wonder Lake 1 1 0 0 3 4 --- 3 0 0 6 13 Nippersink Creek near Spring Grove 0 1 3 1 20 4 --- 0 0 1 8 13 Nippersink Lake at Fox Lake 0 1 1 1 12 --- --- --- 0 0 8 8 North Branch Chicago River at Deerfield 2 1 0 1 10 3 --- 0 2 0 6 11 North Branch Chicago River at Niles 1 0 1 2 17 4 --- 0 0 0 6 10 North Fork Embarras River near Oblong 0 1 3 1 20 2 3 4 2 1 2 11 North Fork Vermilion River near Bismarck 1 0 5 0 21 4 --- 3 0 0 2 9 North Shore Channel at Wilmette 1 0 1 1 11 4 --- 0 0 0 1 5 Pecatonica River at Freeport 0 0 3 2 24 4 2 2 2 2 4 14 Pope Creek near Keithsburg 0 1 3 0 14 1 3 4 0 1 0 9 Poplar Creek at Elgin 0 2 2 0 12 4 --- 0 0 0 6 10
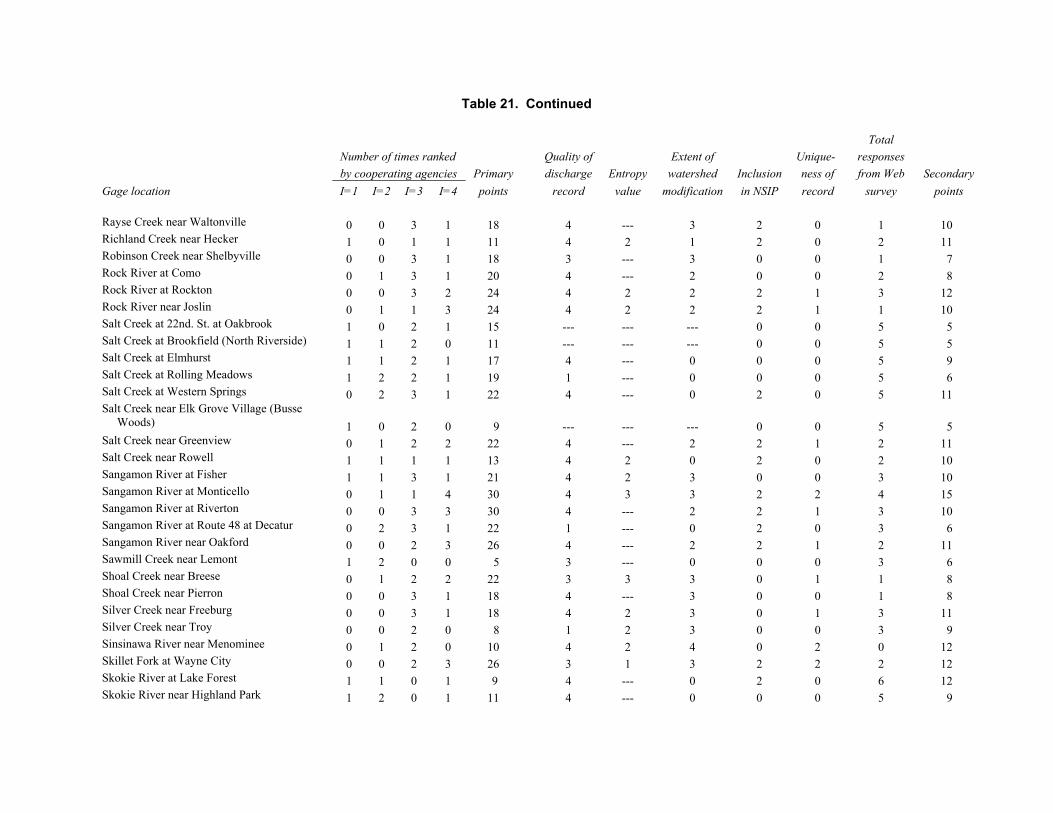
Table 21. Continued
Total Number of times ranked Quality of Extent of Unique- responses by cooperating agencies Primary discharge Entropy watershed Inclusion ness of from Web Secondary Gage location I=1 I=2 I=3 I=4 points record value modification in NSIP record survey points Rayse Creek near Waltonville 0 0 3 1 18 4 --- 3 2 0 1 10 Richland Creek near Hecker 1 0 1 1 11 4 2 1 2 0 2 11 Robinson Creek near Shelbyville 0 0 3 1 18 3 --- 3 0 0 1 7 Rock River at Como 0 1 3 1 20 4 --- 2 0 0 2 8 Rock River at Rockton 0 0 3 2 24 4 2 2 2 1 3 12 Rock River near Joslin 0 1 1 3 24 4 2 2 2 1 1 10 Salt Creek at 22nd. St. at Oakbrook 1 0 2 1 15 --- --- --- 0 0 5 5 Salt Creek at Brookfield (North Riverside) 1 1 2 0 11 --- --- --- 0 0 5 5 Salt Creek at Elmhurst 1 1 2 1 17 4 --- 0 0 0 5 9 Salt Creek at Rolling Meadows 1 2 2 1 19 1 --- 0 0 0 5 6 Salt Creek at Western Springs 0 2 3 1 22 4 --- 0 2 0 5 11 Salt Creek near Elk Grove Village (Busse Woods) 1 0 2 0 9 --- --- --- 0 0 5 5 Salt Creek near Greenview 0 1 2 2 22 4 --- 2 2 1 2 11 Salt Creek near Rowell 1 1 1 1 13 4 2 0 2 0 2 10 Sangamon River at Fisher 1 1 3 1 21 4 2 3 0 0 3 10 Sangamon River at Monticello 0 1 1 4 30 4 3 3 2 2 4 15 Sangamon River at Riverton 0 0 3 3 30 4 --- 2 2 1 3 10 Sangamon River at Route 48 at Decatur 0 2 3 1 22 1 --- 0 2 0 3 6 Sangamon River near Oakford 0 0 2 3 26 4 --- 2 2 1 2 11 Sawmill Creek near Lemont 1 2 0 0 5 3 --- 0 0 0 3 6 Shoal Creek near Breese 0 1 2 2 22 3 3 3 0 1 1 8 Shoal Creek near Pierron 0 0 3 1 18 4 --- 3 0 0 1 8 Silver Creek near Freeburg 0 0 3 1 18 4 2 3 0 1 3 11 Silver Creek near Troy 0 0 2 0 8 1 2 3 0 0 3 9 Sinsinawa River near Menominee 0 1 2 0 10 4 2 4 0 2 0 12 Skillet Fork at Wayne City 0 0 2 3 26 3 1 3 2 2 2 12 Skokie River at Lake Forest 1 1 0 1 9 4 --- 0 2 0 6 12 Skokie River near Highland Park 1 2 0 1 11 4 --- 0 0 0 5 9
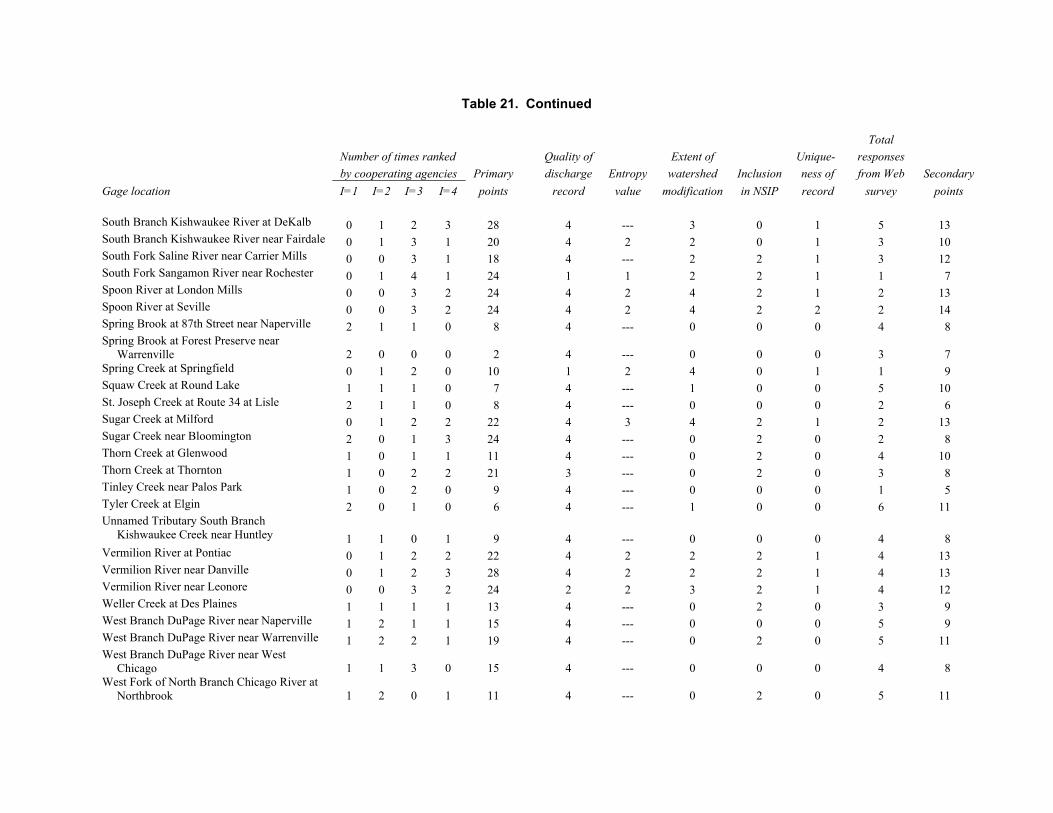
Table 21. Continued
Total Number of times ranked Quality of Extent of Unique- responses by cooperating agencies Primary discharge Entropy watershed Inclusion ness of from Web Secondary Gage location I=1 I=2 I=3 I=4 points record value modification in NSIP record survey points South Branch Kishwaukee River at DeKalb 0 1 2 3 28 4 --- 3 0 1 5 13 South Branch Kishwaukee River near Fairdale 0 1 3 1 20 4 2 2 0 1 3 10 South Fork Saline River near Carrier Mills 0 0 3 1 18 4 --- 2 2 1 3 12 South Fork Sangamon River near Rochester 0 1 4 1 24 1 1 2 2 1 1 7 Spoon River at London Mills 0 0 3 2 24 4 2 4 2 1 2 13 Spoon River at Seville 0 0 3 2 24 4 2 4 2 2 2 14 Spring Brook at 87th Street near Naperville 2 1 1 0 8 4 --- 0 0 0 4 8 Spring Brook at Forest Preserve near Warrenville 2 0 0 0 2 4 --- 0 0 0 3 7 Spring Creek at Springfield 0 1 2 0 10 1 2 4 0 1 1 9 Squaw Creek at Round Lake 1 1 1 0 7 4 --- 1 0 0 5 10 St. Joseph Creek at Route 34 at Lisle 2 1 1 0 8 4 --- 0 0 0 2 6 Sugar Creek at Milford 0 1 2 2 22 4 3 4 2 1 2 13 Sugar Creek near Bloomington 2 0 1 3 24 4 --- 0 2 0 2 8 Thorn Creek at Glenwood 1 0 1 1 11 4 --- 0 2 0 4 10 Thorn Creek at Thornton 1 0 2 2 21 3 --- 0 2 0 3 8 Tinley Creek near Palos Park 1 0 2 0 9 4 --- 0 0 0 1 5 Tyler Creek at Elgin 2 0 1 0 6 4 --- 1 0 0 6 11 Unnamed Tributary South Branch Kishwaukee Creek near Huntley 1 1 0 1 9 4 --- 0 0 0 4 8 Vermilion River at Pontiac 0 1 2 2 22 4 2 2 2 1 4 13 Vermilion River near Danville 0 1 2 3 28 4 2 2 2 1 4 13 Vermilion River near Leonore 0 0 3 2 24 2 2 3 2 1 4 12 Weller Creek at Des Plaines 1 1 1 1 13 4 --- 0 2 0 3 9 West Branch DuPage River near Naperville 1 2 1 1 15 4 --- 0 0 0 5 9 West Branch DuPage River near Warrenville 1 2 2 1 19 4 --- 0 2 0 5 11 West Branch DuPage River near West Chicago 1 1 3 0 15 4 --- 0 0 0 4 8 West Fork of North Branch Chicago River at Northbrook 1 2 0 1 11 4 --- 0 2 0 5 11
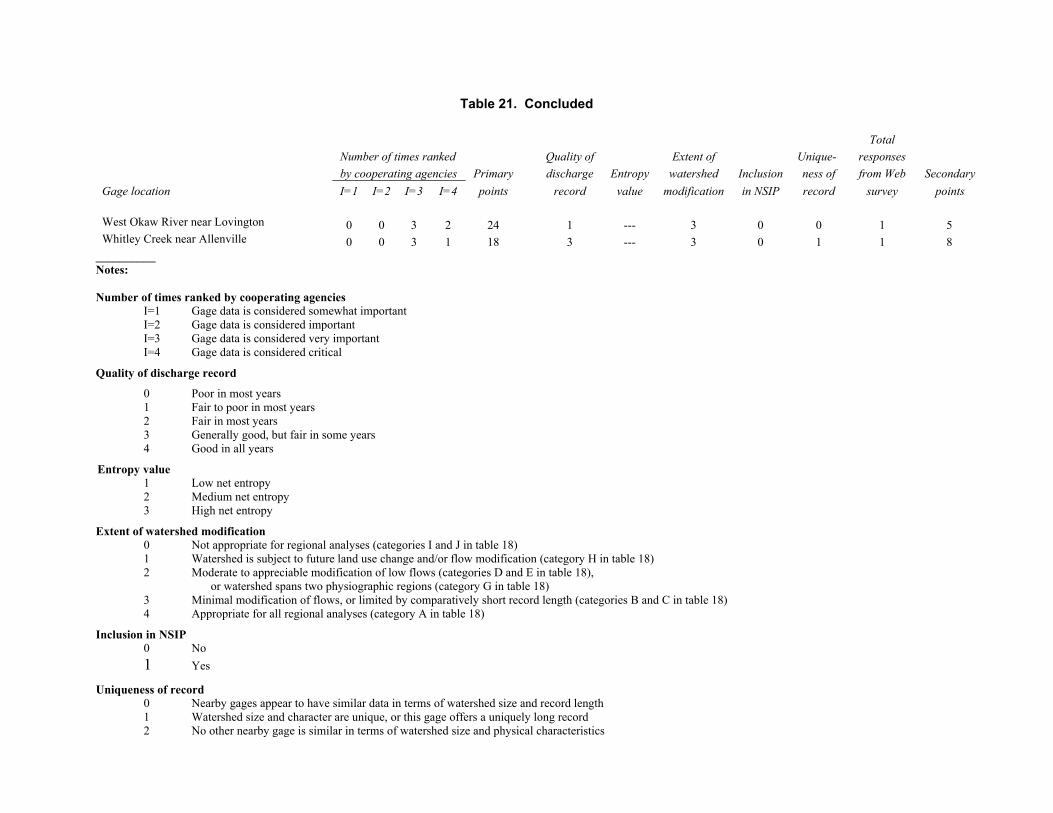
Table 21. Concluded
Total Number of times ranked Quality of Extent of Unique- responses by cooperating agencies Primary discharge Entropy watershed Inclusion ness of from Web Secondary Gage location I=1 I=2 I=3 I=4 points record value modification in NSIP record survey points West Okaw River near Lovington 0 0 3 2 24 1 --- 3 0 0 1 5 Whitley Creek near Allenville 0 0 3 1 18 3 --- 3 0 1 1 8
__________ Notes: Number of times ranked by cooperating agencies I=1 Gage data is considered somewhat important I=2 Gage data is considered important I=3 Gage data is considered very important I=4 Gage data is considered critical
Quality of discharge record
0 Poor in most years 1 Fair to poor in most years 2 Fair in most years 3 Generally good, but fair in some years 4 Good in all years
Entropy value 1 Low net entropy 2 Medium net entropy 3 High net entropy
Extent of watershed modification 0 Not appropriate for regional analyses (categories I and J in table 18) 1 Watershed is subject to future land use change and/or flow modification (category H in table 18) 2 Moderate to appreciable modification of low flows (categories D and E in table 18),
or watershed spans two physiographic regions (category G in table 18) 3 Minimal modification of flows, or limited by comparatively short record length (categories B and C in table 18) 4 Appropriate for all regional analyses (category A in table 18)
Inclusion in NSIP 0 No 1 Yes
Uniqueness of record 0 Nearby gages appear to have similar data in terms of watershed size and record length 1 Watershed size and character are unique, or this gage offers a uniquely long record 2 No other nearby gage is similar in terms of watershed size and physical characteristics
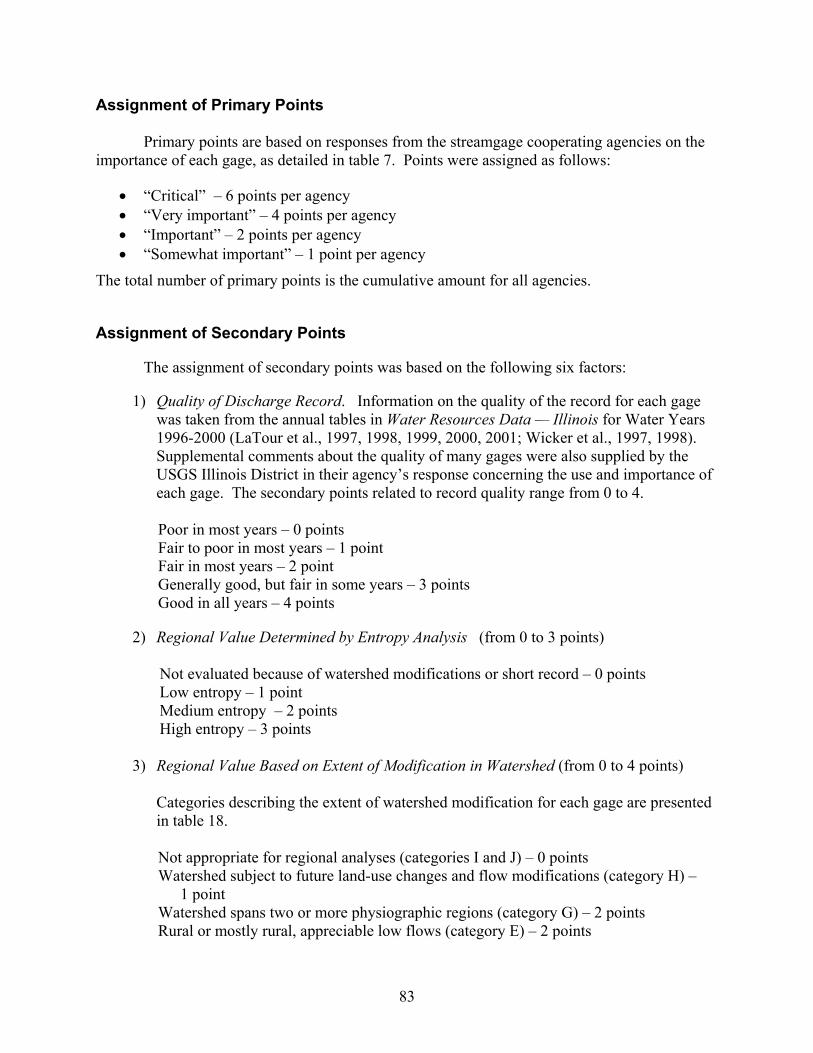
83
Rural or mostly rural, appreciable low flows (category E) – 2 points
Assignment of Primary Points Primary points are based on responses from the streamgage cooperating agencies on the importance of each gage, as detailed in table 7. Points were assigned as follows:
• “Critical” – 6 points per agency • “Very important” – 4 points per agency • “Important” – 2 points per agency • “Somewhat important” – 1 point per agency
The total number of primary points is the cumulative amount for all agencies.
Assignment of Secondary Points
The assignment of secondary points was based on the following six factors:
1) Quality of Discharge Record. Information on the quality of the record for each gage was taken from the annual tables in Water Resources Data — Illinois for Water Years 1996-2000 (LaTour et al., 1997, 1998, 1999, 2000, 2001; Wicker et al., 1997, 1998). Supplemental comments about the quality of many gages were also supplied by the USGS Illinois District in their agency’s response concerning the use and importance of each gage. The secondary points related to record quality range from 0 to 4.
Poor in most years – 0 points Fair to poor in most years – 1 point Fair in most years – 2 point Generally good, but fair in some years – 3 points Good in all years – 4 points
2) Regional Value Determined by Entropy Analysis (from 0 to 3 points)
Not evaluated because of watershed modifications or short record – 0 points Low entropy – 1 point Medium entropy – 2 points High entropy – 3 points
3) Regional Value Based on Extent of Modification in Watershed (from 0 to 4 points)
Categories describing the extent of watershed modification for each gage are presented in table 18.
Not appropriate for regional analyses (categories I and J) – 0 points Watershed subject to future land-use changes and flow modifications (category H) – 1 point Watershed spans two or more physiographic regions (category G) – 2 points
Rural or mostly rural, moderate modifications of flows (category D) – 2 points Rural or mostly rural, minimal or small modifications of flows, limited by
comparatively short record (category C) – 3 points Rural or mostly rural, small modifications of low flows (category B) – 3 points, Rural or mostly rural, minimal modifications of flows (category A) – 4 points
4) Regional Value Based on Uniqueness of Record within Physiographic Region (from 0 to 2 points)
Other nearby gages appear to have similar data in terms of watershed size and record
length – 0 points Watershed size/character are unique, or gage offers a uniquely long record – 1 point No other nearby gage is similar in terms of watershed size and physical characteristics – 2 points
5) Designation of Gage in the National Streamflow Information Program (NSIP) (2 points for this designation)
6) Number of Times Gage Was Identified by Respondents in User Survey (1 point per respondent, 0 - 8 total points)
84
85
be an important general use of streamflow data throughout the United States. Throughout the
Additional Issues and Potential Directions for Streamflow Gaging in Illinois
It is not possible to anticipate many future needs of the streamflow gaging program. As
noted by Benson and Carter (1973, page 10), the use of data for current-use needs “is not subject to advance design because its character changes frequently in response to changing need.” More often than not, emerging issues will need to use streamflow data before there is a chance to collect data for that specific use. The only way to have sufficient data available when these needs arise is by maintaining a base network at locations representative of Illinois streams, such that these long-term data meet a broad range of potential needs. The base network also can be used to supplement records at short-term gages installed at specific sites to address specific issues.
State and federal agencies that currently support most streamflow gages have been doing so for many decades. These agencies continue to support data collection for specific uses (for example, river forecasting, data for operation of major rivers, etc.) that are now considered “traditional” uses of the data that likely will continue to be funded by these agencies for the foreseeable future. If past trends are any indication, however, it is also possible that funding levels for some cooperating agencies may gradually decline over time.
It is unlikely that the direction of gaging in Illinois will be altered appreciably without sustained funding from additional sources. The NSIP may provide new funding, but other new sources of funding likely will be associated with initiatives related to new or emerging data needs. There should be a continuing effort to identify “hot issues” and locations where there is a need and enthusiasm for installing new gages. Emerging Data Needs
Through discussions with the cooperating agencies, results of the user survey, and other feedback, four issues identified as recent or emerging data needs may provide potential sources of funding for the network:
• Load assessment of water quality
• Stream restoration
• Watershed restoration
• Management of new water withdrawals or diversions Load Assessment of Water Quality
Use of stream quantity data for monitoring and assessment of water quality continues to
86
sediment size distribution analyses and estimates of bed load transport, also are needed.
1970s and 1980s, the ambient water quality network in Illinois, broadly supported by the Illinois Environmental Protection Agency (IEPA), established baseline water quality conditions throughout Illinois. The USGS National Water Quality Assessment (NAWQA) programs for the Upper and Lower Illinois River watersheds also have provided additional basic data for long-term assessment of water quality. However, neither monitoring program has produced continuous funding for gages over a long-term period.
A current focus of water quality is on the assessment of TMDLs for specific water bodies that appear on the impaired list developed by the IEPA as part of the Clean Water Act Section 303d program. Based on pilot studies, the IEPA has anticipated the need for streamflow gaging to support the calculation of pollutant loading in streams, especially as it pertains to the calculation of TMDLs and administration of the TMDL program. Several respondents to the user survey also commented on this importance; and there is growing recognition that the availability of sufficient stream quantity and quality data is critical to assessment, modeling, and compliance associated with the TMDL process, as well as to the overall process credibility. However, the actual process and data needs associated with the evaluation of TMDLs are as yet uncertain.
Currently the TMDL process is considered to be in a state of flux. The National Research Council (2001) issued a review of the TMDL process, with recommendations that the process needs to become more scientifically based, including the development of new approaches for monitoring, assessment, and post-implementation monitoring. This process potentially could lead to a greater need for intensive short-term monitoring to more accurately describe the variability of pollutant loading. Stream Restoration Much of the previous work on stream restoration has focused on the implementation of in-channel structures and vegetative controls to reduce bank erosion. While these efforts will continue, an emerging focus is the determination of geomorphologic and hydrologic characteristics of stable stream channels. Assessment of channel stability, characteristics of sediment loading, estimation of effective discharges, and other stream restoration issues will require monitoring of flow and suspended sediment, particularly during high-flow events. Pre- and post-implementation monitoring of stream restoration sites also should also be promoted.
Most of the current suspended sediment records are for short periods in large watersheds. The more complete records are useful in developing sediment budgets for the large rivers of Illinois. Few sediment records are available for streams in small watersheds, such as those that require stream restoration assessment. Monitoring of sediment load characteristics for smaller watersheds poses a new level of challenges in streamflow gaging. Many smaller watersheds have unstable rating curves that require frequent measurements to maintain accuracy. More importantly, to measure discharge and sediment concentration during high flows, it will be necessary for field staff to respond quickly to the onset of storm events and thus be located in close proximity to each gage. Ancillary data on sediment characteristics, including bank and bed
87
Watershed Restoration (Including Assessment of Best Management Practices) Considerable environmental funding is being spent in Illinois for watershed restoration, including land conservation and implementation of various best management practices (BMPs). Most of these watershed restoration practices are designed to reduce the loading of sediments and nutrients in Illinois streams, but there are additional potential benefits, such as the reduction in flood magnitude. The Illinois Department of Natural Resources currently funds 14 streamflow gages operated by the ISWS on small watersheds to evaluate watershed management practices, including those associated with the Conservation Reserve Enhancement Program (CREP). There is considerable need for continued and additional assessment of management practices and associated monitoring efforts. In most cases, the assessment of watershed restoration will require the use of watershed and water-quality modeling, and monitoring should be designed to support modeling needs. Much of the data necessary for watershed management and stream restoration are from small watersheds. In addition, gages installed to assess watershed management practices should be sited carefully to produce the maximum information on BMP effectiveness. For these reasons, current gaging locations generally provide limited information for these data needs. Sediment monitoring, discussed earlier in relation to stream restoration, is also important for establishing baseline conditions for the assessment of watershed restoration. Historical sediment records from the USGS, ISWS, and other agencies provide some baseline analysis of suspended sediment in larger watersheds, but not in smaller watersheds. In addition, much of the monitoring in larger watersheds has been for short periods that do not necessarily represent the expected long-term conditions Management of New Water Withdrawals or Diversions
Over the past two years, there have been numerous plans for and development of large withdrawals from Illinois streams, in particular for use with electricity generation. Recent interest in the development of energy resources and an emphasis by the Illinois Legislature on growing the Illinois coal industry has spawned the design of newer, more energy-efficient power plants, many of which could consume large amounts of water. In many cases, the proposed water withdrawals have the potential for conflicts with other off-stream and in-stream water uses without management of the water resource. Future demands for potable water from the growing population, such as in northeastern Illinois, also will create water resource planning and management concerns that will require good streamflow data. When potential large water withdrawals are not located directly near an existing gage, it often may be appropriate to install a new streamflow gage to monitor stream discharge at the point of withdrawal – particularly for public waters of Illinois, where the State could determine that a proposed withdrawal should be restricted during low-flow conditions to maintain adequate flow for in-stream ecosystems and other uses.
Data Needed on Small Watersheds
The need for streamflow gages on small watersheds for regional analysis was discussed earlier in this report. However, some emerging issues listed above also have similar gaging needs on small watersheds. For example, issues associated with stream restoration, watershed management, and some load assessments for TMDLs require measurements of discharge and sediment during floods and high-flow conditions, often on relatively small watersheds. Assessment for many of these issues will rely on modeling and use data from small streams to calibrate models. Typically, data collection for modeling small watershed gages often is operated for shorter periods of time, i.e., for periods of less than 10 years, until sufficient data are available for model calibration. If possible, gages should be sited to serve multiple purposes to maximize the benefit of the gage’s data, as well as the likelihood of continued support for that gage. If maintained for a sufficient period of record, gages initially installed on small watersheds to evaluate stream and watershed management also can provide records useful for other applications such as regional flood-frequency analysis. Potential Role of NSIP The National Streamflow Information Program (NSIP) was initiated by the USGS (1999) to address concerns with the capacity of the federal streamflow gaging network to meet longstanding federal interests. Funds from NSIP have been used to install several new gages in Illinois, but to date, the extent of the NSIP funding has been limited, thus, also limiting its overall effect on the configuration of the Illinois network.
Most of the present and potential gaging locations selected as part of NSIP provide
support specifically for the NWS forecasting, and, thus, may not address other State and local gaging goals. If sufficiently funded, NSIP potentially can support gages for this use that are currently funded by other agencies, possibly freeing up resources to address other network goals by adding new gages or reactivating discontinued gages. As addressed earlier in this report, the ICWP (2002) has expressed concerns that non-Federal dollars freed up by moving gages into NSIP may not be redirected back into the network, but may be reallocated to meet other State and local water resource needs, particularly if matching funds from the USGS Federal-State Cooperative Water Resources Program are not available.
Current NSIP gages designated for water quality and regional characterization appear to be designed for a national assessment and are too few for detailed statewide assessment and prediction. In addition, a few of the proposed locations of NSIP gages for regional analysis in Illinois should be reevaluated so that sites are located on streams that have a low level of flow modification by human activities. As for all new gages, preference should be given to the new NSIP sites that serve multiple Federal, State, and local needs.
88
89
discharge as represented by long-term flow records. As a result, older, discontinued gaging
Summary and Conclusions
The Illinois Streamflow Gaging Network has been maintained continuously since 1914
through a cooperative partnership between the USGS, State, and other federal agencies. The size and character of the network have changed considerably over the past 30 years, largely because of funding shifts. The number of crest-stage peak-flow gages and continuous discharge gages in small rural watersheds were reduced by well over 90 percent as a result of funding reductions in the 1970s and early 1980s. Since that time, there has been generally level funding in the network from federal and state agencies. This has been counteracted somewhat by an increase in funding from local and county agencies. Local agencies now support 28 continuous discharge gages, or almost 20 percent of the network. The overall network also has become more urban.
Most cooperating agencies and respondents in the user survey consider real-time stage data to be the most critical. However, the most commonly used data are historical discharge records. Annual peak discharge data were identified in the user survey as the most important data for all users. Data products, such as flow forecasts, flood and low-flow frequency estimates, and estimation of flow characteristics at ungaged sites also have high importance for users.
Users perceive that river forecasting/flood warning is the most important category of data application overall, followed by long-term flow statistics for analyzing hydrologic trends and determining human impacts to streams. However, although individual users perceive the overall value of these forecasting and statistics categories, they usually are not involved in those types of applications. The categories with the greatest number of responses as far as importance to individual users are the project assessment categories, i.e., hydrologic-hydraulic modeling and biological and conservation assessment.
The network appears to be meeting most traditional current-use needs. Most decisions that have shaped the streamflow gaging network over the past 30 years have been based primarily on current-use needs, and this likely will continue to be the case. Current-use needs provide a high and direct payback of investments into the network and likely will continue to take precedence over most other needs.
The network no longer appears to provide a sufficient base of gages to support many long-term needs related to small watersheds. A base network, maintained at locations that are representative of Illinois streams, is necessary: 1) to meet future network needs that cannot be anticipated, 2) to detect and evaluate long-term trends and hydrologic effects of land use and climatic changes, and 3) for use in regional studies to estimate flow characteristics for the many streams in Illinois with no gages. The current network adequately covers many major streams, but not a sufficient number or broad geographic coverage of gages on minor streams.
Stationarity in the hydrologic records must not be assumed in the use of hydrologic data. More than half of the long-term flow records in rural areas show statistically significant increases in average flow conditions as a result of climate variability. Statewide, over the past 25 years, there also has been an average increase of 18 percent in the estimates of the 100-year flood peak
records may not accurately represent the expected present-day, long-term hydrologic conditions; and shorter gaging records, regardless of period of record, also may not fully represent the expected long-term conditions.
There should be an effort to rebuild the crest-stage peak-flow network in some form for continuing support in developing regional equations of flood frequency. Because hydrologic stationarity is not present, it is clear that new flood data on small watersheds is needed to properly estimate the present magnitude of flooding in Illinois. Over time, the failure to update the peak-flow database with more recent flow records eventually will invalidate the use of these older records and the equations based upon them. The present set of gages alone is not sufficient to derive regional flood frequency relationships in Illinois. There are similar concerns related to the scarcity of gages available for estimating regional characteristics of low-flow frequency and flow duration in small watersheds. There is a need for more research and analysis to determine how hydrologic trends and variability affect the estimation of flow frequency, including investigation into techniques to detrend or extend gage records, so that shorter gaging records can be interpreted to more accurately estimate the expected long-term conditions on streams.
Various methods are available for assessing the regional value of gages in the network, including both quantitative and descriptive approaches, none of which are definitive and potentially can provide widely different results. Entropy-based information transfer analysis (Markus and Knapp, 2003, in preparation) provides a quantitative measure of regional value. However, because of the variability in results of these analyses, a determination of the regional value of gages should consider a broad range of available information and approaches. The section on “Regional Value of Streamflow Gages” presents a number of different considerations.
Several emerging issues, including those related to stream and watershed restoration and
water-quality load assessment, will require data from smaller watersheds, which are currently underrepresented in the network. To address these issues, efforts must be taken to reestablish streamflow gages in smaller rural watersheds. Although this report has focused on water-quantity issues, there is a need for these small watershed gages to address additional environmental issues, such as sediment and nutrient loading, channel geometry and stability, biological and conservation issues, etc. If possible, new gages should be located to serve multiple purposes, possibly involving financial support from multiple agencies, so as to improve the long-term viability of the gage and thus eventually provide base-network data for future needs. Preference also should be given to reactivating discontinued gages with records of good quality; thus, reviving the historic record of these gages and more quickly leading to the establishment of a long-term record at that site. This report presents a number of factors for evaluating the overall importance of gages. The section “Ranking of Relative Importance of Individual Gages” presents a relative-worth score for each gage based on these factors. The purpose of this score is for relative comparisons and discussion of gage importance, as the assignment of relative worth is subjective and likely to vary over time as the needs of individual agencies change. A detailed list of factors should be
90

developed for discussions related to any specific gage. The retention of gages that have a low relative-worth score should be discussed by appropriate cooperating agencies, as there may be other inactive or new gage sites that could serve multiple purposes and provide more valuable data.
91

93
Network (http://icwp.org/tomdraftreport.pdf, accessed January 2003).
References Benson, M.A., and R.W. Carter. 1973. A National Study of the Streamflow Data-Collection
Program. U.S. Geological Survey, Water-Supply Paper 2028, U.S. Government Printing Office, Washington, D.C.
Clark, J.S., S.R. Carpenter, M. Barber, S. Collins, A. Dobson, J.A. Foley, D.M. Lodge, M.
Pascual, R. Pielke, W. Pizer, C. Pringle, W.V. Reid, K.A. Rose, O. Sala, W.H. Schlesinger, D.H. Wall, and D. Wear. 2001. Ecological Forecasts: An Emerging Imperative. Science 293:657-660.
Curtis, G.W. 1977. Technique for Estimating Magnitude and Frequency of Floods in Illinois.
U.S. Geological Survey Water-Resources Investigations 77-117, Illinois District, Urbana, IL.
Dawdy, D.R. 1979. The Worth of Hydrologic Data, Water Resources Research 15(6):1726-
1732. Dragonetti, J. 1999. Diminishing Financial Resources for the Nation’s Streamgaging Network.
The Professional Geologist 36(4):11. Fitzgerald, K.K., P.D. Hayes, T.E. Richards, and R.L. Stahl. 1984. Water Resources Data,
Illinois, Water Year 1983: Volume 1, Illinois Except Illinois River Basin. U.S. Geological Survey Water-Data Report IL-83-2, Illinois District, Urbana, IL.
Gandin, L.S. 1963. Objective Analysis of Meteorological Fields. Leningrad, Gidrometeorol-
ogischeskoe Izdatel’stvo, 287 pp. (In Russian). (English translation No. 1373 by Israel Program for Scientific Translations (1965), Jerusalem, 242 pp.).
Hardison, C.H. 1969. Accuracy of Streamflow Characteristics. In Geological Survey Research
1969, Chapter D, U.S. Geological Survey Professional Paper 650-D, pp. 210-214, U.S. Government Printing Office, Washington, D.C.
Harmancioglu, N.B., and N. Alpaslan. 1992. Water Quality Monitoring Network Design: A
Problem of Multi-Objective Decision Making. AWRA Water Resources Bulletin 28(1):179-192.
Harris, M.L., P.J. Draper, and D.L. Schrader. 2002. Water Resources Data, Illinois, Water Year
2001. U.S. Geological Survey Water-Data Report IL-73-01, Illinois District, Urbana, IL. Husain, T. 1989. Hydrologic Uncertainty Measure and Network Design. AWRA Water
Resources Bulletin 25(3):527-534. Interstate Council on Water Policy (ICWP). 2002. A Critique of the USGS National Streamflow
Information Program and Considerations in Establishing a National Streamgaging
94
Karasev, I.F. 1968. Principles for Distribution and Prospects for Development in a Hydrologic
Network. Soviet Hydrology 6:560-588, 1968. Lanfear, K.J., and R.M. Hirsch. 1999. USGS Study Reveals a Decline in Long-record
Streamgages. EOS, Transactions of the American Geophysical Union 80(50):605-607. Langbein, W.B. 1979. Overview of the Conference on Hydrologic Data Networks, Water
Resources Research 15(6):1867-1871. Langford, R.H., and F.P. Kapinos. 1979. The National Water Data Network: A Case History.
Water Resources Research 15(6):1687-1691. LaTour, J.K., J.C. Maurer, and T.L. Wicker. 1998. Water Resources Data, Illinois, Water Year
1997: Volume 2, Illinois River Basin. U.S. Geological Survey Water-Data Report IL-97-2, Illinois District, Urbana, IL.
LaTour, J.K., J.C. Maurer, and T.L. Wicker. 1997. Water Resources Data, Illinois, Water Year
1996: Volume 2, Illinois River Basin. U.S. Geological Survey Water-Data Report IL-96-2, Illinois District, Urbana, IL.
LaTour, J.K., J.C. Maurer, T. L. Wicker, and J. M. Gioja. 2001. Water Resources Data, Illinois,
Water Year 2000. U.S. Geological Survey Water-Data Report IL-00, Illinois District, Urbana, IL.
LaTour, J.K., J.C. Maurer, T. L. Wicker, and J. M. Gioja. 2000. Water Resources Data, Illinois,
Water Year 1999. U.S. Geological Survey Water-Data Report IL-99, Illinois District, Urbana, IL.
LaTour, J.K., J.C. Maurer, T. L. Wicker, and J. M. Gioja. 1999. Water Resources Data, Illinois,
Water Year 1998. U.S. Geological Survey Water-Data Report IL-98, Illinois District, Urbana, IL.
Leighton, M.M., G.E. Ekblaw, and L. Horberg. 1948. Physiographic Divisions of Illinois.
Illinois State Geological Survey Report of Investigation 129, Urbana, IL. Linfoot, E.H. 1957. An Informational Measure of Correlation, Information and Control 1:85-89. Mades, D.M., and K.A. Oberg. 1986. Evaluation of the U.S. Geological Survey’s Gaging-
Station Network in Illinois. U.S. Geological Survey Water-Resources Investigations Report 86-4072, Illinois District, Urbana, IL.
Mades, D.M., and K.A. Oberg. 1984. Cost Effectiveness of the U.S. Geological Survey’s
Stream-Gaging Program in Illinois. U.S. Geological Survey Water-Resources Investigations Report 84-4123, Illinois District, Urbana, IL.
Markus, M., and H.V. Knapp. 2003. Use of Information Transfer Methods in Evaluating the Regional Value of Illinois Streamflow Gages. Illinois State Water Survey Contract Report (in preparation).
Maurer, J.C., T.L. Wicker, and J.K. LaTour. 1994. Water Resources Data, Illinois, Water Year
2003: Volume 1, Illinois Except Illinois River Basin. U.S. Geological Survey Water-Data Report IL-93-1, Illinois District, Urbana, IL.
Moss, M.E. 1979. Some Basic Considerations in the Design of Hydrologic Data Networks.
Water Resources Research 15(6):1673-1676. Moss, M.E., E.J. Gilroy, G.D. Tasker, and M.R. Karlinger. 1982. Design of Surface Water Data
Networks for Regional Information. U.S. Geological Survey Water Supply Paper 2178, Reston, VA.
Moss, M.E., and M.R. Karlinger. 1974. Surface Water Network Design by Regression Analysis
Simulation. Water Resources Research 10(3):427-433. Moss, M.E., and G.D. Tasker. 1991. An Intercomparison of Hydrological Network-design
Technologies. Hydrological Sciences Journal 36:209-221. National Research Council (NRC). 2001. Assessing the TMDL Approach to Water Quality
Management. NRC Water Science and Technology Board, National Academy Press, Washington, D.C.
National Research Council (NRC). 1992. Regional Hydrology and the USGS Stream Gaging
Network. National Academy Press, Washington, D.C. Preston, S.D. 1997. Evaluation of the Stream-Gaging Network in Maryland, Delaware and
Washington, D.C. U.S. Geological Survey Fact Sheet FS-97-126 (http://md.usgs.gov/ publications/fs-97-126, accessed January 2003).
Sieber, C.R. 1970. A Proposed Streamflow Data Program for Illinois. U.S. Geological Survey
Open-File Report, Illinois District, Urbana, IL. Singh, K.P., G.S. Ramamurthy, and M.L. Terstriep. 1986. Illinois Streamgaging Network
Program: Related Studies and Results. Illinois State Water Survey Miscellaneous Publication 94.
Slack, J.R., and J.M. Landwehr. 1992. Hydro-Climatic Data Network: A U.S. Geological
Survey Streamflow data Set for the United States for the Study of Climate Variations, 1874-1988. U.S. Geological Survey Open-File Report 92-129, Reston, VA (http://water.usgs.gov/pubs/of/fr92-129/, accessed January 2003).
95
Stahl, R.L., K.K. Fitzgerald, T.E. Richards, and P.D. Hayes. 1984. Water Resources Data, Illinois, Water Year Volume 1, Illinois Except Illinois River Basin. U.S. Geological Survey Water-Data Report IL-83-1, Illinois District, Urbana, IL.
Tasker, G.D. 1986. Generating Efficient Gauging Plans for Regional Information. In Integrated
Design of Hydrological Networks, Proceedings of the Budapest Symposium. (M.E. Moss, ed.). International Association of Hydrological Sciences (IAHS) Publication 158:269-281.
Tasker, G.D., and J.R. Stedinger. 1989. An Operational GLS Model for Hydrologic Regression,
Journal of Hydrology 111:361-375. Team for Evaluating the Wisconsin Water Monitoring Network (TEWWMN). 1998. An
Integrated Water-Moniotoring Network for Wisconsin. Wisconsin Water Resources Center Special Report, WRC SR 98-01, University of Wisconsin, Madison, WI.
Thomas, W.O., Jr., and K.L. Wahl. 1993. Summary of the Nationwide Analysis of the Cost Effectiveness of the U.S. Geological Survey Stream-gaging Program (1983-88). U.S. Geological Survey Water Resources Investigations Report 93-4168, Reston, VA. U.S. Geological Survey. 2002. Illinois NSIP Streamgages that Would Receive Full Federal
Funding Under Complete NSIP Implementation (http://water.usgs.gov/nsip/nsipmaps/ il_nsip.html, accessed January 2003).
U.S. Geological Survey (USGS). 1999. Streamflow Information for the Next Century – A Plan
for the National Streamflow Information Program of the U.S. Geological Survey. U.S. Geological Survey Open-File Report 99-456, Reston, VA (http://water.usgs.gov/pubs/ of/ofr99456/, accessed January 2003).
U.S. Geological Survey (USGS). 1998. A New Evaluation of the USGS Streamgaging Network.
A Report to Congress, November 30, 1998 (http://water.usgs.gov/streamgaging/, accessed January 2003).
U.S. Geological Survey. 1972. Water Resources Data for Illinois, 1971. U.S. Geological
Survey, Illinois District, Urbana, IL. Wahl, K.L., and J.R. Crippen. 1984. A Pragmatic Approach to Evaluating a Multipurpose
Stream-Gaging Network. U.S. Geological Survey, Water Resources Investigations Report 84-4228, Reston, VA.
Wahl, K.L., W.O. Thomas, Jr., and R.M. Hirsch. 1995. Stream Gaging Program of the USGS.
U.S. Geological Survey, Circular 1123 (http://water.usgs.gov/pubs/circ/circ1123/, accessed January 2003) .
96
97
Wicker, T.L., J. K. LaTour, and J.C. Maurer. 1998. Water Resources Data, Illinois, Water Year 1997: Volume 1, Illinois Except Illinois River Basin. U.S. Geological Survey Water-Data Report IL-97-1, Illinois District, Urbana, IL.
Wicker, T.L., J. K. LaTour, and J.C. Maurer. 1997. Water Resources Data, Illinois, Water Year
1996: Volume 1, Illinois Except Illinois River Basin. U.S. Geological Survey Water-Data Report IL-96-1, Illinois District, Urbana, IL.
Yang, Y., and D.H. Burn. 1994. An Entropy Approach to Data Collection Network Design.
Journal of Hydrology 157:307-324. Zuehls, E.E., J.K. LaTour, and T.L. Wicker. 1994. Water Resources Data, Illinois, Water Year
2003: Volume 1, Illinois Except Illinois River Basin. U.S. Geological Survey Water-Data Report IL-93-2, Illinois District, Urbana, IL.
������������������������������
� � �� �� � � � � �
� � � � �
� �� � � � ��������
Equal opportunity to participate in programs of the Illinois Department of Natural Resources (IDNR) and those funded by the U.S. Fish and Wildlife Service and other agencies is availableto all individuals regardless of race, sex, national origin, disability, age, religion, or other non-merit factors. If you believe you have been discriminated against, contact the funding source’scivil rights office and/or the Equal Employment Opportunity Officer, IDNR, One Natural Resources Way, Springfield, IL 62702-1271; 217/785-0067; TTY 217/782-9175.