Embed Size (px)
Citation preview

Greenspan, A. MCD Biology Honors Thesis: Spring, 2011
1
Evaluation of the Heterotrophic Plate Count Test for Drinking Water Safety: Comparing Culture-based vs.
Molecular Methods for Identifying Bacteria
Alex Greenspan MCDB Honors Thesis
Oral Defense: April 1, 2011
Thesis Advisor: Norm Pace (MCD Biology)
Committee Members: Norm Pace (MCD Biology) Noah Fierer (EE Biology)
Rui Yi (MCD Biology)

Greenspan, A. MCD Biology Honors Thesis: Spring, 2011
2
Abstract: Federal regulations of drinking-water quality regarding microbial contamination require
the use of the culture-based heterotrophic plate count (HPC). This study compares HPC to
culture-independent techniques for enumeration and identification of bacteria in environmental
samples. Drinking water samples were collected from four different sites at two different times
of year and analyzed using HPC, bacterial identification from 16s ribosomal RNA gene
sequences, and direct cell counts from epifluorescence microscopy. No significant correlation
was found between HPC measurements and either direct cell counts or measures of sample
biodiversity from sequence analysis. 16s rRNA gene sequences from bulk DNA extractions
reveal microbial communities in drinking water to comprise a broad array of bacterial diversity,
including microbes of potential concern to human health such as mycobacteria. Conversely, HPC
consistently selected for members of the Alphaproteobacteria (Sphingomonas, 45.8%;
Methylobacteria, 33.8%; Porphyrobacter, 11.7%). These organisms comprised 25.0, 2.8, and 0.8
percent respectively of all 16s rRNA gene libraries from bulk DNA extractions. This result
suggests that the heterotrophic plate count is not a relevant measure of drinking water quality.

Greenspan, A. MCD Biology Honors Thesis: Spring, 2011
3
Introduction:
The United States suffers an estimated 19.5 million cases of waterborne illness each
year1. In approximately 47 percent of cases the etiology of the disease is unknown1,2. Despite this
stark uncertainty in the actual quality of American drinking water, federally mandated tests of
drinking water for microbial contamination rely largely on culture-based methods for microbial
detection and assumptions about microbial ecology that have progressed little in the past
century3. Though molecular, DNA-based methods currently exist to reliably and accurately
identify the microbial constituents of environmental samples, information on the actual microbial
consortia inhabiting water systems is lacking.
Municipal water utilities in the United States are required to evaluate the risk of microbial
contamination for drinking water pursuant to the Total Coliform Rule (TCR). This regulation
requires municipalities to monitor for the presence of coliforms (bacteria often found in
mammalian digestive tracts) at end-user locations throughout the water distribution system4. The
absence of coliforms is the main indicator for determining whether water is safe for human
consumption. The Heterotrophic Plate Count (HPC) is used as an ancillary indicator of the
accuracy of total coliform tests and is used by water monitors to provide data about water quality
by approximating the levels of live heterotrophic bacteria in a water sample5. However, the HPC
is severely limited in the range and precision of information the test provides, because the
bacteria detected by the test are not generally pathogenic, and the test does not detect all
pathogenic bacteria6. Furthermore, the methods of disinfection used by treatment facilities
(primarily chlorination and chloramination) often allow the growth of some pathogens not
detected by total coliform and HPC assays, including Legionella pneumophila and many
potentially pathogenic species of mycobacteria7,8. Furthermore, HPC bacteria have been shown

Greenspan, A. MCD Biology Honors Thesis: Spring, 2011
4
experimentally to inhibit the growth of Legionella, meaning low plate counts could potentially
obfuscate their presence9. These organisms are now known to pose a public health risk to
consumers8, yet the prevalence of these organisms is not well understood due to the lack of
monitoring regimes for a broader suite of micro-organisms.
The Heterotrophic Plate Count is conducted by incubating a filtered sample of water on
R2A agar plates, and counting number of resultant bacterial colonies that grow on each plate5.
The number of colonies on a plate divided by the volume of water filtered onto that plate yields
the number of colony forming units (CFU’s) per milliliter. If CFU/mL exceeds 500 in a sample
with a low chlorine residual level, the total coliform test may be indeterminate5. Given the
selective properties of the R2A medium, colonies are assumed to consist of hetertrophic enteric
bacteria (bacteria often found in mammalian digestive tracts, potentially indicative of fecal
contamination), and bacterial colonies are often vaguely identified as specific species based on
morphology5. However, advances in sequencing technologies now allow scientists to examine
environmental microbial communities in much greater depth than was previously possible from
culture-dependent techniques, such as those used in HPC10.
Earlier understanding of microbiology relied on the study of microbes grown in culture.
However, less than one percent of known microbial species can be induced to grow in culture10.
Instead of examining a microbe in enrichment culture, we can now infer the identity of a microbe
in an environmental sample by the sequences of its ribosomal RNA (rRNA) genes. The ribosome
is found in all living organisms, and the genetic sequences that encode rRNA are relatively
highly conserved among the three domains of life, making rRNA gene sequences ideal for
determining broad-scale microbial phylogeny and genetic relatedness10.

Greenspan, A. MCD Biology Honors Thesis: Spring, 2011
5
Though rRNA gene sequencing has been applied in many environmental contexts, the
microbiology of drinking water is still relatively poorly characterized. Several studies have
utilized rRNA gene sequencing to examine microbial communities in drinking water11,7,12. Kim
Ross (Pace Laboratory, University of Colorado, Bouder) is currently conducting numerous
surveys of the microbial ecology of drinking water system around the United States (unpublished
data, personal communications, 2010-2011). These studies indicate that drinking water
ecosystems are much more microbiologically complex than culture based surveys would suggest,
and often contain potential pathogens not detected by standard water quality tests.
Several studies have compared HPC to both other culture-dependent and culture-
independent techniques for examination of microbial ecosystems in drinking water. Carter et al.
conducted HPC while monitoring physical and chemical properties of various water distribution
systems and found HPC results to be uncorrelated with any chemical or physical parameter of
water quality13. Hoefel et al. used culture-independent techniques to specifically monitor the
effect of chloramine disinfection of water on the population of nitrifying bacteria and found that
culture independent techniques revealed bacterial populations to be several orders of magnitude
higher than indicated by HPC11. Lavender and Kinzelman compared agar-based enumeration of
Escherichia coli in water samples to detection by quantitative polymerase chain reaction (qPCR),
wherein an E. coli-specific gene was amplified to quantify the E. coli in the sample, and found
qPCR to be more sensitive than culture-based methods14.
Several studies have also attempted to correlate heterotrophic plate counts with measures
of biodiversity from 16s rRNA gene analysis15-17. Burtscher et al. and Farleitner et al. both
compared HPC results to denaturation-gradient gel electrophoresis (DGGE) profiles of 16s
rRNA gene sequences in drinking water samples15,17. DGGE analysis is conducted by running

Greenspan, A. MCD Biology Honors Thesis: Spring, 2011
6
amplicons of 16s rRNA genes on a denaturation gel containing the denaturant in an increasing
concentration gradient. Different DNA sequences will denature at different concentrations thus
providing a fingerprint of the diversity of different sequences in the sample15,17. In some cases,
DNA bands can be removed from the gel, purified, and sequenced to provide some insight into
the specific microbial constituents of the sample15. Burtscher et al. conducted DGGE analysis on
both DNA extractions from drinking water samples and on colonies of HPC plates from those
same samples and did not find any of the same bands in either analysis, indicating differences in
the make-ups of microbial communities as shown by DGGE and HPC. These results, however,
are limited in the strength of their implications. Burtscher et al. sequenced the variable V3 region
of several of the 16s rRNA bands of both the HPC and DNA extraction DGGE gels to give some
idea of the specific organisms living in the water samples and isolated by HPC. However, these
identifications are limited in phylogenetic accuracy based on the small sequence lengths
compared to the entire 16s rRNA gene. Furthermore, the sequences represent only several
samples of a community of thousands of organisms. At most, DGGE provides a general idea of
the diversity of a sample. However, ecological fingerprinting methods such as DGGE cannot
give as reliable statistical measures of biodiversity as full SSU rRNA gene sequencing studies,
because fingerprints ignore the less abundant organisms that full phylogenetic analysis is capable
of detecting17. In order to accurately evaluate the capabilities and limitations of the heterotrophic
plate count, more precise molecular techniques for enumeration and identification of microbes
must be employed.
Despite consistent findings that heterotrophic plate counts are not correlated with other
measures of drinking water quality, the method is still widely used18. One reason for HPC’s
persistence is that high HPC observations (between 500 and 100 CFU/mL’s) have been shown to
Greenspan, A. MCD Biology Honors Thesis: Spring, 2011
7
interfere with common, lactose-based, culture methods for detection of coliforms, and the total
coliform rule is the primary measure of microbial contamination of drinking water in the United
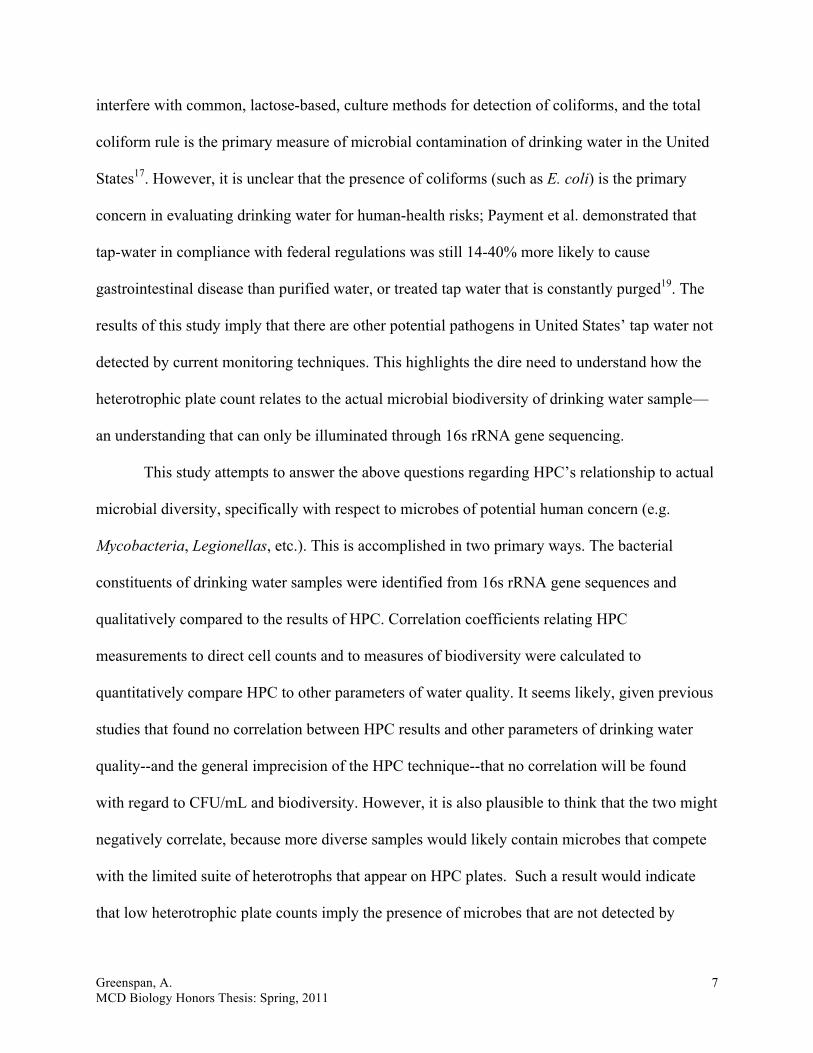
States17. However, it is unclear that the presence of coliforms (such as E. coli) is the primary
concern in evaluating drinking water for human-health risks; Payment et al. demonstrated that
tap-water in compliance with federal regulations was still 14-40% more likely to cause
gastrointestinal disease than purified water, or treated tap water that is constantly purged19. The
results of this study imply that there are other potential pathogens in United States’ tap water not
detected by current monitoring techniques. This highlights the dire need to understand how the
heterotrophic plate count relates to the actual microbial biodiversity of drinking water sample—
an understanding that can only be illuminated through 16s rRNA gene sequencing.
This study attempts to answer the above questions regarding HPC’s relationship to actual
microbial diversity, specifically with respect to microbes of potential human concern (e.g.
Mycobacteria, Legionellas, etc.). This is accomplished in two primary ways. The bacterial
constituents of drinking water samples were identified from 16s rRNA gene sequences and
qualitatively compared to the results of HPC. Correlation coefficients relating HPC
measurements to direct cell counts and to measures of biodiversity were calculated to
quantitatively compare HPC to other parameters of water quality. It seems likely, given previous
studies that found no correlation between HPC results and other parameters of drinking water
quality--and the general imprecision of the HPC technique--that no correlation will be found
with regard to CFU/mL and biodiversity. However, it is also plausible to think that the two might
negatively correlate, because more diverse samples would likely contain microbes that compete
with the limited suite of heterotrophs that appear on HPC plates. Such a result would indicate
that low heterotrophic plate counts imply the presence of microbes that are not detected by

Greenspan, A. MCD Biology Honors Thesis: Spring, 2011
8
current monitoring techniques but which might be of potential human concern. Both hypotheses
will be tested.
Methods:
Sample Collection:
Samples were collected from end-user locations and from the wastewater treatment plant
around the area of Boulder, Colorado. Samples were collected by running taps until the chlorine
residual of the water reached a value greater than 0.7 mg/L, then capturing 1 L of the sample in
sterile containers for HPC and DNA extraction. Forty-five mL of water in a 50 mL conical tube
containing 5 mL of 37% formaldehyde for epifluorescent staining and direct cell counting.
Samples were collected from the same sites in July, 2010 and February, 2011. Samples collected
in July were stored on ice until being returned to the lab. In order to maximize viability of
bacteria in samples collected in February, samples were not stored on ice during transit.
Heterotrophic Plate Counts:
Heterotrophic plate counts were conducted according to protocols outlined in Standard
methods for the examination of water and wastewater20: water samples were diluted in sterile
buffered dilution water (Hatch Company, Dusseldorf, Germany) and filtered through white-
gridded, 0.45 µm, 47 mm diameter Millipore membrane filters (EZ-Pak Membrane Filters,
Millipore, Molsheim, France). The filters were then placed on R2A agar plates and incubated for
7 days at 29°C. The number of colonies on each plate was then counted according to the color
and morphology of each colony.

Greenspan, A. MCD Biology Honors Thesis: Spring, 2011
9
Plates were made from dilutions of 1, 2, and 3 mLs of samples collected in July. Samples
were collected in December, and again plated using 1, 2, and 3 mL dilutions. However,
insufficient colonies grew on the plates made from the December samples to provide relevant
HPC data, requiring recollection of samples in February. Based on the low plate counts from
December’s samples, dilutions of 1, 10, 100, and 200 mL were filtered and plated for each
sample collected in February.
16s rRNA gene sequencing from HPC colonies:
For each sample, I selected one plate that was representative of the diversity in colony-
types present for a given sample. Several colonies of each type (color and morphology) were
selected randomly from each chosen plate and picked into tris-EDTA (TE) buffer (10µL of TE
were used for July samples and 30µL of TE for February samples, due to difficulties in obtaining
reliable PCR product from July’s samples). Picked colonies in TE were boiled for 15 minutes at
85°C and subsequently centrifuged at 3700 rpm for 10 minutes. One µL of supernatant was
pipetted into a PCR reaction mixture with 5 Prime HotMasterMix (5 Prime, Inc., Hamburg,
Germany) and 515 forward/1391 reverse universal small-subunit rRNA gene primers. The
reaction mixtures then underwent 29 cycles of the polymerase chain reaction.
Amplified 16s rRNA genes from each colony were then aliquotted into two reactions and
cleaned (to remove unincorporated nucleotides and other leftover reagents) using ExoSAP-IT
(Affymetrix, Inc., Santa Clara, CA). Cleaned PCR product was prepared for sequencing using
the DYEnamic ET Dye Terminator Kit (MegaBACE, GE Healthcare, Piscataway, NJ) as per
manufacture instruction. Sequences were obtained using the Pace Laboratory’s MegaBACE 96-
well capillary sequencer.

Greenspan, A. MCD Biology Honors Thesis: Spring, 2011
10
DNA extraction and amplification:
Water samples were filtered through 0.2µm polycarbonate filters. Genomic DNA was
then extracted from the filters using phenol-chloroform extraction and resuspended in TE. SSU
rRNA genes from the DNA extractions were amplified using 515f and 1391r universal SSU
rRNA gene primers and 5 Prime HotMasterMix (5 Prime, Inc., Hamburg, Germany).
SSU rRNA gene cloning:
Amplified SSU rRNA genes from the DNA extractions were gel-purified. Gel
purification allows separation of eukaryotic 18s rRNA genes from bacterial and archeal 16s
rRNA genes. However, as sequences obtained from DNA extractions were only to be compared
with gene sequences from bacterial colonies picked from HPC plates, only 16s rRNA genes were
cloned for the purpose of this study (that is, the smaller (16S) band was excised and purified and
the 18S band was not used). Purified DNA was incorporated into PCR4-TOPO vector
(Invitrogen Corp.) containing ampicillin-resistance genes and T3/T7 primer sites. Vectors
containing the incorporated 16s rRNA genes were cloned into electrocompetent TOPO-4
Esherichia coli cells using electroporation. Transfected cells were incubated overnight on LB-
agar/ampicillin plates.
16s rRNA gene sequencing from DNA-extraction amplicons:
Cloned colonies were picked, regrown, and boiled in TE. Supernatant from boiled
biomass underwent T3/T7 PCR. PCR product was cleaned using ExoSAP-IT. Cleaned PCR
product was prepared for sequencing using DYEnamic ET Dye Terminator Kit. 16s rRNA gene

Greenspan, A. MCD Biology Honors Thesis: Spring, 2011
11
sequences were obtained for each sample using the Pace Laborotory’s MegaBACE 96-well
capillary sequencer.
Sequence Analysis:
16s rRNA gene sequences from both HPC colonies and from bulk DNA extraction clone
libraries were BLASTed against the all-species Living Tree Project 16s rRNA gene database for
named species21 using XplorSeq22. BLASTed sequences were then aligned using SILVA’s
SINA online SSU rRNA gene aligner23. Aligned sequences were inserted into SILVA’s SSU
reference database 104 using ARB’s parsimony insertion function24. Phylogenetic lineage
information about each sequence was then exported from ARB for bacterial identification and
biodiversity calculations.
Direct cell counts:
Water samples were fixed at 3.7% formaldehyde. Samples were filtered through 0.2µm
black polycarbonate 25mm diameter filters. Filters were mounted on glass microscope slides
using citifluor mounting agent. 0.5 mL of 2.5 µg/mL 4’-6-diamidino-2-phenylidole (DAPI)--
diluted in pH 7.8 10 mM filter-sterilized tris buffer--was spotted onto each filter. Each filter was
allowed to stain for 5 minutes then cleaned with filter-sterilized tris. Cells were then visualized
and counted at 40x magnification using epifluorescence microscopy. Counts per field of view
were multiplied by the area of each filter over the area of each field then divided by the volume
of sample filtered ((count x (area of filter / area of field)) / volume), then averaged for each
sample to obtain counts in cells/mL for each sample.

Greenspan, A. MCD Biology Honors Thesis: Spring, 2011
12
Results:
Samples were collected from four sites. Three of the four sites (HS, C1, and MC) were
collected from public end-user taps around Boulder, Colorado. The remaining sample (WW) was
collected from the outflow of a wastewater treatment plant. Samples were collected from these
same four sites in July and December of 2010, and February of 2011, then processed as per the
procedures outlined above. Samples collected in December did not yield results sufficient for
data analysis and discussion. The remainder of this paper will focus on data obtained from
samples collected from the four aforementioned sites in July and February.
Heterotrophic Plate Counts:
Multiple dilutions (from different volumes) were plated of each sample. The
heterotrophic plate count data presented here represents the mean CFU/mL calculated from all
plates for each sample. If the number of colonies that grows on a plate is not linearly related to
the volume of water that was filtered for that plate, it is plausible to think that the volume filtered
will influence the CFU/mL calculation for that plate. This would suggest that averaging across
plates with different volumes filtered for the same sample may not accurately represent the
CFU/mL level of that sample. To test for this a correlation coefficient was calculated for all
CFU/mL calculations across all volumes-filtered and all samples. The correlation coefficient was
calculated as -0.243 with a p-value of 0.0829 (degrees of freedom = 32). This test indicates that
there is no significant correlation (at a 95% confidence level) between CFU/mL calculated for a
specific plate, and the volume of water filtered for that plate, lending credibility to the procedure
of averaging across plates for the same sample.

Greenspan, A. MCD Biology Honors Thesis: Spring, 2011
13
Figure 1 shows the average CFU/mL calculated for each sample from both collections
(July and February). The average CFU/mL for all eight samples was 18.8. Plate counts of the
samples collected in July yielded and average CFU/mL of 34.5, whereas samples collected in
February averaged only 3.5 CFU/mL.
Figure 1: Average CFU/mL for four predominant sample-sites calculated from all plates for each sample. Error bars represent standard deviation.
Direct Cell Counts:
The average cell count across all eight samples was on the order of 103 cells/mL. On
average, samples collected in July had an order of magnitude more cells/mL than samples
collected in February with significant differences in average cell counts for samples collected in
July and February (p = 5.058x10⁻⁷, df = 113). Cell counts ranged from 102 cells/mL to 103
cells/mL. This range corroborates expectations of cell concentrations in drinking water from
previous studies; Hoefel et al. compared the enumeration of bacteria in drinking water in
1.07
74.28
2.208.67 6.30
1.44 2.70
53.44
0
10
20
30
40
50
60
70
80
90
100
C1_feb C1_july HS_feb HS_july MC_feb MC_july WW_feb WW_july
CFU/m
L

Greenspan, A. MCD Biology Honors Thesis: Spring, 2011
14
Southern Australia using HPC and flow cytometry (staining samples with propidium iodide/Syto
9) and found both that cell counts from flow cytometry consistently ranged from 102 to 104
cells/mL and were 1-2 log units higher than CFU/mL from HPC24,25.
Figure 2: Direct cell counts (cells/mL on log scale) of eight primary samples. Error bars represent 95% confidence intervals under the assumption that the data follows a t-distribution.
Nevertheless, the precision of the data is limited by several elements of the experiment’s
design. Several counts were performed over the course of the study on each sample by filtering
only part of the sample each time. The cell counts in cells/mL reported here represent the mean
of all counts for each sample. Nested analysis of variance was performed to test whether there
was significant variance in each sample’s average cell count between each time that the sample
was counted, the results of which are summarized in table 1.
Source of Variation
Degrees of Freedom
Sum of Squares
Mean Squares
F Ratio
P(F)
Sample 8 134546250 16818281 5.606656 0.01741311 Count 7 20997892 16818281 1.952968 0.06916349 Error 99 152060956 1535969 Table 1: Nested analysis of variance in cell count data between samples and within each sample between counts.
4.15E+02
2.98E+03
4.91E+02
4.29E+03
5.75E+028.46E+02
5.25E+02
1.57E+03
1.E+00
1.E+01
1.E+02
1.E+03
1.E+04
1.E+05
C1_f C1_j HS_f HS_j MC_f MC_j WW_f WW_j
Log10(Cells/m
L)

Greenspan, A. MCD Biology Honors Thesis: Spring, 2011
15
This test shows that, although there is significant variation in the mean cell counts between
samples, the variation in each sample’s average from the different preparations (i.e. each time the
sample was aliquoted and counted) is not significant. This allows the legitimate averaging of cell
counts for each sample across preparations, which in turn enables the performance of the model-
I, 1-way analysis of variance above, comparing averages from the same collection site across
collection times.
16s rRNA Gene Sequences:
Sequences from bulk DNA extractions:
Figure 4 summarizes the relative abundance of bacteria identified by phylogenetic
analysis from the DNA libraries of all eight samples. The predominant groups in most samples
were Sphingomonadaceae, Cyanobacteria, and Rhizobiales. General patterns of relative
abundance within the bacterial libraries appear to be conserved across samples, and even more
strongly within the same samples collected at different times.

Greenspan, A. MCD Biology Honors Thesis: Spring, 2011
16
!""#$%&'#
$%&(#
)*&'#
)*&(#
+$&
'#+$&
(#,,&(#
,,&'#
-.-#
/.-#
%-.-#
%/.-#
0-.-#
0/.-#
1-.-#
1/.-#
2-.-#
2/.-#
/-.-#
!345
6783
5498
3484
##
!3:;:
<:39
67:=4
84##
!=84
96":=
4834
84##
>83:"
"8348
4#>83
:""?@#
>458
A965
4678
3549:8
#638%
0#
>98;
B9C:D
67:83
484#>
6@48
#
$8?"6
78354
9834
84#?=
3?"5?
94;#
$C:5:
=6AC
8E83
484#*
4;:<
:=:78
3549:?
<#
$"6@59
:;:83
484#F
G678
3549#
$6<
8<6=
8;83
484#!
3:;6H
698G
#
$6<
8<6=
8;83
484#I
4"(5:8
#
$6<
8<6=
8;83
484#*
:<A":
3:@A:9
8#
$69:6
78354
9:834
84#!
56A6
7:?<
#
$B8=
6783
549:8
#+JK
%L%0
#
K=54
9678
3549:8
3484
#K=54
9678
3549#
K9B@
:A4"65
9:3C8
3484
#M?9:3
:78354
9#
K9B5
C967
8354
9834
84#N6
9ACB
9678
3549#
O8<
:"B#PQ
#Q=34
9584#*
4;:@#
N4A5
6=:AC
:"?@#
)BAC
6<:39
67:83
484#>
"8@56
3C"69
:@#
)BAC
6<6=
8;83
484##
J83C
=6@A
:9834
84#!
=849
6@A6
9678
3549#
J83C
=6@A
:9834
84#R6
@47?
9:8#
+45
CB"67
8354
9:834
84#+
45CB
"6783
549:?
<#
<:56
3C6=
;9:8#
#
+69
8G4""
8348
4#!3:=
4567
8354
9#
+B3
6783
549:8
3484
#+B3
6783
549:?
<#
N8@54
?94""
8348
4#)84
<6A
C:"?@
#
N4A5
6363
3834
84#I
4@?"(
6@A6
96@:=
?@#
N"8=3
56<
B345
8348
4#S4<
<85
8#
N"8=6
3633
8348
4#Q=3
4958
4#*4;
:@#
N96A
:6=:78
3549:8
3484
#N96A
:6=:78
3549:?
<#
N@4?
;6<
6=8;
8348
4#N@4
?;6<
6=8@
#
RC:D6
7:8"4@
#O-T0
1#
R:3U
455@:
8"4@#*
+0I
%0#
*:=67
8354
9834
84#V
4H@U
:8#
*AC:=
E6<
6=8;
8348
4#*AC
:=E6<
6=8@
#
*AC:=
E6<
6=8;
8"4@#!
WQ,
X/0#
*594
A563
6338
3484
#*594
A563
633?
@#
P8=5
C6<
6=8;
8348
4##
!"#$"%&'()*%+(%$"'
!""#
$%&'#
$%&(#
)*&'#
)*&(#
+$&
'#
+$&
(#
,,&(#
,,&'#

Greenspan, A. MCD Biology Honors Thesis: Spring, 2011
17
Figure 5: SChao1 vs sequences sampled for different numbers of sequences (clustered at 97% sequence identity) from all samples except WW_j; because of the relatively low number of observed sequences, almost all sequences observed in WW_j’s library were observed only once, causing the SChao1 measure for WW_j to be an order of magnitude higher than for any other sample. Figure 5 shows the predicted diversity in each sample, estimated by SChao1. There does
appear to be a difference in predicted diversity between the libraries, although this may reflect
the small size of the libraries: because of the relatively low number of observed sequences,
almost all sequences observed in WW_j’s library were observed only once, causing the SChao1
measure for WW_j to be an order of magnitude higher than for any other sample. SChao1 is
calculated from the total number of species observed in a sample plus the square of the number
of species observed only once, divided by twice the number of species observed two times26.
SChao1 thereby provides an estimate of the diversity of organisms observed in a sample. Because
total number of species observed and the number of species rarely observed increase with the
number of samples taken until all species have been observed multiple times, SChao1 increases
with sampling. Therefore, SChao1 also provides a measure of how thoroughly a sample has been
sequenced; as the full range of biodiversity in a sample approaches complete observation, SChao1
of the sample no longer increases with increased sequences sampled. By this measure, it would
0
20
40
60
80
100
120
0 20 40 60 80 100 120
Schao1
SequencesSampled
C1_j
C1_f
HS_f
HS_j
MC_j
MC_f
WW_f

Greenspan, A. MCD Biology Honors Thesis: Spring, 2011
18
appear that none of the samples collected in this study have been sequenced fully enough to get a
complete idea of the biodiversity contained within each sample.
Sequences from HPC plates:
Colonies on HPC plates were counted by color and morphology if obviously different
colony structures existed within the same color-group (e.g. large rough versus small round
yellow colonies). Colonies representative of each colony-type on each plate were picked for 16s
rRNA gene sequencing to identify each colony’s constituent bacteria. Sequences were
categorized primarily by the sample from which they originated and the color of the colony they
represented. All of the HPC-plate sequence data, aggregated by color and identified through
phylogenetic analysis are presented in table 2.
Bacterial Lineage Colony type Phylum Class Order Family Genus p w y o b Firmicutes Bacilli Bacillales Staphylococcaceae Staphylococcus 0 0 1 0 0 Proteobacteria Alphaproteobacteria Rhizobiales Methylobacteriaceae Methylobacterium 37 3 1 0 0 Proteobacteria Alphaproteobacteria Rickettsiales 0 0 1 0 0 Proteobacteria Alphaproteobacteria Sphingomonadales Erythrobacteraceae Porphyrobacter 1 0 1 5 5 Proteobacteria Alphaproteobacteria Sphingomonadales Erythrobacteraceae 0 0 1 0 0 Proteobacteria Alphaproteobacteria Sphingomonadales Sphingomonadaceae Blastomonas 0 0 11 0 0 Proteobacteria Alphaproteobacteria Sphingomonadales Sphingomonadaceae Sphingomonas 0 1 49 0 0 Proteobacteria Alphaproteobacteria Sphingomonadales Sphingomonadaceae Sphingopyxis 0 0 1 0 0 Proteobacteria Gammaproteobacteria Xanthomonadales Sinobacteraceae 0 0 0 0 1 Proteobacteria Gammaproteobacteria Xanthomonadales Sinobacteraceae Nevskia 0 0 0 0 18 Table 2: Phylogenetic identification of all HPC colonies classified by color. p=pink, w=white, y=yellow, o=orange, b=brown. The pink colonies were most likely Methylobacteria. The white colonies were too small
to get consistent PCR, so whichever wells were labeled as white more likely contained genetic
material from other colonies and were therefore identified predominantly as species attributed to
other colony-types; as a result, and because of their relative inabundance, the white colonies will
be ignored for the remainder of the study. Yellow colonies were identified predominantly as two

Greenspan, A. MCD Biology Honors Thesis: Spring, 2011
19
different Sphingomonodacae bacteria, but there was no consistent pattern regarding which
colonies were identified as each genus, so all yellow colonies will be treated as Sphingomonas
for the purpose to this study. Orange colonies are assumed to be Porphyrobacter and all brown
colonies are treated as Nevskia.
Comparison between HPC sequences and extraction sequences:
Table 3 compares the relative abundance of bacterial species identified by phylogenetic
analysis of sequences obtained from DNA extractions with the relative abundance of each
species ascribed to each colony-type on each HPC plate, for each sample.
Table 3: Relative abundance of bacteria in bulk DNA extraction clone libraries and on HPC plates. Values in columns labeled “ext” represent the percentage of sequences in the clone library for that sample that were identified as a particular bacterial group. Values in columns labeled “HPC” represent the percentage of colonies on the HPC plates that were identified as belonging to a particular bacterial group.
Total
ext
Total
HPC
C1_f
ext
C1_f
HPC
C1_j
ext
C1_j
HPC
HS_f
ext
HS_f
HPC
HS_j
ext
HS_j
HPC
MC_f
ext
MC_f
HPC
MC_j
ext
MC_j
HPC
WW_
f ext
WW_
f HPC
WW_
j ext
WW_
j HPC
Sphingomonadaceae Sphingomonas 25.0 45.8 10.4 32.2 38.9 18.2 56.1 29.0 95.2 1.2 97.8 26.3 22.2 41.1 47.2 20.0 4.64
Rhizobiales F0723 16.2 29.2 18.9 22.7 1.4 0.0 41.1 2.7 13.3
Cyanobacteria MLE1-12 13.4 22.9 1.1 18.2 40.6 4.8 2.1 13.7 46.7
Peptococcaceae Desulfosporosinus 4.4 10.4 0.0 0.0 0.0 19.0 0.0 1.4 0.0
Hyphomicrobiaceae Hyphomicrobium 4.0 0.0 3.2 0.0 17.4 0.0 4.2 1.4 0.0
Mycobacteriaceae Mycobacterium 3.4 2.1 13.7 0.0 0.0 1.2 0.0 2.7 0.0
Methylobacteriaceae Methylobacterium 2.8 33.8 0.0 52.5 11.6 49 0.0 43.1 1.4 4.76 0.0 2.22 2.1 55.6 0.0 52.8 0.0 1.99
Acetobacteraceae Rhodovarius 2.0 0.0 2.1 0.0 0.0 0.0 8.4 0.0 0.0
Methylobacteriaceae Meganema 2.0 0.0 0.0 0.0 0.0 0.0 10.5 0.0 0.0
Comamonadaceae 1.6 0.0 0.0 0.0 0.0 3.6 0.0 6.8 0.0
Moraxellaceae Acinetobacter 1.6 0.0 0.0 4.5 0.0 4.8 0.0 4.1 0.0
Comamonadaceae Acidovorax 1.4 0.0 0.0 4.5 0.0 2.4 0.0 2.7 13.3
Chitinophagaceae Sediminibacterium 1.2 4.2 0.0 0.0 0.0 3.6 0.0 1.4 0.0
Sphingomonadaceae Sphingobium 1.2 2.1 0.0 0.0 0.0 6.0 0.0 0.0 0.0
Anaerolineaceae 1.0 0.0 0.0 22.7 0.0 0.0 0.0 0.0 0.0
Comamonadaceae Variovorax 1.0 0.0 0.0 0.0 0.0 3.6 0.0 2.7 0.0
Clostridiaceae Oxobacter 1.0 0.0 0.0 0.0 0.0 6.0 0.0 0.0 0.0
Erythrobacteraceae Porphyrobacter 0.8 11.7 0.0 14.6 4.2 49.5 0.0 0.0 0.0 0.0 0.0 0.0 26.5
Rickettsiales SM2D12 0.8 0.0 4.2 0.0 0.0 0.0 0.0 0.0 0.0
Acetobacteraceae 0.8 0.0 2.1 0.0 2.9 0.0 0.0 0.0 0.0
Comamonadaceae Simplicispira 0.8 0.0 0.0 0.0 0.0 1.2 0.0 4.1 0.0
Hyphomonadaceae 0.6 0.0 0.0 0.0 0.0 0.0 3.2 0.0 0.0
Caulobacteraceae uncultured 0.6 4.2 0.0 0.0 0.0 1.2 0.0 0.0 0.0
Pseudomonadaceae Pseudomonas 0.6 0.0 0.0 0.0 0.0 0.0 0.0 4.1 0.0
Lachnospiraceae 0.6 0.0 0.0 0.0 0.0 3.6 0.0 0.0 0.0
Erythrobacteraceae 0.4 0.0 0.0 0.0 1.4 0.0 0.0 1.4 0.0
Planctomycetaceae Planctomyces 0.4 0.0 0.0 0.0 1.4 0.0 0.0 1.4 0.0
Bradyrhizobiaceae 0.4 0.0 0.0 0.0 1.4 1.2 0.0 0.0 0.0
Streptococcaceae Streptococcus 0.4 0.0 0.0 0.0 0.0 1.2 0.0 1.4 0.0
Bacillaceae Bacillus 0.4 0.0 0.0 0.0 0.0 2.4 0.0 0.0 0.0
Chloroplast 0.4 0.0 0.0 0.0 0.0 2.4 0.0 0.0 0.0
Ruminococcaceae Incertae Sedis 0.4 0.0 0.0 0.0 0.0 2.4 0.0 0.0 0.0
Staphylococcaceae Staphylococcus 0.4 0.0 0.0 0.0 0.0 2.4 0.0 0.0 0.0
Phyllobacteriaceae 0.2 0.0 0.0 0.0 0.0 0.0 0.0 0.0 6.7
Sinobacteraceae Nevskia 0.2 8.73 0.0 0.0 0.0 0.81 0.0 0.0 0.0 0.0 6.7 66.9
Chitinophagaceae 0.2 0.0 0.0 4.5 0.0 0.0 0.0 0.0 0.0
Hyphomicrobiaceae Blastochloris 0.2 0.0 0.0 4.5 0.0 0.0 0.0 0.0 0.0

Greenspan, A. MCD Biology Honors Thesis: Spring, 2011
20
Sphingomonas was the only bacterium generally common to sequences both from DNA
extractions and plates. The species that predominated on HPC plates were rarely significant in
the bacterial population as determined by 16s rRNA gene libraries for the same water samples. In
particular, methylobacteria appeared to be much more dominant on HPC plates than in the actual
bacterial communities.
The phylogenetic lineage information displayed above was obtained by inserting SINA-
aligned sequences into SIVLA’s SSU rRNA reference database using ARB’s parsimony
insertion function. Sequences were also aligned using BLAST against the Living Tree Project’s
non-environmental species 16s rRNA gene database, comprised primarily of organisms cultured
in a clinical setting22. BLAST hits were not used for species identification. Interestingly,
however, the average percent identity for HPC sequences BLASTed against the database was
97.2, whereas sequences obtained from clone libraries, on average, were matched to sequences in
the database at 96.1 percent identity. Of the ten identified groups of sequences from all HPC
plates, two were matched at 94 percent sequence identity and one at 95 percent; the remaining
sequences all BLASTed at 98 or 99 percent sequence identity. Sequences from bulk DNA
extraction ranged from 89 to 100 percent sequence identity.
Correlation between cells/mL and CFU/mL:
Figure 6 shows a plot of the calculated cells/mL for all eight samples against CFU/mL
for those same samples. The correlation coefficient was calculated as 0.4576731 with a p-value
of 0.1508896 (n = 8), meaning the data did not show a significant correlation between cell counts
and plate counts.

Greenspan, A. MCD Biology Honors Thesis: Spring, 2011
21
Figure 6: Scatterplot of CFU/mL vs Cells/mL for all samples.
However, the power of this estimate of correlation is 0.18 meaning there is a probability
of 0.82 of not seeing a significant correlation when correlation is in fact present (power was
calculated using Z transformations of the correlation coefficient27). In order to achieve a power
of 0.80 for a similarly weak correlation, approximately 35 observations would be required.
Correlation between biodiversity and CFU/mL:
A correlation coefficient was also calculated relating CFU/mL of a sample calculated
from plate counts to the biodiversity of a sample, estimated by SChao1. Figure 7 summarizes the
relationship between CFU/mL and SChao1 for seven of the eight samples (WW_j was excluded for
reasons explained above). The correlation coefficient was calculated as 0.3076833 with p-value
of 0.2510151 (n = 7), meaning the data was insufficient to observe any significant correlation
between CFU/mL and SChao1. The power of this test was calculated to be 0.08. In order to
achieve power of 0.80, approximately 80 observations would be required.
0
10
20
30
40
50
60
70
80
0 1000 2000 3000 4000 5000
CFU/m
L
Cells/mL

Greenspan, A. MCD Biology Honors Thesis: Spring, 2011
22
Figure 7: Scatterplot of CFU/mL vs SChao1 for all samples except WW_j.
Discussion:
The data collected in this study showed no significant correlation between heterotrophic
plate counts and either direct cell counts, or relative biodiversity. Furthermore, side-by-side
comparisons of the bacteria identified by 16s rRNA gene sequencing from bulk DNA extraction
and heterotrophic plate counts reveals little similarity in overall community diversity as well as
significant distortions in relative abundance, particularly for Methylobacteria. Together, these
results imply that the heterotrophic plate count has little relevance for determining parameters of
drinking water quality regarding microbial communities. This is particularly striking given that
HPC may not detect the potential presence of microbes of concern to human health. In particular,
this study found significant levels of Mycobacteria in the sample collected from C1 in July.
The genus mycobacterium is of particular concern for human health because of the
diversity of obligate and opportunistic human pathogens contained within the genus28. The
particular sequences identified as Mycobacteria in the July C1 sample were identified by BLAST
as Mycobacteria asiaticum with 98% sequence identity, an average bit score of 1364, and
0
10
20
30
40
50
60
70
80
0 5 10 15 20 25
CFU/m
L
SChao1

Greenspan, A. MCD Biology Honors Thesis: Spring, 2011
23
sequences of average length 744 base pairs. M. asiaticum has been identified as possible source
of pulmonary diseases and infection29. However, given high conservation in mycobacterial 16s
rRNA gene sequences, further analysis would need to be conducted before making any strong
conclusions about the presence of possible mycobacterial pathogens in the C1 sample.
Interestingly, the July C1 sample had the highest plate count of any of the eight samples
processed for this study. However, the CFU/mL of the July C1 sample was still less than one
fifth the amount set as the upper limit for acceptable drinking water in the United States.
The primary limitation of the data collected for this study was that the samples collected
represent a small subset of the range in drinking water quality that is acceptable under federal
regulations. Heterotrophic plate counts up to 500 CFU/mL are considered acceptable for human
consumption under the Total Coliform Rule. However, HPCs of samples collected for this study
were consistently observed to be less than 100. Estimates of correlation are known to be weaker
over smaller ranges of data, meaning that even if a correlation could have been observed between
HPC and biodiversity or bacterial load, it is unlikely that such correlation could have been
accurately estimated given the scope of this study. It is difficult to conclude from the results of
this study that the heterotrophic plate count is of no value as an indicator of drinking water
quality. Instead, however, the results of this study suggest the strong need for further
investigations into exactly what HPC measures regarding drinking water quality. Such
investigations will require samples over a broader range of water qualities, as well as more
robust estimates of total bacterial load and bacterial diversity within those samples.

Greenspan, A. MCD Biology Honors Thesis: Spring, 2011
24
Acknowledgements:
I would like to thank my thesis advisor, Norm Pace, for granting me the opportunity to
pursue my research interests and for his seemingly boundless patience. I am deeply indebted to
everyone in the Pace Lab for their support and assistance. I am especially grateful to Eric
Holinger for initially teaching me the techniques required for this study, to Steven Mihaylo for
help with cloning and general technical troubleshooting, as well as Laura Baumgartner and
Reece Gesumaria for help with writing and general emotional support. I cannot give enough
thanks to Kim Ross, without whom none of my thesis would have been possible and who
endured far more than her fair share of stress on my behalf.
This project was funded in part by the Undergraduate Research Opportunities Program
(HHMI) at the University of Colorado, Boulder.

Greenspan, A. MCD Biology Honors Thesis: Spring, 2011
25
References: 1. Reynolds, K. a, Mena, K.D. & Gerba, C.P. Risk of waterborne illness via drinking water
in the United States. Reviews of environmental contamination and toxicology 192, 117-58(2008).
2. Craun, G.F. et al. Causes of Outbreaks Associated with Drinking Water in the United States from 1971 to 2006. Clin. Microbiol. Rev. 23, 507-528(2010).
3. Allen, M.J., Edberg, S.C. & Reasoner, D.J. Heterotrophic plate count bacteria--what is their significance in drinking water? International Journal of Food Microbiology 92, 265-274(2004).
4. Total Coliform Rule : A Quick Reference Guide. 2-3(1989). 5. Reasoner, D.J. Heterotrophic plate count methodology in the United States. International
Journal of Food Microbiology 92, 307-315(2004). 6. Bartram, J. Heterotrophic plate counts and drinking-water safety: the significance of
HPCs for water quality and human health. 272(IWA Publishing: 2003).at <http://books.google.com/books?id=apqcbAN7QL4C>
7. Pryor, M. et al. Investigation of opportunistic pathogens in municipal drinking water under different supply and treatment regimes. Water Science and Technology: A Journal of the International Association on Water Pollution Research 50, 83-90(2004).
8. Berry, D., Xi, C. & Raskin, L. Microbial ecology of drinking water distribution systems. Current Opinion in Biotechnology 17, 297-302(2006).
9. Toze, S. et al. Inhibition of growth ofLegionella species by heterotrophic plate count bacteria isolated from chlorinated drinking water. Current Microbiology 21, 139-143(1990).
10. Pace, N.R. A Molecular View of Microbial Diversity and the Biosphere. Science 276, 734-740(1997).
11. Hoefel, D. et al. Culture-Independent Techniques for Rapid Detection of Bacteria Associated with Loss of Chloramine Residual in a Drinking Water System. Appl. Environ. Microbiol. 71, 6479-6488(2005).
12. Kormas, K.A. et al. Changes of the bacterial assemblages throughout an urban drinking water distribution system. Environmental Monitoring and Assessment 165, 27-38(2009).
13. Carter, J.T. et al. Relationships between levels of heterotrophic bacteria and water quality parameters in a drinking water distribution system. Water Research 34, 1495-1502(2000).
14. Lavender, J.S. & Kinzelman, J.L. A cross comparison of QPCR to agar-based or defined substrate test methods for the determination of Escherichia coli and enterococci in municipal water quality monitoring programs. Water Research 43, 4967-4979(2009).
15. Farnleitner, A.H. et al. Comparison and differentiation of heterotrophic plate count communities in raw and drinking water by eubacterial 16S-rDNA amplicon profiling. Vom Wasser 97, 167-180(2001).
16. Farnleitner, A.H. et al. Eubacterial 16S-rDNA amplicon profiling: a rapid technique for comparison and differentiation of heterotrophic plate count communities from drinking water. International journal of food microbiology 92, 333-45(2004).
17. Burtscher, M. et al. Heterotrophic plate count vs. in situ bacterial 16S rRNA gene amplicon profiles from drinking water reveal completely different communities with distinct spatial and temporal allocations in a distribution net. Water SA (Online) 35, 495-504(2009).

Greenspan, A. MCD Biology Honors Thesis: Spring, 2011
26
18. Bent, S.J. & Forney, L.J. The tragedy of the uncommon: understanding limitations in the analysis of microbial diversity. The ISME journal 2, 689-95(2008).
19. Allen, M.J., Edberg, S.C. & Reasoner, D.J. Heterotrophic plate count bacteria--what is their significance in drinking water? International journal of food microbiology 92, 265-74(2004).
20. Eaton, A.D. et al. Standard methods for the examination of water and wastewater. (American Public Health Association: Washington, D.C., 2005).
21. Payment, P. et al. A prospective epidemiological study of gastrointestinal health effects due to the consumption of drinking water. International Journal of Environmental Health Research 7, 5-31(1997).
22. Yarza, P. et al. The All-Species Living Tree project: a 16S rRNA-based phylogenetic tree of all sequenced type strains. Systematic and applied microbiology 31, 241-50(2008).
23. Frank, D.N. XplorSeq: a software environment for integrated management and phylogenetic analysis of metagenomic sequence data. BMC bioinformatics 9, 420(2008).
24. Pruesse, E. et al. SILVA: a comprehensive online resource for quality checked and aligned ribosomal RNA sequence data compatible with ARB. Nucleic acids research 35, 7188-96(2007).
25. Buchner, A. et al., with Ludwig, W. et al., Yadhukumar ARB: a software environment for sequence data. Nucleic acids research 32, 1363-71(2004).
26. Hoefel, D. et al. Enumeration of water-borne bacteria using viability assays and flow cytometry: a comparison to culture-based techniques. Journal of Microbiological Methods 55, 585-597(2003).
27. Cohen, J. Statistical power analysis for the behavioral sciences. (Lawrence Erlbaum Associates: 1988).
28. Hughes, J.B. et al. MINIREVIEW Counting the Uncountable : Statistical Approaches to Estimating Microbial Diversity. Society 67, 4399-4406(2001).
29. Grech, M., Carter, R. & Thomson, R. Clinical significance of Mycobacterium asiaticum isolates in Queensland, Australia. Journal of clinical microbiology 48, 162-7(2010).


![Heterotrophic nutrition [2015]](https://img.pdfslide.us/doc/110x75/55d39cc0bb61ebf8268b46dd/heterotrophic-nutrition-2015-55d47f014ed07.jpg)