Embed Size (px)
Citation preview
EVALUATION OF THE DEWITT WALLACE-READER’S DIGEST
FUND’S PATHWAYS TO TEACHING CAREERS PROGRAM
SUBMITTED TO THE DEWITT WALLACE-READER’S DIGEST FUND
OCTOBER, 2001
DW
R D
EVALUATION OF THE DEWITT WALLACE-READER’S DIGEST FUND’S PATHWAYS TO TEACHING CAREERS PROGRAM
DeWitt Wallace- Reader’s Digest Fund
Beatriz Chu Clewell The Urban Institute
Ana María Villegas
Montclair State University
October, 2001
THE URBAN INSTITUTE 2100 M STREET, N.W. WASHINGTON, DC 20037
i
TABLE OF CONTENTS Table of Contents..............................................................................................................................i List of Tables .................................................................................................................................. ii List of Figures ................................................................................................................................. ii Acknowledgments.......................................................................................................................... iii Section 1: Introduction.................................................................................................................... 1
The Policy Context for the Pathways to Teaching Careers Initiative ......................................... 1 The Pathways to Teaching Careers Program.............................................................................. 3
The Structure of the Initiative ................................................................................................. 4 Overview of Sites Included in this Evaluation ....................................................................... 5
Section 2: Evaluation Methods ....................................................................................................... 7 The Summative Evaluation......................................................................................................... 7
Data Collection ....................................................................................................................... 8 Survey Coding, Data Verification, Data Entry, and Data Validation................................... 10 Analysis and Use of Survey Data ......................................................................................... 11
Section 3: Program Outcomes ...................................................................................................... 12 Q. 1: Did the Pathways Program meet its overall recruitment goals? ................................. 12 Q. 2: Have Pathways participants remained in the Program through completion and certification? Once they have completed the Program, do they work in targeted districts?. 14 Q. 3: Are Pathways graduates good teachers? ..................................................................... 18 Q. 4: Have Pathways graduates been retained in the teaching profession? ......................... 25
Section 4: Factors Contributing to the Success of the Pathways Program................................... 33 A Strong Partnership ............................................................................................................. 33 Careful Recruitment and Selection of Program Participants ................................................ 34 A Rigorous, Innovative, and Culturally Sensitive Teacher Education Curriculum.............. 37 Support Services for Candidates........................................................................................... 39 Support Services for Completers .......................................................................................... 42
Section 5: Conclusions and Policy Implications........................................................................... 44 Conclusions ............................................................................................................................... 44
Q. 1: Did the Pathways Program meet its overall recruitment goals? ................................. 44 Q. 2: Have Pathways participants remained in the Program through completion and certification? Once they complete the Program, do they teach in targeted school districts?44 Q. 3: Are Pathways graduates good teachers? ..................................................................... 45 Q. 4: Do Pathways graduates remain in teaching? .............................................................. 45
Summary................................................................................................................................... 45 Policy Implications ................................................................................................................... 46
References ..................................................................................................................................... 47 APPENDIX A : Overview of DeWitt Wallace Pathways to Teaching Careers Program sites ..A-1 APPENDIX B : Surveys ............................................................................................................. B-1 APPENDIX C : Description of the Praxis III Assessment system.............................................C-1 APPENDIX D : Report on Scholars Who Left the DeWitt Wallace-Readers Digest Pathways to Teaching Careers Program Before Program Completion...........................................................D-1 APPENDIX E : Coefficient of Variation.....................................................................................E-1
ii
LIST OF TABLES Table 1. Sources of Survey Data to Answer Evaluation Questions................................................ 8 Table 2. Survey Response Rates................................................................................................... 10 Table 3. Contribution of Pathways Participants to the Diversity of the Teacher Pool................. 13 Table 4. Field Supervisor Ratings in Main Teaching Areas, by Status ........................................ 19 Table 5. GES Ratings in Main Teaching Areas, by Status, Years 1-4 ......................................... 20 Table 6. GES Ratings in Main Teaching Areas, by Status, in Comparison to Typ ical Novice
Teachers, Years 5-6............................................................................................................... 21 Table 7. Teaching Effectiveness: Praxis III Ratings for a Sample of Pathways Participants...... 24 Table 8. Setting and Assignments of Pathways Teachers Employed Three Years after
Completion in a Full-Time Job in Teaching, by Status ........................................................ 29 Table 9. Setting and Assignments of Pathways Teachers Employed Three Years after
Completion in a Full-Time Job in Teaching, by Race/Ethnicity .......................................... 30 Table 10. Reasons Given by Pathways Graduates Who Entered and Left Teaching ................... 31 Table A.1a. Profile of Sites in the Northeast and Midwest Expansion.......................................A-2 Table A.1b. Profile of Sites in the Southern Expansion .............................................................A-3 Table A.1c. Profile of Independent Sites ....................................................................................A-4 Table A.1d. Profile of Peace Corps Sites....................................................................................A-5 Table D.1. Race/Ethnicity and Gender of Dropouts and All Scholars in the Case Study Sites .D-3 Table D.2. Race/Ethnicity and Gender of Dropouts from the Case Study Sites Who were
Contacted for Interviews .....................................................................................................D-3 Table D.3. Amount of Time Dropouts Spent in the Program Before Leaving ...........................D-4 Table D.4. Reasons for Leaving the Program.............................................................................D-5 Table D.5. Suggestions for Ways to Retain Scholars in the Pathways Program........................D-9 Table E.1. Coefficient of Variation: Field Supervisor Ratings in Main Teaching Areas, by Status
..............................................................................................................................................E-2 Table E.2. Coefficient of Variation: GES Ratings in Main Teaching Areas, by Status, Years 1-4
..............................................................................................................................................E-2 Table E.3. Coefficient of Variation: GES Ratings of Pathways Teachers in Comparison to
Typical Novice Teachers in Main Teaching Areas, by Status, Years 5-6 ...........................E-3
LIST OF FIGURES Figure 1. Profile of All Pathways Participants.............................................................................. 12 Figure 2. Demographic Profile of Pathways Participants by Status ............................................. 14 Figure 3. Progress of Pathways Participants through the Teacher Education Pipeline, by Status
............................................................................................................................................... 16 Figure 4. Pathways Teachers Working in Targeted and Non-Targeted Districts ......................... 18 Figure 5. Pathways Graduates Three Years After Completion: What Are They Doing? ............. 26 Figure 6. Percentage of Pathways Three-Year Graduates Currently Employed In Education, by
Race/Ethnicity and Status ..................................................................................................... 27 Figure 7. Comparison of Pathways Completers Who Are Still in Teaching After at Least Three
Years, and Those Who Left Teaching After at Least Three Years, by Status and Race/Ethnicity....................................................................................................................... 28
Figure 8. Pathways Graduates - Not Employed in Education ...................................................... 31
iii
ACKNOWLEDGMENTS It is normal for an evaluation spanning six and a half years to have accumulated a large debt of gratitude to myriad individuals who have contributed to its work in one way or another. This evaluation is no exception. What we do find exceptional, however, is the level of dedication that those who have worked on this project have lavished on its successful implementation. Our deepest and most heartfelt thanks go to those who labored long and hard on the Pathways evaluation during its early years: Clemencia Cosentino de Cohen, Stephanie Mudge, Nancy Sharkey, and Antoinette Mitchell. Our first site visitors—from both the Urban Institute and Educational Testing Service—also deserve thanks: Barbara Bruschi, Peg Goertz, Carla Herbig, Maria Rosario Jackson, Molly Joy, and Tamara Lucas. Mary Coombs, Rosemary Deibler, Anita Haywood, and Michael Bowden contributed much to the production of reports and other project materials during the first three years. Thanks also go to Mark Paskowsky, who established the complex database for the Pathways evaluation and to George Chow, whose depth of knowledge and expertise helped ensure smooth sailing for our database. Carrie O'Connor McGillen and Karen Callahan were vital to ensuring the maintenance and updating of this database in later years. Their ingenuity and perseverance was exemplary. For their help in the preparation of this final report, we thank Alissa Anderson, Laurie Forcier and LaTasha Holloway. We also appreciate Jane Hannaway’s suggestions for revising the final report. Kathy Barringer and Nick Holt of Roper Starch International helped us to increase response rates by doing a great job of tracking nonrespondents. This “Acknowledgments” section would not be complete without expressing our gratitude to the 40 Pathways programs that participated in the evaluation: their project directors, staff, and participants actively cooperated in the data collection process. We could not have conducted the evaluation without their help. The same applies to the coordinating agencies and their representatives: Nathaniel Jackson of the Southern Education Fund, Nona Weekes and Cathleen Wiggins of Bank Street, and Fran Bond and Henry Fernandez of the Peace Corps Fellows Program. Special thanks are due the members of our advisory board: Jacqueline Jordan Irvine, Patricia B. Campbell, the late Alonzo Crim, and Ursula Casanova. Their suggestions and insights early in the evaluation process helped give direction to our work. We are grateful to the staff of the DeWitt Wallace-Reader's Digest Fund for the ir unfailing support throughout this project. Adam Stoll, who was our program officer for most of duration of the evaluation, was exemplary in his guidance of the process. Ed Pauly also provided invaluable feedback and support, especially during the last two years. Mildred Hudson, who was the original program officer for Pathways, helped to ensure the cooperation of Pathways sites by her support of the evaluation. Sam Cargile, who became program officer in 1997, continued to be supportive of our efforts. Finally, we would like to take this opportunity to thank the Fund as an organization for acknowledging and validating program evaluation as a tool for facilitating decision making, program improvement, replication of best practices, and policy development. It is extremely gratifying to us, as evaluators, to see the fruits of our work put to the best possible use as it has been by our funder. Thank you.
Beatriz Chu Clewell and Ana María Villegas October 2001
1
EVALUATION OF THE DEWITT WALLACE-READER'S DIGEST FUND'S PATHWAYS TO TEACHING CAREERS PROGRAM
SECTION 1: INTRODUCTION
The purpose of this report is to present the cumulative findings from the six-year
evaluation of the Pathways to Teaching Careers Program supported by the DeWitt Wallace-Reader’s Digest Fund. The report is organized into five sections. In this introduction, we first situate the Pathways program within the current policy context, and then provide an overview of the Pathways initiative. Section 2 describes the evaluation methods. The two subsequent sections present the evaluation findings. Section 3 describes program outcomes, while Section 4 highlights Pathways strategies that proved successful in recruiting new candidates into teacher education, preparing them for teaching, and supporting them through program completion and the attainment of teacher certification. The final section gives the conclusions of the evaluation as well as the implications for policy that can be drawn from the study.
The Policy Context for the Pathways to Teaching Careers Initiative
The predicted shortage of K-12 teachers has captured the attention of educators and policymakers. Projections for the number of new teachers needed over the next eight school years (i.e., AY 2001-02 through AY2008-09) range from 1.6 to 2.0 million (Hussar, 1999). The growing demand for new teachers is attributed largely to two converging demographic trends. First, K-12 student enrollments are expected to expand substantially in the years ahead. In the Fall of 1998, for example, public elementary and secondary schools served a total of 46.5 million students (Snyder & Hoffman, 2000). By 2008, that number is expected to climb to 48.2 million (Hussar, 1999). This trend toward increasing enrollments is expected to extend well into the 21st century: according to the U.S. Department of Commerce (1996), the population of 5- to 19-year-olds will rise to 79.6 million by 2050. Second, as the student population swells, large numbers of teachers who were hired during the baby boom enrollment years will reach retirement age (Hussar, 1999). Exacerbating the attrition problem created by the expected waves of retirements is growing dissatisfaction among teachers stemming from factors such as poor school conditions, lack of administrative support, and low salaries (Education Commission of the States [ECS], 2000; Ingersoll, 2000). Complicating matters further, recent policies that reduce maximum class size, particularly for younger students, are creating additional demands for teachers, especially in the early grades (Clewell & Forcier, 2000; ECS, 2000).
Teacher shortages are not merely a matter of things to come. Many school systems are currently experiencing difficulties filling teacher vacancies. These shortages, however, are not evenly distributed (Clewell, Darke, Davis-Googe, Forcier, & Manes, 2000). Urban and rural schools, in particular, are plagued by an inadequate supply of teachers (Ingersoll & Bobbit, 1995; Eubanks, 1996; National Commission on Teaching and America’s Future, 1996). The majority of teachers prefer to teach in suburban schools (Howey & Zimpher, 1991), and new and returning teachers are not inclined to teach in urban areas (Jones & Sandidge, 1997). That many of the nation’s highest teacher attrition rates occur in urban districts compounds the problem (Adams & Dial, 1993). It is well documented that teachers in central city public schools are the
2
most likely both to migrate to teaching positions elsewhere and to leave the profession altogether (Whitener, Gruber, Lynch, Tingos, Perona & Fondelier, 1997).
Current teacher shortages are also more intense in selected fields. Bilingual education and special education vacancies are particularly difficult to fill (Boe, Bobbit, & Cook, 1997; Schmidt, 1992). Such shortages have been attributed to the low production of teachers in these two areas of specialization relative to the increasing numbers of immigrant students and recent changes in special education codes. Teachers of mathematics and science are also difficult to find (Clewell & Forcier, 2000; Clewell et. al., 2000; Grissmer & Kirby, 1992), in part due to the abundant opportunities that exist outside the teaching profession for college graduates with mathematics and science backgrounds (Clewell & Forcier, 2000).
The growing racial/ethnic imbalance between the student population and the teaching force raises questions about the relative shortage of teachers of color. Over the past two decades the student population has become increasingly diverse. Students of color already comprise over one-third of K-12 enrollments, and by 2035 they are expected to account for the majority of all children served in public elementary and secondary schools (U.S. Department of Commerce, 1996). Teachers of color, on the other hand, now comprise only about one-tenth of the teaching force in public schools (Snyder, Hoffman & Geddes, 1997). Unless active steps are taken to recruit more candidates of color into teaching and retain them in those positions, the representation of this group is likely to decline in the future (Clewell & Villegas, 2001; Villegas & Clewell, 1998a).
A compelling argument has been made that the racial/ethnic gap between teachers and their students deprives all children, but especially children of colo r, of role models (Mercer & Mercer, 1986; Stewart, Meier, La Follette & England, 1989). Additionally, there is evidence to suggest that the racial/ethnic gap between teachers and students deprives children of color of cultural brokers who might mediate critical differences between home and school that obstruct their academic achievement (Irvine, 1988; Villegas & Lucas, in press). The relative shortage of teachers of color, then, could have serious social and academic repercussions for the most rapidly growing segment of the student population (Villegas & Clewell, 1998b). In the past, empirical research attempting to establish the effect of having a same race/ethnicity teacher on student achievement was mixed and inconclusive (Ehrenberg & Brewer, 1995; Ehrenberg, Goldhaber & Brewer, 1995; Hanushek, 1992; Murnane, 1975). More recent research, however, has found consistent evidence of relatively large educational benefits that accrue to Black and Latino students with same/race ethnicity teachers (Dee, 2000; Clewell, Puma & McKay, 2001).
Concern about the relatively limited presence of males in the teaching force is heard in education and policy circles as well. During the 1993-94 school year, for example, males accounted for only 27 percent of all teachers (Henke, Chen, Geis & Knepper, 2000). The argument for greater parity in the gender distribution of the teaching force has not been articulated clearly in the literature, however. Presumably, more males are needed to serve as role models for children. This role model argument is most frequently heard from personnel in urban districts seeking males of color to staff city classrooms.
3
In brief, the overall demand for new teachers will grow substantially in the years ahead. Unless proactive steps are taken now, school systems across the country will have to contend with severe teacher shortages in the future. Already, a shortage of teachers is evident in urban and rural schools, in the fields of bilingual and special education, and in the subjects of mathematics and science. There is also a shortfall of teachers with certain characteristics. Specifically, the supply of teachers of color is sparse, and male teachers, especially males of color, are difficult to find.
Teacher shortages are problematic because they present a serious threat to the quality of education children receive in schools. When the supply of teachers is scarce, school systems cannot be selective in their hiring. Worse still, faced with large numbers of teacher vacancies, districts often resort to undesirable practices, such as assigning teachers to classes in fields other than those for which they were prepared (out-of- field assignments) and hiring teachers who lack appropriate teaching certificates (Clewell & Forcier, 2000). Such practices have become commonplace in urban schools serving high proportions of children who are poor and of color, with detrimental consequences for those children (ECS, 2000; Snyder & Wirt, 1998; National Commission on Teaching and America’s Future, 1996).
While response to the teacher shortage has been somewhat slow, a variety of policies intended to address current and projected school staffing challenges are already in place in some states and local districts. Some of those policies aim to control the exodus of the older and more experienced teachers by creating incentives for them to remain in their positions beyond the time at which they become eligible for retirement. Other policies seek to increase the retention rates of practicing teachers by raising salaries and other benefits, improving working conditions, and providing mentoring support through the initial years of teaching. A third policy approach calls for expanding recruitment efforts to include nontraditional pools of teachers, carefully selecting candidates from these pools, and preparing recruits rigorously for the teaching profession while supporting them in meeting certification requirements (for a thorough review of recruitment programs and policies see Clewell, Darke, Davis-Googe, Forcier & Manes, 2000). The Pathways to Teaching Careers Program exemplifies this last approach. In fact, both recent federal policy and literature on teacher recruitment bear the imprint of the Pathways experience, which has been carefully documented and eva luated over the past six years (see Clewell & Villegas, 1998b, 1999, 2001; Dandy, 1998; DeWitt Wallace-Reader’s Digest Fund, 1997; Villegas & Clewell, 1998a, 1998b).
The Pathways to Teaching Careers Program
Cognizant of the critical shortage of well-prepared teachers for urban and rural schools, the DeWitt Wallace-Reader’s Digest Fund launched the Pathways to Teaching Careers Program in 1989. The goal of this $50 million national initiative was to increase the number of well prepared and fully certified teachers--especially candidates of racial/ethnic minority backgrounds--working in high need public schools.
4
The Structure of the Initiative The Pathways initiative was comprised of four program strands, each targeting a different population. The strand structure provided organizational cohesion to this comprehensive initiative. Precollege Strand
A precollege strand targeted middle school and high school students. The overriding goal of this effort was to cultivate an interest in teaching careers on the part of program participants. The Fund supported one project in this strand. Morgan State University, in collaboration with the Baltimore City Public Schools and several institutions of higher education in the area, was awarded a grant to design and implement a comprehensive precollege program. This effort involved the following activities: recruiting African American students from middle schools and high schools into the program; establishing a formal eighth grade course to expose students in up to 30 middle schools to professional careers in teaching; establishing an elective teacher preparation course at the 12th grade level in 20 Baltimore schools; establishing a magnet school for teaching in Baltimore City Public Schools; and developing links between and among selected institutions of higher education, the school district, and MESA (Mathematics, Engineering, Science Achievement) programs for the purpose of interesting precollege students in becoming teachers. Undergraduate Strand
A second strand targeted traditional undergraduate students with the goal of interesting them in becoming teachers and earning teaching certificates. As part of this effort, Barnard College received funding to work with the Consortium for Excellence in Teacher Education, a group comprised of 16 private liberal arts colleges in the Northeastern United States with teacher education programs. Specifically, this program aimed to identify and recruit undergraduates from the participating colleges and to interest them in teaching in urban middle schools. As lead institution, Barnard College was responsible for providing program participants with supervised field placements in New York City middle schools; offering them an intensive four-week summer program in New York as well as credit-bearing seminars in New York on teaching students at the middle level; implementing follow-up activities at individual college sites and in New York City; and linking program participants, middle school students, and middle school teachers via a telecommunications network. Paraprofessionals and Non-Certified Teachers Strand
The strand targeting paraprofessionals and non-certified teachers was the most encompassing of the four. These efforts aimed at identifying and recruiting paraprofessionals and non-certified teachers working in public schools (e.g., emergency-certified teachers, non-certified substitute teachers, and teachers working outside their areas of certification), and offering them scholarships and other support services in order to obtain bachelor’s or master’s degrees and/or meet other requirements for full state certification. In return, participants agreed to continue teaching in the public schools for a specified period of time after program completion. The strand consisted of three clusters of grantees. The Northeast and Midwest Expansion, comprised of 10 programs, was coordinated by Bank Street College. The Southern
5
Expansion, involving 11 programs, was coordinated by the Southern Education Foundation. The third cluster inc luded five independent projects that reported directly to the Fund. Peace Corps Fellows Strand
The fourth strand included 14 projects, all of which were coordinated by the Peace Corps Fellows/USA Program. The aim of this strand was to identify and support potential teacher candidates from among returning Peace Corps volunteers (RPCVs). The projects placed selected Fellows in full-time salaried positions in urban and rural school districts, and provided a two-year graduate level program leading to teaching certification and a master’s degree.
To summarize, what we refer to in the rest of this report as the Pathways to Teaching Careers Program was national in scope, although concentrated mostly in the South, Northeast, and Midwest regions of the United States. It was comprised of 40 individual projects (11 in the Southern Expansion, 10 in the Northeast and Midwest Expansion, 5 independent sites, and 14 Peace Corps Fellows programs). It also included three coordinating agencies (SEF, Bank Street College, and the Peace Corps Fellows/USA Program).
The evaluation study detailed in this report thus focuses on the 40 projects comprising the two most comprehensive Pathways strands--paraprofessionals and non-certified teachers, and RPCVs. Because the projects implemented by the two lead institutions--Morgan State University and Barnard College--were vastly different from the others in terms of goals, target population, and support strategies, they were evaluated separately. The role of the Pathways evaluation team relative to those two efforts was largely one of providing technical assistance on evaluation matters to staff from Morgan State College and Barnard College. For the remainder of this report, all references to the "Pathways Program," or "Pathways Scho lars/Fellows" will refer solely to the 40 projects that are the subject of this evaluation.
Overview of Sites Included in this Evaluation
Figures A.1a-d (found in Appendix A) provides an overview of the 40 sites included in this evaluation. Each cluster--the Northeast and Midwest Expansion, the Southern Expansion, the Independent sites, and the Peace Corps sites--is profiled separately. An examination of the four components of Figure A.1 shows that all sites worked in partnership with one or more school districts. Nearly all the partner districts were located in urban areas. Paraprofessionals were the primary target pool for the sites in the Northeast and Midwest Expansion and the Southern Expansion. These two clusters also served non-certified teachers, mostly substitutes, some of whom lacked bachelor’s degrees; they also served some emergency-certified teachers. With one exception, the Independent sites focused their recruitment activities largely on emergency-certified teachers employed in underperforming urban schools. Cambridge College, the exception in this cluster, targeted paraprofessionals instead. As expected, the Peace Corps sites recruited from the pool of RPCVs. These recruits were assisted in securing emergency-teaching certificates that enabled them to teach in the partner districts. Nearly all Peace Corps sites required RPCVs to hold a teaching position as a condition for participation in the program.
The overwhelming majority of the programs in three clusters--the Northeast and Midwest Expansion, the Southern Expansion, and the Independent sites--gave preference in the selection
6
process to applicants from underrepresented racial/ethnic groups in the partner districts’ teaching forces. Only three Peace Corps sites gave preference to candidates from racial/ethnic minority groups. Of the 40 sites, only seven targeted males, especially males of color.
The majority of the programs targeted candidates who either already had a strong background in certain subjects/fields or were interested in developing skills in those areas. Eighteen sites gave priority to special education, while 10 sites focused on Bilingual/ESL instruction. Eleven sites targeted math and 10 targeted science. These recruitment and training priorities reflected the areas of greatest teacher shortages in the partner school districts.
In sum, the Pathways to Teaching Careers Program was designed by the DeWitt Wallace-Reader’s Digest Fund in response to the teacher shortages that were already evident in urban schools, and, to a lesser extent, rural schools, during the latter part of the 1980s. Teacher shortages have become even more intense since the Pathways initiative was launched in 1989. The need for new teachers is one of the most important policy issues in the United States today, and will most likely continue as such for some time to come. What has been learned from the Pathways experience has much to contribute to teacher recruitment policy. Before presenting the findings from the evaluation, however, we describe the methods used to collect and analyze the data.
7
SECTION 2: EVALUATION METHODS The evaluation of the Pathways to Teaching Careers Program took place over a six and a half year period beginning in 1994. The evaluation was divided into three components: summative, process and formative. The summative component focused on determining the overall success of the Pathways program in: a) meeting its numerical goal of recruiting nontraditional individuals, including those of racial/ethnic minority background into teacher preparation programs; b) retaining participants through program completion and certification, and ensuring that they worked in targeted districts after completing the program; c) preparing effective teachers; and d) producing teachers who are more likely than their national counterparts to remain in teaching. The process component documented how the programs at the 40 Pathways sites were implemented. This information enabled the evaluators to determine the features of the Pathways model that were most important to its success. 1 The formative component provided timely feedback to individual programs as well as the Fund as to how well programs were progressing toward proposed goals. Another purpose of the formative evaluation was to guide the Fund in designing future teacher recruitment and preparation activities. This report focuses primarily on the summative component of the evaluation as the results of the process component have been published in a separate document, Ahead of the Class: A Handbook for Preparing New Teachers from New Sources. Nevertheless, in Section 4—"Factors Contributing to the Success of the Pathways Program"—we present highlights of the previously published process evaluation findings. Formative evaluation results were submitted on a yearly basis to the Fund to inform its monitoring and decision making functions.
The Summative Evaluation This component was designed to collect data over a six-year period that would answer the following questions: Ø Did the Pathways Program meet its overall recruitment goals? Ø Have Pathways participants remained in the Program through completion and
certification? Once they have completed the Program, do they work in targeted districts? Ø Are Pathways graduates good teachers? Ø Do Pathways graduates remain in teaching longer than the typical novice teacher?
1 In addition to case studies prepared for all programs during the first year of the evaluation, process data were collected via yearly telephone interviews of all programs and coordinating agencies to update implementation data. In order to deepen our understanding of how effective strategies are implemented and can be replicated, case studies of selected programs were prepared that provided in-depth documentation of outstanding features of these programs. Both initial and additional case studies were based on site visits to programs where interviews and focus groups were conducted with participants, program staff, faculty, administrators, and principals.

8
Data Collection
To answer these questions, we collected data (mainly through the use of surveys) from participants, program staff, teaching supervisors, and principals. Performance assessment data (Praxis III) were also collected by evaluation staff. Table 1 below gives the sources of data that were used to answer the evaluation questions.
Table 1. Sources of Survey Data to Answer Evaluation Questions
SURVEYS MAIN EVALUATION QUESTIONS
PPF PPF-FU FESS GES FUS Praxis III
Did the Pathways Program meet its overall recruitment goals? 3 3 Have Pathways participants remained in the Program through completion and certification? Once they have completed the Program, do they work in targeted districts?
3 3
Are Pathways graduates good teachers? 3 3 3 Do Pathways graduates remain in teaching longer than the typical novice teacher? 3
Five surveys were administered each year (see Appendix B for surveys). They were the: Participant Progress Form (PPF)
This survey was completed by program staff for all entering participants during their first year in the program. It collected demographic information, admissions information (including academic background at entry), academic goals, courses taken, support activities utilized, measures of student progress, and student outcomes information. Participant Progress Form—Follow Up (PPF-FU)
This form was filled out in subsequent years by program staff for every participant for whom a PPF had been completed for the first enrollment year. This contained update information on coursetaking, student progress, and student outcomes. Scholar/Fellow Survey
This survey was completed by every participant during their first year in the program. It collected information on family background, academic experiences in K-12, participants' perceptions of their strengths and weaknesses, professional goals, and their views of teaching. Scholar's/Fellow's Teaching Effectiveness: Field Experience Supervisor Survey (FESS)
This form, designed to be filled out by the Pathways participants' student teaching supervisors at the end of the student teaching experience, rates participants' teaching effectiveness in four areas on a scale of 1 to 5, with 5 being the highest rating: a) Organizing content knowledge for student learning; b) creating an environment for student learning; c)
9
teaching for student learning; and d) professionalism. Overall ratings of teaching effectiveness were also collected. Graduate's Teaching Effectiveness: Principal/Building Supervisor Survey (GES)
This survey is identical to the one above with the exception that principals in the schools where Pathways participants had been teaching for two years or more were asked to rate these participants in comparison to other novice teachers in the school. These ratings were collected once for Pathways graduates.
Additional data on teaching effectiveness were collected by evaluators using Praxis III. This performance assessment tool was developed by the Educational Testing Service. It measures performance on skills and competencies that most educators agree good teachers need. Praxis III was administered to a sample of 64 Pathways graduates who were beginning teachers (see Appendix C for a description of the Praxis III performance assessment system).
These yearly surveys were administered according to a schedule. Extensive efforts were made to ensure validity of the data collected as well as to follow up nonrespondents to ensure a good response rate. These efforts are described in greater detail in evaluation reports for Years One through Three of the evaluation. Follow-Up Survey of Pathways Graduates/Completers (FUS)
Beginning in Year Four, we began to collect follow up data on Pathways graduates who had completed the program three or more years earlier to determine their retention in teaching over a three-year period. This data collection instrument, Follow-Up Survey of the Pathways Graduates/Completers (FUS), requested information on the respondents' current employment and, for those who were in education, it collected information on the work setting, whether the respondent was in a classroom teaching position or not, and if not what the respondent's main school assignment was. For those who were not in the education field, the survey collected information on the respondents' main occupational status, whether they had ever worked in education after completing Pathways, for how long, and their main reason(s) for leaving their job in education.
Even though we had collected tracking information from participants, we anticipated that it would be difficult to collect follow up data three years after Scholar/Fellows had graduated from the program. We contracted with Roper Starch International to track those respondents from whom we had not received completed surveys after three rounds of follow up efforts by UI staff.
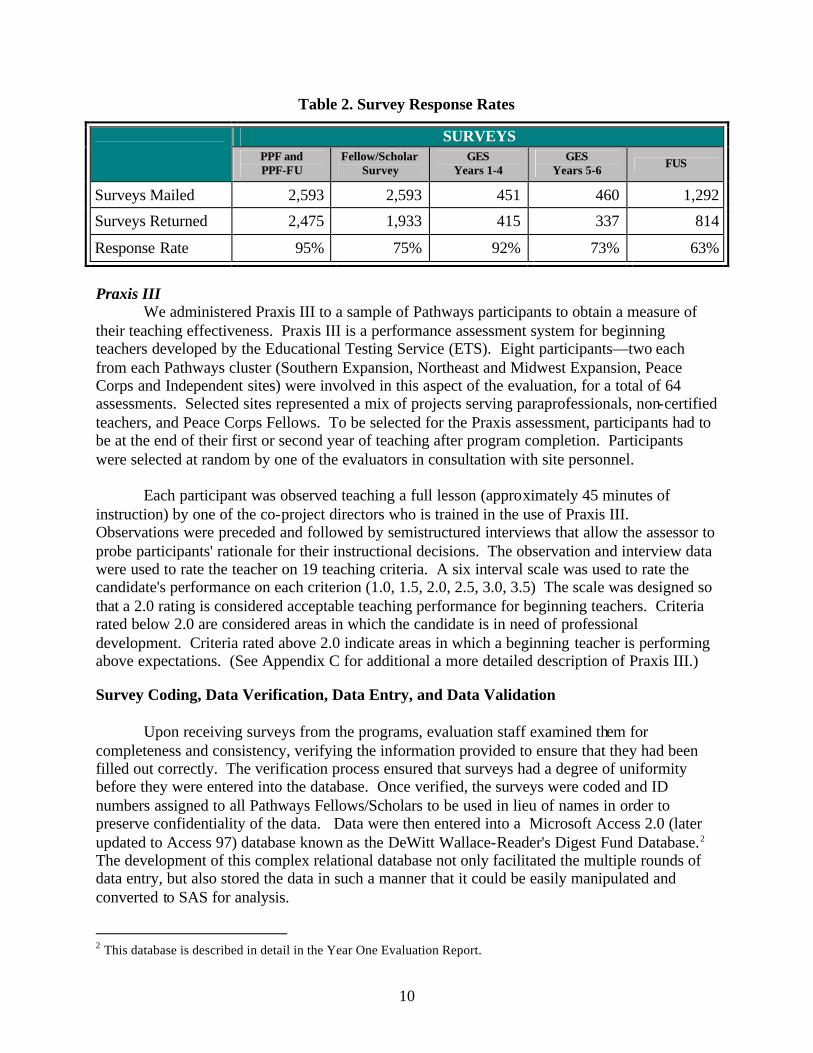
We also received assistance from Roper Starch in obtaining completed Graduate Teaching Effectiveness surveys from nonrespondent principals/supervisors in schools where Pathways graduates were teaching. The combination of repeated follow up efforts on the part of the UI evaluation team and the assistance of Roper Starch, a tracking firm, resulted in our achievement of good response rates for all surveys over the six years of the evaluation. These response rates are shown in Table 2.
10
Table 2. Survey Response Rates
SURVEYS PPF and
PPF-FU Fellow/Scholar
Survey GES
Years 1-4 GES
Years 5-6 FUS
Surveys Mailed 2,593 2,593 451 460 1,292
Surveys Returned 2,475 1,933 415 337 814
Response Rate 95% 75% 92% 73% 63%
Praxis III We administered Praxis III to a sample of Pathways participants to obtain a measure of their teaching effectiveness. Praxis III is a performance assessment system for beginning teachers developed by the Educational Testing Service (ETS). Eight participants—two each from each Pathways cluster (Southern Expansion, Northeast and Midwest Expansion, Peace Corps and Independent sites) were involved in this aspect of the evaluation, for a total of 64 assessments. Selected sites represented a mix of projects serving paraprofessionals, non-certified teachers, and Peace Corps Fellows. To be selected for the Praxis assessment, participants had to be at the end of their first or second year of teaching after program completion. Participants were selected at random by one of the evaluators in consultation with site personnel. Each participant was observed teaching a full lesson (approximately 45 minutes of instruction) by one of the co-project directors who is trained in the use of Praxis III. Observations were preceded and followed by semistructured interviews that allow the assessor to probe participants' rationale for their instructional decisions. The observation and interview data were used to rate the teacher on 19 teaching criteria. A six interval scale was used to rate the candidate's performance on each criterion (1.0, 1.5, 2.0, 2.5, 3.0, 3.5) The scale was designed so that a 2.0 rating is considered acceptable teaching performance for beginning teachers. Criteria rated below 2.0 are considered areas in which the candidate is in need of professional development. Criteria rated above 2.0 indicate areas in which a beginning teacher is performing above expectations. (See Appendix C for additional a more detailed description of Praxis III.)
Survey Coding, Data Verification, Data Entry, and Data Validation Upon receiving surveys from the programs, evaluation staff examined them for completeness and consistency, verifying the information provided to ensure that they had been filled out correctly. The verification process ensured that surveys had a degree of uniformity before they were entered into the database. Once verified, the surveys were coded and ID numbers assigned to all Pathways Fellows/Scholars to be used in lieu of names in order to preserve confidentiality of the data. Data were then entered into a Microsoft Access 2.0 (later updated to Access 97) database known as the DeWitt Wallace-Reader's Digest Fund Database.2 The development of this complex relational database not only facilitated the multiple rounds of data entry, but also stored the data in such a manner that it could be easily manipulated and converted to SAS for analysis.
2 This database is described in detail in the Year One Evaluation Report.
11
One of the strengths of using so many different surveys and sources of information is that the data can be used not only to supplement one another, but also to cross-check one another. At the midpoint of the evaluation (Year Three), we attempted to reconcile the data collected over the three-year period. This process is detailed in our Year Three report and involved comparing the various data sources and bringing them into alignment with one another. Programs were then asked to verify the changes and add information that was missing or incorrect. Thereafter, this process was repeated on a yearly basis.
Analysis and Use of Survey Data Survey data in the DeWitt Wallace-Reader's Digest Fund Database were analyzed using descriptive statistics to produce tables and spreadsheets on evaluation outcomes which were reported to the Fund on an annual basis in the evaluation reports. The Fund disseminated these evaluation results to the coordinating agencies for distribution among the programs. These data were also used by programs and the evaluators in presentations at national conferences, in journal articles, in policy briefings, and by Fund staff for decision making and reporting to the Board of Trustees. Data were also used in briefings to the Department of Education and staffers of the House Committee on Education and the Workforce in connection with the reauthorization of Title II of the Higher Education Act (HEA). For this report, we have aggregated data from the various surveys across a six-year period to answer the main evaluation questions. We have also done tests of significance, confidence intervals and other statistical tests where appropriate. These data are reported in Section 3: Program Outcomes, which follows.
12
SECTION 3: PROGRAM OUTCOMES This section of the report describes the findings of the summative evaluation, which focuses mainly on participant outcomes for the two most comprehensive strands of the Pathways Program that were the subject of our evaluation. We present data to answer the four questions posed by the summative evaluation. 3 Findings are given for the total group of Pathways participants and then disaggregated by participant type served in these two strands: emergency-certified/substitute teachers, paraprofessionals, and Peace Corps Fellows. We organize the findings by participant type rather than by cluster or strand because we feel that such a breakdown is more meaningful and useful in interpreting the effects of the program on the three nontraditional subgroups served by Pathways.
Q. 1: Did the Pathways Program meet its overall recruitment goals? The Pathways Program's numerical recruitment goal was to enroll 2,200 individuals. By the end of the AY 1999-2000, the Program had recruited and served 2,593 participants, thereby exceeding its recruitment goal by 393, or 18 percent. How Effective Was Pathways in Recruiting Nontraditional Individuals, Including Those of Racial/Ethnic Minority Backgrounds?
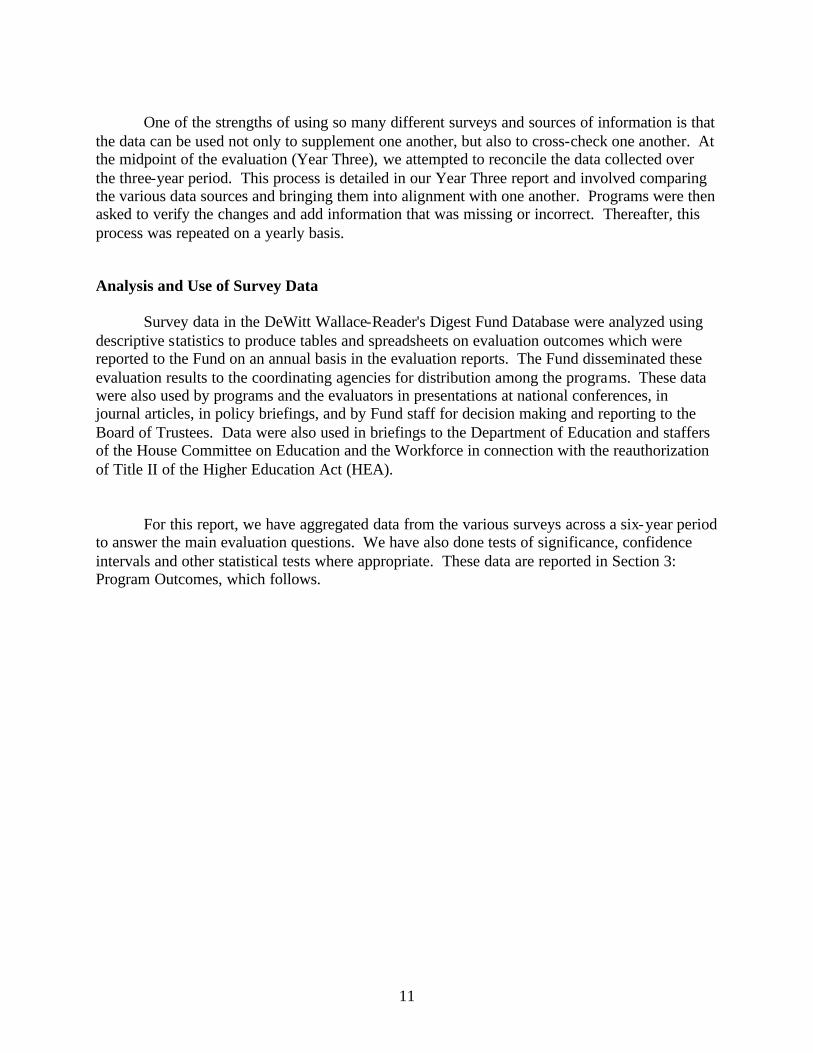
A related recruitment goal was to enroll a diverse group of participants in terms of race/ethnicity, sex, and other demographic characteristics. Figure 1 below gives the race/ethnicity, sex and marital status of all Pathways participants.4
Figure 1. Profile of All Pathways Participants
3 Data sources for tables and graphs are identified throughout the section, although the N for any graph or table may not match the total number of responses shown in Table 2 because of missing data. 4 Data on enrollment and demographic characteristics of participants come from two sources: The Participant Progress Form (PPF) for race/ethnicity data (N=2,475) and the Scholar/Fellow Survey (N=1,933) for sex, age, and marital status.
White30.2%
African American
47.0% Asian1.9%
American Indian0.4%
Other2.6%
Missing6.8%
Hispanic11.1%
Sex Race/Ethnicity Marital Status
Female70.0%
Male30.0%
Single47.0%
Married43.0%
Divorced10.0%
13
A look at the demographic characteristics of newly prepared teachers5 in 1994-93, the last year that these data were available, reveals that while Pathways participants were similar to this group in terms of sex distribution, Pathways Scholars were much more likely to be members of minority groups (63% vs. 18%) and more likely to be older (35 years vs. 28 years) than their national counterparts (Broughman & Rollefson, 2000). While we do not have comparison data at the national level for second language skills, it is likely that the percentage of second- language speakers is higher in the Pathways population than in the national newly prepared teacher pool.
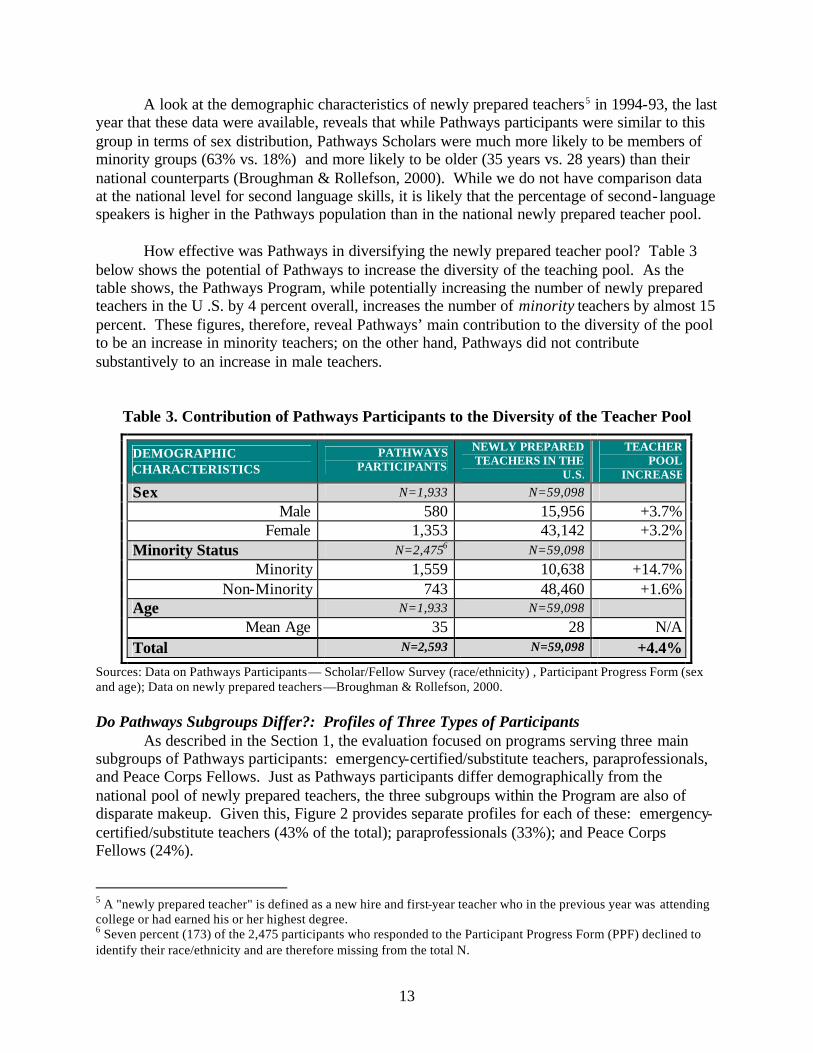
How effective was Pathways in diversifying the newly prepared teacher pool? Table 3 below shows the potential of Pathways to increase the diversity of the teaching pool. As the table shows, the Pathways Program, while potentially increasing the number of newly prepared teachers in the U .S. by 4 percent overall, increases the number of minority teachers by almost 15 percent. These figures, therefore, reveal Pathways’ main contribution to the diversity of the pool to be an increase in minority teachers; on the other hand, Pathways did not contribute substantively to an increase in male teachers.
Table 3. Contribution of Pathways Participants to the Diversity of the Teacher Pool
DEMOGRAPHIC CHARACTERISTICS
PATHWAYS PARTICIPANTS
NEWLY PREPARED TEACHERS IN THE
U.S.
TEACHER POOL
INCREASE
Sex N=1,933 N=59,098 Male 580 15,956 +3.7%
Female 1,353 43,142 +3.2% Minority Status N=2,4756 N=59,098
Minority 1,559 10,638 +14.7% Non-Minority 743 48,460 +1.6%
Age N=1,933 N=59,098 Mean Age 35 28 N/A
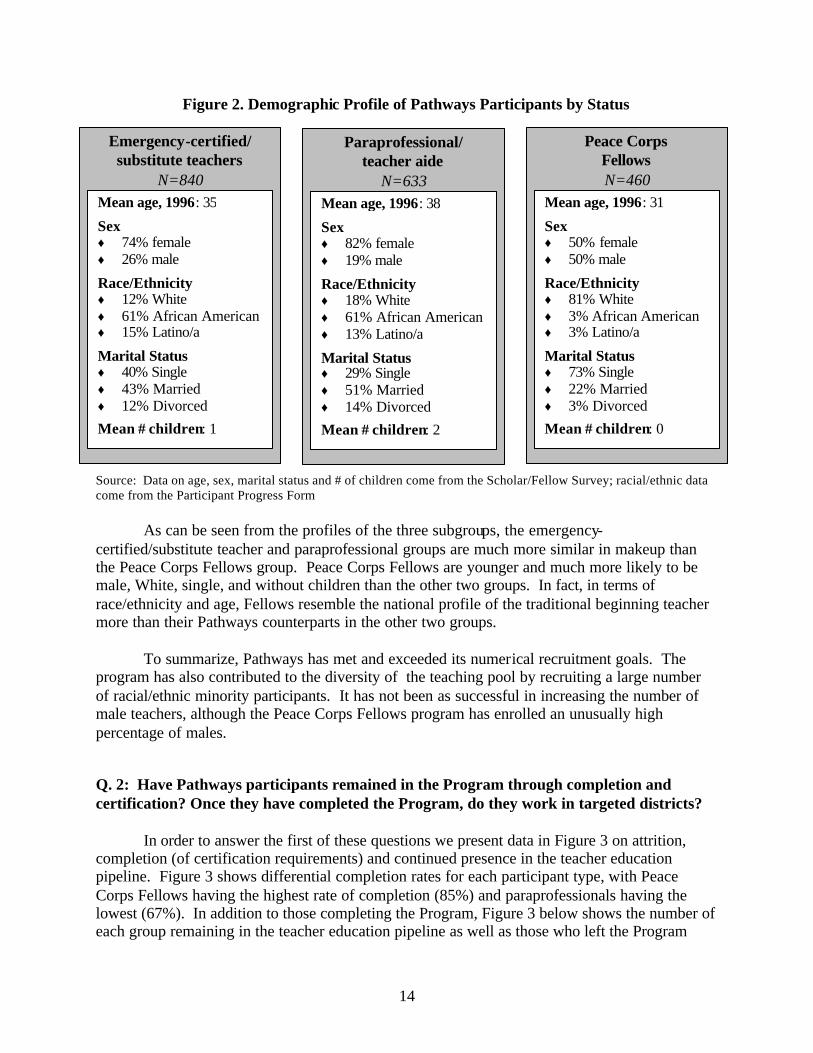
Total N=2,593 N=59,098 +4.4% Sources: Data on Pathways Participants— Scholar/Fellow Survey (race/ethnicity) , Participant Progress Form (sex and age); Data on newly prepared teachers—Broughman & Rollefson, 2000. Do Pathways Subgroups Differ?: Profiles of Three Types of Participants As described in the Section 1, the evaluation focused on programs serving three main subgroups of Pathways participants: emergency-certified/substitute teachers, paraprofessionals, and Peace Corps Fellows. Just as Pathways participants differ demographically from the national pool of newly prepared teachers, the three subgroups within the Program are also of disparate makeup. Given this, Figure 2 provides separate profiles for each of these: emergency-certified/substitute teachers (43% of the total); paraprofessionals (33%); and Peace Corps Fellows (24%).
5 A "newly prepared teacher" is defined as a new hire and first-year teacher who in the previous year was attending college or had earned his or her highest degree. 6 Seven percent (173) of the 2,475 participants who responded to the Participant Progress Form (PPF) declined to identify their race/ethnicity and are therefore missing from the total N.
14
Figure 2. Demographic Profile of Pathways Participants by Status
Source: Data on age, sex, marital status and # of children come from the Scholar/Fellow Survey; racial/ethnic data come from the Participant Progress Form As can be seen from the profiles of the three subgroups, the emergency-certified/substitute teacher and paraprofessional groups are much more similar in makeup than the Peace Corps Fellows group. Peace Corps Fellows are younger and much more likely to be male, White, single, and without children than the other two groups. In fact, in terms of race/ethnicity and age, Fellows resemble the national profile of the traditional beginning teacher more than their Pathways counterparts in the other two groups. To summarize, Pathways has met and exceeded its numerical recruitment goals. The program has also contributed to the diversity of the teaching pool by recruiting a large number of racial/ethnic minority participants. It has not been as successful in increasing the number of male teachers, although the Peace Corps Fellows program has enrolled an unusually high percentage of males.
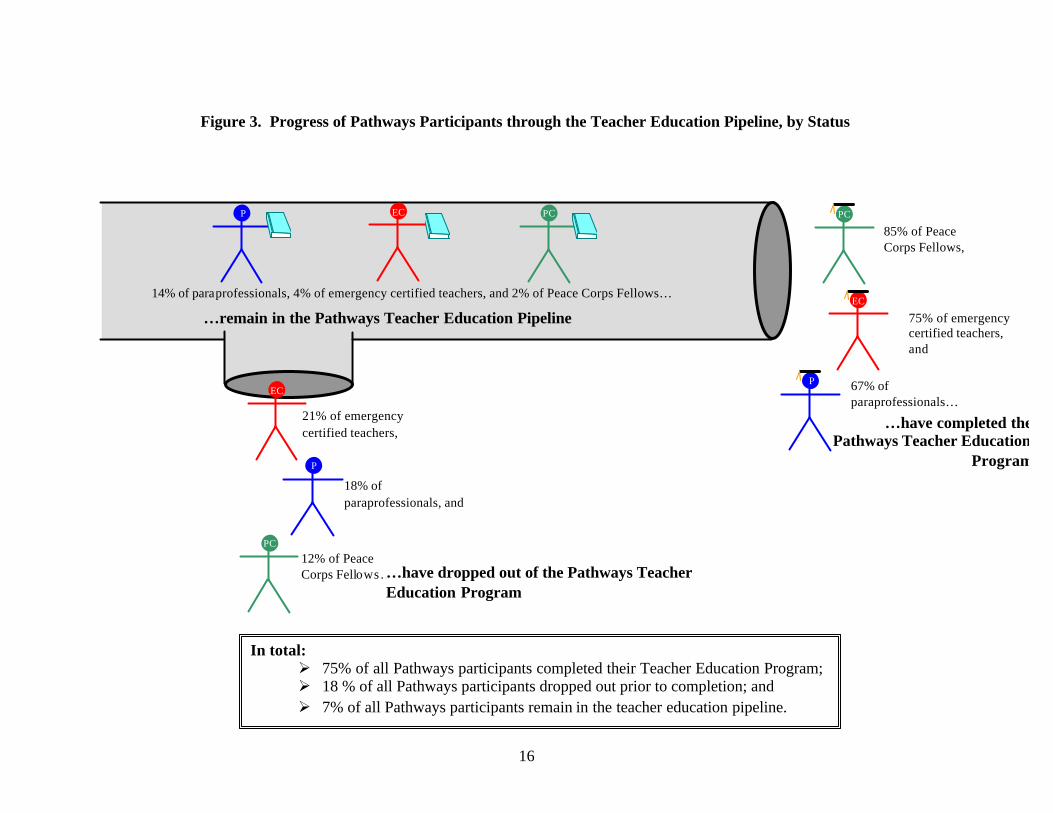
Q. 2: Have Pathways participants remained in the Program through completion and certification? Once they have completed the Program, do they work in targeted districts? In order to answer the first of these questions we present data in Figure 3 on attrition, completion (of certification requirements) and continued presence in the teacher education pipeline. Figure 3 shows differential completion rates for each participant type, with Peace Corps Fellows having the highest rate of completion (85%) and paraprofessionals having the lowest (67%). In addition to those completing the Program, Figure 3 below shows the number of each group remaining in the teacher education pipeline as well as those who left the Program
Emergency-certified/ substitute teachers
N=840 Mean age, 1996: 35
Sex ♦ 74% female ♦ 26% male
Race/Ethnicity ♦ 12% White ♦ 61% African American ♦ 15% Latino/a
Marital Status ♦ 40% Single ♦ 43% Married ♦ 12% Divorced
Mean # children: 1
Paraprofessional/ teacher aide
N=633 Mean age, 1996: 38
Sex ♦ 82% female ♦ 19% male
Race/Ethnicity ♦ 18% White ♦ 61% African American ♦ 13% Latino/a
Marital Status ♦ 29% Single ♦ 51% Married ♦ 14% Divorced
Mean # children: 2
Peace Corps Fellows N=460
Mean age, 1996: 31
Sex ♦ 50% female ♦ 50% male
Race/Ethnicity ♦ 81% White ♦ 3% African American ♦ 3% Latino/a
Marital Status ♦ 73% Single ♦ 22% Married ♦ 3% Divorced
Mean # children: 0
15
before completing the requirements for teacher certification. 7 (We followed up a sample of these Program dropouts and interviewed them regarding their reasons for leaving Pathways. Their responses are reported in Appendix D.) Of the three groups, the emergency-certified/substitutes had the highest attrition rate (21%) and the Peace Corps Fellows had the lowest (12%).
7 Data used in Figure 3 are from the Participant Progress Form (PPF) and Participant Progress Form-Follow Up (PPF-FU)
16
Figure 3. Progress of Pathways Participants through the Teacher Education Pipeline, by Status
14% of paraprofessionals, 4% of emergency certified teachers, and 2% of Peace Corps Fellows…
…remain in the Pathways Teacher Education Pipeline
PC
85% of Peace Corps Fellows,
75% of emergency certified teachers, and
67% of paraprofessionals…
…have completed the Pathways Teacher Education
Program
21% of emergency certified teachers,
18% of paraprofessionals, and
12% of Peace Corps Fellows… …have dropped out of the Pathways Teacher
Education Program
In total: Ø 75% of all Pathways participants completed their Teacher Education Program; Ø 18 % of all Pathways participants dropped out prior to completion; and Ø 7% of all Pathways participants remain in the teacher education pipeline.
P
EC
PC
P
EC
PC P EC
17
The reasons for the differences among the groups in terms of numbers completing and remaining in the pipeline are clear: Peace Corps Fellows and emergency-certified/substitute teachers—who both have at least bachelor's degrees upon entry to Pathways—have much lower numbers in the pipeline simply because they have a shorter program. Their paraprofessional counterparts, however, typically enter Pathways with two years of college and must complete a bachelor's degree plus other certification requirements before exiting Pathways. Members of this group, naturally, have more participants who are still in their Pathways programs.
The completion rates for all groups, as well as for the Pathways completers as a whole,
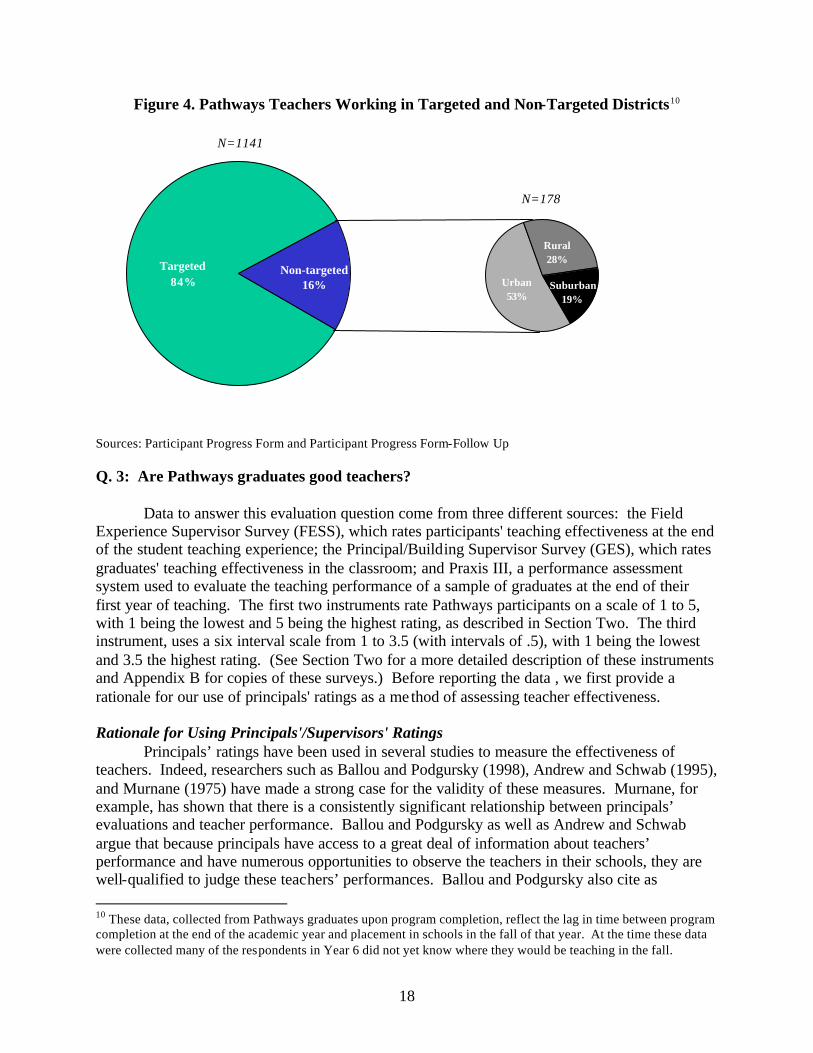
are higher than the national completion rate of 60 percent for traditional undergraduate teacher education students (National Commission on Teaching and America’s Future, 1996).8 A small number of participants (7%) were still working towards completing certification requirements at the time these data were finalized; thus, the completion rate for Pathways Scholars may increase with time. Once They Complete the Program, Do Pathways Graduates Work in Targeted Districts? Most of the Pathways programs required that participants sign a contract promising to work in partner districts—as described in Section 1—after completion of the program. What percentage of Pathways completers fulfilled this promise? Figure 4 below shows that a large proportion of Pathways graduates entered teaching positions in targeted, high-need districts.9 Although not shown in the figure, data disaggregated by status show that paraprofessionals were the most likely of the three groups to teach in targeted districts. Ninety-one percent of paraprofessionals taught in targeted districts, while 82 percent of Peace Corps Fellows and 75 percent of emergency-certified/substitute teachers did so. Of those who did not teach in targeted districts, the majority were employed as teachers in urban or rural school districts.
8 The completion rates of Pathways graduates are not strictly comparable to that of traditional undergraduates for several reasons: whereas the 60 percent completion rate has been calculated for full-time undergraduate teacher education students, Pathways participants attended on a part-time basis and some were enrolled in graduate level programs. Furthermore, the 60 percent completion rate is for completion of a teacher education program, not necessarily completion of all requirements for certification, as in the case of Pathways participants. In the absence of a closer "match," however, we felt that the 60 percent completion rate can provide some sense of the effectiveness of the Program in graduating its participants. 9 Although some of these graduates were already teaching in targeted schools, after completion of Pathways they assumed the status and position of fully certified teachers.
18
Figure 4. Pathways Teachers Working in Targeted and Non-Targeted Districts10
Sources: Participant Progress Form and Participant Progress Form-Follow Up
Q. 3: Are Pathways graduates good teachers? Data to answer this evaluation question come from three different sources: the Field Experience Supervisor Survey (FESS), which rates participants' teaching effectiveness at the end of the student teaching experience; the Principal/Building Supervisor Survey (GES), which rates graduates' teaching effectiveness in the classroom; and Praxis III, a performance assessment system used to evaluate the teaching performance of a sample of graduates at the end of their first year of teaching. The first two instruments rate Pathways participants on a scale of 1 to 5, with 1 being the lowest and 5 being the highest rating, as described in Section Two. The third instrument, uses a six interval scale from 1 to 3.5 (with intervals of .5), with 1 being the lowest and 3.5 the highest rating. (See Section Two for a more detailed description of these instruments and Appendix B for copies of these surveys.) Before reporting the data , we first provide a rationale for our use of principals' ratings as a me thod of assessing teacher effectiveness. Rationale for Using Principals'/Supervisors' Ratings Principals’ ratings have been used in several studies to measure the effectiveness of teachers. Indeed, researchers such as Ballou and Podgursky (1998), Andrew and Schwab (1995), and Murnane (1975) have made a strong case for the validity of these measures. Murnane, for example, has shown that there is a consistently significant relationship between principals’ evaluations and teacher performance. Ballou and Podgursky as well as Andrew and Schwab argue that because principals have access to a great deal of information about teachers’ performance and have numerous opportunities to observe the teachers in their schools, they are well-qualified to judge these teachers’ performances. Ballou and Podgursky also cite as 10 These data, collected from Pathways graduates upon program completion, reflect the lag in time between program completion at the end of the academic year and placement in schools in the fall of that year. At the time these data were collected many of the respondents in Year 6 did not yet know where they would be teaching in the fall.
Targeted84%
Non-targeted16% Urban
53%
Rural28%
Suburban19%
N=1141
N=178

19
evidence the fact that ratings assigned by principals to teachers in the NELS-88 database are significantly related to test scores of their students.
In view of these convincing arguments, we chose this method for assessing the effectiveness of Pathways teachers. Although we considered linking student achievement data to teacher performance as an option, we rejected this measure as being beyond the scope of the evaluation in terms of feasibility, cost and time. To guide the assessment process, we asked principals to rate Pathways teachers in comparison to other beginning, or novice, teachers in the school and provided a detailed instrument for determining the ratings. For the last two years of the evaluation (when about half of the Pathways teachers received ratings), we asked the principals to provide an actual overall rating for the typical novice teacher in their schools to provide a standard against which to compare their rating of the Pathways teacher. Field Experience Supervisor Ratings Table 4 shows the overall results of the Field Experience Supervisor ratings as well as ratings for each of the three groups of Pathways participants. Designed to be completed by the participants' field supervisor (usually a faculty member who supervised the student teaching experience), these instruments were developed to capture the Scholar/Fellow's effectiveness in four main areas of expertise in teaching towards the end of preservice preparation: a) organizing content knowledge for student learning; b) creating an environment for student learning; c) teaching for student learning; and d) professionalism. Each of these areas was broken down into several subareas, and ratings were assigned to each of these subareas (see Appendix B). An overall effectiveness rating was also collected via this survey. Coefficients of variation were also calculated for each of the ratings (see Appendix E) to determine the consistency of ratings across individuals.
Table 4. Field Supervisor Ratings in Main Teaching Areas, by Status
EMERGENCY CERTIFIED/SUBSTITUTE
PARAPROFESSIONAL /TEACHER AIDE
PEACE CORPS FELLOWS TOTAL RATING CATEGORIES
N=575 N=385 N=398 N=1358 Organizing content knowledge for student learning 4.11 4.32 4.32 4.23
Creating an environment for student learning 4.37 4.49 4.43 4.42
Teaching for student learning 4.12 4.32 4.33 4.24
Professionalism 4.32 4.42 4.45 4.39
Overall Assessment of Teacher Effectiveness 4.06 4.13 4.23 4.13
Source: FESS Scale: 1 to 5 with 1=lowest and 5=highest As can be seen from the table, no total rating was lower than 4.13. When ratings are disaggregated by subgroup, participants in the emergency-certified/substitute subgroup scored the lowest in all areas, while paraprofessionals and Peace Corps Fellows had roughly similar
20
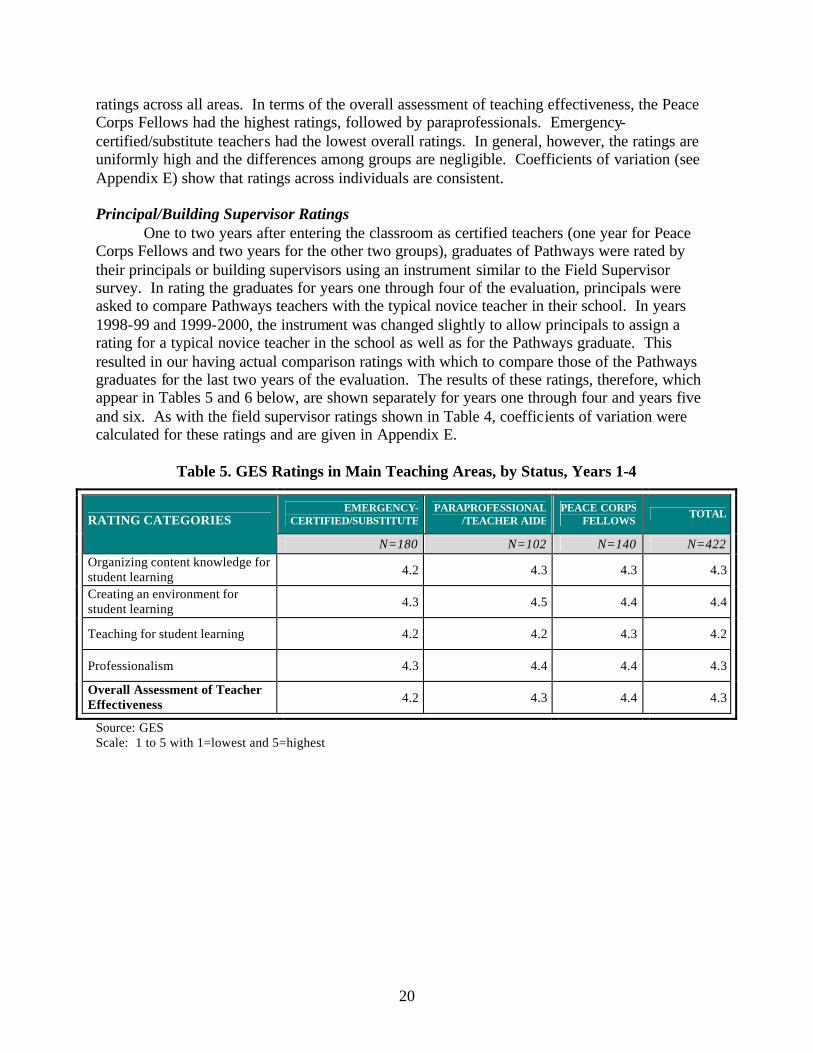
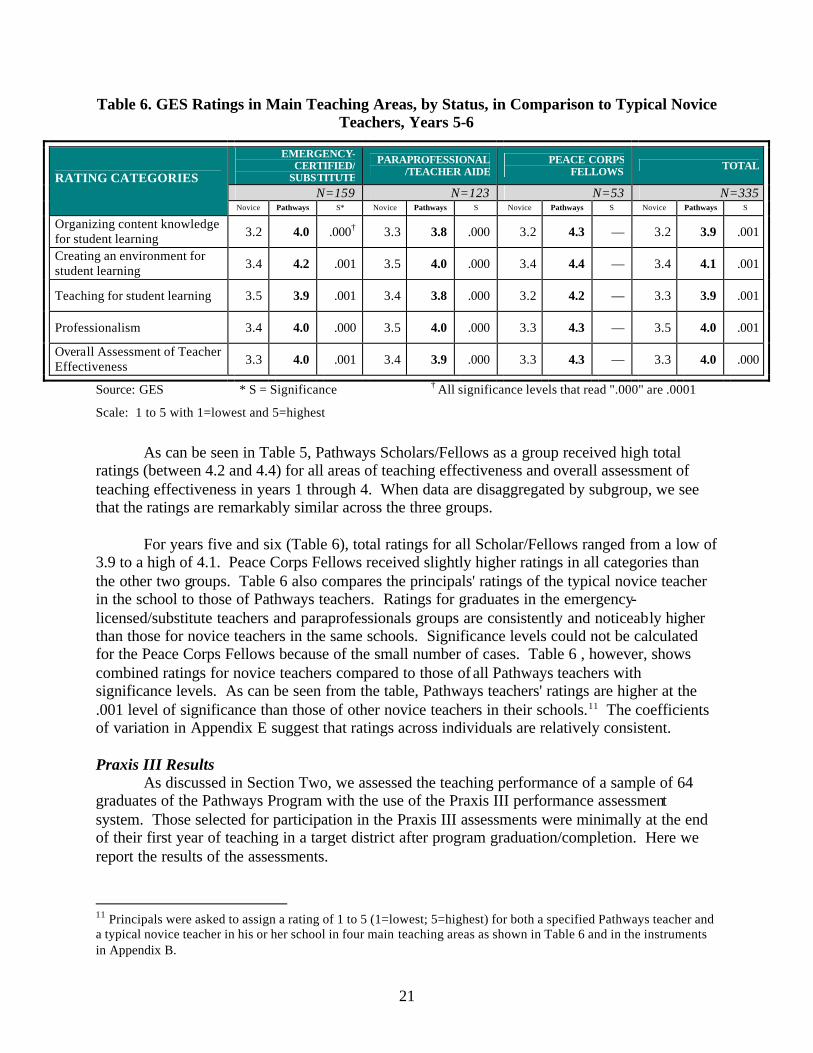
ratings across all areas. In terms of the overall assessment of teaching effectiveness, the Peace Corps Fellows had the highest ratings, followed by paraprofessionals. Emergency-certified/substitute teachers had the lowest overall ratings. In general, however, the ratings are uniformly high and the differences among groups are negligible. Coefficients of variation (see Appendix E) show that ratings across individuals are consistent. Principal/Building Supervisor Ratings One to two years after entering the classroom as certified teachers (one year for Peace Corps Fellows and two years for the other two groups), graduates of Pathways were rated by their principals or building supervisors using an instrument similar to the Field Supervisor survey. In rating the graduates for years one through four of the evaluation, principals were asked to compare Pathways teachers with the typical novice teacher in their school. In years 1998-99 and 1999-2000, the instrument was changed slightly to allow principals to assign a rating for a typical novice teacher in the school as well as for the Pathways graduate. This resulted in our having actual comparison ratings with which to compare those of the Pathways graduates for the last two years of the evaluation. The results of these ratings, therefore, which appear in Tables 5 and 6 below, are shown separately for years one through four and years five and six. As with the field supervisor ratings shown in Table 4, coefficients of variation were calculated for these ratings and are given in Appendix E.
Table 5. GES Ratings in Main Teaching Areas, by Status, Years 1-4
EMERGENCY-CERTIFIED/SUBSTITUTE
PARAPROFESSIONAL /TEACHER AIDE
PEACE CORPS FELLOWS
TOTAL RATING CATEGORIES
N=180 N=102 N=140 N=422 Organizing content knowledge for student learning 4.2 4.3 4.3 4.3
Creating an environment for student learning 4.3 4.5 4.4 4.4
Teaching for student learning 4.2 4.2 4.3 4.2
Professionalism 4.3 4.4 4.4 4.3
Overall Assessment of Teacher Effectiveness 4.2 4.3 4.4 4.3
Source: GES Scale: 1 to 5 with 1=lowest and 5=highest
21
Table 6. GES Ratings in Main Teaching Areas, by Status, in Comparison to Typical Novice Teachers, Years 5-6
EMERGENCY-CERTIFIED/
SUBSTITUTE
PARAPROFESSIONAL /TEACHER AIDE
PEACE CORPS FELLOWS TOTAL
N=159 N=123 N=53 N=335 RATING CATEGORIES
Novice Pathways S* Novice Pathways S Novice Pathways S Novice Pathways S
Organizing content knowledge for student learning 3.2 4.0 .000† 3.3 3.8 .000 3.2 4.3 — 3.2 3.9 .001
Creating an environment for student learning 3.4 4.2 .001 3.5 4.0 .000 3.4 4.4 — 3.4 4.1 .001
Teaching for student learning 3.5 3.9 .001 3.4 3.8 .000 3.2 4.2 — 3.3 3.9 .001
Professionalism 3.4 4.0 .000 3.5 4.0 .000 3.3 4.3 — 3.5 4.0 .001
Overall Assessment of Teacher Effectiveness 3.3 4.0 .001 3.4 3.9 .000 3.3 4.3 — 3.3 4.0 .000
Source: GES * S = Significance † All significance levels that read ".000" are .0001
Scale: 1 to 5 with 1=lowest and 5=highest
As can be seen in Table 5, Pathways Scholars/Fellows as a group received high total ratings (between 4.2 and 4.4) for all areas of teaching effectiveness and overall assessment of teaching effectiveness in years 1 through 4. When data are disaggregated by subgroup, we see that the ratings are remarkably similar across the three groups.
For years five and six (Table 6), total ratings for all Scholar/Fellows ranged from a low of 3.9 to a high of 4.1. Peace Corps Fellows received slightly higher ratings in all categories than the other two groups. Table 6 also compares the principals' ratings of the typical novice teacher in the school to those of Pathways teachers. Ratings for graduates in the emergency-licensed/substitute teachers and paraprofessionals groups are consistently and noticeably higher than those for novice teachers in the same schools. Significance levels could not be calculated for the Peace Corps Fellows because of the small number of cases. Table 6 , however, shows combined ratings for novice teachers compared to those of all Pathways teachers with significance levels. As can be seen from the table, Pathways teachers' ratings are higher at the .001 level of significance than those of other novice teachers in their schools.11 The coefficients of variation in Appendix E suggest that ratings across individuals are relatively consistent. Praxis III Results
As discussed in Section Two, we assessed the teaching performance of a sample of 64 graduates of the Pathways Program with the use of the Praxis III performance assessment system. Those selected for participation in the Praxis III assessments were minimally at the end of their first year of teaching in a target district after program graduation/completion. Here we report the results of the assessments.
11 Principals were asked to assign a rating of 1 to 5 (1=lowest; 5=highest) for both a specified Pathways teacher and a typical novice teacher in his or her school in four main teaching areas as shown in Table 6 and in the instruments in Appendix B.

22
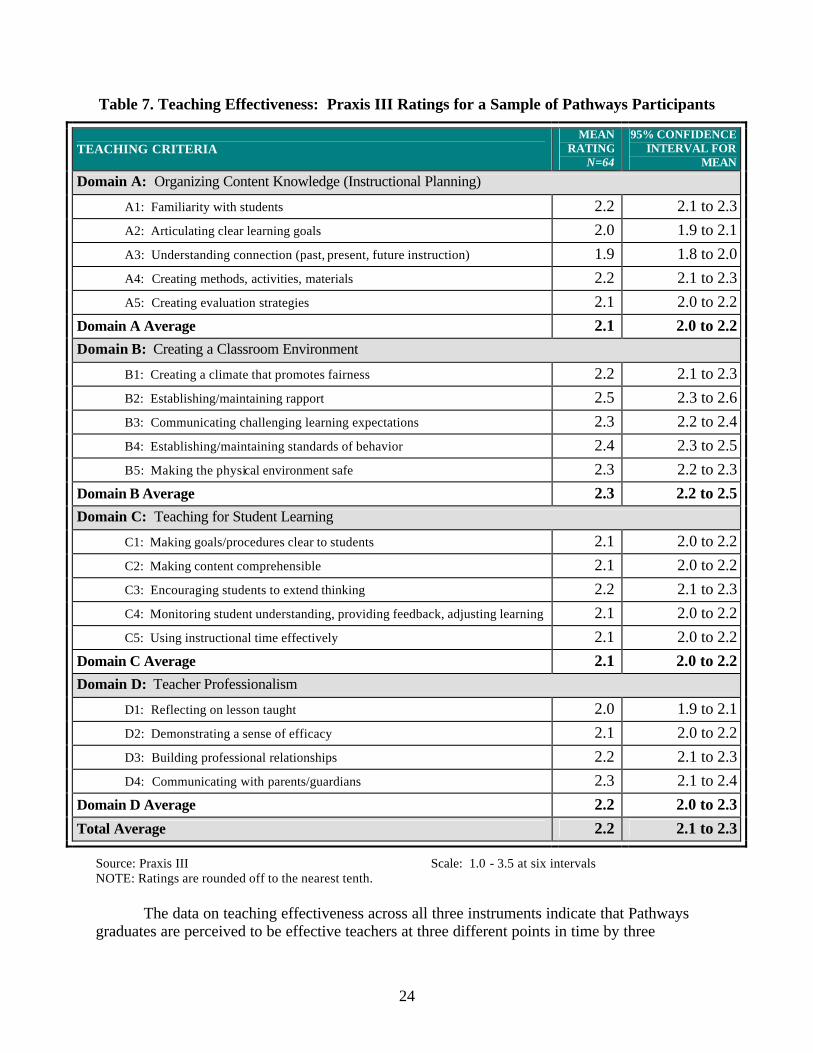
Table 7 summarizes the Praxis III findings. As shown, the overall average rating for all 64 teachers was 2.2, a score above the 2.0 rating expected of beginning teachers (see Section Two for a detailed explanation of the rating system). A closer look at the table reveals that participants also exceeded the 2.0 average score in each of the four domains of teaching. This suggests that, overall, the teaching performance of graduates/ completers of the Pathways Program, as measured by Praxis III, surpasses what can be expected of the typical novice teacher.
Domain A: Organizing content knowledge (instructional planning). In terms of instructional planning (Domain A), Pathways teachers displayed a high level of familiarity with their students’ background knowledge and experiences, as indicated by the 2.2 rating for criterion A1. Not only did the participants know their students well, but they also were adept at using a variety of procedures to learn about their students and they understood why this knowledge is needed in teaching. This is not surprising given the similarity in racial/ethnic backgrounds between the majority of the teachers assessed and the students in the observed classes. Additionally, many of the participating teachers were reported to live in the communities in which the children live. Pathways Scholars also outperform the typical novice teacher in creating methods, activities, and materials (A3), posting a 2.2 rating. The participants were weakest in their understanding of the connections between past, present and future instruction, as gleaned from the 1.9 rating for criterion A3. This was the only criterion in the set of 19 that fell below the 2.0 rating expected of beginning teachers. This suggests that the Scholars may benefit from additional assistance in understanding the sequential flow of instruction.
Domain B: Creating a classroom environment. Table 7 also shows that compared to the typical beginning teacher, Pathways participants excel in their ability to create a classroom environment that is conducive to learning (Domain B). This is evident from the 2.3 average rating for the domain. Particularly noteworthy is the 2.5 rating for establishing and maintaining rapport with students (B2). Research shows that this teaching skill correlates highly with student learning, especially for racial/ethnic minority students. In this domain, the Scholars also received high marks ( a 2.4 rating) for establishing and maintaining standards of behavior (B4). Similarly, they received high scores for communicating challenging learning expectations (B3) and for making the physical classroom environment safe (B5) (with 2.3 ratings for both). As was explained above, the criteria in this domain constitute the social and emotional components of learning, which are prerequisites to academic achievement. These findings suggest that the students taught by Pathways teachers are likely to feel safe, both emotionally and physically, in their classrooms. They are also likely to trust their teachers and to conform to classroom rules. Without this sense of safety and order, academic learning is not likely to occur.
Domain C: Teaching for student learning. Our data suggest that Pathways participants perform slightly better than the average novice teacher in helping students to connect with the content they are taught (Domain C). None of the criteria in this domain fell below 2.1, a solid rating for a novice. As a group, the participants performed best in encouraging students to extend their thinking. This is evident by the 2.2 rating for criterion C3. For example, participants were observed asking open-ended questions, allowing students adequate time to think about their answers to questions, and assigning tasks in which there was more than one right answer.
23
Domain D: Teacher professionalism. Completers of the Pathways Program also compare
favorably with the average beginning teacher in terms of professionalism (Domain D), as the 2.2 overall rating suggests. The teachers were especially effective in building professional relationships (with a 2.2 average rating for D3) and in communicating with parents and/or guardians regarding student learning (with a 2.3 average rating for D4). This last finding comes as no surprise since many of the participants were from the communities in which their students lived. They were also better able to draw on their linguistic and cultural resources to communicate with the students’ parents/guardians in relevant ways.
To summarize, these data show that completers of the Pathways Program perform better in their classrooms and schools than the average beginning teacher. They especially excel in all the criteria comprising Domain B (Creating a classroom environment). They also outperform the typical novice teacher in their familiarity with students; in creating methods, activities, and materials; in encouraging students to extend their thinking; in building professional relationships; and in communicating with parents/guardians. The data also suggest that Pathways completers may need additional support to better understand how any given lessons build on past instruction while simultaneously paving the way for future learning.
24
Table 7. Teaching Effectiveness: Praxis III Ratings for a Sample of Pathways Participants
TEACHING CRITERIA MEAN
RATING N=64
95% CONFIDENCE INTERVAL FOR
MEAN
Domain A: Organizing Content Knowledge (Instructional Planning)
A1: Familiarity with students 2.2 2.1 to 2.3 A2: Articulating clear learning goals 2.0 1.9 to 2.1 A3: Understanding connection (past, present, future instruction) 1.9 1.8 to 2.0 A4: Creating methods, activities, materials 2.2 2.1 to 2.3 A5: Creating evaluation strategies 2.1 2.0 to 2.2
Domain A Average 2.1 2.0 to 2.2 Domain B: Creating a Classroom Environment
B1: Creating a climate that promotes fairness 2.2 2.1 to 2.3 B2: Establishing/maintaining rapport 2.5 2.3 to 2.6 B3: Communicating challenging learning expectations 2.3 2.2 to 2.4 B4: Establishing/maintaining standards of behavior 2.4 2.3 to 2.5 B5: Making the physical environment safe 2.3 2.2 to 2.3
Domain B Average 2.3 2.2 to 2.5 Domain C: Teaching for Student Learning
C1: Making goals/procedures clear to students 2.1 2.0 to 2.2 C2: Making content comprehensible 2.1 2.0 to 2.2 C3: Encouraging students to extend thinking 2.2 2.1 to 2.3 C4: Monitoring student understanding, providing feedback, adjusting learning 2.1 2.0 to 2.2 C5: Using instructional time effectively 2.1 2.0 to 2.2
Domain C Average 2.1 2.0 to 2.2 Domain D: Teacher Professionalism
D1: Reflecting on lesson taught 2.0 1.9 to 2.1 D2: Demonstrating a sense of efficacy 2.1 2.0 to 2.2 D3: Building professional relationships 2.2 2.1 to 2.3 D4: Communicating with parents/guardians 2.3 2.1 to 2.4
Domain D Average 2.2 2.0 to 2.3 Total Average 2.2 2.1 to 2.3
Source: Praxis III Scale: 1.0 - 3.5 at six intervals NOTE: Ratings are rounded off to the nearest tenth. The data on teaching effectiveness across all three instruments indicate that Pathways graduates are perceived to be effective teachers at three different points in time by three
25
independent assessors: field experience supervisors, principals, and an evaluator with training and experience in administering the Praxis III performance assessment. In addition, these data support one another through the consistency of their ratings. Both Praxis III data and GES ratings for Years 5 and 6 provide data against which to compare the teaching performance of Pathways teachers with that of typical novice teachers. In both years, Pathways teachers received significantly higher ratings than their typical counterparts.
Q. 4: Have Pathways graduates12 been retained in the teaching profession? Because the attrition of teachers from the profession is a grave problem that contributes considerably to the teacher shortage (Ingersoll, 2000) we wished to determine whether Pathways teachers were retained in teaching at a greater rate than typical beginning teachers. In order to ascertain whether this was the case, we collected follow up data on Pathways graduates to determine what proportion was in teaching at least three years after program completion. These data were collected in years five and six via the Follow-Up Survey of Pathways Graduates/ Completers (FUS). All Pathways graduates who had completed requirements for certification three or more years before the follow-up questionnaire was administered (a total of 1,292 individuals) were surveyed, with an overall response rate of 63 percent. All data reported in this subsection are from the FUS and provide a picture of the occupational status of Pathways graduates three or more years after completion of the Program. First, we report on those Pathways graduates who have remained in education, including those in teaching; then we describe the occupational status of those who were not in education at the time of the follow-up survey. Finally, for Pathways graduates who entered and left teaching, we give their reasons for leaving the profession. What Are Pathways Graduates Doing Three or More Years After Completion?
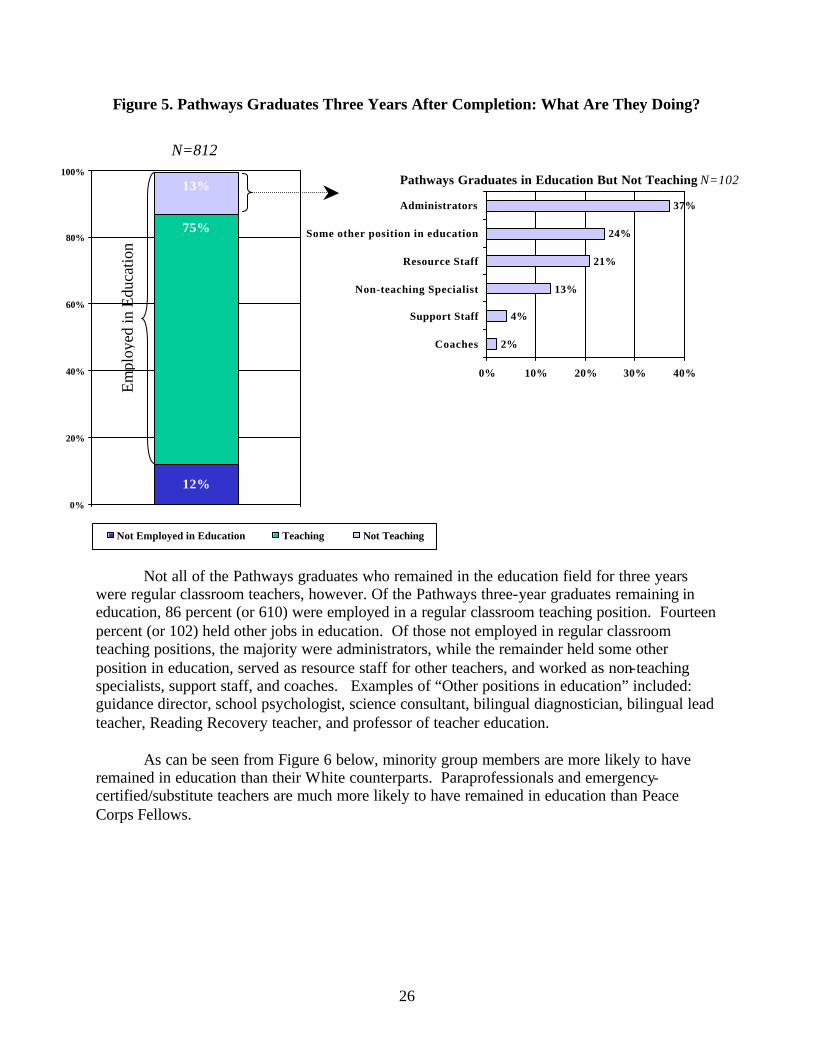
As can be seen from Figure 5, 88 percent of Pathways (or 712) respondents were employed in a full- time job in education three or more years after completion, while 12 percent (or 100) were no longer involved in education.
12 Defined as participants who completed all requirements for certification.
26
Figure 5. Pathways Graduates Three Years After Completion: What Are They Doing?
Not all of the Pathways graduates who remained in the education field for three years were regular classroom teachers, however. Of the Pathways three-year graduates remaining in education, 86 percent (or 610) were employed in a regular classroom teaching position. Fourteen percent (or 102) held other jobs in education. Of those not employed in regular classroom teaching positions, the majority were administrators, while the remainder held some other position in education, served as resource staff for other teachers, and worked as non-teaching specialists, support staff, and coaches. Examples of “Other positions in education” included: guidance director, school psychologist, science consultant, bilingual diagnostician, bilingual lead teacher, Reading Recovery teacher, and professor of teacher education.
As can be seen from Figure 6 below, minority group members are more likely to have remained in education than their White counterparts. Paraprofessionals and emergency-certified/substitute teachers are much more likely to have remained in education than Peace Corps Fellows.
12%
75%
13%
0%
20%
40%
60%
80%
100%
Not Employed in Education Teaching Not Teaching
2%
4%
13%
21%
24%
37%
0% 10% 20% 30% 40%
Coaches
Support Staff
Non-teaching Specialist
Resource Staff
Some other position in education
Administrators
Pathways Graduates in Education But Not Teaching N=102
Empl
oyed
in E
duca
tion
N=812
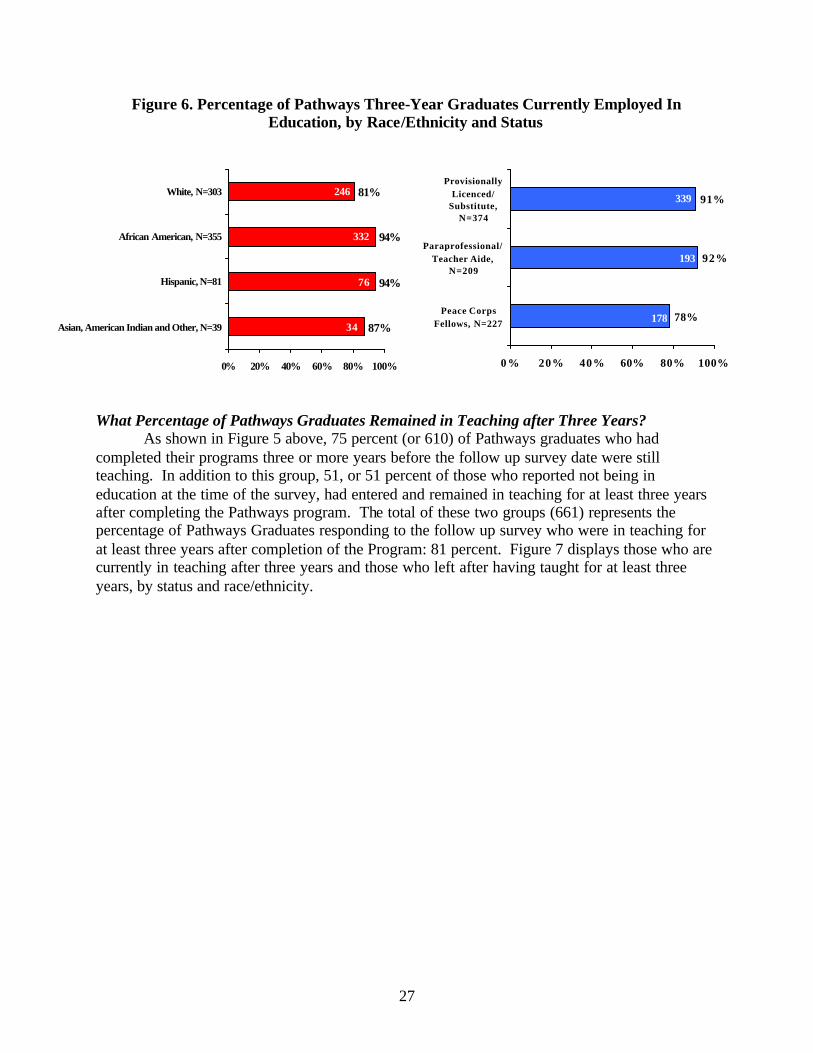
27
Figure 6. Percentage of Pathways Three-Year Graduates Currently Employed In Education, by Race/Ethnicity and Status
What Percentage of Pathways Graduates Remained in Teaching after Three Years? As shown in Figure 5 above, 75 percent (or 610) of Pathways graduates who had completed their programs three or more years before the follow up survey date were still teaching. In addition to this group, 51, or 51 percent of those who reported not being in education at the time of the survey, had entered and remained in teaching for at least three years after completing the Pathways program. The total of these two groups (661) represents the percentage of Pathways Graduates responding to the follow up survey who were in teaching for at least three years after completion of the Program: 81 percent. Figure 7 displays those who are currently in teaching after three years and those who left after having taught for at least three years, by status and race/ethnicity.
87%
81%
94%
94%
0% 20% 40% 60% 80% 100%
Asian, American Indian and Other, N=39
Hispanic, N=81
African American, N=355
White, N=303
78%
92%
91%
0 % 20% 40% 60% 80% 100%
Peace CorpsFellows, N=227
Paraprofessional/Teacher Aide,
N=209
ProvisionallyLicenced/
Substitute,N=374
332
246
76
339
193
17834
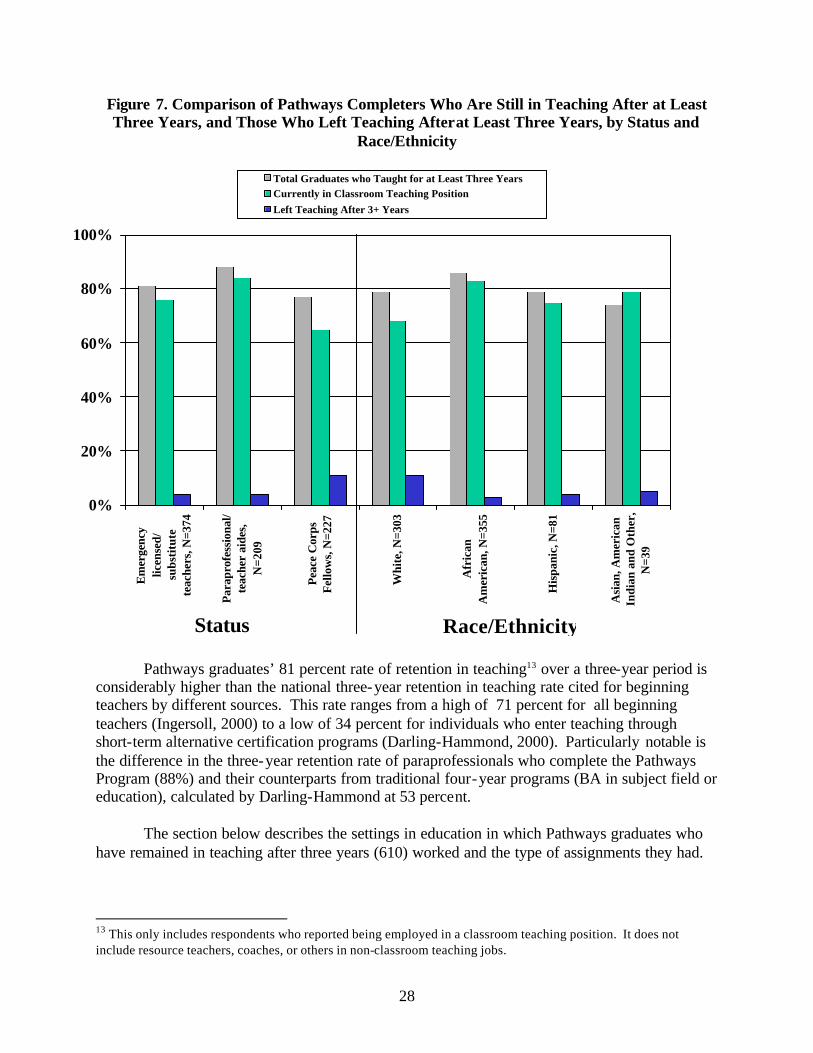
28
Figure 7. Comparison of Pathways Completers Who Are Still in Teaching After at Least Three Years, and Those Who Left Teaching After at Least Three Years, by Status and
Race/Ethnicity
Pathways graduates’ 81 percent rate of retention in teaching13 over a three-year period is
considerably higher than the national three-year retention in teaching rate cited for beginning teachers by different sources. This rate ranges from a high of 71 percent for all beginning teachers (Ingersoll, 2000) to a low of 34 percent for individuals who enter teaching through short-term alternative certification programs (Darling-Hammond, 2000). Particularly notable is the difference in the three-year retention rate of paraprofessionals who complete the Pathways Program (88%) and their counterparts from traditional four-year programs (BA in subject field or education), calculated by Darling-Hammond at 53 percent.
The section below describes the settings in education in which Pathways graduates who have remained in teaching after three years (610) worked and the type of assignments they had.
13 This only includes respondents who reported being employed in a classroom teaching position. It does not include resource teachers, coaches, or others in non-classroom teaching jobs.
0%
20%
40%
60%
80%
100%
Em
erge
ncy
licen
sed/
subs
titu
tete
ache
rs, N
=374
Para
prof
essi
onal
/te
ache
r ai
des,
N=2
09
Peac
e C
orps
Fel
low
s, N
=227
Whi
te, N
=303
Afr
ican
Am
eric
an, N
=355
His
pani
c, N
=81
Asi
an, A
mer
ican
Indi
an a
nd O
ther
,N
=39
Total Graduates who Taught for at Least Three YearsCurrently in Classroom Teaching PositionLeft Teaching After 3+ Years
Status Race/Ethnicity
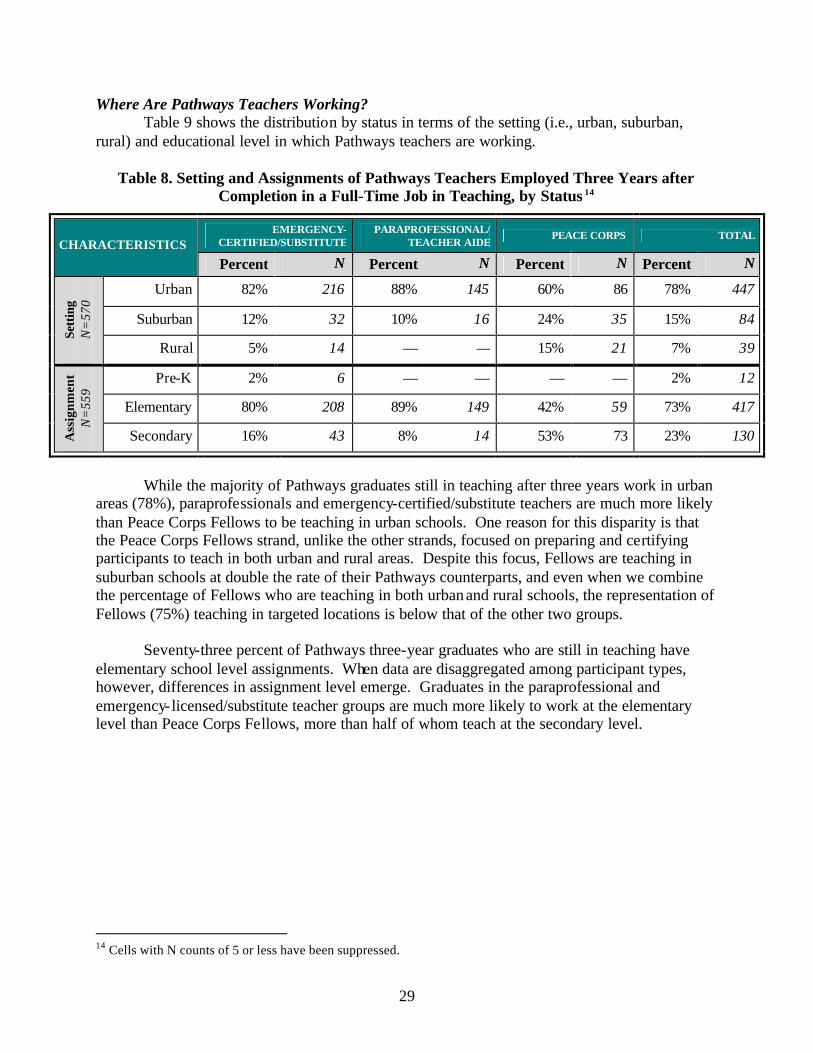
29
Where Are Pathways Teachers Working? Table 9 shows the distribution by status in terms of the setting (i.e., urban, suburban, rural) and educational level in which Pathways teachers are working.
Table 8. Setting and Assignments of Pathways Teachers Employed Three Years after Completion in a Full-Time Job in Teaching, by Status 14
EMERGENCY-CERTIFIED/SUBSTITUTE
PARAPROFESSIONAL/ TEACHER AIDE
PEACE CORPS TOTAL CHARACTERISTICS
Percent N Percent N Percent N Percent N
Urban 82% 216 88% 145 60% 86 78% 447
Suburban 12% 32 10% 16 24% 35 15% 84
Sett
ing
N=
570
Rural 5% 14 — — 15% 21 7% 39
Pre-K 2% 6 — — — — 2% 12
Elementary 80% 208 89% 149 42% 59 73% 417
Ass
ignm
ent
N=
559
Secondary 16% 43 8% 14 53% 73 23% 130
While the majority of Pathways graduates still in teaching after three years work in urban
areas (78%), paraprofessionals and emergency-certified/substitute teachers are much more likely than Peace Corps Fellows to be teaching in urban schools. One reason for this disparity is that the Peace Corps Fellows strand, unlike the other strands, focused on preparing and certifying participants to teach in both urban and rural areas. Despite this focus, Fellows are teaching in suburban schools at double the rate of their Pathways counterparts, and even when we combine the percentage of Fellows who are teaching in both urban and rural schools, the representation of Fellows (75%) teaching in targeted locations is below that of the other two groups. Seventy-three percent of Pathways three-year graduates who are still in teaching have elementary school level assignments. When data are disaggregated among participant types, however, differences in assignment level emerge. Graduates in the paraprofessional and emergency- licensed/substitute teacher groups are much more likely to work at the elementary level than Peace Corps Fellows, more than half of whom teach at the secondary level.
14 Cells with N counts of 5 or less have been suppressed.
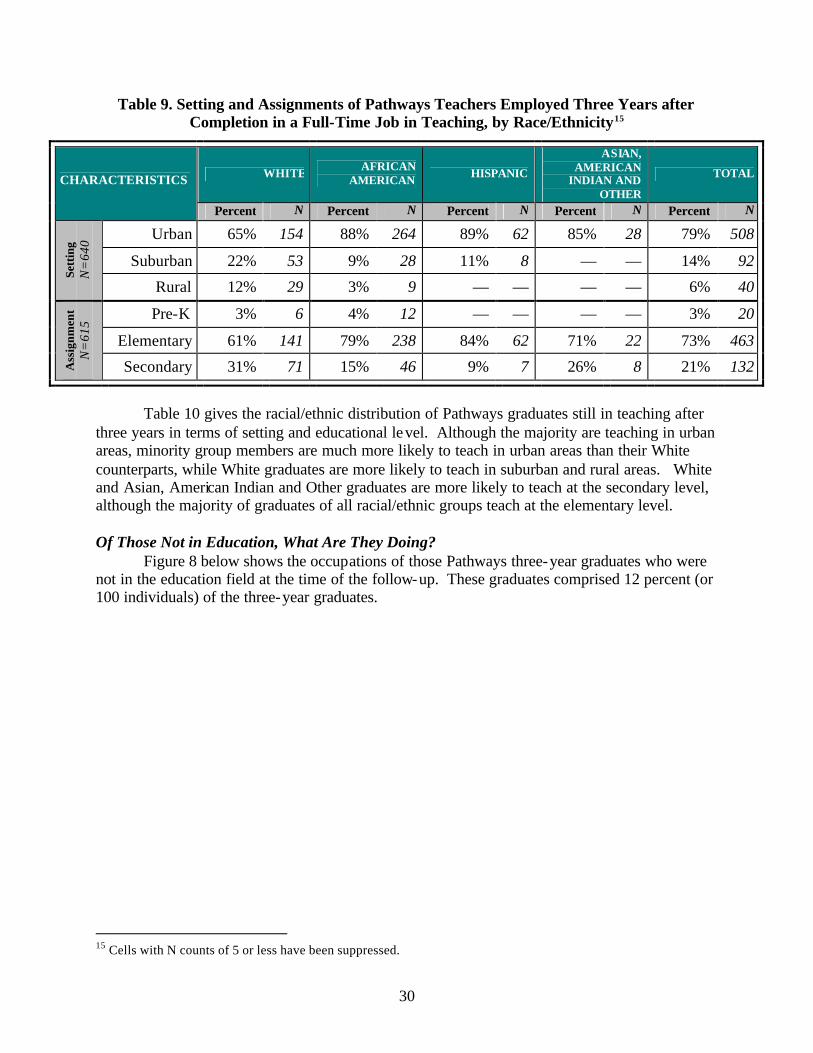
30
Table 9. Setting and Assignments of Pathways Teachers Employed Three Years after Completion in a Full-Time Job in Teaching, by Race/Ethnicity15
WHITE AFRICAN AMERICAN HISPANIC
ASIAN, AMERICAN
INDIAN AND OTHER
TOTAL CHARACTERISTICS
Percent N Percent N Percent N Percent N Percent N
Urban 65% 154 88% 264 89% 62 85% 28 79% 508
Suburban 22% 53 9% 28 11% 8 — — 14% 92
Sett
ing
N=
640
Rural 12% 29 3% 9 — — — — 6% 40
Pre-K 3% 6 4% 12 — — — — 3% 20
Elementary 61% 141 79% 238 84% 62 71% 22 73% 463
Ass
ignm
ent
N=
615
Secondary 31% 71 15% 46 9% 7 26% 8 21% 132
Table 10 gives the racial/ethnic distribution of Pathways graduates still in teaching after three years in terms of setting and educational level. Although the majority are teaching in urban areas, minority group members are much more likely to teach in urban areas than their White counterparts, while White graduates are more likely to teach in suburban and rural areas. White and Asian, American Indian and Other graduates are more likely to teach at the secondary level, although the majority of graduates of all racial/ethnic groups teach at the elementary level. Of Those Not in Education, What Are They Doing? Figure 8 below shows the occupations of those Pathways three-year graduates who were not in the education field at the time of the follow-up. These graduates comprised 12 percent (or 100 individuals) of the three-year graduates.
15 Cells with N counts of 5 or less have been suppressed.
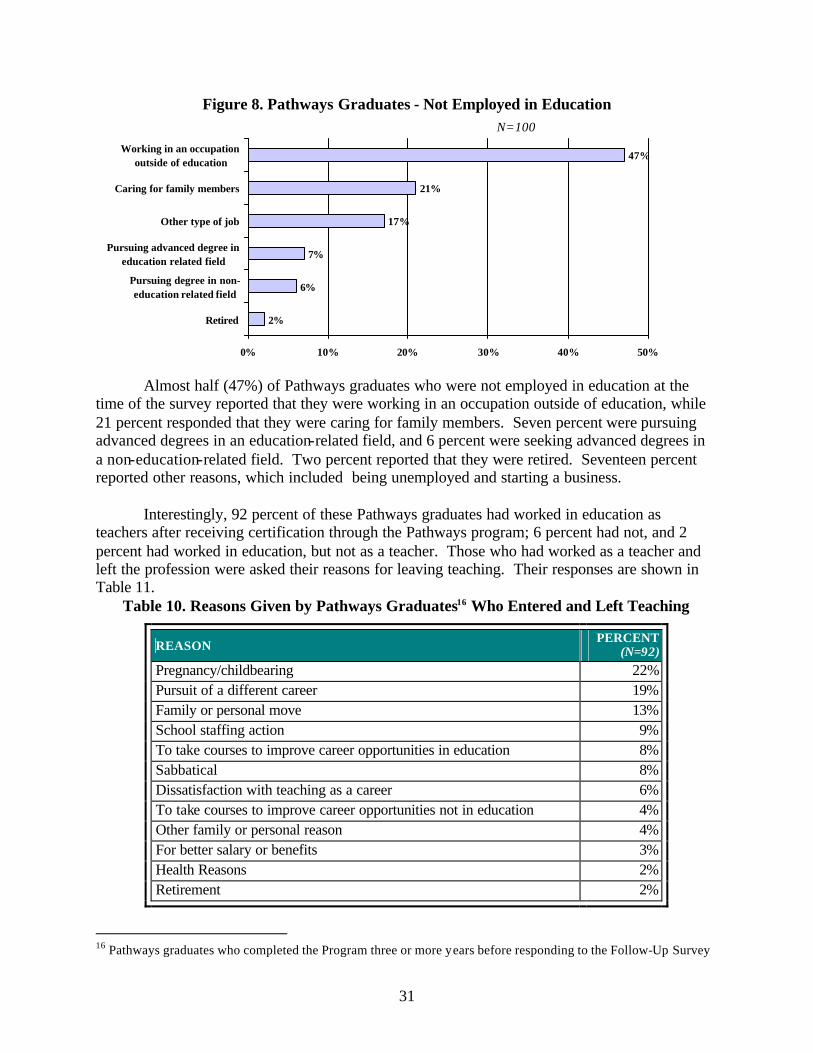
31
Figure 8. Pathways Graduates - Not Employed in Education
Almost half (47%) of Pathways graduates who were not employed in education at the time of the survey reported that they were working in an occupation outside of education, while 21 percent responded that they were caring for family members. Seven percent were pursuing advanced degrees in an education-related field, and 6 percent were seeking advanced degrees in a non-education-related field. Two percent reported that they were retired. Seventeen percent reported other reasons, which included being unemployed and starting a business. Interestingly, 92 percent of these Pathways graduates had worked in education as teachers after receiving certification through the Pathways program; 6 percent had not, and 2 percent had worked in education, but not as a teacher. Those who had worked as a teacher and left the profession were asked their reasons for leaving teaching. Their responses are shown in Table 11.
Table 10. Reasons Given by Pathways Graduates16 Who Entered and Left Teaching
REASON PERCENT
(N=92) Pregnancy/childbearing 22% Pursuit of a different career 19% Family or personal move 13% School staffing action 9% To take courses to improve career opportunities in education 8% Sabbatical 8% Dissatisfaction with teaching as a career 6% To take courses to improve career opportunities not in education 4% Other family or personal reason 4% For better salary or benefits 3% Health Reasons 2% Retirement 2%
16 Pathways graduates who completed the Program three or more years before responding to the Follow-Up Survey
2%
6%
7%
17%
21%
47%
0% 10% 20% 30% 40% 50%
Retired
Pursuing degree in non-education related field
Pursuing advanced degree ineducation related field
Other type of job
Caring for family members
Working in an occupationoutside of education
N=100
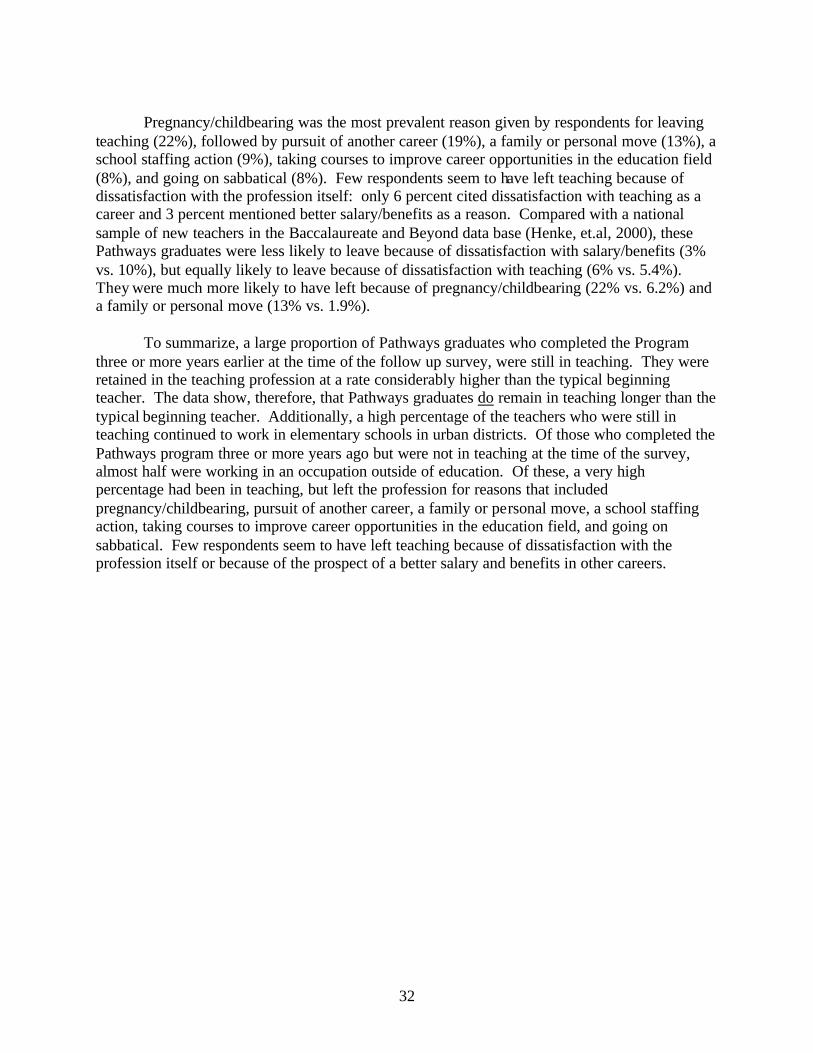
32
Pregnancy/childbearing was the most prevalent reason given by respondents for leaving teaching (22%), followed by pursuit of another career (19%), a family or personal move (13%), a school staffing action (9%), taking courses to improve career opportunities in the education field (8%), and going on sabbatical (8%). Few respondents seem to have left teaching because of dissatisfaction with the profession itself: only 6 percent cited dissatisfaction with teaching as a career and 3 percent mentioned better salary/benefits as a reason. Compared with a national sample of new teachers in the Baccalaureate and Beyond data base (Henke, et.al, 2000), these Pathways graduates were less likely to leave because of dissatisfaction with salary/benefits (3% vs. 10%), but equally likely to leave because of dissatisfaction with teaching (6% vs. 5.4%). They were much more likely to have left because of pregnancy/childbearing (22% vs. 6.2%) and a family or personal move (13% vs. 1.9%). To summarize, a large proportion of Pathways graduates who completed the Program three or more years earlier at the time of the follow up survey, were still in teaching. They were retained in the teaching profession at a rate considerably higher than the typical beginning teacher. The data show, therefore, that Pathways graduates do remain in teaching longer than the typical beginning teacher. Additionally, a high percentage of the teachers who were still in teaching continued to work in elementary schools in urban districts. Of those who completed the Pathways program three or more years ago but were not in teaching at the time of the survey, almost half were working in an occupation outside of education. Of these, a very high percentage had been in teaching, but left the profession for reasons that included pregnancy/childbearing, pursuit of another career, a family or personal move, a school staffing action, taking courses to improve career opportunities in the education field, and going on sabbatical. Few respondents seem to have left teaching because of dissatisfaction with the profession itself or because of the prospect of a better salary and benefits in other careers.
33
SECTION 4: FACTORS CONTRIBUTING TO THE SUCCESS OF THE PATHWAYS PROGRAM
Our process evaluation enabled us to identify four factors that contributed to the
successful outcomes attained by the Pathways Programs. These factors are: Ø a strong partnership between a teacher education program that prepared participants and
one or more high-need school districts that employed them; Ø careful recruitment and selection of program participants;
Ø a rigorous, innovative, and culturally sensitive teacher education curriculum; and
Ø varied types of support for Pathways candidates while they pursued college degrees as
well as teaching certificates. These factors were detailed in a previous report (Clewell & Villegas, 2001). Below we provide highlights of our previous discussion.
A Strong Partnership
Each of the 40 sites in this evaluation entailed a partnership between a teacher education program and one or more school districts in its service area. In fact, the Fund made such partnerships a requirement for applying for a Pathways grant. Specifically, the Fund expected that representatives from the partnering institutions at each site work collaboratively in planning and implementing the program. While differences were observed across the sites regarding the nature of the partnerships, several features stood out.
Successful partnerships officially began when a planning committee was formed for the purpose of designing the program. We found that the composition of this committee was critical to its success. Such a committee typically included: the person who was slated to oversee the Pathways program activities at the college/university; faculty who were likely to teach courses for program participants; a representative from the office of the dean of education at the partnering college/university; a representative from the partner school district’s personnel office who had access to information on local demand for teachers; and principals from the partnering districts.17
The major tasks of the planning team were the following: assessing the district’s need for qualified new teachers, establishing realistic recruitment goals, choosing the pool or pools from which to draw the new teacher recruits, developing a recruitment plan, conceiving the program of study, and devising the academic and social supports participants were apt to need as they progressed through the teacher education pipeline.
17 The support and participation of principals from the partnering districts was essential to the success of the program. The cooperation and support of principals initially ensured a population of paraprofessionals and uncertified teachers to recruit from, and ultimately provided program completers with teaching positions.
34
Once the program entered the implementation phase, the planning team was usua lly
replaced by an advisory group. The new group performed two overall functions--monitoring the progress made by the program toward the established goals and advising program staff on how best to deal with emerging issues. Among the issues most frequent addressed by the advisory groups were: how to deal with participants who lacked the expected number of transferable credits; how to enable participants who were working full- time to complete the required student teaching practicum without salary interruption; what to do about participants with marginal academic performance; and how to facilitate the hiring of program completers. Advisory groups met formally two to four times yearly, but program personnel informally consulted with their advisors as often as needed.
To flourish and succeed, partnerships require time and attention. Time pressure on everyone involved can make it difficult to schedule necessary meetings. Frequent turnover among school personnel, especially in urban districts, can cause communication problems as well as disruptions on program committees. We identified six characteristics that helped to resolve these problems and promoted program success: (a) a history of collaboration between the partner institutions; (b) open and frequent communication between representatives from the partner institutions; (c) an accurate needs assessment that enabled the planning team to articulate clear priorities and precise program goals; (d) a program director/coordinator who commands strong respect in the district; (e) program goals that are compatible with the mission of the participating teacher education institution; and (f) high-caliber program participants.
Careful Recruitment and Selection of Program Participants
A second factor that promoted program success was careful recruitment and selection of participants. As we discovered, site staff were well aware that the success of their programs depended largely on the candidates selected for participation. This awareness led them to recruit and select program candidates carefully. Below we discuss the strategies the programs used to recruit and select candidates from among district personnel (paraprofessionals and uncertified teachers) and from outside the district (RPCVs). Recruiting and Selecting Candidates from School Employee Pools
To ensure a large applicant pool, the Pathways programs publicized information about their existence. They disseminated information about the program in a variety of ways, including newspaper ads, radio announcements, posters in target district schools and communities, flyers sent out to schools and community agencies, newsletters sent out regularly to potential participants either by the district itself or professional unions to which the target employees belonged, and word of mouth.
School district staff with access to personnel information systems and data played a central role in recruiting program participants. These staffers were able to identify potential Pathways applicants for the partnering teacher education program staff, who then sent out individualized recruitment letters. At many sites, this collaboration extended to the school level. District or program staff asked principals to identify paraprofessionals and uncertified teachers
35
whom they believed would be well suited for Pathways training and assistance. Some sites invited experienced teachers to nominate candidates for participation.
Recruitment efforts typically culminated in a series of sessions or workshops that gave detailed information about the program to people from the target pools who had expressed interest. These informational meetings were intended to help potential applicants understand clearly what the program offered them, including the type of preparation they would get, the support they would receive, and the financial assistance that would be available. Potential participants were also helped to understand what the program expected of them in return. This involved giving them a realistic picture of the time commitment required for program-related activities, the rigor of the courses, and the commitment to teach in the target district for a specified period of time following program completion.
While variations in the selection of candidates across the Pathways sites that targeted paraprofessionals and uncertified teachers were noted, an overall pattern emerged. Optimal selection typically occurred in three stages. The initial stage served to screen applicants. Application materials (including background information, copies of college or university transcripts, scores on standardized tests, written essay describing the candidate’s interest in teaching and career goals, and letters of recommendation) were evaluated concurrently for compliance with criteria for admission into teacher education at the partner college/university and for other program-specific participation requirements (e.g., being of a racial/ethnic minority group, having an interest in teaching one of the high-need subjects in the district).18 Applicants who met criteria for admissions into teacher education (or were close to meeting those criteria) and also approximated the profile of the participant sought by the program were invited to the college/university for a visit and further assessment.
The campus visit comprised the second selection phase. During these visits, applicants participated in one or more interviews, and in some cases were also asked to produce writing samples. Applicants’ performance during the interviews and the quality of the writing samples were assessed.
Selection decisions were made during the final phase using information gathered through phases one and two. A salient feature of programs in the Pathways network was their use of both traditional and nontraditional criteria to select partic ipants. Although traditional predictors of success in postsecondary education, such as grade point averages and scores on standardized tests, provide important information about applicants, they can also seriously underpredict the potential of many nontraditional candidates--including paraprofessionals and uncertified teachers--particularly those from racial/ethic minority backgrounds. Conventional selection criteria also ignore the unique strengths that these two target pools bring to the teaching profession, including their personal knowledge of the racial/ethnic minority communities they represent.
Cognizant of the fact that conventional selection criteria disadvantage nontraditional applicants, Pathways staff supplemented those criteria with nontraditional indicators of success 18 Paraprofessionals were often required to have completed a minimum of 60 credit hours to be considered for the Pathways program.
36
that provide a fuller picture of applicants’ strengths. Among these indicators were: recommendations from principals, experienced teachers, and other individuals living in the communities served by the partnering school districts; length of teaching experience in the target district; performance in individual and/or group interviews; expressed commitment to teaching in urban and rural settings; intention to continue teaching in the target district after securing a teaching certificate; motivation to succeed, as evidenced by drive and determination when faced with obstacles; ability to work with others toward productive ends; leadership qualities; residency in an urban or rural community; level of maturity; orientation toward social and community concerns; and skills in a second language.
One overall finding merits discussion. Our data clearly show that a program benefited considerably when district and school staff were actively involved in the identification, recruitment, and selection of participants. Such involvement facilitated communication between the program and potential applicants and generally increased the size of the applicant pool, allowing site personnel to select high quality candidates. It also sent a strong message to applicants that their school districts viewed the investment of time and energy they put into the program favorably. Equally important, when they played a central role in the selection of program participants, district staff had a strong incentive to hire Pathways completers for teaching vacancies. At a minimum, involvement of districts and schools in the selection process entailed their giving input into the criteria used to select participants. However, the more successful sites involved both district staff and principals from partnering schools in the screening, interviewing, and selection of candidates. Recruiting and Selecting from the Pool of Returned Peace Corps Volunteers
While recruitment and selection of candidates from outside the partner school district expands the talent pool from which to fill teaching vacancies, it also can present an initial obstacle to recruiters. We found this to be the case with the RPCVs population served by 14 of the Pathways programs. Because recruits were expected to be in full- time teaching positions while they completed their course of study, considerable effort was required to coordinate the placement of these candidates with their recruitment and selection for the program.
Much of the recruitment of RPCVs was done by the Peace Corps/USA Fellows Program in Washington, D.C, the coordinating agency for the sites that targeted this population. The coordinating agency used its tight-knit communication system of country directors and its direct access to volunteers to inform potential participants about the availability of the Pathways programs and to generate interest in them. Several programs supplemented this centralized recruitment mechanism with a strategy of sending information about their own local efforts directly to country directors of the Corps. To this end, those programs prepared informational packets that included a description of the course of study and support services offered, a description of the partnering districts and its job opportunities, and application materials.
A key factor that contributed to a sometimes uneven flow of applications from RPCVs was the individual program’s ability to place recruits in full- time teaching positions upon admission into the program. Uncertainties surrounding student enrollments and budgets for the coming school year often prevented districts from making an early commitment to place
37
candidates. Programs unable to make this commitment were apt to experience difficulties with recruitment.
Two approaches were used by sites to select candidates from the RPCVs pool. Some sites chose participants for the program before they had been hired as teachers by the partner district. This approach involved three selection phases. In the initial phase, applicants’ materials were evaluated to determine compliance with admission into the teacher education program and other requirements for employability as emergency-certified teachers in the target district. Among the factors considered in this evaluation were the following: successful completion of Peace Corps service; prior teaching experience; background in subjects that received hiring priority in the target district; possession of a bachelor’s degree; grade point average; scores on selected standardized tests; quality of writing sample, and evidence of personal commitment to teaching. As part of the second phase, applicants who met requirements were selected for participation on the condition that they find a teaching position before or soon after beginning the program of study. In the final phase, conditionally selected RPCVs were helped to find teaching position by site personnel. Once placed, they were formally admitted into the Pathways program.
The second approach used to select RPCVs involved choosing participants only after they secured teaching positions in the target districts. This approach was also comprised of three selection phases. During phase one, applicants’ materials were evaluated in a manner similar to that used in first approach. In phase two, applicants who met the specified requirements were helped to find placements as teachers in the partner districts. To facilitate the search, sites typically invited candidates for interviews. Whenever possible, candidates were also scheduled to take the state-required tests for emergency teaching certificates during those visits. In the final phase, only those candidates who had been hired as teachers by the target district were selected for participation in the program. Regardless of the approach used, the placement of candidates in full- time teaching positions was a major challenge for programs to overcome, especially at the outset. We found that the more successful sites solved these difficulties, at least in part, by paying careful attention to returned volunteers’ interests and preparation in subject areas of highest demand in the partner districts. We also noted that the direct involvement of school principals and district staff in selection decisions was crucial.
A Rigorous, Innovative, and Culturally Sensitive Teacher Education Curriculum
The teacher education curriculum is a third factor that contributed to the success of the Pathways Program. The teacher education curriculum leading to full certification was the vehicle for developing and enhancing the dispositions, knowledge, and skills needed by program participants to successfully teach students in the partner districts. Most programs reported modifying their curriculum to reflect current thinking on effective teaching in a multicultural society and to build on participants’ strengths while addressing their unique needs.
A review of the content of the teacher education curriculum used by the Pathways sites revealed several important themes, one of which was the value of diversity. Research shows that
38
teachers who view cultural differences as problems to be remedied will generally not make accurate assessments of children’s strengths and limitations. An attitude that presumes children of color suffer automatic deficits invariably leads teachers to emphasize what students cannot do, rather than what they are capable of doing well. To build on the many strengths all children bring to class, teachers must demonstrate respect for cultural differences. The Pathways programs consistently reinforced the value of cultural diversity throughout the teacher education curriculum.
The curriculum was designed to cultivate participants’ knowledge about cultural differences as a way of preparing them to teach children from diverse backgrounds effectively. This preparation involved helping participants understand the concept of culture and guiding them through an exploration of their own cultural identities. It also entailed requiring participants to learn about the history and literature of the major cultural groups represented in the partnering districts.
Though differences were found in the views of teaching and learning promoted by the various Pathways sites, there was general agreement among program staff that students learn best when teachers help them build bridges to learning. One of the goals of the Pathways preparation, therefore, was to develop among participants a variety of bridge-building strategies for use in their own teaching. Examples of these strategies are selecting materials that are relevant and interesting to students, and clarifying new concepts by using examples or analogies drawn from students’ everyday lives. Many of the programs also developed participants’ ability to involve students’ families in school-related activities.
One objective of many of the Pathways sites was to prepare program participants to serve as role models for their students. Thus, explicit discussions about the qualities of an effective role model were integrated throughout the coursework. Many of the professors in the programs also aimed to serve as role models for participants, teaching them by example about the benefits students can derive from such relationships.
Another theme in the Pathways curriculum was that of making clear to participant s the connection between theory and practice. To accomplish this, participants were asked to carry out frequent field experiences in the classrooms in which they taught either as paraprofessionals or teachers. Participants were also encouraged to bring to bear on their academic courses their wealth of knowledge about teaching derived from their experiences. Course instructors also reported that, to the extent possible, they grounded theoretical discussions in the context of participants’ everyday practices.
If students are to attain high levels of achievement, teachers must not only have strong pedagogical skills but also a deep grounding in subject matter knowledge. In keeping with this principle, Pathways sites consciously aimed to provide participants with a deep understanding of subject matter. To this end, many reported having extensive and rigorous course requirements in general education and the liberal arts, as well as in academic majors.
Changes in the teacher education curriculum were not limited to course content. Instructors at a number of sites used innovative instructional practices as well. These included
39
the use of participant journals to reflect on their teaching, cooperative learning, group projects, analysis of teaching cases, learning by discovery, performance assessment to document breadth and depth of candidates’ learning, and service learning in community settings.
Most of the Pathways sites also modified the structure of the curricula to meet the needs of their participants. For example, nearly all sites reported expanding the number of courses offered during evening hours, weekends, and summer sessions so that participants could continue working during the weekdays throughout the school year. Several sites offered selected classes in the partner districts to make their programs more accessible to participants. A few sites gave participants credit for their wealth of teaching experience. Equally notable, most of the programs serving paraprofessionals developed creative strategies to enable these participants to continue earning a salary while they completed student teaching.
Support Services for Candidates
Because the Pathways participants tended to be older, to have families, to have been out of college settings for some time, and to work full- time, they experienced stress atypical for most teacher education students. To help participants cope with stress while they pursued teaching certificates, and in most cases undergraduate or graduate degrees as well, the programs offered a network of supports.
The main support services provided by the Pathways programs were orientation, academic advising/monitoring, academic tutoring, preparation for certification exams, supervision of field experiences, mentoring, counseling, family support, cohort-building, and financial support. A brief description of each of these services follows.
Orientation. Orientation typically began soon after participants were admitted to the program. The two main functions of this service were: to familiarize new enrollees with the program’s goals and expectations; and to introduce them to the host institution and the teacher education program, including program and institutional support services available for their use. Some programs’ orientation sessions lasted only a few hours or days at the beginning of each semester, while other programs made orientation part of a credit-bearing class that went on throughout the first semester. In other cases, orientation was embedded in the recruitment and selection process.
This service was of particular importance for RPCVs because it was the main source of their knowledge about the school districts where they would teach and their chief opportunity to learn about the teaching profession before assuming full-time jobs in it. Peace Corps programs often offered their orientation in the summer. These sessions gave participants an introduction to the geographic area, the host institution, and the program. Usually, participants also received preparation in pedagogical techniques, including classroom management and instructional planning.
40
Academic advising/monitoring. All programs provided some type of academic advisory
services focused on course selection and sequencing. In some sites advising was done by program staff, in others by faculty or host institution staff, and in still others by both program and host institution staff. Some sites offered group as well as individualized advising. A few programs embedded advising into seminars that discussed issues such as required courses, manageable course loads, and potential difficulties. Because programs for RPCVs tended to mandate a set course sequence, most provided very little advisement.
Almost all programs monitored participants’ progress semester by semester. Transcripts and grades were reviewed to judge whether the academic program was being followed and how the participants were faring in it. At several sites, program staff met periodically with participants to discuss past or potential problems. Participants with academic difficulties were referred to support services provided by either the program or the institution. A number of programs asked faculty who taught Pathways students to report during the semester on their progress in class, so that problems could be addressed before it was too late.
Academic tutoring. Programs for paraprofessionals and uncertified teachers offered academic tutoring on an as-needed basis to both individuals and groups. Sometimes participants used academic services offered by the institution hosting the Pathways program. These institutional services included: regularly scheduled workshops that were designed to develop skills in math, writing, critical thinking, test-taking, studying, time management, and use of the library; and labs or learning centers that participants could use on an as-needed basis to get individual help with math, writing, and other subjects. Some Pathways programs hired in-house tutors when they saw the need for one.
Preparation for certification exams. Almost all programs for paraprofessionals and uncertified teachers provided test preparation assistance. These services varied widely in intensity, from comprehensive programs to one-time workshops lasting no more than three hours. Some sites embedded test-taking skills into their teacher education courses. Others organized groups of students to help one another prepare for the tests. Most of the training activities focused on test-taking skills. Such assistance was especially important for paraprofessionals who had been away from a college setting for several years and who had not taken standardized tests in a long time.
Supervised field experiences. Paraprofessionals in the Pathways Program generally participated in two types of supervised field experiences, the most intensive of which was student teaching. As is customary, student teachers were supervised daily by their cooperating teachers and periodically by university faculty. Supervision sessions were intended to provide student teachers with feedback on their teaching performance and to offer suggestions for improvement purposes. At many Pathways sites, paraprofessionals also received periodic feedback on their classroom performance from the certified teachers they assisted.
Uncertified teachers and RPCVs frequently received supervision from program staff who visited participants’ classrooms to observe them teach. Subsequently, they provided feedback on the observed performance. Occasionally, supervisors would model a teaching strategy. Because
41
most RPCVs had relatively little teaching experience, they benefited considerably from this support service. Nearly all Peace Corps sites reported offering participants intensive in-classroom supervision, particularly during their initial year of teaching.
Mentoring. Many Pathways programs provided mentors for their students. The role of the mentor was to give feedback and support on classroom teaching, resources, and materials, as well as advice on negotiating the educational system. Mentors in these programs might be teachers, program staff, retired school personnel, or program alumni. We found that several factors must work together to ensure high-quality mentoring. In general, mentors should be carefully selected and matched to mentees; they should be paid or given release time for mentoring; they should undergo mentor training; and other program staff must monitor the frequency and quality of mentoring contacts.
Counseling. Because most participants juggled the demands of full- time jobs, family responsibilities, and coursework, they were under constant pressure. Spending many hours away from home to complete coursework and participate in other project-related activities, participants (especially females) often found that spouses and other family members came to resent the program. For some participants, especially paraprofessionals, their participation in the program threatened the stability of relationships with spouses, many whom lacked formal education past high school. Access to counseling was essential for students in these unusually stressful situations. Most counseling services provided to Pathways participants were available through the host institution’s counseling center, although program staff also listened sympathetically to problems.
Family support. To ease the pressure at home, Pathways programs sponsored family support activities such as reimbursement for child care, family socials, activity days for families, awards dinners that invited families, and workshops for spouses. Some sites included participants’ families in orientation activities to introduce them to the goals of the program, discuss its demands or requirements, and enlist their support for participants. Because paraprofessionals and uncertified teachers tended to be older and to have substantial family-related responsibilities, programs serving these populations listed family support activities as a vital service. Peace Corps programs, however, did not place as much emphasis on family support activities, largely because RPCVs tended to be younger and single for the most part.
Cohort-building. Cohort-building--that is, encouraging a community of professional and personal colleagueship among program participants--can help graduates begin to develop the ir own support networks. This sense of cohort group began with the orientation experience that all programs implemented. Several programs also grouped students together in first semester courses--especially in the Peace Corps cluster--to further promote group support. Other strategies used by the programs to cultivate the sense of colleagueship included arranging regular meetings and social activities for students in the same cohort.
Financial support. We found that for program students who were substitute teachers and paraprofessionals who typically hold low-paying jobs, financial assistance with tuition was a must. We also found that to retain in and attract to teaching people who already have a bachelor’s degree and who are creative and competent--like the participating uncertified teachers
42
and RPCVs--financial incentives in the form of tuition assistance were needed as well. Pathways programs provided funding to cover at least two-thirds of tuition. This financial assistance was a critical factor in making the Pathways Program successful.
Support Services for Completers
After participants completed their programs and obtained a teaching certificate, three additional supports helped to smooth their transition into the teaching force. These transitional services are described next.
Placement in teaching positions. Programs serving paraprofessionals were faced with assisting their graduates in finding teaching jobs in targeted school districts. Some Pathways sites provided guidance for participants in negotiating the district bureaucracy and procedures. This guidance included preparing them for interviews and helping them with paperwork. Sites also maintained informal communication with district personnel to learn about job openings and ensure that program graduates were considered for those jobs. As we discussed above, involving school district staff on project advisory councils facilitated the hiring process for program graduates.
Induction services. Pathways programs frequently invited graduates to participate in seminars, workshops, and meetings that contributed to their professional development and support. In their first year of teaching, graduates also received informal assistance from programs, which encouraged them to consult Pathways staff about questions or problems they might have. Occasionally, program staff observed graduates’ classroom teaching and offered feedback.
Many Pathways completers also benefited from induction services provided by the host institution to all its graduates and/or by the school district or teachers’ union to all beginning teachers in the district. In addition to seminars, workshops, and beginning teacher institutes, induction services occasionally offered the assistance of mentor teachers and additional supervision by the principal.
Involving alumni in Pathways-related activities. Some Pathways programs continued to involve their alumni in activities such as meetings, seminars, orientation, and social functions. Alumni were often encouraged to act as mentors for current program participants and recent graduates.
Analysis of our data revealed several principles for constructing an effective support services network for nontraditional teacher education students: Ø Support services should match participants’ needs, while acknowledging and building on
their strengths. Ø Support services should be monitored (and revised when necessary) to ensure that they
are offered as needed.
43
Ø Whenever possible, programs should use or augment support services already offered by the host institution.
To summarize, the success of the Pathways Program is due largely to a partnership
approach in which programs of teacher education work collaboratively with school districts to produce new teachers. Important factors are: careful recruitment and selection of program participants; a structurally innovative teacher education curriculum that prepares participants to work effectively with a diverse student population; and a network of supports designed to retain participants through program completion and certification.
44
SECTION 5: CONCLUSIONS AND POLICY IMPLICATIONS This section presents and summarizes the conclusions that emerged from the evaluation findings. We also discuss the implications for policy regarding teacher recruitment and preparation that can be drawn from these conclusions.
Conclusions In setting out the conclusions here—as in Section 3—we organize them according to the questions posed by the evaluation.
Q. 1: Did the Pathways Program meet its overall recruitment goals?
Enrollment data show that, in terms of numbers of participants recruited, the Pathways Program exceeded its recruitment goal by almost 20 percent. Another recruitment goal was to enroll a nontraditional, diverse set of candidates, especia lly those from minority backgrounds. A comparison of the demographic characteristics of Pathways participants compared to those of a national sample of newly prepared teachers reveals that Pathways recruits were much more likely to be members of racial/ethnic minority groups and more likely to be older than their national counterparts. In fact, in terms of potential contribution to the national pool of new teachers, Pathways increased the racial/ethnic diversity of the pool by almost 15 percent, compared to the overall increase of 4 percent. In general, the Program was not as successful in recruiting a higher percentage of males than is present in the national sample of beginning teachers, although one component of the Program was highly successful in this regard.
The findings suggest that the pools of paraprofessionals and non-certified teachers are good sources from which to recruit candidates of color for teaching. The returning Peace Corps volunteers pool is a good source from which to recruit male teachers.
Q. 2: Have Pathways participants remained in the Program through completion and certification? Once they complete the Program, do they teach in targeted school districts?
At the conclusion of the evaluation, 93 percent of all Pathways participants had exited the Program, with 19 percent of these having dropped out and 81 percent having completed Pathways. Seven percent of all Pathways participants remained in the pipeline, most of these paraprofessionals who typically require much more time to complete certification requirements than the other two types of Scholars/Fellows. The 81 percent completion rate is much higher than the 60 percent national completion rate for teacher education students. We suspect that the careful selection of program participants and the structure of support services available to them contributed to these higher retention rates.
More than 80 percent of Pathways graduates entered teaching positions in schools located
in the high-need districts that had partnered with the Pathways Program. This is a high proportion by any standard. Of those graduates who did not work in targeted school districts, more than three-fourths worked in urban or rural districts. This may reflect the effectiveness of
45
the non-binding contracts that most Pathways Scholars/Fellows were required to sign as a condition of participation in the Program. It may also be an indicator of the Program's success in recruiting and selecting candidates who were committed to teaching in high-need areas. In addition, the close partnerships established between Program sites and target districts surely facilitated the hiring of Pathways graduates into areas where they were needed.
Q. 3: Are Pathways graduates good teachers?
Teaching effectiveness data in four domains of teaching as well as overall, collected for graduates of the Pathways Program at three different points in time from three independent sources consistently support Pathways graduates' effectiveness as teachers. Data comparing the teaching performance of Pathways teachers with that of typical novice teachers further show that Pathways graduates are perceived by both their supervisors and an independent assessor to be more effective teachers than typical novice teachers in their schools.
Particularly noteworthy was the participants’ ability to create an environment for student learning--the teaching domain that attained the highest rating across all three data sources. This domain includes the ability to create a climate that promotes fairness, to establish and maintain rapport with students, to communicate challenging learning expectations, to establish and maintain standards of behavior, and to make the physical environment safe. We suspect that the participants’ overall teaching effectiveness may be related to two key Program factors--their careful recruitment and selection, and the rigorous pedagogical training they received in the program.
Q. 4: Do Pathways graduates remain in teaching?
Of Pathways graduates who were followed up three years or more after they completed the Program, 81 percent had remained in teaching for at least three years. The 81 percent three-year retention rate exceeds the national three-years in teaching retention rate of 71 percent for beginning teachers reported by Ingersoll (2000). Again, this favorable outcome may be related to the process the programs used to select participants as well as to the non-binding agreement signed by participants to remain in teaching for a specified period of time.
Summary
The evaluation findings, therefore, lead us to conclude the following regarding the effectiveness of the Pathways Program: Ø Pathways has surpassed its numeric and diversity recruitment goals.
Ø Pathways participants have achieved a higher completion rate than traditional teacher
education students. Ø Once they complete the Program, Pathways graduates teach in targeted school districts or
urban/rural districts at extremely high rates.
46
Ø Pathways graduates are perceived by their supervisors, principals and others to be more
effective as teachers than the typical beginning teacher in their schools. Ø Pathways graduates are more likely to remain in teaching for at least three years than the
typical beginning teacher.
Policy Implications
The following policy implications can be drawn from the conclusions of this evaluation study:
Recruiting new teachers from nontraditional pools is an effective way of increasing the
national supply of teachers. The Pathways experience has demonstrated that there is a large pool of nontraditional individuals to draw from who have the desire and ability to become effective teachers for urban and rural high-need districts. Federal, state, and local policies should support programs that recruit from nontraditional pools as a way of increasing both the number of teachers for high-need areas and the diversity of the teaching pool.
Paraprofessionals represent a rich source of potential teachers. This group, if selected
carefully and given appropriate support, are as likely as other nontraditional groups to complete a teacher education program and become effective educators. Two additional benefits derived from focusing recruitment efforts on paraprofessionals are that (a) they are more likely to teach and to remain in teaching in high-need districts than their other nontraditional counterparts and (b) they are more likely to be members of racial/ethnic minority groups. Federal, state, and local initiatives to increase the teaching force should include paraprofessionals as a large part of these efforts.
The Pathways model, which provides a program of preparation and support specifically
tailored to the nontraditional groups being served, is an effective and affordable approach to increasing the teaching force in terms of both number and diversity. This model, which is thoroughly described in another report, Ahead of the Class: A Handbook for Preparing New Teachers from New Sources, can be described as an alternate pathway to teacher preparation and certification rather than an alternative certification program. Because evaluation findings have demonstrated its effectiveness, it merits wide replication on national, state and local levels.
Recruiting more candidates of color into teaching could help stabilize the teaching force in urban school districts. If selected carefully, enrolled in teacher education programs that work in partnerships with urban schools, and given appropriate preparation, candidates of color are likely to choose to teach in high need settings and to stay in their positions longer than the average new teacher. Federal, state, and local initiatives that aim to improve the conditions of urban and rural schools should give attention to recruiting and preparing more teachers of color.
47
REFERENCES Adams, G.J., and M. Dial. 1993. “Teacher survival: A Cox regression model.” Education and
Urban Society 26, no.1: 90-101. Andrew, M. D. and R. L. Schwab. 1995. “Has reform in teacher education influenced teacher
performance? An outcome assessment of graduates of an eleven-university consortium.” Action in Teacher Education 17, no. 3: 43-53.
Ballou, D. and M. Podgursky. 1998. "Teacher recruitment and retention in public and private
schools." Journal of Policy Analysis and Management 17, No. 3: 393-417. Boe, E., S. Bobbit, and L. Cook. 1997. “Whither didst thou go?: Retention, reassignment,
migration, and attrition of special and general education teachers from a national perspective.” Journal of Special Education 30: 371-389.
Broughman, S. P. and M. R. Rollefson. 2000. Teacher Supply in the United States: Sources of
Newly Hired Teachers in Public and Private Schools, 1987-88 to 1993-94. (NCES 2000-309). Washington, DC: U.S. Department of Education, National Center for Education Statistics.
Clewell, B. C., and L. B. Forcier. 2000. Increasing the number of mathematics and science
teachers: A review of teacher recruitment programs. Paper prepared for the National Commission on Mathematics and Science Teaching for the 21st Century.
Clewell, B. C., and A. M. Villegas. 2001. Ahead of the class: A handbook for preparing new
teachers from new sources. Washington, DC: The Urban Institute. Clewell, B. C., K. L. Darke, T. Davis-Googe, L. B. Forcier, and S. A. Manes. 2000. Literature
review on teacher recruitment programs. Washington, DC: U.S. Department of Education.
Clewell, B. C., M. Puma and S. A. McKay. 2001. Does it matter if my teacher looks like me?:
The impact of teacher race and ethnicity on student academic achievement. Report to the Ford Foundation. New York, NY: Ford Foundation.
Dandy, E. 1998. “Increasing the number of minority teachers: Tapping the paraprofessional
pool.” Education and Urban Society 31, no. 1: 89-103. Darling-Hammond, L. 2000. Solving the dilemmas of teacher supply, demand, and standards:
How we can ensure a competent, caring, qualified teacher for every child. New York, NY: National Commission on Teaching & America's Future.
Dee, T. S. 2000. Teachers, race and student achievement in a randomized experiment.
Unpublished paper. Swarthmore College, Swarthmore, PA.
48
DeWitt Wallace-Reader=s Digest Fund. 1997. Recruiting, preparing, and retaining teachers for America=s schools: Progress report--Pathways to Teaching Careers. New York, NY: Author.
Education Commission of the States. 2000. In pursuit of quality teaching: Five key strategies
for policymakers. Denver, Colorado: Author. Ehrenberg, R. G. and D. J. Brewer. 1995. “Did teachers' verbal ability and race matter in the
1960s? ‘Coleman’ revisited.” Economics of Education Review 14, no. 1: 1-21. Ehrenberg, R.G., D. D. Goldhaber, and D. J. Brewer. 1995. "Do teachers' race, gender, and
ethnicity matter?: Evidence from the National Education Longitudinal Study of 1988." Industrial and Labor Relations Review 48, no. 3: 547-61.
Eubanks, S. 1996. The urban teacher challenge: A report on teacher recruitment and demand in
selected great city schools. Belmont, MA: Recruiting New Teachers. Grissmer, D. and S. Kirby. 1992. Patterns of attrition among Indiana teachers, 1965-1987.
Santa Monica, CA: RAND Corporation. Hanushek, E. A. 1992. “The trade-off between child quantity and quality.” The Journal of
Political Economy 100, no. 1: 84-117. Henke, R.R., X. Chen, S. Geis and P Knepper. 2000. Progress through the teacher pipeline:
1992-93 college graduates and elementary/secondary school teaching as of 1997 (NCES 00-152). Washington, DC: U.S. Department of Education, National Center for Education Statistics.
Howey, K. R., and N.L. Zimpher. 1991. Restructuring the education of teachers. Reston, VA:
Association for Teacher Educators. Hussar, W. J. 1999. Predicting the need for newly hired teachers in the United States to 2008-
09. (NCES 99-026). Washington, DC: U.S. Department of Education, National Center for Education Statistics.
Ingersoll, R. M. 2000. Turnover among mathematics and science teachers in the U.S. Paper
prepared for the National Commission on Mathematics and Science Teaching for the 21st Century.
Ingersoll, R. M., and S. Bobbit. 1995. Teacher supply, teacher qualifications, and teacher
turnover (1990-91). Washington, DC: U.S. Department of Education, National Center for Education Statistics.
Irvine, J. J. 1988. “An analysis of the problem of the disappearing Black educator.” Elementary
School Journal 88, no. 5: 503-514.
49
Jones, D.L., and R.F. Sandidge. 1997. “Recruiting and retaining teachers in urban schools: Implication for policy and the law.” Education and Urban Society, 29, no. 2: 192-203.
Mercer, W. A., and M. M. Mercer. 1986. “Standardized testing: Its impact on Blacks in
Florida=s educational system.” Urban Educator 8, no. 1: 105-113. Murnane, R. J. 1975. The Impact of School Resources on the Learning of Inner City Children.
Cambridge, MA: Balinger Publishing Company. National Commission on Teaching and America’s Future. 1996. What matters most: Teaching
for America’s future. New York, NY: Author. Schmidt, P. 1992. Shortage of trained bilingual teachers is focus of both concern and attention.
Education Week, February 12, 1992:14. Snyder, T. D. and C. M. Hoffman. 2000. Digest of education statistics, 1999. (NCES 00-031).
Washington, DC: U.S. Department of Education, National Center for Education Statistics.
Snyder, T. D., C. M. Hoffman and C. M. Geddes. 1998. Digest of education statistics, 1997.
(NCES 98-015). Washington, DC: U.S. Department of Education, National Center for Education Statistics.
Snyder, T. D. and J.G. Wirt. 1998. The condition of education, 1998. (NCES 98-013).
Washington, DC: U.S. Department of Education, National Center for Education Statistics.
Stewart, J., K. J. Meier, R. M. La Follette, and R. E. England. 1989. “In quest of role models:
Change in Black teacher representation in urban school districts 1968-86.” Journal of Negro Education 58, no. 2: 140-152.
U. S. Department of Commerce. 1996. Current population reports: Population projections of the
United States by age, sex, race, and Hispanic origin: 1995 to 2050. Washington, DC: Author.
Villegas, A. M., and B. C. Clewell. 1998a. “Increasing teacher diversity by tapping the
paraprofessional pool.” Theory Into Practice 37, no. 2: 121-130. Villegas, A. M., and T. Lucas. In press. Preparing culturally responsive teachers: A coherent
approach. Albany, NY: State University of New York Press. Villegas, A. M., and B. C. Clewell. 1998b. “Increasing the number of teachers of color for
urban schools.” Education and Urban Society 31, no. 1: 42-61. Whitener, S. D., K. J. Gruber, H. Lynch, K. Tingos, M. Perona and S. Fondelier. 1997.
Characteristics of stayers, movers,. and leavers: Results from the teacher follow-up
50
survey: 1994-95. (NCES 97-450). Washington, DC: U.S. Department of Education, National Center for Education Statistics.
A-1
APPENDIX A: OVERVIEW OF DEWITT WALLACE PATHWAYS TO TEACHING CAREERS PROGRAM SITES
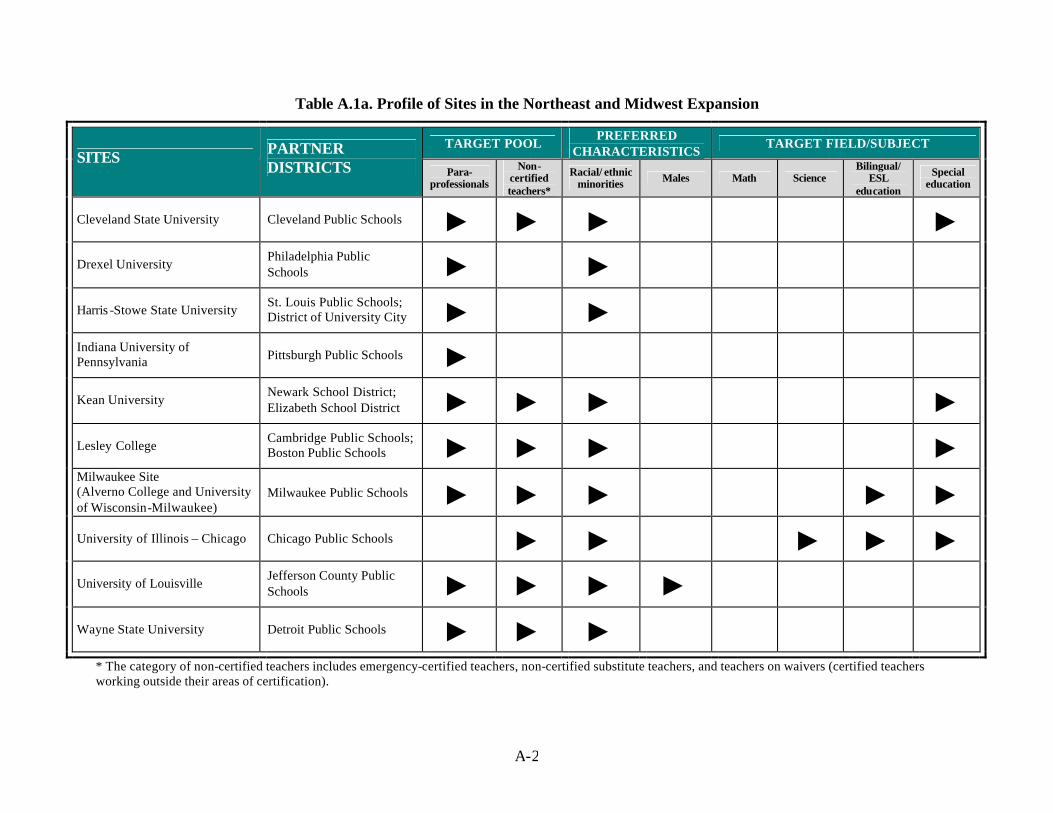
A-2
Table A.1a. Profile of Sites in the Northeast and Midwest Expansion
TARGET POOL PREFERRED
CHARACTERISTICS TARGET FIELD/SUBJECT
SITES PARTNER DISTRICTS Para-
professionals
Non-certified teachers*
Racial/ ethnic minorities Males Math Science
Bilingual/ ESL
education
Special education
Cleveland State University Cleveland Public Schools 3 3 3 3
Drexel University Philadelphia Public Schools 3 3
Harris -Stowe State University St. Louis Public Schools; District of University City 3 3
Indiana University of Pennsylvania Pittsburgh Public Schools 3
Kean University Newark School District; Elizabeth School District 3 3 3 3
Lesley College Cambridge Public Schools; Boston Public Schools 3 3 3 3
Milwaukee Site (Alverno College and University of Wisconsin-Milwaukee)
Milwaukee Public Schools 3 3 3 3 3
University of Illinois – Chicago Chicago Public Schools 3 3 3 3 3
University of Louisville Jefferson County Public Schools 3 3 3 3
Wayne State University Detroit Public Schools 3 3 3
* The category of non-certified teachers includes emergency-certified teachers, non-certified substitute teachers, and teachers on waivers (certified teachers working outside their areas of certification).
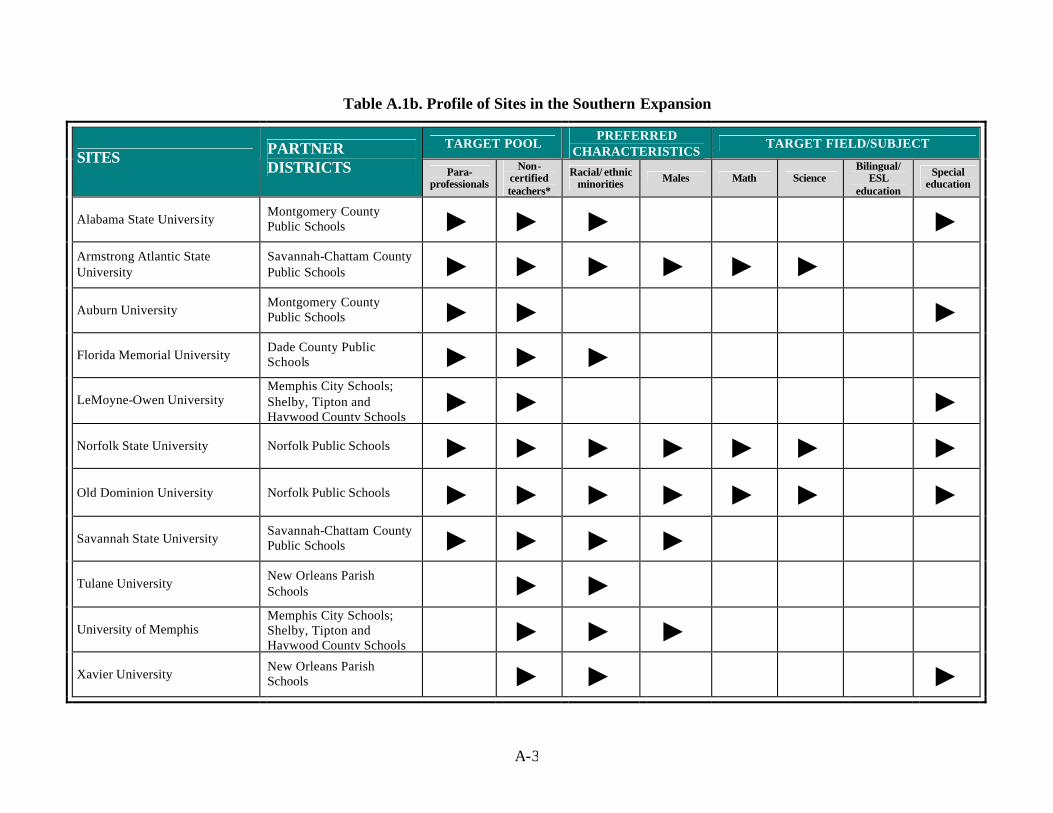
A-3
Table A.1b. Profile of Sites in the Southern Expansion
TARGET POOL PREFERRED
CHARACTERISTICS TARGET FIELD/SUBJECT
SITES PARTNER DISTRICTS Para-
professionals
Non-certified teachers*
Racial/ ethnic minorities Males Math Science
Bilingual/ ESL
education
Special education
Alabama State University Montgomery County Public Schools 3 3 3 3
Armstrong Atlantic State University
Savannah-Chattam County Public Schools 3 3 3 3 3 3
Auburn University Montgomery County Public Schools 3 3 3
Florida Memorial University Dade County Public Schools 3 3 3
LeMoyne-Owen University Memphis City Schools; Shelby, Tipton and Haywood County Schools
3 3 3
Norfolk State University Norfolk Public Schools 3 3 3 3 3 3 3
Old Dominion University Norfolk Public Schools 3 3 3 3 3 3 3
Savannah State University Savannah-Chattam County Public Schools 3 3 3 3
Tulane University New Orleans Parish Schools 3 3
University of Memphis Memphis City Schools; Shelby, Tipton and Haywood County Schools
3 3 3
Xavier University New Orleans Parish Schools 3 3 3
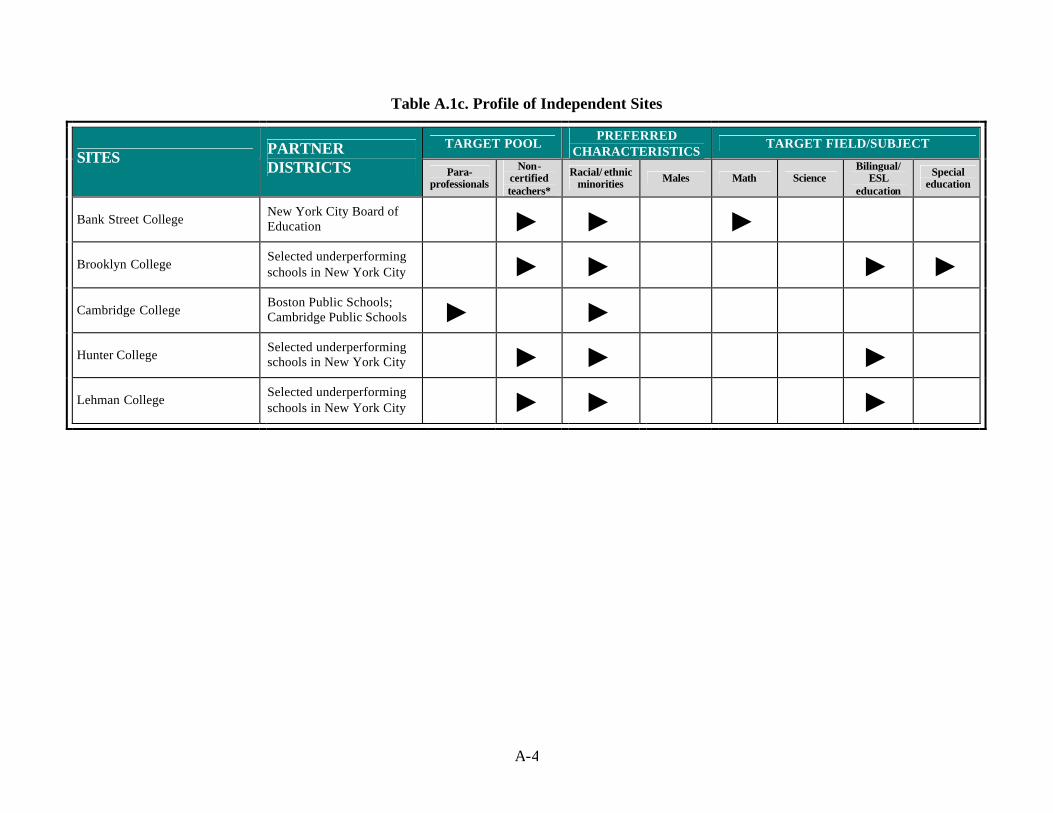
A-4
Table A.1c. Profile of Independent Sites
TARGET POOL PREFERRED
CHARACTERISTICS TARGET FIELD/SUBJECT
SITES PARTNER DISTRICTS Para-
professionals
Non-certified teachers*
Racial/ ethnic minorities Males Math Science
Bilingual/ ESL
education
Special education
Bank Street College New York City Board of Education 3 3 3
Brooklyn College Selected underperforming schools in New York City 3 3 3 3
Cambridge College Boston Public Schools; Cambridge Public Schools 3 3
Hunter College Selected underperforming schools in New York City 3 3 3
Lehman College Selected underperforming schools in New York City 3 3 3
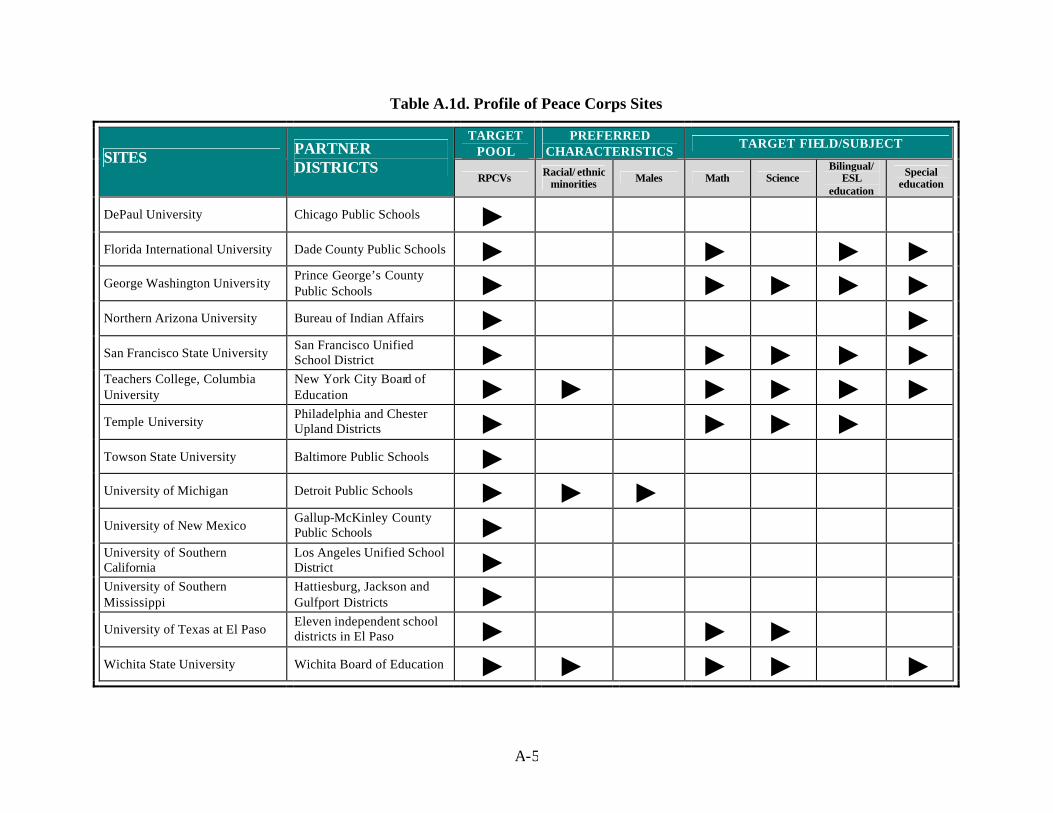
A-5
Table A.1d. Profile of Peace Corps Sites
TARGET POOL
PREFERRED CHARACTERISTICS
TARGET FIELD/SUBJECT SITES PARTNER
DISTRICTS RPCVs Racial/ ethnic
minorities Males Math Science Bilingual/
ESL education
Special education
DePaul University Chicago Public Schools 3
Florida International University Dade County Public Schools 3 3 3 3
George Washington University Prince George’s County Public Schools 3 3 3 3 3
Northern Arizona University Bureau of Indian Affairs 3 3
San Francisco State University San Francisco Unified School District 3 3 3 3 3
Teachers College, Columbia University
New York City Board of Education 3 3 3 3 3 3
Temple University Philadelphia and Chester Upland Districts 3 3 3 3
Towson State University Baltimore Public Schools 3
University of Michigan Detroit Public Schools 3 3 3
University of New Mexico Gallup-McKinley County Public Schools 3
University of Southern California
Los Angeles Unified School District 3
University of Southern Mississippi
Hattiesburg, Jackson and Gulfport Districts 3
University of Texas at El Paso Eleven independent school districts in El Paso 3 3 3
Wichita State University Wichita Board of Education 3 3 3 3 3
B-1
APPENDIX B: SURVEYS

B-2
DEWITT WALLACE-READER'S DIGEST FUND PATHWAYS TO TEACHING CAREERS PROGRAM PARTICIPANT PROGRESS FORM (Please type or print) Scholar/Fellow:
a. Name: ________________________________________________________________ Last Name First Name Middle Initial
b. Social Security Number: ______ - ____ - ______
c. Address: _________________________________________________
Street Address Apt. #
_________________________________________________ City State Zip Code
d. Telephone number: ( ) ______ - __________ Institution: ___________________________________________________________________________ Cohort number and/or class entry date (month, year): ________________________________________ I. Admissions Information:
1. Date admitted into program: _____ / _____ MM YY
2. Category:
_____ Provisionally licensed teacher _____ Substitute teacher _____ Teacher aide/paraprofessional _____ Returning Peace Corps volunteer _____ Other (describe):
__________________________________

B-3
3. Highest degree held upon admission, field of specialization, completion date, and
institution from which highest degree was awarded:
a. Degree (check only one):
_____ high school degree/diploma _____ associate degree _____ bachelor's degree _____ masters degree _____ other (describe): _______________________________
b. Field of specialization: _______________________
c. Date highest degree was awarded: _____ / _____
MM YY
d. High school/community college/college/university from which highest degree was awarded: ______________________________________________
4. Number of college credit hours transferred, if any: _________________
5. Entering GPA: __________
6. Teaching experience prior to entering program: ____ Yes ____ No
a. Number of years: __________
b. Grade level(s): ______________________________
c. Setting (check all that apply):
_____ urban
_____ suburban
_____ rural

B-4
7. Is this Scholar/Fellow seeking a degree?
_____ No
_____ Yes. If so:
i. What type of degree?
_____ associate
_____ bachelor's
_____ masters
_____ other (describe): ____________________________
ii. Area of specialization: ______________________________
iii. Expected date of completion: _____ / _____ MM YY
8. Is this Scholar/Fellow seeking a teaching certificate?
___ No
___ Yes. If so:
i. What type of certificate? _____________________________
ii. Area of specialization: ________________________________
iii. Expected date of completion: _____ / _____ MM YY

B-5
II. Initial Assessment:
1. Identify all the strategies used to assess Scholar/Fellow during the process of admitting him or her into the program. For each identified strategy, specify the results/scores obtained from the assessment.
Check Strategy Used
_____ a. Standardized tests of general knowledge/skills :
Check if Result/score used
_____ SAT: V:_____ M:_____
_____ ACT: EU:____ MU:____ S/R:_____ NS/R:_____
_____ Enhanced ACT: E:_____ M:_____ R:_____ S/R:_____
_____ PPST: R:_____ M:_____ W:_____
_____ CTBS: ___________________
_____ GRE: V:_____ Q:_____ A:_____
_____ MAT: ___________________
Other standardized general knowledge tests, if used:
Name of test Result/score
_________________________: ___________________
_________________________: ____________________
_________________________: ____________________
Continued on the next page

B-6
Check Strategy Used
_____ b. Other standardized tests of specific academic skills, if used:
Check if Result/score used
_____ Nelson-Denny Reading V:_____ C:_____ Test
_____ Torrance Test of V:_____ F:_____
Creative Thinking
Others (list)
_____ _______________
_____ _______________
_____ c. College/university designed instruments, if used:
Name of instrument/tool Result/score
_______________________ ____________
_______________________ ____________
_____ d. Attitude inventories, if used:
Name of instrument/tool Result/score
_______________________ ____________
_______________________ ____________
_______________________ ____________
Continue d on the next page

B-7
Check Strategy Used
_____ e. If a writing sample was used, please provide a rating for each of the
categories listed below. (Check only one per category)
i. Mechanics (punctuation and spelling): _____ Excellent _____ Good _____ Average _____ Below average _____ Poor _____ Not evaluated
ii. Grammar (e.g. subject/verb agreement,
verb tense, pronoun usage): _____ Excellent _____ Good _____ Average _____ Below average _____ Poor _____ Not evaluated
iii. Vocabulary: _____ Excellent
_____ Good _____ Average _____ Below average _____ Poor _____ Not evaluated
iv. Sentence and paragraph development: _____ Excellent
_____ Good _____ Average _____ Below average _____ Poor _____ Not evaluated
v. Development of ideas: _____ Excellent
_____ Good _____ Average _____ Below average _____ Poor _____ Not evaluated
vi. Other (please describe):
Continued on the next page

B-8
Check Strategy Used
_____ f. Interview with Scholars/Fellows: _____ Excellent candidate
_____ Good candidate _____ Average candidate _____ Below average candidate _____ Poor candidate _____ Not interviewed
_____ g. Other assessment strategies used (describe additional strategy and results yielded):
Strategy Results
i.__________________________________ __________________________
___________________________________ __________________________
ii._________________________________ __________________________
___________________________________ __________________________
iii._________________________________ __________________________
___________________________________ __________________________

B-9
III. Individual Program Plan of Study and Support Activities
1. Total number of credits required for completing the program: ______
2. Please list the titles of all courses successfully completed by the Scholar/Fellow during the time period of _____ / _____ through _____ / _____ :
MM YY MM YY
Course Title
Credit Hours
Date Completed
Grade Earned
Example: Introduction to Psychology -- PSYCH 101
3
12/94
A

B-10
3. At the current course-taking pace, will Scholar/Fellow complete the program by the
expected date?
_____ No*
_____ Yes
* If not, what is a more realistic completion date? _____ / _____
MM YY
4. Place a check mark before each support service used by the Scholar/Fellow during the time period of _____ / _____ through _____ / _____ :
MM YY MM YY
_____ a. Orientation to program
_____ b. Academic advisement
_____ c. Academic tutoring
_____ d. Special seminars/workshops attended by Scholar (list topics):
_____________________________________________
_____________________________________________
_____________________________________________
_____________________________________________
_____ e. Other type of academic support (describe):
_____________________________________________
_____________________________________________
_____________________________________________
_____ f. Preparation/workshop for certification exams
_____ g. Mentoring
_____ h. Counseling
_____ i. Family support (e.g., child care) Continued on the next page

B-11
_____ j. Other (please describe):
_____________________________________________
_____________________________________________
_____________________________________________
_____________________________________________
5. Record of financial assistance provided to Scholar/Fellow by DeWitt Wallace Reader's Digest Fund during each academic year he/she has participated in program. In the last column, list the total amount of financial assistance provided to Scholar/Fellow by other sources.
Academic Year
Tuition/ Fees
Books
Other
Total
Estimated Non-DeWitt Wallace Funds
1989-90
$
$
$
$
$
1990-91
$
$
$
$
$
1991-92
$
$
$
$
$
1992-93
$
$
$
$
$
1993-94
$
$
$
$
$
1994-95
$
$
$
$
$
1995-96
$
$
$
$
$
1996-97
$
$
$
$
$
1997-98
$
$
$
$
$
Total
$
$
$
$
$

B-12
IV. Ongoing Monitoring of Student Progress:
1. Programs often monitor student progress in an ongoing manner. A variety of strategies can be used in this monitoring process, including periodic review of GPA, results of tests administered by the program, in-class performance, emerging portfolio, performance on key independent learning projects, performance in supervised internships, and student self-assessment. To help track the progress this Scholar/Fellow is making, place a check mark before each monitoring strategy the program has used, and summarize the latest results/scores:
Check Strategy Used
_____ a. GPA*
* For each academic year completed by the Scholar/Fellow, specify his/her GPA:
Academic Year GPA
1989-90 _____
1990-91 _____
1991-92 _____
1992-93 _____
1993-94 _____
1994-95 _____
1995-96 _____
1996-97 _____
1997-98 _____
Continued on the next page
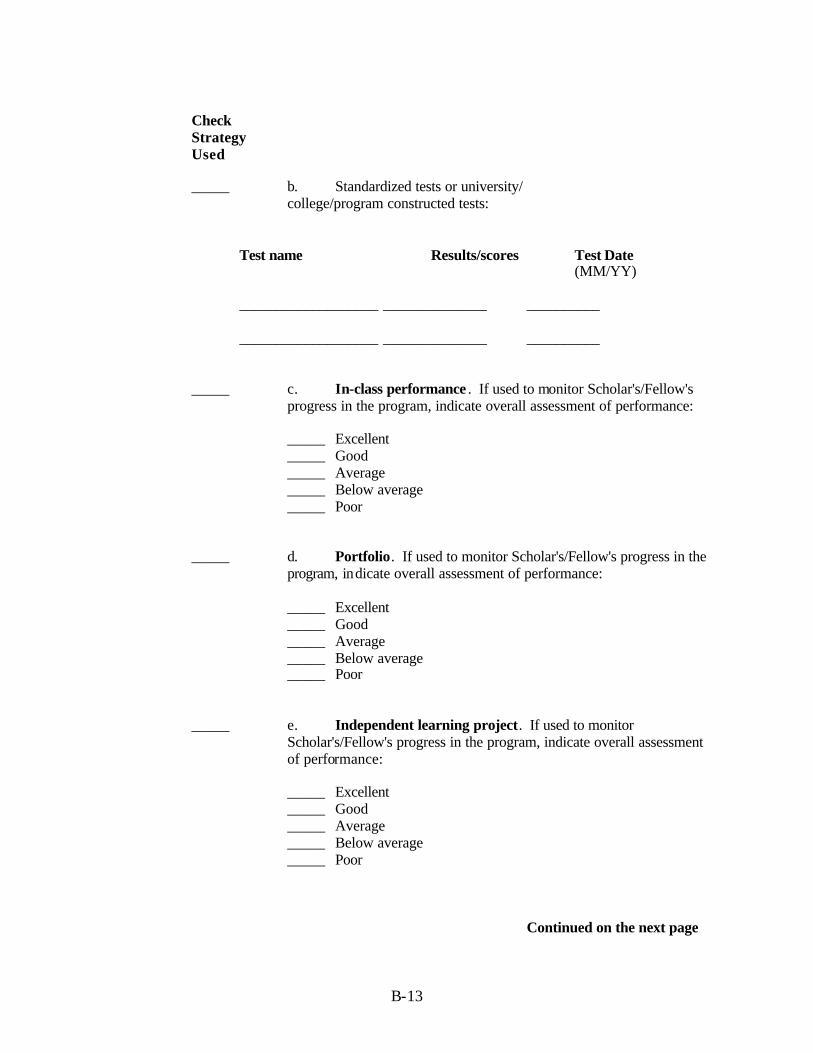
B-13
Check Strategy Used
_____ b. Standardized tests or university/
college/program constructed tests:
Test name Results/scores Test Date (MM/YY)
___________________ ______________ __________
___________________ ______________ __________
_____ c. In-class performance . If used to monitor Scholar's/Fellow's progress in the program, indicate overall assessment of performance:
_____ Excellent _____ Good _____ Average _____ Below average _____ Poor
_____ d. Portfolio. If used to monitor Scholar's/Fellow's progress in the program, indicate overall assessment of performance:
_____ Excellent _____ Good _____ Average _____ Below average _____ Poor
_____ e. Independent learning project. If used to monitor Scholar's/Fellow's progress in the program, indicate overall assessment of performance:
_____ Excellent _____ Good _____ Average _____ Below average _____ Poor
Continued on the next page

B-14
Check Strategy Used
_____ f. Supervised internship. If used to monitor Scholar's/Fellow's progress in the program, indicate:
i. How often was the Scholar/Fellow observed during the internship? ________
ii. Who conducted the observations? _______________________
iii. Overall assessment of performance: _____ Excellent
_____ Good _____ Average _____ Below average _____ Poor
_____ g. Student self-assessment. If used to monitor Scholar's/Fellow's progress in the program, indicate overall assessment of performance:
_____ Excellent _____ Good _____ Average _____ Below average _____ Poor
_____ h. Other strategies used to monitor student progress. Please describe both strategy and results.
Continued on the next page

B-15
Check Strategy Used
_____ i. Is this Scholar/Fellow currently on academic probation?
_____ No
_____ Yes*
* Probation period: ____ / ____ / ____ to ____ / ____ / ____ MM DD YY MM DD YY
Reason for probation:
_____________________________________________
_____________________________________________
_____________________________________________
_____________________________________________
2. Was this Scholar/Fellow on leave this year?
_____ No
_____ Yes
3. Did this Scholar/Fellow drop out of the program?
_____ No
_____ Yes. If so:
i. When did this occur? ____ / ____ / ____ MM DD YY
ii. Explain why:
_____________________________________________
_____________________________________________
_____________________________________________

B-16
V. Student Outcomes:
If Scholar/Fellow has completed the program, provide the following information:
1. Date of program completion: _____ / _____ MM YY
2. GPA upon program completion: _____
3. What degree did Scholar/Fellow earn?
___ No degree sought
___ Associate degree
___ Bachelor's degree
___ Masters degree
___ Other (describe): ____________________________________________
4. Did the Scholar/Fellow complete all the requirements for certification (e.g., completing courses and practica, and passing required tests)?
_____ No*
_____ Yes
* If not, please explain:
_____________________________________________
_____________________________________________
_____________________________________________
5. Did the Scholar/Fellow obtain a teaching certificate?
_____ Don't know
_____ No
_____ Yes*
* If so, in what area? ____________________________

B-17
6. Was the Scholar/Fellow hired to work in a school setting?
_____ Don't know
_____ No
_____ Yes. If so:
i. Provide name, telephone number and address of school:
School name: _____________________________________
School telephone number: ( ) ______ - _________
School address: __________________________________ Street Address
__________________________________ City State Zip Code
ii. When was he/she hired? _____ / _____
MM YY
iii. In which grade level(s) does he/she work? ___________
7. In what capacity was the Scholar/Fellow hired?
_____ as a teacher
_____ as an instructional aide
_____ as a substitute teacher
_____ other (specify): _____________________________
THANK YOU

B-18
DEWITT WALLACE-READER'S DIGEST FUND PATHWAYS TO TEACHING CAREERS PROGRAM
PARTICIPANT PROGRESS FORM--FOLLOW-UP
Period Covered: 06/96 - 05/97
(Please type or print) Scholar/Fellow:
a. Name: ________________________________________________________________ Last Name First Name Middle Initial
b. Social Security Number: ______ - ____ - ______
If Scholar/Fellow has changed address and/or telephone number, please update:
c. New Address: _________________________________________________
Street Address Apt. #
_________________________________________________ City State Zip Code
d. New Telephone number: ( ) ______ - __________
e. Sex: _____ Female _____Male
f. Race/Ethnicity: _____ African American/Black (non-Hispanic Americans)
_____ American Indian _____ Asian/Pacific Islander (Asians, South East Asians, Indians, etc.)
_____ Hispanic/Latino (regardless of race) _____ White (non-Hispanic) _____ Other (describe): _____________________
Institution: ___________________________________________________________________________ Admissions Information:
a. Date admitted into the program (month/year): ____/____
b. Date entered the program (month/year): ____/____

B-19
I. Scholar’s/Fellow’s Degree and Certification Goals:
1. Has this Scholar/Fellow changed his/her degree goals?
_____ No. Go to question 2.
_____ Yes. If so, has his/her _____ degree, _____ area of specialization, and/or _____ expected date of completion changed? (Mark all that apply.)
a. If Scholar/Fellow degree has changed, what type of degree is he/she now
seeking?
_____ associate
_____ bachelor’s
_____ master’s
_____ other (describe): ____________________________
b. If Scholar/Fellow area of specialization has changed, what is his/her new area of focus? ______________________________
c. If Scholar/Fellow expected date of completion has changed, what is the
new date? _____ / _____ MM YY
2. Has this Scholar/Fellow changed his/her certification goals?
___ No. Go to Section II.
___ Yes. If so, has his/her _____ type of certificate, _____ area of specialization, and/or _____ expected date of completion changed? (Mark all that apply.)
a. If Scholar/Fellow type of certificate has changed, what type is he/she
now seeking? ____________________________
b. If Scholar/Fellow area of specialization has changed, what is his/her new area of focus? ______________________________
c. If Scholar/Fellow expected date of completion has changed, what is the
new date? _____ / _____ MM YY

B-20
II. Individual Program Plan of Study and Support Activities
1. Did the Scholar/Fellow take courses between 06/96 and 05/97? ____ No. If not, please explain:
____ Yes. If so, please list the titles of all courses taken by the Scholar/Fellow during the time period of 06/96 through 05/97:
Course Title
Course
Number
Credit Hours
Date
Completed
Grade Earned
Transfer Credit? (yes/no)
Example: Introduction to Psychology
PSYCH 101
3
12/96
A
no

B-21

B-22
2. At the current course-taking pace, will Scholar/Fellow complete the program by the expected date?
_____ No*
_____ Yes
* If not, what is a more realistic completion
date? _____ / _____ MM YY
3. Place a check mark before each support service used by the Scholar/Fellow during the time period of 06/96 through 05/97:
_____ a. Orientation to program
_____ b. Academic advisement
_____ c. Academic tutoring
_____ d. Special seminars/workshops attended by Scholar (list topics):
_____________________________________________
_____________________________________________
_____________________________________________
_____________________________________________
_____ e. Other type of academic support (describe):
_____ f. Preparation/workshop for certification exams
_____ g. Mentoring
_____ h. Counseling
_____ i. Family support (e.g., child care)
_____ j. Other (please describe):
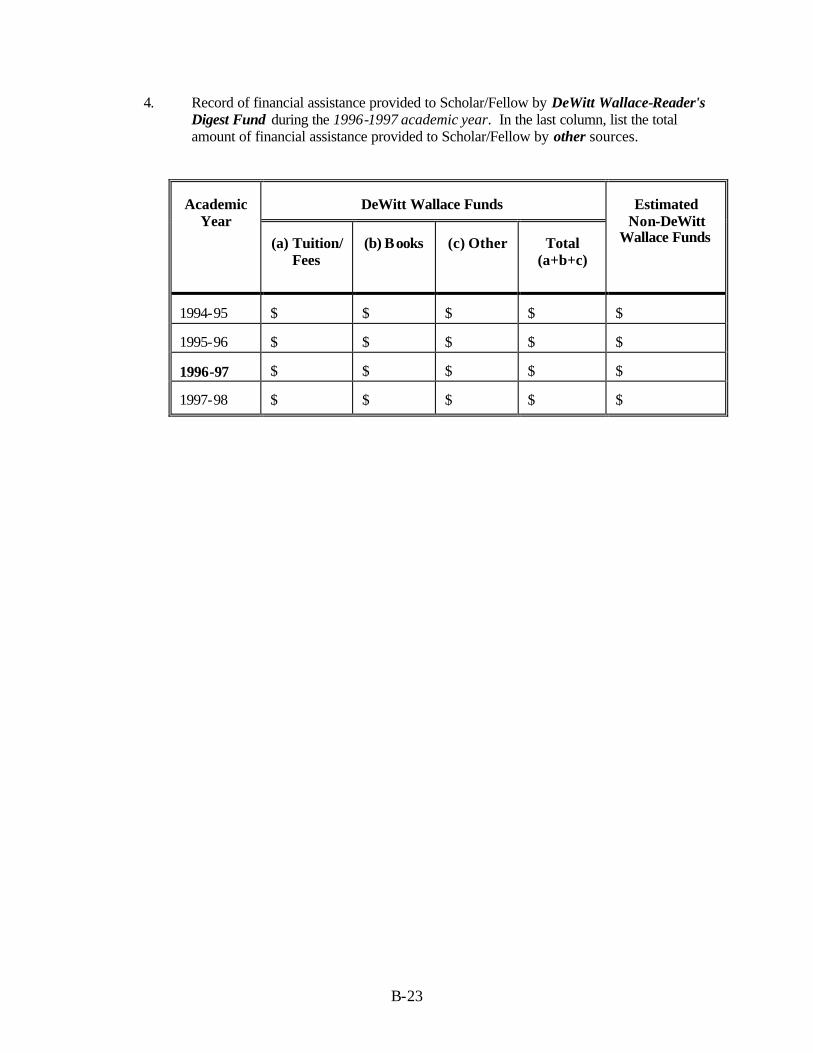
B-23
4. Record of financial assistance provided to Scholar/Fellow by DeWitt Wallace-Reader's Digest Fund during the 1996-1997 academic year. In the last column, list the total amount of financial assistance provided to Scholar/Fellow by other sources.
DeWitt Wallace Funds
Academic
Year (a) Tuition/
Fees
(b) Books
(c) Other
Total
(a+b+c)
Estimated
Non-DeWitt Wallace Funds
1994-95
$
$
$
$
$
1995-96
$
$
$
$
$
1996-97
$
$
$
$
$
1997-98
$
$
$
$
$
B-24
III. Ongoing Monitoring of Student Progress:
1. Programs often monitor student progress in an ongoing manner. A variety of strategies can be used in this monitoring process, including periodic review of GPA, results of tests administered by the program, in-class performance, emerging portfolio, performance on key independent learning projects, performance in supervised internships, and student self-assessment. To help track the progress this Scholar/Fellow is making, place a check mark before each monitoring strategy the program has used during the 1996-1997 academic year:
Check Strategy Used
_____ a. GPA
Χ Scholar=s/Fellow=s cumulative GPA: _____ as of ____ /____ MM YY
Χ Scholar=s/Fellow=s 1996-97 non-cumulative GPA:
Academic Year GPA
1989-90 _____
1990-91 _____
1991-92 _____
1992-93 _____
1993-94 _____
1994-95 _____
1995-96 _____
1996-97 _____
1997-98 _____

B-25
Check Strategy Used
_____ b. Standardized tests or university/
college/program constructed tests:
Test name Results/scores Test Date (MM/YY)
___________________ ______________ _____ / _____
___________________ ______________ _____ / _____
_____ c. In-class performance . If used to monitor Scholar's/Fellow's progress in the program, indicate overall assessment of performance:
_____ Excellent _____ Good _____ Average _____ Below average _____ Poor
_____ d. Portfolio. If used to monitor Scholar's/Fellow's progress in the program, indicate overall assessment of performance:
_____ Excellent _____ Good _____ Average _____ Below average _____ Poor

B-26
Check Strategy Used
_____ e. Independent learning project. If used to monitor
Scholar's/Fellow's progress in the program, indicate overall assessment of performance:
_____ Excellent _____ Good _____ Average _____ Below average _____ Poor
_____ f. Supervised internship. If used to monitor Scholar's/Fellow's
progress in the program, indicate:
i. How often was the Scholar/Fellow observed during the internship? _____ times per semester/quarter
for _____ semesters/quarters or _____ weeks (number) (circle one) (number)
ii. Who conducted the observations?
Title/Position:____________________________
iii. Overall assessment of performance: _____ Excellent _____ Good _____ Average _____ Below average _____ Poor
_____ g. Student self-assessment. If used to monitor Scholar's/Fellow's progress in the program, indicate overall assessment of performance:
_____ Excellent _____ Good _____ Average _____ Below average _____ Poor

B-27
Check Strategy Used
_____ h. Other strategies used to monitor student progress. Please describe both strategy and results.
_____ i. Is this Scholar/Fellow currently on academic probation?
_____ No
_____ Yes*
*Probation period: ____ / ____ / ____ to ____ / ____ / ____ MM DD YY MM DD YY
Reason for probation:
_____ j. Based on the evidence collected through the monitoring process, indicate how well this Scholar/Fellow is performing in the program:
_____ Excellent _____ Good _____ Average _____ Below average _____ Poor
2. Was this Scholar/Fellow on leave this academic year?
_____ No
_____ Yes

B-28
3. Did this Scholar/Fellow drop out of the program?
_____ No
_____ Yes. If so:
i. When did this occur? ____ / ____ / ____ MM DD YY
ii. Explain why:
IV. Student Outcomes:
Has Scholar/Fellow completed the program?
_____ No. If so, skip this section. You have completed this survey.
_____ Yes. If so, please provide the following information:
1. Date of program completion: _____ / _____ MM YY
2. GPA upon program completion: _____
3. What degree did Scholar/Fellow earn?
___ No degree sought
___ Associate degree
___ Bachelor’s degree
___ Master’s degree
___ Other (describe): ____________________________________________
4. Did the Scholar/Fellow complete all the requirements for full certification (e.g., completing courses and practica, and passing required tests)?
_____ No*
_____ Yes
* If not, please explain:

B-29
5. Did the Scholar/Fellow obtain full teaching certification?
_____ Don't know
_____ No
_____ Yes*
* If so, in what area? ____________________________
* Date of certification: ____ / ____
MM YY
6. Was the Scholar/Fellow hired to work in a school setting?
_____ Don't know
_____ No
_____ Yes. If so:
i. Provide name, telephone number and address of school:
School name: _____________________________________
School telephone number: ( ) ______ - _________
School address: __________________________________ Street Address
__________________________________ City State Zip Code
ii. When was he/she hired? _____ / _____
MM YY
iii. In which grade level(s) does he/she work? ___________
7. In what capacity was the Scholar/Fellow hired?
_____ as a teacher
_____ as an instructional aide
_____ as a substitute teacher
_____ other (specify): _____________________________

B-30
THANK YOU
DEWITT WALLACE-READER'S DIGEST FUND PATHWAYS TO TEACHING CAREERS PROGRAM
SCHOLAR/FELLOW SURVEY
(Please type or print)
Name: ____________________________________________________________________________
Last Name First Name Middle Initial Social Security Number: ______ - ____ - ______ Institution: __________________________________________________ I. General Information:
1. Date of birth: _____ / _____ / _____ MM DD YY
2. Place of birth: ______________ / ______________ / ______________
city state country
If born outside the U. S., in what year did you come to this country? _________
3. Do you speak a language other than English?
_____ No
_____ Yes*
* If so, which language(s)? __________________________________
4. Which of the following best characterizes you:
_____ White
_____ African American
_____ Hispanic/Latino
_____ Asian/Pacific Islander
_____ American Indian
_____ Other (describe): _____________________

B-31

B-32
5. Sex: _____ Male
_____ Female
6. Marital status: _____ Single
_____ Separated
_____ Married
_____ Widowed
_____ Divorced
7. Number of children: ______
Ages of children: _______________________________________
8. Family background information:
a. Mother:
i. Number of years completed in school: ______________
ii. Highest diploma/degree earned: ____________________
iii. Occupation ________________________________________
b. Father:
i. Number of years completed in school: ______________
ii. Highest diploma/degree earned: ____________________
iii. Occupation ________________________________________
c. Number of siblings: _______
9. What is your current employment status?
_____ Employed full-time
_____ Employed part-time
_____ Unemployed
10. Occupation: _____________________________________

B-33
11. Are you currently employed as a teacher or paraprofessional? (check only one):
_____ Not employed as a teacher or paraprofessional
_____ Teacher*
_____ Paraprofessional*
* If you are currently employed as either a teacher or paraprofessional:
a. Number of years in this position: ___________
b. Name and address of school:
_______________________________________________ School Name
_______________________________________________ Street Address
_______________________________________________ City State Zip Code
c. Grade you are currently teaching: ________________
d. Other grades you have taught in the past: _________________
e. Describe work experience with children or adolescents prior to your
current employment as a teacher or paraprofessional:
_____ No prior experience
_____ Prior experience (please describe): ____________________________________________________ ____________________________________________________ ____________________________________________________
12. If you are not currently employed as a teacher or paraprofessional, have you ever worked
with children or adolescents before?
_____ Does not apply (I am currently employed as a teacher or paraprofessional)
_____ No, I have never worked with children or adolescents
_____ Yes, I have worked with children or adolescents
If so, please describe this experience: ____________________________________________________ ____________________________________________________ ____________________________________________________

B-34
II. Educational History:
1. Where did you attend elementary school (if more than one, list the last school that you attended):
a. City in which school was located: __________________
b. State in which school was located: _________________
c. If outside the United States, in what country? _________________
2. Where did you attend secondary school (if more than one, list the last school that you
attended):
a. City in which school was located: __________________
b. State in which school was located: _________________
c. If outside the United States, in what country? __________________
3. How would you evaluate the academic preparation you received in K - 12?
_____ Excellent _____ Very Good _____ Good _____ Satisfactory _____ Poor _____ Very Poor
4. a. Which of the following descriptors best describes the best teacher you had in elementary
school? (Please check all that apply.)
_____ caring _____ kind _____ nurturing _____ gentle _____ patient _____ concerned about his or her students _____ creative in teaching style _____ available to students _____ encouraged independence _____ sensitive _____ established and maintained good rapport with students _____ made learning goals and instructional procedures clear to students _____ encouraged students to extend their thinking _____ stern _____ demanding _____ held high expectations for students _____ made the subject interesting and fun
Continued on next page

B-35
_____ was enthusiastic about the subject he or she taught _____ was enthusiastic about teaching _____ motivated students to learn _____ established and maintained consistent standards of classroom behavior _____ treated all students fairly _____ possessed cross cultural perspective (new) _____ created a student-centered classroom _____ used direct instruction, including lectures _____ was very knowledgeable about the subject being taught _____ other, please describe:
________________________________________________________________ ________________________________________________________________ ________________________________________________________________
4. b. Which of the following descriptors best describes the best teacher you had in secondary
school? (Please check all that apply.)
_____ caring _____ kind _____ nurturing _____ gentle _____ patient _____ concerned about his or her students _____ creative in teaching style _____ available to students _____ encouraged independence _____ sensitive _____ established and maintained good rapport with students _____ made learning goals and instructional procedures clear to students _____ encouraged students to extend their thinking _____ stern _____ demanding _____ held high expectations for students _____ made the subject interesting and fun _____ was enthusiastic about the subject he or she taught _____ was enthusiastic about teaching _____ motivated students to learn _____ established and maintained consistent standards of classroom behavior _____ treated all students fairly _____ possessed cross cultural perspective (new) _____ created a student-centered classroom _____ used direct instruction, including lectures _____ was very knowledgeable about the subject being taught _____ other, please describe:
________________________________________________________________ ________________________________________________________________ ________________________________________________________________

B-36
5. Upon entering the program, what was/were your strongest academic area(s)? Check as many as apply.
_____ Reading/language arts
_____ Literature
_____ Mathematics
_____ Science
_____ Social Studies
_____ History
_____ Geography
_____ Other:
________________________________________________ ________________________________________________ ________________________________________________
6. In which academic area(s) do you need most improvement? (check all that apply):
_____ Reading/language arts
_____ Mathematics
_____ Science
_____ Social studies
_____ History
_____ Geography
_____ Other (describe):
_______________________________________________________ _______________________________________________________ _______________________________________________________
III. Professional Goals:
1. What are your long term professional goals? (Please check all that apply.)
_____ Be an elementary school teacher _____ Be a secondary teacher _____ Be a community college teacher _____ Be a school administrator (e.g., principal) _____ Be a counselor _____ Be a specialist (e.g., reading specialist, mathematics specialist)

B-37
_____ Obtain an advanced degree in the field of education
_____ Obtain an advanced degree in a field other than education _____ Stay in education for a few years and then go on to another profession _____ To start a school _____ Other, please describe:
_________________________________________________________________ _________________________________________________________________
2. How will this program help you work toward those goals? (Please check all that apply.)
_____ By helping me obtain teaching certification
_____ By helping me obtain a degree
_____ By helping me become a better teacher
_____ By providing me with academic support to complete my degree and/or become certified to teach
_____ By providing me with professional support (e.g., workshops and pedagogical
issues, feedback on my teaching)
_____ Other, please describe _________________________________________________________________ _________________________________________________________________ _________________________________________________________________
IV. You and Teaching:
1. What, in your view, is the role of the teacher? (Please check all that apply.)
_____ To serve as role model for students
_____ To serve as role model for parents
_____ To help students develop academically
_____ To provide broader support for students -- by acting as parents, psychologists, social workers, nurses, etc.-- according to the students' needs
_____ To help students develop socially
_____ To make learning interesting and fun
_____ To motivate students to do well in their classes
_____ To instill in students the love of learning
_____ To instill in students a sense of self-worth

B-38
_____ To help students become responsible citizens and productive members of the communities in which they live
_____ To address critical needs for disadvantaged groups
_____ Other, please describe:
_________________________________________________________________ _________________________________________________________________ _________________________________________________________________
2. Background and Experiences:
a. What relevant background and experiences do you personally bring to teaching?
(Please check all that apply.)
_____ Prior experience working with children
_____ Personal qualities (e.g., creativity, sensitivity, determination, flexibility, high level of energy, sense of responsibility, etc.)
_____ Personal skills (e.g., ability to interact with people )
_____ Fluency in a language other than English
_____ Knowledge about, and appreciation of, minority cultures and experiences
_____ New ways of looking at teaching and learning
_____ I have lived in conditions similar to those in which my students live
_____ I have lived or been educated in settings in which I was in the cultural
minority
_____ Other, please describe: __________________________________________________________ __________________________________________________________ __________________________________________________________
b. How will you relate your background knowledge and experiences to your
teaching? (Please check all that apply.)
_____ designing and selecting materials
_____ designing learning activities
_____ designing evaluation strategies
_____ establishing relationships with students
_____ interacting with students in culturally-relevant ways

B-39
_____ motivating students to do well both in school and beyond
_____ making content comprehensible to students (e.g., using culturally-relevant analogies, examples, stories)
_____ establishing relationships with parents or guardians
_____ tapping community resources
_____ other, please describe:
__________________________________________________________ __________________________________________________________ __________________________________________________________
3. Why do you want to be a teacher? (Please check all that apply.)
_____ I love children
_____ I had a powerful teaching experience which motivated me to become a teacher
_____ I love teaching
_____ I can make a difference in how and what students learn
_____ I want to do something constructive for my community
_____ To help empower students
_____ To help empower parents
_____ To teach students to take pride in their cultural backgrounds
_____ I can make the learning process fun and meaningful for students
_____ Other, please describe:
_________________________________________________________________ _________________________________________________________________ _________________________________________________________________
V. Self-Assessment:
This section is intended to collect information regarding your perception of your own skills at the time you first became a Pathways Fellow/Scholar.
Using a scale of 1 (lowest rating) to 4 (highest rating), rate yourself on each of the following:
Rating (1-4)
a. Leadership skills _____
b. Decision-making skills _____

B-40
c. Flexibility and adaptability _____
d. Analytical skills _____
e. Study habits _____
f. Empathy _____
g. Interpersonal skills _____
h. Self-esteem _____
i. Organization and planning _____
j. Ability to question _____
k. Creativity _____
l. Level of energy _____
m. Perseverance _____
n. Self-confidence _____
o. Conflict Management _____
THANK YOU

B-41
DEWITT WALLACE-READER'S DIGEST FUND PATHWAYS TO TEACHING CAREERS PROGRAM
SCHOLAR'S/FELLOW'S TEACHING EFFECTIVENESS: FIELD EXPERIENCE SUPERVISOR SURVEY
(Please type or print) Name of Scholar/Fellow: ___________________________________________________________________________
Last Name First Name Middle Initial Grade(s) taught: _____________________________________________________________________ Institution: _________________________________________________________________________ Supervisor's information:
a. Name: _____________________________________________________________________________ Last Name First Name Middle Initial
b. Position: _______________________________________________________________
c. Telephone number: ( ) ______ - _________
d. How many years have you been supervising teacher education field experiences: ______
e. Approximately how many students have you supervised to date: ______
As part of the supervised field experience that served as the basis for your assessment of this Fellow/Scholar, approximately how many times did you observe this Scholar/Fellow while teaching? _____ times. Date survey was completed: _____ / _____ / _____
MM DD YY Using a scale of 5 to 1, rate the teaching effectiveness of the Scholar/Fellow whose name appears above. The rating of 5 indicates the highest rating of effectiveness, and the rating of 1 indicates the lowest level of effectiveness. In arriving at your rating, please compare the Scholar/Fellow to other teachers -to-be or novice teachers that you have supervised over the years. If you do not have sufficient information to evaluate the Scholar/Fellow on any specific skill, circle II (insufficient information).

B-42
A. Organizing Content Knowledge for Student Learning: The five items listed below refer to the Scholar's/Fellow's knowledge of the
content he or she teaches, knowledge of the students in the class, and skills in planning instruction.
A1. Is familiar with relevant background knowledge and experiences of students in the class
Highest Lowest Insufficient Information
5 4 3 2 1 II
A2. Articulates clear learning goals for the lesson that are appropriate for the students
5 4 3 2 1 II
A3. When teaching a lesson, the Fellow/Scholar demonstrates an understanding of the connections between the content that his/her student learned previously, the content of the specific lesson, and the content that remains to be learned by the student in the future
5 4 3 2 1 II
A4. Creates or selects teaching methods, learning activities, and instructional materials that are appropriate for the students and that are aligned with the goals of the lesson
5 4 3 2 1 II
A5. Creates or selects evaluation strategies that are appropriate for the students and that are aligned with the goals of the lesson
5 4 3 2 1 II
Summary rating of the Scholar's/Fellow's skills in organizing content knowledge for student learning
5 4 3 2 1 II
B-43
B. Creating an Environment for Student Learning: The five items listed below refer to the Scholar's/Fellow's skills in creating a positive
environment for learning, particularly as it relates to the relationships among members of the classroom community. To the extent that it affects learning, the physical environment is also included in this list.
B1. Creates a climate that promotes fairness
Highest Lowest Insufficient Information
5 4 3 2 1 II
B2. Establishes and maintains rapport with most students
5 4 3 2 1 II
B3. Communicates challenging learning expectations to each student
5 4 3 2 1 II
B4. Establishes and maintains consistent standards of classroom behavior
5 4 3 2 1 II
B5. Makes the physical environment as safe and conducive to learning as possible
5 4 3 2 1 II
Summary rating of the Scholar's/Fellow's skills in creating an environment for student learning
5 4 3 2 1 II
B-44
C. Teaching for Student Learning: The six items listed below refer to the Scholar's/Fellow's skills in implementing a lesson.
C1. Makes learning goals and instructional procedures clear to students
Highest Lowest Insufficient Information
5 4 3 2 1 II
C2. Makes content comprehensible to students
5 4 3 2 1 II
C3. Encourages students to extend their thinking
5 4 3 2 1 II
C4. Monitors students' understanding of content, provides feedback to students to assist learning, and adjusts learning activities as the situation demands
5 4 3 2 1 II
C5. Uses instructional time to the fullest advantage
5 4 3 2 1 II
C6. Uses a variety of teaching strategies to involve students in their own learning
5 4 3 2 1 II
Summary rating of the Scholar's/Fellow's skills in teaching for student learning
5 4 3 2 1 II
B-45
D. Professionalism: The four items listed below refer to the Scholar's/Fellow's professional behavior.
D1. Reflects on the extent to which the learning goals were met
Highest Lowest Insufficient Information
5 4 3 2 1 II
D2. Perseveres in efforts to improve student learning
5 4 3 2 1 II
D3. Builds professional relationships with other educators
5 4 3 2 1 II
D4. Communicates with parents or guardians regularly about student learning
5 4 3 2 1 II
Summary rating of the Scholar's/Fellow's professionalism
5 4 3 2 1 II
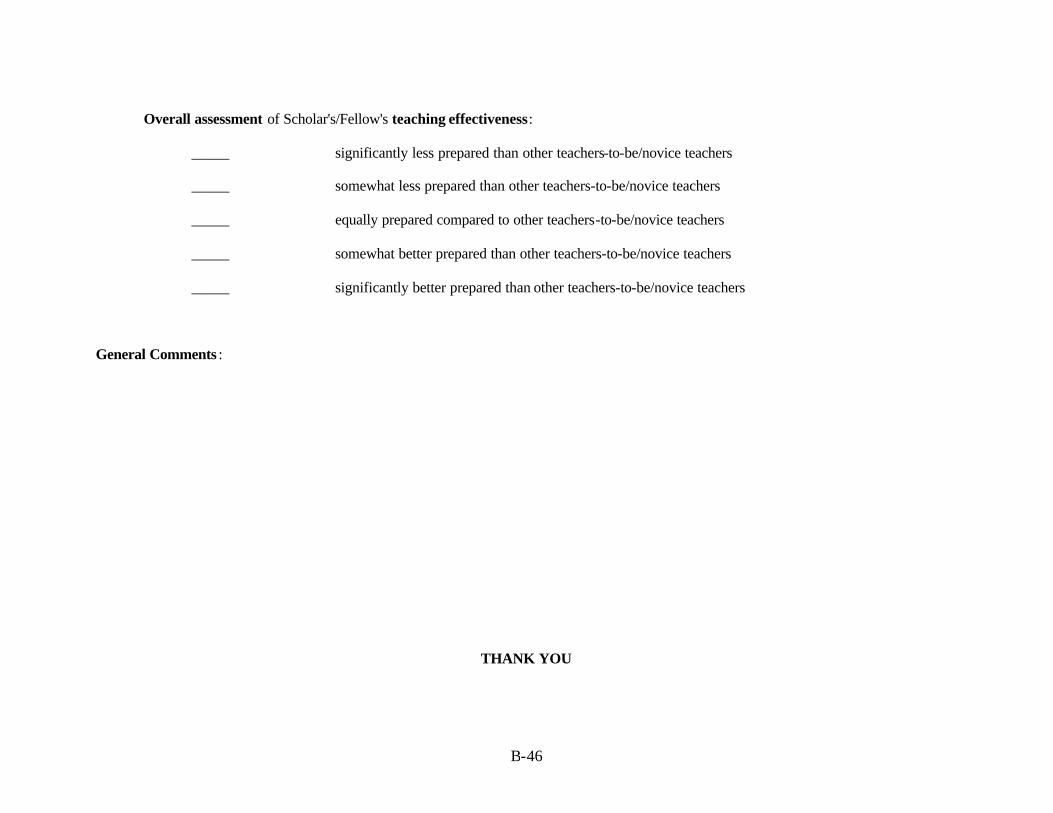
B-46
Overall assessment of Scholar's/Fellow's teaching effectiveness:
_____ significantly less prepared than other teachers-to-be/novice teachers
_____ somewhat less prepared than other teachers-to-be/novice teachers
_____ equally prepared compared to other teachers-to-be/novice teachers
_____ somewhat better prepared than other teachers-to-be/novice teachers
_____ significantly better prepared than other teachers-to-be/novice teachers
General Comments :
THANK YOU

B-47
Version used in Survey years 1-4 DEWITT WALLACE-READER'S DIGEST FUND PATHWAYS TO TEACHING CAREERS PROGRAM GRADUATE'S TEACHER EFFECTIVENESS: PRINCIPAL/BUILDING SUPERVISOR (OR DESIGNEE) SURVEY (Please type or print) Name of teacher: _________________________________________________________________________
Last Name First Name Middle Initial Name of school: __________________________________________________________________________ Grade(s) taught by the teacher: _____________________________________________________________ Number of students taught by the teacher: ______ Institution from which the teacher graduated/obtained certification requirements: _________________________ Person completing the survey:
a. Name: ______________________________________________________________________ Last Name First Name Middle Initial
b. Position: ________________________________________
c. Telephone number: ( ) ______ - _________
d. Years experience as principal/building supervisor: ______
e. In total, approximately how many novice teachers have you supervised to date: ______
Date survey was completed: _____ / _____ / _____
MM DD YY How often have you supervised this teacher? _________

B-48
Using a scale of 5 to 1, rate the teaching effectiveness of the teacher whose name appears above. The rating of 5 indicates the highest rating of effectiveness, and the rating of 1 indicates the lowest level of effectiveness. In arriving at your rating, please compare the teacher to other novice teachers that you have supervised over the years. If you do not have sufficient information to evaluate this teacher on any specific skill, circle II (insuffic ient information). A. Organizing Content Knowledge for Student Learning: The five items listed below refer to the teacher's knowledge of the content he or
she teaches, knowledge of the students in the class, and skills in planning instruction.
A1. Is familiar with relevant background knowledge and experiences of students in the class
Highest Lowest Insufficient Information
5 4 3 2 1 II
A2. Articulates clear learning goals for the lesson that are appropriate for the students
5 4 3 2 1 II
A3. When teaching a lesson, the teacher demonstrates an understanding of the connections between the content that his/her student learned previously, the content of the specific lesson, and the content that remains to be learned by the student in the future
5 4 3 2 1 II
A4. Creates or selects teaching methods, learning activities, and instructional materials that are appropriate for the students and that
are aligned with the goals of the lesson
5 4 3 2 1 II
A5. Creates or selects evaluation strategies that are appropriate for the students and that are aligned with the goals of the lesson
5 4 3 2 1 II
Summary rating of the teacher's skills in organizing content knowledge for student learning
5 4 3 2 1 II
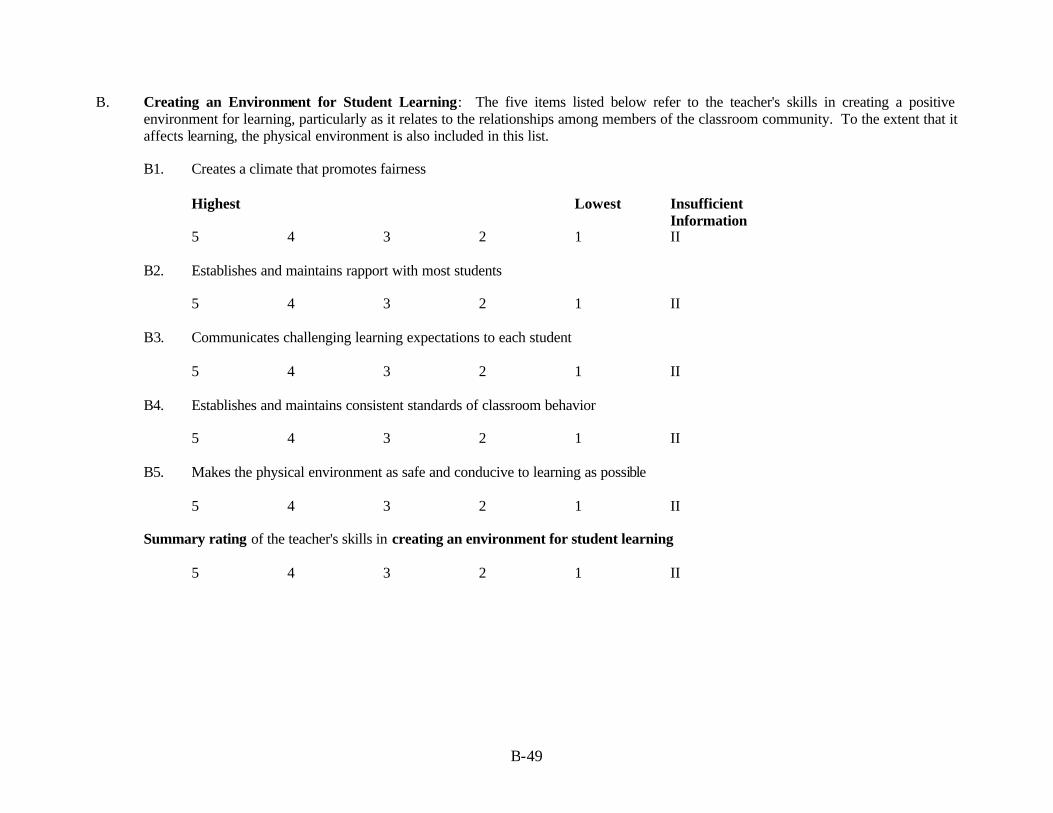
B-49
B. Creating an Environment for Student Learning: The five items listed below refer to the teacher's skills in creating a positive environment for learning, particularly as it relates to the relationships among members of the classroom community. To the extent that it affects learning, the physical environment is also included in this list.
B1. Creates a climate that promotes fairness
Highest Lowest Insufficient
Information 5 4 3 2 1 II
B2. Establishes and maintains rapport with most students
5 4 3 2 1 II
B3. Communicates challenging learning expectations to each student
5 4 3 2 1 II
B4. Establishes and maintains consistent standards of classroom behavior
5 4 3 2 1 II
B5. Makes the physical environment as safe and conducive to learning as possible
5 4 3 2 1 II
Summary rating of the teacher's skills in creating an environment for student learning
5 4 3 2 1 II

B-50
C. Teaching for Student Learning: The six items listed below refer to the teacher's skills in implementing a lesson.
C1. Makes learning goals and instructional procedures clear to students
Highest Lowest Insufficient Information
5 4 3 2 1 II
C2. Makes content comprehensible to students
5 4 3 2 1 II
C3. Encourages students to extend their thinking
5 4 3 2 1 II
C4. Monitors students' understanding of content, provides feedback to students to assist learning, and adjusts learning activities as the situation demands
5 4 3 2 1 II
C5. Uses instructional time to the fullest advantage
5 4 3 2 1 II
C6. Uses a variety of teaching strategies to involve students in their own learning
5 4 3 2 1 II
Summary rating of the teacher's skills in teaching for student learning
5 4 3 2 1 II
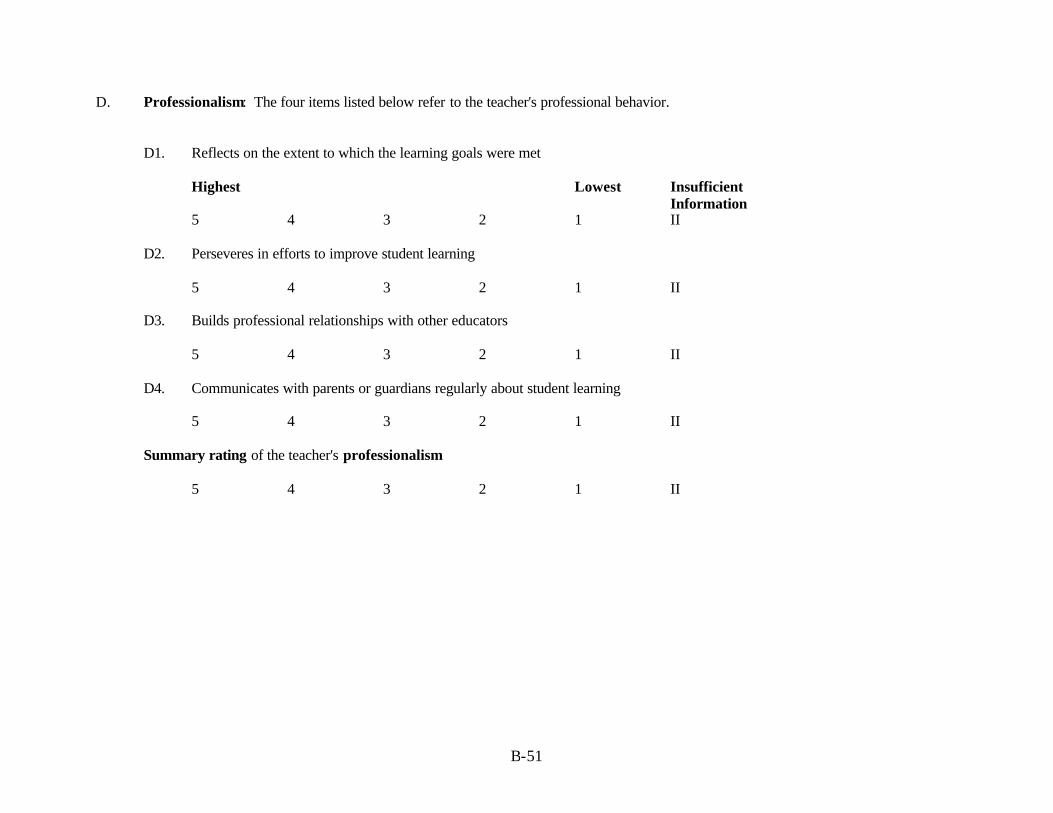
B-51
D. Professionalism: The four items listed below refer to the teacher's professional behavior.
D1. Reflects on the extent to which the learning goals were met
Highest Lowest Insufficient Information
5 4 3 2 1 II
D2. Perseveres in efforts to improve student learning
5 4 3 2 1 II
D3. Builds professional relationships with other educators
5 4 3 2 1 II
D4. Communicates with parents or guardians regularly about student learning
5 4 3 2 1 II
Summary rating of the teacher's professionalism
5 4 3 2 1 II

B-52
Overall assessment of teacher's effectiveness:
_____ significantly less prepared than other novice teachers
_____ somewhat less prepared than other novice teachers
_____ equally prepared compared to other novice teachers
_____ somewhat better prepared than other novice teachers
_____ significantly better prepared than other novice teachers E. General Comments :
THANK YOU

B-53
Version used in Survey years 5-6
DEWITT WALLACE-READER'S DIGEST FUND PATHWAYS TO TEACHING CAREERS PROGRAM
GRADUATE'S TEACHER EFFECTIVENESS: PRINCIPAL/BUILDING SUPERVISOR (OR DESIGNEE) SURVEY
(Please type or print) Name of teacher:
Last Name First Name Name of school: Grade(s) taught by the teacher: Number of students taught by the teacher: Institution from which the teacher graduated/obtained certification requirements: Person completing the survey: a. Name: b. Position: c. Telephone number: ( ) ______ - _________ d. Years of experience as principal/building supervisor: ______ e. In total, approximately how many novice teachers have you supervised to date: ______ Date survey was completed: _____ / _____ / _____ MM DD YY How often have you supervised this teacher? (If possible, indicate number of times) _________
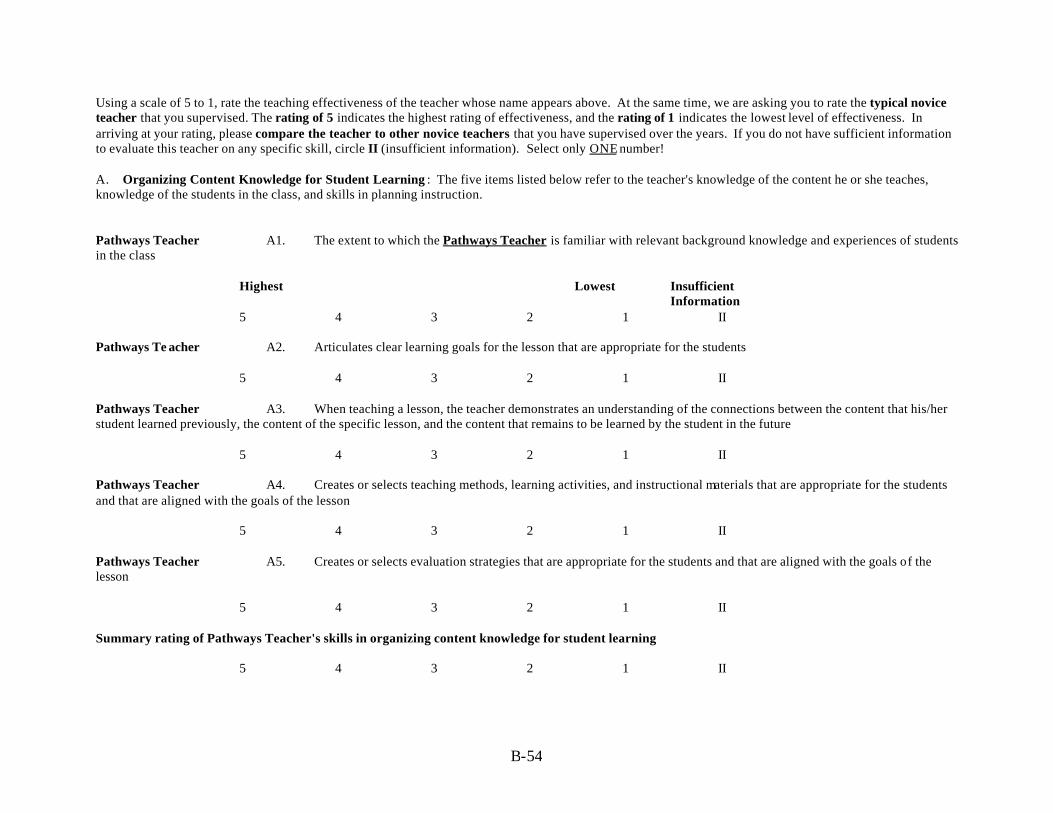
B-54
Using a scale of 5 to 1, rate the teaching effectiveness of the teacher whose name appears above. At the same time, we are asking you to rate the typical novice teacher that you supervised. The rating of 5 indicates the highest rating of effectiveness, and the rating of 1 indicates the lowest level of effectiveness. In arriving at your rating, please compare the teacher to other novice teachers that you have supervised over the years. If you do not have sufficient information to evaluate this teacher on any specific skill, circle II (insufficient information). Select only ONE number! A. Organizing Content Knowledge for Student Learning : The five items listed below refer to the teacher's knowledge of the content he or she teaches, knowledge of the students in the class, and skills in planning instruction. Pathways Teacher A1. The extent to which the Pathways Teacher is familiar with relevant background knowledge and experiences of students in the class
Highest Lowest Insufficient Information 5 4 3 2 1 II
Pathways Te acher A2. Articulates clear learning goals for the lesson that are appropriate for the students
5 4 3 2 1 II Pathways Teacher A3. When teaching a lesson, the teacher demonstrates an understanding of the connections between the content that his/her student learned previously, the content of the specific lesson, and the content that remains to be learned by the student in the future
5 4 3 2 1 II Pathways Teacher A4. Creates or selects teaching methods, learning activities, and instructional materials that are appropriate for the students and that are aligned with the goals of the lesson
5 4 3 2 1 II Pathways Teacher A5. Creates or selects evaluation strategies that are appropriate for the students and that are aligned with the goals of the lesson
5 4 3 2 1 II Summary rating of Pathways Teacher's skills in organizing content knowledge for student learning
5 4 3 2 1 II
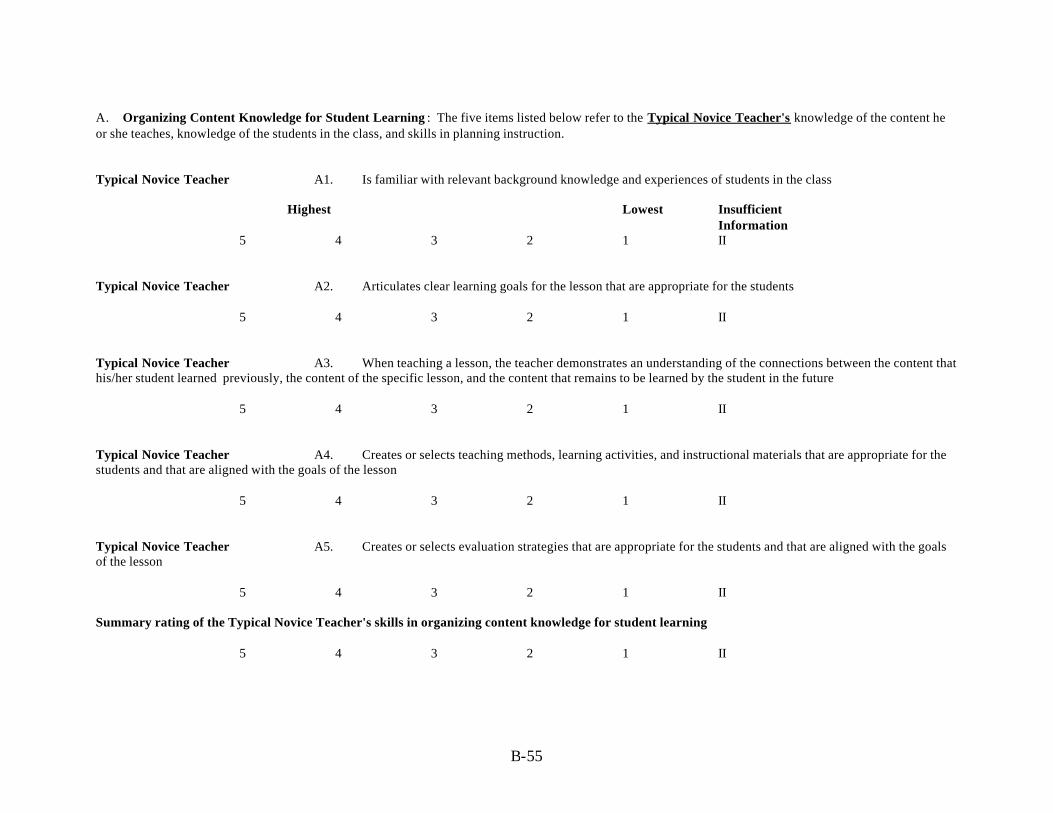
B-55
A. Organizing Content Knowledge for Student Learning : The five items listed below refer to the Typical Novice Teacher's knowledge of the content he or she teaches, knowledge of the students in the class, and skills in planning instruction. Typical Novice Teacher A1. Is familiar with relevant background knowledge and experiences of students in the class
Highest Lowest Insufficient Information 5 4 3 2 1 II
Typical Novice Teacher A2. Articulates clear learning goals for the lesson that are appropriate for the students
5 4 3 2 1 II Typical Novice Teacher A3. When teaching a lesson, the teacher demonstrates an understanding of the connections between the content that his/her student learned previously, the content of the specific lesson, and the content that remains to be learned by the student in the future
5 4 3 2 1 II Typical Novice Teacher A4. Creates or selects teaching methods, learning activities, and instructional materials that are appropriate for the students and that are aligned with the goals of the lesson
5 4 3 2 1 II Typical Novice Teacher A5. Creates or selects evaluation strategies that are appropriate for the students and that are aligned with the goals of the lesson
5 4 3 2 1 II Summary rating of the Typical Novice Teacher's skills in organizing content knowledge for student learning
5 4 3 2 1 II
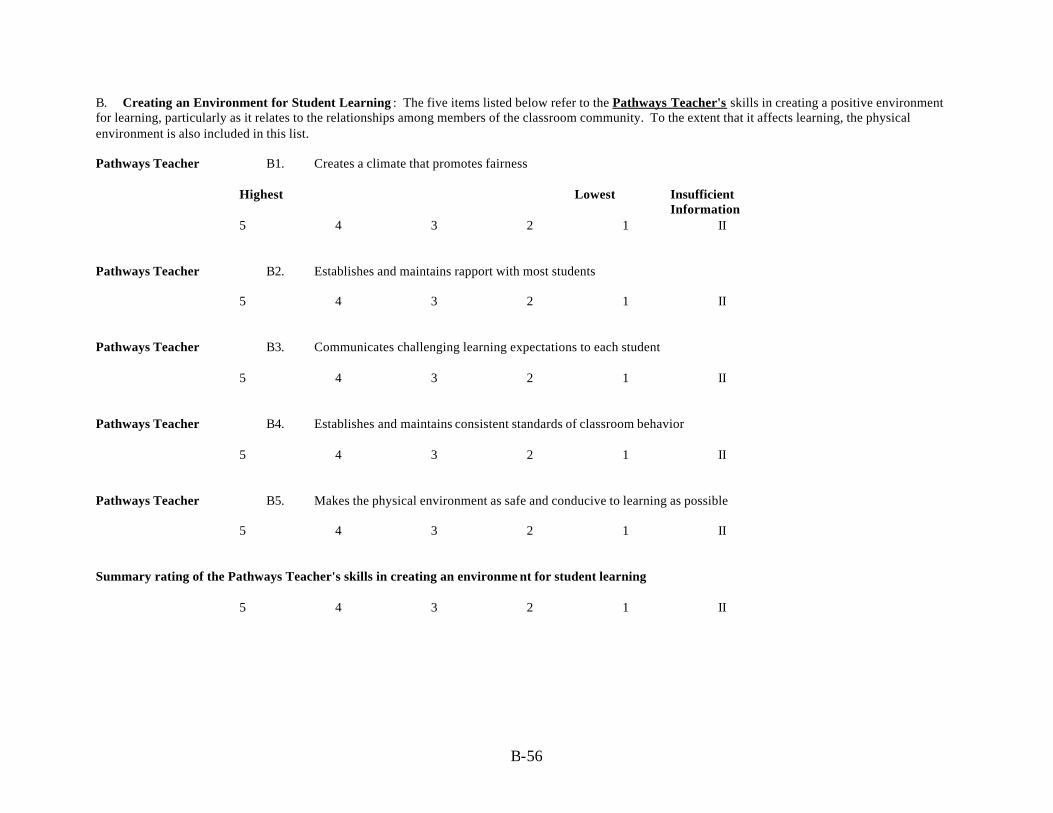
B-56
B. Creating an Environment for Student Learning : The five items listed below refer to the Pathways Teacher's skills in creating a positive environment for learning, particularly as it relates to the relationships among members of the classroom community. To the extent that it affects learning, the physical environment is also included in this list. Pathways Teacher B1. Creates a climate that promotes fairness
Highest Lowest Insufficient Information 5 4 3 2 1 II
Pathways Teacher B2. Establishes and maintains rapport with most students
5 4 3 2 1 II Pathways Teacher B3. Communicates challenging learning expectations to each student
5 4 3 2 1 II Pathways Teacher B4. Establishes and maintains consistent standards of classroom behavior
5 4 3 2 1 II Pathways Teacher B5. Makes the physical environment as safe and conducive to learning as possible
5 4 3 2 1 II Summary rating of the Pathways Teacher's skills in creating an environme nt for student learning
5 4 3 2 1 II

B-57
B. Creating an Environment for Student Learning : The five items listed below refer to the Typical Novice Teacher's skills in creating a positive environment for learning, particularly as it relates to the relationships among members of the classroom community. To the extent that it affects learning, the physical environment is also included in this list. Typical Novice Teacher B1. Creates a climate that promotes fairness
Highest Lowest Insufficient Information 5 4 3 2 1 II
Typical Novice Teacher B2. Establishes and maintains rapport with most students
5 4 3 2 1 II Typical Novice Teacher B3. Communicates challenging learning expectations to each student
5 4 3 2 1 II Typical Novice Teacher B4. Establishes and maintains consistent standards of classroom behavior
5 4 3 2 1 II Typical Novice Teacher B5. Makes the physical environment as safe and conducive to learning as possible
5 4 3 2 1 II Summary rating of the Typical Novice Teacher's skills in creating an environment for student learning
5 4 3 2 1 II
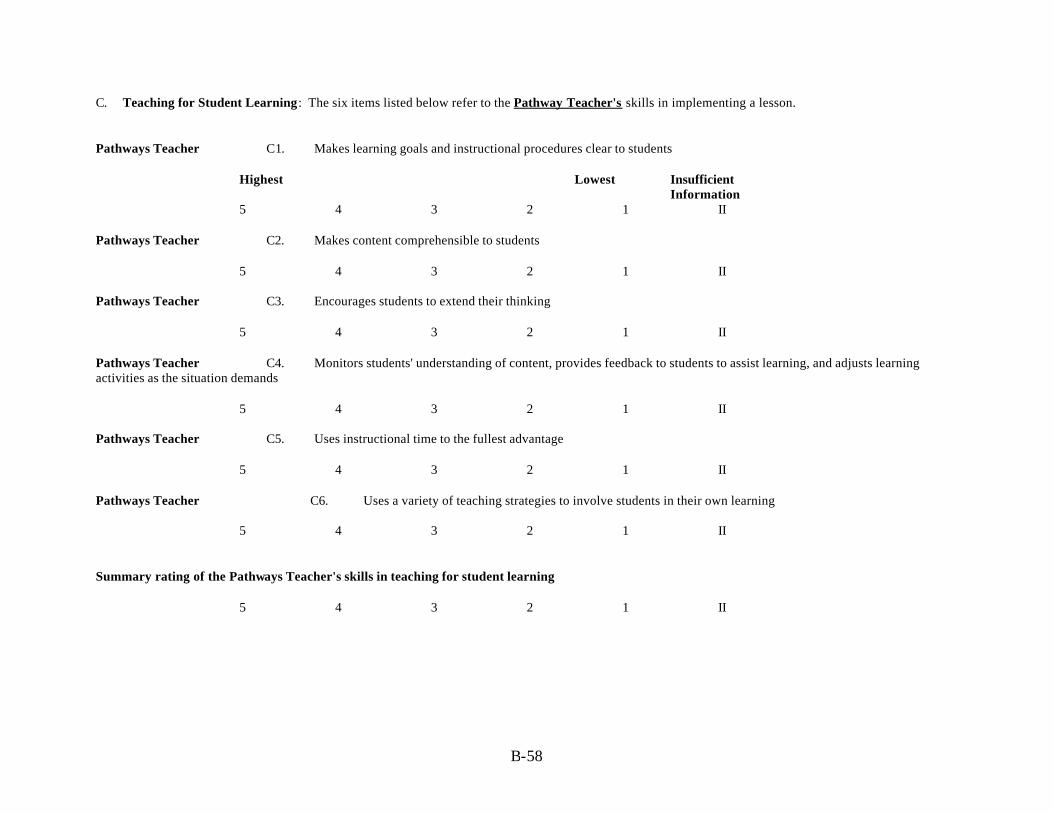
B-58
C. Teaching for Student Learning : The six items listed below refer to the Pathway Teacher's skills in implementing a lesson. Pathways Teacher C1. Makes learning goals and instructional procedures clear to students
Highest Lowest Insufficient Information 5 4 3 2 1 II
Pathways Teacher C2. Makes content comprehensible to students
5 4 3 2 1 II Pathways Teacher C3. Encourages students to extend their thinking
5 4 3 2 1 II Pathways Teacher C4. Monitors students' understanding of content, provides feedback to students to assist learning, and adjusts learning activities as the situation demands
5 4 3 2 1 II Pathways Teacher C5. Uses instructional time to the fullest advantage
5 4 3 2 1 II Pathways Teacher C6. Uses a variety of teaching strategies to involve students in their own learning
5 4 3 2 1 II Summary rating of the Pathways Teacher's skills in teaching for student learning
5 4 3 2 1 II

B-59
C. Teaching for Student Learning : The six items listed below refer to the Typical Novice Teacher's skills in implementing a lesson. Typical Novice Teacher C1. Makes learning goals and instructional procedures clear to students
Highest Lowest Insufficient Information 5 4 3 2 1 II
Typical Novice Teacher C2. Makes content comprehensible to students
5 4 3 2 1 II Typical Novice Teacher C3. Encourages students to extend their thinking
5 4 3 2 1 II Typical Novice Teacher C4. Monitors students' understanding of content, provides feedback to students to assist learning, and adjusts learning activities as the situation demands
5 4 3 2 1 II Typical Novice Teacher C5. Uses instructional time to the fullest advantage
5 4 3 2 1 II Typical Novice Teacher C6. Uses a variety of teaching strategies to involve students in their own learning
5 4 3 2 1 II Summary rating of the Typical Novi ce Teacher's skills in teaching for student learning
5 4 3 2 1 II
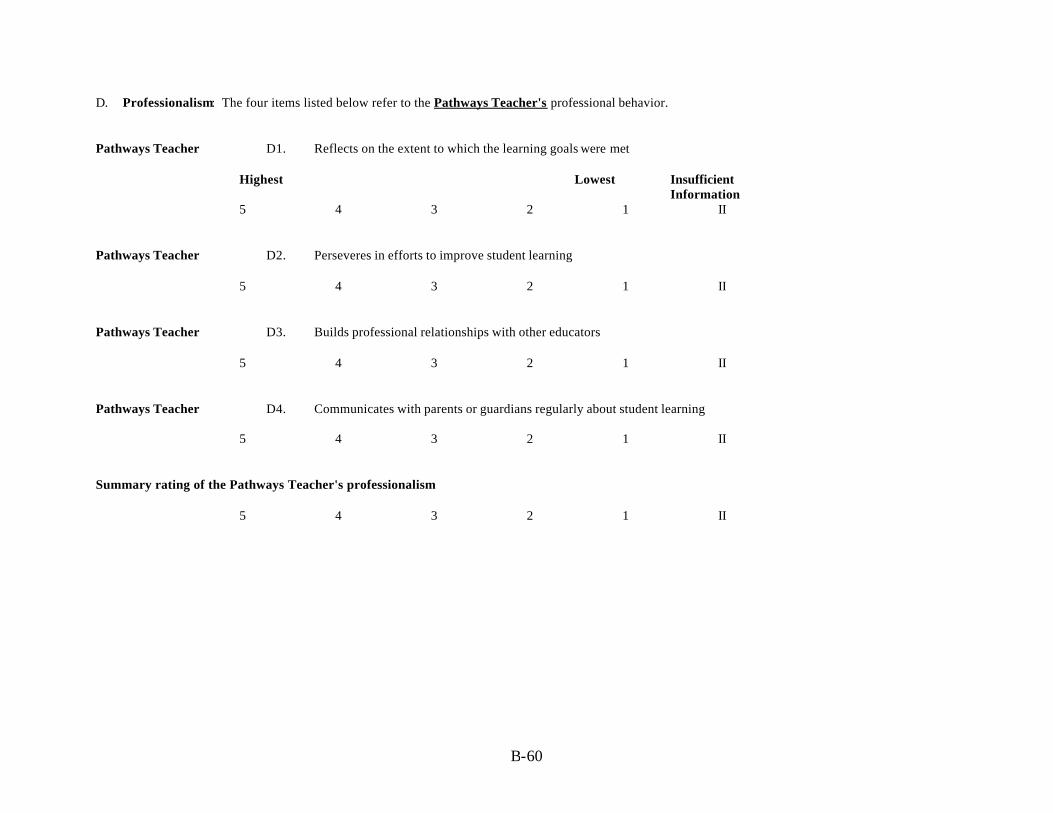
B-60
D. Professionalism: The four items listed below refer to the Pathways Teacher's professional behavior. Pathways Teacher D1. Reflects on the extent to which the learning goals were met
Highest Lowest Insufficient Information 5 4 3 2 1 II
Pathways Teacher D2. Perseveres in efforts to improve student learning
5 4 3 2 1 II Pathways Teacher D3. Builds professional relationships with other educators
5 4 3 2 1 II Pathways Teacher D4. Communicates with parents or guardians regularly about student learning
5 4 3 2 1 II Summary rating of the Pathways Teacher's professionalism
5 4 3 2 1 II
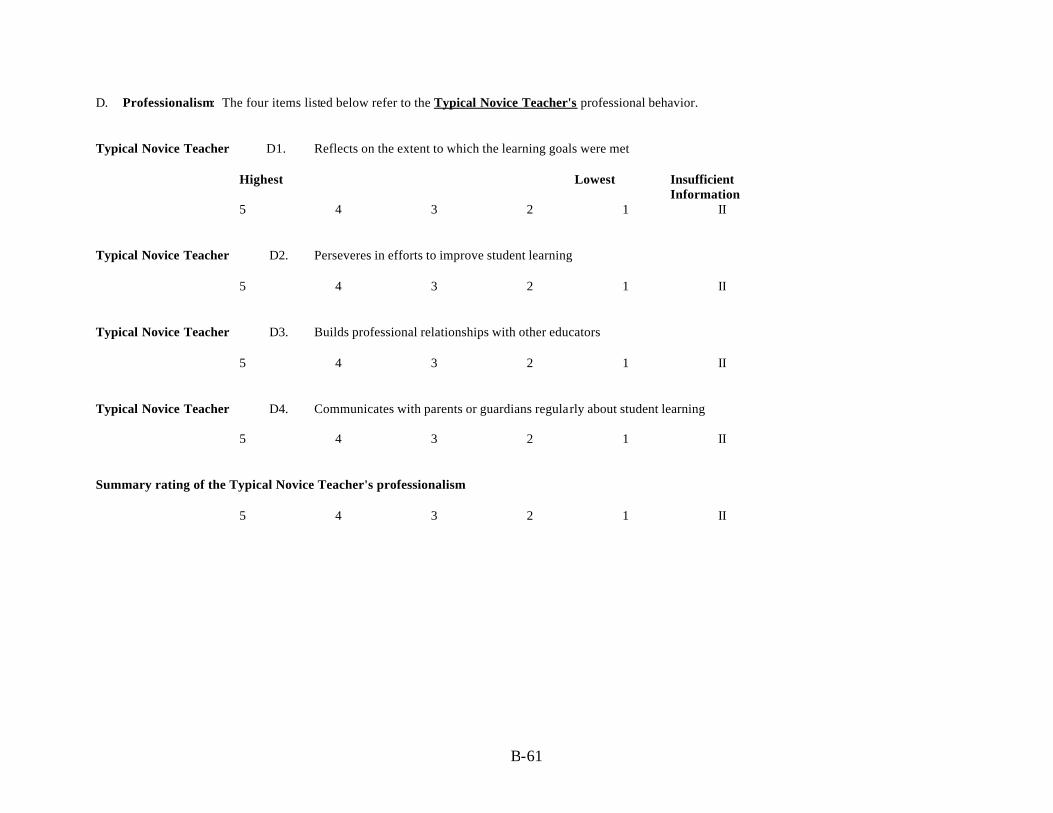
B-61
D. Professionalism: The four items listed below refer to the Typical Novice Teacher's professional behavior. Typical Novice Teacher D1. Reflects on the extent to which the learning goals were met
Highest Lowest Insufficient Information 5 4 3 2 1 II
Typical Novice Teacher D2. Perseveres in efforts to improve student learning
5 4 3 2 1 II Typical Novice Teacher D3. Builds professional relationships with other educators
5 4 3 2 1 II Typical Novice Teacher D4. Communicates with parents or guardians regularly about student learning
5 4 3 2 1 II Summary rating of the Typical Novice Teacher's professionalism
5 4 3 2 1 II
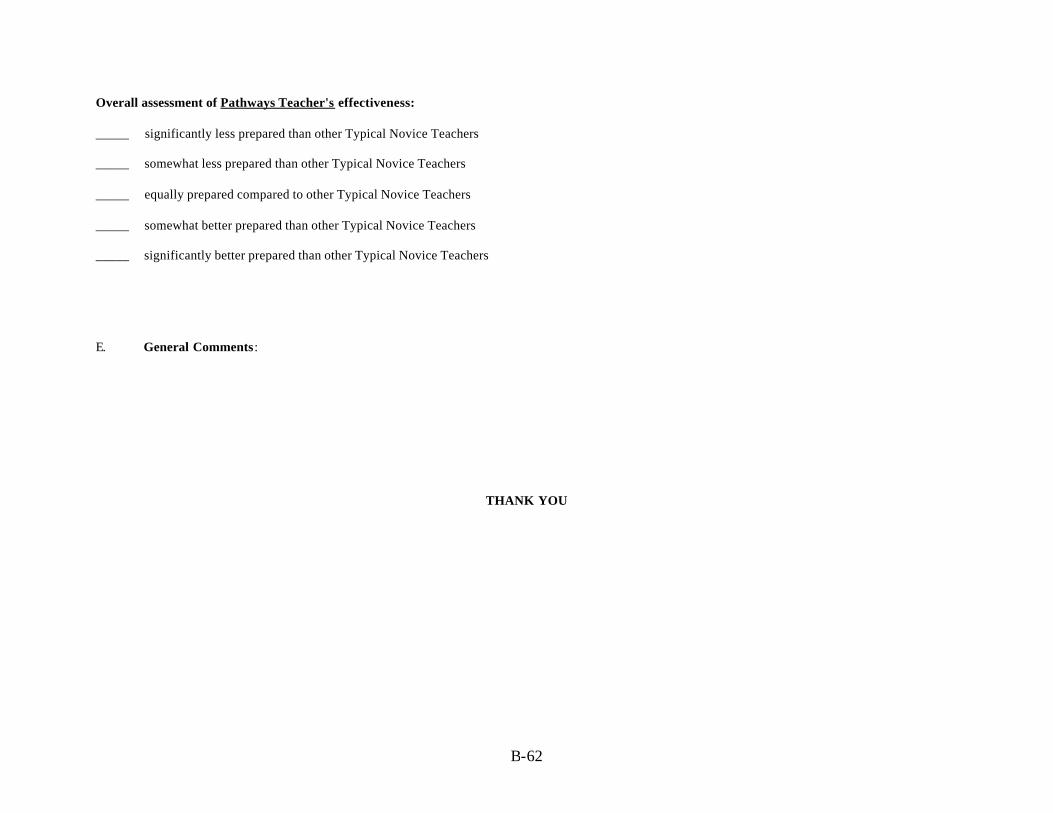
B-62
Overall assessment of Pathways Teacher's effectiveness: _____ significantly less prepared than other Typical Novice Teachers _____ somewhat less prepared than other Typical Novice Teachers _____ equally prepared compared to other Typical Novice Teachers _____ somewhat better prepared than other Typical Novice Teachers _____ significantly better prepared than other Typical Novice Teachers E. General Comments :
THANK YOU

B-63
FOLLOW-UP SURVEY OF THE PATHWAYS GRADUATES/COMPLETERS Are you currently employed in a full-time job in education? o YES (please answer Part A ONLY) o NO (please skip Part A and answer Part B ONLY- reverse side of page)
PART A 1. How would you categorize the setting in which you work?Please check one: q urban q suburban q rural
Please check one: q public q private
Please check one: q pre-school q elementary(K-8) q secondary (9-12)
q district level q post-secondary
2. What is your MAIN occupational status? (Please check one of the choices below) q Employed in a classroom teaching position q Employed in a non-classroom teaching position in education (Skip to question 4)
3. If you checked “Employed in a classroom teaching position” in question 2, what is your MAIN teaching assignment?
q A full-time certified classroom teacher q A part-time certified classroom teacher q A substitute classroom teacher q A paraprofessional/teacher’s aide q Other Please describe:
4. If you checked “Employed in a non-classroom teaching position in education” in question 2, what
is your MAIN school assignment?
q Administrator (e.g., principal, assistant principal, director, head) q Non-teaching specialist (e.g., counselor, librarian) q Resource person for other teachers (e.g., department head, curriculum coordinator, mentor) q Support staff (e.g., secretary, aide) q Coach q Other Please specify:_________________________________________________
5. What is the name of principal at the school where you work? ______________________________ What is the name and address of the school? __________________________________________________________ (School Name) __________________________________________________________ (School Address) _________________________ ____________ _______________ (School City) (School State) (School Zip)
OVERé
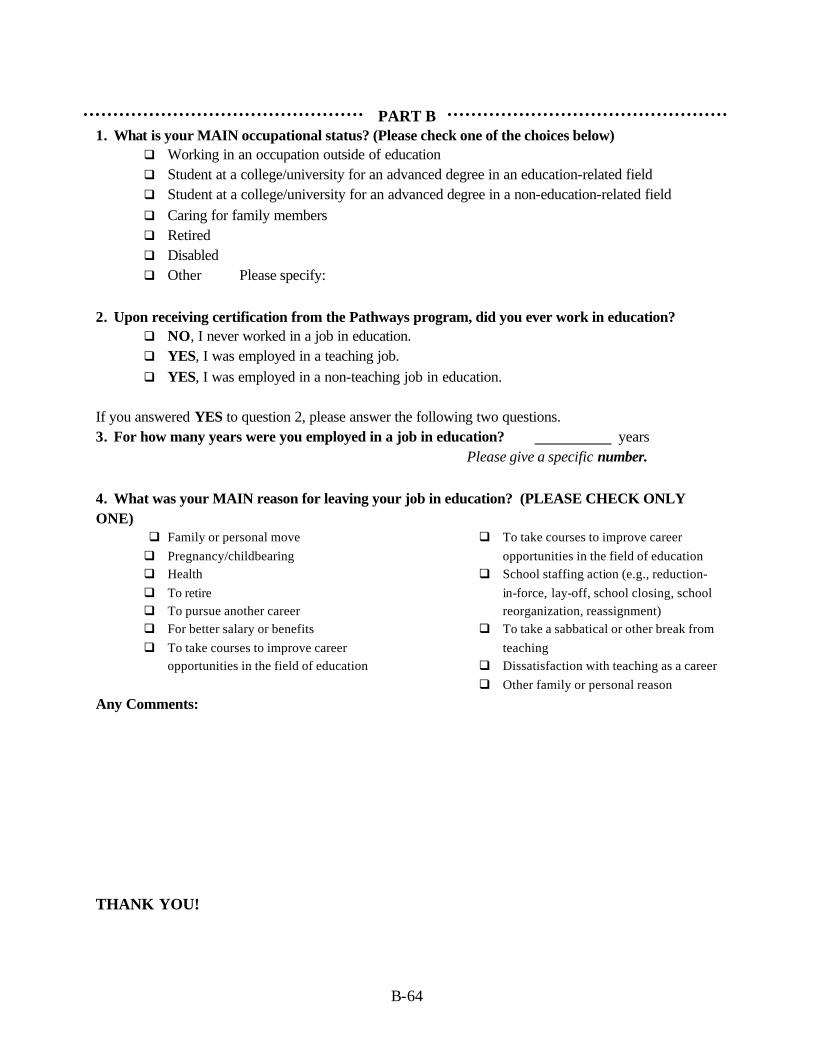
B-64
PART B 1. What is your MAIN occupational status? (Please check one of the choices below)
q Working in an occupation outside of education q Student at a college/university for an advanced degree in an education-related field q Student at a college/university for an advanced degree in a non-education-related field q Caring for family members q Retired q Disabled q Other Please specify:
2. Upon receiving certification from the Pathways program, did you ever work in education?
q NO, I never worked in a job in education. q YES, I was employed in a teaching job. q YES, I was employed in a non-teaching job in education.
If you answered YES to question 2, please answer the following two questions. 3. For how many years were you employed in a job in education? years Please give a specific number. 4. What was your MAIN reason for leaving your job in education? (PLEASE CHECK ONLY ONE)
q Family or personal move q Pregnancy/childbearing q Health q To retire q To pursue another career q For better salary or benefits q To take courses to improve career
opportunities in the field of education
q To take courses to improve career opportunities in the field of education
q School staffing action (e.g., reduction-in-force, lay-off, school closing, school reorganization, reassignment)
q To take a sabbatical or other break from teaching
q Dissatisfaction with teaching as a career q Other family or personal reason
Any Comments: THANK YOU!
C-1
APPENDIX C: DESCRIPTION OF THE PRAXIS III ASSESSMENT SYSTEM

C-2
Description of the Praxis III Assessment System
The Praxis III assessment system is organized into four teaching domains, each comprising a set of criteria:
Organizing content knowledge (instructional planning): Knowledge of the students and content to be taught underlies all aspects of good instruction. The five criteria in this domain focus on how teachers use their understanding of students and subject matter to decide on learning goals, to design or select appropriate activities and instructional materials, to sequence instruction in ways that will help students meet short- and long-term curricular goals, and to design or select informative evaluation strategies.
Creating a classroom environment: The second domain relates to the social and emotional components of learning as prerequisites to academic achievement. Most of the criteria in this domain focus on the human interactions in the classroom, on the connections between teachers and students, and among students. The domain stresses issues of fairness and rapport, of helping students to believe that they can learn and can meet challenges, and of establishing and maintaining constructive standards for behavior in the classroom.
Teaching for student learning: The third domain focuses on the act of teaching and its overall goal--helping students to connect with the content. Teachers direct students in the process of establishing individual connections with the content, thereby devising a good “fit” for the content within the framework of the students’ individual and cultural knowledge and experiences. At the same time, teachers should help students to move beyond the limits of their current knowledge or understanding. Effective teachers monitor learning, making certain that students assimilate information accurately and that they understand and can apply what they have learned. Teachers must also be sure that students understand what is expected of them procedurally during the lesson, and that class time is used to good purpose.
Teacher professionalism: To be effective, teachers must be able to evaluate their own instructional effectiveness in order to plan specific future lessons for particular classes and to improve their teaching over time. They should be able to discuss the degree to which different aspects of a lesson were successful in terms of instructional approaches, student responses, and learning outcomes. Teachers should be able to explain how they will proceed to work toward learning for all students. The professional responsibilities of all teachers also include sharing appropriate information with other professionals and with families in ways that support the learning of diverse student populations.
D-1
APPENDIX D: REPORT ON SCHOLARS WHO LEFT THE DEWITT WALLACE-READERS DIGEST PATHWAYS TO TEACHING CAREERS PROGRAM BEFORE
PROGRAM COMPLETION
D-2
Report on Scholars Who Left the DeWitt Wallace-Readers Digest Pathways to Teaching Careers Program Before Program Completion
Tamara Lucas, Montclair State University
September 1998
Between the beginning of the DeWitt Wallace-Readers Digest Pathways to Teaching Careers Program and June 1997, 113 Scholars left the 15 case study sites before having completed the program. They will be referred to in this report as dropouts and former Scholars.19 In 1997 and 1998, the evaluation team attempted to interview all dropouts for purposes of gathering information about (1) their reasons for leaving the program, (2) what if anything could have been done to help them complete the program, (3) whether they were still planning to pursue a career in teaching, and (4) whether their experience in the program had influenced their career decisions.20 Seventy-eight dropouts (69%) were reached by telephone or through mail surveys. Of those 78 dropouts, one declined to be interviewed. Therefore, the data reported below are derived from interviews with 77 program dropouts.
Table D.1 shows the race/ethnicity and gender of the dropouts compared to the race/ ethnicity and gender of all students in the case study sites. The proportion of dropouts who were African American was equivalent to the proportion of African American Scholars in the program (49.0% and 50.4%, respectively). A relatively large proportion of dropouts were Asian American (4.0%, compared to 1.8% Asian Americans in the total population). Relatively smaller proportions of program dropouts were White (14.0%) and Hispanic (9.0%) compared to their representation in the total group of Scholars (29.5% and 16.4%, respectively). Compared to their representation in the total population of Scholars, more males (42% of dropouts and 32% of all Scholars) than females (57% of dropouts and 68% of all Scholars) dropped out of the program.
19 This number does not include two Scholars who died while in the program. 20 See the interview protocol on page D-16.
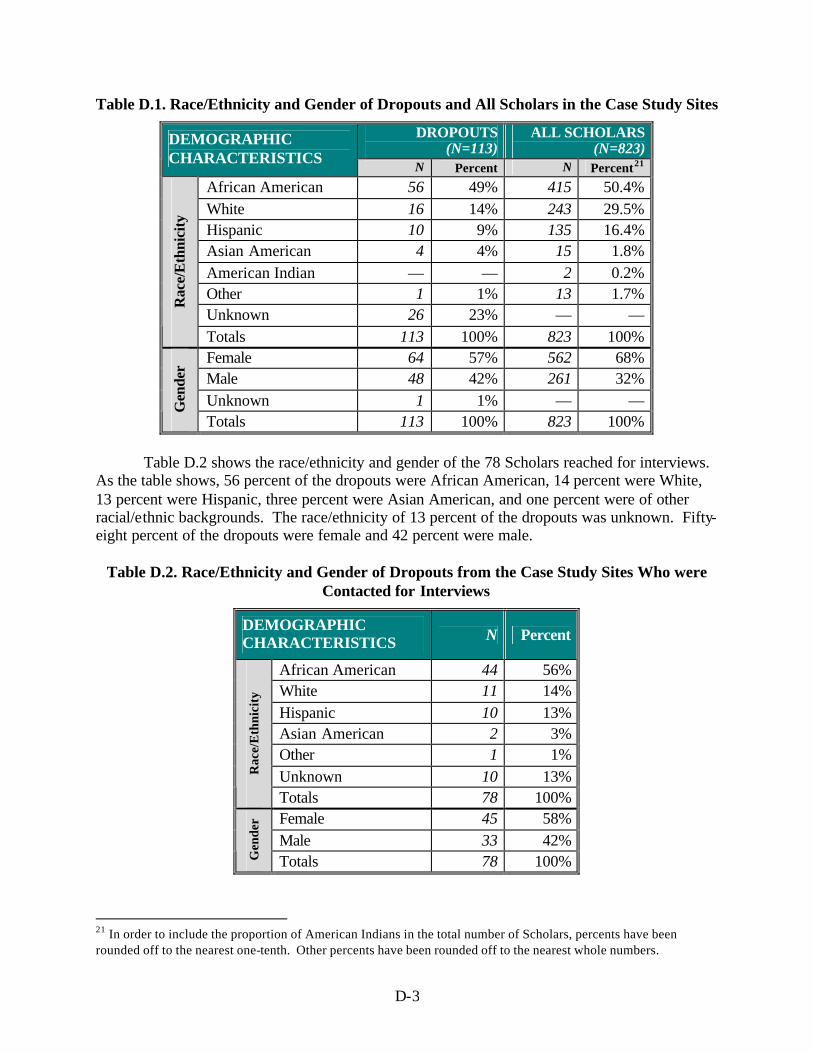
D-3
Table D.1. Race/Ethnicity and Gender of Dropouts and All Scholars in the Case Study Sites
DROPOUTS (N=113)
ALL SCHOLARS (N=823) DEMOGRAPHIC
CHARACTERISTICS N Percent N Percent21
African American 56 49% 415 50.4% White 16 14% 243 29.5% Hispanic 10 9% 135 16.4% Asian American 4 4% 15 1.8% American Indian — — 2 0.2% Other 1 1% 13 1.7% Unknown 26 23% — —
Rac
e/E
thni
city
Totals 113 100% 823 100% Female 64 57% 562 68% Male 48 42% 261 32% Unknown 1 1% — — G
ende
r
Totals 113 100% 823 100%
Table D.2 shows the race/ethnicity and gender of the 78 Scholars reached for interviews. As the table shows, 56 percent of the dropouts were African American, 14 percent were White, 13 percent were Hispanic, three percent were Asian American, and one percent were of other racial/ethnic backgrounds. The race/ethnicity of 13 percent of the dropouts was unknown. Fifty-eight percent of the dropouts were female and 42 percent were male.
Table D.2. Race/Ethnicity and Gender of Dropouts from the Case Study Sites Who were Contacted for Interviews
DEMOGRAPHIC CHARACTERISTICS N Percent
African American 44 56% White 11 14% Hispanic 10 13% Asian American 2 3% Other 1 1% Unknown 10 13% R
ace/
Eth
nici
ty
Totals 78 100% Female 45 58% Male 33 42%
Gen
der
Totals 78 100%
21 In order to include the proportion of American Indians in the total number of Scholars, percents have been rounded off to the nearest one-tenth. Other percents have been rounded off to the nearest whole numbers.
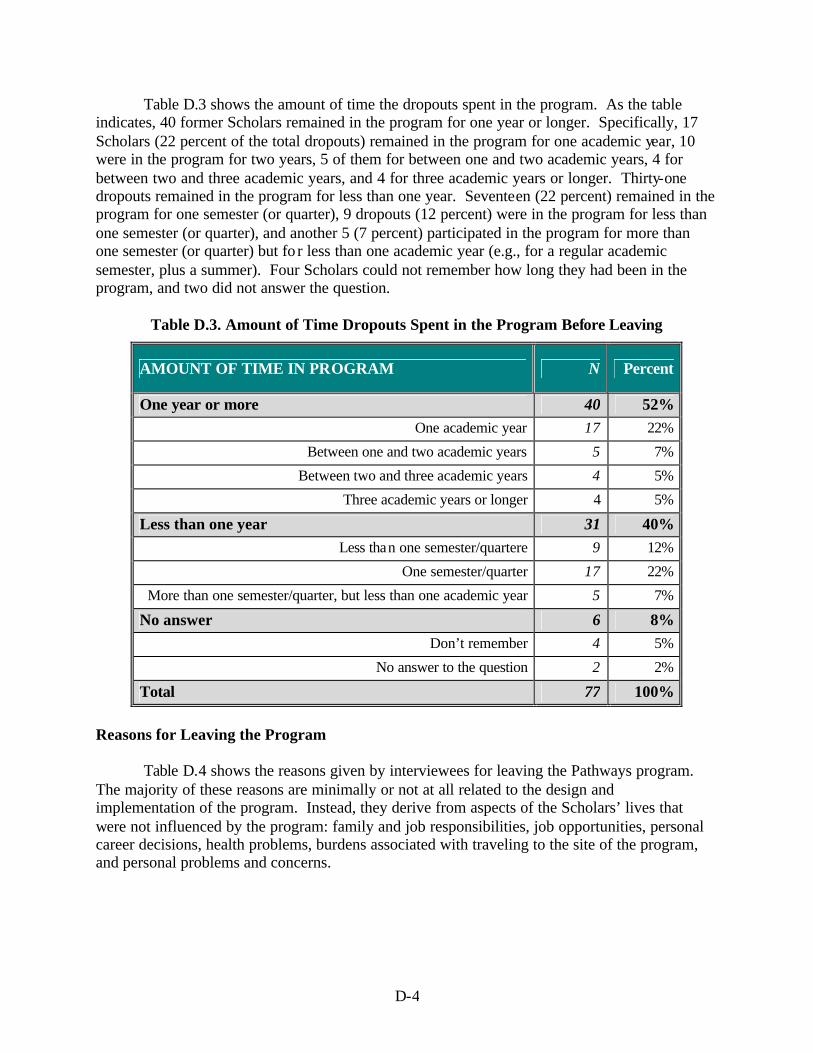
D-4
Table D.3 shows the amount of time the dropouts spent in the program. As the table indicates, 40 former Scholars remained in the program for one year or longer. Specifically, 17 Scholars (22 percent of the total dropouts) remained in the program for one academic year, 10 were in the program for two years, 5 of them for between one and two academic years, 4 for between two and three academic years, and 4 for three academic years or longer. Thirty-one dropouts remained in the program for less than one year. Seventeen (22 percent) remained in the program for one semester (or quarter), 9 dropouts (12 percent) were in the program for less than one semester (or quarter), and another 5 (7 percent) participated in the program for more than one semester (or quarter) but fo r less than one academic year (e.g., for a regular academic semester, plus a summer). Four Scholars could not remember how long they had been in the program, and two did not answer the question.
Table D.3. Amount of Time Dropouts Spent in the Program Before Leaving
AMOUNT OF TIME IN PROGRAM N Percent
One year or more 40 52% One academic year 17 22%
Between one and two academic years 5 7%
Between two and three academic years 4 5%
Three academic years or longer 4 5%
Less than one year 31 40% Less than one semester/quartere 9 12%
One semester/quarter 17 22%
More than one semester/quarter, but less than one academic year 5 7%
No answer 6 8% Don’t remember 4 5%
No answer to the question 2 2%
Total 77 100% Reasons for Leaving the Program
Table D.4 shows the reasons given by interviewees for leaving the Pathways program. The majority of these reasons are minimally or not at all related to the design and implementation of the program. Instead, they derive from aspects of the Scholars’ lives that were not influenced by the program: family and job responsibilities, job opportunities, personal career decisions, health problems, burdens associated with traveling to the site of the program, and personal problems and concerns.
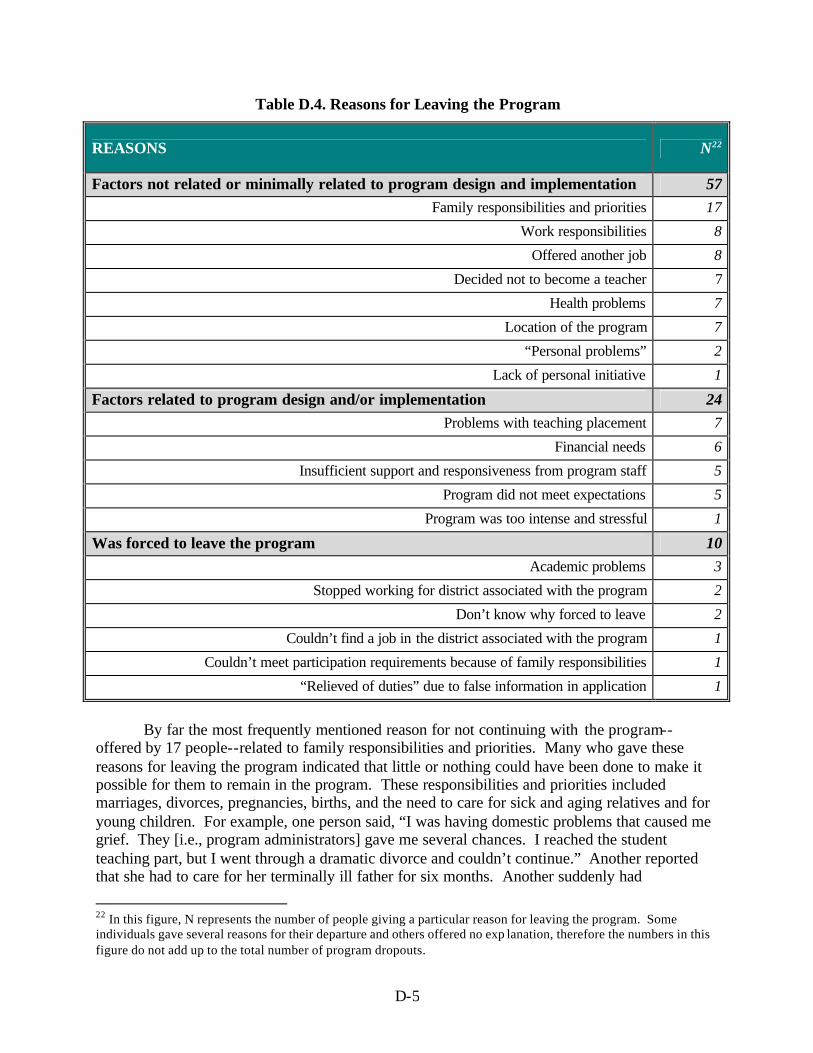
D-5
Table D.4. Reasons for Leaving the Program
REASONS N22
Factors not related or minimally related to program design and implementation 57 Family responsibilities and priorities 17
Work responsibilities 8
Offered another job 8
Decided not to become a teacher 7
Health problems 7
Location of the program 7
“Personal problems” 2
Lack of personal initiative 1
Factors related to program design and/or implementation 24 Problems with teaching placement 7
Financial needs 6
Insufficient support and responsiveness from program staff 5
Program did not meet expectations 5
Program was too intense and stressful 1
Was forced to leave the program 10 Academic problems 3
Stopped working for district associated with the program 2
Don’t know why forced to leave 2
Couldn’t find a job in the district associated with the program 1
Couldn’t meet participation requirements because of family responsibilities 1
“Relieved of duties” due to false information in application 1
By far the most frequently mentioned reason for not continuing with the program--
offered by 17 people--related to family responsibilities and priorities. Many who gave these reasons for leaving the program indicated that little or nothing could have been done to make it possible for them to remain in the program. These responsibilities and priorities included marriages, divorces, pregnancies, births, and the need to care for sick and aging relatives and for young children. For example, one person said, “I was having domestic problems that caused me grief. They [i.e., program administrators] gave me several chances. I reached the student teaching part, but I went through a dramatic divorce and couldn’t continue.” Another reported that she had to care for her terminally ill father for six months. Another suddenly had
22 In this figure, N represents the number of people giving a particular reason for leaving the program. Some individuals gave several reasons for their departure and others offered no exp lanation, therefore the numbers in this figure do not add up to the total number of program dropouts.
D-6
responsibility for her sister’s four children. Another said that his teenage son needed lots of attention, while yet another said that her two young children were her “priorities” and she realized she “couldn’t do it all.”
Eight people reported that the need to attend to work-related responsibilities interfered with program participation. Several said that they simply could not juggle a full- time job and school. One said she had to work on weekends to “make ends meet” and could not take required Saturday classes. One person was promoted and could not find time to go to school. In addition to these work related responsibilities, another reason for leaving the program was job opportunities. Eight people also explained that they dropped out of the program because they were offered jobs outside the program that they did not want to pass up. Four of these were teaching positions.
Seven interviewees reported that they dropped out of the program because they realized that they did not want to become teachers. As discussed below, some of these said that the program helped them make this decision. Two of these dropouts had enjoyed teaching in other countries in the Peace Corps but found that they did not like teaching in U.S. schools. One of the seven said that he realized that he did not “have the gift to teach,” and another realized that her “heart wasn’t in the education field” but in pre- law.
Seven also reported that health problems forced them to leave the program. An equal number said that the location of the program posed an obstacle to their participation. One of these people reported that she never intended to stay in the city where the program was located longer than one year. Another realized that he did not like living in the city that was the site of the program. Others moved while they were in the program and found the commute impossible. Finally, two people reported that unspecified personal problems led them to drop out, and another said that her own lack of motivation, not the program, caused her to leave.
The second set of reasons that dropouts gave for having left the program were directly related to the program itself. The most frequently mentioned of these reasons was difficulty with teaching assignments. This included being asked to teach different grade levels than those that the person wanted or felt prepared for (e.g., in secondary school rather than elementary school) and being asked to teach subjects other than those for which they felt prepared. One Returning Peace Corps Volunteer (RPCV) reported that the contrast to teaching in the Peace Corps was too disheartening. He said that in the school where he taught in the Peace Corps, there was “instant respect” for the teacher, but in the inner city school where he taught in the program, “students showed no respect.” One student was not able to find a placement until mid-October, which led him to deplete his savings. He had expected the program to find him a job and was upset that he “had to do the leg-work to get a job” for himself. One Scholar described her placement in an extremely difficult teaching situation. She reported:
I was placed in a bad school. The board of education didn’t support me and said they couldn’t move me to another school. It was a school for students with learning disabilities, whereas I was studying mental retardation. Sixteen teachers left the school that year. The principal would hit students, was verbally and emotionally abusive. The students would hit me and nothing would be done about it. The parents
D-7
of one student threatened to kill me. There was no mentoring for new teachers. The special education program had no supervisor. There was no one I could talk to. I felt I was very much alone. There was no support from the school, the board, or the program.
Six dropouts reported that the financial assistance provided by the program was not
sufficient, so they had to leave the program for financial reasons.
While their individual experiences differed, five former Scholars cited insufficient support and responsiveness from program staff as the reason they dropped out. One person reported that, because she was getting married in the summer she wanted to take the summer semester off. She was told that she “had to go every semester consecutively--no exceptions.” Another person also felt that the program staff was not responsive to individual differences among Scholars. He described it as being “treated like babies, not like professionals.” He elaborated:
We had to do lots of extra things, attend meetings and get-togethers that were irrelevant to me. I spent lots of time doing that. I had to take days off to attend some of these things. They said we had to attend these things. I got tired of being treated like a kid. I already have a BA. I have subbed for 5 years.... They haven’t contacted me since I left. They didn’t seem to care.
A third person reported that a change in staffing resulted in less support for Scholars:
After [the staff change], it was hard to get the kind of help and understanding that I needed. I felt pressure to take lots of classes. They’d tell me, ‘You need to take this and you need to take that.’ Then I got really lost. I also had a lot of pressure about my pregnancy, but the project director had so much to deal with that it was just up to me. They didn’t really try to help me stay. I got really discouraged.
Another dropout also reported feeling that she could not get the support she needed to remain in the program:
At first, the program felt really good; it was communication-oriented and cohesive. But then we were completely left to our own devices. The program staff were completely inaccessible. It did not appear that they were giving the project much attention. I was very motivated when I first entered the program, but I was very disenchanted with the program and the staff. I felt completely isolated, wasting away, with nowhere to take my grievances.
Five people reported that they left the program because it did not meet particular
expectations they had when they enrolled. Two of these dropouts discovered that they could not get degrees or certificates in fields that they had expected to study. One had wanted a degree in math/science but found he could only get a teaching certificate through the program; the other wanted to become certified in special education but found that the program did not offer such certificates. Two others dropped out when they found that a number of courses that they thought
D-8
would count towards their degrees would not count, so they would have had to take more courses than they had anticipated. The other person found the courses “too theoretical, not practical enough.” He attributed this theoretical focus of the program to the fact that it “catered to non-teachers” rather than to practicing teachers like himself. One person simply found the program too intense and stressful. He reported that his wife, who was also in the program, dreamed about it and could not relax because of the pressure to juggle full-time teaching and full- time coursework.
Ten program dropouts said that they did not want to leave the program, but that they forced to leave. Three former Scholars reported that they could not maintain the required grade point average. Two reported that they stopped working for the school district associated with the program and could therefore no longer participate. Two reported that they did not know why they were asked to leave the program. One said she tried to find a job with the school district but was unsuccessful. She was disappointed that the program had not given her more assistance to find a job, as indicated by her comments: “I was booted out of the program because I couldn’t find a job. When I entered the program, I thought they would find jobs for the people that were in the program.” Another person used similar language to describe her departure from the program:
I did not leave the program; I was booted out. I am a single parent with a daughter who was a senior in high school at the time. The program required participation in additional enrichment activities and seminars. I was unable to attend many extra-curricular activities because of family commitments. My daughter is a musician and needed to be driven around. The program coordinator was insensitive to these issues and asked me to leave the program.
Finally, one man reported that he was asked to leave the program because “they said I had provided false information when I enrolled.” Advice for Retaining Scholars in the Program
When asked whether anything could have been done to allow them to stay in the program, 29 former Scholars (38% of the 77 dropouts interviewed) said that nothing could have been done. Their reasons for leaving were related to family responsibilities, health concerns, travel difficulties, and other life events and situations. Some of these dropouts as well as others made positive comments about the program despite their having left without completing it, for example:
I thought it was an excellent program. It also helped minorities with their special problems. I was influenced by my instructors, and also the exceptional opportunities and workshops offered. This is the best program going, compared to what some of my friends have been through. The support mechanisms were great. My questions were answered. People came to observe me teach. The mentoring aspect was tremendous.
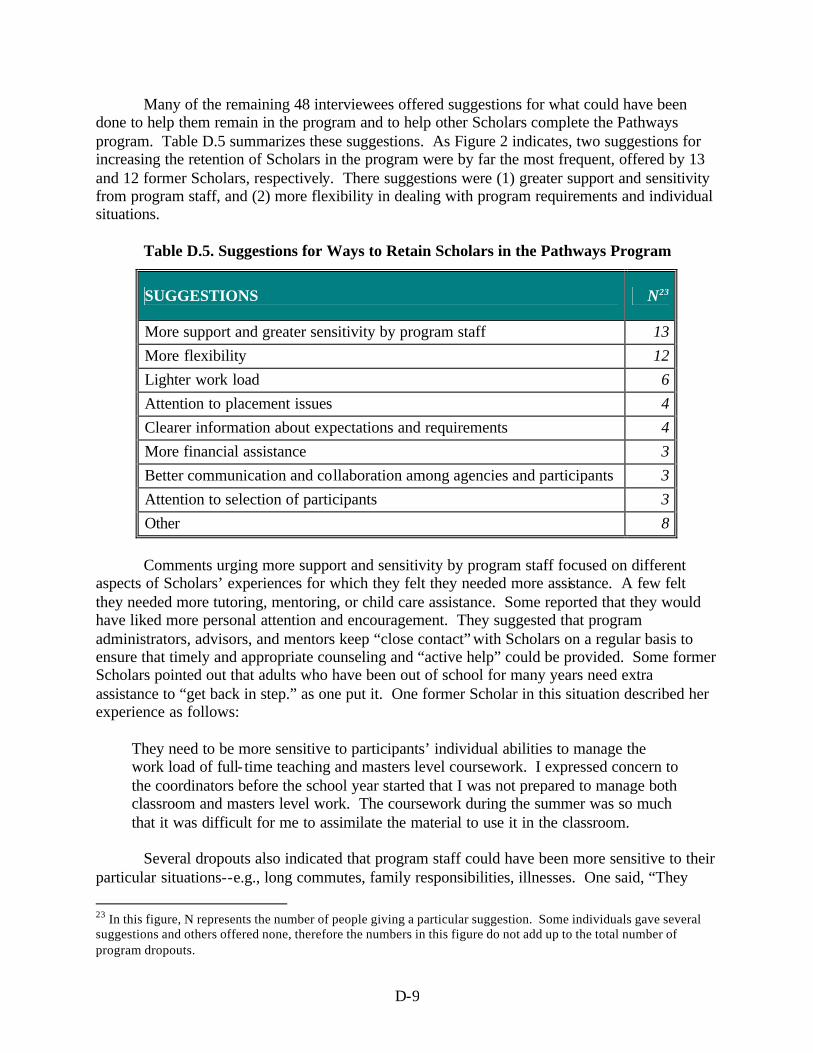
D-9
Many of the remaining 48 interviewees offered suggestions for what could have been done to help them remain in the program and to help other Scholars complete the Pathways program. Table D.5 summarizes these suggestions. As Figure 2 indicates, two suggestions for increasing the retention of Scholars in the program were by far the most frequent, offered by 13 and 12 former Scholars, respectively. There suggestions were (1) greater support and sensitivity from program staff, and (2) more flexibility in dealing with program requirements and individual situations.
Table D.5. Suggestions for Ways to Retain Scholars in the Pathways Program
SUGGESTIONS N23
More support and greater sensitivity by program staff 13 More flexibility 12 Lighter work load 6 Attention to placement issues 4 Clearer information about expectations and requirements 4 More financial assistance 3 Better communication and collaboration among agencies and participants 3 Attention to selection of participants 3 Other 8
Comments urging more support and sensitivity by program staff focused on different
aspects of Scholars’ experiences for which they felt they needed more assistance. A few felt they needed more tutoring, mentoring, or child care assistance. Some reported that they would have liked more personal attention and encouragement. They suggested that program administrators, advisors, and mentors keep “close contact” with Scholars on a regular basis to ensure that timely and appropriate counseling and “active help” could be provided. Some former Scholars pointed out that adults who have been out of school for many years need extra assistance to “get back in step.” as one put it. One former Scholar in this situation described her experience as follows:
They need to be more sensitive to participants’ individual abilities to manage the work load of full- time teaching and masters level coursework. I expressed concern to the coordinators before the school year started that I was not prepared to manage both classroom and masters level work. The coursework during the summer was so much that it was difficult for me to assimilate the material to use it in the classroom.
Several dropouts also indicated that program staff could have been more sensitive to their
particular situations--e.g., long commutes, family responsibilities, illnesses. One said, “They
23 In this figure, N represents the number of people giving a particular suggestion. Some individuals gave several suggestions and others offered none, therefore the numbers in this figure do not add up to the total number of program dropouts.

D-10
need to understand that Scholars with families may not be able to attend every function. It’s a great program, but it works best for single men without children or married people without children.” One person whose grandfather died while she was student teaching said that her advisor “didn’t take the time to talk to me. It was like your own problems were your own problems.” One Scholar felt that it would have helped him if the Scholars had “been made to feel more special, that we were in a special program, were recruited and wanted and more valued. It became clear that we were just going through an alternative teacher preparation program.”
Twelve interviewees felt that the program and program staff were not flexible enough-- that rules and expectations were too rigid and that staff did not allow departures from the planned sequence and number of activities and courses. Some mentioned that the schedule was not flexible enough. One person, for example, worked on Saturday and could not attend required Saturday classes. Another would have been able to attend daytime and weekend classes, but not evening classes. Several people indicated that it was difficult to attend all of the extra-curricular activities, which in some cases were required. As one put it, “Though the extra-curricular activities are great and beneficial for the participants, they are time-consuming and difficult for people with families.” One person suggested that Scholars should be allowed to take some courses at home through e-mail. Several reported that they felt pressure to take a certain number of courses within a specified amount time and that adhering to the required pace was impossible for them. Finally, a number of people suggested that Scholars should not be limited to teaching in only a few specific schools within a district, as one pointed out, “especially when other schools in the district have the same student population.”
A third suggestion (made by 6 interviewees) was that the work load should be lighter. These people pointed out that teaching full- time and going to school full-time put considerable pressure on them, especially those with families. They felt that a lighter class load at a slower pace would have made it possible for them to remain in the program. For those who had been out of school for a number of years, the fast pace was especially challenging. As one said, “The quality of the program is great, but the speed of the program is too fast. Start out at a little slower pace with maybe two classes and let the student take more classes by building on that early success. I was out of school for 16 or 17 years and the pace was too much for me.”
Four former Scholars suggested that more attention be given to placing the Scholars in teaching positions. One problem they mentioned was that Scholars were not always placed early enough in the school year. A few Scholars reported that they were not able to find jobs at all or that they found them after the school year had already begun. They suggested that the program should arrange for placements in schools before the school year begins. A second issue was who was responsible for finding teaching placements--the Scholar or the program. Several former Scholars mentioned that they had expected the program to find them jobs, but they discovered that they were responsible for finding their own jobs. This was especially problematic for those who came from outside the area, as the Peace Corps Fellows did. They had very little time to find positions and no knowledge of the area or the school system. The third problem related to placement was the nature of the schools in which some Scholars were placed. In some contexts, Scholars were placed in especially difficult schools. One former Scholar described her time

D-11
spent in such a school as “a horrible experience.” Another pointed out that placing her in a difficult school was not only problematic for her, but also not in the best interests of the school:
I was assigned to a junior high school that was very difficult in terms of the students’ behavioral problems. Also, they were below their level in math, reading, and writing. (I was teaching Earth Science.) And the social problems--some violence; social skills were real low. Being assigned to an easier school would have made it easier. This school needed a more experienced teacher. It would have been better if I had more experience before going to the school I was assigned to.
Finally, some dropouts said that they didn’t feel welcome or valued in the schools where they were placed. One person suggested that an effort should be made to place Scholars in schools where “they are at least shown that they’re wanted, even if people aren’t desperate to have them.”
Four interviewees suggested that the programs provide clearer information about expectations and requirements. Some were confused about what courses would be required for and accepted toward their degree, and they took courses that were not accepted. Some had thought that they could get a particular degree or certificate in a particular field, only to find out that they could not do so within the program.
Three other suggestions were made by three dropouts each. First, three former Scholars reported that the financial assistance provided by the program was insufficient to allow them to remain in the program. They recommended that the program provide more financial support. Second, three interviewees indicated that more communication and collaboration between the program, the school district, and the schools would have provided more support and cohesiveness. In some cases, they got conflicting information from different sources. One person felt that collaboration would have given her “someone to fall back on when a problem surfaces or an issue has to be hashed out” at the school site. Third, three dropouts suggested that giving attention to the selection of program participants could increase retention of more Scholars in the program. One felt that focusing on people “fresh out of college” would be advisable. He said, “If they catch people when they’re undecided [about their careers], they have a better chance of finishing the program.” Another said that “only those who really want to teach in U.S. schools” should be accepted. The third suggested selecting people who already have experience teaching in U.S. schools, so they’ll “know what they’re getting into.” The latter two comments came from RPCVs.
Eight other suggestions for retaining Scholars in the program were offered by individuals. These were as follows: Ø Provide transportation. Ø Provide more preparation in urban education before having the Scholars start to teach. Ø Find a way to ensure that graduates will be offered contracts with the school system at the
end of the program. Ø Provide accurate information about the program. “If it’s really not a special program,
they shouldn’t market it as one.”

D-12
Ø Count previous teaching experience (including that in the Peace Corps) for some credits toward a degree.
Ø Make more people aware of the program. “I learned about it by chance. I know people who would have benefited but they didn’t know about it.”
Ø Have Scholars visit a school early, so they can decide sooner whether they really want to teach.
Ø Suggest that RPCVs take a year off before entering the program to give them a chance to reacclimate to the U.S. and decide whether they really want to teach.
Career Plans and the Influence of the Pathways Experience on those Plans
When interview respondents were asked whether they still intend to pursue a career in teaching, 78 percent (n = 60) said yes, 12 percent (n = 9) said no, and 10 percent (n = 8) said that they were unsure. When asked whether their experience in the Pathways program had influenced their decision to pursue or not to pursue such a career, 40 percent (n = 31) said it had influenced their decision, 23 percent (n = 18) said it had not influenced their decision, 13 percent (n = 10) said they were not sure, and 23 percent (n = 18) did not answer the question.
Interviewees were also asked to explain how their experience in the Pathways program influenced their career decisions. Of those who responded to this question, nine who are still planning to pursue a career in teaching said that their experience in the program did not influence their decision. They made comments such as, “I already loved teaching,” and “I already knew I wanted to be a teacher.”
Eight respondents who are still planning to pursue a career in teaching said that they had already decided to become teachers, but that the program encouraged them to continue toward this goal. Some also ment ioned that the financial support helped them pursue their goal, even though they were not able to complete the program. Comments from this group of interviewees are illustrated by the following:
I had already decided to become a teacher, but the program did enhance my decision. The opportunities and support in the program encouraged me to stick with it and pursue my goal. The program provided the money that allowed me to concentrate on my studies for a longer time than I would have been able to otherwise. I had the desire before I entered the Pathways program, but the program also gave me a great deal of encouragement. On some level, I always had the desire. The program just gave me the necessary path to pursue it.
Nine of those who are still planning to pursue a career in teaching reported that the
program directly influenced their decision. They reported that they learned how important teaching is and that they learned about the different options within the field of teaching, which

D-13
helped them determine the particular directions they want to take. Several mentioned that the support, mentoring, and encouragement they received in the program helped them develop confidence that they can become teachers. Two comments are illustrative:
If it weren’t for my experience in the program, I wouldn’t be teaching now. I got so much information and support there that it made me ready to teach. All the professors were unbelievably supportive, flexible, actually human. They understood the stresses of teaching in an urban setting.
Absolutely, [my experience in the program influenced my decision to become a teacher]. I valued getting a more direct and open awareness of why quality education has be to in the school system and why it isn’t there now and what needs to happen to make it be of high quality.
Of those who decided not to pursue a career in education, only one said that the program itself led her to decide not to become a teacher. She said, “I was so disenchanted with the program that I decided not to go into teaching. I had no support from the people running the program or from my colleagues in the school where I was teaching.” However, the ten others who have decided not to become teachers and who responded to the question asking about the influence of the program on their career decision said that it was not the program itself that caused them to decide to seek another career. Many reported that their teaching experiences while in the program showed them that they did not want to be teachers. The following comments illustrate:
I don’t blame the program. It’s a good program but I wasn’t sure I wanted to teach.
I decided I didn’t want to be a teacher, but the program didn’t have anything to do with my decision. My roommates are all still in the program and they like it.
While in the Pathways program, I found all the support and confidence I needed to pursue my true goal, and this is pre- law.
It wasn’t the program, but the teaching situation in the U.S. that discouraged me from becoming a teacher. I became very cynical very quickly.
Summary
In summary, the proportion of African American dropouts was equivalent to the proportion of African American Scholars, the proportion of Asian American dropouts was higher than the proportion of Asian American Scholars, and the proportions of White and Hispanic dropouts were lower than their proportions of the total number of Scholars. More than half (56 percent) of the former Scholars interviewed were African American. Approximately equal proportions of interviewees were White (14 percent), Hispanic (13 percent), and of unknown race/ethnicity (13 percent). Two interviewees were Asian American and one was of another race/ethnicity. Fifty-eight percent of the people interviewed were female and 42 percent were male.
D-14
Fifty-two percent of the dropouts had been in the Pathways program for one year or
more, while 40 percent had been in the program for less than one year and another 8 percent did not remember how long they had been in the program or did not answer the question.
When asked why they left the Pathways program before completing it, 57 people
mentioned factors that were not related or were minimally related to program design and implementation. These factors were related to family and job responsibilities, job opportunities, personal career decisions, health problems, burdens associated with traveling to the site of the program, and personal problems and concerns. Another 24 Scholars reported that they left the program for reasons that were related to program design and implementation, such as problems with their teaching placements, financial needs that were not met by the program, insufficient support and responsiveness from program staff, aspects of the program that did not meet their expectations, and the intensity and stressfulness of the program. Another 10 dropouts said that they did not leave the program voluntarily but were forced to leave for a variety of reasons, including academic problems, discontinuing their employment with the school district(s) associated with the program, inability to find a job in the district(s) associated with the program, and inability to meet the program’s requirements for participation in extra-curricular activities. Two of these 10 former Scholars said they were unsure why they were forced to leave.
Twenty-nine dropouts (38 percent of the dropouts interviewed) reported that nothing
could have been done to keep them in the program. They left for such reasons as family responsibilities, health concerns, travel difficulties, and job opportunities. Of the 56 former Scholars who offered suggestions for ways to retain Scholars in the program, 13 suggested that the staff provide more support and sensitivity to Scholars’ individual situations and needs, and 12 advised that the programs should be more flexible in terms of the rules, expectations, and planned sequence of courses and activities. Less frequently mentioned suggestions were to lighten the work load (6 interviewees), give greater attention to placement of Scholars in teaching positions (4 interviewees), provide clearer information about expectations and requirements (4 interviewees), provide more financial assistance (3 interviewees), establish better communication among the various agencies and organizations involved (3 interviewees), and give more attention to the selection of Scholars (3 interviewees). Eight other individuals offered suggestions as well.
Sixty people (78 percent of the 77 interviewees) reported that they still plan to pursue a career in teaching, 9 (12 percent) said they do not plan to pursue a career in teaching, and 8 (10 percent) said they are not sure whether they will pursue such a career or not. Thirty-one respondents (40 percent) said their experience in the Pathways program influenced their career decision, 18 (23 percent) said it did not, and 10 (13 percent) were not sure whether their experience had influenced their decision. Eighteen people (23 percent) did not respond to this question.
Of the 60 people who said that they are planning to pursue teaching careers, 9 said that their Pathways experience did not influence their career decision, 8 said it did not influence their decision but it did encourage them, and another 9 reported that their experience did make the difference in their decision to continue in the teaching profession. Only one of the 9 people who

D-15
do not intend to pursue a teaching career reported that her experience in the program led her to make this decision. The other 8 former Scholars reported that other factors led them to decide against becoming teachers.

D-16
DEWITT WALLACE-READER’S DIGEST FUND PATHWAYS TO TEACHING CAREERS
Program Evaluation
Phone Interview with Program Dropouts (15 minutes)
Name of Respondent: Institution: Date and Time of Interview: Interviewer: 1. When did you enter the Pathways to Teaching Careers Program at (name of institution)? 2. When did you leave the program? 3. How many credits did you complete in the program? 4. Why did you leave the program? (PROBE for a thorough explanation. PROBE for any
aspects of the program itself that might have led the person to drop out.) 5. (If appropriate): Could anything have been done to make it possible for you to stay in the
program? If so, what? 6. a. Are you still planning to pursue a career in education?
b. If so, what are your plans? (PROBE for plans for taking courses/getting certificates and for career plans.)
c. Did your experience in the DWRD program influence your decision to pursue a career in education? If so, how?
d. If not, why have you decided to leave the field of education?

D-17
e. What field do you plan to pursue for your career?
f. Is your decision to pursue this career related to your experience in the Pathways Program in any way? If so, how?
7. Do you have any advice for the program administrators about how to ensure that future
Pathways Scholars/Fellows can complete the program?
E-1
APPENDIX E: COEFFICIENT OF VARIATION
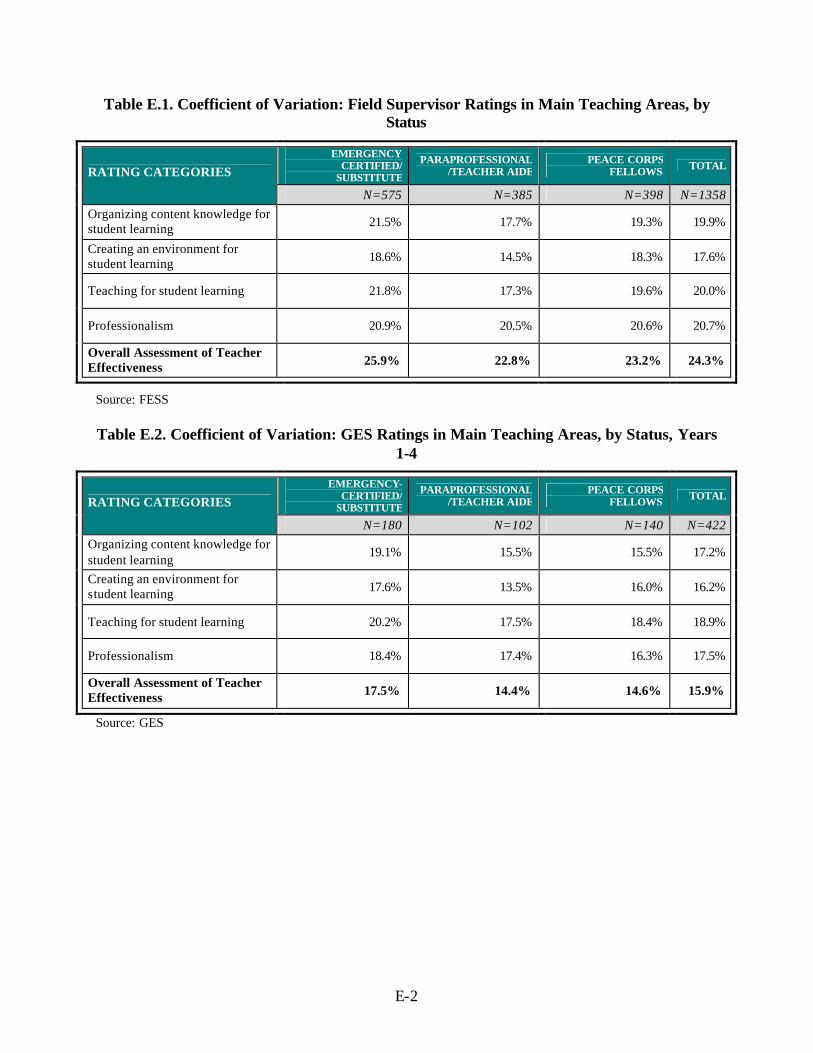
E-2
Table E.1. Coefficient of Variation: Field Supervisor Ratings in Main Teaching Areas, by Status
EMERGENCY CERTIFIED/
SUBSTITUTE
PARAPROFESSIONAL /TEACHER AIDE
PEACE CORPS FELLOWS TOTAL RATING CATEGORIES
N=575 N=385 N=398 N=1358 Organizing content knowledge for student learning 21.5% 17.7% 19.3% 19.9%
Creating an environment for student learning 18.6% 14.5% 18.3% 17.6%
Teaching for student learning 21.8% 17.3% 19.6% 20.0%
Professionalism 20.9% 20.5% 20.6% 20.7%
Overall Assessment of Teacher Effectiveness 25.9% 22.8% 23.2% 24.3%
Source: FESS Table E.2. Coefficient of Variation: GES Ratings in Main Teaching Areas, by Status, Years
1-4
EMERGENCY-CERTIFIED/
SUBSTITUTE
PARAPROFESSIONAL /TEACHER AIDE
PEACE CORPS FELLOWS TOTAL RATING CATEGORIES
N=180 N=102 N=140 N=422 Organizing content knowledge for student learning
19.1% 15.5% 15.5% 17.2%
Creating an environment for student learning 17.6% 13.5% 16.0% 16.2%
Teaching for student learning 20.2% 17.5% 18.4% 18.9%
Professionalism 18.4% 17.4% 16.3% 17.5%
Overall Assessment of Teacher Effectiveness 17.5% 14.4% 14.6% 15.9%
Source: GES
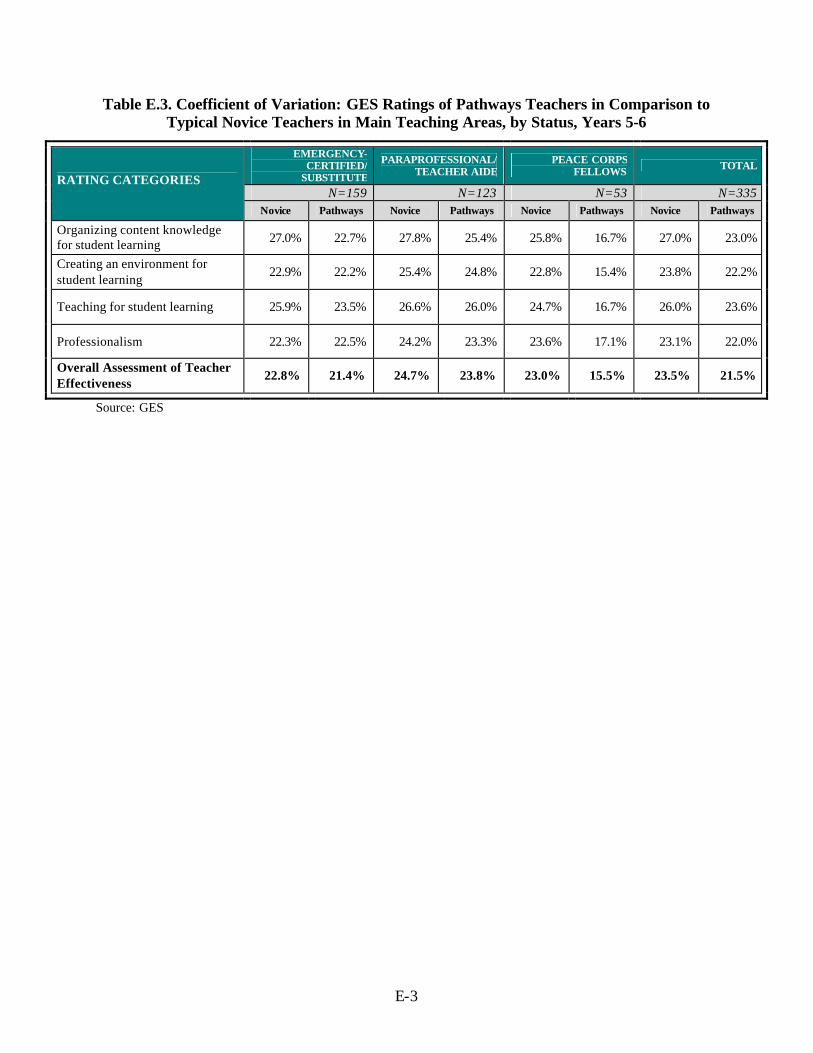
E-3
Table E.3. Coefficient of Variation: GES Ratings of Pathways Teachers in Comparison to Typical Novice Teachers in Main Teaching Areas, by Status, Years 5-6
EMERGENCY-CERTIFIED/
SUBSTITUTE
PARAPROFESSIONAL/ TEACHER AIDE
PEACE CORPS FELLOWS TOTAL
N=159 N=123 N=53 N=335 RATING CATEGORIES
Novice Pathways Novice Pathways Novice Pathways Novice Pathways
Organizing content knowledge for student learning 27.0% 22.7% 27.8% 25.4% 25.8% 16.7% 27.0% 23.0%
Creating an environment for student learning 22.9% 22.2% 25.4% 24.8% 22.8% 15.4% 23.8% 22.2%
Teaching for student learning 25.9% 23.5% 26.6% 26.0% 24.7% 16.7% 26.0% 23.6%
Professionalism 22.3% 22.5% 24.2% 23.3% 23.6% 17.1% 23.1% 22.0%
Overall Assessment of Teacher Effectiveness 22.8% 21.4% 24.7% 23.8% 23.0% 15.5% 23.5% 21.5%
Source: GES