Embed Size (px)
Citation preview

Evaluation of the Cosmetic Potential of the Cyanobacterium Spirulina platensis.
Carlos Ricardo Soccol, Ph.D., HDR
Supervisor
By
Alessandra Cristine Novak
Curitiba – Paraná – Brazil November - 2010

ii
"The cosmetic products do less than we say, but more than we think". Researcher from a French company.

iii
Summary Chapter 1: General Introduction ........................................................................................................ 9
Chapter 2: Cultivation of Spirulina platensis and the obtaining of its Biomass and Exopolysaccharide (EPS) ................................................................................................................... 10
2.1 Introduction .................................................................................................................. 10
2.1.1 Microalgae and Cyanobacterium ................................................................................ 10
2.1.1.1 Spirulina platensis Biomass Characteristics and Composition ................... 10
2.1.2 Polysaccharides Sources ............................................................................................ 12
2.1.3 Purification and Structural Analysis ........................................................................... 12
2.1.4 Applications ............................................................................................................... 13
2.1.5 Microbial Polysaccharides ......................................................................................... 13
2.1.5.1 Definitions, Characteristics and Classification ........................................... 13
2.1.5.2 Algal Polysaccharides ................................................................................. 15
2.1.5.2.1 Spirulina platensis Exopolysaccharides ...................................... 17
2.2 Materials and Methods ............................................................................................... 19
2.2.1 Biomass ..................................................................................................................... 19
2.2.2 Exopolysaccharides .................................................................................................... 20
2.3 Results and Discussion ................................................................................................. 20
2.3.1 Biomass ..................................................................................................................... 20
2.3.1.1 Growth and Composition Analysis ............................................................. 20
2.3.1.2 Phenolic Compounds ................................................................................. 21
2.3.1.3 Antioxidant Potential ................................................................................. 21
2.3.2 Exopolysaccharides ....................................................................................... 23
2.3.2.1 Production .................................................................................... 23
2.3.2.2 Appearance ................................................................................... 24
2.3.2.3 Monomers Composition (HPLC) ..................................................... 24
2.3.2.4 Phenolic Compounds and Antioxidant Activity ............................. 25
2.4 Conclusions .................................................................................................................. 27
References ......................................................................................................................... 28
Chapter 3: Cosmetic Products – An Overview ................................................................................. 32
3.1 Cosmetics ...................................................................................................................... 32
3.1.1 History and Definitions ............................................................................................... 32
3.1.2 Industry Overview ..................................................................................................... 32
3.1.3 Cosmetics Classification ............................................................................................. 34
3.1.4 Raw materials and cosmetic formulations ................................................................. 34

iv
3.1.4.1 Kaolin ......................................................................................................... 36
3.1.5 Innovations in Cosmetics ........................................................................................... 38
3.1.5.1 Microalgae and Algae Products in Cosmetic Application ........................... 39
3.1.6 Human Skin ................................................................................................................ 39
3.2 Conclusions .................................................................................................................. 41
References ......................................................................................................................... 42
Chapter 4: Creams Formulation and Experimental Design ............................................................. 43
4.1 Introduction .................................................................................................................. 43
4.1.1 Biomass Extract in Cream Formulation....................................................................... 45
4.1.2 EPS in Cream Formulation ......................................................................................... 45
4.1.3 Experimental Design .................................................................................................. 46
4.2 Conclusions .................................................................................................................. 47
References ......................................................................................................................... 48
Chapter 5: Rheological Analysis ...................................................................................................... 49
5.1 Rheology ...................................................................................................................... 49
5.1.1 Fluids Rheology .......................................................................................................... 49
5.1.1.1 Newtonian liquids ...................................................................................... 51
5.1.1.2 Non-Newtonian Fluids ............................................................................... 52
5.1.1.3 Viscoelastic Behavior ................................................................................. 53
5.2 Materials and Methods ............................................................................................... 55
5.3 Results and Discussion ................................................................................................. 55
5.3.1 Stress Ramp Test ....................................................................................................... 55
5.3.2 Minimum Apparent Viscosity .................................................................................... 57
5.3.3 Tension Scan .............................................................................................................. 57
5.3.4 Frequency Scan .......................................................................................................... 59
5.3.5 Creep and Recovery ................................................................................................... 60
5.3.6 Rheological and Sensorial Data Correlation ............................................................... 61
5.4 Conclusions .................................................................................................................. 62
References ......................................................................................................................... 63
Chapter 6: Accelerated Stability Analysis ........................................................................................ 65
6.1 Introduction ................................................................................................................. 65
6.1.1 Preliminar Stability .................................................................................................... 66
6.1.1.1 Freeze-thaw ............................................................................................... 66
6.1.1.2 Centrifugation ............................................................................................ 66
6.1.2 Accelerated Stability .................................................................................................. 67
6.1.2.1 Aspect ........................................................................................................ 67

v
6.1.2.2 Color and Odor .......................................................................................... 68
6.1.2.3 pH .............................................................................................................. 68
6.1.2.4 Water Activity ............................................................................................ 68
6.1.2.5 Volatile Compounds ................................................................................... 69
6.1.2.6 Spreadability .............................................................................................. 69
6.1.2.7 Microbiology .............................................................................................. 70
6.1.2.7.1 Sterilization ................................................................................ 70
6.1.2.7.1.1 UV .............................................................................. 70
6.1.2.7.1.2 Autoclave ................................................................... 71
6.1.2.7.1.3 Pasteurization ............................................................ 72
6.2 Materials and Methods ............................................................................................... 72
6.2.1 Preliminary Stability ................................................................................................... 73
6.2.1.1 Freeze-Thaw .............................................................................................. 73
6.2.1.2 Centrifugation ............................................................................................ 73
6.2.2 Accelerated Stability .................................................................................................. 73
6.2.2.1 Aspect, Color and Odor .............................................................................. 73
6.2.2.2 pH .............................................................................................................. 73
6.2.2.3 Water Activity ............................................................................................ 74
6.2.2.4 Volatile Compounds ................................................................................... 74
6.2.2.5 Spreadability .............................................................................................. 74
6.2.2.6 Microbiology .............................................................................................. 74
6.2.2.6.1 Sterilization ............................................................................................. 75
6.3 Results and Discussion ................................................................................................. 75
6.3.1 Freeze-Thaw .............................................................................................................. 75
6.3.2 Centrifugation ............................................................................................................ 75
6.3.3 Color, Aspect and Odor .............................................................................................. 75
6.3.4 pH .............................................................................................................................. 78
6.3.5 Water Activity ............................................................................................................ 78
6.3.6 Volatile Compounds .................................................................................................. 81
6.3.7 Spreadability .............................................................................................................. 81
6.3.8 Microbiology .............................................................................................................. 83
6.3.8.1 Sterilization ................................................................................................ 84
6.4 Conclusions .................................................................................................................. 85
References ......................................................................................................................... 86
General Conclusion ......................................................................................................................... 88

viii
List of Abbreviations
TPCS – Toiletry, Perfumery Cosmetics Sector EPS - Exopolysaccharide GRAS – Generally Recognized as Safe FDA – Food and Drug Administration LPS – Lipopolyssacharide CPS – Capsular Polyssacharyde ROS – Reactive Oxygen Species DNA – Desoxiribonucleic Acid ABTS - 2,2'-azino-bis(3-ethylbenzthiazoline-6-sulphonic acid) FRAP - Ferric reducing antioxidant power ORAC - Oxygen Radical Absorbance Capacity IC 50 - Half maximal inhibitory concentration UFSM-RS – Universidade Federal de Santa Maria – Rio Grande do Sul MERCOSUL – Mercado Comum do Sul EU – European Union RDC - Resolução da Diretoria Colegiada da Anvisa SEBRAE – Serviço Brasileiro de Apoio às Micro e Pequenas Empresas SECEX - Secretaria Executiva do Ministério do Desenvolvimento Agrário
BHA - 2 and 3-terc-butil-4-hidroxianisol BHT - Butil Hidroxi Tolueno ANVISA - Agência Nacional de Vigilância Sanitária ABIHPEC - Associação Brasileira da Indústria de Higiene Pessoal, Perfumaria e Cosméticos LEB – Laboratório de Engenharia de Microalgas HPLC - High Performance Liquide Chromatography DPPH - 2,2-diphenyl-1-picrylhydrazyl UHT – Ultra High Temperature PDA – Potato Dextrose Agar NA – Nutrient Agar
9
Chapter 1
General Introduction
Toiletry, Perfumery and Cosmetics Sector (TPCS) occupies a prominent place
in modern society. The search for beauty and wellness, combined with increased life
expectancy of the population, causes the intensive search to products that improve
appearance, hygiene and health. Thus, the development of cosmetics is very
stimulated. Another important feature is the continuously pressure from consumers and
companies to this development of new and innovative products, raising
competitiveness. Based on this, large sums are being annually invested in this area.
Innovation is the world in cosmetic industry. One of the biggest sources of
innovation are the additives, which play a role ranging from improvement sensory
properties to protection of the skin against free radicals.
With respect to these additives, most are of synthetic origin. Nowadays, their
safety and the way they are obtained is being questioned, once negative effects of
classical substances used through years are being founded. Thus, attempts to find
natural substances capable of replacing these synthetic ingredients are being made, in
association with principles of environmental sustainability. Therefore, developing
biotechnological products has emerged as an important alternative for achieving
efficient and safe additives for cosmetic use. This work fits in this context, aiming to
study the potential application of Spirulina platensis biomass and exopolysaccharide
(EPS) in cosmetic products.
The general objective of this work is:
Evaluate the effects of the cyanobacteria S. platensis biomass and EPS
addition in cosmetics searching a new cosmetic formulation.
The specific objectives were determined as:
Promote microalgae growth and evaluate growth parameters, EPS
production and biomass composition;
Asses the phenolic compounds in S. platensis biomass and EPS and their
antioxidant potential;
Evaluate the rheological characteristics of the addition of biomass and EPS
in a moisturizer for the face skin and propose a formulation;
Assay cream stability through pH, color, odor, general aspect, spreadability,
volatile acids and microbiology;
Evaluate the new formulation for skin irritability in guinea pigs;
Sensory analysis of the new formulation in panel members.

10
Chapter 2
Cultivation of Spirulina platensis and the obtaining of its Biomass and
Exopolysaccharide (EPS)
2.1 Introduction
Biodiversity represents the biological diversity of a particular place and is yet not
enough explored and elucidated on the planet. The value associated to it exploration is
immeasurable, since even many compounds that could be used in medicines, foods,
fertilizers, pesticides, cosmetics, solvents, plastics, energy, etc, can be discovered.
However, it is difficult to measure how much this untapped biodiversity worth. Some
studies have estimated its value at about U$ 4 trillion (Cunha, 2009). However, the
most important thing is not to determine its real economic value, but to relate the
findings to development for mankind through its sustainable use.
2.1.1 Microalgae and Cyanobacterium
Microalgae are quite diverse form of life, including nine phyla of eukaryotic
organisms and two prokaryotes phyla. These organisms occupy virtually all types of
biosphere environments, such as fresh and salt water, ice, soil, rocks and tree bark,
occurring even in extreme environments such as deserts and polar regions, thanks to
its efficient morpho-physiological adaptations (Van den Hoek et al., 1995). From a
phylogenetic standpoint, microalgae range from very primitive (such as euglenoids) to
modern lineages (such as some green algae) (Van den Hoek et al., 1995), setting more
functional classification than taxonomical.
This evolutionary lines variety, shapes and physiological mechanisms, makes
microalgae a group that produces a wide variety of chemical compounds with potential
application in the food, cosmetic, pharmaceutical and even energy production
(Olaizola, 2003). Coupled with the large production potential of microalgae as industrial
producer of interesting compounds it is observed the ease isolation from natural
environments and ease cultivation in culture collections (Lourenço, 2004).
2.1.1.1 Spirulina platensis Biomass Characteristics and Composition
Spirulina platensis is a bacterium belonging to the cyanobacterium. It is
unicellular but grouped to form trichomes or filamentous forms (Figure 2.1). Their cell
wall contains peptidoglycan in its composition and structure, thus classified as Gram
negative. In the cytoplasm there are inclusions bodies (granules of polyphosphate,

11
glycogen and cinanophycine), the carboxysome polyhedral bodies (where RuBisCO,
the main enzyme responsible for photosynthetic fixation of carbon dioxide, is situated)
and 70S ribosomes.
Fig. 2.1: Spirulina platensis micrography (http://www.shigen.nig.ac.jp/algae/top.jsp)
The use of Spirulina sp. for food is not new, since there is evidence of its use by
that the Aztecs. Also other ancient societies in the region of Lake Chad, in Africa, also
included in their usual diet Spirulina in the form of cakes.
Despite knowing this bacterium for centuries, it was in the last half of the
twentieth century that it began to be used industrially. This is a crop suitable for dry
areas where the salinity of the water is not fit for their traditional agricultural
employment. Indeed, Spirulina industrial cultivation did not begin until 1962 in the area
of Chad.
Nowadays its main application is in feeding, mainly in the form of pills or tablets,
but it's also used as a source of pigments, such as phycocyanin or xanthophylls, and
polyunsaturated fatty acids. Due to the high protein content it is also studied as a
substitute of soy protein and as food for fish. Lots of other possible applications are
under cevelopment.
Spirulina platensis is a microalga whose composition is suitable for use as food
supplement and can be used to combat malnutrition (Fox, 1996). It’s composition
includes high levels of protein (64-74%), polyunsaturated fatty acids and vitamins
(Cohen, 1997), and antioxidant compounds (Collar et al., 2007). This microalgae is
classified as GRAS (Generally Recognized as Safe) by FDA (Food and Drug
Administration), which ensures its use as food without risk to health.
In microalgae culture, the source of nutrients is economically the second
influence in high production costs (Vonshak, 1997). Cost reducing studies were
performed, showing that reducing the Zarrouk medium (the standard medium for

12
Spirulina cultivation) composition to 10 or 20% of its original medium, does not
influence significantly biomass productivity (Pinto, 2004).
The carbon source in the standard medium for growth of Spirulina is sodium
bicarbonate (Zarrouk, 1966), which supplies CO2 for photosynthesis. Recently other
carbon sources, such as CO2 have been studied for the cultivation of microalgae
(Morais & Costa, 2007). Although it uses photosynthesis metabolism to obtain carbon,
Spirulina is able to assimilate organic substrates in mixotrophy cultures (Andrade &
Costa, 2007; Marquez et al., 1993).
2.1.2 Polysaccharides Sources
Polysaccharides with industrial applications are usually extracted from plants
(including algae), animals, or obtained through microbial fermentation, such as
microalgae, bacteria and fungi. In higher plants they can be obtained from exudates,
seeds, fruits and tubers.
Algae, specially red and brown ones, produce various types of polysaccharides,
such as agaranas, carrageranas and alginates. Plant seeds structural or reservation
polysaccharides include galactomannans, xyloglucans, mannans and glucans; the first
two being used in industrial applications. Some plants produce exudates, which
contains polysaccharides containing glucuronic and galacturonic acids, that function in
the defense against stress caused by physical injuries and even microbial attacks.
Fruits are important sources of pectin, a heteropolysaccharide constituent of their cell
wall. Tubers and cereals are the most important sources of starch, the most important
reserve polysaccharide of plants. (Cunha, 2009)
Polysaccharides such as hyaluronic acid and heparin can be obtained from
animals. extracted from the vitreous humor of cattle or poultry crests and from the
lungs of cattle and pig intestine, respectively.
2.1.3 Purification and Structural Analysis
Awareness of the importance of analyzing the structure of saccharide
substances in recognition of their properties and biological roles has promoted the
increasing development of methods to analyze the structure and stereochemistry of
complex oligo and polysaccharides. Polysaccharide analysis is complicated due to its
branching and monosaccharide bindings, unlike nucleic acids and proteins. The
analysis of oligosaccharides should be done after the withdrawal of other related
biomolecules such as proteins and/or lipids. It is then subjected to stages of
degradation, with specific reagents, which show the position of the bounds and/or the

13
stereochemistry of the molecule. Other techniques such as mass spectrometry and
NMR spectrometry also bring relevant analysis to assist in the elucidation of the
structures of molecules. (Lehninger, 2003)
2.1.4 Applications
Extracellular polymeric substances produced by many microorganisms are
applied widely in adhesives, food, and beverage industries (Sutherland 1996),
pharmaceuticals (Benedetti et al. 1989), oil and metal recovery from ore and industry
(Gutnick 1997), because of its special physico-chemical and physiological activation
characteristics, such as stabilizing, suspending, gelling and water-retention capability
(Morgante et al. 2007).
Polysaccharides have a wide range of applications in the areas food,
pharmaceutical, cosmetic, especially as stabilizing agents, thickeners, gelling and
retaining moisture. Biotechnological applications are the most extensive, ranging from
immobilization of enzymes, biosensor, drug delivery vehicles, to substitute for blood
plasma and preparation of resins used for the separation and purification of
substances. Furthermore, the polysaccharides have been investigated for their
potential as antiviral agents, stimulating the immune system, antitumor, antioxidant,
antithrombotic and anticoagulants.
2.1.5 Microbial Polysaccharides
2.1.5.1 Definitions, Characteristics and Classification
Carbohydrates are the most abundant biomolecules on Earth. They are
predominantly cyclic polihidroxialdehyde or polihidroxicetones, or substances that
release these compounds by hydrolysis. Many carbohydrates are described by the
general formula (CH2O)n, but some also contain nitrogen, phosphorus or sulfur. They
are divided into three main classes according to their size: monosaccharides,
oligosaccharides or polysaccharides.
Monosaccharides, also called simple sugars, consist of a single molecule of
polihidroxialdehyde or ketone. The most abundant in nature is the D-glucose, also
called dextrose.
Oligosaccharides are composed of short chains formed by monosaccharide
units, which are joined by glycosidic bonds. Among the oligosaccharides, one example
is the disaccharides, formed by two monosaccharides (Lehningher, 2003).
The polysaccharides, also called glycans, are composed of at least 20
monosaccharide units, reaching hundreds or thousands. These chains can be linear or

14
branched, and the linkages between the monomers can be of different types. .
Polysaccharides differ based on the monosaccharide composition, the length of the
chains and their degree of branching. Considering monosaccharide composition,
polysaccharides can be classified in homo-polysaccharide (a single kind of monomer
unit) or hetero-polysaccharide (two or more kinds of monomeric units).
Polysaccharides usually have defined molecular weights, a consequence of its
the assembly mechanism. During the synthesis, enzymes that catalyze the
polymerization of monomer units are regulated by specific programs to build the
molecules (Lehningher, 2003).
Polysaccharides have important functions, such as reserve of energy (starch,
glycogen) and as structural materials (cellulose, chitin, peptidoglycan). They can also
play a role as intracellular indicators and mediators in specific cell-cell and cell-
extracellular matrix interactions. They can bind to other biomolecules such as lipids and
proteins, forming glycoconjugates, which are commonly bioactive biomolecules
(Lehningher, 2003).
Microbial polysaccharides are present as cell wall components
(lipopolysaccharide or LPS), linked covalently to the cell surface (capsular
polysaccharides or CPS), or secreted into the extracellular medium (exo-
polysaccharides or EPS) (Boels et al., 2001). While the polysaccharide associated with
cell (CPS and LPS) have medical importance, many EPS have wide spectrum of
applications in the food industry and cosmetics, being used as thickeners, stabilizers,
emulsifiers, coagulants, films formers, suspending agents and dispersants,
(Sutherland, 1998; Stredansky et al., 1999).
The EPS are long chain polysaccharides secreted mainly by bacteria, although
they may also be produced during growth of microalgae, yeasts and fungi. They are not
linked to microbial cell surface (Laws et al., 2001) and, among other properties,
promote protection against limiting and/or toxic environments (Looijesteijn et al., 2001)
and contribute to colonization and cellular recognition (Roberts, 1996). Furthermore, it
should be noted that the polysaccharides extracted from plants and algae still dominate
the gums industry due to low production cost. The production cost is the main limiting
factors for the use of microbial EPS (Stredansky et al., 1999, De Vuyst et al., 2001).
The microbial biosynthesis of EPS is very complex. The biosynthetic pathway
can be divided into four separated sequences of reactions: the reactions involved in
sugar transport to the cytoplasm, the synthesis of sugar-1-phosphate activation and
binding of sugars, and the processes involved in the secretion of EPS (Kleerebezem et
al., 2000; De Vuyst et al., 2001, Laws et al., 2001). The EPS production seems to

15
occur during the logarithmic phase, and for some bacteria, continues during the
stationary phase of growth (Laws et al., 2001).
The fermentation conditions strongly influence the production of EPS. Studies
indicate that the best conditions for the production are usually different from the
optimum condition for cell growth due to the fact that production is related to responses
of microorganisms to stress conditions (Gamar et al., 1997). The effect of pH on EPS
production is based in the activity of enzymes glicosil-hydrolases responsible for
degradation of EPS after long fermentations. The optimum pH for EPS production will
be the one at which production and degradation are balanced (Pham et al., 2000, Laws
et al., 2001).
Commercial exploitation of exopolysaccharides as materials to improve the
texture and sensory characteristics of foods and cosmetics requires the synthesis of
EPS with adequate physical properties and in sufficient quantities to meet demand. A
major problem observed is the low level of production, varying from a few milligrams to
about 1 g/L (De Vuyst et al., 2001, Laws et al. 2001).
An increase in EPS production can be achieved through genetic manipulation or
through metabolic engineering. The determination of the mechanisms responsible for
controlling and regulating the biosynthesis of EPS, the level of genes and proteins, is
necessary for the production of EPS can be optimized (De Vuyst and Degeest, 1999;
Boels, et al. 2001; Laws et al., 2001).
2.1.5.2 Algal Polysaccharides
Microalgal polysaccharides are important metabolites, representing 40-90% of
organic compounds produced by them and showing a huge spectrum of compositions
and different molecular masses (Myklestad, 1995). In general polysaccharides from
microalgae can be divided in three major groups: reserve, structural and extracellular.
The main intracellular polysaccharides are the reserve ones, usually composed
by homogeneous glucans such as starch and its variations in cyanobacteria and
rodophites and crisolaminarina in heterokonts (diatomaceaes, crisoficeas, xantoficeas
and others) (Percival, 1979).
The structural polysaccharides, present mainly in cell walls, can greatly vary in
composition depending on the taxonomic group, including xylans, mannans, ramnans
(Carlberg and Percival, 1977) and various glycoproteins (Morita et al., 1999), being
used as an important criterion in the definition of phyla, classes and orders of
microalgae (Reviers, 2006).
Extracellular polysaccharides, which are quite representative in the quantitative
point of view (Paulsen and Vieira, 1994), also have a very variable composition and

16
can form compounds as homogeneous fucans (Giroldo and Vieira, 2002), mannans
(Vieira et al. 2006), arabinogalactan (Kiemle et al., 2007), and heteropolysaccharide
with five or more components (Giroldo and Vieira, 2005). This group of sugars is less
known, both in terms of composition, structure and biological functions (Giroldo et al.,
2003).
The lack of information about extracellular polysaccharides in most species of
microalgae is a consequence of the no relation between the kind of polysaccharide
production and the phylogenetic classification, mainly in reserve and structural
polysaccharides. In addition, there are few studies on characterization of these
polysaccharides in the taxonomic groups.
Besides the interesting functions performed by these extracellular
polysaccharides, many of these compounds have known biological activity (Olaizola,
2003). The wide range of fractions with different molecular weights and different
compositions, produced by several not studied species of microalgae, shows the
possibility of discovering innumerous bioactive compounds. Among the potential
polysaccharides with biological activity commonly observed in microalgae there are
fucans, arabinans, arabinogalactan and ramnogalacturanos (Paulsen, 2001).
Fucans are polysaccharides rich in fucose and has a broad spectrum of
biological activities including anticoagulant effect, anti-inflammatory,
immunostimulatory, anti-viral, anti-tumor and anti-metastasis (Cumashi et al., 2007).
The main sources are the brown algae (Class Phaeophyceae), particularly of the
Orders Laminariales and Fucales (Cumashi et al., 2007), which produces high sulfated
fucans known as fucoidan. Several species of microalgae can also produce fucans with
bioactivity, but tests in this area are still quite rare. Cryptomonas obovata,
Tetrapyrenoidosa cryptomonas (Cryptophyceae), Duostra thalassiosira
(Bacillariophyceae) and Staurastrum orbiculare (Zygnematophyceae) are examples of
freshwater microalgae producers of fucose-rich polysaccharide (Giroldo and Vieira
2002; Giroldo et al., 2003).
Arabinans, arabinogalactan and ramnogalacturanos are often associated with a
class of compounds known as pectins, characterized by the presence of arabinose,
galactose and galacturonic acid. These compounds are very common in higher plants
and plants used in traditional medicine. Several species of algae, especially those
phylogenetically near higher plants, present cell wall pectins (Domozych et al., 2007).
Moreover, other green microalgae exhibit cell wall and extracellular polysaccharides
with characteristics similar to pectin, such as the glycoproteins (pherophorins) that form
the cell envelope typical of Bars and Volvocales Chlamydomonadales (Morita et al.,
1999). The immunostimulating activity of Chlorella sp. (Chlorococcales) is directly

17
related to the presence of arabinose and galactose rich polysaccharide (Kralovec et al.,
2007).
Considering the aspects described, it is evident that the production of bioactive
polysaccharide by microalgae should be urgently explored. Bioprospecting shows out
as an indispensable tool for the discovery of new substances of human interest.
2.1.5.2.1 Spirulina platensis Exopolysaccharides
Spirulina sp. secretes sulfated exopolysaccharides through capsule formation
and gradually releasing in the culture medium, where it is first dissolved by making it
more thick and ends by forming yellow-brown microscopic lumps of varying size
(Pinotti, 2004).
EPS production frequently occurs at high and low pH and under strong light
(Cornet, 1992). Strong production of EPS is an efficiency loss and led to harvesting
difficulties, such as an inability to wring pressing the biomass. Otherwise, the presence
of a certain amount of EPS in medium appears to facilitate the harvest, occasionally
causing flocculation.
The promising applications of the Spirulina EPS are related to your biological
activity, and so many properties are being investigated, like antitumor, antioxidant,
antibiotic, antiparasitic, etc. (Pinotti, 2004)
2.1.6 Antioxidant Potential
Several studies have pointed out the crucial role of free radicals and other
oxidants as responsible for aging and the cause of many degenerative diseases such
as cancer, cardiovascular diseases, immune system reduced efficiency, cataracts,
brain dysfunction, etc. These free radicals, called reactive oxygen species (ROS), can
damage DNA, oxidize lipids and proteins. They attack the polyunsaturated fatty acid
chains of phospholipids and cholesterol, removing one hydrogen atom of the bis-allylic
methylene group, initiating the process of lipid peroxidation in cell membranes. The
carbon radicals formed through this reaction can react with oxygen, leading thus to
peroxyl radicals, which in turn can attack new chain polyunsaturated fatty acids,
propagating the reaction, and the result is the oxidation of various molecules fatty
acids. These hydroperoxides formed by lipid peroxidation have short life and when they
react with metals, form aldehydes (eg malondialdehyde, acrolein and crotonaldehyde)
and epoxides, which are reactive and cause damage to the “DNA again”. (Atoui, 2005,
Sousa et al, 2007)

18
The body free radical production is controlled by various compounds and
antioxidants, which are endogenous (eg the enzyme superoxide dismutase) or from
feeding (eg tocopherols (vitamin E), ascorbic acid (vitamin C), polyphenols, selenium
and carotenoids). Antioxidants are able to stabilize or disable free radicals. The lack of
antioxidants causes a cumulative damage (Atoui, 2005).
According to Souza et al (2007), antioxidants can be considered substances
that, in low concentrations, significantly retard or inhibit the oxidation of the substrate,
whereas the reaction product between subtances capable of producing radicals and an
antioxidant radical is stable and do not propagate in chain. The antioxidant capacity of
a substance is the potential to capture and stabilize a given quantity of free radicals.
There are several methodologies available to evaluate this capacity. According to
Thaipong et al (2006), the following chemicals or processes are used to generate free
radicals: 2,2 - azinobis (3-ethyl-benzothiazoline-6-sulfonic acid) (ABTS); 2,2-diphenyl-
1-picrylhydrazyl (DPPH), Ferric Reducing Antioxidant Power (FRAP) and oxygen
radical absorption capacity (ORAC).
The chemiluminescence method is based on the principle of absorption of
photons emitted by the luminol when it reacts with the free radicals produced by the
combination of hydrogen peroxide and a peroxidase enzyme. The addition of an
antioxidant substance, leading to the neutralization of free radicals, leads to a decrease
in the emission of photons (Cheng et al., 2003).
The ability of a substance to neutralize free radicals is expressed in terms of
IC50, which expresses the amount of sample required to inhibit 50% of free radicals to
which it is exposed. Thus, the lower is the substance’s IC50, the greater is its
antioxidant potential (low sample concentration is able to inhibit a large amount of free
radicals). Strong antioxidant substances such as rutin and gallic acid, have IC50 values
about 27.80 mg/mL and 24.27 mg/mL, respectively (Souza et al, 2007).
In the food industry, lipid oxidation is undesirable and is inhibit through the use of
free radical scavengers. The most common substances used for this purpose are
butylated hydroxy anisole (BHA), butylated hydroxy toluene (BHT), tert-butyl hydroxy
quinone (TBHQ) tri-hydroxy-butyl fenona (THBP) and epigallocatechin gallate propyl
(GP) (Souza et al, 2007). Some studies have demonstrated toxic effects of synthetic
antioxidants ( Botterweck et al, 2000, Cruces-Blanco et al, 1999). Therefore, intensive
researches of natural sources of antioxidants are being done, aiming to reduce or even
avoid the use of synthetic compounds.

19
2.2 Materials and Methods
2.2.1 Biomass
S. platensis strain LEB-52 were obtained from Federal University of Santa
Maria (UFSM, Brazil) and cultivated in 6L Erlenmeyer (4L working volume) at 30°C in
Zarrouk medium. Illumination was provided by eight cool white 32W fluorescent lamps
(3500 lux) in 12:12 h (light/dark) photoperiod. Experiments duration were 15 days.
The agitation was realized with sterile air injection at 0.2-0.3vvm. The initial
concentration of S. platensis was 0.23 g.L-1. Biomass growth was monitored daily by
dry weight. Evaluations of maximum biomass concentration (Xmax, g.L-1) and
maxiumum productivity (Pmax, g.L-1.day-1) were carried. The maximun productivity was
obtained according to the equation P = (Xt X0)/(t t0), where Xt is the biomass
concentration (g.L-1) at time t (day), and X0 was the biomass concentration (g.L-1) at
time t0 (day). The maximum specific growth velocity (µmáx, day-1) was obtained by linear
exponencial regression applied to the logarithmic growth phase (Bailey & Ollis, 1986).
�� ��i
i
tt
NN
���˜��
� 303,2loglog
�P
Samples were withdrawn daily and centrifuged in a Sorvall Legend Mach 1.6 R
centrifuge (Sorvall, Germany) at 16800g for 15 min. Cells were washed once and dried
at 60°C until constant weight, while the cell-free medium was used for further analysis
of total sugars by the phenol–sulfuric method (Dubois et al., 1956), predicting the EPS
production.
The dried biomass was analyzed for chlorophylls, carbohydrates, proteins, lipids
and ash. Pigments were extracted with 90% acetone and the quantification followed
the equations suggested by Strickland and Parsons (1968). Lipids were determined by
extraction with methanol:chloroform 1:1 (Bligh and Dyer, 1959) followed by a liquid–
liquid extraction with hexane (Sydney et al 2010). Ash was quantified by the AOAC
941.12 method, while phenol–sulfuric method (Dubois et al., 1956) was used for total
carbohydrate and the Lowry method (Lowry, 1951) for protein determination. The
phenolic compounds were quantified by the Folin-Ciocalteu method (Costa, 2010), and
the antioxidant potential was determined using two different methodologies: the 2,2-
diphenyl-1-picrylhydrazyl (DPPH) assay system and chemiluminescence assay
(Cheng, 2003) using a 10% (w/v) biomass aqueous extract.

20
2.2.2 Exopolysaccharides
Samples collected at various intervals from shake flask were vacuum filtered by
filter-paper (Whatman 1). The resulting culture filtrate was concentrated to ¼ of the
original volume by rotary evaporator below 50°C. The filtrated was dialyzed in a
membrane with 12-14 KDa cutoff. For EPS precipitation, four volumes of absolute
ethanol was used, stirring vigorously and left overnight at 4°C. After centrifugation at
16800xg for 10 min, the supernatant was discarded. The pure EPS was lyophilized and
the weighted.
The extracellular polysaccharide concentration was determined according to the
classical method of Dubois et al. (1956) using glucose solution as a standard
reference.
The EPS composition analysis was performed in a Shimadzu HPLC (High
Performance Liquid Chromatrography) equipped with a refractive index detector. The
column used was Aminex HPX87H. Analytical conditions were: H2SO4 5mM, 60°C,
0,6mL/min.
The antioxidant potential of samples was determined using the DPPH and the
chemiluminescence method. The analysis of phenolic compounds was performed
through the Folin-Cicauteau method.
2.3 Results and Discussion
2.3.1 Biomass
2.3.1.1. Growth and Composition Analysis
The S. platensis growth pattern can be seen in figure 2.2. It’s an expected
behavior, showing a lag phase (until day 5), a log phase (between days 5 and 12) and
the beginning of the stationary phase.
Fig. 2.2: S. platensis grow pattern, during 15 days.

21
The Xmax achieved was 1,44g.L-¹, and the maximum productivity Pmax was
0,42g.L-¹.d-¹, and µmax 0,43 day-1.
The S. platensis general biomass composition in terms of protein, sugars,
pigments, lipids and ash is showed in table 2.1. The composition is in accordance to
other works (Andrade & Costa, 2008; Sydney et al, 2010).
Protein (%) Sugars (%) Pigments (%) Lipids (%) Ash (%)
Spirulina
platensis
LEB-52
52.33 ± 1.5 10.6 ± 0.92 16.32 ± 2.1 10.3 ± 1.7 6.81 ± 1.6
Table 2.1: S. platensis biomass centesimal composition.
2.3.1.2 Phenolic Compounds
Phenolic compounds test was performed in the and in the polysaccharides,
using a biomass water dissolution at 10% (v/w). S. platensis contains many pigments,
including chlorophyll-a, xanthophyll, betacarotene, echinenone, myxoxanthophyll,
zeaxanthin, canthaxanthin, diatoxanthin, 3'-hydroxyechinenone, beta-cryptoxanthin and
oscillaxanthin, plus the phycobiliproteins c-phycocyanin and allophycocyanin (Vonshak,
1997). All the enumerated pigments have unless a phenolic characteristic region and
they can play a role as antioxidants. The total phenolic compounds was equal to
150.39 mg in 100 g of biomass.
The amount of Chlorophylls a and b and the Carotenoids are shown in Table
2.2.
2.3.1.3 Antioxidant Potential
Initially, qualitative tests were performed with aqueous biomass and
polysaccharide extracts. A 10% water dissolution of these samples were tested against
0.2 µL of reagent DPPH. The biomass sample caused the discoloration in a test tube (it
was originally purple), and thus was deemed to contain antioxidant potential. However,
perhaps due to the existing color in this extract of biomass, the final color in the tube
was not yellow (corresponding to the coloring of the total free radical inhibition) (Figure
Pigments (mg/m³)
Chlorophyll a 297,8
Chlorophyll b 133,78
Carotenoids 68,44
Table 2.2: Chlorophyll and Carotenoids quantification S. platensis biomass.

22
2.3). Despite the indication of potential antioxidant, in this sample it was not possible to
obtain the antioxidant potential curve due to the method used, DPPH.
(a) (b)
Fig. 2.3: Aqueous biomass extract dilutions to perform the DPPH test (a) and the DPPH test results (b). Note the purple color disappearance in tubes and the green color influence (b).
Thus, we used another method to quantify the antioxidant potential of the
biomass of S. platensis: the method of luminol-dependent chemiluminescence. This
method is fast, reliable and effective in determining the ability of some antioxidants is to
neutralize free radicals (Cheng et al, 2003).
Bar graphs shown in figure 2.4 indicate the signal measured by the equipment
(Greater area under the curve AUC-detected), proportional to the free radical content.
Thus, higher antioxidant power of the sample will result in lower AUC. The solvent used
in dilutions was phosphate buffer, pH 7.4. A control was made with distillated water.
It was conclude (Figure 2.4) that the biomass sample had a capacity of almost
100% inhibition of free radicals by at a concentration of 2.0 mg/mL. Thus, the sample’s
IC50 can be calculated, which is equivalent to 0.962 mg/ml.
As a parameter, are normally used in food industry the BHT (di-tert-butyl-methyl
phenol) with an IC50 of 12.5 µg/mL, and BHA (tert-butyl-4-hydroxyanisole), with an IC50
of 2.97 µg/mL.

23
Fig. 2.4: The luminol-dependent chemiluminescence assay results of S. platensis aqueous biomass extract in different concentrations.
2.3.2 Exopolysaccharides
2.3.2.1 Production
The S. platensis EPS production was accompanied during 14 days, reaching
0.46g.L-1 (Figure 2.5), what means 0,183gEPS/gbiomass (18.3%). Neto et al (2004)
reached 20% to the cianobacterium Mastigocladus laminosum. The theoretical balance
for Spirulina platensis (Cogne, 2003) shows that this value can reach 51%. It indicates
that EPS production can be much more enhanced.
In figure 2.5, it is possible to see the enhanced EPS production in the middle-
end of the growing period. EPS production is associated to nitrogen deficiency or
phosphate absence (De Phillipis; Vincenzini, 1998). This explains why, besides its
proportionality to biomass concentration, EPS production was greatly increased after
the beginning of the stationary phase of growth.
Fig. 2.5: S. platensis EPS production curve in the 15-days experiment.

24
2.3.2.2 Appearance
The no-dialyzed lyophilized EPS has a very similar appearance to kaolim. Both are
powdered, clear and low density (Fig. 2.6).
Fig. 2.6: The general powdered appearance of Kaolin sample (a) and liophilizated Spirulina platensis EPS (b).
2.3.2.3 Monomers Composition (HPLC)
Until 1988, 70 cyanobacteria strains were studied for EPS production (de
Philippis e Vicenzini, 1998). Glucose is the monosaccharide most found in
cyanobacterial EPS is glucose (90%), followed by galactose, mannose and rhamnose
(80-85%).Cyanobacterial EPS showed the following monosaccharides in their
composition:
(i) Hexoses: glucose, galactose and mannose;
(ii) Pentoses: ribose, xylose and arabinose;
(iii) Deoxhyhexoses: fucose and rhamnose;
(iv) Acid monosaccharides: glucuronic and galacturonic acids.
The monosaccharide composition of the EPS produced is showed in table 2.3.
Hexoses was founded to be the main constituents of the EPS (glucose, mannose and
galactose), but high amount of pentoses was also observed (rhamnose and fucose).
a b

25
Compounds % Protein content 49.2 Carbohydrate content 42.1
Monosaccharide mol % Rhamnose 11.5 Fucose 13.4 Ribulose 1.7 Arabinose 1.7 Xylose 6.5 Mannose 25.1 Glucose 24.3 Galactose 16.0 Table 2.3: EPS protein and carbohydrate content and its monosaccharide composition.
2.3.2.4 Phenolic Compounds and Antioxidant Activity
The phenolic quantity in the EPS was equal to 7.44 mg (in 100 g of EPS
sample).
To the DPPH assay a dissolution of 10% (w/v) was prepared. This solution was
diluted (fig. 2.7 – a) and the assay was carried. It was observed a slight decrease in the
purple coloration (fig. 2.7 – b) and also the appearance of turbidity. So this test was
only used as a qualitative analysis: the free radical scavenging exists for this sample,
but can’t be measured by this method.
Fig. 2.7: Aqueous EPS dilutions to perform the DPPH test (a) and the DPPH test results (b). Note the purple color disappearance in tubes and turbidity appearing (b).
To quantify the EPS antioxidant potential the luminol-dependent
chemiluminescence method was performed. EPS IC50 was equal to 2.878 mg/ml. This
value is three times higher than the biomass extract IC50, what means that the biomass
extract is three times more efficient against free radical than the EPS.

26
Fig. 2.8: The luminol-dependent chemiluminescence assay results of S. platensis EPS in different concentrations.

27
2.4 Conclusions
It was possible to cultivate Spirulina platensis and obtain biomass and EPS at
usual levels;
The biomass and EPS analysis were performed and their composition are
similar to those described in the literature;
It was found that the S. platensis EPS has a protein-glucan nature;
The antioxidant capacity test demonstrated the potential of S. platensis biomass
and EPS for cosmetics application;
It was observed potential possibility to replace or unless diminish the use of
synthetic antioxidant substances, like BHA and BHT, by S. platensis biomass
extracts;
S. platensis EPS showed visual similarity to Kaolim, which is a mineral used in
cosmetic industry to improve rheological and sensorial properties.

28
References
Andrade, M. R.; Costa, J. A. V. Mixotrophic cultivation of microalga Spirulina platensis using molasses as organic substrate. Aquaculture, Amsterdam, v. 264, p. 130-134, 2007. Atoui, A. K.; Mansouri, A.; Boskou, G.; Kefalas, P.; Food Chem. 2005, 89, 27; Barreiros, A. L. B. S.; David, J. M.; David, J. P.; Quim. Nova 2006, 29, 113. Benedetti L.M., Topp E., Stella V.J. A novel drug delivery system: microspheres of hyaluronic acid derivatives. In: Sutherland IW (ed) Biomedical and biotechnological advances in industrial polysaccharides. Gordon and Breach, New York, NY, pp 27–33, 1959 Bligh, E.G., Dyer, W.J. A rapid method for total lipid extraction and purification. Can. J. Biochem. Physiol. 37, 911–917, 1959. Boels IC, Van Kranenburg R, Hugenholtz J, Kleerebezem M, de Vos WM. Sugar catabolism and its impact on the biosynthesis and engineering of exopolysacharide production in lactic acid bacteria. International Dairy Journal, v. 11, p. 723-732, 2001.
Botterweck, A. A. M.; Verhagen, H.; Goldbohm, R. A.; Kleinjans, J.; Food Chem. Toxicol. 2000, 38, 599. Carlberg, G. E., Percival, E. Carbohydrates of green seaweeds belonging to genus Urospora. 2. Carbohydrates of green seaweeds urospora - wormskioldii and codiolum - pusillum. Carbohydrate Research 57, 223 – 234, 1977. Cheng, K. & Leung, P. General review of polysaccharopeptides (PSP) from C. versicolor: Pharmacological and clinical studies. Cancer Therapy 6: 117-130. 2008. Cogne, G., Gros, J.B., Dussap, C.G. Identification of a Metabolic Network Structure Representative of Arthospira (Spirulina) platensis Metabolism. Biotechnology and Bioengineering, Vol. 84, n°6, December 20, 2003. Cohen, Z. The chemicals of Spirulina. In: Vonshak, A. Spirulina platensis (Arthrospira) physiology, cell-biology and biotechnology. London: Taylor & Francis, 1997. 233 p. Colla, L. M.; Reinehr, C. O.; Reichert, C.; Costa, J. A. V. Production of biomass and nutraceutical compounds by Spirulina platensis under different temperature and nitrogen regimes. Bioresource Technology, v. 98, n. 7, p. 1489-1493, May 2007. Cornet, J.F., 1992. Etude cinétique et énergétique d’un photobioréacteur. Etablissement d’un modèle structuré. Applications à un écosystème clos artificiel. Ph.D. Thesis. University of Paris XI.
Costa, D.A., Chaves, M.H., Silva, W.C.S, Costi, C.H.S. Constituintes químicos, fenóis totais e
atividade antioxidante de Sterculia striata St. Hil. et Naudin. Acta Amaz. vol.40 n°.1 Manaus, Mar. 2010 Cumashi, N.A. Ushakova, M.E. Preobrazhenskaya, A. D’Incecco, A. Piccoli and T. Licia et al., A comparative study of the anti-inflammatory, anti-coagulant, anti-angiogenic and anti-adhesive activities of nine different fucoidans from brown seaweeds, Glycobiology 17 (2007), pp. 541–552. Cunha P.L.R., Paula R.C.M. and Feitosa J.P.A. Polissacarídeos da biodiversidade brasileira: uma oportunidade de transformar conhecimento em valor econômico Quim. Nova, Vol. 32, No. 3, 649-660, 2009
Cruces-Blanco, C.; Carretero, A. S.; Boyle, E. M.; Gutiérrez, A. F.; Talanta 1999, 50, 1099.

29
De Philippis, R. & Vincenzini, M. 1998. Exocellular polysaccharides from cyanobacteria and their possible applications. FEMS Microbiol. Rev. 22: 151–75. De Vuyst, L., Degeest, B. Heteropolysaccharides from lactic acid bacteria. FEMS Microbiology Reviews, v. 25, p. 153-177. 1999. De Vuyst, L., De Vin, F., Vaningelgem, F., Degeest, B. Recent developments in the biosynthesis and applications of heteropolysaccharides from lactic acid bacteria. International Dairy Journal, v. 11, p. 687-707. 10. 2001. Domozych, D. S., Gretz, M. R. The extracellular polymeric substances of desmids (Conjugatophyceae, Streptophyta): chemistry, structural analyses and implications in wetland bio_lms. Phycologia, 46: 617 - 627. 2007. Dubois, M., Gilles, K.A., Hamilton, J.K., Rebers, P.A., Smith, E., 1956. Calorimetric method for determination of sugars and related substances. Anal. Chem. 28, 350–356. Fox, R. D. Spirulina production & potential. Paris: Edisud, 1996. 232 p. Gamar, L., Blondeau, K., Simonet, J. M. Physiological approach to extracellular polysaccharide production by Lactobacillus rhamnosus strain C83. Journal of Applied Microbiology, v. 83, p. 281-287. 1997. Giroldo, D. & Vieira, A. A. H. An extracellular sulphated fucose - rich polysaccharides produced by a tropical strain of C. obovata (Cryptophyceae). Journal of Applied Phycology 14, 185 – 191, 2002. Giroldo D., Vieira, A.A.H. & Paulsen, B. S. Relative increase of deoxy sugars during microbial degradation of an extracellular polysaccharide released by a tropical freshwater Thalassiosira sp. (Bacillariophyceae). Journal of Phycology 39, 1109 - 1115. 2003. Giroldo, D.& Vieira, A. A. H. Polymeric and free sugars released by three phytoplanktonic species from a freshwater tropical eutrophic reservoir. Journal of Plankton Research 27, 695 - 705. 2005. Gutnick D. Engineering polysaccharides for biosorption of heavy at oil/water interfaces. Res Microbiol 148:519–521. 1997. Kiemle, S. N., Domozych, D. S., Gretz, M. R. The extracellular polymeric substances of desmids
(Conjugatophyceae, Streptophyta): chemistry, structural analyses and implications in wetland
biofilms. Phycologia, 46. p.617-627. 2007.
Kleerebezem, M., Hols, P., Hugenholtz, J. Lactic acid bacteria as a cell factory: Rerouting of carbon metabolism in Lactococcus lactis by metabolic engineering. Enzyme and Microbial Technology, v. 26, p. 840-848. 2000.
Kralovec, J. A. et al. Immunostimulatory principles from Chlorella pyrenoidosa - Part 1: Isolation and biological assessment in vitro. Phytomedicine, 14. p.57 - 64. 2007. Laws, A., Gu, Y., Marshall, V. Biosynthesis, characterization and design of bacterial exopolysaccharides from lactic acid bacteria. Biotechnology Advances, v. 19, p. 597-625. 2001. Lehninger, A. I.; Nelson, D. L.; Cox, M. Princípios de bioquímica. 2 ed. São Paulo: Sarvier,
2003.

30
Looijesteijn, P. J., Trapet, L., De Vries, E., Abee, T., Hugenholtz, J. Physiological function of exopolysaccharides produced by Lactococcus lactis. International Journal of Food Microbiology, v. 64, p. 71-80, 2001. Lourenço, S. O. e Vieira A. A. H. Culture collections of microalgae in Brazil: progress and constraints. Nova Hedwigia 79 (1 - 2): 149 - 173. 2004. Lowry, O.H., Rosbrough, N.J., Farr, A.L., Randall, R.J. Protein measurement with the Folin phenol reagent. J. Biol. Chem. 193, 265–275.1951. Maruqez, F. J.; Sasaki, K.; Kakizono, T.; Nishio, N.; Nagai, S. Growth characteristics of Spirulina platensis in mixotrophic and heterotrophic conditions. Journal of Fermentation Bioengeneering, v. 5, p. 408-410, 1993. Morais, M. G.; Costa, J. A. V. Biofixation of carbon dioxide by Spirulina sp. and Scenedesmus obliquuscultivated in a three-stage serial tubular photobioreactor. Journal of Biotechnology, v. 129, n. 3, p. 439-445, May 2007. Morgante C, Castro S, Fabra A. Role of rhizobial EPS in the evasion of peanut defense response during the crack-entry infection process. Soil Biol Biochem 39:1222–1225, 2007. Morita, E. Abe, T., Tsuzuki, M., Fujiwara, S., Sato, N., Hirata, A., Sonoike, K. e Nozaki, H. Role of pyrenoids in the CO2-concentrating mechanism: comparative morphology, physiology and molecular phylogenetic analysis of closely related strains of Chlamydomonas and Chloromonas (Volvocales). Planta 208, 365-372. 1999. Myklestad, S. M. Release of extracellular products by phytoplankton with special emphasis on polysaccharides. The Science of Total Environment 165, 155 – 164, 1995. Olaizola M. Commercial development of microalgal biotechnology: from the test tube to the marketplace. Biomolecular Engineering 20: 459-466, 2003. Paulsen, B. S. & Vieira, A. A. H. Structural studies on extracellular dissolved and capsular polysaccharides produced by Spondylosium panduriforme. Journal of Phycology 30, 638 – 641, 1994. Paulsen, B. S. Plant polysaccharides with immunostimulatory activities. Current Organic Chemistry 5, 939 – 950, 2001. Percival, E. Polysaccharides of green, red and brown seaweeds - their basic structure, biosynthesis and function. British Phycological Journal 14, 103 – 117, 1979. Pham, P. L., Dupont, I., Roy, D., Lapointe, G., Cerning, J. (2000). Production of exopolysaccharide by Lactobacillus rhamnosus R and analysis of its enzymatic degradation during prolonged fermentation. Applied and Environmental Microbiology, v. 66, p. 2302-2310. Pinto, M.H., Arruda, A.S., Goldbeck, L., Andrade, M.R., Costa, J.A.V. Cultivo da Microalga Spirulina platensis com Concentração de Nutrientes Reduzida. XIX Congresso Regional de Iniciação Científica e Tecnológica em Engenharia – CRICTE 2004 – Curitiba - Paraná. 13 a 15 de Novembro de 2004 Pinotti, M. H., Neto D. C. Cyanobacterial Exopolysaccharides. Semina: Ciências Exatas e Tecnológicas, Londrina, v. 25, n. 1, p. 43-52, jan./jun. 2004 Reviers, B. Biologia e filogenia das algas. Artmed, Porto Alegre.280p. 2006. Roberts, I. S. The biochemistry and genetics of capsular polysaccharide production in bacteria. Annual Reviews of Microbiology, v. 50, p. 285-315, 1996.

31
Sousa, C.M. de M., et al. Fenóis Totais e Atividade Antioxidante de Cinco Plantas Medicinais. Química. Nova, Vol. 30, n°.2, p.351-355, 2007. Stredansky, M., Conti, E., Navarini, L., Bertocchi, C. Production of bacterial exopolysaccharides by solid substrate fermentation. Process Biochemistry, v. 34, p. 11-16. 1999. Strickland, J.D.H., Parsons, T.R. A practical handbook of seawater analysis Pigment analysis. Bull. Fish. Res. Bd. Canada 167, 311. 1968. Sutherland, I.W. Products of primary metabolism. In: Reed G (ed) Biotechnology. Wiley–VCH, Weinheim, Germany, pp 613–657, 1996. Sydney, E.B., et al. Potential carbon dioxide fixation by industrially important microalgae. Bioresour. Technol. 2010. Thaipong, K. et al. Comparison of ABTS, DPPH, FRAP, and ORAC assays for estimating antioxidant activity from guava fruit extracts. Journal of Food Composition and Analysis, 19. p. 669–675. 2006. Vieira, A. A. H., Giroldo, D., Ortolano, P. I. C. Aggregate formation in axenic and microbial co -inoculated batch cultures of Aulacoseira granulata (Bacillariophyceae). Acta Limnologica Brasiliensia 18, 1 - 7. 2006 Van den Hoek, C., Mann, D. G. e Jahns, H. M. 1995. Algae: an introduction to phycology. Cambridge University Press, Cambridge. 627p. Vonshak, A. Spirulina platensis (Arthrospira) physiology, cell-biology and biotechnology. London: Taylor & Francis, 1997. 233 p. Zarrouk, C. Contribution à l étude d une cyanophycée: influence de divers facteurs physiques et chimiques sur la croissance et photosynthese de Spirulina maxima Geitler. 1966. Thesis (Ph.D.) - University of Paris, Paris, 1966.
32
Chapter 3
Cosmetic Products – An Overview
3.1 Cosmetics
3.1.1 History and Definitions
The use of cosmetics was present even in the more primitive societies, in body
painting both for ornamental and religious purposes. Over time, cosmetic products
were developed and improved. Around 180 A.C., the Greek physician Claudius Galen
developed a cold cream, the first chemical-pharmaceutical product. Although during the
Middle Ages the use of cosmetics was suppressed due to the ban the cult of hygiene
and exaltation of beauty, their use was restimulated during the Crusades. In the late
seventeenth century, it was considered a manifestation of witchcraft until the
Contemporary Age (mid-nineteenth century). Cosmetics industries have emerged only
in the early twentieth century. (SECEX, 2004; SEBRAE, 2007; Romanowski &
Schueller, 2001. v.1).
Brazilian definition of cosmetic products is, according to Resolution RDC n°. 79
of August 28, 2000 (Brasil, 2000):
“Cosmetics are products made with natural and synthetic substances or their
mixtures, for external use in various parts of the human body (skin, hair
system, nails, lips, genitalia, teeth and mucous membranes of the oral cavity),
with the goal of cleaning them, perfuming them, alter their appearance,
correcting body odors, protect them or keep them in good condition.”
The EU definition is essentially the same adopted by Brazil and MERCOSUL,
through Resolution n° 31, 1995.
3.1.1 Industry Overview
Over the past 14 years, the Brazilian industry of personal hygiene, perfumery
and cosmetics deflated an annual average growth of 10.5%, much higher than the
average growth of other industries (2.3%). This increase is attributed to several factors,
such as increasing participation of women in the labor market, advanced technologies
development and productivity increased, supporting good prices and constant new
products release. Another relevant factor is the increase in life expectancy. In the last
decade, Brazilian exportation of personal care products, fragrances and cosmetics had
an accumulated increase of 249.7%, against a cumulative exportation of 121.0%. The
surplus in 2009 reached R$ 131 million (ABIHPEC, 2010).

33
Table 3.1 describes Brazilian specific cosmetic products exportation in 2009:
US$ Million % Vs. 2008 % Vs. 2000 2009
– F
OB
Hair Products 162.627 0,7 1.281,1
Oral Hygiene 125.731 -16,6 217,1
Soaps 113.513 -27,3 185,7
Deodorants 47.668 4,3 766,2
Disposable(*) 46.723 8,4 37,9
Other 91.312 0,7 143,6
TOTAL 587.575 -9,3 249,7
Table 3.1: TPCS products 2009 brazilian exportation (Source: ABIHPEC, 2010)
In relation to the world market, Brazil occupies a prominent place. According to
Euromonitor (2009) Brazil is in third place (Table 3.2), representing 8% of global
cosmetic exportations. The Brazilian performance also includes, in terms of world
exportation: first place in deodorants, second in children's products, male enhancement
products, oral hygiene, sunscreen, perfume and bath, and third in products for hair and
stains, sixth in skin and eighth in depilatories.
Personal Hygiene,
Perfumery and Cosmetics
2009
US$ Billion
(consumer price)
%
Growing Participation
Countires 350,3 -2,1
1 United States 58,9 -1,3 16,8
2 Japan 39,9 6,6 11,4
3 Brazil 28,4 3,2 8,1
4 China 20,8 10,4 5,9
5 Germany 17,4 -4,2 5,0
6 France 16,3 -6,8 4,7
7 United Kingdom 15,0 -13,2 4,3
8 Italy 12,5 -5,4 3,6
9 Spain 10,7 -17,7 3,1
10 Russia 10,4 -9,2 3,0
Top Ten 230,37 -1,6 65,8
Table 3.2: Top ten world markets of HPPC. (Source: Euromonitor, 2009)
(*) Includes diapers, sanitary napkins, toilet paper and napkins, towels and wipes.

34
3.1.3 Cosmetics Classification
Cosmetic products can be divided into four categories according to their use
(SEBRAE, 2007): hygiene products, cosmetics, perfumes, and products for babies. In
relation to risk, they can be divided into two groups, according to Table 3.3 (SEBRAE,
2007; RDC 211/05, Annex II):
Level Risk Type of
Risk Information Required Examples
1 Mínimum
Elementary or basic
properties, prove initially
did not necessary;
not required detailed
information (mode and
use restrictions).
Soaps, shampoos, shaving creams, after-shave
lotions, toothbrushes, dental floss, powder,
beauty creams, beauty lotions, oils, make-up,
lipstick, lip pencils and eyeliners, eye products
and perfumes .
2 Potential
Specific directions;
proof of safety and
efficacy, need for
information and care,
method and use
restrictions.
Anti-dandruff shampoos, toothpaste anti-caries
and anti-plaque, intimate feminine deodorants,
underarm deodorants, chemical exfoliators for
the skin, for protecting the lips with sunscreen,
certain products for the eye area, UV filters,
tanning lotions, tinctures hair, bleaching,
permanent waving products, products for hair
growth, hair removers, cuticle removers, stain
removers, nail hardeners, insect repellents and
all products for babies.
Table 3.3: Cosmetic product classification according to its potential risk to the human health.
The criteria for this classification were defined according to the probability of
occurrence of unintended effects from the misuse of the product, its formulation, use
intention, areas of the body application and precautions to be observed during its use.
It is noteworthy that cosmetic products classified as Level 2 are submitted to technical
requirements much more stringent. (Noguti et al, 2007).
3.1.4 Raw materials and cosmetic formulations
There are over 12,000 ingredients that can be used in cosmetics (ANVISA,
2008), such as thickeners, emulsifiers, dyes, scents, etc. Many of these ingredients are
known, besides their chemical name, by its trade names. This variety of nomenclatures
may cause confusion during buying and selling materials and can cause unwanted

35
changes in the final products. To minimize this problem, INCI - International
Nomenclature of Cosmetic Ingredient – was created. It is an international coding
system of nomenclature of cosmetic ingredients, widely recognized and used, created
to standardize the names of ingredients and the products labeling (ANVISA, 2008).
This nomenclature system has many advantages for the consumer (clearer
identification and reduction of errors of interpretation), for health surveillance (greater
agility in the identification of ingredients of cosmetic products in a more clear, correct
and accurate way) and also for the scientific community (advice for consumers, and
dynamic updating of scientific knowledge).
Different materials have different functions in cosmetics and may, for example,
modulate the distribution of the active principles among the target cells of the skin, act
as a matrix, increase the penetration speed and guide the location of certain
biomolecules, among various other goals. These vectors are usually solutions,
suspensions or emulsions. Solutions result from dissolution of solutes (gases, liquids or
solids) in a liquid, called solvent, generating homogeneous mixtures. Suspensions are
dispersions of fine solid particles (dispersed) in a liquid (dispersant) in which they are
insoluble (Fresnel, 1999).
Emulsions are mixtures relatively stables of oil and water, produced by mixing
water soluble and fatty soluble substances with an emulsifier agent. The substances
affinity is manifested not only by solubility but also by "phase" formation. When two or
more immiscible substances coexist in a solution, each one is regarded as a
"phase". In two-phase systems, one substance is distributed in the other. In these
circumstances, the first phase is known as "internal", "dispersed" or "discontinuous",
and the latter phase as "external" or "continuous."
There are four types of emulsions: water-oil emulsions (W-O), oil-water
emulsions (O-W), multiple emulsions and microemulsions. The choose between them
depends on the active ingredient and which cells are target, or on the specific type of
skin of the consumer.
The water-oil emulsions are an oily continuous phase with aqueous substances
dispersed. This type of emulsions is the basis for greasy creams and are lipid soluble,
insoluble in water and do not conduct electricity. In the oil-water emulsion, the
continuous phase is aqueous and the dispersed phase is oily. Emulsions are less
greasy than its components, are water-soluble, insoluble in lipids, and conduct
electricity.
There are two types of multiple emulsions: hydrophilic-lipophilic-hydrophilic,
where an oil phase separates two aqueous phases, and the lipophilic-hydrophilic-
lipophilic, where an aqueous phase separates the oily phases. It is prepared with an

36
initial emulsion, which is subsequently used to prepare the second emulsion. (Fresnel,
1999)
Microemulsions consist of oil, water and surfactants. Its particular structure is
due to the fact that molecules hydrophilic and lipophilic surfactants and are intertwined
in each other, forming a homogeneous system. They are very stable and better
absorbed by the skin, greatly improving its appearance. They are commonly used in
bath oils. (Fresnel, 1999; Moore & Wilkinson, 1990)
3.1.4.1 Kaolin
According to Silva, 2001, the term kaolin or "china clay" derives from the
Chinese word Kauling (which means high hill) and refers to a hill of Jauchau Fu,
located in northern China, where the material was obtained long ago. It is one of the
most important and one of the six most abundant minerals in the top of the Earth crust
(10 meters depth). The same author reports that the first industrial use of this mineral
was in the manufacture of ceramic and porcelain, many centuries ago, and that only in
the 1920s it began to be used in the paper and rubber industry. Kaolin is now also
used to produce plastics, pesticides, paints, adhesives, cement, animal feed, food and
pharmaceutical products, including cosmetics, fertilizers and others, currently having a
very large variety of industrial applications.
Kaolin has many industrial applications and new uses are constantly being
researched and developed. Kaolin is a mineral with special features very interesting for
many industrial applications, including cosmetic ones. Special features include
chemically inertion over a wide pH range, white color, great hiding power when used as
a pigment or extender, soft and slightly abrasive, low conductivity of heat and electricity
and low cost (Silva, 2001). In terms of sensorial characteristics and rheological
properties it gives finesse to the final product, being mostly indicated to people with
sensitive skin, and can even be ingested.
World reserves of kaolin are abundant. Brazil is the sixth largest producer of
kaolin, with approximately 2.8 million tons in 2008, or about 6% of world production,
approximately. The United States is the largest global producer. The Brazilian reserves
of kaolin reach 7.3 million tons. The detailed Brazil and World productions can be seen
in figure 3.1, as the prices.

37
(a)
(b)
Figure 3.1: World x Brazil Kaolim Production in the last decade (a); kaolim’s prices evolution since 2001 (b).
In 2008 Brazil exported 2.8 million tons of kaolin around (U.S. $ 305 million),
representing an increase of 20% over the previous year. Countries that import Brazilian
Kaolin are Belgium (21%), United States (20%), Japan (14%), Netherlands (13%),
Finland (11%) and others (21%).
The mining activity of kaolin strongly modifies the environmental conditions of
where it is extracted. Although it starts to perceive an incipient environmental concern,
the kaolin industry still cause disorders such as excessive production of particulates
generated during transportation (raw gross) and production tailings (waste). These
wastes contain, in addition to other contaminants, concentration of metals such as iron
(Fe), aluminum (Al), zinc (Zn) and cadmus (Cd), above the legally allowed. In Brazil,
the first legal provision in order to minimize the negative impacts caused by mining was
based on the Mining Code of 1967, that provides, among other things, that the miner

38
should " (...) prevent air pollution or water that may result from mining works; protect and
conserve the sources and use the water according to the precepts technicians (…).”
Typically, kaolin mines rejects are usually placed in adjacent areas with no
criteria, contaminating the soil and water bodies in the region. Several old mines are
abandoned without any action being taken to recover. The inspections are rare and
inefficient. However, mining should be done based on the principle of rational use of
natural resources, as described by the Brazilian Federal Constitution of 1988:
"Art 225, § 2 Those who explore mineral resources shall be required to restore
the degraded environment, according to the technical solution required by the
competent organ as provided by law.”
Thus, despite being a cheap and abundant element, solutions for the
replacement of kaolin are important. The development and of materials with similar
characteristics, but not causing environmental impacts, is indispensable. Society
demands for environmentally friend and sustainable products.
3.1.5 Innovations in Cosmetics
Innovation, as may be appropriate for some instrument of intellectual property,
can represent for a particular company or institution a right of exclusive economic
exploitation, thereby inhibiting a possible opportunistic behavior of its competitors
(Schumpeter, 1985). However, in addition to innovation, the cosmetic industry should
seek to develop other strategies, including, for example, more efficient production and
more effective, better sales structure (distribution channels, advertising, brand
promotion), assists post sales and technical support, etc.
Thus, one of the major aspects involved in innovations in cosmetics is related to
new raw materials and additives development, which gives different properties and
characteristics capable of bringing better and faster results and that are consistent with
contemporary concepts, such as improvement of quality of life and environmental
sustainable.
The growing importance of such new products in recent years has led to the
adoption of the term "cosmeceuticals", or cosmetics with therapeutic goals and that use
active chemicals, a phenomenon parallel to that in the food industry ("nutraceuticals").
Industry professionals are almost unanimous in pointing out that this segment of the
cosmetics industry has strong growth potential, which could generate business
opportunities in the sector (Portal Educação, 2010).Thus, the search for applications of
biomolecules, not only from extractive processes but also from other sources such as

39
biotechnological processes, is extremely important. They can provide better cosmetic
properties and characteristics, and still leading a more environmentally and
economically sustainable product with greater added value and market acceptance.
3.1.5.1 Microalgae and Algae Products in Cosmetic Application
Microalgae and their products use in cosmetic products as creams, gels,
shampoos, etc is very disseminated. Heterogenic polysaccharides, called mucilage,
are extracted from brown (Feoficeas) and red (Rodoficeas) algae. When in water
contact these mucilage form colloidal not adhesive. Among these compounds, alginate,
agar and carrageenan are the most used. Other species, like Fucus vesiculosus (a red
algae with emollients properties), have the hability to accumulate iodine and are used
in anticellulitic treatments.
The powdered Macrohystis pyrifera presents sebaceous secretion regulation
properties. Transpiration reduction properties are assigned to the specie Rhodymenia
palmaria. Delesseria sanguínea e Undalaria punnatifada act on skin toning, as
moisturizing and as anti-wrinkles action. Dunaliella salina is a pro-vitamin A (beta-
carotene) source and its extracts stimulate cell regeneration at the level of the
epidermis or dermal connective tissue; moreover It also seems to stimulate the melanin
production and has antioxidant power. Plocanium coccineum is a source of red
pigments, which generate less risks than synthetics ones but shows problems of
instability (Barata, 2000).
3.1.6 Human Skin
Skin is defined as an active barrier between the environment and the human
organism. It is responsible to controls fluids loss, avoids dangerous substances
penetration and protects against mechanical shocks, also regulating the thermic
changes. The permeability barriers are cells, firmly packed, that forms the epidermis.
(Moore & Wilkinson, 1990)
The epidermis is constituted by many layers, which are result of keratinocytes
changes. They are borned in the basal layer and dead on the last layer (skin surface).
There are another tree cells kinds in the skin: melanocytes (pigmented cells),
Langerhans cells (dendritic, with no color) and Mekel cells (related to the tact) (Moore
& Wilkinson, 1990).
The skin layers are: stratum basal (or germinativum), the stratum spinosum, the
stratum granulosum, the stratum lucidus, and the stratum corneum. For this study, the
most important is the Stratum Corneum. The queratinocits are anuclear cells that live in
the Stratum Corneum and have great quantities of keratin. The corneum cells are

40
released continuously from the skin surface, and the moisturizer skin degree is directly
related with the water found in this layer (Moore & Wilkinson, 1990).

41
3.2 Conclusions
The mondial and brazilian cosmetic market have place to new and innovative
products;
The microalgae are beginning to be intensively researched as source for new
and innovative cosmetic products and stand out as one interesting alternative
for the cosmetic industries.

42
References
ABIHPEC. Panorama do Setor de Higiene Pessoal, Perfumaria e Cosméticos. 12/04/2010. ANVISA. http://www.anvisa.gov.br/cosmeticos/inci.htm (Acessed in 10/06/2010)
Barata, E.A.F. A cosmetologia – Princípios Básicos. Tecno Press, São Paulo, 2000. Brasil, ANVISA - Resolução RDC nº 79, de 28 de agosto de 2000, Estabelece a definição e Classificação de Produtos de Higiene Pessoal, Cosméticos e Perfumes e outros com abrangência neste contexto, D.O.U. - Diário Oficial da União; Poder Executivo, de 31 de agosto de 2000. EUROMONITOR INTERNATIONAL. Disponível em: http://euromonitor.com. Acesso em: 19/06/2009. Fresnel, M.M.M, Hernandez, M. Manual de Cosmetologia. Rio de Janeiro: Revinter. 1999. Moore, R.J. & Wilkinson, J.B. Cosmetología de Harry. Díaz de Santos, 1990, Madrid. Traduction: Marta A. Rodriguez Navarro & Dario Rodriguez Devesa. Noguti, M. B,.Capanema, L. X. De L., Velasco, O. M. De, Palmeira Filho, P. L., Panorama da Indústria de Higiêne Pessoal, Perfumaria e Cosméticos. BNDES Setorial, Rio de Janeiro, n. 25, p. 131-156, março 2007. Portal Educação, 2010. Disponível em: http://www.tecnologiacursos.com.br/educacao/noticias/41413/saiba-a-diferenca-entre-cosmeticos-e-cosmeceuticos (Acessed in: 22/07/2010.) Romanowski P. & Sgueller, R. Iniciação à Química Cosmética, volume 1. Associação Brasileira de Cosmetologia, São Paulo, 2001. Romanowski P. & Sgueller, R. Iniciação à Química Cosmética, volume 2. Associação Brasileira de Cosmetologia, São Paulo, 2001. Romanowski P. & Sgueller, R. Iniciação à Química Cosmética, volume 3. Associação Brasileira de Cosmetologia, São Paulo, 2001. Schumpeter, J. A. Teoria do desenvolvimento econômico. 2. ed. - São Paulo: Nova Cultural, 1985. Silva, S.P. Caulim. Balanço Mineral Brasileiro, 2001. Relatório da SECEX - Secretaria de Comércio Exterior. Brasil, 2004 Silva, S.P. Caulim. Balanço Mineral Brasileiro, 2001. DNPM – Departamento Nacional de Produção Mineral, Governo do Brasil. SEBRAE. Informações de Mercado sobre Cosméticos à Base de Produtos Naturais – ESPM – Novembro/2007.

43
Chapter 4
Creams Formulation and Experimental Design
4.1 Introduction
In cosmetic context, the “cream” term means a solid or semi-solid emulsion. If
an emulsion has a so low viscosity as the gravity makes it to flow, this substance is
called lotion, and don’t cream. The skin creams can be classified according to its
function and composition: cleaners, to night, to massage, moisturizers, evanescent,
hands and body protectors, and for general use creams. (Moore & Wilkinson, 1990)
According to Moore & Wilkinson, 1990, the proposed cream, for table 4.2, is an
evanescent and base cream. This kind of cream is easily spread and has the sensation
that disappears rapidly after applied. To reach a fast absorption effect, the fatty phase,
besides having a low composition percentage, have emollient esters, as stearic acid,
an emollient substance that generates smooth and well-being. It tenderizes the skin,
leaving it non greasy, and makeup can be applied easily. The oil phase remains
invisible during use, provides a film no-grease, and leaves a very attractive final
product.
All cosmetic emulsions are made by two imiscibles liquids: one dispersed as
little drops in the other, and separated by a tensoactive agent in each size of the liquid-
liquid frontier, as explained in Chapter 3. The phases are mixed at turbulent conditions:
one of them divides into little drops, because the shear force, and is distributed
completely in another phase. During the agitation, the drops will divide into ever smaller
drops, until the point at which the applied force is not able to reduce their size, and they
are in almost same average diameter, with little variation.
The creams were prepared by using the ingredients showed in Table 4.1. The
aqueous and oily substances were mixed, according to its affinity, and the two phases
were warmed separately to 75.0°C, in bath. Under constant agitation, the oily phase
was shed into the aqueous phase, and manual agitation was done until the mixture
reaches room temperature.
After cream preparation, the additives (both EPS and aqueous biomass extract)
were added, and cream’s appearance, color and homogeneity, observed. This addition
caused emulsion instability, with viscosity loss and phase separation. So, it was chosen
a second formulation, presented in table 4.2, which didn’t caused destabilization but
improved general creams characteristics: it became softer, less shining and sticky
(Figure 4.1).

44
Compound %
Ethoxylate Stearyl alcohol 1
Stearyl alcohol 1
EDTA 0,05
Isopropyl Palmitate 2
Triethanolamine 6
Propylparaben 0,02
Methylparaben 0,18
Propylene glycol 3
Polymer Carboxivinilic 15
Distilled water q.s.p.
Table 4.1: Composition of formulation # 1
Compound %
Ethoxylate Stearyl alcohol 3
Stearyl alcohol 6
Silicone Fluid (dimethicone copolyol) 1
Cetyl palmitate 3
Isopropyl myristate 4
Butylhydroxytoluene (BHT)* 0,05
Propylparaben 0,02
Methylparaben 0,18
Propylene glycol 3
Ethoxylated lanolin 50% 2
Distilled water q.s.p.
Table 4.2: Composition of formulation # 2
*BHT wasn’t added, not to interfere in the cream
antioxidant quantification.
A B

45
Figure 4.1: The general appearance of Base Cream (A) and Spirulina Cream (B). A slight green color can be observed in (B) due to the aqueous S. platensis biomass extract.
4.1.1 Biomass Extract in Cream Formulation
A biomass extract was prepared by adding water in a dry biomass. After
vigorously agitation (3 or 4 times in 30 minutes), the mixture was centrifuged (Sorvall
Legend Mach 1.6 R, 5000rpm, 5 minutes). Two milliliters of the supernatant was used
for each 50 grams of cream. Choosing this quantity was based in the tests of
antioxidant power, which were carried and are described in Chapter 2.
4.1.2 EPS in Cream Formulation
EPS was added to the cream formulation in concentrations of 0.5, 2.5 and 5.0%
(w/w). Rheological analysis were performed, trying to predict any destabilization
problem and are described in Chapter 6. From here, the so-called “Base Cream”
A B
A B

46
designates the Cream prepared according to Table 4.2, without any addictive, while the
“Spirulina Cream” has the same basic composition as the Base Cream but added with
Spirulina platensis aqueous extract and EPS at determined concentrations.
4.1.3 Experimental Design
Formulating a new product involves not solely the correct formulation chosen,
acceptable to the formula owner and apparently having good properties and
characteristics. As it can be a commercial product, stability tests may be performed, to
guarantee that in this shelf life, any problem occurs and the consumer’s acceptance
continue being the same.
With this aim, once the EPS concentration was defined, in Chapter 5, preliminar
and accelerated stability tests were performed to foresee the cream stability against
severe transport and storage conditions, giving important information about the cream
shelf life and evolution through the time (Chapter 6). With these results, could be
needed reformulations, or changes in the formula, aiming to maintain the physical,
chemical and biological creams properties.
Also, in vivo tests may be performed, to foresee the cream irritability and to give
reliable information about the allergenic Spirulina cream potential. This test was carried
in guinea pigs (Chapter 7), before the cream’s contact with human. So, if there are any
irritant response in the guinea pigs skin (that is more sensible then the human skin)
reformulations can yet be done.
After all, the consumer’s acceptance is a crucial factor. So, sensorial tests were
performed (Chapter 8), to evaluate consumer’s impressions and opinions about the
new developed cream. The expected enhanced properties were evaluated by the
volunteers, comparing the Base and Spirulina Cream, directly seeing and using the
products. The effects of biomass extract and EPS in moisturizing power was also
evaluated and described in this Chapter.

47
4.2 Conclusions
It was possible to find a formulation that, with the EPS addition, there were no
emulsion problems in viscosity, aspect, pH or color.
The EPS addition can cause emulsion destabilization, and before test a new
formulation, preliminary tests has to be performed.

48
References
Fresnel, M.M.M, Hernandez, M. Manual de Cosmetologia. Rio de Janeiro: Revinter. 1999. Moore, R.J. & Wilkinson, J.B. Cosmetología de Harry. Díaz de Santos, 1990, Madrid. Traduction: Marta A. Rodriguez Navarro & Dario Rodriguez Devesa. Romanowski P. & Sgueller, R. Iniciação à Química Cosmética, volume 1. Associação Brasileira de Cosmetologia, São Paulo, 2001. Romanowski P. & Sgueller, R. Iniciação à Química Cosmética, volume 2. Associação Brasileira de Cosmetologia, São Paulo, 2001. Romanowski P. & Sgueller, R. Iniciação à Química Cosmética, volume 3. Associação Brasileira de Cosmetologia, São Paulo, 2001.

49
Chapter 5
Rheological Analysis
5.1 Rheology
According Schramm (2006), rheology is the science that describes body
deformation, whether solid, liquid or gas, under the influence of stresses. To Bretas
and D'Avila (2005) ideal solid deforms elastically and the energy required for its
deformation is completely recovered when the stress is removed. Ideal fluids such as
liquids and gases deform irreversibly, draining, and the energy required for deformation
is dissipated within the fluid as heat and cannot be restored merely by the tensions
removal.
Many of the textural properties that humans perceive when they consume food,
cosmetics, and various other products, are basically the rheological ones, including
creaminess, juiciness, tenderness, softness and hardness (Haminiuk, 2007). According
to Fields and colleagues (1989), the rheological data are essential to:
• Calculations in process engineering, involving a large variety of equipment
such as pumps, pipes, extruders, mixers, heat exchangers, among others;
• Determination of ingredients functionality in product development;
• Control intermediate or final product quality;
• Shelf life testing;
• Evaluation of the products texture (foods, cosmetics, etc.) and correlation with
sensory tests.
5.1.1 Fluids Rheology
Isaac Newton expressed the basic viscometry law, describing the flow behavior
of an ideal liquid, (equation 5.1), where t is the shear stress, h is the dynamic or
apparent viscosity and γ is the rate of shear or deformation.
t = h . γ [5.1]
The fluid deformation generates modifications through the continuous force
action at a constant rate. This condition can be designed and monitored by using two
parallel plates, with fluid placed in the space between them. The bottom plate is fixed
and the top moves at a constant speed, and deformation in the fluid is evaluated.
The shear stress (t) relates to a force (F) applied parallel or tangential to the
face of a material (A). The application of the force F produces a flow of the material,

50
generating also a resistance force, the so called shear stress. By keeping F constant,
the flow rate can be maintained. The share stress (t) is also a consequence of the
internal resistance of the liquid, ie the viscosity (Navarro, 1997). The shear stress
generates different responses in solids or liquids. The firstdeformed, while the other
flows.
The shear stress acting on the fluid makes it flow in a certain pattern. The
maximum speed is observed far away from the stationary surface, while the minimum
speed is observed in the liquid in contact with the stationary surface. This velocity
gradient is defined as shear rate (γ); by increasing the shear rate, the material viscosity
can increase or decrease (Navarro, 1997).
Viscosity is a rheological property defined as the resistance to flow, it becomes
apparent when a fluid layer moves relatively to another. Thus, with increasing the fluid
viscosity, it also increases the frictional forces, requiring more energy to fluid
displacement.Consequently, highly viscous fluids require more force to flow than less
viscous materials (Bretas; D'Avila, 2005).
Viscosity is expressed through the mathematical formula presented in equation
[5.2], where h is the dynamic or apparent viscosity, t is the shear stress and γ is the
rate of shear or deformation.
h = t / γ [ 5.2 ]
Among the parameters that affect the viscosity of polymers are the type of
molecular structure, temperature and concentration of polymer solution analyzed.
Temperature can cause a decrease in viscosity, while concentrated polymer solutions
tend to have higher values of h (Pinto et al, 2002; Silva 2006), for example. Polymeric
structures can have their arrengement undone by increasing shear rates, due to the
orientation of molecules in the direction of flow (Figure 5.2). Spherical particles can be
deformed into a more elongated, and aggregates may be broken (Bretas; D'Avila,
2005).

51
Fig. 5.1: Viscosity Behavior of Multiphase Dispersed Systems (emulsions).
Fluids can be defined as Newtonians and non-Newtonians, in accordance to
their rheological characteristics (figure 5.2).
Fig. 5.2: Rheological behaviors of fluids at different shear rates and shear stress, according to their characteristics. Source: http://www.globalspec.com/reference/10735/179909/chapter-3-physical-properties-of-fluids-vapor-pressure-and-boiling-point-of-liquids
5.1.1.1 Newtonian liquids
In his studies about the properties of materials, Newton assumed that the line
generated by plotting (equation [5.1]) for an ideal liquid would be a straight line, starting
at the origin and with inclination α. Thus any point of this line defines pairs of values (t x
γ), and from this we can obtain h (from the equation [5.2]).
By means of an ideal liquid, it can be inferred that the viscosity (h) is not
affected by changes in shear rate, as it is kept constant at all points. All fluids for which

52
this statement is true are called Newtonian, such as pure liquids, very dilute solutions
and true colloidal systems (water, mineral oil, etc).
5.1.1.2 Non-Newtonian Fluids
Liquids that do not exhibit the behavior of "ideal" flow as described in the
previous section, are called non-Newtonians. They are, in number, a larger group than
the Newtonian fluids.
Non-Newtonian fluids are defined as those where the ratio t / γ is not constant.
This means that when the shear rate varies, the shear stress does not vary in the same
proportion (or necessarily in the same direction) (Mano, Mendes, 1999), causing
viscosity changes during variation of shear rate.
The non-Newtonian fluids can be classified as viscoelastic or inelastic.
The viscoelastic fluids exhibit both properties of fluid (viscous) and solid (elastic)
(Barnes, Hutton, Walters, 1989).Inelastic non-Newtonian fluids are classified based on
dependence of duration of force F application: the apparent viscosity of the
independent ones, under conditions of constant temperature and composition, depends
only on the magnitude of F, while the apparent viscosity of the time-dependent
depends on the magnitude and on the duration.
Among the inelastic fluids independent of F duration, there are pseudoplastics,
dilatants and plastics. For pseudoplastics, such as paints, emulsions and dispersions in
general, the viscosity decreases with increasing shear rate. For dilatants, such as
caramels and corn starches in water, viscosity increases with increasing shear rate.
Plastic fluids, such as creams, ketchup, mayonnaise, toothpaste, etc, behave like
solids under static conditions, with internal forces that prevent it from flowing until a
certain shear stress, after which they begin to flow (Shaw, 1975). The F duration-
dependent inelastic fluids are those in which there are changes in viscosity over time
and shear rate and temperature variation, and can be divided into thixotropic and
rheopectics. In thixotropic fluids viscosity decreases with time for a constant shear rate
(Costa, 2006), while for the rheopectics the opposite occurs, i.e. the viscosity increases
with time for a constant shear rate.
The microbial polysaccharides normally show pseudoplastic and viscoelastic
characteristics (Covielo et al., 2007; Toneli et al 2005, Sutherland 2001). Some
advantages of the microbial EPS use in industrial products are: low concentration
needed to form viscous solutions, high solubility, viscosity and stability present in a
wide range of pH, temperature and in the presence of salts.

53
5.1.1.3 Viscoelastic Behavior
The viscoelastic behavior of an emulsion can be defined through studies of
rheological dynamic analysis and/or oscillatory tests for the evaluation of its
proportional solid and fluid behavior: the elastic shear modulus (G') concerns the
character of solid behavior, while the viscous shear modulus (G") refers to the
character liquid behavior. The energy used in the deformation of an elastic solid is
recovered when it returns to its original state, while for an ideal liquid there is no such
recovery and the energy is lost. Thus, the modules G 'and G" are also called modules
of storage and loss, respectively (Schramm, 2006 and Brummer, 2006). For a perfect
elastic material all the energy is stored, the stress and deformation are in phase and G"
is equal to zero. On the other hand, for no elastic liquids all the energy is dissipated as
heat, G' is equal to zero, and the tension and strain are out of phase (Iagher, 2000,
Brummer, 2006).
The elastic shear modules (G') and viscous (G") are given by the following
equations:
G’= (t0/g0).cos d [ 5.3 ]
G”= (t0/g0).cos d [ 5.4 ]
G”/ G’ = tg d [ 5.5 ]
where:
G'= dynamic elastic shear modulus
G = dynamic viscous shear modulus
t0 = stress amplitude
g0 = amplitude of deformation
d = phase angle
The response of a sample to oscillatory strain deformation can be characterized
by complex dynamic shear modulus G *, which is given by the following equation:
G* = (G’2 + G”2) 1/2 [ 5.6 ]
where:
G* = complex dynamic shear modulus
G'= dynamic elastic shear modulus
G = shear modulus dynamic viscous

54
The complex dynamic modulus G* can define a complex viscosity (h*), which
describes the total resistance for a dynamic measurement and is expressed by the
equation:
h* = G*/ f [ 5.7 ]
where:
h* = complex dynamic viscosity
G* = complex dynamic shear modulus
f = frequency
Dynamic analysis of shear modules G' and G" and complex dynamic viscosity,
allows viscosity and elasticity characterization (Morris, 1996). Variations in G', G" and
h* also give important information to characterize the time scale of molecular
interactions in emulsion systems.
The thixotropy is a viscous and time-depending variable, and shows the
material's ability to deform under a constant shear rate. A thixotropic product tends to
have longer shelf life because, during storage, has constant viscosity, which hinders
the formulation constituents separation.
The most appropriate way to measure the thixotropy is achieved by the flow
curve with shear rate controlled. The shear rate increases with time until it reaches a
maximum shear value. Subsequently, without any disturbance, the process is reversed,
decreasing the shear rate, leading to the formation of curves up and down. The area
enclosed by the curve up and down is referred to as hysteresis (Schramm, 2006).
A thixotropic product becomes more fluid during application, facilitating
spreading, and restores the original viscosity by the end of application. This prevents
product draining (Martin, 1993, Gaspar, Maia Campos, 2003; Leonardi et al.,
2000). Very high thixotropy values make product flow over the skin after application. In
contrast, very low values of thixotropy generate low spreadability and do not allow
homogeneous application on the skin (Gaspar & Maia Campos, 2003).
Substances addition to a cosmetic formulation, especially in the case of
complex ones (such as microbial polysaccharides) may cause instability. Rheometry
allows the verification of the cosmetic response, to ensure the reproducibility of
properties. By checking parameters such as viscosity and thixotropy, the product
physicochemical nature can be understood, the raw materials quality can be controlled
and final product failures or instabilities can be detected. Instability problems can cause

55
failures in the product as creaming, flocculation and coalescence of phases, reactions
that are easily detected and reproved by consumers (Dukhin et al., 2003).
5.2 Materials and Methods
Four creams sets were prepared, using the formulation in table 3.2 (Chapter 3).
To 3 of these creams Spirulina EPS was added in crescent concentrations of 0.5%,
2.5% and 5.0%. The cream without EPS addition was used as control. The creams
were maintained in opaque flasks at 4ºC. Four hours before the analyses, creams were
left at room temperature until come into equilibrium.
The analysis was performed in a Brookfield Mod. RV III rheometer, using a
cone-plate system, Software Rheocalc 3.0. and a CP 52 spindle. Triplicate analysis
were carried using 0.4 g of sample at 25°C. The variables considered in this study
depended on the formulation obtained.
5.3 Results and Discussion
Rheology is useful for predicting emulsions physical instability in long-term
(Tadros, 2004). From the observation of the Rheograms ascending and descending
patterns, presented and discussed below in this section, it was found that both do not
obey Newton's law and are classified as non-Newtonian fluids.
5.3.1 Stress Ramp Test
In the stress ramp test, the shear stress is increased continuously until it
reaches a maximum value (100s-1), resulting in a torque which is measured (Fig. 5.3).
Based in these intervals the viscosity was calculated. After reaching the maximum, the
shear stress applied was continuously decreased and the torque decreasing ramp is
also measured (Fig. 5.3). In Figure 5.4 all patterns are plotted in the same area
allowing better comparison between them.
There are several models available for interpreting measure curves, and
different results are found based in the way the data is plotted. If the shear stress is
plotted against the torque, it’s possible to see an area in which the force or shear stress
applied to the sample do not cause any detectable deformation, showing that the
system remains at rest.

56
(a) (b)
(c) (d)
Fig. 5.3: Flow Curves. Control (a); 0.5% Spirulina EPS (b); 2.5% Spirulina EPS (c); 5.0% Spirulina EPS (d).
Fig. 5.4: Flow curves of all formulations plotted together, helping the comparison among them.
In this work, the thixotropy was quantified through the measurement of the
hysteresis area (between the ascending and descending curves). All the emulsions
showed pseudoplastic behavior and the presence of hysteresis areas, showing its
thixotropy. This area pattern is a typical characteristic of thixotropic formulations. The
hysteresis area calculated for each sample is showed in table 5.1.
During the shear rate time the bounding forces between molecules/particles
decrease and, when it ceases, reagroupment and restoration of the initial

57
characteristics of the fluid can be observed. This reagroupment and the viscosity
restauration were observed (Figure 5.3).
The hysteresis area presented by the 0.5% EPS Cream presented a slightly
decrease when compared with the base cream (fig. 5.3 a). The cream with EPS 2.5%
presented a very small hysteresis area, while the cream with EPS 5.0% had a very big
hysteresis area. The last two behaviors are not desired: very small or very big
hysteresis areas indicate problems (enormous difficulty to flow or draining) interfering
directly in the process stability. So, for the tree formulations, the one with the best
hysteresis area pattern is the EPS 0.5%. At this concentration, only a slight decrease in
the hysteresis area was observed, not affecting the cream spreadability.
Sample Hysteresis Area (Pa/s)
Base Cream 723.4±61.0
EPS 0.5% 514.6±36.1
EPS 2.5% 188.4±43.5
EPS 5.0% 1721.0±73.4
Table 5.1: The hysteresis area average and
deviation for each formulation.
5.3.2. Minimum Apparent Viscosity
Another result that gives information about the stability of the formulation is the
viscosity, which is always related with a strain rate (Martin, 1993). The sample
minimum apparent viscosity (Pa.s) is calculated during the Stress Ramp test, at the
highest shear used (100 s-1). At this point the viscosity is at the lowest value, being
called minimum apparent viscosity. In all the formulations the minimum apparent
viscosity was diminished (table 5.2), comparing to the base cream, and the smaller
value was found in the 0.5% EPS cream. This indicates that this cream may present
better spreadability and flow properties than the others.
Sample Minimum Apparent Viscosity (Pa.s)
Base Cream 0.874±0.015
EPS 0.5% 0.631±0.003
EPS 2.5% 0.734±0.005
EPS 5.0% 0.787±0.008
Table 5.2: The minimum apparent viscosity average
and deviation for each formulation.
5.3.3 Tension Scan
The tension scan may be performed before the frequency scan and the creep
and recovery tests, because it is used to determine the ideal zone tension to the

58
sample’s rheological analyses. This ideal zone tension is that where the tension
applied is not high enough to cause sample destructurization, but sufficient to allow
sample to flow. This test, also called amplitude variation, or strain test, is performed at
constant temperature and frequency. The response obtained are two moduli G’ e G”,
which, when plotted against the tension applied, must appear as parallel curves. To
achieve this, random frequencies were chosen, increasing tensions were applied and
the obtained curves analyzed. The tension amplitude was varied from 0.01 to 100Pa.
Figure 5.5 shows the best pattern for the tension scan achieved.
From figure 5.5 it was observed that a linear pattern was achieved in the region
between 0.01 and 10 Pa tension. When more tension was applied it was observed a
destabilization in viscosity (not showed), G’ and G” in all samples. Thus, for the
following rheological analysis, a random share tension from the linear phase response
was chosen: 5Pa.
(a) (b)
(c) (d)
Fig. 5.5: Tension Scan. Base Cream (a); EPS 0.5% (b); EPS 2.5% (c); EPS 5.0% (d).

59
5.3.4 Frequency Scan After fixing the tension in the tension scan, the frequency effect was studied.
Measurements usually begin at the highest frequency followed by logarithmic
reductions.
The frequency scan testing is a useful tool in evaluating elastic (G ') and viscous
(G'') modulus and the apparent viscosity. Therefore, it is possible to say whether the
formulation has elastic, viscous or viscoelastic behavior. In the case of viscoelastic
behavior, we are able to evaluate which behavior prevails: elastic or viscous.
The frequency scan showed (Fig. 5.6) that in the established range (1-10 Hz)
there was virtually no change in the behavior of elastic and viscous moduli both in Base
Cream and 0.5% EPS samples. On the other hand, for the samples containing 2.5%
and 5.0% EPS, the viscous modulus G" suffered a slight increase. This behavior may
be due to increased particulate matter in the emulsion, which turns the sample more
viscous. Furthermore, a strong viscoelastic behavior was observed in the range
established, since G' (elastic modulus) are higher than G" (viscous modulus). This
shows that the sample is in semi-solid state because the modulus G” would always be
larger than the modulus G’ if it was a fluid.
(a) (b)
(c) (d)
Fig. 5.6: Frequency Scan. Base Cream (a); EPS 0.5% (b); EPS 2.5% (c); EPS 5.0% (d).
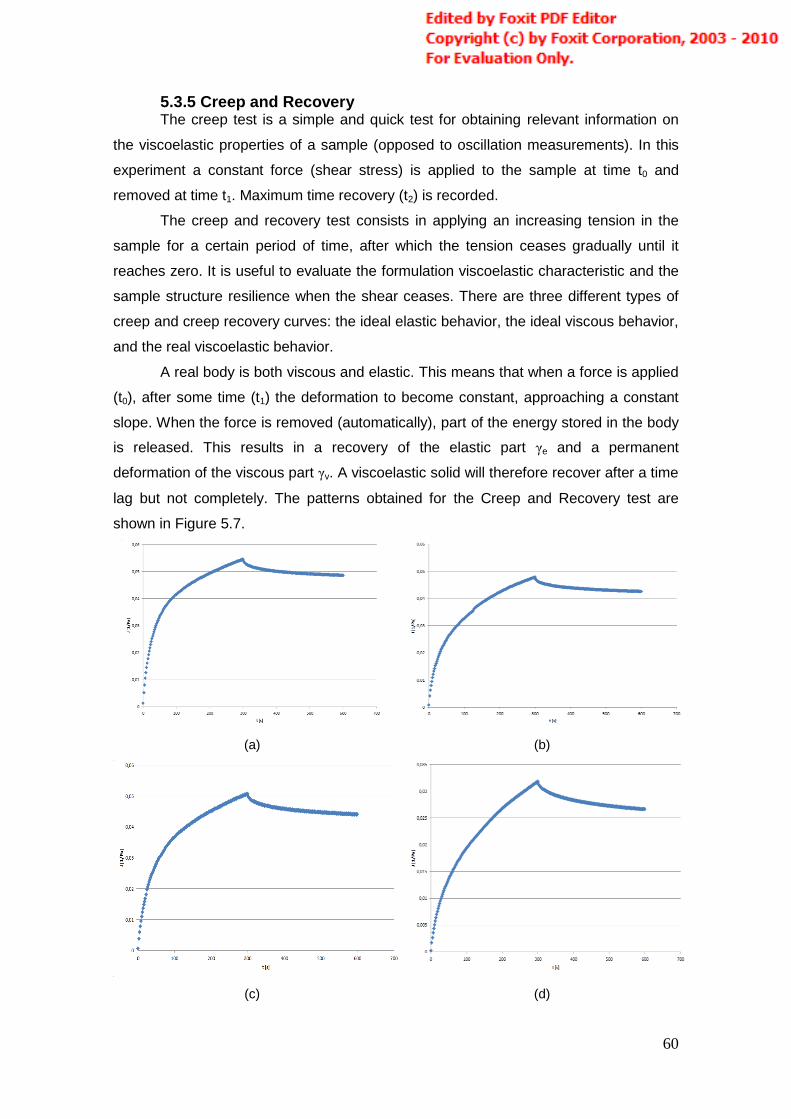
60
5.3.5 Creep and Recovery The creep test is a simple and quick test for obtaining relevant information on
the viscoelastic properties of a sample (opposed to oscillation measurements). In this
experiment a constant force (shear stress) is applied to the sample at time t0 and
removed at time t1. Maximum time recovery (t2) is recorded.
The creep and recovery test consists in applying an increasing tension in the
sample for a certain period of time, after which the tension ceases gradually until it
reaches zero. It is useful to evaluate the formulation viscoelastic characteristic and the
sample structure resilience when the shear ceases. There are three different types of
creep and creep recovery curves: the ideal elastic behavior, the ideal viscous behavior,
and the real viscoelastic behavior.
A real body is both viscous and elastic. This means that when a force is applied
(t0), after some time (t1) the deformation to become constant, approaching a constant
slope. When the force is removed (automatically), part of the energy stored in the body
is released. This results in a recovery of the elastic part γe and a permanent
deformation of the viscous part γv. A viscoelastic solid will therefore recover after a time
lag but not completely. The patterns obtained for the Creep and Recovery test are
shown in Figure 5.7.
(a) (b)
(c) (d)

61
Fig. 5.7: Creep and recovery tests. Base Cream (a); EPS 0.5% (b); EPS 2.5% (c); EPS 5.0% (d).
From the data obtained, the sample’s recovery percentage can be calculated
(Table 5.3). It’s possible to see that for the Base Cream and the EPS 0.5% Cream
almost the same recuperation was achieved. For the two other samples, the recoveries
were smaller, indicating that they must be more fluid than the other ones, causing
problems during its application such as draining and less smooth appearance.
Sample Recovery (%)
Base Cream 89.1%
EPS 0.5% 89.0%
EPS 2.5% 86.9%
EPS 5.0% 83.6%
Table 5.3: The percentage recovery
achieved by the creep-recovery test.
5.3.6 Rheological and Sensorial Data Correlation
The relationship between structure and sensory emulsion is difficult to extract. A
correlation between rheology and sensory testing could therefore help achieve the
desired sensory product properties. After being established a relationship, it would be
possible to correlate the ingredients used and the processes involved to have the final
sensory attributes of personal care products. Then, the chemical formulator can choose
the best ingredients and the best process to achieve the desired goal of sensory
attributes. This knowledge, therefore, should facilitate the development of innovative
cosmetic formulations.

62
4.5 Conclusions
All the creams tested (with or without Spirulina EPS addition) showed a non-
Newtonian, pseudoplastic and viscoelastic behavior. All of them also showed
thixotropic behavior. The more adequate hysteresis area was achieved with
0.5% Spirulina platensis EPS addition to the Base Cream;
The 0.5% of Spirulina platensis EPS cream presented the best Minimum
Apparent Viscosity, indicating its better spreadability;
The frequency and tension scans were useful to observe the G’ and G” moduli
behavior of each sample. The base cream and the 0.5% EPS cream showed
the more constant pattern, what indicates best emulsion stability (distorted in
the other creams probably by the great amount of solid particles in it).
The higher recovery was achieved for the Base and 0.5% EPS creams. The
results achieved in these tests showed that the cream with 0.5% EPS
presented general better results in relation to the Base Cream. The 0.5% EPS
cream was chosen for the next tests. By analyzing the rheograms, some
sensorial and physico-chemical stability improvements of the addition of 0,5%
EPS could be predicted: it can make the cream smoother and improve
spreadability.
Further evaluation of the improvements in cream properties proposed by the
addition of Spirulina EPS will be handled in the next chapter.

63
References
Barry, B.W. Sensory testing of spreadability-investigation of rheological conditions operative during application of topical preparations, J Pharm Sci 61(3):335-341, 1972 Bretas, R. E. S.; D’ávila, M. A. Reologia de polímeros fundidos. 2. ed. São Carlos: EdUFSCar, 2005. Brummer, R.. Rheology essentials of cosmetic and food emulsions. Springer, 2006, Germany. Carson, K., Meullenet J.E.C., Reischem D.W. Spectral stress strain analysis and partial least squares regression to predict sensory texture of yogurt using a compression/penetration instrumental method, J Food Sci 67:1224-1228, 2002 Costa, M. Entenda o que é tixotropia. Informativo CRQ-IV, São Paulo, nº. 81, p. 10-11, 2006. Coviello, T.; Matricardi, P.; Marianecci, C.; Alhaique, F. Polysaccharide hydrogels for modified release formulations. J. Cont. Rel., v. 119, p. 5-24, 2007. Dukhin, S.S. et al. Coalescence coupling with flocculation in dilute emulsions within the primary and/or secondary minimum. Adv. Colloid Interface Sci., Amsterdan, v. 93, n. 1-3, p. 47-81, 2003. Gaspar, L.R., Maia Campos, P.M.B.G., 2006. Evaluation of the photostability of different UV filter combinations in a sunscreen. Int. J. Pharm., v. 307, 123–128. Haminiuk, C. W. I. Estudo do comportamento reológico e colorimétrico de misturas ternárias e sistemas pécticos de polpas de morango, amora-preta e framboesa. 2007. 124f. Dissertação (Doutorado). Programa de pós-graduação em tecnologia de alimentos, setor de tecnologia da Universidade Federal do Paraná. Iagher, F. Análise estrutural e estudo das propriedades reológicas de polissacarídeos extraídos de polpa de manga (Mangífera indica L.). 2000. Dissertação (mestrado), Pós graduação em Bioquímica e Biologia Molecular, Setor de ciências Biológicas, Universidade Federal do Paraná. Leonardi, G.R.; Beraldi, P.; Freitas, P.C.D.; Campos, P.M.M. Produto de uso tópico com Aloe vera. Cosmet. Toiletries, v.12, n.5, p.44-53, 2000. Mano, E.B.; Mendes, L.C. Introdução a Polímeros. 2. ed. revista e ampliada. São Paulo: Edgard Blücher, 1999, 191p. Martin, A.N. Physical pharmacy. 4.ed. London: Lea & Febiger, 1993. p.453-473. Morris, E. R. Rheology of xanthan: Suspension of particles and stabilization of emulsions. Foods and Food Ingredients: Journal of Japan, Tokyo, v.167, p.31-36, 1996. Navarro, R. F. Fundamentos de reologia de polímeros. Caxias do Sul: Editora da Universidade de Caxias do Sul, 1997. Pinto, E. P.; Moreira, A.; Vendruscolo, C. T. Influência do pH, adição de sais e temperatura na viscosidade dos biopolímeros produzidos por Beijerinckia sp. 7070 e UR4.Revista Brasileira Agrociência, Pelotas, v. 8, n. 3, p. 247-251, 2002. Schramm, G. Reologia e Reometria. Fundamentos Teóricos e Práticos. São Paulo: Artiliber, 2006. Silva, D. D. V.; Canilha, L.; Carvalho, W.; Mancilha, I. M. Aditivos alimentares produzidos por via fermentativa parte 3: polissacarídeos e enzimas. Revista Analytica, São Paulo, v. 20, p. 32-41, 2006.

64
Shaw, D. J. Introdução a química dos colóides e de superfícies. São Paulo: Edgard Blucher, 1975. p.180. Sutherland, I. W. Microbial polysaccharides from Gram-negative bacteria. International Dairy Journal, Oxford, v. 11, p. 663-674, 2001. Tadros, T. Application of rheology for assessment and prediction of the long-tern physical stability of emulsions. Adv. Colloid Interface Sci., v.108/109, p.227-258, 2004. Toneli, J. T.C. L.; Murr, F. E. X.; Park, K. J. Estudo da reologia de polissacarídeos utilizados na indústria de alimentos. Revista Brasileira de Produtos Agroindustriais, Campina Grande, v.7, p.181-204, 2005. Wortel, V.A.L., Wiechers, J.W. Skin sensory performance of individual personal care ingredients and marketed personal care products, Food Quality and Preference 11:121-127, 1999 Wortmann F.J. Aussagekraftige Dimensionen, Parfumerie und Kosmetik 80(6), 1999

65
Chapter 6
Accelerated Stability Analysis
6.1 Introduction
Product stability can be defined as the maintenance of its key features and
functions through time. Many variables can be related to the product properties, like its
manufacturing process, material bottle packaging, transport and environmental
conditions, and all can influence in its stability. (Isaac, 2008) In product development,
especially when a substance is added, like antioxidants, rheological and sensorial
improvers, plant extracts, etc., many studies may be performed aiming to obtain a
stable, secure and effective product.
Changes that occur in cosmetics products can be caused by external factors
(extrinsic) or related to the formulation’s nature (intrinsic). Extrinsic factors could be
time, temperature, light, oxygen, microorganisms and vibration, and the reactions
caused by these factors are summarized in table 6.1. On the other hand, intrinsic
factors are related to ingredients interactions or to the conditioning material, such as
redox reactions, hydrolysis, pH changes, etc. (Isaac, 2008, Brasil, 2004).
Factor Problem
Time Product aging.
Temperature (high or low) Accelerating the chemical and physical-chemical reactions,
changes in viscosity, aspect, color, odor, precipitation,
crystallization.
Light and oxygen Initiate the redox reactions.
Humidity Changes in rheological properties, making the product more
softened or sticky, or modifying its weight or volume. It can
potentiate the microbiological contamination.
Packing Material Interactions between the product and the packaging material.
Microorganisms Contamination, causing product deterioration, health consumers
problems, toxic substances appearance, changes in color, odor
and aspect.
Vibration Emulsion separation phases, compaction, changes in viscosity,
and changes in temperature.
Table 6.1: Extrinsic factors and how they can change the product.
The cosmetic stability analysis provides information that indicates the relative
product stability in different conditions to which it may be subjected, since its production
until the end of its validity. However, stability assessments are always relative, because

66
product properties varies with time and depend on various factors. However, some
modifications, provided within pre-established parameters, can be accepted.
The purpose of cosmetic stability studies is to be a guide to formula
development and appropriate packaging material choose. It also provides subsidies for
the formulations improvement; validity estimation, assists in monitoring organoleptic
activity, physico-chemical and microbiological properties, producing information on the
reliability and product safety.
6.1.1 Preliminar Stability
The preliminar stability test is used to select the best product formulation, and is
one of the first analysis to be made. It consists in submitting a sample to extreme
temperature conditions and make assays about many parameters, according to the
kind of cosmetic product and the analysis aim. The test is made through 15 days, being
the first analysis 24h hours after the product manipulation or preparation (maturation
time), and the following analysis each 24 hours. The parameters that can be analyzed
are: aspect, color, odor, after the freeze-thaw and centrifugation. Measurements must
be done in triplicate and the arithmetic average shown.
6.1.1.1 Freeze-thaw
According to Friedrich et al (2007), freeze-thaw cycles evaluate the stability by
anticipating temperature shock that the product could suffer, in its storage or transport,
which can cause problems like phase separation, crystals formation, compression, loss
of sensorial and rheological properties and active principles damage. In this test, the
samples are stored in alternate temperatures at regular time intervals, and the cycle
numbers are variable. The suggested limits are:
Cycles of 24 hours at room temperature and 24 hours at -5 ± 20°C.
Cycles of 24 hours at 40 ± 20°C and 24 ± 20 hours at 4°C.
Cycles of 24 hours to 45 ± 20°C and 24 hours at -5 ± 20°C.
Cycles of 24 hours at 50 ± 20°C and 24 hours at -5 ± 20°C.
After the temperature cycles, the physical and organoleptic characteristics are
evaluated. Great changes indicate that a re-formulation may be done.
6.1.1.2 Centrifugation
The centrifugation test aims to determine the cream behavior at the end of the
storage conditions. The gravity force acts in the sample making its particles to move
inside. It generates sample stress, simulating a growth in gravity force, increasing the

67
particle mobility and producing instabilities. This can cause precipitation, phase
separation, caking formation, coalescence, etc. The sample is centrifuged in pre-
determined time, temperature and velocity, followed by visual evaluation. (Friedrich et
al, 2007)
6.1.2 Accelerated Stability
This test is carried to foresee product’s stability, such as the life time and the
compatibility between formulation and its packing, using non-extreme conditions
(Brasil, 2004). This predictive study can be also used to evaluate modifications in
product’s formulation or production process. The samples are packed in glass flasks or
in the final product pack. It’s important not to complete the total package volume (left
around a third free) to possible gaseous changes (Brasil, 2004).
The accelerated stability test is carried through 90 days, although it could be
extended to six months or to a year, depending in the product’s characteristics (Brasil,
2004). The samples may be submitted to heating (in incubators at controlled
temperature), cooling (in refrigerators), light radiation and to environmental conditions.
It’s also possible to simulate product transportation, submitting the samples to a real
movement (placing them in a transportation truck, for example) or to artificial
movement, like in shakers.
There are many parameters that could be followed in accelerated stability
analysis. They are defined by the evaluator and depend on the product characteristics
and the ingredients used in the formula. The sample must be analyzed in relation to the
pattern in order to check for instability signs. This is an important evaluation because
changes are undesirable, since a cosmetic product normally is used for many days,
usually for weeks or months.
Generally, are evaluated the following parameters (Brasil, 2004):
Organoleptic: appearance, color, odor and flavor, if applicable;
Physicochemical: pH, viscosity, density, and in some
cases, the monitoring of ingredients of the formulation;
Microbiological: microbial count and the challenge test
preservative system (Challenge Test).
6.1.3.1 Aspect
The product general aspect may be evaluated for the non-occurrence of phase
separation, precipitation or turbidity, what should be an indicative of the stability of the
sample. The appearance can be described as grainy, dry powder, wet powder,

68
crystalline, paste, gel, fluid, viscous, volatile, homogeneous, heterogeneous,
transparent, opaque and milky. The sample condition may be described as normal,
with no change or slightly separated, precipitated, turbid, always depending of the
product kind. (Brasil, 2004)
6.1.3.2 Color and Odor
In general, color and odor may be unaltered over time. But when there are
natural compounds in the formulation, it’s natural the occurance of changes, which are
generally accepted by consumers. The sample to be evaluated is compared with the
pattern, conditioned in the same flask kind, at same conditions. (Brasil, 2004)
6.1.3.3 pH
A cosmetic formulation to the skin may normally have a pH range between 5.5
and 7.0. The variation over the time can indicate some problem, such as undesirable
reactions between the cream’s components, between the cream and the package or
could indicate some microbial contamination. Moreover, pH increase could be related
to volatile aldehydes oxidation to carboxylic acids or lipid enzymatic hydrolysis, what
releases free fatty acids. (Wajda, 1985; Masmoudi et al., 2005).
6.1.3.4 Water Activity
The water in a cosmetic product is crucial to its rheological properties, texture,
consistency, viscosity and shelf time. The presence of water occurs in terms of water
activity and bounded water, resulting in total water content, expressed as humidity.
The bound water is directly linked to the product molecules, and can’t be
removed or used for any kind of reaction. The no bounded water is available for
physical (evaporation), chemical (darkening) and microbiological reactions and is
measured with the name of water activity (Aw), which can vary from Aw=0,000 (when
there is no available water) to Aw=1,000 (pure water).
A pure liquid, when in contact with air, loss molecules by evaporation. On the
other hand, if the liquid is kept in a closed container in presence of air, the molecules
come off of the liquid medium by evaporation until an equilibrium point. From this point,
a compensation phenomenon occurs: for each molecule evaporated, another one
condenses, exerting a vapor pressure.
By adding a solute in a liquid (what occurs during the preparation of an
emulsion, for example) less molecules evaporation is observed; therefore the vapor
pressure is reduced. Based on these concepts, the water activity (Aw) of a solution or

69
product is defined as the ratio between the solution vapor pressure (p) and the pure
solvent vapor pressure (po), usually pure water (= 1) at the same temperature (equation
6.1).
[6.1]
For cosmetics and hygiene products for topical use, it is important to measure
water activity since it is known that higher water activity provides "freshness" and tied
water is responsible for the delivery of the active principle. It is also a parameter
entirely linked to the product moisture capacity, as shown in the Chapter 8, and
together with temperature, pH and oxygen, is the factor that influences the most in the
stability of cosmetics and food products.
6.1.3.5 Volatile Compounds
The volatile compound can be classified as phenols, aldehydes, ketones,
alcohols, ethers, hydrocarbons, organic acids, anhydrides, esters, lactones, amines
and compounds containing sulfur atoms. The origin of each compound is listed in table
6.2.
Volatile Product Origin Author
Aldehydes Lipids auto-oxidation (unsaturated fatty acids). Dart et al, 1985
Ketones Lipids auto-oxidation (particularly unsaturated fatty acids). Dart et al, 1985
Alcohols Secondary products of lipids oxidative degradation;
carotenoids break.
Shibamoto et al,
1992
Hydrocarbons Lipids oxidative degradation. Clifford et al, 1985
Carboxylic acids Carbohydrates degradation; lipids degradation; thermic
degradation, aldehydes auto-oxidation.
Feldman et al, 1969,
Kawanda et al, 1985,
May et al, 1985
Esters Alcohol degradation; Microbial Production. Guyot, 1982
Sulfur
Compounds
Aminoacid degradation or it interactions with
carbohydrates; oxidation reactions.
Dart et al, 1985,
Kallio et al, 1990
Table 6.2: Biochemical origin of different volatiles.
6.1.3.6 Spreadability
Product spreadability can be defined as the ease with which a substance can
be expanded in a surface, in a determined time under determined pressure. The major
part of spreadability determination methods measures its deformation resistance. It can
be evaluated in sensorial tests, but it only is used to classify the consumer’s

70
acceptance. So, there are some methodologies to quantify this property (Borghetti and
Knorst, 1996).
In these tests, the spreadability is the total area reached by the scattering of a
given cream quantity. It’s calculated using the equation:
Ei = (d2. π)/4 [6.3]
where:
Ei: spreadability of the sample for a given weight (i) (cm2)
d: average diameter (cm).
6.1.3.7 Microbiology
Microbiological contamination of a cosmetic product is measured through
colony counting in Petry dishes. In some cases, they affect the preservative structure,
influencing product stability. It’s ideal that no contamination is found; however it’s
acceptable low colony counting. The presence of water and organic components in the
formulation supports microorganism growth.
According to the “Good Manufacturing Practice”, the cosmetic microbiological
quality may not rely solely on its preservative system, however it cannot be dispensed.
So, the preservative choice should be adequate (effective). Furthermore, it must be
considered that the preservatives can partially or entirely inactivated, leaving the
product without the expected protection. Thus, preservatives effectiveness tests are an
essential part of products cosmetics security. These tests aim to determine the
preservative type and effective concentration, and the minimum necessary to ensure
satisfactory protection of the product from the manufacture to the final users.
6.1.3.7.1 Sterilization
The product contamination can be due to raw materials contamination. When
extracts or natural products are added in a formulation, some decontamination process
can be carried, decreasing its microbial charge. Some industrial usual procedures are
ultraviolet light exposure, autoclaving and pasteurization.
6.1.3.7.1.1 UV
Irradiation is the process of applying radiant energy to any target, such as a
food, cosmetic or a package (Ingram & Roberts, 1980). It is used in different
applications such as air sterilization, equipment surfaces and in food packaging.
Ultraviolet irradiation is effective microbicide if used with intensity and sufficient

71
exposure time. Wavelengths below 200 nm are inefficient, since they are quickly
absorbed by oxygen and water. The ultraviolet radiation in the range of 210 and 330
nm are more effective as germicides because they are absorbed by proteins and
nucleic acids, causing chromosome disruption, genetic mutations and enzymes
inactivation, then hencing cell death (Cardoso, 2007).
UV radiation is composed of radiation bands with specific characteristics and
practical applications. The UV-A represents the bulk of the UV rays emitted by the sun,
responsible for the skin bronzing. It is not harmful and is used in medical treatment of
certain skin diseases. The UV-B, a small part of UV radiation from sunlight, is
dangerous but is mostly absorbed by the ozone layer. Prolonged exposure to UV-B
results in skin cancer and eye cataracts. The UV-C, germicidal, also known as "short
wave UV”, cause skin reddening and eye irritation, but does not cause skin cancer
(Rouessac, 2000).
The wavelength of UV-C, which inactivates the DNA / RNA, the genetic material
of microorganisms, is between 250 to 270 micrometers. In general, ultraviolet radiation
has been shown to be the fastest, reliable, effective, economical and environmentally
safe in the treatment of surfaces and liquids. Moreover, the combined use of ultraviolet
radiation and chemical disinfectants has presented a synergistic effect in
microorganisms control, especially in cases where the residual chemical agent should
be controlled at minimum levels or absent (Abreu & Faria, 2004; Siemens
Water Technologies, 2007).
6.1.3.7.1.2 Autoclave
The sterilization procedure that offers greater security is saturated steam under
pressure, held in autoclaves. In this equipment, the microbes are destroyed by the
combined action of temperature, pressure and humidity, which promote thermal
coagulation and protein denaturation of cellular genetic structure. The saturated steam
process has advantageous characteristics and other limiting factors. The advantages
consist in the rapid heating and rapid penetration into textile fabrics or cotton, microbial
spore destruction in a short exposure period, easy quality control and mortality, toxic
materials absence and be economical. The constraints consist of the incomplete air
removal from the inner chamber, not allowing the spread and steam expansion to
achieve sterilization and equipment misuse, which can lead to overheating the steam,
reducing the microbicide power, and don’t sterilize powders and oils. (Godoy et al,
2000)
NBR ISO 11134 specifies requirements for the use of moist heat in sterilization
process development, validation of the sterilization process and control of routine

72
sterilization. It involves all processes in wet heat, including steam and saturated steam-
air mixture, is applicable to all industrial manufacturing processes and all others who
perform sterilization by moist heat. The principles outlined may be useful in the use of
moist heat sterilization in establishments other than hospital products industries.
6.1.3.7.1.3 Pasteurization
The method of pasteurization was created by Louis Pasteur, who tested a
possibility of microorganism inactivation in wine through the application of
heat. Pasteurization's main objective is the destruction of pathogenic organisms of a
given product. A secondary objective is to increase its shelf life, reducing the rates of
microbiological and enzymatic changes. Pasteurized products may encore contain
many living organisms, which limits their shelf life. Thus, pasteurization is often
combined with other preservation methods and many pasteurized products are stored
under refrigeration (Potter & Hotchkiss, 1995). There are three types of pasteurization:
• Slow Pasteurization: lower temperatures for longer time intervals. The most
commonly used set temperature is 65 ˚ C for thirty minutes.
• Fast Pasteurization: high temperatures for short time intervals. The most
commonly used temperature is 75 ˚ C for 15 to 20 seconds. This type of pasteurization
is known by HTST (High Temperature and Short Time).
• Very Fast Pasteurization: temperatures ranging from 130 ˚ C to 150 ˚ C for
three to five seconds. It is known as UHT (Ultra High Temperature) or long life.
6.2 Materials and Methods
It was prepared 1kg of base cream, which was divided into two parts: the first
500g received 0,5% (w/w) Spirulina platensis EPS and 2ml of a water biomass extract
(10% v/w) and the other 500g didn’t received any other addictive. Each cream amount
was divided in 5 plastic flasks, with capacity to 120g, each one with 100g of cream. The
flasks were distributed to evaluate the response against some conditions. One
Spirulina’s Cream flask and one Base Cream were left in a paper closed box, at room
temperature. The same was made in the refrigerator, in the incubator, in the shaker
and in the illuminated shelf.
These creams were subjected to different types of stress to check its stability
during 90 days (accelerated stability). The conditions tested were temperature (room
temperature, incubator at 37°C, refrigerator at 5°C), light exposure (3500Lux, 12h/12h),
and agitation (shaker 120 rpm, 27°C).

73
6.2.1 Preliminary Stability
Freeze-thaw and centrifugation were carried to evaluate the preliminary
stability.
6.2.1.1 Freeze-Thaw
In appropriate plastic packaging, similar to that used for cosmetic products,
about 20g of the sample was subjected to at least six extreme temperatures cycles.
Cycles of alternate freezing and thawing included sample’s exposure during 24 hours
at high temperatures (30 ± 2 ºC) and 24 hours at low temperatures (–5 ± 2 ºC).
6.2.1.2 Centrifugation
In graduated conical centrifuge tubes 5g of sample was weighed in analytical
balance and centrifuged (246xg) for thirty minutes at room temperature (Rieger, 1996,
Morais, 2006). The non-occurrence of phase separation does not ensure its stability,
but allows it to follow to a stability test. The creaming absence (oil phase floating)
indicates that this emulsion, under normal gravity conditions, could be physically stable.
(Tadros, 2004).
6.2.2 Accelerated Stability
Accelerated stability analysis was carried in days 1, 8, 15, 25, 40, 55, 70 and 90
after the moisturizers production. The recipients containing the samples were collected
from each place (room temperature, refrigerator, incubator, shaker and under light) and
5g was collected for visual analysis of appearance, odor and color. After that, the water
activity was measured, followed by pH measurement, volatiles acids and spreadability.
Microbiology analysis was carried in days 1, 40 and 90).
6.2.2.1 Aspect, Color and Odor
The colors analyses were performed by visual comparison, under conditions of
white light and also spectrophotometrically, as indicated by standard methods. Odor
was evaluated by direct smelling (standard method). The appearance, odor and color
were evaluated by comparison between the initial and final samples aspects of
Spirulina Cream and the control (Base Cream).
6.2.2.2 pH
The pH determination was conducted in an aqueous dispersion of 10% (m/v)
obtained with a dispersion of 0.5g of sample in freshly distilled water, homogenized

74
with a magnetic agitator using digital pH meter, in triplicate (Brasil, 2004).The electrode
should be inserted directly into the dispersion water (Davis and Burbage, 1997; Isaac,
1998a; Brazilian Pharmacopoeia, 2001). pH values between 5.5 and 7.0 are
compatible with cutaneous pH and should be used as a criteria of stability (Knorst,
1991; Milão, 2001).
6.2.2.3 Water Activity
The water activity measurement of 5 grams samples was performed in Aqua-
Lab X. The equipment was periodically calibrated with appropriate standards.
6.2.2.4 Volatile Compounds
Certain amount of sample weighed analytically was dried at 100ºC to constant
weight. The difference in weight was considered as volatile compounds (usually
expressed in percentage).
6.2.2.5 Spreadability
To determine the spreadability, the methodology proposed by Isaac (1994) was
employed. On a rectangular wooden board, a sheet of graph paper was fixed, and a
rectangular glass plate (10 cm x 20 cm) putted above. The weighted sample (0.1g) was
placed in the glass plate and another glass plate of known weight (325g) was placed
on top. After three minutes, a weight of 250g was repeatedly added until reach a kilo
(four weights, 250g each one).
To measure the area upon which the cream was able to spread, a device
millimeter scale was used. Measurements were made in duplicates.
6.2.2.6 Microbiology
The creams microbiology was evaluated by successive dilution and inoculation
into plates containing Nutrient Agar (to analyses the bacterial presence) and Potato
Dextrose Agar – PDA (to fungi and yeast). To Type I Products (for use by children, for
the eye area and products that come into contact with mucous membranes), the
maximum count is 5 x 10² CFU/g or ml; while to Type II Products (other cosmetics, in
which are body and face creams are included), the maximum count is ten times higher
(Carturan, 1999).

75
6.2.2.6.1 Sterilization
The EPS and Biomass Sterilization were tested to foresee if the microbial count
can be decreased. Sterilizations by UV exposure through 30 minutes, autoclaving
through 15 minutes at 130°C and pasteurization at 65°C for 30 minutes, were
performed. Aqueous extracts of the samples, 10% (m/v), were used. After the
sterilization procedures, the aqueous extracts were diluted and plated in Nutrient Agar
(NA) and Potato Dextrose Agar (PDA). NA plates were incubated at 30°C for 24h to NA
and PDA at 37°C for 72h.
6.3 Results and Discussion
6.3.1 Freeze-Thaw
After 6 cycles of freeze-thaw (24h in freezer, -5°C, and 24h in incubator, 30°C),
the cream’s appearance was evaluated. Both Spirulina and Base Cream didn’t show
any modifications in odor and color, neither in the general cream aspect. There were
no phase separations and any destabilization emulsion effect, such as creaming,
floating, coalescence, etc.
6.3.2 Centrifugation
Centrifugation was performed as a preliminary analysis to determine any signs
of instability indicative of the need for reform (Brasil, 2004). Any of the formulations,
Base and Spirulina Cream, showed alterations in relation to its original appearance.
Considering this and the freeze-thaw test, it can be concluded that it’s not
necessary any reformulation, once problems was not observed when the samples were
exposed to critical conditions. So, they can be analyzed for their response to the
accelerated stability tests.
6.3.3 Color, Aspect and Odor
The organoleptic characteristics determine the parameters of the product
acceptance by consumers. Those tests are intended to ensure that possible changes
that may occur in the product will not be perceived by the senses and will not bring any
loss of product benefit or safety.
The results obtained for general aspects (color, odor and aspect) are
summarized in the table 6.3. It was noted that the Spirulina Cream was more
susceptible to the extreme conditions to which it was subjected, in relation to the
control. Probably, this is a consequence of microbiological contamination, a
consequence of EPS addition to the cream, which it can act as carbon source.

76
Creams
Base Spirulina
Condition Time (days) Aspect Color Odor Aspect Color Odor
Room temperature (dark)
1 N N N N N N
8 N N N N N N
15 N N N N N N
25 N N N N N N
40 N N N N N L
55 N N L N N L
70 N N L N N L
90 N N L N N L
Incubator (37°C)
1 N N N N N N
8 N N N N N N
15 N N N N N N
25 L N N L N N
40 L N N L N L
55 L N L L N L
70 M N L M N L
90 M N L M N M
Refrigerator (4°C)
1 N N N N N N
8 N N N N N N
15 N N N N N N
25 N N N N N N
40 N N N N N N
55 N N N N N N
70 N N N N N N
90 N N N N N N
Shaker (27°C, 120rpm)
1 N N N N N N
8 N N N N N N
15 N N N N N N
25 N N N N N N
40 N N N N N L
55 N N L N N L
70 N N L N N L
90 N N L N N L
Under Light
1 N N N N N N
8 N N N N N N
15 N N N N N N
25 N N N N N N
40 N N N N N N
55 N N N N N L
70 N N L N N L
90 N N L N N L
Table 6.3: Aspect, color and odor analysis.
Aspect
N – normal, without alteration
Color
N – normal, without alteration
Odor
N – normal, without alteration
L - lightly modified L - lightly modified L - lightly modified
M – modified M – modified M – modified
I - intensely modified I - intensely modified I - intensely modified

77
It’s important to note that low temperature didn’t showed effect in creams
stability. Changes were noted when the creams were subjected to higher temperature
(50ºC in incubator). Creams surface became very dry and brittle, general viscosity was
altered and little phase separation was noted (untied water in the middle of the dry
cream). So, high temperature was the only condition that affects cream composition.
In terms of color, any changes was noted in the conditions tested, what was not
observed to the odor. Cream’s odor was classified as “Modified” only when subjected
to high temperature (50ºC). In conditions in which lightly changes were observed, both
creams were altered. In this case, changes in Spirulina Cream started before than the
Base Cream, probably due to cream manipulation in no sterile place (to simulate the
normal consumer’s manipulation). It may have left the cream susceptible to
microbiological contamination, and microorganisms growth may be a possible cause to
odor generation. Also, the additives (Biomass extract and EPS) can bring some
microbial charge, what will be discussed.
(a)
(b)
(c)
Fig. 6.1: Flasks used for the Accelerated Stability Test (a): the flasks in the left column contained the Base Cream, and in the right the Spirulina Cream. (Code: A Ambient; E Incubator; G Refrigerator; S Shaker; Glass Flask with color cover light exposure. The modified aspects of the creams in Incubator (b), in comparison with a normal aspect (refrigerator) (c) are shown.

78
6.3.4 pH
Both creams maintained their pH values almost constant trough the time. The
inicial and final pH are shown in table 6.4. The intermediate data are not shown, but
were always between 6.4 and 6.9, wich are acceptable values for skin products, not
causing skin problems. The little pH modification is an indicative of no occurance of any
critical reaction between the cream’s componentsand no critical microbian
contamination.
Initial pH Final pH
Base Cream
Room Temperature 6.56±0.02 6.79±0.03
Incubator 6.80±0.03 6.45±0.01
Refrigerator 6.50±0.01 6.46±0.02
Shaker 6.40±0.02 6.76±0.01
Under Light 6.65±0.02 6.67±0.02
Spirulina’s Cream
Room Temperature 6.53±0.03 6.87±0.01
Incubator 6.71±0.01 6.90±0.03
Refrigerator 6.32±0.01 6.70±0.01
Shaker 6.49±0.02 6.82±0.02
Under Light 6.78±0.01 6.85±0.03
Table 6.4: pH values inicial and final (t=1 and t=90 days)
6.3.5 Water Activity
Water activity measurements showed that in all cases the loss of water was
smaller in the Spirulina Cream than in the Base Cream (Figure 6.2). It indicates that the
EPS increases the free water content. It’s also related with a bigger moisturizer power,
as discussed in Chapter 8. It’s possible to see that, through time, water activity was
always equal or higher than the Spirulina Cream. Moreover, water activity lost was
much lower in Spirulina Cream (0.2% maximum decrease, while the base cream
decreased 2.0% in average). It seems to be a small difference, but the EPS addition
prevented 10 times the free water product loss.

79
(a)
(b)
(c)

80
(d)
(e)
(f)
Fig. 6.2: Water activity profile for Base Cream and Spirulina Cream, at Room Temperature (a), Incubator (b), Refrigerator (c), Shaker (d) and Under Light (e). Resume of all creams and conditions, showing the best performance of Spirulina Cream, against Base Cream (f).

81
6.3.6 Volatile Compounds
The volatile compounds were measured in days 1, 8, 15, 25, 40, 55, 70 and 90,
and results are shown in Table 6.5. Through time, no significant changes were
observed, which indicates no occurrence of intrinsic reactions neither an expressive
microbial contamination.
Volatile Compounds (%)
Base Cream
Room Temperature 2,89±0,17
Incubator 2,68±0,02
Refrigerator 2,91±0,18
Shaker 2,74±0,06
Under Light 2,44±0,15
Spirulina’s Cream
Room Temperature 2,66±0,01
Incubator 2,58±0,05
Refrigerator 2,47±0,13
Shaker 2,26±0,28
Under Light 2,23±0,30
Table 6.5: Volatiles compounds measured.
6.3.7 Spreadability
Spreadability was better to the Spirulina Cream then the Base Cream in all
conditions tested (Figure 6.3). It’s important to note that the average spreadability was
much smaller to the samples placed in the incubator. It can be explained by the
alteration in visual viscosity and the phase separation. In all other cases, spreadability
didn’t presented great variations, showing no interference of the different conditions
tested. On the other hand, by comparing the Base and the Spirulina Creams, a big
difference was noted. At room temperature, for example, spreadability of Spirulina
Cream was almost twice of the Base Cream.

82
Fig. 6.3: Spreadability average comparision among all conditions tested.
Table 6.6 shows the diameter average values of each cream in each condition.
It’s clear the lower spreadability obtained for the samples placed in the incubator,
showing that high temperatures promote great aqueous phase evaporation, changing
the cream’s general aspect and the parameters related to its viscocity(spreadability, for
example). The average diameter values for the Base Cream, considering all conditions,
were about 5cm, 1 cm lower than the average obtained with Spirulina Cream. So, using
Equation 6.2, the area covered by a certain cream amount can be calculated (Table
6.6). Disconsidering the samples placed in the incubator, the Spirulina Cream
spreadability was always higher than the Base Cream: 59,1% (under light), 63,7%
(shaker), 70,2% (refrigerator) and 83,7% (room temperature).

83
0,1g
Medium Diameter (cm) Area (cm²) cm²/g
Base Cream
Room Temperature 5.09 20.33 203.26
Incubator 3.42 9.20 92.05
Refrigerator 4.94 19.12 191.24
Shaker 4.79 18.03 180.33
Under Light 5.14 20.75 207.51
Spirulina’s Cream
Room Temperature 6.90 37.34 373.35
Incubator 3.53 9.77 97.66
Refrigerator 6.44 32.56 325.57
Shaker 6.13 29.53 295.25
Under Light 6.49 33.02 330.21
Table 6.6 : Spreadability values to each cream and each condition; average considering 90-days experiment.
6.3.8 Microbiology
The microbiology contamination was evaluated in days 1, 40 and 90, . Fungi
and yeast weren’t found, while bacteria were. The total count is sumarized in table 7.
The microbiological count was always below the maximun limit allowed (5 x 10³). It
was noted a little increase in the total microbial charge, but only after 3 months.
This unusual kind of contamination can be explained by the so-called “Phoenix
Effect” (Maibach, 2001). This effect is generated by a intense stress at the moment of
the product preparation causing most microrganisms death and the latent state in the
remaining. Those who were in latent state begin to growth after some time. In the
Creams preparation, after the EPS addition the pH went up (source of stress), being
readly corrected by citric acid adding, probably giving conditions to the Phoenix effect.
Base Cream
Day 1 40 90
Bacteria (UFC/g) 1,10 x 10¹ 0,93 x 10² 1,36 x 10³
Spirulina Cream
Day 1 40 90
Bacteria (UFC/g) 2,70 x 10¹ 1,13 x 10² 2,92 x 10³
Table 6.7: Bacterial Count of Base Cream and Spirulina Cream, in the beginning, in the
middle and in the end of the experiment.

84
6.3.8.1 Sterilization
One hypotesis to the microbial charge in the creams, higher in the Spirulina
Cream, is the use of EPS and microalgal as carbon source for growth before the final
product for ulation. To confirm this, three sterilization methods were tested.
Aqueous extracts (10% w/v) were prepared, both with Spirulina EPS and
biomass. One part of this aqueous extracts was inoculated in Agar Nutrient and PDA
plates without sterilization. The other part of the aqueous extracts was submited to one
of the following sterilization methods: autoclaving, ultraviolet exposure and
pasteurization and inoculated in Agar and PDA plates. After incubation, sterilization
methods were evaluated through microbial count. UV exposure and Pasteurization
promoted a decrease in the microbial charge, and by autoclavation promoted complete
microbial charge removal (Table 6.8).
Considering allowed microbial count, any sterilization treatment is really
necessary to the Spirulina Cream. In the accelerated stability test, after 90 days the
total microbial count didn’t reached the maximum value allowed . But, as the slight odor
modification noted can be due to this small bacterial contamination, sterilization
methods can be used to avoid odour modifications
UFC/mL
Limit 5,00 x 10³
Ambient
EPS 3,15 x 10²
Biomass 2,30 x 10²
Ultraviolet
EPS 5,10 x 10¹
Biomass 3,20 x 10¹
Pasteurized
EPS 1,10 x 10¹
Biomass 2,00 x 10¹
Autoclaved
EPS 0
Biomass 0
Table 6.8: Microbial count before and after sterilization tests.

85
6.4 Conclusions
The Preliminar Stability Test showed that the Spirulina and Base cream were
apparently stable, without the necessity to recast;
Little sensorial modifications (in aspect and odor) were noted through the 90-
days analysis, probably caused by microbial contamination;
The Spirulina Cream had better water retention capacity, indicating that,
besides sensorial improved properties, it can be more moisturizing (Chapter8);
Both creams presented negative changes when incubated at high temperature,
losing water, modifying the cream aspect and losing spreadability. For all the
other conditions, the Spirulina Cream had best spreadability values than the
Base Cream;
Few contamination was observed in both creams; the total microbial count were
always below the maximum limit allowed by legislation;
The best sterilization method for both EPS and Biomass was autoclaving.

86
References Abreu, L. F.; Faria, J. A. F. Evaluation of a system for chemical sterilization of packages. Packaging Technology and Science, v. 17, p. 37-42, 2004. Bezerra, S.V & Rebello, T. Guia de Produtos Cosméticos. Ed. Senac, São Paulo. 1999. 2ªEd. Brasil. Agência Nacional de Vigilância Sanitária (ANVISA). Gerência Geral de cosméticos. Guia de controle de qualidade de produtos cosméticos. Brasília, 2004. Brannan, D.K. Cosmetic Microbiology – A Pratical Handbook. CRC Press, New York, 1997. Cardoso, C. F. Avaliação da esterilização de filme de polietileno com peróxido de hidrogênio e radiação ultravioleta. 2007. Dissertação (Mestrado em Tecnologia de Alimentos) Universidade Estadual de Campinas, Campinas, 2007.
Cartunan, G.F. Guia ABC de Microbiologia – Controle Microbiológico na Indústria de Produtos de Higiene Pessoal, Cosméticos e Perfumes. Parâmetros, Metodologia Analítica e Orientações. Associação Brasileira de Cosmetologia. São Paulo, 1999. Clifford, M. N.; In Coffee Botany, Biochemistry and Production of Beans and Beverage; Clifford, M. N.; Willson, K. C., Eds; Croom Helm; London, 1985; p. 351. Dart, S. K.; Nursten, H. E.; In Coffee Chemistry (vol. 1); Clarke, R. J.; Macrae, R., Eds.; Elsevier Applied Science Publishers; London, 1985; p. 247. Davis SS, Burbage AS. Electron micrography of water in-oil-in-water emulsions, J Colloid Interface Sci 1997; 62:361-3. Farmacopéia Brasileira. 4.ed. São Paulo: Atheneu; 2001.pt.2. p.146. Feldman, J. R.; Ryder, W. S.; Kung, J. T.; J. Agric. Food Chem. 1969, 17, 733. Friedrich, M., Primo, F.T., Funck , J.A.B., Laporta, L.V., Alves , M.P, Bittencourt, C.F., Escarrone, A.L.V. Avaliação da Estabilidade Físico-Química de Creme Não Iônico Inscrito no Formulário Nacional Latin American Journal of Pharmacy (formerly Acta Farmacéutica Bonaerense) Lat. Am. J. Pharm. 26 (4): 558-62. 2007. Godoi, I.P. et al. Validação de Processos de Esterilização. Apostila – Faculdade de Ciências Farmacêuticas. Universidade de São Paulo. Guyot, B.; Cros, E.; Vincent, J. C.; Café Cacao Thé 1982, 26, 279. Ingram, M.; Roberts, T. A. Application of the Dconcept to heat treatments involving curing salts. Journal Food Technology, v. 6, p. 21-28, 1980. Isaac VLB. Desenvolvimento, estabilidade e liberação in vitro de preparações lipolíticas. [Tese] São Paulo; Faculdade de Ciências Farmacêuticas, USP; 1998. Isaac, V.L.B., et al. Protocolo para ensaios físico-químicos de estabilidade de fitocosméticos. Revista de Ciências Farmacêuticas Básica e Aplicada. Vol. 29, nº1, p. 81-96, 2008. Kawanda, T.; Krishnamurthy, R. G.; Mookherjee, B. D.; Chang, S. S.; In Coffee Chemistry (vol. 1); Clarke, R. J.; Macrae, R., Eds.; Elsevier Apllied Science Publishers; London, 1985; p. 287. Kallio, H.; Leino, M.; koullias, K. ; Kallio, S.; Kaitaranta, J.; Food Chem. 1990, 36, 135.

87
Knorst, M.T. Desenvolvimento tecnológico de uma forma farmacêutica plástica contendo extrato concentrado de Achyrocline satureoides (lam.) Compositae-marcela. Porto Alegre: UFRGS, 1991. Dissertação, Universidade Federal do Rio Grande do Sul, 1991. Knorst MT, Borghetti GS. Desenvolvimento e avaliação da estabilidade física de loções O/A contendo filtro solares. Rev Bras Ciênc Farm 2006; 42(4):531-7. Maibach, H.I, Paye M., Barel, A.O. Handbook of Cosmetic Science and Technology. Marcel Dekker, New York. 2001. May, W. A.; In Coffee Chemistry (vol. 1); Clarke, R. J.; Macrae, R., Eds.; Elsevier Apllied Science Publishers; London, 1985; p. 287. Milão, D., Lange, K.M., Heberlé, G. Avaliação da estabilidade e atividade antioxidante de uma emulsão base não-iônica contendo resveratrol . Brazilian Journal of Pharmaceutical Sciences vol. 45, n. 1, jan./mar., 2009 Morais, G.G. Desenvolvimento e avaliação da estabilidade de emulsões O/A com cristais líquidos acrescidas de xantina para taratamento da hidrolipodistrofia ginóide (celulite). São Paulo, 2006. 181p. Dissertação (Mestrado) – Faculdade de Ciências Farmacêuticas de Ribeirão Preto - Universidade de São Paulo. NBR ISO 11134/2001 Esterilização de produtos hospitalares. Requisitos para validação e controle de rotina. Esterilização por calor úmido Orth, D.S. Handbook of Cosmetic Microbiology. Marcel Dekker New York, 1993. Potter, N.N.; Hotchikiss, J.H. Food Science. 5.ed. New York: Chapman & Hall, 1995. 608 p. Rieger, M.M. Teste de estabilidade para macroemulsões. Cosmet. Toiletries, 8(5): 47-53, 1996. Rouessac F. & Rouessac A. Chemical Analysis, Modern Instrumentation Methods and Techniques; John Wiley & Sons, 2000, p189. Siemens Water Technologies. UV technology: chemical-free water treatment and disinfection. Disponível em: <http://www.siemens.com>. Acesso em: 27 abr. 2007. Shibamoto, T.; Yeo, H.; In Flavor Precursors (Therma and Enzymatic Conversions); Teranishi, R.; Takeoka, G.R.; Güntert, M., Eds; ACS Symposium Series 490; New York, 1992; p. 175. Tadros, T. Application of rheology for assessment and prediction of the long-tern physical stability of emulsions. Adv. Colloid Interface Sci., v.108/109, p.227-258, 2004. Wajda, P.; Walczyk, D.; In Coffee Chemistry (vol. 1); Clarke, R. J.; Macrae, R., Eds.; Elsevier Apllied Science Publishers; London, 1985; p. 271.

88
General Conclusion
After this work, it was possible to conclude that it was possible to cultivate Spirulina
platensis and obtain biomass and EPS at usual levels, with compositions similar to those
described in the literature. Also, it was found that the S. platensis EPS has a protein-glucan
nature.
Some properties were investigated to find some cosmetic application to this biomass
extract and polysaccharide. The antioxidant capacity test demonstrated the potential of S.
platensis biomass and EPS for cosmetics application, and, in this way, these products could
replace or unless diminish the use of synthetic antioxidant substances, like BHA and BHT, by S.
platensis biomass extracts. In other hand, the S. platensis EPS showed visual similarity to
Kaolim, which is a mineral used in cosmetic industry to improve rheological and sensorial
properties.
Nowadays, both the mondial and Brazilian cosmetic market have place to new and
innovative products and, in this context, the microalgae are beginning to be intensively
researched as source for new and innovative cosmetic products and stand out as one
interesting alternative for the cosmetic industries. So, adding the important properties found in
the microalgae products and this place in the market, it was decided to insert this material into
emulsions and study the acceptability. So, it was found a cream formulation that, with the EPS
and biomass extract addition, there were no emulsion problems in viscosity, aspect, pH or color.
All the creams tested (with or without Spirulina EPS addition) showed a non-Newtonian,
pseudoplastic and viscoelastic behavior. All of them also showed thixotropic behavior. The
more adequate hysteresis area was achieved with 0.5% Spirulina platensis EPS addition to the
Base Cream. The 0.5% of Spirulina platensis EPS cream presented the best Minimum
Apparent Viscosity, indicating its better spreadability;
The frequency and tension scans were useful to observe the G’ and G” moduli behavior
of each sample. The base cream and the 0.5% EPS cream showed the more constant pattern,
what indicates best emulsion stability (distorted in the other creams probably by the great
amount of solid particles in it).
The higher recovery was achieved for the Base and 0.5% EPS creams. The results
achieved in these tests showed that the cream with 0.5% EPS presented general better results
in relation to the Base Cream. The 0.5% EPS cream was chosen for the next tests. By
analyzing the rheograms, some sensorial and physico-chemical stability improvements of the
addition of 0.5% EPS could be predicted: it can make the cream smoother and improve
spreadability.

89
After this preliminar formulation, it was necessary to perform Stability tests, to see if the
active compounds could interact and destabilize the formula. The Preliminar Stability Test
showed that the Spirulina and Base cream were apparently stable, without the necessity to
recast. Little sensorial modifications (in aspect and odor) were noted through the 90-days
analysis, probably caused by microbial contamination. The Spirulina Cream had better water
retention capacity, indicating that, besides sensorial improved properties, it can be more
moisturizing.
Despite this good results, both creams presented negative changes when incubated at
high temperature, losing water, modifying the cream aspect and losing spreadability. For all the
other conditions, the Spirulina Cream had best spreadability values than the Base Cream.
Looking this entire scenario, it’s possible to conclude that the Spirulina platensis
products can be an important biotechnological source of bioactive substances, improving the
performance of a lot of anti-aging and related products, in a growing and increasingly critical
market.