Embed Size (px)
Citation preview

Page 12
Received 02 July 2019 Revised 09 Sep 2019 Accepted 10 Oct 2019
NBR
NUST Business Review NBR-19-0107 Vol. 01, No. 01 10, 2019 pp. 12-43 © NUST Business School
Evaluation of the China Pakistan Economic Corridor Road Network: Shortest Route,
Regional Distribution, and Robustness
Raja Awais Liaqaita a Department of Mechanical Engineering, Capital University of Science & Technology,
Islamabad, Pakistan; Email: [email protected]
Mujtaba Hassan Aghab,*1, b NUST Business School (NBS), National University of Sciences and Technology,
Islamabad, Pakistan; Email: [email protected]
Till Beckerc
cFaculty of Business StudiesUniversity of Applied Sciences Emden/Leer Emden,
Germany; Email: [email protected]
Abstract
Purpose - The transport road network plays a significant role in the economic
development of any country. An appropriate road network not only reduces
transportation cost but it also serves as an infrastructural enabler for further economic
development. The China-Pakistan Economic Corridor (CPEC) is part of the Chinese
“Belt and Road Initiative”, seeking better connectivity between Asia, Europe, and
Africa. The major part of the CPEC project is the development of a road network
linking the port city of Gwadar (Pakistan) with Kashgar (China). This paper focuses
on the quantitative evaluation of alternate routes within the CPEC road network
inside Pakistan with regard to travel times, road development in provinces, a
balanced distribution of road network among provinces, and robustness against road
closures.
Methodology - The network is developed as an undirected graph with nodes as cities
and edges as interlinking roads. Based on publicly available data, the paper identifies
the shortest path from Gwadar to Khunjerab pass (Pakistan-China Border) and
measures the distribution of the travelled distance among Pakistan’s provinces for
each alternate route. Moreover, the robustness of road network is evaluated by a
knock-out analysis.
Results - The results showed that an unconsidered route by the planners promises the
shortest travel time and that some proposed routes have significantly unbalanced
share amongst provinces. There is a variation in robustness between the alternate
routes, but with any route selected, the road network is able to remain functional even
after closure of multiple connections.
The current issue and full text archive of this journal is available on NUST Business Review at: www.nbr.nust.edu.pk

NBR 1,1
Page 13
Practical Implications - This study provides a decision-making toolbox for analysis and
policy-making related to economic corridors e.g. CPEC – which is at its inception
phase, and still tied to limited availability of data.
Originality - The present study is novel because no prior study has covered the road
network analysis of CPEC. Also, robustness and topographical analyses with respect
to CPEC have not previously been undertaken.
Key Points:
Comparison of the three proposed routes of China Pakistan Economic Corridor
(CPEC) road network based on travel time and distance.
Evaluating the robustness of the CPEC road network via node and edge knock-out
analysis.
Shortest travel time is achieved using a combination of Eastern and Central routes.
Eastern route gives the most equitable share of all provinces in the network.
Keywords: China Pakistan Economic Corridor (CPEC), Knock-out Analysis,
Network Failure, Robustness.
Paper Type: Research Paper
1.0 Introduction
The “Belt and Road Initiative” is an infrastructure development endeavour with
the aim of building stronger economic links between Europe, Asia and Africa (Cheng,
2016). The Eurasian continent will be connected through the land based “Silk Road
Economic Belt” while connectivity between Asia and Africa will be improved via the
maritime Silk Road (Yang et al., 2017) as shown in Figure 1.
Most of the countries covered by the Belt and Road Initiative are low-income
economies and contribute only 30% to the world’s GDP (Huang, 2016). However,
these countries have great potential for rapid economic growth if proper conditions
are provided (Tian et al., 2016). This initiative will not only benefit the countries in
the Belt and Road area through a Chinese outward direct investment (ODI), but also
Figure 1.
Routes of the Belt and
Road Initiative
(Adapted from Xinhua
News Agency)
NBR 1,1
Page 14
Table 1.
CPEC
Infrastructure
Projects
upgrade industries in the underdeveloped north western region of China (Zheng &
Liu, 2015).
The “China Pakistan Economic Corridor” (CPEC) is part of the “Belt and Road
Initiative”. Considered as a gateway of economic prosperity and stabilization for
Pakistan, (S Uddin et al. 2019). Acting as a framework of regional connectivity
comprising of transport infrastructure development, energy projects, and special
economic zones (Rafiq, 2017), this project aims to provide an easy access from north
western provinces of China to the Arabian sea via Gwadar, which is the closest deep
sea port for these regions (Cheng, 2016; Naseem, 2017). Moreover, CPEC has the
potential to connect Middle East and Central Asian energy supplies to China (Shaikh
et al., 2016; Sheu & Kundu, 2017). While CPEC is a bilateral economic corridor between Pakistan and China,
currently all the development projects under CPEC are being carried out only in
Pakistan. China’s foreign direct investment (FDI) initiative is aimed at improving the
underdeveloped infrastructure of Pakistan. The total estimated cost of CPEC is US$62
billion (Garlick, 2018). CPEC is projected to reach completion by 2030. However, a
3000-kilometer road network mainly consisting of highways and motorways is
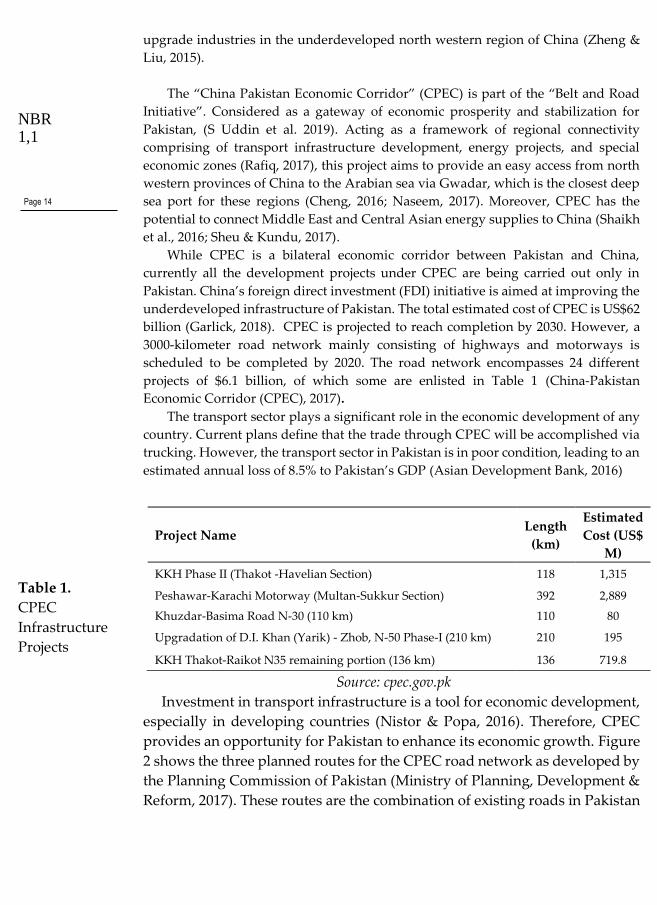
scheduled to be completed by 2020. The road network encompasses 24 different
projects of $6.1 billion, of which some are enlisted in Table 1 (China-Pakistan
Economic Corridor (CPEC), 2017).
The transport sector plays a significant role in the economic development of any
country. Current plans define that the trade through CPEC will be accomplished via
trucking. However, the transport sector in Pakistan is in poor condition, leading to an
estimated annual loss of 8.5% to Pakistan’s GDP (Asian Development Bank, 2016)
Source: cpec.gov.pk
Investment in transport infrastructure is a tool for economic development,
especially in developing countries (Nistor & Popa, 2016). Therefore, CPEC
provides an opportunity for Pakistan to enhance its economic growth. Figure
2 shows the three planned routes for the CPEC road network as developed by
the Planning Commission of Pakistan (Ministry of Planning, Development &
Reform, 2017). These routes are the combination of existing roads in Pakistan
Project Name Length
(km)
Estimated
Cost (US$
M)
KKH Phase II (Thakot -Havelian Section) 118 1,315
Peshawar-Karachi Motorway (Multan-Sukkur Section) 392 2,889
Khuzdar-Basima Road N-30 (110 km) 110 80
Upgradation of D.I. Khan (Yarik) - Zhob, N-50 Phase-I (210 km) 210 195
KKH Thakot-Raikot N35 remaining portion (136 km) 136 719.8

NBR 1,1
Page 15
and the new ones being developed under the umbrella of CPEC infrastructure
development projects. The routes are named: Eastern route, Central route and
Western route according to their geographical alignment within Pakistan.
The substantial benefits that CPEC can bring to Pakistan depend on its
actual implementation, which requires a number of decisions to be made by
the policy makers. Jato et al. (2014) argued that major construction projects
involve a variety of factors, which need to be considered, thus making
decisions in such environments are difficult. Therefore, this study aims to
provide a quantitative tool that can aid policy makers in Pakistan in their
decision-making.
The major part of the CPEC project is the development of a road network
linking the port city of Gwadar (Pakistan) with Kashgar (China). China’s part
of the CPEC road network (starting from Khunjerab Pass to Kashgar) is
already constructed, therefore, this study will only evaluate the road network
of CPEC in Pakistan, that is, from Gwadar to Khunjerab pass (Pak-China
border). The study focuses on evaluating the robustness of a planned road
network. Moreover, identification of important cities and evaluation of
alternate routes with regards to travel time, travel distance and regional share
(both geographical and population distribution) are also highlighted for the
detailed evaluation of the CPEC road network in Pakistan.
Following this introduction, section 2 details the problem statement of this
study. While, section 3 explains a further elaboration of the transport
corridors and road network connectivity. The method for assessment and
data collection is outlined in section 4. The key findings are highlighted and
discussed in section 5. Finally, conclusions are presented in section 6.
Figure 2.
Routes of CPEC Road
Network (Source:
National Highway
Authority (NHA)
Government of
Pakistan)

NBR 1,1
Page 16
2.0 Problem Statement
Nowadays, the major problem that CPEC project is facing is the strong
criticism from some local ethnic groups and leaders of the smaller provinces
of Pakistan (Bengali et al., 2015). The smaller provinces in Pakistan believe
that the largest province (Punjab) will reap most of the expected benefits of
CPEC and an undue importance is being given to the Eastern route (Peer,
2015). This political debate accrues serious concerns about the fulfilment and
implementation of CPEC project for both China and Pakistan. The road
network should not only provide fast linkage from the port city of Gwadar
(Pakistan) to Kashgar (China) as travel time is directly related to
transportation cost (Anderluh et al., 2019), but it should also provide equitable
share for all regions within Pakistan. In this critical environment, there is a
need to provide an unbiased approach that helps the policy makers analyse
this multi criterion problem. So far, majority of the studies have approached
CPEC from socio-economic and geo-political perspectives (Ali et al., 2018) but
no quantitative study has been conducted that analyses the CPEC road
network. Therefore, this study aims to address this gap by a quantitative
assessment of alternate routes within the CPEC road network.
3.0 Literature Review
Road networks are considered as a means of socio-economic development
because they link people and economies together (Javier Gutierrez & Paloma,
1996; Ivanova & Masarova, 2013). An improved road network not only
increases accessibility and mobility but also reduces travel costs and time
(Buurman & Rietveld, 1999; Deichmann et al., 2005). Socio-economic
development linked with road network advancements includes better access
to education (Bourdet, 1998), better health care delivery (Airey, 1992), greater
employment opportunities (Windle & Cramb, 1997), increased household
income (Jacoby, 2000), and reductions in poverty (Fan & Chan-kang, 2005).
Road development can also enhance economic development in an area by
providing basic infrastructure for investment and harnessing local and
regional economic development potential (Lampe, 2016).
Lucas & Currie (2011) have investigated the relationship between
transport opportunities and social outcomes. They claim that transport policy
makers have to be more aware of the mobility and accessibility needs of low-
income populations. Hof et al., (2011) point out that economic benefits can be
generated from transport infrastructure, but the modelling and design of such
infrastructure requires more variables than only the optimization of travel
time. Furthermore, route choices and therefore the perception of routes by
individuals are also dependent on various other variables (Prato et al., 2012;
Vreeswijk et al., 2014).

NBR 1,1
Page 17
Since CPEC’s inauguration, several studies have been conducted that analyze
the CPEC and its pros and cons for Pakistan. R. Ahmed & Mustafa, (2017),
identified the relationship between strategic level policy decisions and the
associated operational level impacts of CPEC for the agriculture sector of
Pakistan. Qureshi (2015) discussed the legal and policy standpoint of CPEC
arrangement between Pakistan and China. His study highlights the relevance
of the application of both Pakistani law and international law to CPEC.
Mahmood (2015) exhibited China’s approach towards the construction of the
road network and discussed the geostrategic implications of Chinese policies
with relevance to CPEC policy framework. Latif et al., (2017), did quantitative
analysis of an optical fibre project under CPEC and proposed a novel
technique for carrying large capacity triple play services across CPEC. Munir
et al., (2017), used mix integer linear programming technique for resource
allocation of the cement industry along the CPEC proposed route. Ali et al.,
(2018), used multi criteria decision-making (MCDM) techniques for the
assessment of energy projects under CPEC. He provided a framework for
policy makers in selecting the best set of CPEC energy projects that should be
completed in the first wave of development. Zhang et al., (2017), used the
fuzzy comprehensive evaluation method (FCEM) to highlight the
environmental and social risk factors involved in CPEC construction. They
provided a framework for the analysis of environmental and social issues
during the investment process of Chinese enterprises. As part of a World
Bank report, Derudder et al., (2018), have already used centrality measures to
identify important nodes in the CPEC network. However, their scope of CPEC
only includes the Chinese side of the network, which results in almost only
Chinese cities being considered as important due to their size and the dense
road infrastructure in China. The available literature demonstrates that there
have been many studies on CPEC but no quantitative study has been done
that analyses the CPEC road network.
According to Dunn & Wilkinson (2015), graph theory is the most suitable
tool for evaluating the characteristics of a network. In graph theory, the
transportation network can be represented in form of an abstract graph
composed of nodes and edges. This abstract graph can be used to determine
network efficiency using metrics such as shortest path and centrality
measurements (betweenness and closeness) as they demonstrate a node's
involvement in the cohesiveness of the network (Latora & Marchiori, 2007).
The shortest path not only refers to spatial distance, but also to travel time
(Yao et al., 2014). Road networks often suffer connectivity issues due to
unexpected failures and disruptions that result in closure of linking roads.
While internal disruptions (accidents and technical failures) in the network

NBR 1,1
Page 18
may have limited impact on it, external threats (earthquakes, floods, terror
attacks, etc.,) leave a greater impact on a road network (Bíl et al., 2015; Jenelius
& Mattsson, 2015). The availability of alternate routes ensures the connectivity
of the transportation system in cases of impediment (Balijepalli & Oppong,
2014; Jenelius, 2010).
Road networks can be analysed using concepts such as vulnerability and
robustness. Berdica (2002) did pioneer work to analyse the vulnerability of
transportation networks and defined vulnerability as a susceptibility to
incidents that can result in considerable reductions in road network
performance and operational degradation. This notion has been adopted by
Jenelius & Mattsson (2012) and Xu et al., (2017). The vulnerability of a
transport network can be analysed either statically or dynamically. In this
context, static network analysis investigates the consequences of disruptions
by considering travel time as a static measure (Rodríguez-Núñez & García-
Palomares, 2014). On the contrary, vulnerability is dynamically quantified by
a large variety of metrics in terms of the coverage (Jenelius & Mattsson, 2012),
accessibility (Berdica & Mattsson, 2007; Taylor et al., 2006; Taylor &
Susilawati, 2012; Yu et al., 2012), reliability (Yao et al., 2014), and connectivity
(Kurauchi et al., 2009) by considering travel time, travel distance, congestion,
traffic flow patterns, and traffic flow density as decisive parameters.
Network robustness can be considered as reciprocal to vulnerability
(Knoop et al., 2012; Rupi et al., 2015). Robustness can be defined as the
stability against different varying conditions in the networks (Stricker &
Lanza, 2014; Stricker et al., 2015). According to Sakakibara et al., (2004),
robustness of road networks can be investigated either on the basis of
network’s topological structure using graph theory or traffic flow analyses for
different types of disruptions. Like vulnerability, robustness of road networks
has also been evaluated using either static analysis (Zhou et al., 2017) or
dynamic indices by considering parameters like traffic flow, traffic density,
traffic congestion and road structure (Sullivan et al., 2010; El-Rashidy &
Grant-muller, 2014; Zhang et al., 2015; Cats, 2016).
4.0 Methodology
Road network data were gathered from two different government
organizations: National Highway Authority (National Highways Authority,
2017) and Geological Survey of Pakistan (Geological Survey of Pakistan,
2017). The road network model of CPEC represented in Figure 3 consists of
29 nodes (cities) connected by 46 edges (road links between cities). The
network representation of the transport system is an undirected graph G =
(V, E) that consists of a set of nodes V= {v1,…, v |v|} and a set of edges E= {(vi,
vj),…, (vy ,vz)} between a section of node pairs. The 29 cities selected represent

NBR 1,1
Page 19
all the main cities that lie on the road network intersections and junctions.
The cities that lie in between junction/intersection points were not
considered in this study. An exception was made for Karachi, because it is
the industrial centre of Pakistan, and therefore, we decided to display it on
the map.
Figure 3.
Pakistan road
network model in
CPEC context. The
colours of the nodes
indicate the province
in which city is
located.

NBR 1,1
Page 20
As a pass-through node, its existence has no positive or negative impact
on the subsequent analyses. The shortest path between source and sink node
is evaluated using Dijkstra’s algorithm (Oliveira & Pardalos, 2011) as it is
considered to be the preeminent algorithm for evaluating shortest paths in
the network (Saha Ray, 2013). The importance of different components in the
network was analysed using the centrality calculations. Robustness is
defined as the capacity of a network to not only remain functional but also
maintain a high level of operational performance in face of disturbances.
Therefore, the robustness of the network was evaluated using a knock-out
analysis (Reka Albert & Hawoong Jeong, 2004). In this type of analysis, the
edges of a network are removed incrementally, either selected randomly or
following a certain criterion. After each removal of an edge of a performance
measure, such as the shortest path between two nodes, a general efficiency
measure like the network diameter is checked and the intensity of
performance loss is analysed. Alternatively, the number of edge removals
required to render the network dysfunctional (e.g. disconnected) is
measured, which is often described as the property of robustness. This
understanding of robustness from a network perspective has been applied
in the research of biological systems (see, e.g., Min et al. (2011); Kitano,
(2004)), but the concept is applicable to transportation networks in a uniform
manner. In this study, the network robustness is computed by analysing how
much deviation occurs in the shortest path (both in terms of distance and
travel time) when an edge is removed from the network.
4.1 Assumptions
For travel time computations, the following assumptions are used: The network is undirected meaning that all edges can be travelled in both directions
at the same speed.
The edges have been categorized into three types: Motorways, Highways and Hilly
Road. A hilly road is defined in this study as a road that passes through a
mountainous terrain. This categorization is based on the authors’ geographical
knowledge and is in accordance with data from the National Highway Authority
(National Highways Authority, 2017).
The assumed speed of a truck on Motorways is set as 70 km/hour; Highways is 45
km/hour, and on Hilly roads it is 35 km/hour. Since there is no published data for
truck speed in Pakistan, speed values of trucks from India have been used as the
country has similar geospatial topology and similar types of trucks are in use. The
average speed on National Highway in India was reported to be 45.88 km/hour
(Balakrishnan & Sivanandan, 2015) and, maximum speed was 69 km/hour (Bains
et al., 2013). The cogency of these values was corroborated by National Logistics
Cell officials (National Logistics Cell, 2017).

NBR 1,1
Page 21
4.2 Research Limitations
The road network of CPEC is currently under construction and details
about traffic flow, traffic density, etc. are not available. Hence, in this study,
emphasis is on the geographical network rather than on traffic flows. Thus,
the analysis carried out in this study is based on static edge travel time and
distance. The details regarding nodes, edges, respective distances, road type,
and time calculations are presented in Appendix (Table A.1 and A.2).
4.3 Modelling Software
All network modelling, path calculations, centrality assessment, knock-
out analyses, robustness, and vulnerability calculations have been carried
out using self-developed code in Python with the support of the NetworkX
library.
5.0 Results and Analysis
5.1 Shortest Path Calculation
The shortest path between the entrance into Pakistan at Khunjerab Pass
(Node 1, the source node) and the final destination of the goods, the port city
of Gwadar (Node 29, the sink node), is evaluated both in terms of distance
and travel time.
Figure 4. Shortest Path
Calculation in terms
of both Distance and
Time. (The distances
between the nodes in
this figure and the
following are not to
scale. Nodes in
densely populated
areas had to be
exploded for reasons
of readability.)

NBR 1,1
Page 22
5.1.1. Shortest Distance Route
For the calculation of the shortest distance route, the weight of each edge is
set to the road distance between its nodes in kilometers. For example, the
road distance between Khunjerab pass (Node 1) and Gilgit (Node 2) is 208
km. The shortest path between source and sink in terms of distance is 2,549
kilometers (Figure 4 (a)).
5.1.2. Shortest Time Route
For shortest time route calculations, the weight of each edge is set to the
time needed to travel between its two nodes. The travel time is calculated
based on road conditions, i.e., whether the truck is traveling on Motorway,
Highway or Hilly Roads. As discussed in Section 4, the speed of a truck is
assumed 70 km/hr for Motorway, 45 km/hr for Highway and 35 km/hr for
Hilly Roads. The shortest path from source to sink in terms of travel time is
53.43 hours (Figure 5 (b)). The overall travel distance for this route is 2,618.5
kilometres.
5.1.3. Comparison with Proposed Routes
In logistics networks, shortest travel time is directly related to total cost
(Anderluh et al., 2019).
Several studies have been done on various logistics networks in order to
estimate the shortest travel time amongst different routes in context of
analysing total cost (see for example (Chen et al., 2015; Jeevan et al., 2015;
Qin et al., 2014; Rahman & Shurong, 2017; Shaikh et al., 2016). In accordance
with this, Hellinga and Fu (Hellinga & Fu, 1999) argued that drivers are more
sensitive about expected travel time and likely to have a lower tolerance for
experiencing travel times that exceed their expectations.
The network representation of the three different routes of CPEC planned
by the government of Pakistan is shown in Figure 5. It can be seen from the
network representation that there is an identical sub-route from Khunjerab
Pass (Node 1) to Haripur (Node 10). However, after Haripur, the routes
diverge along Eastern, Central, and Western alignments. The Western and
Central routes combine again at Quetta (Node 21) and follow the same path
thereafter up to Gwadar (Node 29).
It is evident from Figures 4 and 5 that neither the shortest distance nor the
shortest time route matches completely with any of the three planned routes.
However, the shortest path in terms of distance and travel time is similar.
The routes are identical from Khunjerab Pass to Islamabad (1-2-4-7-10-13)
and then from Shikarpur to Gwadar (22-24-27-29). The only difference is that
the shortest distance route diverges from Islamabad-DI Khan-DG Khan-

NBR 1,1
Page 23
Table 2.
Difference
between Routes
in terms of
distance and
time
Shikarpur (13-17-18-22) while the shortest time route diverges from
Islamabad-Pindi Bhattian-Multan-Sukkur-Shikarpur (13-16-19-23-22).
Table 2 shows a comparative analysis of the distance and travel time
calculations for Western, Central, and Eastern routes along with the shortest
distance route and shortest time route. The results show that amongst the
planned three routes the best is the Eastern route. However, travel time for
the Eastern route is 6% (i.e., an increment of 3.17 hours) more than the best
alternate route given by the shortest time route, which might result in truck
drivers selecting the route that provides the shortest travel time.
Transport infrastructure is a key factor for the economic development of any
region. Hence, for promoting equitable regional development, it is desirable
that all the regions should get their proper share in the CPEC road network.
Therefore, it is important to provide a concrete examination for the policy
makers that which of the CPEC routes will benefit which region of Pakistan
the most.
Routes
Shortest
Distance
Route
Shortest
Time
Route
Western
Route
Central
Route
Eastern
Route
Distance
(Km) 2,549
2,618.5
(+69.5)
2,727
(+178)
3,098
(+549)
2,854
(+305)
Time
(Hr)
56.83
(+3.4) 53.43
65.02
(+11.59)
69.54
(+16.11)
56.6
(+3.17)
Figure 5. CPEC
planned routes. The Western route is
composed of nodes 1-2-4-
7-10-12-11-14-17-20-21-
24-27-29, the Central
route of 1-2-4-7-10-13-17-
18-22-21-24-27-29, and
the Eastern route of 1-2-4-
7-10-13-16-19-23-25-2

NBR 1,1
Page 24
5.2 Regional Share of different routes
5.2.1 Geographical distribution across different routes
Figure 6 shows the geographical distribution, in terms of kilometres, for
alternate routes within the CPEC road network in Pakistan. The three
planned routes, the shortest distance, and the shortest travel time route will
pass through several regions of Pakistan.
The result shows that the shortest travel time route will have a regional
share distribution of 37% Punjab, 5% Sindh, 34% Balochistan, 9% KPK, and
15% of Gilgit-Baltistan in the CPEC network. Similarly, the shortest distance
route comprises of all regions with an added share of KPK. In contrast, the
Western route only consists of three regions, i.e., Balochistan, KPK and
Gilgit–Baltistan. However, the Eastern route exhibits the highest degree of
equality in regional distribution, and it is furthermore the second most
appropriate option with respect to travel time. It includes 34% Punjab, 17%
Sindh, 24% Balochistan, 13% KPK and 12% of Gilgit- Baltistan.
5.2.2 Population Distribution across different routes
As discussed earlier, the transport sector plays a significant role in socio-
economic development. Therefore, it is important to take in to account the
population that benefits from the development of transport infrastructure.
Figure 7 shows the population distribution for all the alternate routes within
the CPEC road network. The population is not uniformly distributed along
with the CPEC road network as shown in Table 3. The population data for
the analysis is based on the census report issued by the Pakistan Bureau of
Figure 6.
Regional share
of different
routes of CPEC

NBR 1,1
Page 25
Table 3.
Total and
Regional
Population
Distribution
along routes
Statistics (Pakistan Bureau of Statistics, 2018). The population has been
considered on the basis of small units (i.e., Tehsil) that are found within the
radius of 30 km of specific edge passing through it.
Route Punjab Sindh Balochistan KPK Gilgit
Baltistan
Total
Population
Shortest
Time 42,777,634 14,767,733 2,027,656 6,451,894 1,647,362 67,672,279
Shortest
Distance 21,205,209 11,234,778 2,027,656 10,098,043 1,647,362 46,213,048
Western 1,883,556 0 12,121,166 31,607,740 1,647,362 47,259,824
Central 21,205,209 4,558,428 12,715,020 10,098,043 1,647,362 50,224,062
Eastern 42,777,634 26,727,583 581,232 6,451,894 1,647,362 78,185,705
The result shows that the Eastern route will cover the highest number
(i.e., 78.1 Million) of the population across the route and Shortest Time Route
is furthermore the second most appropriate option with respect to the
population as it contains a population of 67.6 Million. However, the shortest
distance route will only cover 46.2 Million people out of 20.01 Million
population of Pakistan. Moreover, Western Route completely negates Sindh.
In contrast, out of all the five regions, Balochistan has the smallest
population share among the available routes. Gilgit-Baltistan will have the
Figure 7.
Population
Distribution for
CPEC Road
Network

NBR 1,1
Page 26
same number (i.e., 1.64 Million) as all the routes passing through this region,
as discussed in 5.1.3. Although the total population of Central route is 5.02
Million, but it exhibits the highest degree of equality in population
distribution.
5.3. Identification of Important Cities in the Network
Other than transport infrastructure, CPEC comprises of several economic
zones to be established by 2030 at regions for the CPEC road network (China
Pakistan Economic Corridor (CPEC), 2018). Therefore, it is important to
identify key cities (nodes) in the road network that can act as transport hubs
and ideal locations for special economic zones.
One of the most frequently used measures for the importance of a node
is betweenness centrality which indicates whether a node provides a
bridging role in the network. Betweenness centrality is calculated as the
fraction of shortest paths between node pairs that pass through the node of
interest and can be considered as a good measure to distinguish the most
influential node in the network (Newman, 2005).
Closeness centrality focuses on how close a node is to all the other nodes
in a network. It is calculated as the reciprocal value of the sum of the
shortest paths from the observed node to all other nodes. Like betweenness
centrality, it also describes the extent of the importance of a node in the
network.
Figure 8 shows the normalised betweenness and closeness centrality
values based on distances between nodes of the CPEC road network. The
results indicate that the highest betweenness and closeness centrality values
are for Islamabad (Node 13) and DI Khan (Node 17). From the centrality
measures, it is clear that both Islamabad (Node 13) and DI Khan (Node 17)
hold important positions in the CPEC road network of Pakistan. Not only do
they provide the highest number of shortest paths to pass through them, but
they also occupy central locations in the network. Hence, these two nodes
will be frequented more during the transportation of goods and act as main
transport hubs. The centrality calculations are limited to the CPEC road
network. The importance of different cities would alter if cross-border trade
with neighbouring countries (i.e., India, Iran, and Afghanistan) were taken
into consideration.
5.4. Network Robustness
Stricker and Lanza (Stricker & Lanza, 2014), defined robustness as the
ability of a system under impediment to remain in a predefined robustness
zone. Regarding networks, Jenelius (Jenelius, 2009) claims that the
importance of an edge can be estimated by the effect of any edge(s) removal
on the performance of the system. Thus, combining the above two notions,

NBR 1,1
Page 27
the network robustness is computed in this study by a knock-out analysis,
i.e., quantifying the impact on the shortest path (both in terms of distance
and travel time) when a single edge is or multiple edges are removed from
the network, as described in Section 4.
5.4.1. Path Robustness against Single Road Closure: Edge Knock-out
Analysis
To assess the impact of the closure of a single road on the different CPEC
routes, each edge on a route is removed and the shortest possible detour is
calculated. It is assumed that travel time and distance remain unchanged for
all other undisrupted edges when an edge is removed from the network.
To judge the robustness of the network, five distinct routes were considered:
Shortest time route (edges: 2-4, 4-7, 7-10, 10-13, 13-16, 16-19, 19-23, 23-22, 22-
24, 24-27, 27-29)
Shortest distance route (edges: 2-4, 4-7, 7-10, 10-13, 13-17, 17-18, 18-22, 22-24,
24-27, 27-29)
Western route (edges:2-4, 4-7, 7-10, 10-12, 12-11, 11-14, 14-17, 17-20, 20-21, 21-
24, 24-27, 27-29)
Central route (edges: 2-4, 4-7, 7-10, 10-13, 13-17, 17-18, 18-22, 22-21, 21-24, 24-
27, 27-29) and
Eastern route (edges: 2-4, 4-7, 7-10, 10-13, 13-16, 16-19, 19-23, 23-25, 25-26, 26-
28, 28-29)
It is important to note that the edge between Khunjerab Pass (Node1) and
Gilgit (Node 2) is not considered in the edge knock out analysis, as its
Figure 8. Normalized centrality
values as a proxy for
importance of the nodes
in the road network
model. A higher value
(red colour) denotes a
higher centrality in the
network. The node labels
correspond to the
numbering of the cities as
in Figure 3.

NBR 1,1
Page 28
removal will leave the network dysfunctional. This is due to the peculiar
nature of the CPEC road network in Pakistan, as there is no alternate path
between Khunjerab Pass (Node1) and Gilgit (Node 2). Thus, edge knock-out
analysis is carried out on all the edges between Gilgit (Node 2) to Gwadar
(Node 29).
The removal of a single edge from a specific route means that the original
route remains in operation, but only the two cities being connected by the
removed edge need to be re-connected by finding the shortest available path
between them. The resulting route distance is by definition larger (or at least
equal) than the original route distance. The impact, both in terms of distance
travelled and travel time, was evaluated and the edge knock-out distribution
analysis is presented in Figure 9.
Figure 9 (a) shows the distribution of the resulting distances of various
routes of the observed road network with respect to travel distance. The red
dot represents the original travel distance of the indicated routes. For the
shortest travel distance route as shown in Figure 9 (a), the original travel
distance is 2341 km excluding the edge travel distance between Khunjerab
Pass (Node 1) and Gilgit (Node 2). The median for the shortest distance route
after removing the edges is 2725 km, indicated by the orange line in the
middle of the box plot. The overall distribution of travel distance including
detours for any a removed edge lies within 2410-3300 km, as indicated by the
lower and upper whiskers. The box in the middle of each box plot spans from
the lower to the upper quartile values. While comparing all the routes in
Figure 9 (a), it seems that the median of the shortest travel distance route is
nearby the Western route, shortest travel time route, and Eastern route.
Figure 9.
Edge Knock-out
distribution
analysis of
different routes
of CPEC

NBR 1,1
Page 29
Similarly, Figure 9 (b) illustrates the change in travel time of different
routes. The red dot, in this case, represents the original travel time of each
route. Figure 9 (b) shows that for shortest travel time route, the original travel
time is 47.49 hours excluding the edge travel time between Khunjerab Pass
(Node 1) and Gilgit (Node 2). In case of shortest travel time, the lower and
upper whiskers lie between 50 and 75 hours. Although the median of
shortest travel time and Eastern route is approximately equal, the broader
variation in the Eastern route represents the existence of critical links within
the route that results in an increase in travel time. It also supports the
argument that other than the shortest travel time route the Eastern route is
the most viable option in all the three proposed routes as shown in Table 1.
The results indicate that the knock-out analysis as applied here can be
used to distinguish different routes in a transportation network regarding
the impact of edge removals (as a proxy for a breakdown of a transportation
connection) on the performance. The advantage of this type of study is that
it can be applied to other transportation networks as well and that the effort
to implement it is manageable. The observed performance criterion to
quantify robustness can be adapted to the given case and is not limited to
travel time or distance. However, the effects of edge removals across
different networks can only be compared to a limited extent due to the
impact of individual network properties such as network size or connectivity
on selected performance measures.
5.4.2 Network Robustness against Collective Road Closures: Multiple Edge
Knockout Analysis
The previous section investigated the impact of a single edge removal as
part of a knock-out analysis. However, under certain circumstances, more
severe events can threaten the functioning of a network. In terms of our
graph model, such an event would cause the failure of multiple items in the
network. These events could be nationwide natural disasters, such as
earthquakes, floods, or coordinated attacks. Therefore, a second type of edge
knock-out analysis was conducted, which investigated the impact of
multiple edge removal in the network as shown in Figure 10.
On the basis of definition of robustness, this study tends to evaluate by
considering the edge removals from the network. The functionality of the
system, i.e., the observed road network, can be expressed as keeping up the
ability to deliver goods in time. Therefore, we define robustness in this case
as a maximally accepted increase in travel time or distance after a certain
number of edges have been removed. For example, in case of accepting a 10%
increase, the network will be robust as long as the edge removals do not
result in the travel time increasing over 52.23 hours (which is the minimum

NBR 1,1
Page 30
travel time of 47.49 hours plus a 10% increase). Thus, during the knock-out
analysis, a network failure probability is observed. It indicates how likely it
is that the minimum travel time or distance from source to sink does not
increase above the selected threshold after the removal of a certain number
of edges.
Due to the large number of possible permutations when selecting the
order of edges to be removed, it was necessary to find an evaluation method
that allows an average over numerous different combinations of removed
edges. Consequently, this type of knock-out analysis removes a bunch of
edges in a random fashion from the network and checks after the removal if
the robustness condition as described above is still met. This process is
repeated 10,000 times and the network failure probability of the network is
determined from the empirically observed results. Again, only the network
from Gilgit (Node 2) to Gwadar (Node 29) was used. Regarding the
procedure of the random selection of edges, two variants were applied. First,
each edge in the network had a uniform probability to be chosen for removal.
In the second variant, the probability of an edge to be removed was
proportional to its edge betweenness centrality in order to simulate targeted
attacks on important connections in the network. The procedure was
Figure 10.
Network
Robustness
Measurements
NBR 1,1
Page 31
repeated for five different robustness thresholds, i.e., 1%, 5%, 10%, 25%, and
50%, in combination with the simultaneous removal of one to ten edges.
The resulting probability distribution functions are displayed in Figure 9.
It can be observed that for low threshold values, there is a steep increase in
failure frequency when removing more edges. In turn, extremely high
tolerance regarding travel time or distance increase barely has an impact on
robustness. It is noteworthy that targeted attacks, simulated by weighted
edge selection, have a clearly stronger impact on robustness (as expected),
but also travel time turns out to be more sensitive than distance. In general,
this type of analysis can be used as a risk assessment of the complete network
and as a comparative tool for possible variations of the same network.
Hence, even networks of different sizes and structures can be compared.
On the downside, the interpretation of the resulting curves needs more
attention and the observed results cannot be expressed in a single figure as,
e.g., in the previously studied single-edge knock-out analysis when
considering the average travel time or distance. Furthermore, the necessity
of a-priori selection of the threshold for a network failure influences the
outcome, so that ideally multiple thresholds must be tested.
6. Conclusion
The China Pakistan Economic Corridor (CPEC) is a framework of
regional connectivity. The novelty of this research is the quantification of
the properties of the CPEC road network, an area that has not been
explored by other researchers up to now. In this study, the performance
and robustness of the CPEC road network were investigated and questions
regarding the shortest route, the share of different regions in the network,
and the robustness of the network were answered using a model based on
graph theory and tools from the domain of network analysis.
The government of Pakistan has planned three routes as possible
options for the development of CPEC: The Eastern, Central, and Western
routes. However, the results in this study indicated the presence of another
route that is shortest in terms of travel time. This “shortest travel time
route” is the combination of Central and Eastern routes. The regional
distribution of each route within the network was analysed and the results
suggested that the shortest travel time route does not contain the desirable
share of regions due to the underrepresentation of Sindh, which is the
second largest province, and the overrepresentation of Punjab. On the
other hand, the Eastern route exhibited the most equitable share either with
respect to infrastructure (i.e., 34% Punjab, 17% Sindh, 24% Balochistan, 13%
KPK, and 12% of Gilgit-Baltistan) or by population distribution (i.e., 78.1
Million) for all the provinces in the network.

NBR 1,1
Page 32
Moreover, the significance of various cities in the CPEC road network was
evaluated and it was found that both Islamabad and DI Khan can act as
transport hubs because of their high centrality values. According to
Pakistan’s Ministry of Planning, Development and Reform, an important
aspect of CPEC is the development of Special Economic Zones (SEZ). Hence,
owing to their high centrality values, both Islamabad and DI-Khan have the
potential to become logistics centres for warehousing activities in Pakistan.
Moreover, Islamabad’s central location in the network is further
strengthened by its presence on the shortest travel time route. The results
also indicate that apart from the source Khunjerab Pass and the sink Gwadar,
the most important node that causes the network to become dysfunctional is
Gilgit.
Furthermore, the robustness of the network was determined using a
knock-out analysis for single as well as multiple edges (link roads between
cities). The single edge removal analysis also supports the argument that
other than the shortest travel time route the Eastern route is the most viable
option in all the three proposed routes. Moreover, to estimate the overall
performance of the CPEC road network, multiple edge knock-out analysis
was performed. This was done to analyse the sustainability of the network
under severe conditions (for instance, natural disasters) where multiple links
(roads) can be broken. It was established that the CPEC road network is
robust and can maintain good operational performance.
The strength of the study is that it provides a tool for analysis of economic
corridors (like CPEC) which are at the inception phase with limited
availability of data. While the research presented in this paper focused on
providing a decision-making toolbox for the policy makers of Pakistan (in
context of CPEC road network in Pakistan), this research can be used as a
template for similar analysis in other regions of the world using publically
available data such as government reports, google maps, etc. Furthermore,
additional aspects regarding road flow capacity, demographic changes, and
multi-modal transport can also be integrated with our calculations for more
far reaching insight into benefits and risks of economic corridor-based road
networks.
Author Contributions: R. A. Liaqait: Literature Search and Review, Data Collection, Network Modelling and
Manuscript Writing.
M. H. Agha: Content Planning, Literature Search and Review, Data Collection,
Manuscript Writing and Editing.
T. Becker: Network and Robustness Analysis, Manuscript Writing and Editing.

NBR 1,1
Page 33
References
Ahmed, R., & Mustafa, U. (2014). Impact of CPEC projects on
agriculture sector of Pakistan: Infrastructure and agricultural output
linkages. Pakistan Institute of Development Economics (PIDE):
Islamabad, Pakistan. 511–528.
uddin Ahmed, S., Ali, A., Kumar, D., Malik, M. Z., & Memon, A. H.
(2019). China Pakistan Economic Corridor and Pakistan’s energy
security: A meta-analytic review. Energy policy, 127, 147-154.
https://doi.org/10.1016/j.enpol.2018.12.003
Airey, T. (1992). The impact of road construction on the spatial
characteristics of hospital utilization in the Meru district of Kenya. Social
Science and Medicine, 34(10), 1135–1146. https://doi.org/10.1016/0277-
9536(92)90287-Z
Ali, Y., Rasheed, Z., Muhammad, N., & Yousaf, S. (2018). Energy
optimization in the wake of China Pakistan Economic Corridor (CPEC).
Journal of Control and Decision, 5(2), 129–147.
https://doi.org/10.1080/23307706.2017.1353929
Anderluh, A., Larsen, R., Hemmelmayr, V. C., & Nolz, P. C. (2019).
Impact of travel time uncertainties on the solution cost of a two-echelon
vehicle routing problem with synchronization. Flexible Services and
Manufacturing Journal, 1-23. https://doi.org/10.1007/s10696-019-09351-w
Asian Development Bank. (2016). Pakistan Enabling Economic
Corridors through Sustainable Transport Sector.
Bains, M. S., Bhardwaj, A., Arkatkar, S., & Velmurugan, S. (2013). Effect
of Speed Limit Compliance on Roadway Capacity of Indian
Expressways. Procedia - Social and Behavioural Sciences, 104, 458–467.
https://doi.org/10.1016/j.sbspro.2013.11.139
Balakrishnan, S., & Sivanandan, R. (2015). Influence of lane and vehicle
subclass on free-flow speeds for urban roads in heterogeneous traffic.
Transportation Research Procedia, 10, 166-175.
https://doi.org/10.1016/j.trpro.2015.09.066
Balijepalli, C., & Oppong, O. (2014). Measuring vulnerability of road
network considering the extent of serviceability of critical road links in
urban areas. Journal of Transport Geography, 39, 145–155.
https://doi.org/10.1016/j.jtrangeo.2014.06.025
Bengali, K., Baloch, I., Khan, B., Tareen, M., Hafeez, M., & Yousaf, S.
(2015), "China Pakistan Economic Corridor? The Route Controversy.",
available at: http://www.cmpru.gob.pk/reports/CPEC.pdf (accessed 18
October 2018)

NBR 1,1
Page 34
Berdica, K. (2002). An introduction to road vulnerability: What has been
done, is done and should be done. Transport Policy, 9(2), 117–127.
https://doi.org/10.1016/S0967-070X(02)00011-2
Berdica, K., & Mattsson, L. (2007). Vulnerability: A Model-Based Case
Study of the Road Network in Stockholm. Critical Infrastructure, 81–106.
https://doi.org/https://doi.org/10.1007/978-3-540-68056-7_5
Bíl, M., Vodák, R., Kubeček, J., Bílová, M., & Sedoník, J. (2015).
Evaluating road network damage caused by natural disasters in the
Czech Republic between 1997 and 2010. Transportation Research Part A:
Policy and Practice, 80, 90–103. https://doi.org/10.1016/j.tra.2015.07.006
Bourdet, Y. (1998). The Dynamics of Regional Disparities in Laos: The
Poor and the Rich. Asian Survey, 38(7), 629–652.
https://doi.org/10.2307/2645753
Buurman, J., & Rietveld, P. (1999). Transport Infrastructure and
Industrial Location: The Case of Thailand. Review of Urban and Regional
Development Studies, 11(1), 45–62. https://doi.org/10.1111/1467-
940X.00004
Cats, O. (2016). The robustness value of public transport development
plans. Journal of Transport Geography, 51, 236–246.
https://doi.org/10.1016/j.jtrangeo.2016.01.011
Chen, X. Z., Lu, Q. C., Peng, Z. R., & Ash, J. E. (2015). Analysis of
transportation network vulnerability under flooding disasters.
Transportation Research Record, 2532, 37–44. https://doi.org/10.3141/2532-
05
Cheng, L. K. (2016). Three questions on China’s “Belt and Road
Initiative”. China Economic Review, 40, 309–313.
https://doi.org/10.1016/j.chieco.2016.07.008
China Pakistan Economic Corridor (CPEC). (2017). CPEC Infrastructure
Projects. Retrieved from http://cpec.gov.pk/infrastructure
ChinaPakistan Economic Corridor (CPEC) (2018). CPEC Special
Economic Zones (SEZs). Retrieved from http://cpec.gov.pk/special-
economic-zones-projects
Deichmann, U., Kaiser, K., Lall, S. V., & Shalizi, Z. (2005).
Agglomeration, transport, and regional development in Indonesia. The
World Bank.
Derudder, B., & Kunaka, C. (2018). Connectivity Along Overland
Corridors of the Belt and Road Initiative, Tech. rep., The World Bank.
Dunn, S., & Wilkinson, S. M. (2015). Increasing the resilience of air
traffic networks using a network graph theory approach. Transportation

NBR 1,1
Page 35
Research Part E: Logistics and Transportation Review, 90, 39–50.
https://doi.org/10.1016/j.tre.2015.09.011
El-Rashidy, R. A., & Grant-muller, S. M. (2014). An assessment method
for highway network vulnerability. Journal of Transport Geography, 34,
34–43. https://doi.org/10.1016/j.jtrangeo.2013.10.017
Fan, S., & Chan-kang, C. (2005). Road Development, Economic Growth,
and Poverty Reduction in China.
Geological Survey of Pakistan. (2017). http://www.gsp.gov.pk/ (accessed
9 December 2017)
Hellinga, B., & Fu, L. (1999). Route selection considering travel time
variability. In 6th World Congress on Intelligent Transport Systems,
Toronto, Ontario.
Hof, B., Heyma, A., & van der Hoorn, T. (2012). Comparing the
performance of models for wider economic benefits of transport
infrastructure: results of a Dutch case study. Transportation, 39(6), 1241-
1258. https://doi.org/10.1007/s11116-011-9383-4
Huang, Y. (2016). Understanding China’s Belt & Road Initiative:
Motivation, framework and assessment. China Economic Review, 40, 314–
321. https://doi.org/10.1016/j.chieco.2016.07.007
Ivanova, E., & Masarova, J. (2013). Importance of Road Infrastructure in
the Economic Development and Competitiveness. Economics and
Management, 18(2), 263–274.
https://doi.org/http://dx.doi.org/10.5755/j01.em.18.2.4253
Jacoby, H. G. (2000). Access to markets and the benefits of rural roads.
Economic Journal, 110(465), 713–737. https://doi.org/10.1111/1468-
0297.00562
Jato-Espino, D., Castillo-Lopez, E., Rodriguez-Hernandez, J., &
Canteras-Jordana, J. C. (2014). A review of application of multi-criteria
decision-making methods in construction. Automation in Construction,
45, 151–162. https://doi.org/10.1016/j.autcon.2014.05.013
Javier Gutierrez and Paloma. (1996). Accessibility in the European
Union: The impact of the trans-European road network. Journal of
Transport Geography, 4(1), 15–25. https://doi.org/10.1016/0966-
6923(95)00042-9
Jeevan, J., Chen, S. L., & Lee, E. S. (2015). The challenges of Malaysian
dry ports development. Asian Journal of Shipping and Logistics, 31(1), 109–
134. https://doi.org/10.1016/j.ajsl.2015.03.005
Jenelius, Erik; Mattsson, L. G. (2015). Road network vulnerability
analysis: Conceptualization, implementation and application. Computers,

NBR 1,1
Page 36
Environment and Urban Systems, 49, 136–147.
https://doi.org/10.1016/j.compenvurbsys.2014.02.003
Jenelius, E. (2009). Network structure and travel patterns: explaining the
geographical disparities of road network vulnerability. Journal of
Transport Geography, 17(3), 234–244.
https://doi.org/10.1016/j.jtrangeo.2008.06.002
Jenelius, E. (2010). Redundancy importance: Links as rerouting
alternatives during road network disruptions. Procedia Engineering, 3,
129–137. https://doi.org/10.1016/j.proeng.2010.07.013
Jenelius, E., & Mattsson, L. G. (2012). Road network vulnerability
analysis of area-covering disruptions: A grid-based approach with case
study. Transportation Research Part A: Policy and Practice, 46(5), 746–760.
https://doi.org/10.1016/j.tra.2012.02.003
Jeremy Garlick (2018) Deconstructing the China–Pakistan Economic
Corridor:
Pipe Dreams Versus Geopolitical Realities, Journal of Contemporary
China, 27:112, 519-533. https://doi.org/10.1080/10670564.2018.1433483
Kitano, H. (2004). Biological robustness. Nature Reviews Genetics.
https://doi.org/10.1038/nrg1471
Knoop, V. L., Snelder, M., van Zuylen, H. J., & Hoogendoorn, S. P.
(2012). Link-level vulnerability indicators for real-world networks.
Transportation Research Part A: Policy and Practice, 46(5), 843–854.
https://doi.org/10.1016/j.tra.2012.02.004
Kurauchi, F., Uno, N., Sumalee, A., & Seto, Y. (2009). Network
Evaluation Based on Connectivity Vulnerability. Transportation and
Traffic Theory 2009: Golden Jubilee, 637–649. https://doi.org/10.1007/978-1-
4419-0820-9_31
Lampe, K. J. (2016). Rural Development in Mountainous Areas: Why
Progress Is So Difficult. In Mountain Research and Development, Workshop
on the Stability and Instability of Mountain Ecosystems. 3,14–19.
International Mountain Society. available at:
http://www.jstor.org/stable/3672993
Latif, Z., Jianqiu, Z., Ullah, R., Pathan, Z. H., & Latif, S. (2017).
Application of Optical Frequency Comb in High-Capacity Long
Distance Optical Communication for China-Pakistan Economic
Corridor. Journal of Optical Communications, 38(3), 331–340.
https://doi.org/10.1515/joc-2017-0014
Latora, V., & Marchiori, M. (2007). A measure of centrality based on
network efficiency. New Journal of Physics, 9, 188.
https://doi.org/10.1088/1367-2630/9/6/188

NBR 1,1
Page 37
Lucas, K., & Currie, G. (2011). Developing socially inclusive
transportation policy: Transferring the United Kingdom policy
approach to the State of Victoria? Transportation, 39(1), 151–173.
https://doi.org/10.1007/s11116-011-9324-2
Mahmood, M. (2015). China – Pakistan Economic Corridor - The Geo
Strategic Dimension and Challenges.
Min, Y., Jin, X., Chen, M., Pan, Z., Ge, Y., & Chang, J. (2011). Pathway
knockout and redundancy in metabolic networks. Journal of Theoretical
Biology, 270(1), 63–69. https://doi.org/10.1016/j.jtbi.2010.11.012
Ministry of Planning, Development & Reform. (2017). Retrieved from
http://www.pc.gov.pk/
Munir, M., Khalid, R., & Latif, M. (2017). Route optimization for the
cement industry under the CPEC initiative. Business Review, 12(2), 65–83.
Available at: http://e-space.mmu.ac.uk/621182/http://e-space.mmu.ac.uk
Naseem, N. (2017). Geopolitical Value of Gwader for the Region (Mainly
for Pakistan, China and the Region). South Asian Studies (1026-678X),
29(2), 519–530. Available at:
http://search.ebscohost.com/login.aspx?direct=true&db=a9h&AN=10030
6235
National Highways Authority. (2017), http://nha.gov.pk/en/ (accessed 19
November 2017)
National Logistics Cell. (2017), http://www.nlc.com.pk/ (accessed 27
December 2017)
Newman, M. E. J. (2005). A measure of betweenness centrality based on
random walks. Social Networks, 27(1), 39–54.
https://doi.org/10.1016/j.socnet.2004.11.009
Nistor, F., & Popa, C. C. (2016). The Role of Transport in Economic
Development. 534. Naval Academy Press. Available at:
https://mpra.ub.uni-muenchen.de/70586/
Oliveira, C. A. S., & Pardalos, P. M. (2011). Mathematical Aspects of
Network Routing Optimization (53). Springer New York.
https://doi.org/10.1007/978-1-4614-0311-1
Pakistan Bureau of Statistics. (2018). Retrieved from
http://www.pbs.gov.pk/
Peer M (2015) China-Pakistan Economic Corridor: Issue of western,
eastern
routes raised again. URL https://tribune.com.pk/story/937045/china-
pakistaneconomic-corridor-issue-of-western-eastern-routes-raised-again

NBR 1,1
Page 38
Prato, C. G., & Bekhor, S. (2012). Latent variables and route choice
behaviour. Transportation, 39(2), 299–319. https://doi.org/10.1007/s11116-
011-9344-y
Qin, J., He, Y., & Ni, L. (2014). Quantitative efficiency evaluation method
for transportation networks. Sustainability, 6(12), 8364–8378.
https://doi.org/10.3390/su6128364
Qureshi, A. H. (2015). China/Pakistan Economic Corridor: A Critical
National and International Law Policy Based Perspective. Chinese
Journal of International Law, 14(4), 777–799.
https://doi.org/10.1093/chinesejil/jmv045
Rafiq, A. (2017). "China-Pakistan Economic Corridor (CPEC), Barriers and
Impact." available at: https://www.usip.org/sites/default/files/2017-
10/pw135-the-china-pakistan-economic-corridor.pdf (accessed 21
November 2018)
Rahman, S. U., & Shurong, Z. (2017). Analysis of Chinese Economic and
National Security Interests in China-Pakistan Economic Corridor
(CPEC) under the Framework of One Belt One Road (OBOR) Initiative.
Arts and Social Sciences Journal, 8(4), 1-7. https://doi.org/10.4172/2151-
6200.1000284
Reka Albert, Hawoong jeong, A.-L. B. (2004). Error and attack tolerance
of complex networks. Physica A: Statistical Mechanics and Its Applications,
340(1–3), 388–394. https://doi.org/10.1016/j.physa.2004.04.031
Rodríguez-Núñez, E., & García-Palomares, J. C. (2014). Measuring the
vulnerability of public transport networks. Journal of Transport
Geography, 35, 50–63. https://doi.org/10.1016/j.jtrangeo.2014.01.008
Rupi, F., Angelini, S., Bernardi, S., Danesi, A., & Rossi, G. (2015).
Ranking links in a road transport network: A practical method for the
calculation of link importance. Transportation Research Procedia, 5, 221–
232. https://doi.org/10.1016/j.trpro.2015.01.003
Saha Ray, S. (2013). Algorithms on Graphs. In Graph Theory with
Algorithms and its Applications, 49–93. Springer India.
https://doi.org/10.1007/978-81-322-0750-4_5
Sakakibara, H., Kajitani, Y., & Okada, N. (2004). Road Network
Robustness for Avoiding Functional Isolation in Disasters. Journal of
Transportation Engineering, 130(5), 560–567.
https://doi.org/https://doi.org/10.1061/(ASCE)0733-947X(2004)130:5(560)
Shaikh, F., Ji, Q., & Fan, Y. (2016b). Prospects of Pakistan-China Energy
and Economic Corridor. Renewable and Sustainable Energy Reviews, 59,
253–263. https://doi.org/10.1016/j.rser.2015.12.361

NBR 1,1
Page 39
Sheu, J. B., & Kundu, T. (2017). Forecasting time-varying logistics
distribution flows in the One Belt-One Road strategic context.
Transportation Research Part E: Logistics and Transportation Review, 117, 5–
22. https://doi.org/10.1016/j.tre.2017.03.003
Stricker, N., & Lanza, G. (2014). The concept of robustness in production
systems and its correlation to disturbances. Procedia CIRP, 19(C), 87–92.
https://doi.org/10.1016/j.procir.2014.04.078
Stricker, Nicole, Pfeiffer, A., Moser, E., Kádár, B., Lanza, G., &
Monostori, L. (2015). Supporting multi-level and robust production
planning and execution. CIRP Annals - Manufacturing Technology, 64(1),
415–418. https://doi.org/10.1016/j.cirp.2015.04.115
Sullivan, J. L., Novak, D. C., Aultman-Hall, L., & Scott, D. M. (2010).
Identifying critical road segments and measuring system-wide
robustness in transportation networks with isolating links: A link-based
capacity-reduction approach. Transportation Research Part A: Policy and
Practice, 44(5), 323–336. https://doi.org/10.1016/j.tra.2010.02.003
Taylor, M. A., Sekhar, S. V., & D'Este, G. M. (2006). Application of
accessibility-based methods for vulnerability analysis of strategic road
networks. Networks and Spatial Economics, 6(3-4), 267-291.
https://doi.org/10.1007/s11067-006-9284-9
Taylor, M. A. (2012). Remoteness and accessibility in the vulnerability
analysis of regional road networks. Transportation research part A: policy
and practice, 46(5), 761-771. https://doi.org/10.1016/j.tra.2012.02.008
Tian, W., Yu, M., & Zhang, F. (2016). The exceptional performance of
Chinese outward direct investment firms. China Economic Journal, 9(2),
209-219. https://doi.org/10.1080/17538963.2016.1172783
Vreeswijk, J., Thomas, T., Berkum, E. Van, & Arem, B. Van. (2014).
Perception bias in route choice. Transportation, 41(6), 1305–1321.
https://doi.org/10.1007/s11116-014-9552-3
Windle, J., & Cramb, R. A. (1997). Remoteness and rural development:
economic impacts of rural roads on upland farmers in, 38(1), 37–53.
Xu, L. jun, Fan, X. chao, Wang, W. qing, Xu, L., Duan, Y. lian, & Shi, R.
jing. (2017). Renewable and sustainable energy of Xinjiang and
development strategy of node areas in the “Silk Road Economic Belt.”
Renewable and Sustainable Energy Reviews, 79(March 2016), 274–285.
https://doi.org/10.1016/j.rser.2017.05.031
Yang, D., Pan, K., & Wang, S. (2017). On service network improvement
for shipping lines under the one belt one road initiative of China.
Transportation Research Part E: Logistics and Transportation Review.
https://doi.org/https://doi.org/10.1016/j.tre.2017.07.003
NBR 1,1
Page 40
Yao, B., Hu, P., Lu, X., Gao, J., & Zhang, M. (2014). Transit network
design based on travel time reliability. Transportation Research Part C:
Emerging Technologies, 43, 233–248.
https://doi.org/10.1016/j.trc.2013.12.005
Yu, B., Lam, W. H. K., Sumalee, A., Li, Q., & Li, Z. (2012). Vulnerability
analysis for large-scale and congested road networks with demand
uncertainty. Transportation Research Part A, 46(3), 501–516.
https://doi.org/10.1016/j.tra.2011.11.018
Zhang, R., Andam, F., & Shi, G. (2017). Environmental and social risk
evaluation of overseas investment under the China-Pakistan Economic
Corridor. Environmental Monitoring and Assessment, 189(6).
https://doi.org/10.1007/s10661-017-5967-6
Zhang, X., Miller-Hooks, E., & Denny, K. (2015). Assessing the role of
network topology in transportation network resilience. Journal of
Transport Geography, 46, 35–45.
https://doi.org/10.1016/j.jtrangeo.2015.05.006
Zheng, L., & Liu, Z. (2015). Spatial pattern of Chinese outward direct
investment in the Belt and Road Initiative area. Progress in Geography,
34(5), 563–570. https://doi.org/10.11820/dlkxjz.2015.05.004
Zhou, Y., Sheu, J. B., & Wang, J. (2017). Robustness Assessment of Urban
Road Network with Consideration of Multiple Hazard Events. Risk
Analysis, (1). https://doi.org/10.1111/risa.12802

NBR 1,1
Page 41
Appendix
Table A.1:
Details of all
links between
the nodes
Node to
node km % share
Road
Type
%
share
Road
Type
%
share
Road
Type
%
share
Road
Type
%
share
Road
Typehours
1 1 to 2 2 08 0 % 0 % 0% 0% 100% Hilly Road 5.94
2 2 to 4 133 0 % 0 % 0% 0% 100% Hilly Road 3 .8
3 2 to 5 549 0 % 0 % 0% 61% Hilly Road 39% Hilly Road 15.69
4 3 to 6 84 0 % 0 % 0% 100% Hilly Road 0% 2.4
5 3 to 7 2 44 0 % 0 % 0% 100% Hilly Road 0% 6.97
6 4 to 3 2 85 0 % 0 % 0% 80% Hilly Road 20% Hilly Road 8 .14
7 4 to 7 2 33 0 % 0 % 0% 79% Hilly Road 21% Hilly Road 6 .66
8 5 to 6 165 0 % 0 % 0% 100% Hilly Road 0% 4.71
9 5 to 8 154 0 % 0 % 0% 100% Hilly Road 0% 4.4
10 6 to 9 44 0 % 0 % 0% 100% Hilly Road 0% 1.26
11 7 to 10 63 0 % 0 % 0% 100% Hilly Road 0% 1.8
12 8 to 9 66 0 % 0 % 0% 100% Hilly Road 0% 1.89
13 8 to 11 27 0 % 0 % 0% 100% Hilly Road 0% 0.77
14 9 to 12 88 0 % 0 % 0% 100% Hilly Road 0% 2.51
15 10 to 12 125 0 % 0 % 0% 100% Hilly Road 0% 3.57
16 10 to 13 103 40% Highway 0 % 0% 60% Highway 0% 2.29
17 11 to 12 30 0 % 0 % 0% 100% Moto rway 0% 0.43
18 11 to 14 31 0 % 0 % 0% 100% Moto rway 0% 0.44
19 12 to 13 140 21.50%Moto rw
ay0 % 0% # # # Moto rway 0% 2
20 12 to 14 61 0 % 0 % 0% 100% Highway 0% 1.36
21 13 to 15 2 93 100% Highway 0 % 0% 0% 0% 6.51
22 13 to 16 2 66 100%Moto rw
ay0 % 0% 0% 0% 3.8
23 13 to 17 3 66 75.40%Moto rw
ay0 % 0% # # # Moto rway 0% 5.23
24 14 to 17 2 97 0 % 0 % 0% 100% Highway 0% 6.6
25 15 to 16 129 100%Moto rw
ay0 % 0% 0% 0% 1.84
26 15 to 19 3 33 100%Moto rw
ay0 % 0% 0% 0% 4.76
27 16 to 19 2 88 100%Moto rw
ay0 % 0% 0% 0% 4.11
28 17 to 18 217 70 .50% Highway 0 % 0% # # # Highway 0% 4.82
29 18 to 20 3 47 25.90% Highway 0 % 74 .10% Highway 0% 0% 7.78
30 19 to 18 100 100%Moto rw
ay0 % 0% 0% 0% 1.43
31 20 to 17 2 47 0 % 0 % 3 9% Highway 61% Highway 0% 5.49
32 21 to 20 189 0 % 0 % 100% Highway 0% 0% 4.2
33 21 to 22 3 68 0 % 33% Highway 67% Highway 0% 0% 8.18
34 21 to 24 30 1 0 % 0 % 100% Highway 0% 0% 6.69
35 22 to 18 3 36 50% Highway 50% Highway 0% 0% 0% 7.47
36 23 to 19 3 87 85.80%Moto rw
ay14 .20%Moto rway 0% 0% 0% 5.53
37 23 to 22 47.5 0 % 100%Moto rway 0% 0% 0% 0.68
38 23 to 25 2 96 0 % 100%Moto rway 0% 0% 0% 4.23
39 24 to 22 120 0 % 60% Moto rway 4 0% Moto rway 0% 0% 1.71
40 25 to 22 3 46 0 % 100% Highway 0% 0% 0% 7.69
41 26 to 25 131 0 % 100%Moto rway 0% 0% 0% 1.87
42 27 to 24 585 0 % 0 % 100% Highway 0% 0% 13
43 27 to 28 121 0 % 0 % 100% Hilly Road 0% 0% 3.46
44 28 to 26 6 23 0 % 4 % Highway 9 6% Highway 0% 0% 13 .84
45 29 to 27 185 0 % 0 % 100% Highway 0% 0% 4.11
46 29 to 28 123 0 % 0 % 100% Highway 0% 0% 2.73
KP KGilg it
B a lt is t anTime
S r.
no .Links
D is t an
c eP unjab S ind h B alo c his t an

NBR 1,1
Page 42
Table A.2:
Nodes and their
elevations
Node
no. Cities
Elevation
(Meters)
1 Khunjerab
pass 4,693
2 Gilgit 1,500
3 Shangla 1,524
4 Chillas 1,146
5 Upper Dir 1,841
6 Khewazakhela 1,138
7 Mansehra 1,088
8 Takhat Bhai 402
9 Barikot 800
10 Haripur 520
11 Charsada 276
12 Mardan 286
13 Islamabad 620
14 Peshawar 359
15 Lahore 217
16 Pindi Bhattian 184
17 DI khan 165
18 DG khan 1,800
19 Multan 1,22
20 Qilla Saifullah 844
21 Quetta 1,680
22 Shikarpur 13
23 Sukkur 67
24 Khuzdar 1,237
25 Hyderabad 13
26 Karachi 8
27 Turbat 129
28 Pasni 10
29 Gwadar 8

NBR 1,1
Page 43
About Author
Raja Awais Liaqat Mr. Raja Awais Liaqait is the MS student of Engineering Management at Capital University
of Science and Technology, Islamabad. He has his Bachelors in Mechanical Engineering from
Muhammad Ali Jinnah University, Islamabad campus. His research area focuses on supply
chain optimization and logistics management of complex networks.
Mujtaba Hassan Agha Dr. Mujtaba Hassan Agha is Professor and Head of Department Operations and Supply
Chain at NUST Business School. He did his PhD in Industrial Engineering from Institute
National Polytechnique Toulouse (INPT), University of Toulouse (France). His teaching and
research areas of interest are Production & Logistics Systems, Supply Chain Management
and Energy Management.
Till Becker Dr. Till Becker is Professor of Information Systems at the University of Applied Sciences
Emden/Leer in Germany. He obtained his PhD in International Logistics from Jacobs
University in Bremen, Germany. His research focuses on complex networks in
manufacturing and logistics and on the ongoing digitalization in industry.
The Corresponding Author Professor Mujtaba Hassan Agha can be contacted at: [email protected]