Embed Size (px)
Citation preview


China Pakistan Economic Corridor (Western Route)
Baseline Study of Socioeconomic Situation of Zone of Influence
Authors: Dr.Shahid Habib, Fazle Rabi and Farkhanda Jabeen
i
EXECUTIVE SUMMARY
The China-Pakistan Economic Corridor (CPEC) has great potential to increase regional and
economic integration between the two countries. More importantly, the corridor is expected to
improve the socioeconomic condition of the Zone of Influence (ZOI)1 districts of the corridor. This
study focuses on the socioeconomic condition of the districts falling across the Western route of
the corridor. The Zone of Influence districts taken for the study include Gwadar, Turbat, Khuzdar,
Kalat, Quetta, Qilla Saifullah, Zhob, Dera Ismail Khan, Mianwali, and Attock. The socioeconomic
variables included in the study are education, health, industry-wise employment, and assets. The
study quantitatively compares the socioeconomic condition of the ZOI districts using descriptive
statistics. The data has been taken from Pakistan Social and Living Standard Measurement (PSLM)
for the year 2012-13.
This study finds significant variation in primary and middle school enrollment across the districts.
The average distance to middle schools is greater in rural districts of Balochistan as compared to
the rural districts of Punjab and KPK. This shows that average distance to schools could be one of
the primary reasons behind low enrollment in underprivileged areas of the ZOI districts.
Our research highlights that accessibility of households to health units and other health facilities
in terms of utilization of health units and Lady Health Worker Services (LHWS). According to the
study, utilization of health units is higher in the rural districts of Balochistan when compared to
rural districts of Punjab and Khyber Pakhtunkhwa. On the other hand, utilization of LHWS is
higher in the rural districts of Punjab and Khyber Pakhtunkhwa as compared to that of Balochistan.
This study also highlights five major sectors in terms of employment across the ZOI districts:
agriculture, forestry, and fishing; retail trade; construction; manufacturing; and transportation and
storage, in order of their employment share. Further classifying the agriculture sectors into sub-
sectors/industries, the study finds that almost the entire employment share in the agriculture sector
belongs to crop and animal production industry across the ZOI districts. Similarly the wearing
apparel industry comprises the highest share of manufacturing sector employment across the ZOI
1 Zone of Influence (ZOI) districts refers to the districts touched by the road network/highway.
ii
districts while the civil engineering industry comprises the highest share of employment in the
construction sector.
Finally, the study compares the ZOI districts in terms of the average market value of capital assets
held by households. The results show that Quetta, Mianwali, and Attock have the highest average
value of household assets on average while Gwadar, Turbat, and Qilla Saifullah have the lowest.
The current socioeconomic conditions highlighted by the study can be used as a benchmark to
analyze long term impact assessment of the socioeconomic conditions in these districts after the
completion of the corridor.
iii
TABLE OF CONTENTS
Executive Summary ......................................................................................................................... i
Section I: Introduction .................................................................................................................... 1
1.1. Background of Study ............................................................................................................ 1
1.2. Purpose of Study .................................................................................................................. 3
1.3. Organization of the Report ................................................................................................... 3
Section II: Data and Methodology .................................................................................................. 4
2.1. Data ...................................................................................................................................... 4
2.2. Methodology ........................................................................................................................ 4
Section III: State of Socio-economic Indicators ............................................................................. 5
3.1. Education .............................................................................................................................. 5
3.1.1. Primary School Enrollment ........................................................................................... 5
3.1.2. Middle School Enrollment............................................................................................. 6
3.1.3. Average Distance to Primary and Middle Schools (in Kilometer) ................................ 6
3.2. Health ................................................................................................................................... 7
3.2.1. Households’ Utilization of Lady Health Worker Services ............................................ 8
3.2.2. Households’ Visit to Health Units ................................................................................. 9
3.2.3. Average Distance to Health Units (in Kilometer) ......................................................... 9
3.3. Sector-wise Employment ................................................................................................... 11
3.3.1. Sector-wise Employment (in all ZOI Districts) ...................................................... 11
3.3.2. District-wise Distribution of Employed Persons for Major Sectors ....................... 12
3.3.3. District-wise Distribution of Employed Persons for Sub-Sectors/Industries ......... 12
3.4. Household Asset Possession .......................................................................................... 15
Section IV: Conclusion and Policy Recommendations ................................................................ 17
iv
LIST OF FIGURES
Figure 1.1. CPEC Routes .............................................................................................................................. 2
Figure 3.1. Primary School Enrollment ........................................................................................................ 5
Figure 3.2. Middle School Enrollment .......................................................................................................... 6
Figure 3.3. Distance to Primary and Middle Schools (km)........................................................................... 7
Figure 3.4. Percentage of Households utilizing Lady Health Worker (LHW) Service................................. 8
Figure 3.5. Percentage of Households visiting Health Units ........................................................................ 9
Figure 3.6. Distance to Health Units (km) .................................................................................................. 10
Figure 3.7. Industry wise share of Employed persons across ZOI Districts ............................................... 11
Figure 3.8. District-wise Percentage Distribution of Employed Persons .................................................... 12
Figure 3.9. District-wise Percentage Distribution of Employed Persons: Sub-sectors of Agriculture ....... 13
Figure 3.10. District-wise Percentage Distribution of Employed Persons: Sub-sectors of Manufacturing 14
Figure 3.11. District-wise Percentage Distribution of Employed Persons: Sub-sectors of Construction ... 14
Figure 3.12. District-wise Percentage Distribution of Employed Persons: Sub-sectors of Wholesale and
Retail Trade ................................................................................................................................................. 15
Figure 3.13. Average Asset worth of Households (PKR) ........................................................................... 16
1
SECTION I: INTRODUCTION
1.1. Background of Study
The construction of corridors (network of roads) helps in improving the trade and economic
connectivity of a region. It enhances regional economic and trade cooperation which contributes
towards regional peace and stability. Several economic benefits can be derived from investments
in economic corridors including growth in economic output, generational employment, and
improvement in household welfare. Given the important role of corridors in economic and
geographical integration, China and Pakistan signed the China-Pakistan Economic Corridor
(CPEC) agreement which includes a $46 billion investment in Pakistan out of which $5.90 billion
would be spent solely on the construction of a road from Gwadar in Pakistan to Kashgar in the
Western Chinese province of Xinjiang2.
Currently, China mainly relies on the shipping route of the Strait of Malacca to reach European
markets. This route is 9912 miles long and takes around 45 days to reach Europe via the Middle
East, costing almost $18 million on a daily basis. Through the CPEC, the distance would be
reduced by up to 3626 miles and it would take China only 10 days for its shipments to reach their
destination thus saving almost $2 billion every year3. In Pakistan’s case the corridor will not only
provide access to central Asian countries and Europe but will also re-route more than $2 trillion of
Chinese exports -- thus making Pakistan a transit economy. Apart from this, the functioning of
Gwadar port will boost business activities in the region4. This will potentially improve the
socioeconomic condition of the region particularly in the marginalized areas of both countries.
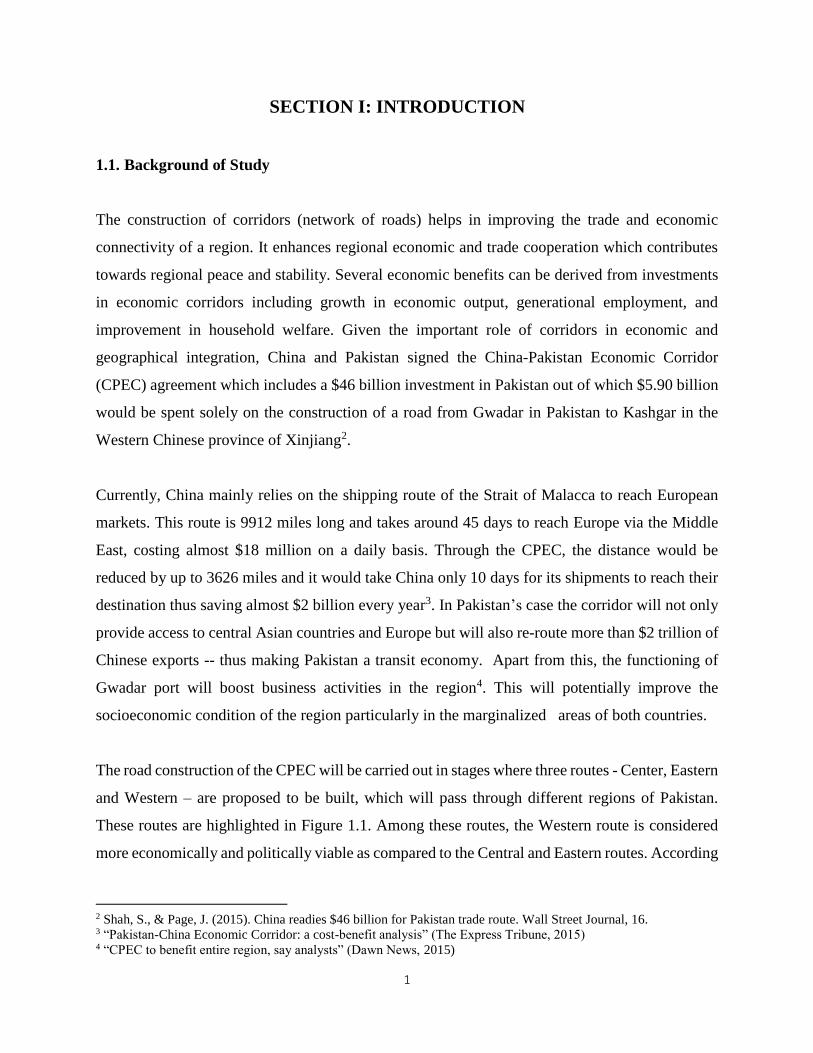
The road construction of the CPEC will be carried out in stages where three routes - Center, Eastern
and Western – are proposed to be built, which will pass through different regions of Pakistan.
These routes are highlighted in Figure 1.1. Among these routes, the Western route is considered
more economically and politically viable as compared to the Central and Eastern routes. According
2 Shah, S., & Page, J. (2015). China readies $46 billion for Pakistan trade route. Wall Street Journal, 16. 3 “Pakistan-China Economic Corridor: a cost-benefit analysis” (The Express Tribune, 2015) 4 “CPEC to benefit entire region, say analysts” (Dawn News, 2015)
2
to a study on CPEC by the Chief Minister’s Policy Reform Unit, Government of Balochistan,5 the
feasibility of the Western route is in terms of low cost of land acquisition and population
dislocation compensation in the associated areas. The Western road would be passed from
Gwadar-Turbat-Panjgur-Khuzdar-Kalat-Quetta-Zhob-Dera Ismail Khan-Bannu-Kohat-Peshawar-
Hasanabdal-and onwards and will mostly cover least developed areas of Pakistan such as
Balochistan and Khyber Pakhtunkhwa. This road will benefit Pakistan due to its social impact
(health, education, environment, communication, etc.); economic impact (income, assets holding,
accessibility to market, employment, production, etc.); and political impact mainly in the
insurgency hit areas of Balochistan.
Figure 1.1. CPEC Routes
5 “China-Pakistan Economic Corridor: The Route Controversy” (2015)

3
1.2. Purpose of Study
This study highlights the socioeconomic situation of the districts across the Western route of the
Zone of Influence (ZOI) surrounding the economic corridor. The socioeconomic indicators are
education, health, assets and industry-wise employment. The study shows district wise
socioeconomic comparisons to supply policy recommendations accordingly. The Zone of
Influence districts in the Western route taken for the study include Gwadar, Turbat, Khuzdar6,
Kalat, Quetta, Qilla Saifullah, Zhob, Dera Ismail Khan, Mianwali, and Attock. This baseline study
would be helpful to understand the dynamics of the socioeconomic conditions of the ZOI as well
as to comparatively evaluate the socioeconomic impact after the completion of the corridor.
1.3. Organization of the Report
Section II covers Data and Methodology. Section III covers State of Socioeconomic Indicators,
which is based on the result of data analysis. Finally Section IV presents Conclusion and Policy
Recommendations.
6 Although Khuzdar lies in the central route but its linkage between central and western routes makes it an important
district to study.

4
SECTION II: DATA AND METHODOLOGY
2.1. DATA
To assess the socioeconomic condition of the ZOI districts, data of households as well as
individuals has been used for the ZOI districts. The data has been extracted from Pakistan Social
and Living Standards Measurement (PSLM) for the year 2012-13. The variables which reflect
socioeconomic condition are taken such as education, health, employment, and assets possession.
Table 2.1 describes the variables and indicators included in the study.
Table 2.1. Variables Description
Variable Indicator Sample Size
Education
Enrollment in Primary school
Enrollment in Middle school
Distance to the nearest Primary/Middle schools
12,174
children
Health
Households’ Visit to Health Care Unit
Household’s utilization of Lady Health Worker service
Distance to the nearest Health units
4808
households
Employment
Industry and gender wise share of employed persons
Industry and District wise share of employed persons
(For top 5 industries)
Industry and District wise share of employed persons
(For sub-divisions of each of the top 5 industries)
24,395
household
members
Assets possession District wise capital assets possession by households in
market value
4808
households
2.2. Methodology
To conduct a quantitative analysis of the socioeconomic data, this study relies on descriptive
statistics. The indicator for each variable is tabulated in terms of frequency distribution
(percentage) across the ZOI districts. The tabulation is graphically presented to show district-wise
comparison of socioeconomic indicators. The district wise result is also backed with province and
region based comparisons to highlight the broader view of socioeconomic condition in the ZOI
districts.
5
SECTION III: STATE OF SOCIO-ECONOMIC INDICATORS
The results are graphically presented by reporting District-wise percentage distribution for each
indicator. This section explains the status of socioeconomic indicators across the ZOI districts.
3.1. Education
Education is considered a key indicator of socioeconomic development, which also facilitates an
individual’s capacity development. Since Pakistan needs sound policies for capitalizing on its
human resources and socioeconomic development mainly in rural areas, highlighting the current
education situation in ZOI districts would help develop appropriate policy to facilitate more
accessible and affordable education in these districts. To evaluate the current education situation,
this report covers enrollment rates in primary and middle schools as well as distance to the nearest
primary and middle schools for each district respectively. The CPEC would reduce travel time for
the given distance, which increases access to schools mainly in terms of enrollment across all ZOI
districts.
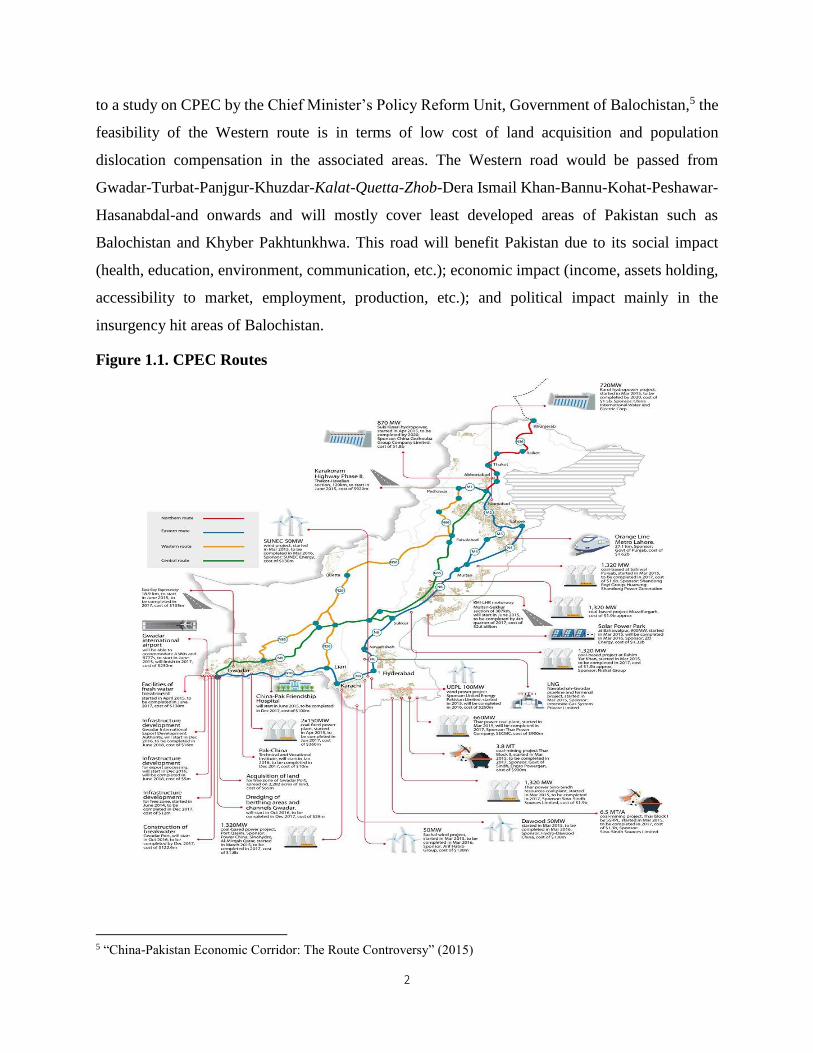
3.1.1. Primary School Enrollment
The primary school enrollment (in percentage) of the ZOI districts is shown in Figure 3.1. Attock
and Mianwali rank highest in enrollment which is at more than 75 percent for the two districts
while Zhob and Kalat rank lowest having less than 50 percent overall enrollment. However,
female enrollment in all districts is below 50 percent with Zhob and Kalat having the lowest female
enrollment rates of 9.6 and 18.5 percent respectively.
Figure 3.1. Primary School Enrollment
0%
20%
40%
60%
80%
100%
Attock Mianwali Gawadar Quetta Turbat Q.Saifullah Khuzdar D.I. Khan Kalat Zhob
Primary School EnrollmentTotal Enrolled
Male Enrolled
Female Enrolled
6
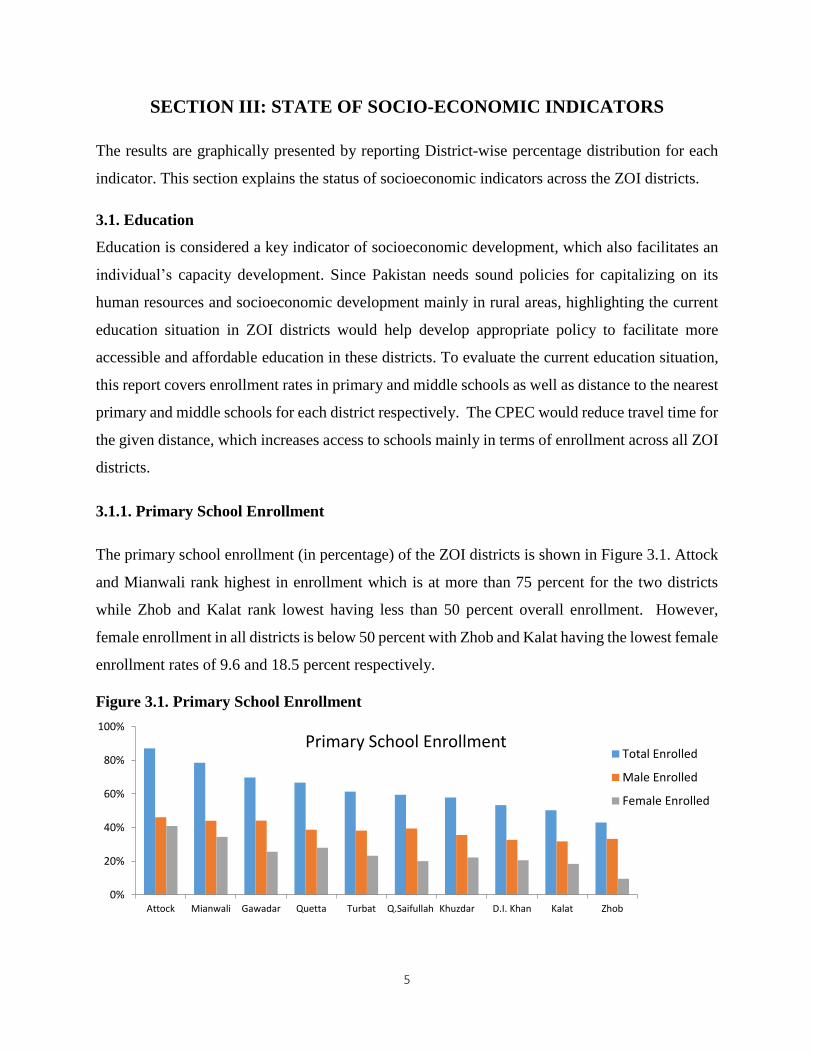
3.1.2. Middle School Enrollment
The middle school enrollment (in percentage) of ZOI districts is shown in Figure 3.2. Attock and
Mianwali rank highest in enrollment, which is more than 80 percent while Zhob and Kalat rank
the lowest having less than 50 percent in overall enrollment. However, the female enrollment in
all districts is less than 40 percent with Zhob and Kalat have the lowest female enrollment of 8.5
and 12.6 respectively.
Figure 3.2. Middle School Enrollment
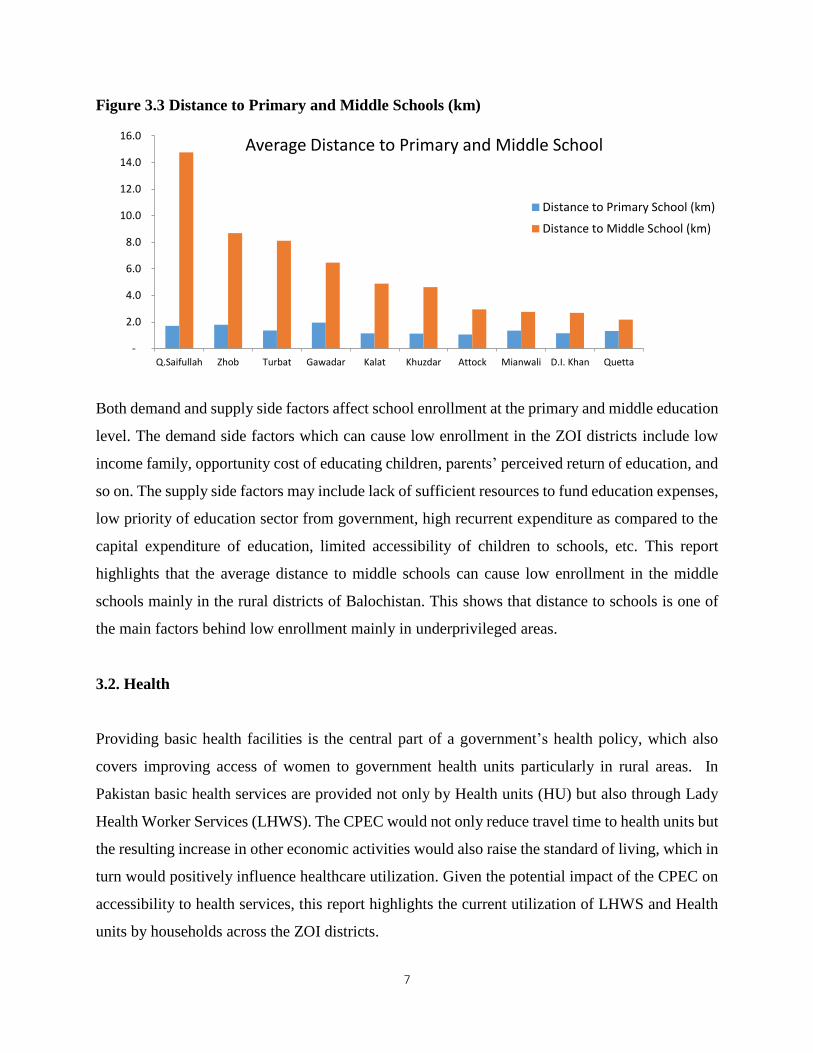
3.1.3. Average Distance to Primary and Middle Schools (in Kilometer)
Figure 3.3 shows average distance from households to primary and middle schools across ZOI
districts. It indicates that the average distance to primary school is less than 2 km in all districts of
ZOI while the average distance to middle schools goes as far as 14.8 km. Among these districts,
Qilla Saifullah has the highest average distance to middle schools which is 14.8 km while Quetta
has the lowest which is 2.2 km. It can also be seen that the average distance to middle schools is
greater in rural districts of Balochistan as compared to the rural districts of Punjab and KPK.
0%
10%
20%
30%
40%
50%
60%
70%
80%
90%
100%
Attock Mianwali Gawadar Quetta Turbat D.I. Khan Q.Saifullah
Khuzdar Kalat Zhob
Middle School Enrollment
Total Enrolled
Male Enrolled
Female Enrolled
7
Figure 3.3 Distance to Primary and Middle Schools (km)
Both demand and supply side factors affect school enrollment at the primary and middle education
level. The demand side factors which can cause low enrollment in the ZOI districts include low
income family, opportunity cost of educating children, parents’ perceived return of education, and
so on. The supply side factors may include lack of sufficient resources to fund education expenses,
low priority of education sector from government, high recurrent expenditure as compared to the
capital expenditure of education, limited accessibility of children to schools, etc. This report
highlights that the average distance to middle schools can cause low enrollment in the middle
schools mainly in the rural districts of Balochistan. This shows that distance to schools is one of
the main factors behind low enrollment mainly in underprivileged areas.
3.2. Health
Providing basic health facilities is the central part of a government’s health policy, which also
covers improving access of women to government health units particularly in rural areas. In
Pakistan basic health services are provided not only by Health units (HU) but also through Lady
Health Worker Services (LHWS). The CPEC would not only reduce travel time to health units but
the resulting increase in other economic activities would also raise the standard of living, which in
turn would positively influence healthcare utilization. Given the potential impact of the CPEC on
accessibility to health services, this report highlights the current utilization of LHWS and Health
units by households across the ZOI districts.
-
2.0
4.0
6.0
8.0
10.0
12.0
14.0
16.0
Q.Saifullah Zhob Turbat Gawadar Kalat Khuzdar Attock Mianwali D.I. Khan Quetta
Average Distance to Primary and Middle School
Distance to Primary School (km)
Distance to Middle School (km)
8
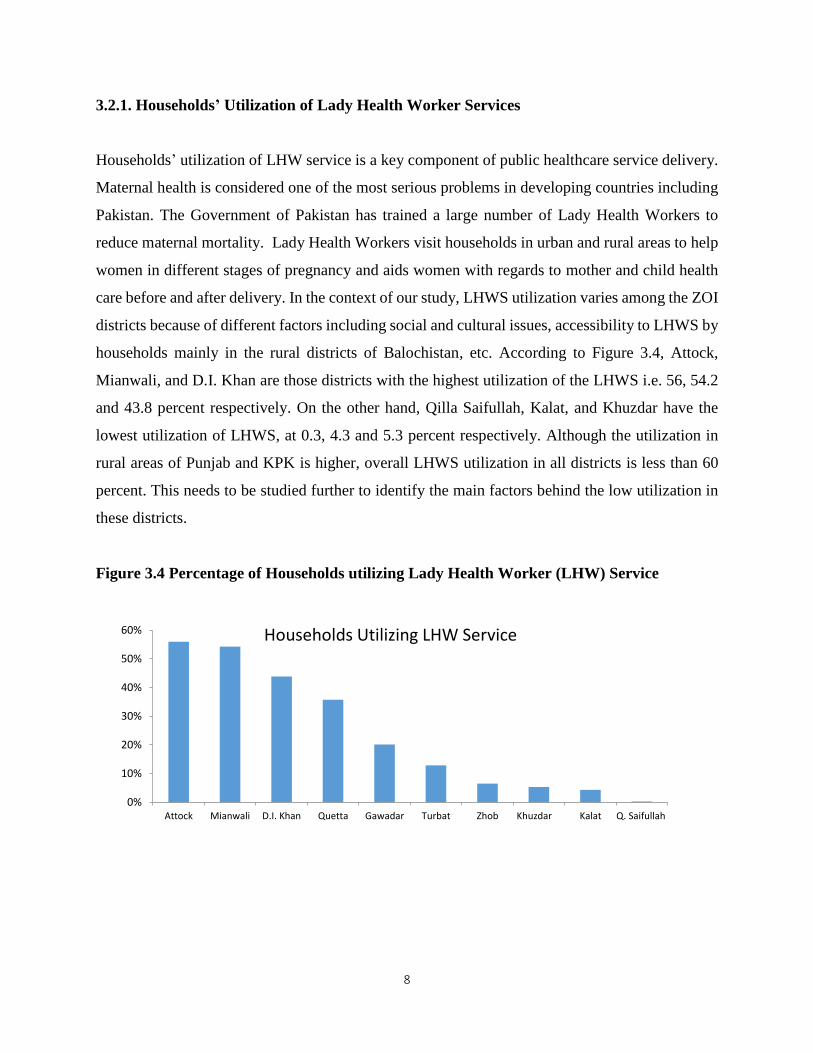
3.2.1. Households’ Utilization of Lady Health Worker Services
Households’ utilization of LHW service is a key component of public healthcare service delivery.
Maternal health is considered one of the most serious problems in developing countries including
Pakistan. The Government of Pakistan has trained a large number of Lady Health Workers to
reduce maternal mortality. Lady Health Workers visit households in urban and rural areas to help
women in different stages of pregnancy and aids women with regards to mother and child health
care before and after delivery. In the context of our study, LHWS utilization varies among the ZOI
districts because of different factors including social and cultural issues, accessibility to LHWS by
households mainly in the rural districts of Balochistan, etc. According to Figure 3.4, Attock,
Mianwali, and D.I. Khan are those districts with the highest utilization of the LHWS i.e. 56, 54.2
and 43.8 percent respectively. On the other hand, Qilla Saifullah, Kalat, and Khuzdar have the
lowest utilization of LHWS, at 0.3, 4.3 and 5.3 percent respectively. Although the utilization in
rural areas of Punjab and KPK is higher, overall LHWS utilization in all districts is less than 60
percent. This needs to be studied further to identify the main factors behind the low utilization in
these districts.
Figure 3.4 Percentage of Households utilizing Lady Health Worker (LHW) Service
0%
10%
20%
30%
40%
50%
60%
Attock Mianwali D.I. Khan Quetta Gawadar Turbat Zhob Khuzdar Kalat Q. Saifullah
Households Utilizing LHW Service
9
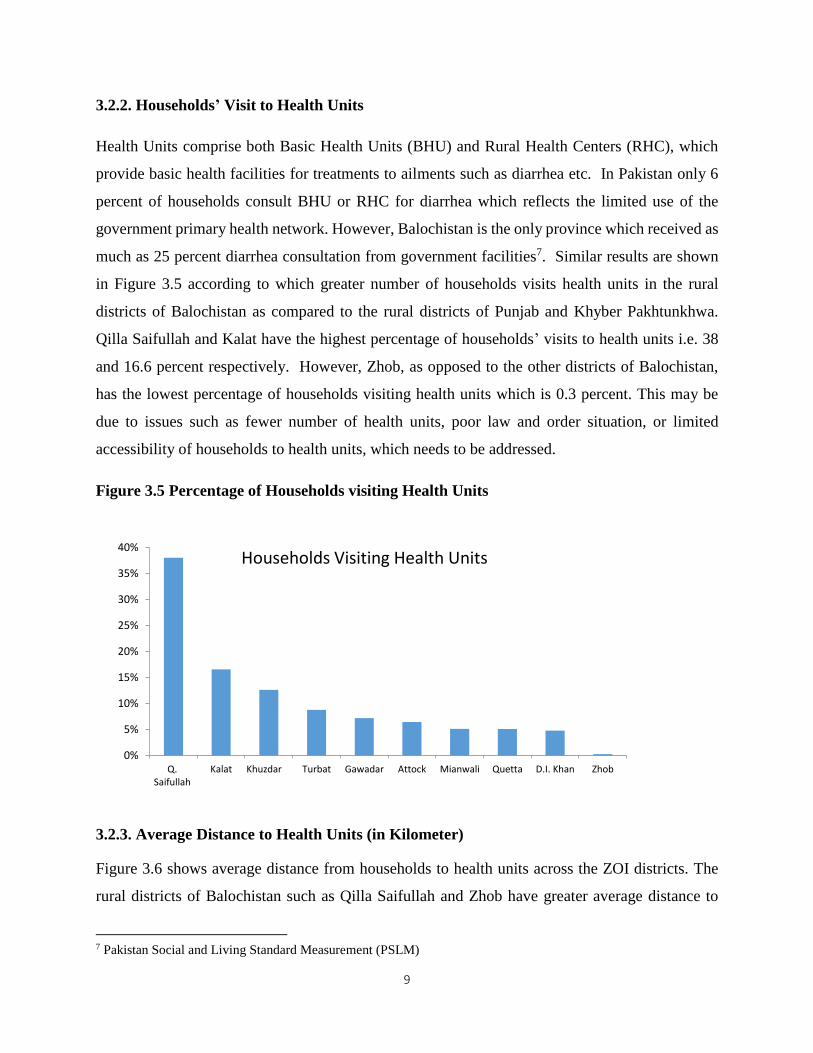
3.2.2. Households’ Visit to Health Units
Health Units comprise both Basic Health Units (BHU) and Rural Health Centers (RHC), which
provide basic health facilities for treatments to ailments such as diarrhea etc. In Pakistan only 6
percent of households consult BHU or RHC for diarrhea which reflects the limited use of the
government primary health network. However, Balochistan is the only province which received as
much as 25 percent diarrhea consultation from government facilities7. Similar results are shown
in Figure 3.5 according to which greater number of households visits health units in the rural
districts of Balochistan as compared to the rural districts of Punjab and Khyber Pakhtunkhwa.
Qilla Saifullah and Kalat have the highest percentage of households’ visits to health units i.e. 38
and 16.6 percent respectively. However, Zhob, as opposed to the other districts of Balochistan,
has the lowest percentage of households visiting health units which is 0.3 percent. This may be
due to issues such as fewer number of health units, poor law and order situation, or limited
accessibility of households to health units, which needs to be addressed.
Figure 3.5 Percentage of Households visiting Health Units
3.2.3. Average Distance to Health Units (in Kilometer)
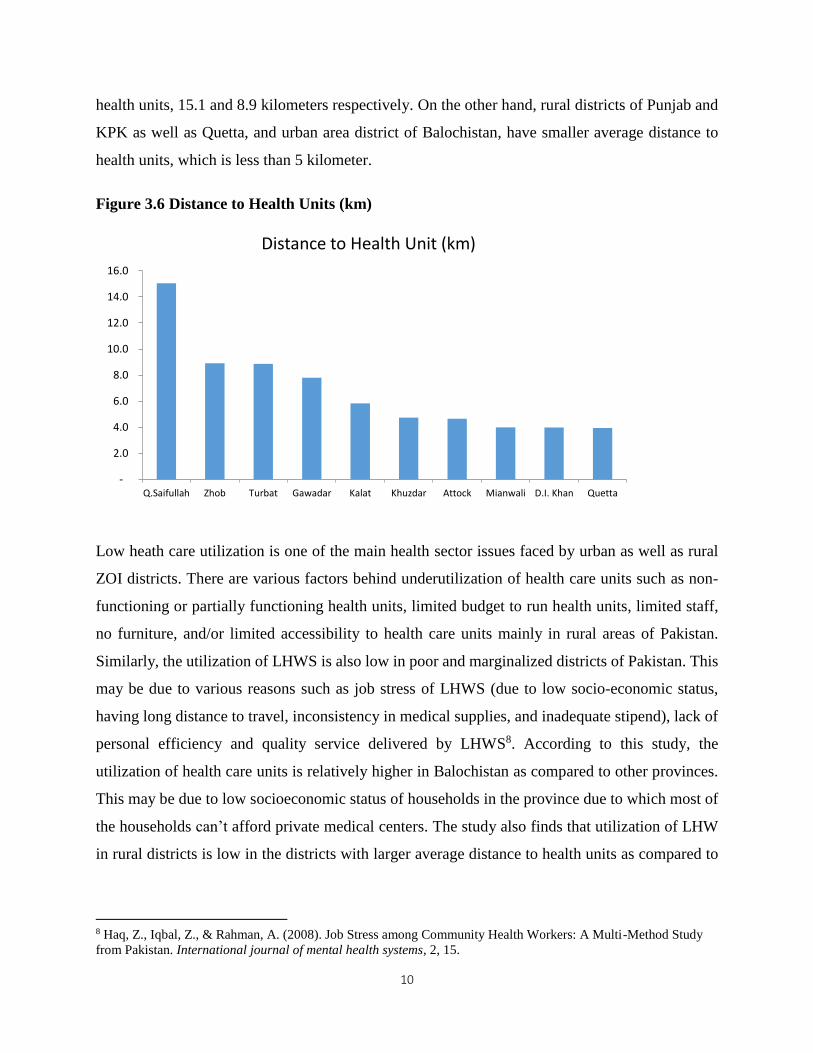
Figure 3.6 shows average distance from households to health units across the ZOI districts. The
rural districts of Balochistan such as Qilla Saifullah and Zhob have greater average distance to
7 Pakistan Social and Living Standard Measurement (PSLM)
0%
5%
10%
15%
20%
25%
30%
35%
40%
Q.Saifullah
Kalat Khuzdar Turbat Gawadar Attock Mianwali Quetta D.I. Khan Zhob
Households Visiting Health Units
10
health units, 15.1 and 8.9 kilometers respectively. On the other hand, rural districts of Punjab and
KPK as well as Quetta, and urban area district of Balochistan, have smaller average distance to
health units, which is less than 5 kilometer.
Figure 3.6 Distance to Health Units (km)
Low heath care utilization is one of the main health sector issues faced by urban as well as rural
ZOI districts. There are various factors behind underutilization of health care units such as non-
functioning or partially functioning health units, limited budget to run health units, limited staff,
no furniture, and/or limited accessibility to health care units mainly in rural areas of Pakistan.
Similarly, the utilization of LHWS is also low in poor and marginalized districts of Pakistan. This
may be due to various reasons such as job stress of LHWS (due to low socio-economic status,
having long distance to travel, inconsistency in medical supplies, and inadequate stipend), lack of
personal efficiency and quality service delivered by LHWS8. According to this study, the
utilization of health care units is relatively higher in Balochistan as compared to other provinces.
This may be due to low socioeconomic status of households in the province due to which most of
the households can’t afford private medical centers. The study also finds that utilization of LHW
in rural districts is low in the districts with larger average distance to health units as compared to
8 Haq, Z., Iqbal, Z., & Rahman, A. (2008). Job Stress among Community Health Workers: A Multi-Method Study
from Pakistan. International journal of mental health systems, 2, 15.
-
2.0
4.0
6.0
8.0
10.0
12.0
14.0
16.0
Q.Saifullah Zhob Turbat Gawadar Kalat Khuzdar Attock Mianwali D.I. Khan Quetta
Distance to Health Unit (km)
11
the ones with less distance. This implies that having long distance to health units may cause low
utilization of LHWS mainly in the rural areas of Balochistan.
3.3. Sector-wise Employment
According to the Labor Force Survey 2013-14, Pakistan has a labor force of around60 million
strong, out of which 56.52 million people are employed. The agriculture sector dominates with
42.2 percent share of employment followed by wholesale and retail trade (14.7 percent),
manufacturing (14.3 percent), construction (7.7 percent), and transport and communication (5.7
percent). The economic integration of different regions of Pakistan after the completion of the
western route of the CPEC would enable modernized and efficient transportation and
communication networks across these regions. The western route of CPEC would also establish
rural-urban links and increase market accessibility which can create more employment
opportunities in these regions.
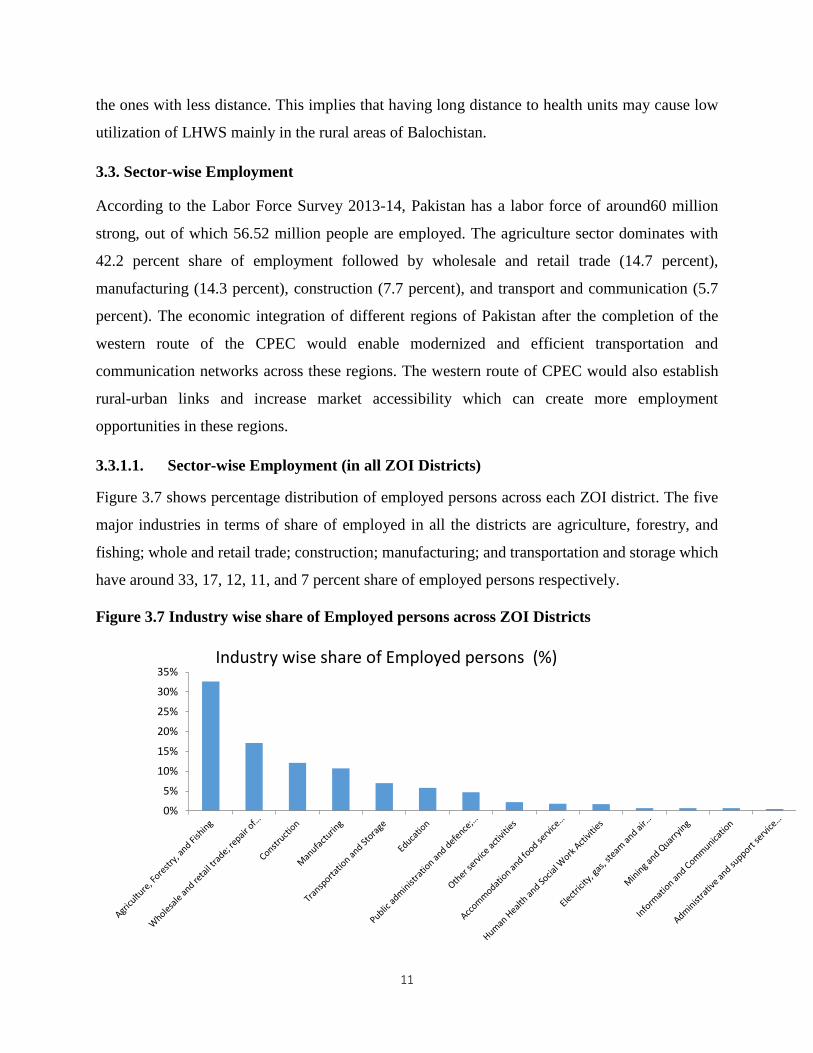
3.3.1.1. Sector-wise Employment (in all ZOI Districts)
Figure 3.7 shows percentage distribution of employed persons across each ZOI district. The five
major industries in terms of share of employed in all the districts are agriculture, forestry, and
fishing; whole and retail trade; construction; manufacturing; and transportation and storage which
have around 33, 17, 12, 11, and 7 percent share of employed persons respectively.
Figure 3.7 Industry wise share of Employed persons across ZOI Districts
0%
5%
10%
15%
20%
25%
30%
35%Industry wise share of Employed persons (%)
12
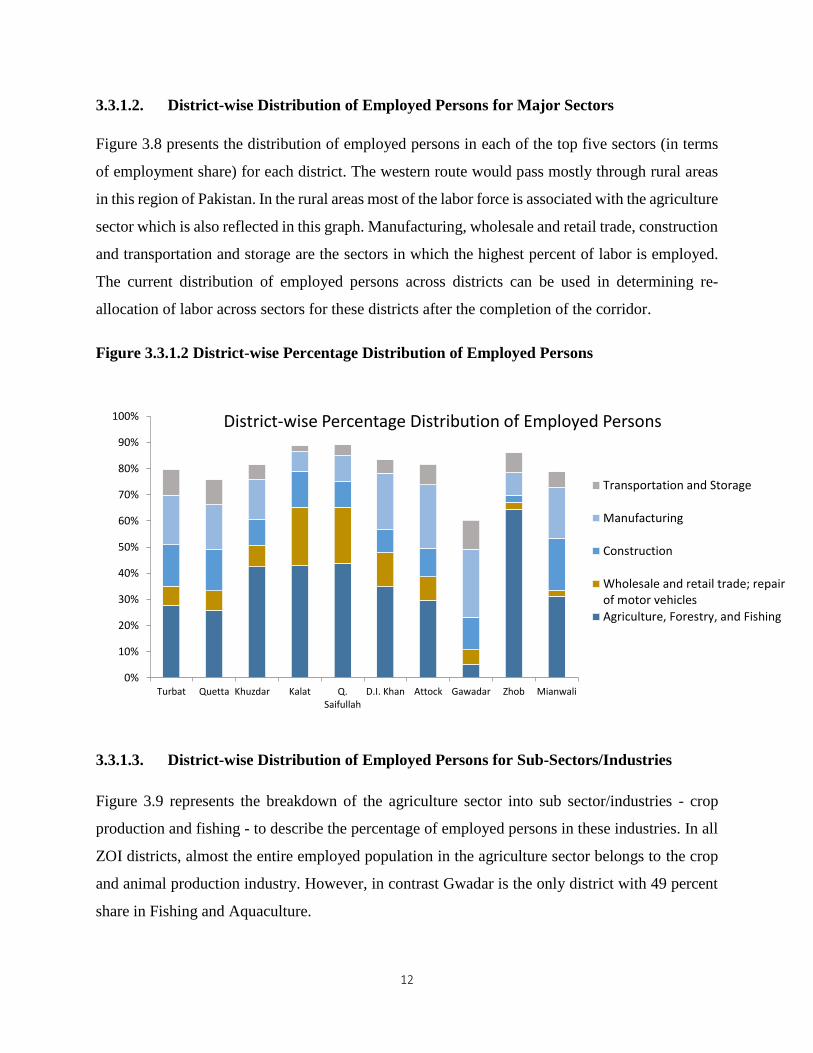
3.3.1.2. District-wise Distribution of Employed Persons for Major Sectors
Figure 3.8 presents the distribution of employed persons in each of the top five sectors (in terms
of employment share) for each district. The western route would pass mostly through rural areas
in this region of Pakistan. In the rural areas most of the labor force is associated with the agriculture
sector which is also reflected in this graph. Manufacturing, wholesale and retail trade, construction
and transportation and storage are the sectors in which the highest percent of labor is employed.
The current distribution of employed persons across districts can be used in determining re-
allocation of labor across sectors for these districts after the completion of the corridor.
Figure 3.3.1.2 District-wise Percentage Distribution of Employed Persons
3.3.1.3. District-wise Distribution of Employed Persons for Sub-Sectors/Industries
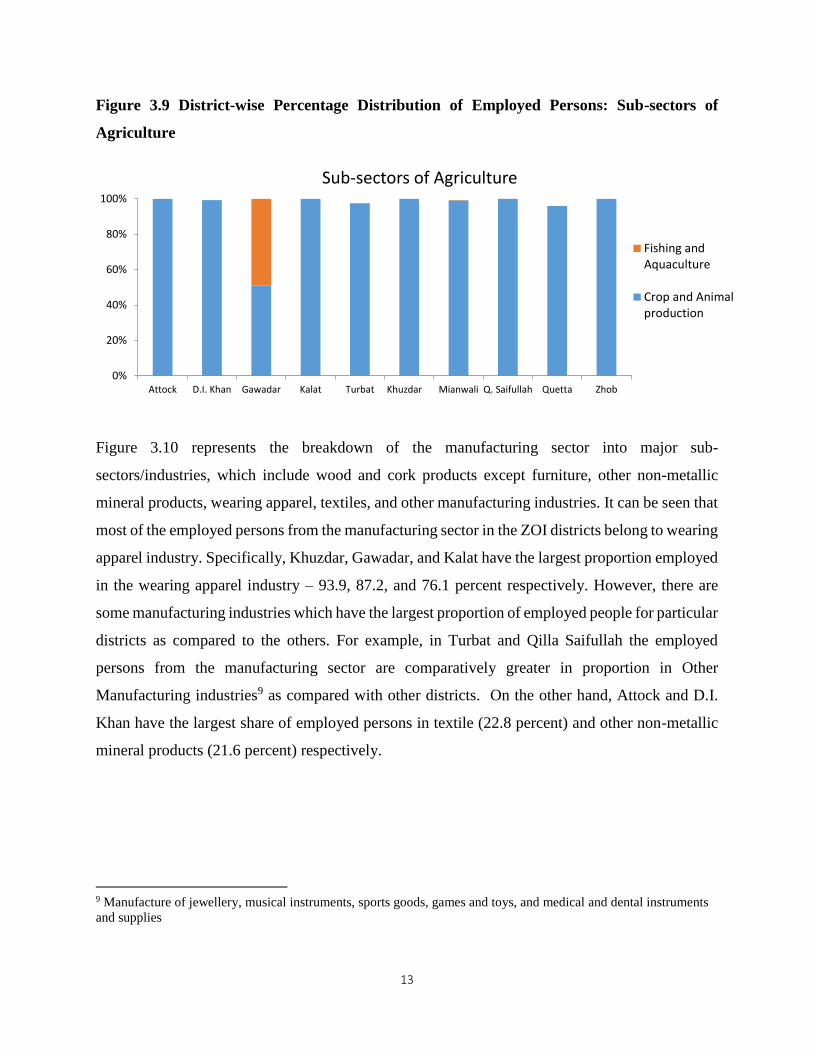
Figure 3.9 represents the breakdown of the agriculture sector into sub sector/industries - crop
production and fishing - to describe the percentage of employed persons in these industries. In all
ZOI districts, almost the entire employed population in the agriculture sector belongs to the crop
and animal production industry. However, in contrast Gwadar is the only district with 49 percent
share in Fishing and Aquaculture.
0%
10%
20%
30%
40%
50%
60%
70%
80%
90%
100%
Turbat Quetta Khuzdar Kalat Q.Saifullah
D.I. Khan Attock Gawadar Zhob Mianwali
District-wise Percentage Distribution of Employed Persons
Transportation and Storage
Manufacturing
Construction
Wholesale and retail trade; repairof motor vehicles
Agriculture, Forestry, and Fishing
13
Figure 3.9 District-wise Percentage Distribution of Employed Persons: Sub-sectors of
Agriculture
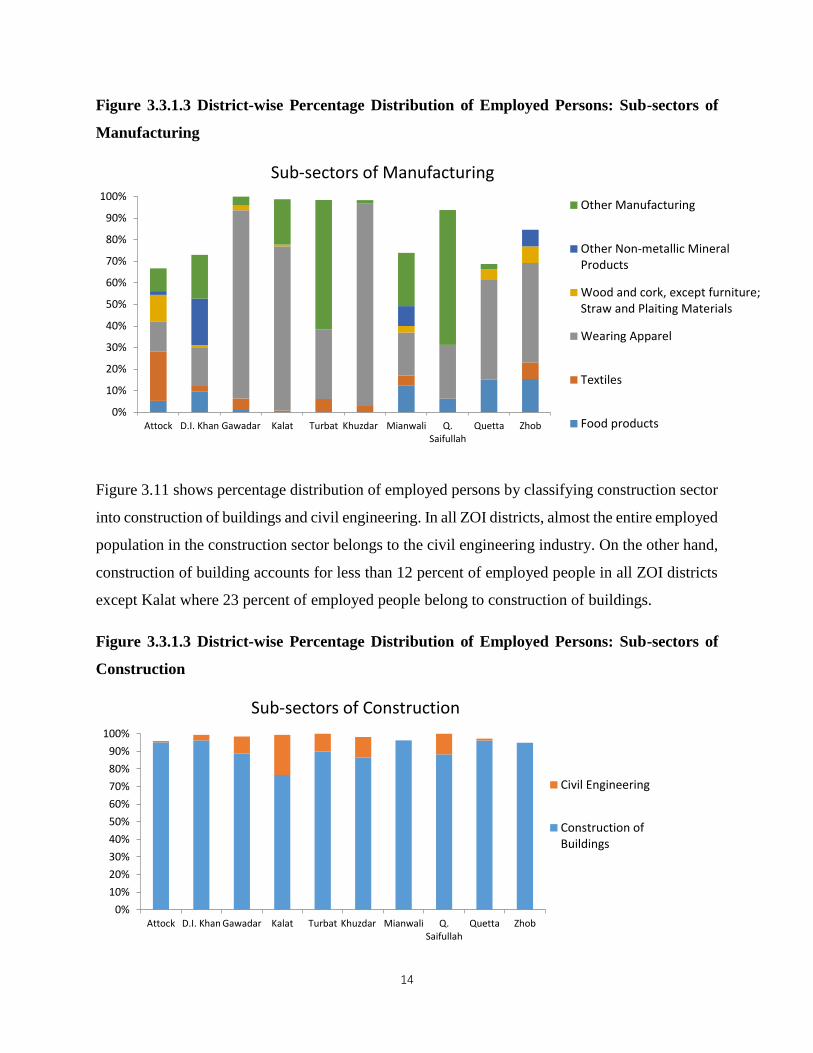
Figure 3.10 represents the breakdown of the manufacturing sector into major sub-
sectors/industries, which include wood and cork products except furniture, other non-metallic
mineral products, wearing apparel, textiles, and other manufacturing industries. It can be seen that
most of the employed persons from the manufacturing sector in the ZOI districts belong to wearing
apparel industry. Specifically, Khuzdar, Gawadar, and Kalat have the largest proportion employed
in the wearing apparel industry – 93.9, 87.2, and 76.1 percent respectively. However, there are
some manufacturing industries which have the largest proportion of employed people for particular
districts as compared to the others. For example, in Turbat and Qilla Saifullah the employed
persons from the manufacturing sector are comparatively greater in proportion in Other
Manufacturing industries9 as compared with other districts. On the other hand, Attock and D.I.
Khan have the largest share of employed persons in textile (22.8 percent) and other non-metallic
mineral products (21.6 percent) respectively.
9 Manufacture of jewellery, musical instruments, sports goods, games and toys, and medical and dental instruments
and supplies
0%
20%
40%
60%
80%
100%
Attock D.I. Khan Gawadar Kalat Turbat Khuzdar Mianwali Q. Saifullah Quetta Zhob
Sub-sectors of Agriculture
Fishing andAquaculture
Crop and Animalproduction
14
Figure 3.3.1.3 District-wise Percentage Distribution of Employed Persons: Sub-sectors of
Manufacturing
Figure 3.11 shows percentage distribution of employed persons by classifying construction sector
into construction of buildings and civil engineering. In all ZOI districts, almost the entire employed
population in the construction sector belongs to the civil engineering industry. On the other hand,
construction of building accounts for less than 12 percent of employed people in all ZOI districts
except Kalat where 23 percent of employed people belong to construction of buildings.
Figure 3.3.1.3 District-wise Percentage Distribution of Employed Persons: Sub-sectors of
Construction
0%
10%
20%
30%
40%
50%
60%
70%
80%
90%
100%
Attock D.I. Khan Gawadar Kalat Turbat Khuzdar Mianwali Q.Saifullah
Quetta Zhob
Sub-sectors of Manufacturing
Other Manufacturing
Other Non-metallic MineralProducts
Wood and cork, except furniture;Straw and Plaiting Materials
Wearing Apparel
Textiles
Food products
0%
10%
20%
30%
40%
50%
60%
70%
80%
90%
100%
Attock D.I. Khan Gawadar Kalat Turbat Khuzdar Mianwali Q.Saifullah
Quetta Zhob
Sub-sectors of Construction
Civil Engineering
Construction ofBuildings

15
Figure 3.12 represents the breakdown of Wholesale and retail trade sector. In ZOI districts, almost
the entire employed population in this sector belongs to retail trade. Wholesale trade, on the other
hand, accounts for less than 13 percent of employed people in all ZOI districts except Gawadar
and Turbat where the proportion of employed people in the wholesale trade is comparatively
higher than the other districts – 31 and 24 percent respectively. Repair of motor vehicles accounts
for less than 17 percent of employed people in all ZOI districts.
Figure 3.3.1.3 District-wise Percentage Distribution of Employed Persons: Sub-sectors of
Wholesale & Retail Trade
The results conclude that the major share of employment across the ZOI is associated with
agriculture sector, however the share of employed persons varies across the districts; districts
which are relatively more developed, such as Quetta, Attock, and Gawadar, have less employment
share in agriculture as compared to the less developed districts such as Zhob, Qilla Saifullah, and
Kalat. The study also indicates that the wearing apparel industry has the major share of
employment in manufacturing sector in most of ZOI districts while the civil engineering industry
has the highest share of employment in the construction sector.
3.3.1.4. Household Asset Possession
The households’ asset possession is taken as proxy to households’ financial status. It is represented
by market value of capital assets held by households which include agricultural land, residential
0%
10%
20%
30%
40%
50%
60%
70%
80%
90%
100%
Attock D.I. Khan Gawadar Kalat Turbat Khuzdar Mianwali Q.Saifullah
Quetta Zhob
Sub-sectors of Wholesale and Retail Trade
Retail Trade
Wholesale Trade
Repair of motorvehicles
16
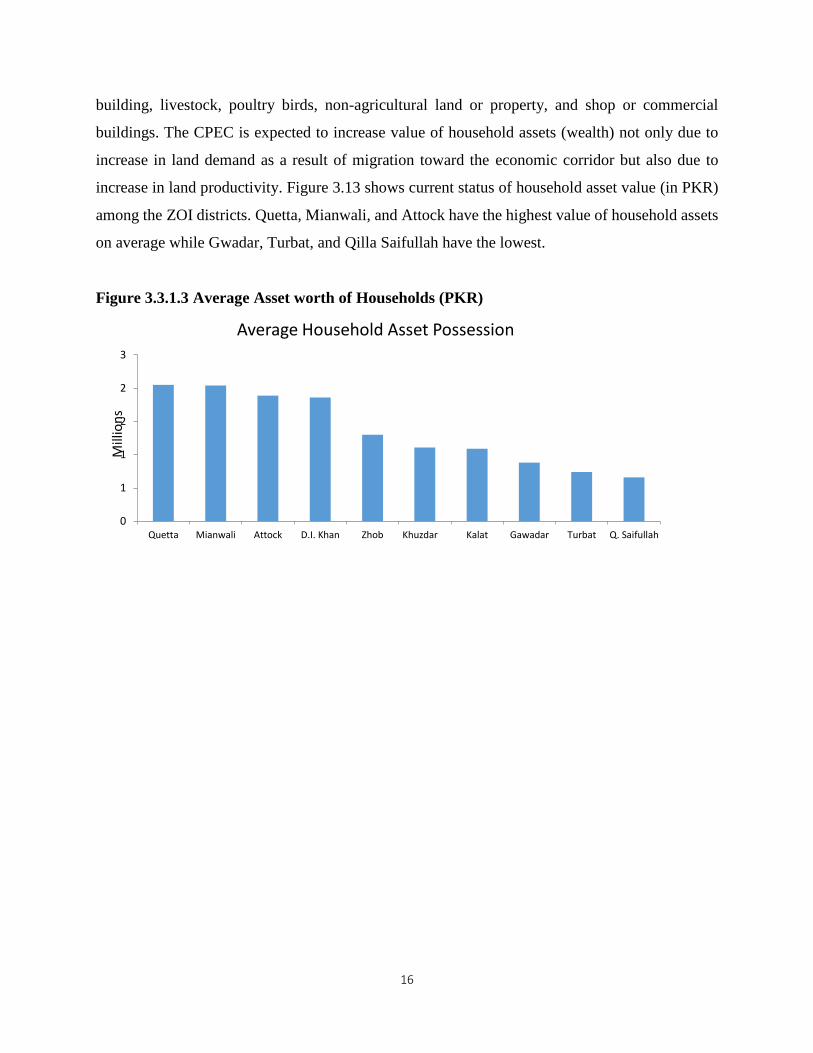
building, livestock, poultry birds, non-agricultural land or property, and shop or commercial
buildings. The CPEC is expected to increase value of household assets (wealth) not only due to
increase in land demand as a result of migration toward the economic corridor but also due to
increase in land productivity. Figure 3.13 shows current status of household asset value (in PKR)
among the ZOI districts. Quetta, Mianwali, and Attock have the highest value of household assets
on average while Gwadar, Turbat, and Qilla Saifullah have the lowest.
Figure 3.3.1.3 Average Asset worth of Households (PKR)
0
1
1
2
2
3
Quetta Mianwali Attock D.I. Khan Zhob Khuzdar Kalat Gawadar Turbat Q. Saifullah
Mill
ion
s
Average Household Asset Possession
17
SECTION IV: CONCLUSION AND POLICY RECOMMENDATIONS
The study highlights current socioeconomic condition of ZOI districts across the Western route of
China Pakistan Economic Corridor. The study will be used as a benchmark to conduct impact
assessment of socioeconomic conditions of the ZOI districts which compares the socioeconomic
conditions of the districts after the completion of the corridor with their current status.
This study indicates that low financial status (household asset possession) and greater travel time
from schools in ZOI districts can cause low enrollment. Similar reasons can also be associated
with low utilization of health facilities. This suggests addressing issues of accessibility to schools
and health units to increase enrollment and health utilization respectively. Also, schools and health
units should be built nearest to communities to facilitate their accessibility.
This study also provides current status of employment in different sectors across the ZOI districts.
The employment situation of the main sectors is further explored for the industries/ sub-sectors
which have the major employment share. The highest share belonging to the wearing apparel
industry in manufacturing sector employment implies that the increased accessibility of wearing
apparel industry to market in the ZOI districts can potentially create jobs in the industry.
Another important matter is that most of the economic zones would be built on the Eastern route
which may create unrest in other provinces – KPK and Balochistan. Therefore, it is suggested that
more economic zones should be built on those areas of Western route where it is economically and
politically feasible and this may also contribute to reducing insurgencies in the associated areas.
The construction of economic zones in the Western route (mainly Zhob and Khuzdar) would
potentially shift labor from agriculture to other sectors. This suggests that government should
establish institutions where local people can be trained for the resulting diverse nature of jobs and
thus increase their productivity. The corridor would not only facilitate the agriculture sector but
also the fishing industry in Gwadar by increasing accessibility to urban and international markets
which would create more jobs in these sectors. Given this, the Pakistan Government needs to
enhance storage capacity particularly for perishable commodities, increase accessibility to
markets, facilitate fish farmers in earning market return, and explore national and international
markets for these products to increase jobs in ZOI districts.