Embed Size (px)
Citation preview
ECONOMICS • FINANCE • PLANNING
Evaluation of the Bright Start Genetic Testing Program
Prepared for the State of Washington Department of Social and Health Services
888 SW Fifth Avenue
Suite 1460
Portland, Oregon 97204
503-222-6060www.econw.com
October, 2009


Bright Start Genetic Testing Evaluation ECONorthwest Page i
Table of Contents
Page
CHAPTER 1 INTRODUCTION AND SUMMARY...............................................1-1
INTRODUCTION .........................................................................................................1-1 KEY FINDINGS...........................................................................................................1-1 ORGANIZATION OF THE REPORT ................................................................................1-3
CHAPTER 2 GENETIC TESTING PROCESS ..................................................2-1
INTRODUCTION .........................................................................................................2-1 THE HOSPITAL-BASED OFFER ....................................................................................2-1 APPLICATION PROCESSING .......................................................................................2-3 GENETIC TESTING.....................................................................................................2-7 POST-TEST PROCESSES ...........................................................................................2-7 OWNERSHIP AND SUBSEQUENT USES OF THE GENETIC TEST FINDINGS.......................2-8 CONCLUSIONS..........................................................................................................2-8
CHAPTER 3 GENETIC TEST OUTCOMES AND APPLICANT
CHARACTERICS ......................................................................................3-1
INTRODUCTION .........................................................................................................3-1 GENETIC TESTING APPLICATIONS, REFERRALS, AND OUTCOMES ................................3-1 DEMOGRAPHIC CHARACTERISTICS OF MOTHERS WHO APPLIED FOR A GENETIC
TEST ...................................................................................................................3-5 HOSPITAL DETAIL......................................................................................................3-9
CHAPTER 4 COST ESTIMATES FOR STATEWIDE IMPLEMENTATION............4-1
INTRODUCTION .........................................................................................................4-1 STATEWIDE IMPLEMENTATION ...................................................................................4-1 CONCLUSIONS..........................................................................................................4-4
APPENDIX A BRIGHT START PROCESS DETAILS........................................A-1


Bright Start Genetic Testing Evaluation ECONorthwest Page 1-1
Chapter 1 Introduction and Summary
INTRODUCTION In mid-2005, the federal Office of Child Support Enforcement (OCSE)
awarded Washington State’s Division of Child Support (DCS) a Section
1115(a) demonstration grant to implement and rigorously evaluate
enhancements to its pioneering work in voluntary paternity establishment.
The demonstration project—called Bright Start— sought to demonstrate that
a renewed and reinvigorated relationship with hospital staff could
measurably improve rates of in-hospital paternity establishment. The project
also sought to test the feasibility and demand for complementary services
that could be offered during a hospital stay, including genetic testing. Bright
Start’s four-year experience in the implementation of genetic testing is the
focus of this report.
To build the case for the free genetic test offer, DCS managers noted that
not all mothers were certain about the paternity of their newborn. And,
hospital staff had few, if any, suggestions for mothers who declined to sign an
affidavit because of uncertainty about paternity. The program’s supporters
argued the offer could eliminate some inappropriate affidavits signed by men
who are not biological fathers and could encourage additional affidavits
among men who, before the test, were uncertain about paternity. To avoid
situations in which parents, who are already certain about paternity, request
a test simply because it is free, Bright Start instructed hospital staff to limit
the offer to only parents who express uncertainty about paternity. If a couple
chose not to complete an affidavit, however, hospitals were to offer testing
information without further questioning.
During 2006-2008, the Bright Start demonstration operated in 15
hospitals in the Tacoma, Fife, Vancouver, and Yakima areas. In mid-2008,
the federal government approved funding to expand the program to 14
additional hospitals in Seattle, Spokane, Moses Lake, and the Tri-Cities
areas. As the demonstration came to an end in the Fall 2009, DCS planned to
expand to all birthing hospitals in the state.
KEY FINDINGS Stakeholders inside and outside of DCS viewed the genetic test offer as an
appropriate complement to the paternity affidavit program.
• The program enjoyed near universal support among hospital
staff. Nurses, social workers, and vital records staff embraced the
service and saw it as filling a gap for couples that were unsure about
paternity of a newborn. In the views of many, the test offer filled a
hole in the affidavit program. For years, hospital staff has been
providing the opportunity to attest to paternity but could offer no

Page 1-2 ECONorthwest Bright Start Genetic Testing Evaluation
advice to mothers who were unsure about the paternity of their
newborn.
• Hospital staff training likely explains uneven implementation.
Despite strong support for the genetic testing component of Bright
Start, hospitals varied greatly in how consistently they offered parents
information about the no-cost genetic test, as suggested by the
distribution of referrals by hospital. While differing patient
demographics explain some of the variation, interviews at several
hospitals revealed that staff does not consistently offer the genetic test
information when parents decline to sign the paternity affidavit. Such
inconsistencies appeared to primarily be the result of staff turnover,
and managers at underperforming hospitals indicated that they will
be more vigilant in presenting this service in the future.
• A small but measurable share of couples request tests. The
percent of unmarried parents that requested a test through Bright
Start birth hospitals varies between 0 and 6 percent. We predict that,
statewide, between 1.3 and 2.0 percent of unmarried parents will
request a genetic test while at the hospital with statewide
implementation of the program.
• Hospitals with higher hospital-based paternity establishment
rates also tend to have higher referral rates for genetic tests.
Although the relationship is not strong, a more robust statewide
paternity acknowledgement program might be expected to produce
relatively more genetic test requests than a weaker program.
• With a few exceptions applicants’ demographic characteristics
mirror those of all unmarried mothers giving birth at Bright
Start hospitals. As a group, non-white mothers were relatively less
likely to request a test than were white mothers, although the share of
applicants mothers identified specifically as African American was
greater than the share of African American mothers among all
unmarried births. At the same time, mothers with greater educational
attainment and greater socioeconomic status were relatively more
likely to request a test. The data were too limited to draw strong
conclusions regarding these findings, but they suggest that different
demographic groups vary in either their uncertainty regarding
paternity, their willingness to participate in voluntary genetic test, or
both.
• A waiting period does not dampen participation among
genetic testing applicants. Couples interested in genetic testing
had to apply to Bright Start for services and then typically waited
about 25 days to take the test.1 Despite the wait and required travel,
83 percent of applicants appeared for their test appointments. Prompt
1 Bright Start reports that the typical lag between application and scheduled test date has shrunk over time.

Bright Start Genetic Testing Evaluation ECONorthwest Page 1-3
processing of applications and reasonably convenient testing locations
were a key to the high participation rate.
• Bright Start program helped resolve paternity uncertainty
and may have prevented errors in paternity establishment.
Although a minority of men (18%) were ultimately ruled out as the
biological father, 82% of Bright Start’s genetic tests confirmed the
paternity of the tested child.
• Offering genetic testing has improved establishment
outcomes. Out of 216 applications completed with tests indicating
inclusion within 120 days, 33% ultimately established paternity. This
results in an average of 1 establishment per every 3 to 4 inclusions.
• The total program cost per completed test for statewide
program implementation is estimated between $304 to $317.
The estimates include the cost of the test itself and the staff resources
necessary to process genetic test referrals. We estimate a program
that includes enhanced “second effort” follow-ups with identified
biological fathers to encourage official paternity establishment would
cost between $350 and $365 per completed test, and somewhat less
per referral because not all referrals produce a test result.
ORGANIZATION OF THE REPORT This report is designed to document the processes and outcomes of Bright
Start’s genetic testing offer, as well as, to serve as a “how to” guide for other
states or regions that might be interested in implementing a similar service.
Chapter 2 details the program’s processes, step-by-step, from the hospital-
based offer and application to the couple’s receipt of test findings. Chapter 3
outlines the analysis of program outcomes and summarizes: the total number
of applications by hospital, the characteristics of applicants and testing no-
shows, the incidences of paternity inclusion and exclusion, and subsequent
paternity establishment status of men included by the genetic test. Chapter
4 projects the staffing and funding requirements of a genetic test program at
full implementation and offers concluding thoughts for states considering a
similar program.

Bright Start Genetic Testing Evaluation ECONorthwest Page 2-1
Chapter 2 Genetic Testing Process
INTRODUCTION The State of Washington viewed the offer of a genetic test as a natural
complement to the long-standing in-hospital paternity establishment
program. To be effective, the test offer would need to take place at the
hospital, at the same time unwed couples are considering paternity
acknowledgement. Bright Start’s managers hypothesized, and the program’s
experience confirmed, that a small but measurable percentage of couples are
uncertain about paternity at the time of birth.
The program’s design and process are relatively simple. To deliver the
genetic test offer, Bright Start tapped the network of birthing clerks, nurses,
and social workers that disseminate the Washington Paternity Affidavit
form. Next, Bright Start’s manager developed a self-standing management
information system to accept applications, set and track client appointments,
and close cases. Bright Start selected a national genetic testing company
approved under an existing Washington State contract as the provider of
tests in sites across the state.
Because the Bright Start genetic testing program operated outside of Title
IV-D of the Social Security Act and offered tests to some couples with no
current IV-D case, the greatest implementation challenges related to
emerging or subsequent IV-D actions. The remainder of this chapter steps
through processes implemented by Bright Start to deliver free genetic
testing.
THE HOSPITAL-BASED OFFER Drawing on nearly two decades of work with birthing hospitals, Bright
Start’s manager knew that expanding the paternity-related discussion in the
hospitals could be a challenge. While the affidavit program was generally
embraced by Washington hospitals, the paternity conversation falls in second
tier of importance—well behind ensuring and monitoring the mother’s and
child’s health, counseling on child feeding and care, and collecting payment
and insurance information. In recent years, hospital visits have become
shorter, and mothers are inundated with materials on birth certificates,
breastfeeding, photographs, and additional social service programs.
At the program’s outset, Bright Start’s manager feared that genetic
testing could be viewed as one more offer squeezed—and perhaps lost—in an
increasingly short and crowded conversation between mothers and hospital
staff. With that in mind, Bright Start designed the hospital’s role to be as
small and focused as possible.
Leveraging the same conversation on paternity that introduces the
affidavit, Bright Start encouraged hospital staff to:

Page 2-2 ECONorthwest Bright Start Genetic Testing Evaluation
1. Offer the paternity affidavit first without a mention of the
genetic test offer. At Bright Start’s outset, the manager worried
that a simultaneous offer of the affidavit or testing could cause
confusion and lead some couples to conclude that they need a test
before they sign the affidavit. Bright Start wanted couples that
were sure about paternity to simply proceed with the affidavit.
2. If couples appear uncertain about paternity or are
otherwise unwilling to sign the affidavit, hospital staff
makes the free genetic test offer. When a test offer is
appropriate, the hospital’s role is minimal but key. The staff
distributes a self-addressed, stamped application to the mother,
provides a very brief explanation of the process and typical timing,
and offers to send completed applications to Bright Start. The
application form requests simply the names and contact
information of the mother, child, and possible father (see
Appendix A).
Hospital staff were generally supportive of the genetic testing service.
They noted that cost is a major issue for many parents, and being able to get
a free test is an important option for those mothers who are uncertain about
the biological father’s identity. Similarly, those staff who are aware of the
long-term implications of paternity acknowledgement (e.g., the difficulty in
disestablishing paternity) supported the option of offering the test to those
individuals who expressed doubt about paternity.
Staff did note that genetic testing can be a sensitive topic. When the
mother and potential father are hesitant to sign the affidavit, it can be
uncomfortable to probe for the reasons why. In many cases, staff suggested
that it is easier to raise the issue of the genetic test when only the mother is
present. Others noted that, especially with teen parents, the grandparents
can create additional problems. In some cases the parents of the mother may
have strong feelings about the father and not want him to be the legal father,
regardless of whether or not he is the biological father. Additionally, the
parents of the presumptive father may be wary about their son consenting to
a genetic test.
Overall, staff in most hospitals reported offering the genetic test
information at the appropriate time (i.e., when the mother and potential
father decline to sign the paternity affidavit). Typically, the staff responsible
for presenting the paternity affidavit information will also discuss the genetic
test option.
A number of Bright Start hospitals use social workers to address the issue
of genetic testing. Interviewees suggested that social workers are often better
equipped to deal with these issues than other staff involved in the paternity
affidavit process (e.g., medical records clerks). Similarly, some staff noted
that patients are sometimes embarrassed about receiving genetic test
information.

Bright Start Genetic Testing Evaluation ECONorthwest Page 2-3
Despite strong support for the genetic testing component of Bright Start,
hospitals varied greatly in how consistently they offered parents information
about the no-cost genetic test. While some of this variation is likely due to
differences in patient demographics across hospitals, interviews at several
hospitals revealed that staff does not consistently offer the genetic test
information when parents decline the paternity affidavit. Interviewees in one
hospital indicated that they do not always offer the genetic test, and they
only provide the information if the parents explicitly ask about genetic
testing options. In other hospitals, interviews with staff revealed
inconsistency within the hospital. While some staff regularly offered the
genetic test information, others were not aware that the service was even
available. Such inconsistencies appeared to primarily result from staff
turnover, and managers in underperforming hospitals promised they would
be more vigilant in presenting this service in the future.
APPLICATION PROCESSING Bright Start receives and processes applications for genetic tests centrally
at an office in Olympia, Washington. The demonstration operated in the
Department of Social and Health Services (DSHS), Operations Support
Division (OSD), Economic Services Administration Management
Accountability and Performance Statistics (E-MAPS), which is formally
outside of the Division of Child Support. It manages demonstrations, audits,
and other special projects.
Throughout the Bright Start demonstration, a single manager handled
application processing, with assistance during vacation, leave, and training
periods. Bright Start also developed a self-standing management
information system (MIS)—separate from the large, mainframe child support
information system. The system was built in-house using Microsoft ACCESS
and captured the identifying applicant data, as well as the key process dates
and steps. A genetic test application generates a self-standing Bright Start
case—separate from the IV-D system. Washington has developed an enhanced
MIS for the statewide implementation of the genetic testing program. The
new system captures more case information than the original system and
improves the ease of case management. Appendix A includes screen shots
from the system.
Upon receipt of an application for testing, the manager opens a Bright
Start case and steps through the following case processes:
1. Ensures paternity isn’t already established through an
affidavit. The manager has online access to paternity affidavit
records, which—in Washington—are maintained by the
Department of Health. In rare instances, the manager finds
genetic test applications for couples that had already signed a
paternity affidavit. If the mother or man disputes paternity—
despite having signed the affidavit—Bright Start refers the couple
to a legal education and referral network. The manager encourages
the parties to read the rights and responsibilities section on the

Page 2-4 ECONorthwest Bright Start Genetic Testing Evaluation
back of the affidavit and will send an extra copy, if necessary.
However, Bright Start does not provide genetic testing if an
affidavit is in force.
2. Ensures the mother isn’t married. In Washington, the husband
of a married mother is presumed to be the father unless the
husband formally denies paternity. If the husband signs a denial of
paternity and is not named as father on the birth certificate,
Bright Start will pay for a genetic test for another putative father.
3. Checks the child support system for case activity and
rejects applications already involved in a formal
establishment process. For many, the application for genetic
testing takes place well before involvement with the child support
system. And many couples never interact with child support.
However, it is important to check a couple’s child support status
before proceeding with a Bright Start-funded genetic test. Bright
Start occasionally uncovers mothers with open child support cases,
and some have parallel paternity establishment processes
underway.
If the Washington State Division of Child Support (DCS) has a
case but has not made progress on paternity establishment, Bright
Start’s manager will ask for permission to proceed with the genetic
test. However, if DCS has already referred a case to the
prosecuting attorney office for the county in which the mother lives
for formal paternity establishment, Bright Start typically defers to
the formal process, rejects the application for genetic testing, and
closes the Bright Start case.
Even if Bright Start does not find an active child support case, the
case manager takes the first opportunity to clearly ask whether
the parents have applied for public assistance. Bright Start
typically opens a case before any type of DCS case is open.
4. Sends closure letters to couples that Bright Start cannot
serve. Couples who already have paternity established or have a
formal paternity establishment process underway, receive Bright
Start closure letters.
5. Calls eligible mothers to determine convenient testing
times and locations. Unmarried mothers without established
paternity and no formal establishment activity underway are
eligible for the free genetic test. The Bright Start manager calls
each applicant mother to verify the application’s details and
ensure continued interest in the test by both parties. If there is
continued interest, the manager will inquire about convenient or
specific testing times and locations (e.g. before or after work) for
the mother and man and pass this information on to the genetic
test vendor for final scheduling. Appendix A includes letters from
the vendor and Bright Start to illustrate. If appropriate, couples

Bright Start Genetic Testing Evaluation ECONorthwest Page 2-5
are offered separate testing locations. The state’s vendor has been
able to accommodate a range of requests, including out of state and
tests of military personnel stationed overseas, though this has not
yet been requested. Bright Start was generally satisfied with the
vendor’s ability to establish testing sites across the state. Based on
discussions with couples, Bright Start’s manager reports that
while work conflicts, inclement weather, and the distance to
testing locations are barriers to participation, unresponsiveness by
the mother or man is the most prevalent barrier. Bright Start was
generally satisfied with the vendor’s ability to establish testing
sites across the state.
Figure 2-1, below, displays a flowchart of the application process.

Page 2-6 ECONorthwest Bright Start Genetic Testing Evaluation
Figure 2-1: Bright Start Process

Bright Start Genetic Testing Evaluation ECONorthwest Page 2-7
GENETIC TESTING Bright Start forwarded completed test applications to its testing vendor.
The vendor operates a large network of laboratories and testing sites
worldwide and has more than 28,000 employees.
The vendor was responsible for scheduling the test at a testing location
reasonably near the applicants. During the Bright Start demonstration, the
vendor established an appropriate number of sites in Tacoma, Fife, and
Vancouver but struggled initially in Yakima area, which delayed the
program’s implementation in that region. As Bright Start expanded in 2008
to Seattle, Olympia, Spokane, Moses Lake, and the Tri-Cities area, the
vendor encountered little difficulty in finding new sites. The vendor has used
a variety of venues including child support and prosecuting attorneys’ offices,
hospitals, and vendor-owned clinics. Bright Start’s manager has not sensed
hesitation by non-child support clients to visit child support or prosecuting
attorneys’ offices.
With applicants’ preferences in hand, the vendor would notify couples of
the specific time and location of the test (or tests). Again, the vendor could
accommodate different testing locations for geographically separated couples.
The DNA samples were obtained using a buccal swab method. The sample
is collected by swabbing the inner facial cheek—or buccal cavity—with a
sterile cotton swab. The company reports its DNA tests are highly accurate
and that they typically exclude 99.99% of men who are not the true biological
father.
The vendor distributed findings to the mother, putative father, and the
Bright Start program. A summary findings report identifies the tested
parties, the date of the test, and whether the putative father was included or
excluded. The vendor maintains the results for seven years.
POST-TEST PROCESSES To date, a relatively high share of couples report to their first assigned
testing date.1 Bright Start has been lenient with first time “no shows” for
testing. The Bright Start manager calls the parties, explores why they were
unable to make the appointment, and requests preferences for a rescheduled
test. Bright Start tolerates as many as two “no shows” per couple before
closing a case.
In cases in which a couple completes a test and the man is excluded as
father, Bright Start allows the mother to apply for testing with another man.
However, Bright Start will not authorize genetic testing for multiple men
simultaneously.
1 The next chapter provides details on the share of couples that show up for their
tests.
Page 2-8 ECONorthwest Bright Start Genetic Testing Evaluation
For cases in which a test includes the man as father, Bright Start sends
the man a paternity affidavit and an information booklet entitled Establish
Paternity for Your Child’s Sake to encourage voluntary paternity
establishment. The paternity establishment outcomes for included fathers
are discussed in the next chapter.
OWNERSHIP AND SUBSEQUENT USES OF THE GENETIC TEST
FINDINGS At the outset of the demonstration, Bright Start’s manager weighed the
advantages and disadvantages of the ownership and uses of the genetic test
results. On the one hand, Bright Start viewed the test offer as a service to the
parents and considered keeping the findings confidential. Without that
confidentiality, the reasoning went, some uncertain couples would forgo
testing out of fear that the child support agency would learn of paternity and
initiate enforcement actions. On the other hand, the state pays for the tests
and has legitimate downstream interests in the findings should the couple
apply for child support enforcement services.
During the demonstration, the requesting couple essentially governed the
tests. Bright Start had access to the results but did not share with other
agencies unless both parties agreed to release them. Such releases were
executed in two instances during the demonstration.
As Bright Start transitioned from a demonstration to a state-funded
program, managers saw a need to tie the genetic testing program more
closely to the child support program. In the event that the couple does require
child support services in the future, the Bright Start findings could
potentially save the state the cost of identifying and locating the father
and/or the cost of retesting the couple. Without these potential downstream
benefits, managers believed it would be difficult to make the case for on-going
program funding. After consultation with a DCS attorney, Bright Start staff
decided not to receive a copy of the test reports during the demonstration,
although the vendor still considered DCS the “owner” of the reports, and the
program has requested copies of test results on a few occasions. As Bright
Start moved out of its demonstration phase, the state changed the messaging
on the test application to indicate that if the applicants have a case with the
Division of Child Support, Bright Start may give DCS a copy of the test
findings.
With the change, Bright Start’s manager now circles back to the IV-D
system before closing a case and adds a comment to the state’s main child
support database to document the genetic test findings.
CONCLUSIONS From end to end, Bright Start’s manager estimates that a typical genetic
test case requires 60 to 90 minutes of staff work. That includes the upfront
checking of affidavit, child support, and marriage databases, conversing with
one or both parties and occasionally others in the family, forwarding and

Bright Start Genetic Testing Evaluation ECONorthwest Page 2-9
managing the application, and dealing with any post-test issues. For the most
part, the process is straightforward and, as is discussed in the next chapter,
proceeds at a pace that does not deter participation.
The critical point in the process is the hospital. If hospital managers buy
into the program and keep records clerks, social workers, and nurses trained
on the few required procedures, the program runs smoothly. However, if a
hospital loses track of the program, fails to inform new staff, or misplaces
applications, the program is easily derailed. That suggests a key to a
successful process is a very close monitoring of application flow by hospitals
and quick intervention by Bright Start if test applications decline abruptly
without good reason. The intervention can be as simple as a call or site
visit—as it appears that a large majority of hospital staff embrace the genetic
test offer. But in some cases, that offer gets lost during a very crowded and
hectic hospital stay.

Bright Start Genetic Testing Evaluation ECONorthwest Page 3-1
Genetic Test Outcomes Chapter 3 and Applicant Characteristics
INTRODUCTION This chapter describes outcomes from Bright Start’s offer of no-cost genetic tests
to unmarried couples. In most cases, hospital staff extended the test offer to an
unmarried mother and man who chose not to sign a paternity affidavit during their
hospital stay. Bright Start also offered the genetic test applications at Division of
Child Support offices, Community Service Offices, and other venues. Below, we
detail the number and type of referrals, test outcomes, paternity establishment
outcomes after genetic tests, and examine the characteristics of mothers who
requested a test.
GENETIC TESTING APPLICATIONS, REFERRALS, AND
OUTCOMES As described in Chapter 2, the genetic testing application process may begin in
the hospital directly after a child is born or it may begin in a non-hospital setting
months or years after a child is born, though a majority of application forms are
distributed to mothers in the hospital near the time of birth. An applicant is
counted as a referral when a Bright Start manager receives the application for
testing. It is important to note that not all applications are complete when received
by Bright Start and not all complete applications are ultimately referred to the
genetic testing vendor to establish a testing location and date. For example, in
many cases only the mother signed the test application, whereas Bright Start
generally requires both man and mother to sign before making a referral to the
vendor. We describe the genetic testing process, from application to completion in
detail in Chapter 2.
Table 3-1 shows the total number of genetic testing referrals between May 2006
and May 2009. Out of 620 total applicants, 16% (100 referrals) did not complete
the testing process. Incomplete applications resulted from a variety of
circumstances. Some applicants were rejected because paternity had been
established through an affidavit by the time the application was received by
Bright Start. In other cases, the applicant did not confirm a schedule test date. In
others, the applicant did not show up for the test itself. Of the remaining 520
completed applications, 82% (426 applications) ultimately confirmed the tested
man as the biological father, while 18% (94 applications) excluded the man.
Fourteen applicants requested one or more additional tests after a potential father
was excluded by a genetic test. Of the twelve mothers requesting a total of two
tests, 10 of the second tests identified the child’s biological father. Of the two
cases with three tests, only one identified the biological father. Although a
minority of tested men were ultimately determined not to be the biological father

Page 3-2 ECONorthwest Bright Start Genetic Testing Evaluation
of the child, the test outcomes nonetheless suggest that the Bright Start program
helped many couples resolve uncertainty regarding paternity and may have
prevented errors in paternity establishment. From this perspective, even a test that
excludes a man can be considered a success.
Table 3-1: Genetic test applications and test outcomes, May 2006-May 2009
Note: Includes only the final test results for applicants that received more than one test.
Source: Bright Start and Washington State Division of Health
As illustrated in Table 3-2, below, not all mothers referred to the genetic testing
program had recently given birth. This table shows the number of new births as a
share of the total applications for genetic testing. New births constituted 89% of
the applications for genetic testing. The remaining 11% were applications from
mothers who obtained an application from another source (e.g., a DCS office).
Table 3-2: Source of genetic test applications, May 2006-May 2009
Source: Bright Start
After the first round of hospital training visits in Spring 2006, the number of
referrals built for several quarters before reaching a plateau. Figure 3-1 shows the
time trend of genetic test applications per quarter, referred by Bright Start
hospitals between 2006 and 2009. As illustrated, the number of applications rose
quickly for several quarters before declining in late 2007, just over one year after
program implementation. The referral count then held steady well into 2008, at
which point the second cohort of hospitals (hereafter Bright Start II hospitals),
further increasing the total referral count. As a share of total un-established,
unmarried births, at Bright Start hospitals, however, referral rates have remained
at about one or two percent after the initial ramp-up in applications. We use this
range for program take-up rates in our Chapter 4 estimates of the likely costs to
implement the program statewide. As shown below, the take-up rate varied
considerably across hospitals, but was rarely above two percent.

Bright Start Genetic Testing Evaluation ECONorthwest Page 3-3
Figure 3-1: Number of Bright Start referrals, by quarter Q2 2006-Q1 2009
Note: The gray line indicates the time at which Bright Start II hospitals began providing genetic test applications..
Source: Bright Start
TIME AND THE TESTING PROCESS
For all applicants, the time between birth and paternity establishment, and
between each of the steps in the testing process can vary significantly from
referral to referral. The median number of days between a child’s birth and the
time Bright Start received an application was 17; the median time between the
referral and receipt of test results was 44 days. Paternity acknowledgement
following the identification of the biological father took a median of 135 days.
Table 3-3 shows in more detail the time lapse between the application date and
the date test results were received.
Table 3-3: Time between date of referral and receipt of test results for hospital-based applications, May 2006-May 2009
Note: Data based on the 369 completed applications for which we had both a referral data and a test completion date.
Source: Bright Start and Washington Division of Health

Page 3-4 ECONorthwest Bright Start Genetic Testing Evaluation
PATERNITY ESTABLISHMENT OUTCOMES FOR TEST COMPLETERS
Among testing applicants, the data contain every conceivable permutation of
testing outcome and paternity establishment. In 14 cases, Washington’s
Department of Health (DOH) had a paternity affidavit record before the test was
completed. As noted above, this resulted in some couples being denied a test if
Bright Start found evidence of the paternity establishment before referring the
couple to the genetic testing vendor. In most cases for which the data indicate a
filed paternity affidavit, however, paternity establishment followed the
completion of the test. Table 3-4 displays the paternity status 120 days after birth
for children participating in the testing process.1
Table 3-4: Paternity establishment for completed genetic tests, Bright Start hospitals, May 2006-May 2009
Paternity
Established
Paternity Not
Established Total % Established
Included 72 144 216 33%
Excluded 3 44 47 6%
Total 75 188 263 29% Note: Only those tests completed within 120 days of child’s birth were used in analysis
Source: Bright Start and Washington State Division of Health
As illustrated, a majority of the children subject to testing had not had paternity
established within the 120-day window regardless of whether or not the results
indicated that the tested man was the child’s biological father. While this 29%
paternity establishment rate is low when compared to the statewide hospital-based
paternity establishment rate—56% within 90 days of birth during 2009—the
target population for the genetic test offer is actually the remaining 44% of
parents who do not establish paternity soon after birth. Seen in this light, even the
much lower establishment rate for test takers is indicative of paternity
establishments that would not have occurred in the absence of the testing
program.
Among 216 completed tests that identified the tested man as biological father, 72
of the tested men acknowledged paternity within 120 days of birth. While a
majority of exclusions did not result in paternity establishment, as might be
expected, there were 15 cases for which paternity was established after the genetic
test resulting in exclusion. Assuming that a man other than the one tested signed
the paternity affidavit in these cases, we again find evidence that the genetic test
offer has improved establishment outcomes, although we do not have sufficient
data to prove this conclusively and, as we note elsewhere, it is likely that an
excluded man occasionally acknowledges paternity despite strong evidence
contradicting the acknowledgement.
1 For this report, DOH provided birth record and paternity establishment data through September 2009. This allows a four-month follow-up
period for the last births eligible for the testing offered by Bright Start in May of 2009. Thus we restrict the analysis here to 120 days after birth, although a handful of affidavits may ultimately be signed after 120 days.

Bright Start Genetic Testing Evaluation ECONorthwest Page 3-5
Figure 3-2 illustrates the “productivity” of referrals at producing paternity
establishments: Of the 535 hospital-based genetic test applications, 444 tests were
completed. Of the completed tests, 363 resulted in inclusions, confirming the
tested man as the tested child’s. Of these 363 men, 101 ultimately signed a
paternity affidavit, for approximately one paternity establishment every 5
referrals. Again, we cannot prove that the test results necessarily caused the father
to acknowledge paternity, but the results are suggestive.
Due to the timing of data collection, these data do not reflect the total number of
paternity affidavits eventually signed after parents receive test results. In many
cases, as discussed below, there is a significant lapse between the time the
applicants receive the test results and the time an affidavit is signed. Because our
analysis includes referrals collected through May 2009, the available data do not
allow us to track paternity establishment related to the most recent referrals
beyond about four months, but the number of such delayed establishments is
likely to be fairly small.
Figure 3-2: Paternity established as a share of total genetic testing applications, Bright Start hospitals, May 2006-May 2009
Source: Bright Start and Washington State Division of Health
DEMOGRAPHIC CHARACTERISTICS OF MOTHERS WHO
APPLIED FOR A GENETIC TEST In the Update Evaluation of the Bright Start Demonstration Program, completed
in September 2009 as part of the Bright Start evaluation, ECONorthwest
identified demographic characteristics that helped to predict hospital-based
paternity establishment. This section examines a similar set of demographic
characteristics of mothers requesting a genetic test. Differences in the
demographic characteristics of these mothers may suggest that certain
subpopulations are either more uncertain about the paternity of their child or are
more likely to accept a no-cost offer that can definitively determine biological
paternity of their child.

Page 3-6 ECONorthwest Bright Start Genetic Testing Evaluation
RACE AND ETHNICITY
In general, the 33% of applicants identifying as non-white mothers appear
relatively less likely to request a genetic test than are white mothers, although the
difference varies by race (see Figure 3-3). Among the pool of applicants, the share
of mothers in the “other race” category is small compared to the share of “other
race” mothers among all unmarried mothers in the analysis. The share of Black
mothers among applicants is, on the other hand, slightly higher than that of Black
mothers among all unmarried mothers.
As described in our companion evaluation reports, unmarried African American
mothers give birth to children who are, all else equal, over 16 percentage points
less likely to have paternity established through the birth hospital. Although the
difference is not large, the fact African American mothers are relatively more
prevalent among test applicants suggests the possibility that greater uncertainty
about paternity explains the large impact of being an African American mother on
the likelihood of paternity establishment.
Figure 3-3: Mother’s race for genetic test applicants and by paternity establishment status at Bright Start hospitals, May 2006-May 2009
Notes: The data include only births during those months for which Bright Start services had been available at
each hospital. The chart reflects data from the 518 applicant mothers for which DOH was able to provide demographic data. Number of births includes mothers of all races.
Source: Bright Start and Washington State Division of Health
Figure 3-4 displays the share of Hispanic mothers among applicants, and among
all unmarried mothers who did and did not complete a paternity affidavit at the
hospital. The pattern resembles that displayed above in Figure 3-3. Namely, non-
Hispanics make up a larger share of applicants (81%) than they do of either group
of mothers of Hispanic origin represented in the genetic test applicant group. Our
analysis of paternity establishment determinants found that the children of
Hispanic mothers were significantly more likely to have paternity established than
were the children of other mothers. That relatively fewer Hispanic mothers
request a genetic test supports the implication that these mothers have less
uncertainty about the paternity of their children.

Bright Start Genetic Testing Evaluation ECONorthwest Page 3-7
Figure 3-4: Share of unmarried mothers classified as Hispanic for test applicants and by paternity establishment status at Bright Start hospitals, May 2006-May 2009
Notes: The data include only births during those months for which Bright Start services had been available at each hospital. The chart reflects data from the 518 applicant mothers for which DOH was able to provide
demographic data.
Source: Bright Start and Washington State Division of Health
EDUCATIONAL ATTAINMENT
When compared to mothers foregoing paternity establishment, applicants for
genetic testing were 7 percentage points more likely to have a high school
education or better, as illustrated in Figure 3-5. Overall, applicant mothers appear
more similar to mothers of children who ultimately had paternity established than
to mothers of children who did not. The primary difference between applicants
and the “not established” group is the six percentage point difference between the
share of mothers with post-high school education (33% versus 27%).
This pattern suggests, but does not prove, that more educated mothers are more
willing to engage in the genetic test process, all else equal. It is also possible that,
among mothers with great uncertainty about paternity, more educated mothers are
more likely to request a test than are less educated mothers—a subtle but
important difference.

Page 3-8 ECONorthwest Bright Start Genetic Testing Evaluation
Figure 3-5: Mother’s educational attainment of genetic test applicants and by paternity establishment status at Bright Start hospitals, May 2006-May 2009
Notes: The data include only births during those months for which Bright Start services had been available at
each hospital. The chart reflects data from the 518 applicant mothers for which DOH was able to provide demographic data.
Source: Bright Start and Washington State Division of Health
PRESENCE OF OTHER LIVING CHILDREN
Another indicator of attitudes with respect to paternity is whether a mother had
other living children at the time of her new baby’s birth. Figure 3-6 shows the
share of unmarried mothers who reported having other children at the time of
birth.
Figure 3-6: Presence of other living children of genetic test applicants and by paternity establishment status at Bright Start hospitals, May 2006-May 2009
Source: Bright Start and Washington State Division of Health

Bright Start Genetic Testing Evaluation ECONorthwest Page 3-9
Mothers with prior children make up a smaller proportion—by six percentage
points—of test applicants than of all unmarried mothers giving birth at Bright
Start hospitals. This pattern reinforces the findings from our regression analysis,
and suggests that these experienced mothers are either less concerned about
paternity establishment, less uncertain about the paternity of their children, or
both.
TEST OUTCOMES BY MOTHER’S DEMOGRAPHIC CHARACTERISTICS
Table 3-5 provides another look at test outcomes broken down by the
demographic characteristics of applicant mothers. The table illustrates a number
of interesting features of the data with respect to test completion and paternity
establishment.
Table 3-5: Test outcomes and paternity status by mother’s characteristics for genetic test applicants who gave birth at Bright Start hospitals, May 2006-May 2009
Source: Bright Start and Washington State Division of Health
For example, not only are Hispanic mothers relatively less likely to request a
genetic test, they are also less likely than average to complete the test after
applying (77% versus 84%). Mothers with educational attainment beyond high
school were relatively more likely to complete the test (87%). Because of the
small sample size for most sub-groups, we view the differences implied in table 3-
5 as suggestive and worthy of future investigation, but not conclusive regarding
propensity to take a genetic test or the level of uncertainty surrounding paternity.
HOSPITAL DETAIL We conclude this chapter with a look at detailed test outcomes for each of the
Bright Start hospitals. Table 3-6 displays counts for unmarried births and genetic
test referrals at each Bright Start hospital during the demonstration. For Bright
Start I hospitals, the table includes all unmarried births from May 2006 through
May 2009. For Bright Start II, the included period covers August 2008 through

Page 3-10 ECONorthwest Bright Start Genetic Testing Evaluation
May 2009.2 The table also includes outcome information for the referrals and the
hospital-based paternity establishment rate for comparison purposes.
Table 3-6: Number of Referrals by Hospital
Source: Bright Start and Washington State Division of Health
Although the relationship is not strong, hospitals with higher genetic test referral
rates tend to have higher paternity establishment rates. Legacy Salmon Creek, for
example has the highest referral take-up rate as well as a paternity establishment
rate well above average. This is counterintuitive in the sense that a higher in-
hospital rate implies a smaller pool of potential test applicants. On the other hand,
as with the paternity program overall, we suspect that greater attention to the
testing program is likely to produce a greater flow of referrals. This implies that
hospitals with robust paternity acknowledgement programs will also have produce
a robust flow of genetic testing referrals.
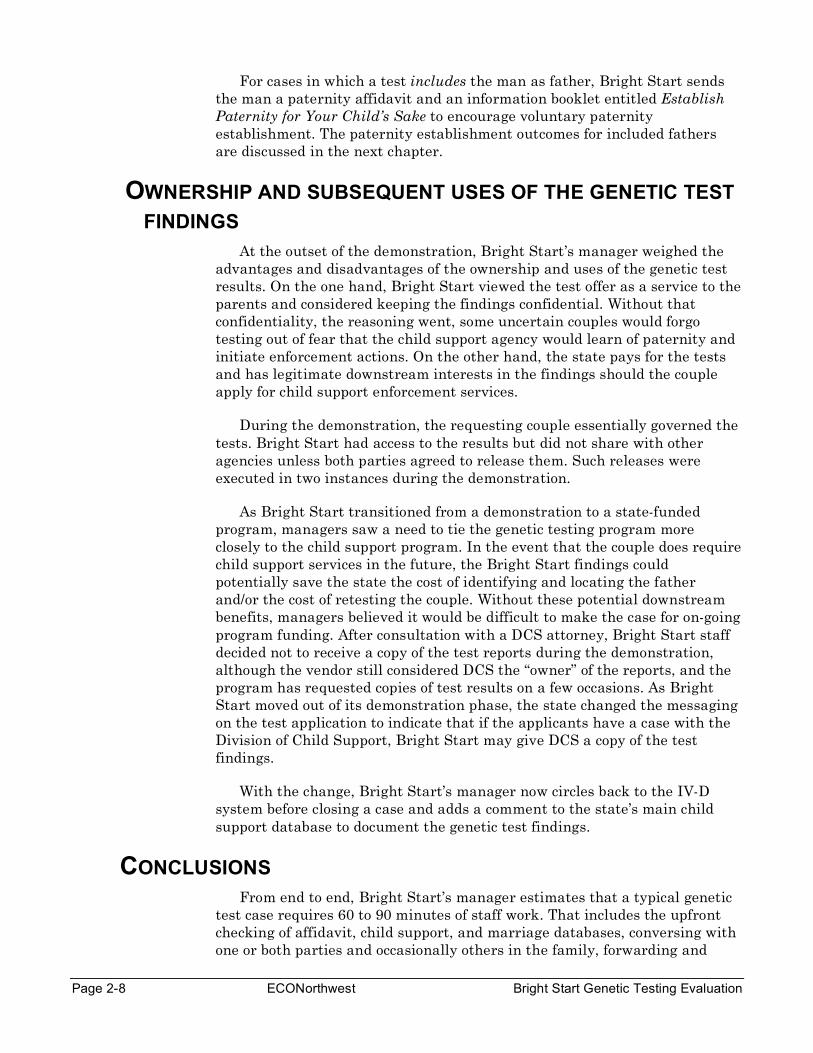
Figure 3-7 displays the referral rate data visually. The figure includes hospitals of
very different scale (see Table 3-6), so some comparisons can be misleading. But
2Bright Start II hospitals may have implemented the program a month or two later than August 2008. The table also includes the two hospitals selected for the second cohort but that never received the initial training—Evergreen and Group Health Centralia.
Bright Start Genetic Testing Evaluation ECONorthwest Page 3-11
there is clearly a wide range of take-up rates across the hospitals, with most
hospitals substantially above or below the Bright Start average of 1.4%. While
demographic differences in the patients seen at each hospital likely affect referral
rates, and we do not know whether an optimal referral rate exists, the data suggest
that parents, children, and the Division of Child Support benefit from the genetic
testing program and that greater effort at low-referral rate hospitals would likely
yield greater benefits.
Figure 3-7: Genetic Test Referral Rate for Bright Start Hospitals
Source: Bright Start and Washington State Division of Health
Bright Start
average: 1.4%


Bright Start Genetic Testing Evaluation ECONorthwest Page 4-1
Cost Estimates for Chapter 4 Statewide Implementation
INTRODUCTION By all accounts, no-cost genetic testing has been among the most
successful of the strategies deployed during the Bright Start demonstration
to encourage voluntary, appropriate paternity establishment. Hospital staff
supports the program almost without exception. In addition, a small but
measurable share of unmarried mothers has received important information
about the biological paternity of their children through the genetic tests
facilitated by Bright Start. The federal government recognized this success by
funding a fourth year of Bright Start. At the conclusion of this fourth
program year, Washington State anticipates implementing no-cost genetic
testing statewide.
This section uses the test outcome data described in Chapter 3 to update
the staffing and funding estimates for the annual cost of statewide
implementation of this program. These estimates will also provide a sense of
scale to child support agencies in other states that are contemplating a
similar genetic testing program. Understanding the likely magnitude of
program costs is critical, particularly given the fiscal crisis facing most states
over the next several years. In addition, highlighting the program’s relatively
low cost helps to bolster the case for implementing this type of program, as it
may ultimately save states a significant amount of money by reducing the
number of court-ordered paternity establishments in future years.
STATEWIDE IMPLEMENTATION To estimate program cost, we consider the cost of the genetic tests
themselves and the staffing needed to facilitate the expected number of test
requests. We estimate the number of requests using Bright Start referral
data applied to a simple forecast for the number of unmarried births in
calendar years 2010 and 2011.
UNMARRIED BIRTHS
The number of unmarried births rose sharply during the first three years
of Bright Start, increasing by an average of 5.8 percent per year in each of
2006, 2007, and 2008. As of September 2009, however, this trend appears to
have reversed completely, with unmarried births in January through
September of 2009 2.5 percent below the total unmarried births during the
same period in 2008. In the calculations below, we assume that the 2009
numbers reflect a significant slowing in the number of unmarried births
during 2009, but that 2010 and 2011 totals will produce slight increases in
unmarried births relative to 2009 (see Figure 4-1).

Page 4-2 ECONorthwest Bright Start Genetic Testing Evaluation
Figure 4-1: Actual and predicted number of unmarried births in Washington State, 2004-2011
*Estimated based on data through September 2009.
Notes: The totals include the approximately one percent of unmarried births registered with the state that do not occur at a birthing hospital.
Source: ECONorthwest
TAKE-UP RATE
Chapter 3 illustrates the wide variability in take-up rates across
demonstration hospitals—from zero to about six percent of unmarried births.
Some of this variation could result from inter-hospital differences in mothers’
certainty about paternity, but we attribute most of the variation to
differences in how each hospital handles the genetic test offer.
The overall take-up rate at the first cohort of Bright Start hospitals was
1.5 percent of unmarried births, with a noticeable acceleration several
months after implementation. The second cohort produced relatively fewer
referrals, at a take-up rate of 1.0 percent of unmarried births, for a combined
average of 1.3 percent during the demonstration. Two of the hospitals in the
second cohort, however, had not even fully engaged with the program before
the end of the demonstration. Nonetheless, at the conclusion of Bright Start,
it was too early to tell whether the second cohort would also increase the
take-up rate over time like the first cohort did. Based on these data, we

Bright Start Genetic Testing Evaluation ECONorthwest Page 4-3
calculate program cost using an in-hospital take-up rate of between 1.3 and
2.0 percent of all unmarried births.1
Bright Start also offered tests to applicants who found out about the
program through non-hospital sources such as child support offices. Clearly,
program eligibility policy will determine the potential number of these
additional referrals. Based on Bright Start outcomes and an assumption that
Washington’s statewide program will operate using similar guidelines as
Bright Start, we predict the total number of referrals to be 15 percent higher
than the in-hospital total, resulting in a take-up rate of between 1.5 and 2.30
percent of all unmarried births. Of the referrals received by Bright Start, 83
percent resulted in a completed test, and in our calculations we apply the
same percentage.
Table 4-1 displays our predicted number of referrals and completed tests
in 2010 and 2011 for the low (1.15 percent) and high (2.30 percent) take-up
rate scenarios.
Table 4-1: Predicted number of genetic test referrals and completed tests in 2010 and 2011
2010 2011
Unmarried births 30,137 30,497
Referrals (low) 451 456
Referrals (high) 693 701
Completed tests (low) 374 378
Completed tests (high) 575 582
Source: ECONorthwest
TESTING AND STAFFING COSTS
The state pays its genetic testing vendor significantly less per test than
parents would have to pay to obtain a test themselves. We do not know
whether Washington’s existing vendor contract will continue under similar
terms or whether the declining cost of testing generally will necessarily affect
the terms of future contracts with genetic testing vendors. Below, we assume
that the state will pay $130 for each completed test, close to the actual
amount paid during Bright Start. Based on Table 4-1, we anticipate a
statewide testing cost of between $48,600 and $75,700 annually during 2010
and 2011.
Based on conversations with Bright Start staff, we estimate referral
processing, follow-up, and additional phone support for interested parents
would require between about 0.75 FTE of a management analyst at current
referral volumes of about 320 referrals per year ((the rate observed during
1 As in Figure 4-1, we include in our calculations unmarried births that did not occur at a birthing hospital. Such births
typically account for about one percent of all unmarried births.
Page 4-4 ECONorthwest Bright Start Genetic Testing Evaluation
the last ten months of the demonstration). We estimate that the high and
low-referral scenarios would require between 1.1 and 1.6 management
analyst FTE, respectively, with total staff costs expected to be approximately
$55,000 in salary and benefits per FTE. In addition, the genetic test program
requires program management to oversee staff, field calls from other agencies
(e.g., prosecuting attorneys within Washington or child support staff in other
states), and so on. We estimate the statewide program would require 0.15
FTE of a program manager at approximately $78,000 per FTE.2
In total, staff resources add between $70,000 and $101,000 to annual
program cost, depending on volume. The genetic testing program would
therefore cost between $304 and $317 per test, with a higher test volume
corresponding to lower cost per test because the staff overhead is allocated
over more completed tests.
FOLLOW-UP COSTS
The testing results described in Chapter 3 suggest that, while the genetic
test offer may have resolved parents’ uncertainty about the paternity of their
child, many did not follow through and formally establish paternity after
receiving their test results. This fact indicates that child support staff may
have the ability to further increase paternity establishment through
additional follow-up with parents. For cases where a man was excluded, the
program guidelines allow an additional test for the mother and another man.
Through experience processing the hundreds of test referrals provided by
Bright Start, staff believe that targeted “second efforts” to follow-up with
parents who have identified a child’s biological father but have not signed a
paternity acknowledgement would prove beneficial.
Clearly, these efforts would require staff resources to contact parents,
discuss paternity related issues, and possibly mail mothers additional
paternity-related documents. These second efforts were not part of the
Bright Start demonstration and we do not have precise data on their likely
cost. Assuming that these second efforts would add an average of 15 percent
to the cost per case, the total cost per completed test would cost between $350
and $365.
CONCLUSIONS The hospital-based offer of genetic testing is a natural complement to
Washington’s voluntary paternity acknowledgement program. As the state
has succeeded in extending the acknowledgement offer to nearly all unwed
mothers and their partners, hospital staff inherently come across mothers
who are uncertain about the paternity of their new child. Washington’s
prosecuting attorneys—a one-time opponent of the voluntary
2 The program manager would likely be the same individual running the broader paternity acknowledgement program.
Running the broader program would likely absorb the balance of the program manager’s time.

Bright Start Genetic Testing Evaluation ECONorthwest Page 4-5
acknowledgement program—have been concerned that some men, absent a
genetic test and more formal establishment processes, would acknowledge
paternity in instances in which they were not the biological fathers. And
hospital staff noted that in those cases in which couples expressed doubts
about paternity, they had little tangible advice for those couples about how to
proceed.
Both the attorneys and hospital staff view the genetic test offer as an
improvement to the broader acknowledgement process. To those uncertain
parents, the offer sends a strong signal that acknowledging paternity is an
important decision with lifelong consequences and that the state is willing to
invest resources upfront to ensure that the couple makes that decision with
the best information possible. To date, about one in five men who have taken
the genetic test has been excluded as the biological father, thereby resolving
a degree of uncertainty about paternity for the tested children. Absent a
control group, however, we do not know how many of these men may have
inappropriately signed a paternity acknowledgement in the absence of testing
nor do we know how many men determined to be a child’s biological father
would have signed an acknowledgement without the genetic test. !
As Washington expands the program to other hospitals, and other states
consider implementing a similar program, key questions revolve around how
to proceed as efficiently as possible. As a demonstration, Washington appears
to have landed on a reasonably efficient process in its first attempt. The
demands on the hospital are modest and are limited to identifying potentially
interested couples, disseminating an application, and, in some cases,
dropping the application in the outgoing mail. Other states may consider on-
site testing at the time of birth; however, in Washington’s context that was
more than managers were comfortable asking of their hospital partners. !
Despite a very simple process, Washington nonetheless found varied
outcomes across hospitals that were too large to be explained by socio-
economic differences alone. The genetic testing offer, though simple, can still
get lost in the clatter of an emotional, exhausting, brief, and information-
heavy hospital stay. As with the voluntary acknowledgement process, high
turnover can undercut the effectiveness of the program if incoming staff are
unaware the offer exists. Applications can go missing. The program is more
likely to be successful if it is reintroduced and reinforced with annual, on-site
visits that are coordinated with brief trainings on the paternity
acknowledgement and, ideally, birth certificate programs. !
Given that several weeks can elapse between the application date and the
actual test, Bright Start’s 83 percent completion rate3 exceeded expectations.
It conveys that couples value the opportunity. The high completion rate also
speaks to the timely and careful processing of applications by state staff.
3 That is, completed tests divided by total applications. Some of the incompletes were applicants deemed ineligible by
Bright Start (e.g., DOH had a paternity acknowledgement on file for the child at the time Bright Start received the
application).!

Page 4-6 ECONorthwest Bright Start Genetic Testing Evaluation
Those who implement the program should anticipate a wide range of
complexity of applications. Easier applications may take well under an hour
to process, contact, and refer to the vendor. Others, given the nature of the
matter, can take hours and can involve conversations not only with the
mother and putative father, but also parents or other relatives of the couple.
In this demonstration, case managers were patient with applicants and spent
time on the phone explaining the process and its consequences, often to
multiple parties. !
The selection of vendor and convenience of testing sites is also critical.
Applicants—who are disproportionately younger and from lower-income
households—may forgo the test if it involves long travel or a need to take
significant time off of work. Washington perceived only one problem with test
site availability, and that was relatively early in the demonstration.
Thereafter, state managers were generally pleased with the vendor’s ability
to provide flexible options for couples, including testing some parties out of
state and even overseas. !
With the test completed and findings known to the state and the parties,
Washington can improve upon the subsequent steps in the process. Based on
available data, testing found 431 men to be the biological fathers, yet records
show only 166 paternities acknowledged. And, a handful of those
acknowledgements may have been for men for whom the test excluded
paternity. !
While the instances will be rare, the state will occasionally come across
excluded fathers who nonetheless acknowledge paternity. This raises an
important ethical question: Should the state actively counsel couples with
negative results, but with paternity acknowledged, to take the legal steps
necessary to nullify the acknowledgement, or at least announce the
consequences of not doing so?!
In all those instances in which included fathers fail to acknowledge
paternity, the state may incur downstream confusion and costs. Tested
couples—with positive results—may enter the child support system a year or
more later with paternity not established and a hazy recollection that the
government provided a genetic test. Despite Washington’s best efforts, some
of those cases will inevitably slip through the cracks and head down a costly,
and wholly unnecessary, court-based paternity establishment process. !
Washington already routinely checks administrative databases to ensure
the program does not provide genetic tests for men who have already
acknowledged paternity. As budgets and staffing recover from the current
fiscal crisis, the state may consider focused follow-up efforts and track closely
the reasons why some couples—despite a positive test result—fail to take the
next step and establish paternity. The state will also have to perfect its
processes to ensure that state-funded test results on non-IVD couples are
shared with IVD if a couple subsequently enters the system.!

Bright Start Genetic Testing Evaluation ECONorthwest Page 4-7
Just how much the state invests in the follow-up efforts depends on the
goals of the program. If the program is designed primarily to get the right
information in the hands of unwed couples, then limited follow-up efforts
could be justified. However, if the goal is paternity establishment, then the
state needs to work more actively with couples who receive positive test
results. In Washington’s case, the Bright Start demonstration initially
focused on getting the right test information to parents and essentially
expected they would put it to good use. But as the program transitions from a
pilot to a permanent program, Washington expects better outcomes on
paternity establishments. The findings here suggest the state will have to
invest some additional resources on follow-up to achieve those outcomes.!


Bright Start Genetic Testing Evaluation ECONorthwest Page A-1
Appendix A Bright Start Process Details
This appendix includes Bright Start documentation referenced in
Chapter 2. The exhibits below illustrate three components of the Bright Start
genetic testing program: the application form, the Bright Start management
information system, and letters relating to test processing.
Exhibit 1: Bright Start Application Brochure (front)
Exhibit 2: Bright Start Application Brochure (back)

Page A-2 ECONorthwest Bright Start Genetic Testing Evaluation
Exhibit 3: Bright Start Information Management System
Exhibit 4: Bright Start Information Management System, cont’d

Bright Start Genetic Testing Evaluation ECONorthwest Page A-3
Exhibit 5: Bright Start Information Management System, cont’d
Exhibit 6: Bright Start Information Management System, cont’d

Page A-4 ECONorthwest Bright Start Genetic Testing Evaluation
Exhibit 7: Bright Start Testing notification letter

Bright Start Genetic Testing Evaluation ECONorthwest Page A-5
Exhibit 8: Genetic Testing Vendor Notification Letter