Embed Size (px)
Citation preview
Introduction
Lubricants (oils and greases) used in industrial plants typically start off as a base oil. Most lubricant oils are formulated with 70%–99% base oil with the rest being additives to impart desirable characteristics. Greases typically have 70%–94% base oil. The American Petroleum Institute (API) has categorized base oils refined from petroleum crude oil into three categories based upon the properties of the product. The least refined, lowest performing products are classified as ‘Group I’ while the highly processed, most expensive, and highest performing products are ‘Group III’.
The composition of the base oil has a significant effect on the quality, blending potential and possible applications for the product. While these oils may contain hundreds of individual compounds, it is typically sufficient to quantitate classes of compounds rather than identify and quantitate each compounds separately to ascertain quality. The most common method for these determinations in additive-free base oil is ASTM D7419 which measures total aromatics and total saturates using high performance liquid chromatography (HPLC) with refractive index detection.
Evaluation of the Agilent 1260 LC system for analysis of base oils, as specified by ASTM D7419
Application note
Authors
Sue D’Antonio Agilent Technologies Cedar Creek, TX, USA
Greg Hunlen Agilent Technologies Alpharetta, GA, USA
Petrochemical
2
Experimental
InstrumentationThe Agilent 1260 Infinity HPLC system was used for this analysis. The following components were used:
• Agilent 1260 Infinity Quaternary Pump (G1311B)
• Agilent 1260 Infinity Standard Autosampler (G1329B)
• Agilent 1290 Infinity Column Compartment (G1316C) with valve drive installed (#058)
• Agilent 1200 Infinity Series Quick Change 2-position/6-port Valve (G4231A).
• Agilent 1260 Infinity Refractive Index Detector (G1362A)
• Agilent 1260 Infinity Variable Wavelength Detector (G1314F) s standards flow cell (G1314-60083)
• Open Lab Chromatography Data System
Columns2 x Agilent ZORBAX SIL 9.4 x 250 mm, 5 µm, Part number: 880952-201
1 x Agilent ZORBAX CN 9.4 x 250 mm, 5 µm, B12246
Mobile phase conditions Heptane (HPLC Grade) @ 3.0 mL/min
Calibration standards and samplesCalibration standards and test samples were prepared as prescribed in ASTM D7419 using reagent grade hexadecane and octadecylbenzene in HPLC grade heptane with Class A volumetric glassware. An analytical balance capable of weighing to ±0.0001 g was used in the preparation of these solutions.
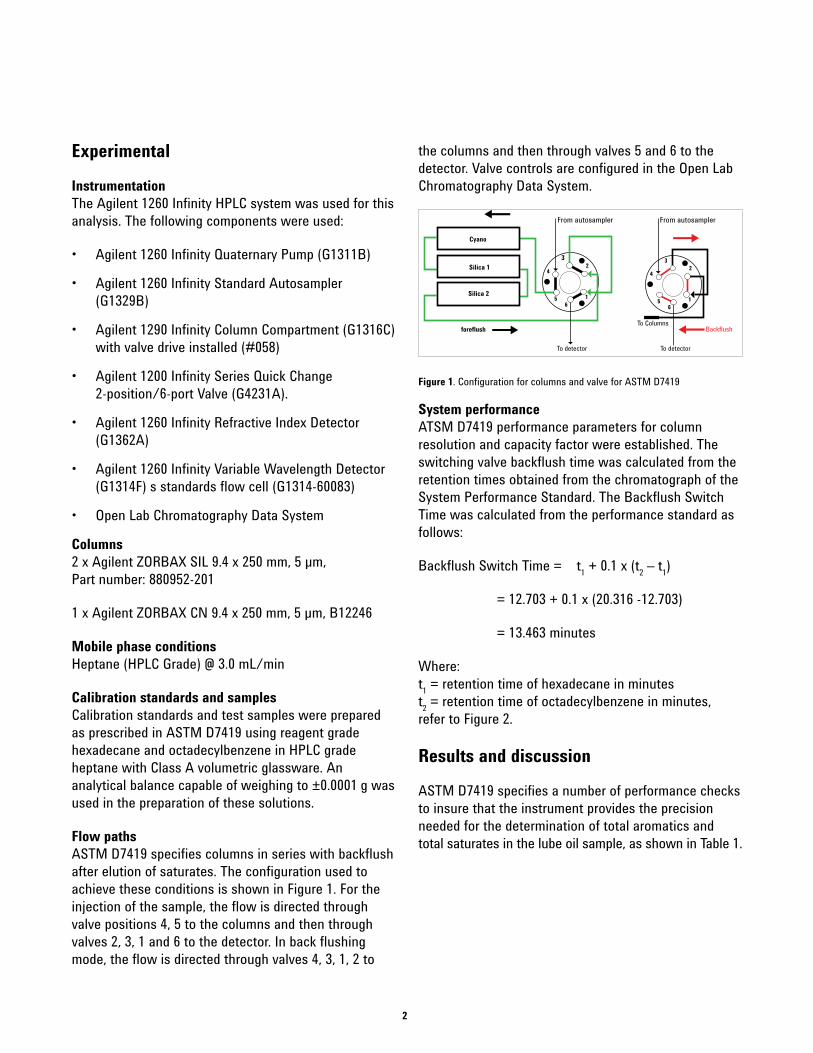
Flow paths ASTM D7419 specifies columns in series with backflush after elution of saturates. The configuration used to achieve these conditions is shown in Figure 1. For the injection of the sample, the flow is directed through valve positions 4, 5 to the columns and then through valves 2, 3, 1 and 6 to the detector. In back flushing mode, the flow is directed through valves 4, 3, 1, 2 to
the columns and then through valves 5 and 6 to the detector. Valve controls are configured in the Open Lab Chromatography Data System.
1
23
4
56
1
23
4
56
foreflush
To detector
BackflushTo Columns
Cyano
Silica 1
Silica 2
From autosampler From autosampler
To detector
Figure 1. Configuration for columns and valve for ASTM D7419
System performanceATSM D7419 performance parameters for column resolution and capacity factor were established. The switching valve backflush time was calculated from the retention times obtained from the chromatograph of the System Performance Standard. The Backflush Switch Time was calculated from the performance standard as follows:
Backflush Switch Time = t1 + 0.1 x (t2 – t1)
= 12.703 + 0.1 x (20.316 -12.703)
= 13.463 minutes
Where: t1 = retention time of hexadecane in minutes t2 = retention time of octadecylbenzene in minutes, refer to Figure 2.
Results and discussion
ASTM D7419 specifies a number of performance checks to insure that the instrument provides the precision needed for the determination of total aromatics and total saturates in the lube oil sample, as shown in Table 1.
3
Table 1. ASTM D7419 performance requirements
Performance area Requirement D7419-13 Section
Resolution ≥ 5 9.3Capacity factor ≥ 0.4 9.3Signal to noise at ≥ 10 μL injection volume ≥ 8 9.6
Short term precision fore flush mode < 0.6% RSD 12.3
Calibration Linear, forced through origin with a correlation coefficient > 0.999
10.4
Aromatic response factor 1.67–1.8 13.1Std at 0.1 mass% analyses for octadecylbenzene <0.15 mass % 9.7.3
A system performance standard was prepared according to section 9.3.1 of the ASTM method by weighing hexadecane (1.0 ± 0.1 g) and octadecylbenzene (1.0 ± 0.1 g) into a 10 mL volumetric flask and filling to the mark with heptane. This solution was then used to obtain the typical results for each of the quality checks that are shown below:
Requirement: Resolution ≥ 5Resolution is calculated by:
2 x (T2 - T1) Resolution = ———— 3 x (y1 + y2)
Where: T1 = Retention time of hexadecane peakT2 = Retention time of the octadecylbenzene peaky1 = Peak width at ½ height of hexadecane peaky2 = Peak width at ½ height of the octadecylbenzene
peakSubstituting values obtained for the chromatogram in Figure 2 gives:
2 x (20.316 - 12.703) Resolution = ———————— 3 x (0.11081 + 0.31815)
= 12
Therefore, the system resolution exceeds the ASTM requirement.
Figure 2. Chromatogram of the system performance standard
Requirement: Capacity factor ≥ 0.4The capacity factor (K) is calculated from the chromatogram using the equation:
T2 - T1 K = ———— T1
Where T1 is the retention time of the hexadecane peak and T2 is the retention time for the octadecylbenzene peak. Substituting values obtained from the chromatogram in Figure 2 into this equation gives:
20.316 - 12.703 = ———— 12.703
= 0.6
Therefore, the capacity factor exceeds the ASTM method requirement.
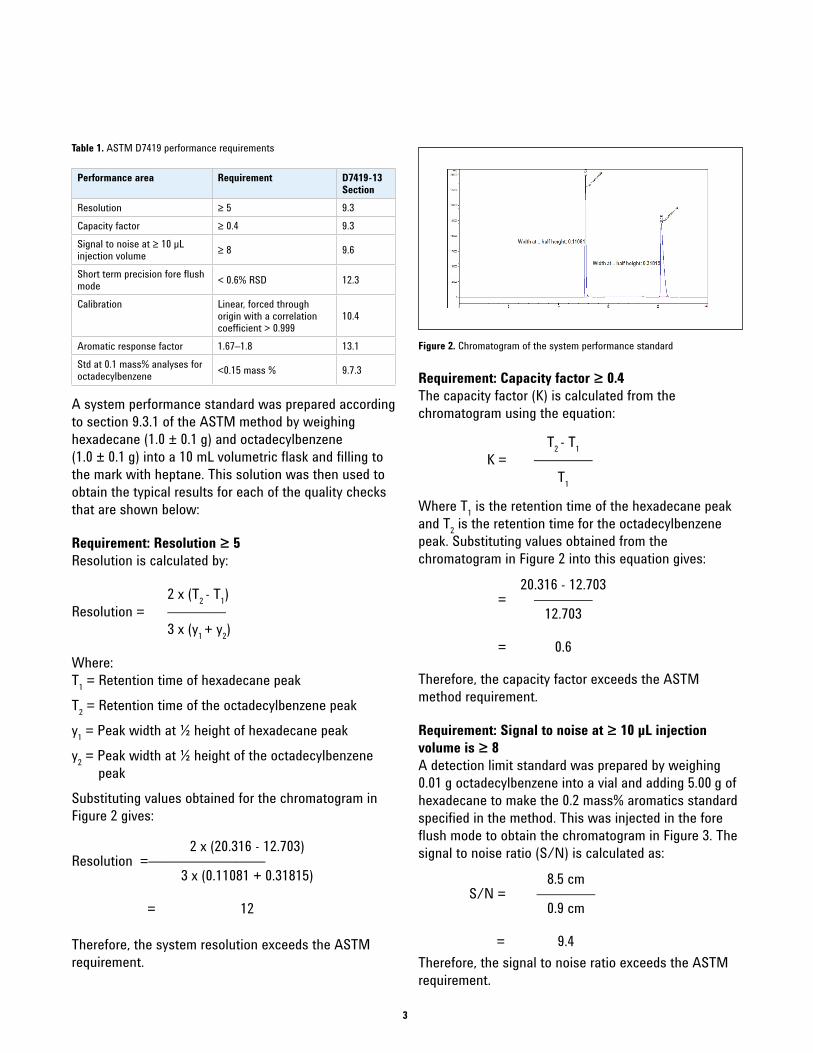
Requirement: Signal to noise at ≥ 10 µL injection volume is ≥ 8A detection limit standard was prepared by weighing 0.01 g octadecylbenzene into a vial and adding 5.00 g of hexadecane to make the 0.2 mass% aromatics standard specified in the method. This was injected in the fore flush mode to obtain the chromatogram in Figure 3. The signal to noise ratio (S/N) is calculated as:
8.5 cm S/N = ———— 0.9 cm
= 9.4Therefore, the signal to noise ratio exceeds the ASTM requirement.
4
Figure 3. Chromatogram for Signal to Noise Calculation
Figure 4. Overlay for 5 chromatograms of the system performance standard in fore flush mode
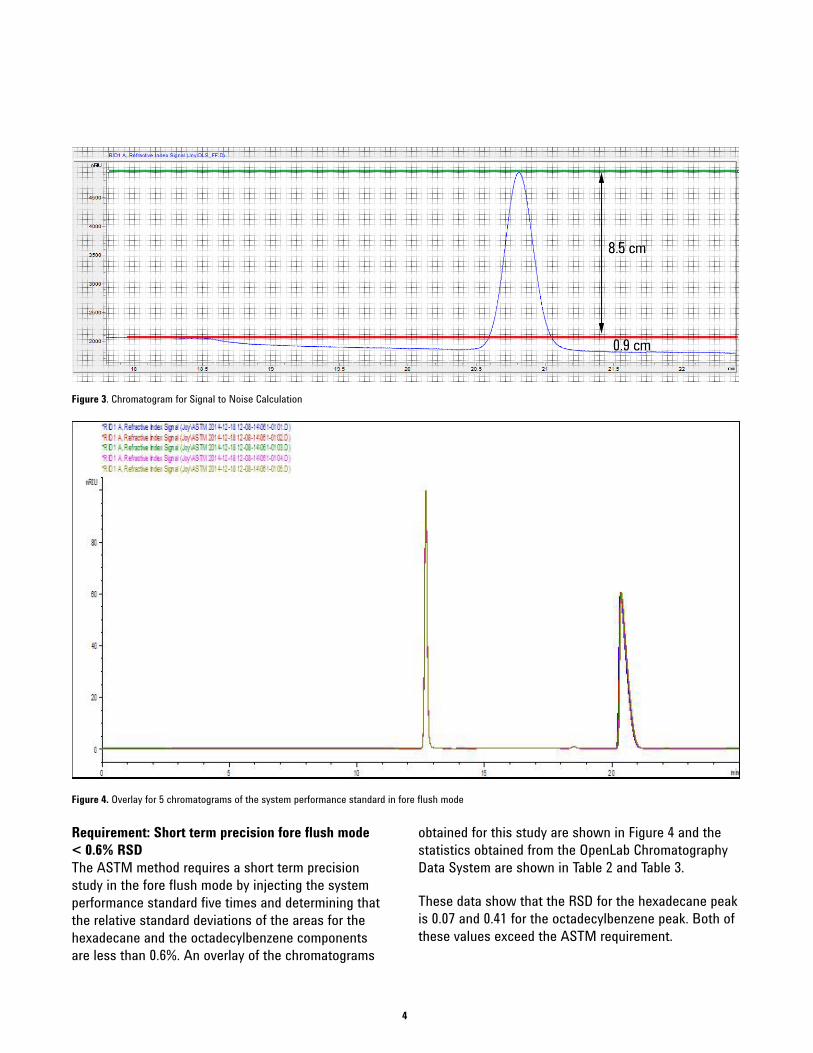
Requirement: Short term precision fore flush mode < 0.6% RSDThe ASTM method requires a short term precision study in the fore flush mode by injecting the system performance standard five times and determining that the relative standard deviations of the areas for the hexadecane and the octadecylbenzene components are less than 0.6%. An overlay of the chromatograms
obtained for this study are shown in Figure 4 and the statistics obtained from the OpenLab Chromatography Data System are shown in Table 2 and Table 3.
These data show that the RSD for the hexadecane peak is 0.07 and 0.41 for the octadecylbenzene peak. Both of these values exceed the ASTM requirement.
5
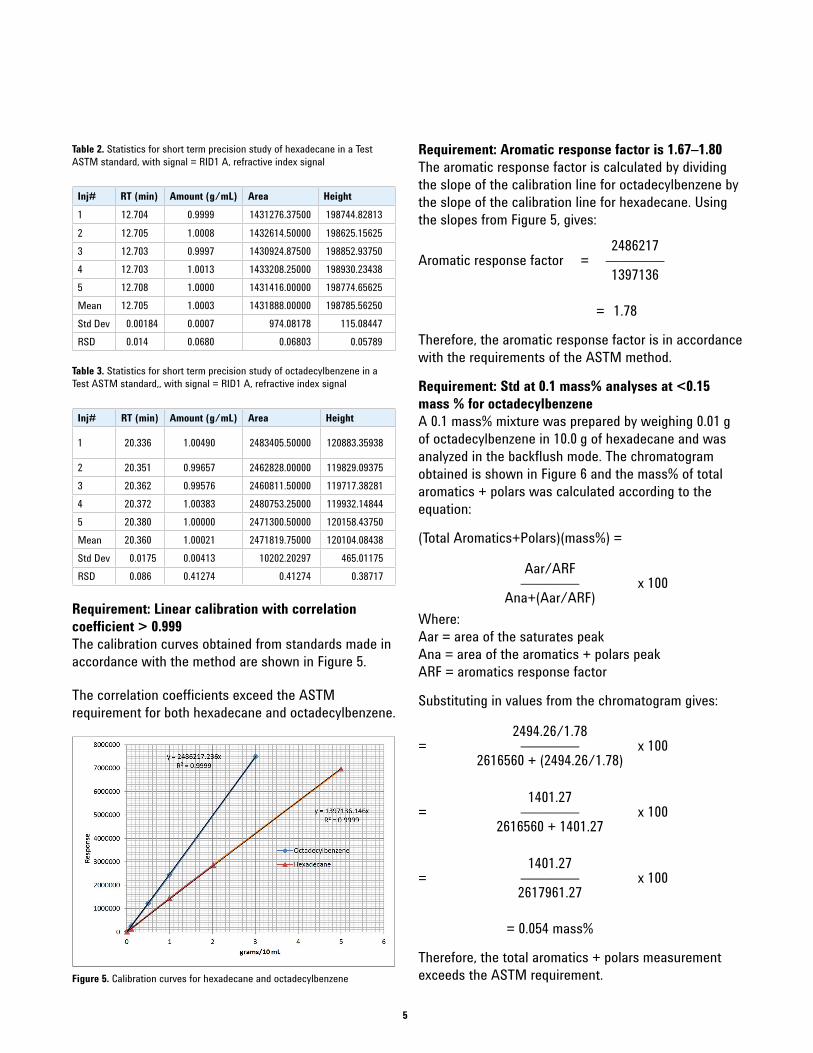
Table 2. Statistics for short term precision study of hexadecane in a Test ASTM standard, with signal = RID1 A, refractive index signal
Inj# RT (min) Amount (g/mL) Area Height1 12.704 0.9999 1431276.37500 198744.828132 12.705 1.0008 1432614.50000 198625.156253 12.703 0.9997 1430924.87500 198852.937504 12.703 1.0013 1433208.25000 198930.234385 12.708 1.0000 1431416.00000 198774.65625Mean 12.705 1.0003 1431888.00000 198785.56250Std Dev 0.00184 0.0007 974.08178 115.08447RSD 0.014 0.0680 0.06803 0.05789
Table 3. Statistics for short term precision study of octadecylbenzene in a Test ASTM standard,, with signal = RID1 A, refractive index signal
Inj# RT (min) Amount (g/mL) Area Height
1 20.336 1.00490 2483405.50000 120883.35938
2 20.351 0.99657 2462828.00000 119829.093753 20.362 0.99576 2460811.50000 119717.382814 20.372 1.00383 2480753.25000 119932.148445 20.380 1.00000 2471300.50000 120158.43750Mean 20.360 1.00021 2471819.75000 120104.08438Std Dev 0.0175 0.00413 10202.20297 465.01175RSD 0.086 0.41274 0.41274 0.38717
Requirement: Linear calibration with correlation coefficient > 0.999The calibration curves obtained from standards made in accordance with the method are shown in Figure 5.
The correlation coefficients exceed the ASTM requirement for both hexadecane and octadecylbenzene.
Figure 5. Calibration curves for hexadecane and octadecylbenzene
Requirement: Aromatic response factor is 1.67–1.80The aromatic response factor is calculated by dividing the slope of the calibration line for octadecylbenzene by the slope of the calibration line for hexadecane. Using the slopes from Figure 5, gives:
2486217 Aromatic response factor = ———— 1397136
= 1.78
Therefore, the aromatic response factor is in accordance with the requirements of the ASTM method.
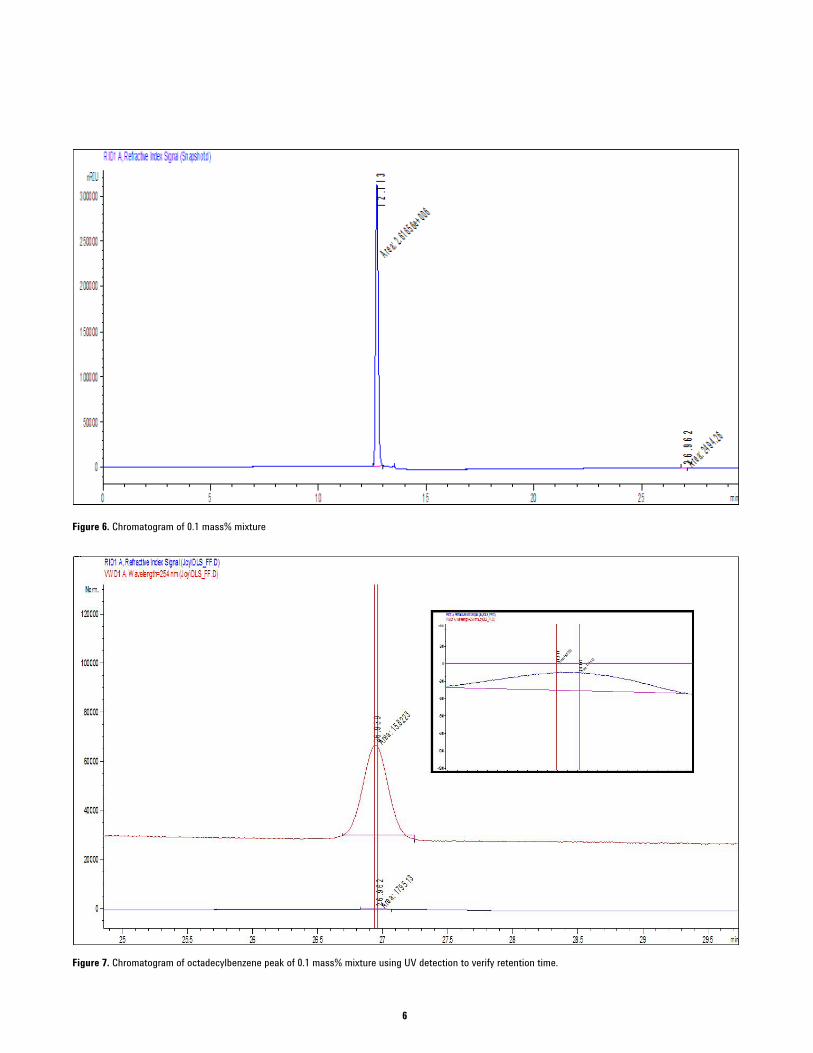
Requirement: Std at 0.1 mass% analyses at <0.15 mass % for octadecylbenzene A 0.1 mass% mixture was prepared by weighing 0.01 g of octadecylbenzene in 10.0 g of hexadecane and was analyzed in the backflush mode. The chromatogram obtained is shown in Figure 6 and the mass% of total aromatics + polars was calculated according to the equation:
(Total Aromatics+Polars)(mass%) =
Aar/ARF ———— x 100 Ana+(Aar/ARF) Where: Aar = area of the saturates peak Ana = area of the aromatics + polars peak ARF = aromatics response factor
Substituting in values from the chromatogram gives:
2494.26/1.78 = ———— x 100 2616560 + (2494.26/1.78)
1401.27 = ———— x 100 2616560 + 1401.27
1401.27 = ———— x 100 2617961.27
= 0.054 mass%
Therefore, the total aromatics + polars measurement exceeds the ASTM requirement.
6
Figure 6. Chromatogram of 0.1 mass% mixture
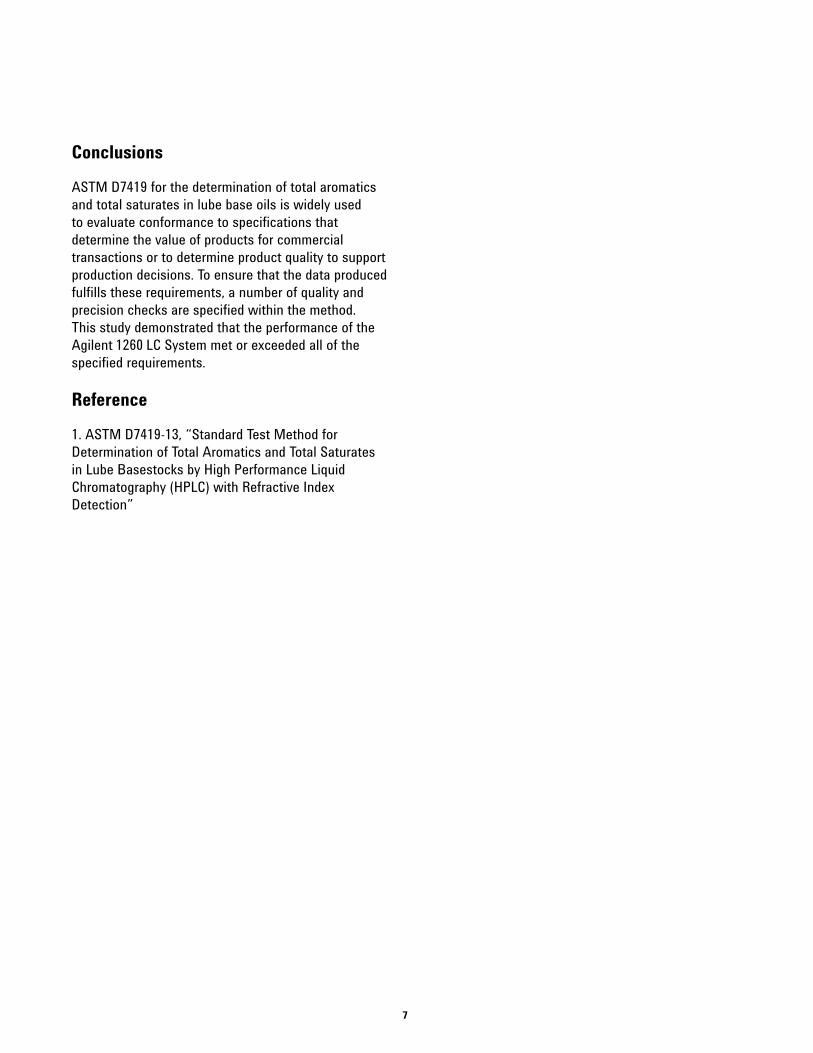
Figure 7. Chromatogram of octadecylbenzene peak of 0.1 mass% mixture using UV detection to verify retention time.
7
Conclusions
ASTM D7419 for the determination of total aromatics and total saturates in lube base oils is widely used to evaluate conformance to specifications that determine the value of products for commercial transactions or to determine product quality to support production decisions. To ensure that the data produced fulfills these requirements, a number of quality and precision checks are specified within the method. This study demonstrated that the performance of the Agilent 1260 LC System met or exceeded all of the specified requirements.
Reference
1. ASTM D7419-13, “Standard Test Method for Determination of Total Aromatics and Total Saturates in Lube Basestocks by High Performance Liquid Chromatography (HPLC) with Refractive Index Detection”

www.agilent.com/chemAgilent shall not be liable for errors contained herein or for incidental or consequential
damages in connection with the furnishing, performance or use of this material.
Information, descriptions, and specifications in this publication are subject to change without notice.
© Agilent Technologies, Inc. 2015Published May 1st, 2015
Publication number: 5991-5577EN