Embed Size (px)
Citation preview
Evaluation of the 1998 Flagship Course on Health Sector Reform and Sustainable Financing
William A. Eckert Fumika Ouchi
49069P
ublic
Dis
clos
ure
Aut
horiz
edP
ublic
Dis
clos
ure
Aut
horiz
edP
ublic
Dis
clos
ure
Aut
horiz
edP
ublic
Dis
clos
ure
Aut
horiz
edP
ublic
Dis
clos
ure
Aut
horiz
edP
ublic
Dis
clos
ure
Aut
horiz
edP
ublic
Dis
clos
ure
Aut
horiz
edP
ublic
Dis
clos
ure
Aut
horiz
ed

Evaluation of the 1998 WBI Flagship Course on Health Sector Reform and Sustainable Financing
William A. Eckert Fumika Ouchi
WBI Evaluation Studies Number ES99-33
World Bank Institute The World Bank Washington, D.C.

Table of Contents
Page
Executive Summary ....................................................................................................... i
PART I: Introduction ..................................................................................................... 1
PART II: Course Objectives .......................................................................................... 3 Overall Course Objectives ........................................................................................... 3 Objec~ives by Module .................................................................................................. 3
PART III: Evaluation Design and Methods ................................................................... 5 Evaluation Objectives .................................................................................................. 5 Evaluation Study Design ............................................................................................. 5 Data Collection Methods ............................................................................................. 6 Analytical Methods ...................................................................................................... 7 Study Limitations ......................................................................................................... 8
PART IV: Evaluation Results ..................................... : ................................................ 11 Descriptive Evaluation Results .................................................................................. 11
A. Respondent Demographics .............................................................................. 11 B. Criteria Selection .............................................................................................. 13 C. Course Expectations ........................................................................................ 13
Formative Evaluation Results .................................................................................... 14 A. Learning Outcomes .......................................................................................... 16 B. Participant Reaction ......................................................................................... 19 C. Cross-Item Analysis ......................................................................................... 30 D. Multivariate Model Analysis .............................................................................. 33
PART V: Findings and Conclusions .......................................................................... 39
ANNEXES: Annex A: Description of the 1998 Flagship Program Course Modules ....................... 45 Annex B: Description of Analytical Methods .............................................................. 47 Annex C: Ratings on Evaluation Feedback Sessions and Distance Learning ............ 49 Annex D: By-Module Ratings Tables ......................................................................... 51 Annex E: Correlation Analysis Results ...................................................................... 65 Annex F: Multivariate Model Analysis ........................................................................ 69


Executive Summary
I ntrod uction
The Human Development (HD) group of the World Bank Institute (WBI) held its second core course on Health Sector Reform and Sustainable Financing in Washington, D.C. from October 21 to November 20, 1998. The 4-week course consisted of 9 separate Modules designed to provide an intensive and comprehensive learning program for government policy makers, public and private sector implementers of health reforms, and World Bank staff. Course material was developed and updated by internal experts and external partners from academic institutions. The courses used an evidence-based approach, with an overview of the topic followed by country case studies that included lessons learned and best practices utilized in World Bank-sponsored projects and other reform efforts. This approach was supplemented by various types of pedagogical methods, including lectures, small group work sessions, panel discussions, and computer exercises. Module 1 also used a distance learning modality; information was sent to participants in advance of the course, and two days were then spent reviewing these materials.
An evaluation of the Flagship Course was conducted by the Evaluation Unit (WBIES) of the WBI, in cooperation with project staff from the HD group. Descriptive, formative, and summative evaluation methods were used to address two key questions: 1) What did participants learn from the course?, and 2) How satisfied were they with the course? These questions applied to the course in its entirety and to each specific module. A total of 89 course participants out of 103 enrolled (86.4 percent) participated in some phase of the evaluation.
Evaluation Methodology
Several design strategies were used to answer key evaluation questions about individual modules and the overall course, including a randomized pre/post design for measuring learning gain among partiCipants. Data for the evaluation were collected through a number of different types of methods and instruments. These included pre and post cognitive tests, end-of-activity questionnaires for each module and for the overall course, and a survey to compile data on the demographics of participants. All questionnaires used in the evaluation were linked through a system of blind identification codes. There were also in-course feedback sessions to help staff make the modules more effective as the course was being carried out.
Both qualitative and quantitative methods were used to analyze the data. Qualitative methods consisted of content analyses and summaries of responses. The quantitative methods consisted of summary indicators, such as arithmetic means for central tendency, standard deviations for distribution, and percentages. Additionally, a number of statistical tests were applied to these data. Correlation tests were used to measure associations among various indicators, and means tests were used to determine before/after differences in the cognitive learning tests. Two multivariate statistical models were used simultaneously to measure the effects of several variables on learning outcomes. A least squares regression model was constructed to examine the interactions among characteristics of the participant population, such as gender and work experience, on learning gain. Logit regression models were developed to look at the effects of these same characteristics on test scores before and after the course.

1998 Flagship Course on Health Sector Reform and Sustainable Financing
Principal Findings
Findings are reported according to the three general types of evaluation methods used: descriptive, formative, and summative. Each of these methods addresses, in some way, the key evaluation questions of participants' learning and satisfaction. Specific results from each method are reported in the main body of this report.
Generally, it can be concluded that this course met its main objectives. There is strong and consistent evidence that learning did occur among participants as a result of course and module presentations. Most modules showed statistically significant learning gains. Participants also appear to have been satisfied with the course. Ratings across modules were generally high for both course content and presentations by course trainers. Support services, such as hotel accommodations, were well regarded by participants and received consistently high ratings.
1. Descriptive Evaluation Results
Data for the descriptive evaluation were obtained through a demographic survey of participants. Primary information was asked about gender, training in economics, and years of relevant work experience. Results from this survey were compared with the same information from the 1997 pilot course.
On three demographic indicators, there were noticeable changes in participants' characteristics between 1997 and 1998. In 1998 there were more females, more participants without degrees in economics, and less work experience in the health sector. These factors may be important in explaining degrees of learning and satisfaction with various aspects of the course.
2. Formative Evaluation Results
The primary means for developing formative information that could be relayed to course staff during operations was the in-course feedback sessions. These were structured group interviews conducted by the Evaluation Unit after approximately one day of module instruction. The information about module operations was summarized and given to module presenters and course staff to use in making adjustments to each module.
Several consistent issues emerged from these feedback sessions. First, participants were concerned that course time was not managed well, causing a rush at the end of the day to cover all material. Next, perhaps reflecting the large number without degrees in economics, participants felt that technical terms were not sufficiently explained. Third, they expressed an interest in hearing more relevant country or regional examples. Finally, participants expressed the need for more discussion time and the opportunity to ask questions. The staff took actions to address these concerns.
3. Cognitive Test Results
Cognitive tests designed to measure learning were used in seven of the nine modules offered in the Flagship Course. These tests were administered in pre and post-course formats, with sets of randomly assigned questions administered before and after the module. This method effectively eliminates external factors that may influence test results, so that any change between pre and post tests can be attributed to participation in the module. From these test results, there is strong evidence that extensive learning occurred in four of the seven modules. Increases from pre to post test were statistically significant in Modules 3, 4/5, 7, and 8. Module 1 showed a gain that was not statistically significant, but this result may still be relevant because that module utilized distance learning.
Several statistical models were constructed to examine the effects on learning of training in economics, work experience, and gender. Both logistic regression and ordinary least squares
ii

1998 Flagship Course on Health Sector Reform and Sustainable Financing
regression models were applied to each module and across the entire course. Results show that while each of these factors was significant in explaining variation for specific modules and for the course, there was no consistent effect across modules for any of these factors.
4. Participant Satisfaction
The satisfaction benchmark used in the 1997 pilot Flagship Course was that 66 percent of respondents would score in the 5 to 6 range on a six-point scale. The 1998 course evaluation changed that criterion to 75 percent scoring 4 to 5 on a five-point scale. From the satisfaction survey results, it appears that participants were generally satisfied with individual modules and the overall course. There was some consistent variation among subgroups, with women and those with less work experience expressing different levels of satisfaction with aspects of modules and with the course. Module 6 stands out for the general dissatisfaction expressed by participants with both its content and delivery (see Figure 1).
Figure 1. Results of Three Selected Questions across Modules on a Five-Point Scale
Q4 I.JseIiJness cI case Stl.dy I case Me!hld cll.earing (,\.lSeljnesS r:i exanpes" frr M1)
05 aaity of Traners in Presentaicns 5,-________________________________ -.
i 5 r-------------------------------, 4.41 432
4 3.89
4.3
3.94 4
4.35
3.27
4.12 4.42 4.58 4.35 4.61
4 3.97
I
4.2 3.93 3.81
3.41
3 3
2 2
1 '- '--- '---' __ . '-- '--- --McxiJeMcxiJeMcxiJeMcxiJeMcxiJeM:JcljeMcxiJeMcxiJeMcxiJe ~e MldJe MxiJe ~e Module Module ~e Module MldJe
1 2 3 4-5 6 7 8 9 11 1 2 3 4-5 6 7 8 9 11
Q9 0""",11 Usefunless of the Module 5,-____________________________________ --.
4.47 4.35 4.29
4.44 4.24
4 3.86
3.55
3
2
Module Module Module Module Module Module Module Module Module 1 2 3 4-5 6 7 8 9 11
An analysis was conducted to relate levels of satisfaction with cognitive test outcomes, in order to examine the hypothesis that participants who were more satisfied would learn more. Results support
iii

1998 Flagship Course on Health Sector Reform and Sustainable Financing
the hypothesis, showing some modest correlation between these factors. Module 9, however, appears to be an exception, receiving high scores on satisfaction but showing no gain in learning.
Conclusions
The Flagship Course is an evolving one; it aims at changing and improving individual modules and, consequently, the overall course from year to year. After the pilot course was offered in 1997, and based partially on results from the evaluation of that course, revisions and additions were made for the 1998 offering. Within this framework, the following conclusions can be drawn from the evaluation results:
• There is evidence of significant learning gain, based on results of cognitive tests, which suggests that the course is effective in teaching new skills and relating new information.
• Overall, participants appear to be highly satisfied with the content and delivery of the course and individual modules.
• There was some variation in reaction and performance among participants based on their training in economics, years of experience, and gender, both course-wide and for individual modules. However, there were no consistent differences based on any of these factors.
• A general correlation between performance and satisfaction suggests that good pedagogy may be an important element in learning.
• Some common themes heard during the in-course feedback sessions included the need to make examples more country and regionally relevant, and the over use of technical terms.
• In the distance learning module, Module 1, participants felt they did not have sufficient time to prepare prior to attending the course.
iv

PART I Introduction
Following a pilot course conducted in October 1997, the Human Development (HD) group of the World Bank Institute (WBI) conducted a formal core course on Health Sector Reform and Sustainable Financing in Washington, D.C., from October 21 to November 20, 1998. The course is a key component of HD's Flagship Program on Health Sector Reform and Sustainable Financing. Its objective is to provide all World Bank client countries, as well as Bank staff, with cutting-edge knowledge and skills in the field of health sector development. In addition to conducting a core training course in Washington D.C. every year, the program aims at building the capacity of regional partner institutions and utilizing distance learning methods to reach a global audience.
The core course is a comprehensive learning program targeting government policymakers, public and private sector implementers of health sector development, donor country representatives, and Bank staff. During an intensive, month-long period of training, participants become familiar with not only the overall framework for health sector development, but a wide' range of options and strategies for health sector reform and financing. Key issues are discussed from the perspectives of efficiency, equity, and sustainability, and messages are delivered using an evidence-based approach. An overview of a particular subject or concept is followed by a number of country case presentations, including best practices and lessons learned from World Bank-sponsored projects and country reforms. Course modules and materials are developed and constantly updated by the Bank's internal experts, as well as by several external partners from academic institutions and multilateral organizations. Currently, a total of 11 one-week modules have been developed for the Washington course.
The course was attended by a total of 103 participants representing 33 countries, including 13 Bank staff, 5 donor representatives, and 19 trainers from institutional partners in the Flagship Program. The course delivered nine of the 11 modules on site. 1 Various types of pedagogical instruments were used throughout the course, including lectures, case studies, small group workshops, panel discussions, computer exercises, and case method exercises. One of the modules (Module 1) was delivered through distance learning prior to the beginning of the course. Learning materials for this module were mailed to participants two months prior to the start of the course, and the time in Washington was spent reviewing key principles and concepts with instructors.
The Evaluation Unit of WBI then evaluated the course using both formative and summative methods. Two key questions were assessed: 1) participants' level of satisfaction with course content, design, and delivery (Level I evaluation); and 2) participants' learning gains in each module (Level II evaluation). A number of different instruments were used to assess course content, design, and delivery: 1) questionnaire forms for each module and for the overall course; 2) an open-ended course expectation survey at the beginning of the course; 3) in-class feedback sessions conducted during the mid-week of each module to make any necessary adjustments or improvements to the course; and 4) two suggestion boxes placed in the breakout room and the lobby area, soliciting comments from participants. Participants' responses were evaluated according to factors determined by a demographic survey: training in economics, experience in the health sector, and gender.
1 Module 10 was not ready in time for the course and was not offered; Modules 4 and 5 were combined into one module.
1998 Flagship Course on Health Sector Reform and Sustainable Financing
The degree of participants' learning gain was assessed using two types of instruments: 1) their selfreported knowledge acquisition for two mandatory modules (Modules 2 and 11), where they were asked at the end of each module how much they felt they learned; and 2) pre and post cognitive tests for all optional modules. One improvement in the evaluation method since the pilot course was the use of an evaluation code number, a three-digit ID number assigned to each participant at the beginning of the course. Participants were asked to write their code on all questionnaires and pre and post tests. This allowed for the linkage of their responses across the various tests and questionnaires.
This report presents the evaluation design and methods used in the course, and the results of the evaluation findings. The paper is divided into five parts. Following the present introduction in Part I, Part II, Course Objectives, describes the overall objectives of the Flagship Course, as well as module-specific objectives. Part III, Evaluation Design and Methods, discusses research designs, data collection methods, and analytical methods used for the course evaluation. Results obtained from the course evaluation, including descriptive, formative, and summative results, are summarized in Part IV, Evaluation Results. The summative evaluation results are discussed in terms of participant learning outcomes, participant reaction to the course, cross item analysis, and multivariate model analysis. Part V, Findings and Conclusions, summarizes key evaluation findings, and presents conclusions and recommendations drawn from the findings.
2

1998 Flagship Course on Health Sector Reform and Sustainable Financing
PART II Course Objectives
During the design process, the course organizer identified specific objectives for the overall course and for each of the 10 modules. This section summarizes the objectives of the entire course, as well as the objectives of each module.
Overall Course Objectives
The overall objectives of the course were broken down into process/implementation and outcome issues, as listed below.
Process/implementation objectives • Treat course topics in depth • Involve participants actively in the course • Provide "what to do" • Provide "how to do" • Provide adequate amount of learning materials • Provide evidence-based learning • Provide adequate amount of country case studies • Provide adequate course length • Use the case method of learning as an effective learning device • Provide feedback opportunities useful to participants • Make feedback sessions effective in improving modules
Outcome objectives • Provide training relevant to participants' work • Provide training that participants would recommend to others • Provide training that meets participants' expectations • Provide training that partiCipants consider useful.
Objectives by Module
Annex A gives a detailed description of each of the nine modules and the pedagogical instruments they used. Two of the nine modules, modules 2 and 11, were mandatory and attended by all partiCipants. The remaining modules were optional; partiCipants selected two modules of interest. Modules 4 and 5 were combined into a joint module (Module 4/5), so there were a total of seven optional modules. The objectives that were common across all modules are listed below.
Common Module Objectives • Provide clear background materials • Provide useful background papers • Provide useful evidence from country studies • Provide useful case studies • Provide trainers knowledgeable about their respective topics • Provide trainers who are clear in their presentations
3
1998 Flagship Course on Health Sector Reform and Sustainable Financing
• Provide trainers who answer participants' questions adequately • Provide training modules relevant to participants' work • Provide training modules considered useful by participants • Provide adequate time for discussion • Provide an adequate level of interaction between participants and trainers • Treat each topic in depth • Assign an adequate amount of reading for the evening.
In addition to these common objectives, all modules except the two that were mandatory had the specific objective of increasing the level of participant learning. These modules attempted to objectively measure the extent of learning through pre and post testing.
4

1998 Flagship Course on Health Sector Reform and Sustainable Financing
PART III Evaluation Design and Methods
Evaluation Objectives
The overall purpose of the evaluation was to provide information to the project managers and course designers to assist them in developing future courses, and to give the Human Development group an indication of the course's effectiveness in the areas of delivery and learning impact. Consistent with this general purpose, the evaluation attempted to meet the following objectives:
1. Develop a profile of participants according to key characteristics
2. Develop information on course performance to feed back to organizers and presenters, for use in making mid-course adjustments
3. Assess the degree to which participants' general expectations were met
4. Assess participants' satisfaction with course execution, content, and delivery
5. Assess the satisfaction of participants with course outcomes (immediate and expected results)
6. Assess the degree to which new knowledge and/or skills were learned during the course
7. Assess the interrelationship between course process and outcome factors, within and across modules
8. Assess the interrelationship among process and outcome factors, and assess learning impact among participants both within and between modules.
These objectives provided the framework and overall direction for conducting the evaluation, and helped determine the degree to which the course met its overall and module-specific objectives. The following sections describe the methodologies used to meet these objectives.
Evaluation Study Design
A mUlti-method approach was used to meet the study objectives. This consisted of descriptive, formative, and summative evaluation strategies.
Descriptive methods were used primarily to profile the participant population. Data for this profile came from a questionnaire administered at the beginning of the course. The information collected consisted of participants' region, years of professional experience in the field of health policy, degrees received in economics, and gender. Figures and graphs were used to display these characteristics. This population was compared with the pilot (1997) participant population on several indicators.
A formative evaluation method was used to meet the second study objective, "Develop information on course performance to feed back to organizers and presenters, for use in making mid-course
5

1998 Flagship Course on Health Sector Reform and Sustainable Financing
adjustments." This consisted of a rapid feedback design to collect information on module performance mid-way through each module. An interview guide was used by the Senior Evaluator to direct the issues and content covered by each group interview. The guide covered:
• Pace of the course • Opportunity to ask questions • Friendliness of the learning environment • Clarity of trainers' presentations • Feeling of involvement in the course • Suggestions to trainers for improving the course • Amount of time allowed for presentations • Participants' views of background papers and other reading materials • Balance among theory, evidence, and exercises.
These areas were selected for their relevance to course operations and their ability to be changed as a result of rapid feedback. All modules except for Module 1 included mid-course interviews. Module 1 was designed and presented as a distance learning course, with only two days reserved for operations. This made it less amenable to mid-course review than the other modules.
The summative evaluations used several designs to assess the process, outcomes, and learning impacts of the course. A post-test only design was used to assess participants' reactions to and opinions of various aspects of the models and the overall course. This design consisted of measuring reactions, attitudes, and opinions immediately after the modules and the course, when participants were assumed to be most aware of process and outcomes for course operations and their immediate effects.
Another design employed in the summative evaluation was a modified pre/post design called a postthen design, which measured learning in modules 2 and 11 by asking participants to rate their understanding of key concepts before and after having participated in the module. It is important to note that both these measures were taken at the same time, after the module had ended. This gave respondents a common point of reference to assess their pre-module levels of understanding of key concepts. One disadvantage of this design was that it measured participants' impressions of their learning achievement, but did not provide an objective measure of that achievement.
In addition, a randomized pre test/post test design was used to measure learning in all modules, except Modules 2 and 11. Course planners and module presenters provided evaluation staff with a set of 30 to 40 multiple choice and true/false questions, to assess the basic ideas and concepts taught in each module. Evaluation staff formatted the questions and then randomly assigned them to 2 groups of 15 questions each. One set of questions was administered at the beginning of the module and the other set at the end. Planners and presenters had no prior knowledge of the question distribution mix, to ensure that they would focus their instruction in a way that would not bias the test results. This gave greater validity to any recorded gains.
Data Collection Methods
Data for both the formative and summative evaluations were collected systematically through a set of structured and unstructured instruments. Many were the same basic instruments used to evaluate the pilot course, modified to meet the specific objectives of the second study. One major difference between the two evaluations was the linking of results across modules. This was achieved by supplying an evaluation code number to each participant. Participants were instructed to enter this number on each evaluation form they completed.
6

1998 Flagship Course on Health Sector Reform and Sustainable Financing
The instruments used to collect data for the evaluation are described below.
• Cognitive-based test questions. Cognitive-based questions were developed for Modules 1, 3, 4/5, 6, 7, 8, and 9. The remaining 2 modules, Modules 2 and 11, did not use this method to measure learning, since the task manager felt that the structure of these modules did not lend itself to this type of testing. Between 30 and 40 multiple choice and true/false questions were developed by the course planners. Then the evaluation staff randomly assigned the questions to two equal groups, and administered one set at the beginning of the module and the other at the end.
• Expectations questionnaire. A questionnaire was administered to all participants at the beginning of the course asking for their two most important expectations. This was an openended questionnaire that allowed participants to express these expectations in terms of their own needs and country experiences. These results were entered into a word processing database for later content analysis.
• Formal in-course feedback group interviews. Formal in-course feedback sessions were conducted by evaluation staff after one and a half to two days, for all modules except Module 1. A structured interview guide was used to conduct the group interviews, and responses were summarized in writing by evaluation staff and provided to course staff and presenters. The summaries included recommendations for making mid-course adjustments to improve module content and delivery.
• Structured end-of-module and end-of-course questionnaires. Structured questionnaires were administered to participants at the end of each module and at the end of the full course. The pilot evaluation had used primarily closed-ended questions, with a six-point Likert-type response scale. The current evaluation, to be consistent with WBl's new evaluation policy, used a similar five-point scale (see below). A common set of questions was included in each questionnaire to measure key features of each module. For the end-of-module questionnaires, these questions related to both the process and outcomes of the session. For one group of questions, the response scale ranged from 1 = minimum to 5 = maximum, and was intended to measure the extent of reaction to specific items. Another group of questions used the same scale, but 1 = insufficient and 5 = excessive, with the intent of measuring how closely the modules came to the optimal score of 3.0. Two modules, 2 and 11, also contained questions on participants' pre and post levels of knowledge on key topics taught in each module.
In addition to these instruments, information for the evaluation was collected through suggestion boxes and staff contact. The suggestion boxes were strategically located throughout the common areas of the training facility. Blank cards were provided and participants were encouraged to comment on issues they believed important. Suggestions were collected twice daily by evaluation staff and provided to project staff as they were received.
The contact between participants and staff took several forms. Both evaluation and project staff were encouraged to interact regularly with participants and pass any information received in this way to senior project planners and presenters. Additionally, participants were told that the Senior Evaluator was independent of staff planners and that he and would maintain the anonymity of any participant wishing to comment on the course. Information obtained by the Senior Evaluator was conveyed daily to senior project planners and presenters.
Analytical Methods
The analytical methods varied according to the types of data collected. The qualitative data consisted of information from suggestions, verbal feedback, open-ended questions on participants' course expectations, and results from in-course feedback sessions. These data were reViewed, their
7
1998 Flagship Course on Health Sector Reform and Sustainable Financing
content analyzed and summarized, and the results presented to course planners and presenters for use in making in-course adjustments or assessing the effects of the training. The open-ended questions contained in the end-of-module and the end-of-course questionnaires were not analyzed for this report because of the time and resources required for this large volume of information. The results, however, have been made available to the course planners.
The quantitative data collected through the structured questionnaires were analyzed using several methods. For many of the scaled responses, respondent frequencies and percentages were computed for each group of questions. The arithmetic mean and standard deviations were also calculated and used as summary indicators of response levels. Three general breakout categories were used with these descriptive data: 1) years of experience, 2) whether the participant held a degree in economics, and (3) gender. Gender was a new category for this year's analysis, reflecting the increased number of female participants.
The analytical methods used with these data were: Pearson's Product-Moment Correlation Test, Student's T-Test, Multiple Regression with Dummy Variables, and Logit Regression. Each method is described in Annex B.
Comparing the results of the current evaluation with those of the pilot was made more difficult by the change in measurement scales. The pilot evaluation used the then-standard six-point Likert-type scale. External and internal WBI research, however, suggested that a five-point scale might be more appropriate. Based on these results, the Evaluation Unit adopted a five-point scale, which was used in this evaluation. Thus any comparison between the two evaluations will also be a comparison between five and six-point scales. In anticipation of this problem, the WBI researchers also developed a method for adjusting these scales so that their results could be compared (Gaur and Eckert, "Evaluating EDI Participant Reactions via Different Response Scales," World Bank Institute, 1998). This adjustment takes the form of a 0.78 addition to the five-point scale results in order to derive its six-point equivalent. Conversely, 0.78 can be subtracted from the six-point scale results to derive its five-point scale equivalent. This adjustment was made for all cross-year comparisons.
The criterion for success used in the pilot evaluation was that at least 66 percent of respondents would fall within the upper scale range of 5 and 6. Because that was a pilot course, the criterion for success in the second course was that 75 percent would score in the 4 to 5 range.
Study Limitations
This evaluation was limited by a number of factors, most of which were the result of attempting to evaluate training activities in a manner that was not overly obtrusive. The major limitations were as follows:
• The scope of the evaluation was limited to an assessment of process (content and delivery) and of the initial and immediate effects of the training provided during the course. The evaluation did not examine the extent to which recruiting objectives were met or whether participants' potential for initiating change in their health systems was considered in recruitment. Nor did the evaluation consider the intermediate or long-term effects of the training. It focused only on the short-term effects of the training-that which could be observed and measured within the one-month training period.
• A limitation of the pilot evaluation was the almost exclusive reliance upon participants' subjective self-assessments to measure learning and changes in knowledge and skill levels. This shortcoming was largely overcome in the current evaluation by the extensive use of cognitive questions, which were randomly assigned to pre and post tests to measure the extent of learning. However, not all modules presented during this year's course used cognitive questions. Modules 2 and 11 relied solely on participants' impressions of how much (or little) they learned.
8

1998 Flagship Course on Health Sector Reform and Sustainable Financing
While these modules were not suited to cognitive testing, the problem of how to objectively measure learning for these modules still remains.
• The cognitive questions were solicited from the course presenters, who were given general guidelines, as described above. However, no effort was made to determine the validity of the questions. It was simply assumed that the presenters would produce valid questions of roughly the same quality. Since this was not verified, differences in the validity and difficulty of questions may have affected test results. For example, questions that were too easy may have resulted in unrealistically high pre and post test scores when there may, in fact, have been little gain in knowledge.
While these limitations were not serious or extensive, they should still be kept in mind when interpreting the evaluation results.
9

1998 Flagship Course on Health Sector Reform and Sustainable Financing
PART IV Evaluation Results
Descriptive Evaluation Results
A. Respondent Demographics
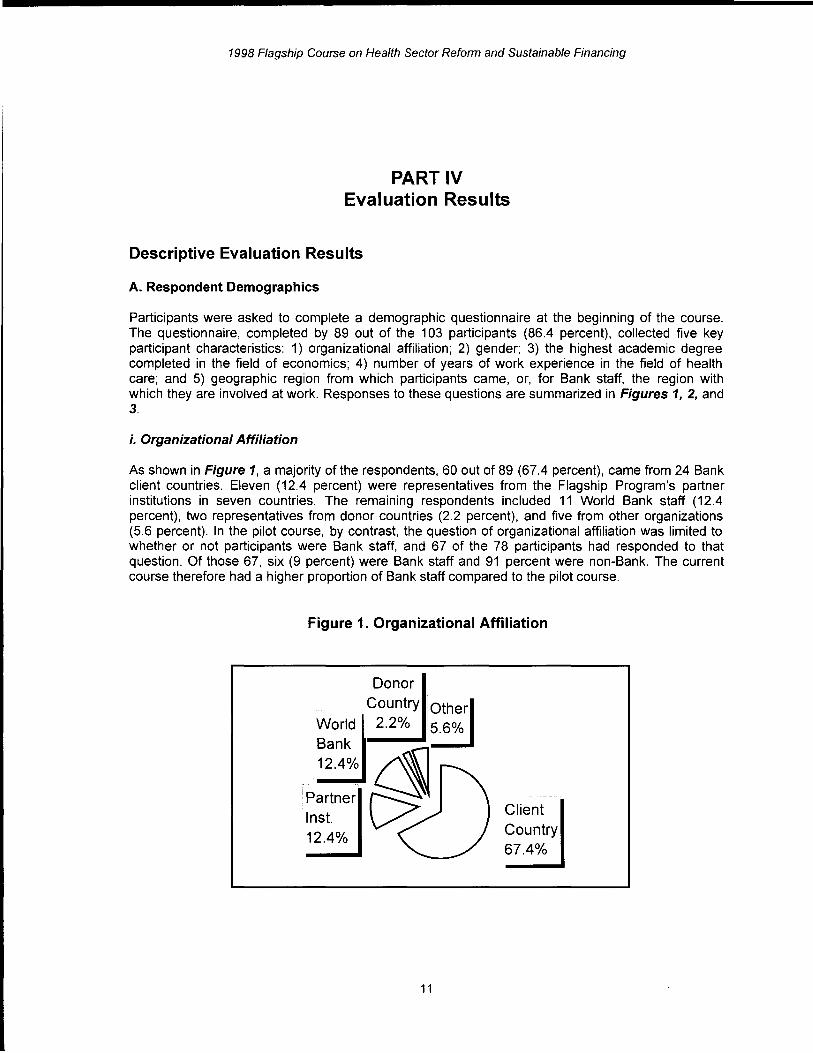
Participants were asked to complete a demographic questionnaire at the beginning of the course. The questionnaire, completed by 89 out of the 103 participants (86.4 percent), collected five key participant characteristics: 1) organizational affiliation; 2) gender; 3) the highest academic degree completed in the field of economics; 4) number of years of work experience in the field of health care; and 5) geographic region from which participants came, or, for Bank staff, the region with which they are involved at work. Responses to these questions are summarized in Figures 1, 2, and 3.
i. Organizational Affiliation
As shown in Figure 1, a majority of the respondents, 60 out of 89 (67.4 percent), came from 24 Bank client countries. Eleven (12.4 percent) were representatives from the Flagship Program's partner institutions in seven countries. The remaining respondents included 11 World Bank staff (12.4 percent), two representatives from donor countries (2.2 percent), and five from other organizations (5.6 percent). In the pilot course, by contrast, the question of organizational affiliation was limited to whether or not participants were Bank staff, and 67 of the 78 participants had responded to that question. Of those 67, six (9 percent) were Bank staff and 91 percent were non-Bank. The current course therefore had a higher proportion of Bank staff compared to the pilot course.
Figure 1. Organizational Affiliation
Donor Country 1
IOther World 2.2% I
15.6% Bank -
12.4%
~I\) i Partner
Inst. Client
12.4% Country 67.4% -
11

1998 Flagship Course on Health Sector Reform and Sustainable Financing
ii. Personal and Professional Characteristics
Figure 2 shows respondents' gender distribution, academic background in economics, and work experience in the field of health care. Results were compared with the same data collected from the pilot course. As in the pilot, a majority of respondents in the current course were men (62.5 percent). However, the proportion of women increased from 20.6 percent in 1997 to 37.5 percent in 1998. The 1998 course consisted of almost an equal number of respondents with a university degree in economics (50.6 percent) and those without an economics degrees (49.4 percent). In the previous course, a majority of respondents had no academic background in economics (62.7 percent). The 1998 course also included more respondents who were relatively new to the field of health care. Approximately 56 percent reported that they had 10 or fewer years of experience in health care. In the 1997 course, by contrast, more than half (51.5 percent) said they had at least 10 years of such experience.
Figure 2. Personal and Professional Characteristics
.l9 100
c: 80 GI "0 c: 60 0 Co
40 1/1
~ 20 ~ •
0
Female Male No Degree Degree in 10 yrs or >10 yrs in Economics less
Economics experience
I [] 1998 course • 1997 course I
iii. Geographic Distribution of Respondents
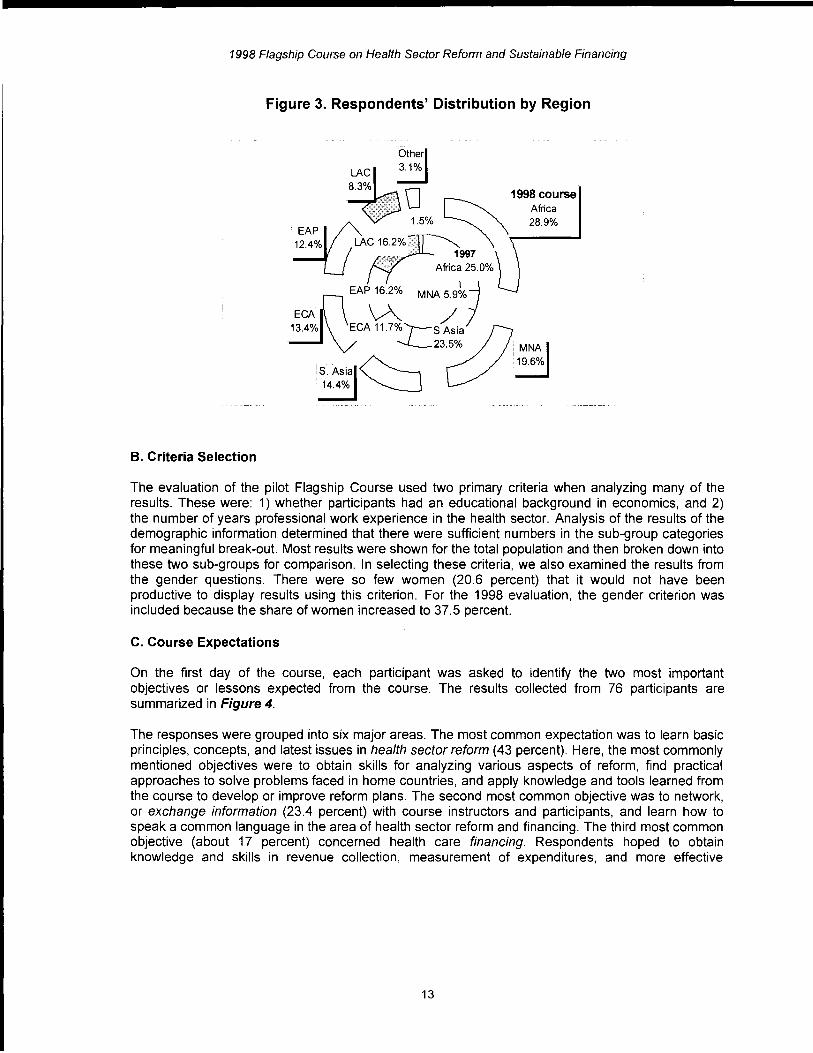
Figure 3 shows the distribution of respondents' home regions, and the regions with which Bank staff were involved in their work. Broken down according to the Bank's six operational regions, 28.9 percent of respondents in the current course were from Africa, 19.6 percent from the Middle East and North Africa (MNA), 14.4 percent from South Asia, 13.4 percent from Europe and Central Asia (ECA), 12.4 percent from East Asia and Pacific (EAP), and 8.3 percent from Latin America and Caribbean (LAC). As in the pilot course, the largest group of respondents (more than 25 percent) was from Africa. The second largest group in 1998, from the MNA region, had accounted for only 5.9 percent in 1997, but increased by nearly threefold in the 1998 course. The ratio of participants from the LAC region, by contrast, fell by almost half, from 16.2 percent in 1997 to 8.3 percent in 1998.
12
1998 Flagship Course on Health Sector Reform and Sustainable Financing
Figure 3. Respondents' Distribution by Region
B. Criteria Selection
EAP ~1998course
Africa 28.9%
1997
EAP 16.2% MNA 5.9~/o ~
ECA~~ /1 13.4% ECA11.7%T--S2JAia
~23.5% : MilA I i • ~ 19.6% IS. ASia 14.4%
The evaluation of the pilot Flagship Course used two primary criteria when analyzing many of the results. These were: 1) whether participants had an educational background in economics, and 2) the number of years professional work experience in the health sector. Analysis of the results of the demographic information determined that there were sufficient numbers in the sub-group categories for meaningful break-out. Most results were shown for the total population and then broken down into these two sub-groups for comparison. In selecting these criteria, we also examined the results from the gender questions. There were so few women (20.6 percent) that it would not have been productive to display results using this criterion. For the 1998 evaluation, the gender criterion was included because the share of women increased to 37.5 percent.
C. Course Expectations
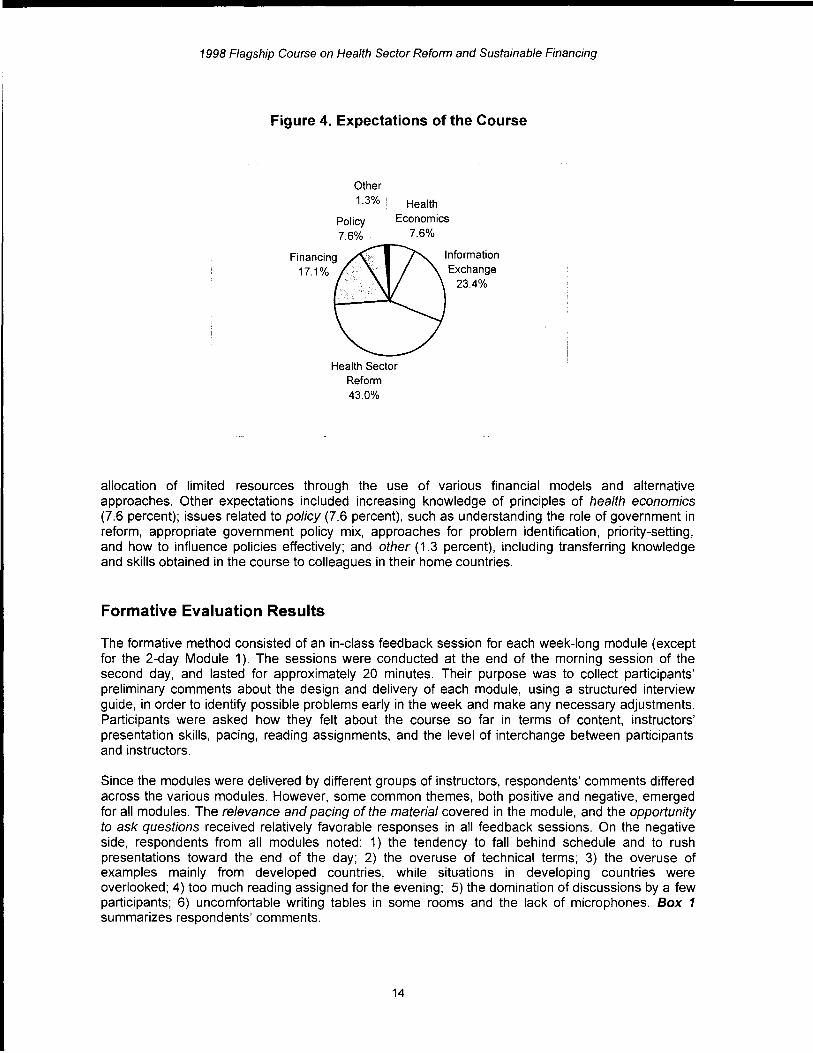
On the first day of the course, each participant was asked to identify the two most important objectives or lessons expected from the course. The results collected from 76 participants are summarized in Figure 4.
The responses were grouped into six major areas. The most common expectation was to learn basic principles, concepts, and latest issues in health sector reform (43 percent). Here, the most commonly mentioned objectives were to obtain skills for analyzing various aspects of reform, find practical approaches to solve problems faced in home countries, and apply knowledge and tools learned from the course to develop or improve reform plans. The second most common objective was to network, or exchange information (23.4 percent) with course instructors and participants, and learn how to speak a common language in the area of health sector reform and financing. The third most common objective (about 17 percent) concerned health care financing. Respondents hoped to obtain knowledge and skills in revenue collection, measurement of expenditures, and more effective
13
1998 Flagship Course on Health Sector Reform and Sustainable Financing
Figure 4. Expectations of the Course
Other
1.3%! Health
Economics 7.6%
Health Sector Reform 43.0%
Information Exchange
23.4%
allocation of limited resources through the use of various financial models and alternative approaches. Other expectations included increasing knowledge of principles of health economics (7.6 percent); issues related to policy (7.6 percent), such as understanding the role of government in reform, appropriate government policy mix, approaches for problem identification, priority-setting, and how to influence policies effectively; and other (1.3 percent), including transferring knowledge and skills obtained in the course to colleagues in their home countries.
Formative Evaluation Results
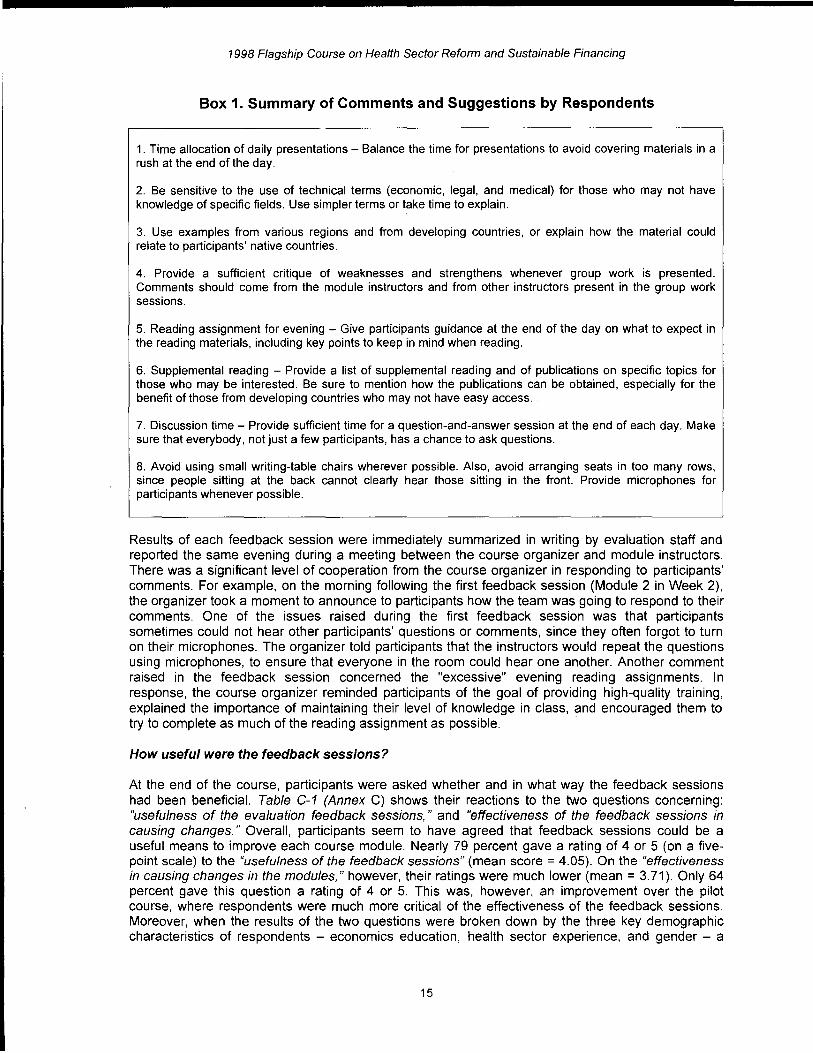
The formative method consisted of an in-class feedback session for each week-long module (except for the 2-day Module 1). The sessions were conducted at the end of the morning session of the second day, and lasted for approximately 20 minutes. Their purpose was to collect participants' preliminary comments about the design and delivery of each module, using a structured interview guide, in order to identify possible problems early in the week and make any necessary adjustments. Participants were asked how they felt about the course so far in terms of content, instructors' presentation skills, pacing, reading assignments, and the level of interchange between participants and instructors.
Since the modules were delivered by different groups of instructors, respondents' comments differed across the various modules. However, some common themes, both positive and negative, emerged for all modules. The relevance and pacing of the material covered in the module, and the opportunity to ask questions received relatively favorable responses in all feedback sessions. On the negative side, respondents from all modules noted: 1) the tendency to fall behind schedule and to rush presentations toward the end of the day; 2) the overuse of technical terms; 3) the overuse of examples mainly from developed countries, while situations in developing countries were overlooked; 4) too much reading assigned for the evening; 5) the domination of discussions by a few participants; 6) uncomfortable writing tables in some rooms and the lack of microphones. Box 1 summarizes respondents' comments.
14
1998 Flagship Course on Health Sector Reform and Sustainable Financing
Box 1. Summary of Comments and Suggestions by Respondents
1. Time allocation of daily presentations - Balance the time for presentations to avoid covering materials in a rush at the end of the day.
2. Be sensitive to the use of technical terms (economic, legal, and medical) for those who may not have knowledge of specific fields. Use simpler terms or take time to explain.
3. Use examples from various regions and from developing countries, or explain how the material could relate to participants' native countries.
4. Provide a sufficient critique of weaknesses and strengthens whenever group work is presented. Comments should come from the module instructors and from other instructors present in the group work sessions.
5. Reading assignment for evening - Give participants guidance at the end of the day on what to expect in the reading materials, including key points to keep in mind when reading.
6. Supplemental reading - Provide a list of supplemental reading and of publications on specific topics for those who may be interested. Be sure to mention how the publications can be obtained, especially for the benefit of those from developing countries who may not have easy access.
7. Discussion time - Provide sufficient time for a question-and-answer session at the end of each day. Make sure that everybody, not just a few participants, has a chance to ask questions.
8. Avoid using small writing-table chairs wherever possible. Also, avoid arranging seats in too many rows, since people sitting at the back cannot clearly hear those sitting in the front. Provide microphones for participants whenever possible.
Results of each feedback session were immediately summarized in writing by evaluation staff and reported the same evening during a meeting between the course organizer and module instructors. There was a significant level of cooperation from the course organizer in responding to participants' comments. For example, on the morning following the first feedback session (Module 2 in Week 2), the organizer took a moment to announce to participants how the team was going to respond to their comments. One of the issues raised during the first feedback session was that participants sometimes could not hear other participants' questions or comments, since they often forgot to turn on their microphones. The organizer told participants that the instructors would repeat the questions using microphones, to ensure that everyone in the room could hear one another. Another comment raised in the feedback session concerned the "excessive" evening reading aSSignments. In response, the course organizer reminded participants of the goal of providing high-quality training, explained the importance of maintaining their level of knowledge in class, and encouraged them to try to complete as much of the reading assignment as possible. .
How useful were the feedback sessions?
At the end of the course, participants were asked whether and in what way the feedback sessions had been beneficial. Table C-1 (Annex C) shows their reactions to the two questions concerning: "usefulness of the evaluation feedback sessions," and "effectiveness of the feedback sessions in causing changes." Overall, participants seem to have agreed that feedback sessions could be a useful means to improve each course module. Nearly 79 percent gave a rating of 4 or 5 (on a fivepoint scale) to the "usefulness of the feedback sessions" (mean score = 4.05). On the "effectiveness in causing changes in the modules," however, their ratings were much lower (mean = 3.71). Only 64 percent gave this question a rating of 4 or 5. This was, however, an improvement over the pilot course, where respondents were much more critical of the effectiveness of the feedback sessions. Moreover, when the results of the two questions were broken down by the three key demographic characteristics of respondents - economics education, health sector experience, and gender - a
15

1998 Flagship Course on Health Sector Reform and Sustainable Financing
lower rating for "effectiveness" persisted across all categories. Respondents with higher-level degrees in economics, 10 years or less of work experience, and women all viewed the feedback sessions much more critically than their counterparts.
The results from the pilot clearly suggested the need to reconsider how to best utilize participants' comments and suggestions and make more effective mid-course adjustments. Thus, during the 1998 course, results from each feedback session were reported to the course organizer and instructors on the same day. Nonetheless, some of the same unfavorable comments were raised by participants later in the course. There were two possible reasons for this: 1) problems related to the facility, such as chairs, tables and the arrangement of microphones, may have been difficult to adjust due to the facility's requirement for advance reservations; and 2) the emphasis of the feedback session was on improvement of the second half of each module, not on improvement of later modules, and comments received in one module may not have been transmitted to the instructors of later modules.
Data collection in regard to the feedback sessions may also be in need of improvement. For example, the question measuring the effectiveness of the feedback session was asked in the end-ofcourse questionnaire. The rating of this indicator, therefore, reflected the participants' aggregate reaction to all modules they had attended. This question should probably be in the end-of-module questionnaire. Also, the timing of the feedback sessions may need to be reviewed. Some participants mentioned that having the feedback session on the second day of a module was too soon, since they could not yet judge the relevance of module content, the usefulness of the materials, or whether the module contained sufficient case examples.
A. Learning Outcomes
Results show a substantial amount
of learning throughout the
course.
Seven of the nine modules administered pre and post cognitive tests designed to measure the amount of learning that occurred. Results from these tests show a substantial amount of learning throughout the course. For four of the modules, there was clear evidence of sUbstantial learning gain. Module 1 also showed some evidence of learning, although to a lesser degree. In two modules, 6 and 9, there was no evidence that
participants learned the basic information that was presented. Still, the overall results show that the course was remarkably effective in meeting the objective of teaching new skills and imparting new knowledge.
i. Distribution of Pre and Post Cognitive Test Scores across Modules
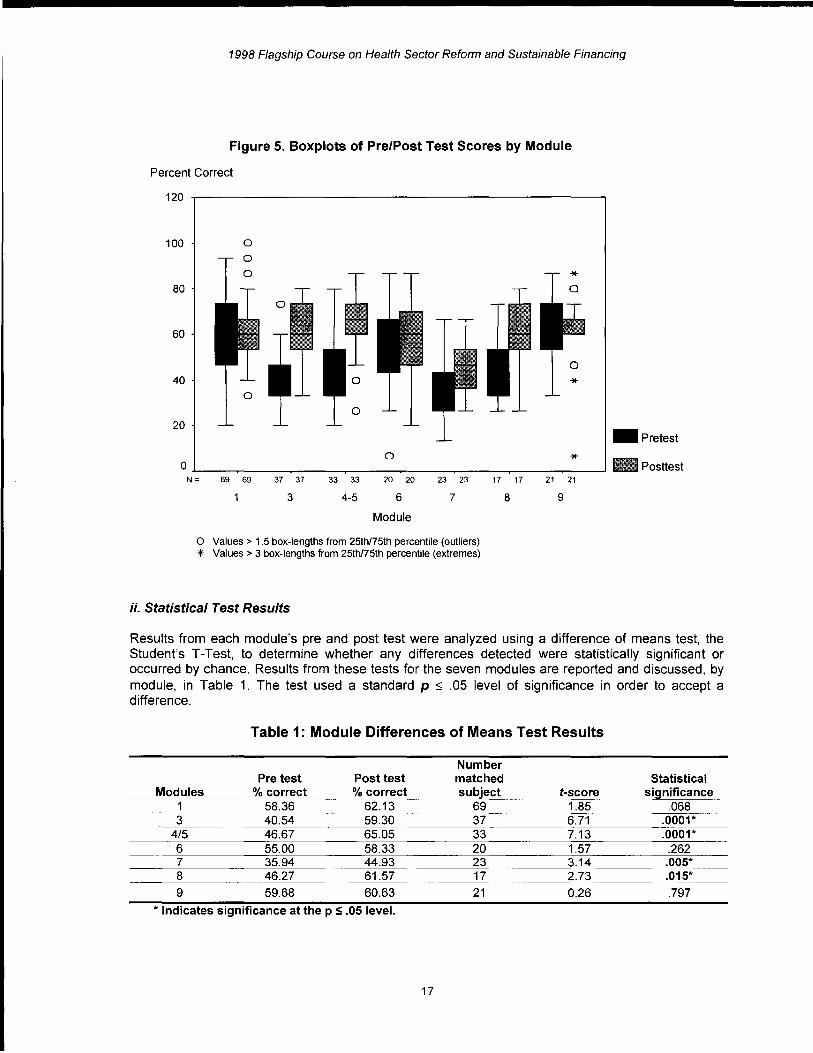
Figure 5 shows the boxplots of respondents' test scores for all modules that administered pre and post cognitive tests to assess learning gains. The distributions summarize the test scores of respondents whose pre and post scores were matched within each module according to their evaluation code numbers. The len~th of each box corresponds to the interquartile range, or the difference between the 75th and 25 h percentiles. Fifty percent of the test scores on each test fall within the box. The horizontal line inside the box represents the median. Test scores with values between 1.5 and 3 box lengths from the 25th or 75th percentiles show outliers and extremes.
Results show a substantial shift in the position of the interquartile box for the post test in Modules 3, 4/5, and 8. Module 7 had a smaller spread of post test scores at a higher range. The increase in respondents' test scores on the post test was among the largest for these modules. Modules 1 and 9 had several outliers and extreme values on the post test, and the overall change between pre and post test scores was relatively smaller. However, the length of the interquartile box was much smaller on the post test compared to the pre test, indicating that respondents' test scores on the post test were much more concentrated in a smaller range for these modules. Respondents in Module 6 did better on the post test on average, but the distribution of the test scores remained relatively the same on the post test among the respondents.
16
1998 Flagship Course on Health Sector Reform and Sustainable Financing
Figure 5. Boxplots of Pre/Post Test Scores by Module
Percent Correct
120
100 0 o o
80
60
40 o
20 _ Pretest
o * o .L-_~ ___ ~ __ ~ ___ ~ __ ~ __ ~ ___ ~_--' _ Posttest N= 69 69 37 37 33 33
3 4-5
20 20
6
Module
23 23
7
o Values> 1.5 box-lengths from 25th/75th percentile (outliers) * Values> 3 box-lengths from 25th/75th percentile (extremes)
ii. Statistical Test Resu/ts
17 17 21 21
8 9
Results from each module's pre and post test were analyzed using a difference of means test, the Student's T -Test, to determine whether any differences detected were statistically significant or occurred by chance. Results from these tests for the seven modules are reported and discussed, by module, in Table 1. The test used a standard p :-::; .05 level of significance in order to accept a difference.
Table 1: Module Differences of Means Test Results
Number Pre test Post test matched Statistical
Modules % correct % correct subject t-score significance 1 58.36 62.13 69 1.85 .068 3 40.54 59.30 37 6.71 .0001*
4/5 46.67 65.05 33 7.13 .0001* 6 55.00 58.33 20 1.57 .262 7 35.94 44.93 23 3.14 .005* 8 46.27 61.57 17 2.73 .015*
9 59.68 60.63 21 0.26 .797
* Indicates significance at the p S .05 level.
17
1998 Flagship Course on Health Sector Reform and Sustainable Financing
• Module 1 data were collected on 69 matched participants (79.3 percent) out of the 87 enrolled in
... modest learning occurred as a
result of participation in this
module.
the module. According to these results, only a slight gain in learning was evident. On the pre test, these participants had an average of 58.36 correct answers. This increased to 62.13 percent in the post test, a gain of 3.77 percentage points. When tested to determine whether this difference was statistically significant or occurred by chance, results showed that the difference was not significant at the accepted probability level (pS,.05). This suggests that modest learning occurred as a result of participation in
this module. These results are important because the module employed a distance learning strategy. It speaks well for the course that, on average, respondents were able to answer more than 58 percent (58.36 percent) of the questions correctly after reviewing course materials prior to attending the course.
The most important finding from the analysis is the modest increase in knowledge attributable to this module. However, this finding should be interpreted keeping in mind that its structure differed from that of other modules. Participants were sent study materials in advance, and the actual course consisted of a twO-day review of these materials as opposed to the week-long instructional sessions of other modules.
From this perspective, the modest gain registered on the cognitive tests is significant. First, as noted earlier, participants scored higher on the pre test than did the participants in most other modules, indicating that there may have been some learning as a result of exposure to the study materials. This learning did not seem to correlate with the amount of time participants said they spent reviewing the materials. Second, there was some increase in learning after the two-day review. This suggests that the modest gain registered was actually indicative of a more systematic pattern of learning through the distance learning mode. More results from this and other modules using distance learning techniques are needed before we can assess how much learning occurs.
• Module 3. Results from the statistical tests showed a rather sizeable gain in learning as a result of this module (Table 1). On average, participants had about 40 percent (40.54 percent) of answers correct on the pre test. This score increased almost 20 percentage points (18.76), to 59.30 percent correct answers on the post test. The reported t-score was 6.71, which was significant at well below the pS,.05 level. It is clear from these results that considerable learning occurred during this module.
• Module 4/5 test results also showed evidence of significant learning. The pre test showed that, on average, participants correctly answered about 47 percent (46.67 percent) of the questions. This score rose to over 65 percent (65.05 percent) on the post test, an increase of almost 20 percentage points (18.38). The test results indicate that this increase was significant and not a chance event. It appears from this evidence that Module 4/5 provided an effective learning experience to participants.
• Module 6 results did not show that participants learned a significant amount through this module. On average, participants answered 55 percent of the questions correctly on the pre test. This score increased slightly more than three percentage points (3.33) for the post test, where participants answered 58.33 percent of the questions correctly. When the test for a difference of mean scores was applied, it was found to be non-significant. This suggests that the observed increase was probably arrived at simply by chance and that no real learning gain occurred. It does not appear that participants gained a great deal of knowledge from this module.
• Module 7 test results showed some learning gain. Participants answered about 36 percent (35.94 percent) of the pre test questions correctly, a score that appears relatively low. This may be because of the difficulty of the module content or of the questions. The average percentage correct increased on the post test to almost 45 percent (44.93 percent), a gain of 8.99 percentage points. It should be noted, however, that even with this increase, participants were only able to answer about 45 percent (44.93 percent) of the post test questions correctly. While
18
1998 Flagship Course on Health Sector Reform and Sustainable Financing
this does show a true learning gain, it is also evident that less than half the material was mastered during the module.
• Module 8 results showed that participants experienced some learning gain. For the pre test, participants answered slightly more than 46 percent (46.27 percent) of the questions correctly. The score increased by more than 15 pOints (15.30) in the post test, to nearly 62 percent (61.57 percent). This apparently significant gain was verified with results from the difference of means test. These results show that the difference was significant well within the stated level of pS.05. It is safe to conclude that a considerable degree of learning occurred among participants in this module.
• Module 9 results showed no evidence that any learning occurred. On the pre test, the average number of correct answers was almost 60 percent (59.68 percent). This high number suggests that either the test questions were too easy or that participants entered the course knowing a great deal about the topic. Post test results showed that participants answered nearly 61 percent (60.63 percent) of the questions correctly. This was less than a 1 percentage point gain over the pre test scores. Results from the difference of means test confirmed that the change was negligible. The test showed that this difference was well outside of the pS.05 range for significance and may have occurred by chance.
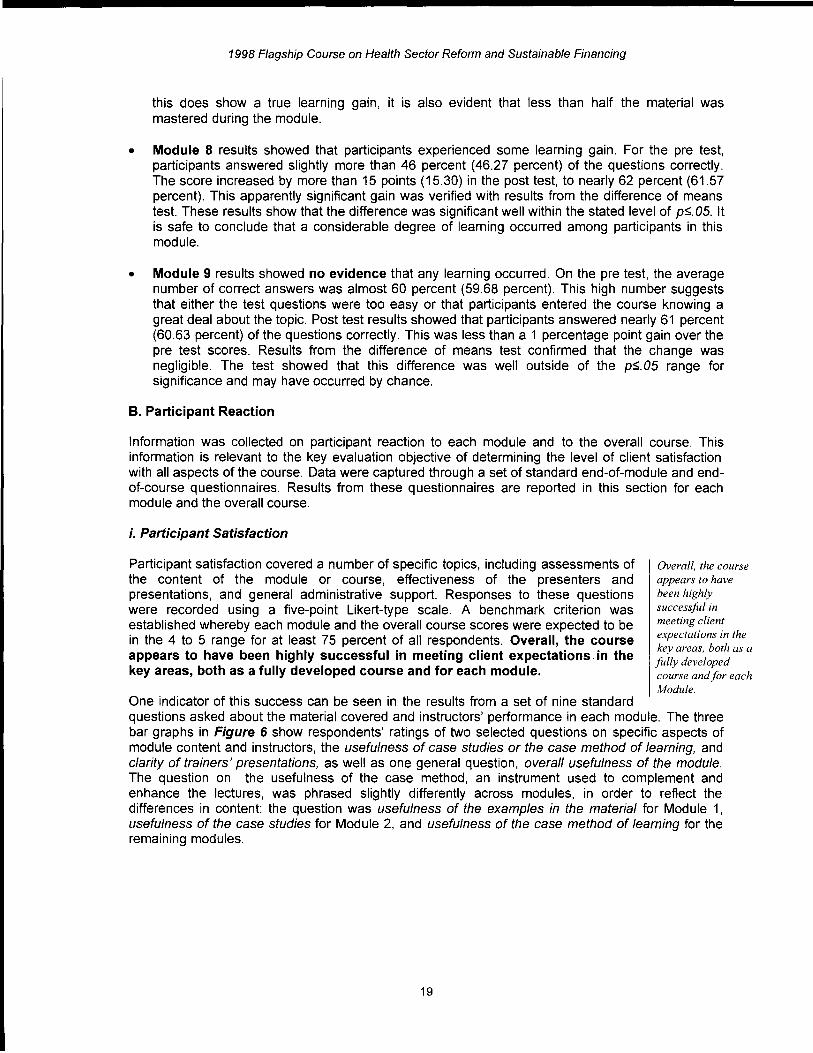
B. Participant Reaction
Information was collected on participant reaction to each module and to the overall course. This information is relevant to the key evaluation objective of determining the level of client satisfaction with all aspects of the course. Data were captured through a set of standard end-of-module and endof-course questionnaires. Results from these questionnaires are reported in this section for each module and the overall course.
i. Participant Satisfaction
Participant satisfaction covered a number of specific topics, including assessments of the content of the module or course, effectiveness of the presenters and presentations, and general administrative support. Responses to these questions were recorded using a five-point Likert-type scale. A benchmark criterion was established whereby each module and the overall course scores were expected to be in the 4 to 5 range for at least 75 percent of all respondents. Overall, the course appears to have been highly successful in meeting client expectations. in the key areas, both as a fully developed course and for each module.
One indicator of this success can be seen in the results from a set of nine standard
Overall, the course appears to have been highly successful in meeting client expectations in the key areas, both as a fully developed course and for each Module.
questions asked about the material covered and instructors' performance in each module. The three bar graphs in Figure 6 show respondents' ratings of two selected questions on specific aspects of module content and instructors, the usefulness of case studies or the case method of learning, and clarity of trainers' presentations, as well as one general question, overall usefulness of the module. The question on the usefulness of the case method, an instrument used to complement and enhance the lectures, was phrased slightly differently across modules, in order to reflect the differences in content: the question was usefulness of the examples in the material for Module 1, usefulness of the case studies for Module 2, and usefulness of the case method of learning for the remaining modules.
19
1998 Flagship Course on Health Sector Reform and Sustainable Financing
Figure 6. Results of Three Selected Questions Across Modules on a Five-Point Scale
Q4 Usefulress (icase StL.dy I case iVettiOct d l.eanirg ("usefUress d ex;;rnples" fa" M1)
OJ Oa-ity a Trainers in Presenta:i01S
5,-________________________________ -, 5,----------------------------------.
4.61 4.42 4.58 4.35 441 4.32
4 3.89
4.35 4.12
4.3
394 4 4
3.97 4.2
3.93
3.27 3.41
3 3
2 r- -- I 2
'-- -- -- --MxiJeMxiJe MxiJe MxiJe MxiJeMxiJe l'vbiJIe Moc1JIel'vbiJle MxilIe Mr:xlUe WocUe WocUe MxilIe WocUe MxiJe WocUe WocUe
1 2 3 4-5 6 7 8 9 11 1 2 3 4-5 6 7 8 9 11
09 0""'1311 Usefunless of the Module 5,-____________________________________ --,
4.44 4.47 4.35 4.29 4.24
4 3.86
3.55
3
2
, 1
Module Module Module Module Module Module Module Module Module 1 2 3 4-5 6 7 8 9 11
The three graphs show a pattern in respondents' ratings of the modules. The ratings were generally higher for Modules 2, 3, 4/5, 7, and 9, exceeding a rating of 4.0 on a five-point scale on both module content and effectiveness of trainers. Respondents' overall level of satisfaction with these modules also exceeded 4. O. By contrast, two modules, 6 and 11, received a rating of less than 4.0 on both module content and trainers. The perceived usefulness of these modules was also lower than that of other modules, with a mean score of less than 4.0. It was particularly noticeable that Module 6 consistently showed lower ratings than other modules.
Further results from the full questionnaire are discussed below for each module and for the overall course.
• Module 1 , "Review of Concepts and Analytical Tools of Health Sector Reform," was attended by 87 participants. The module was designed as a shorter session of two days, compared to the five days for the rest of course modules. As in the pilot, Module 1 was conducted on Day 2 and Day 3 of the course. The module was unique in its instructional method: participants were asked to prepare for the module by reading materials sent prior to the start of the course (distance learning), and during the two-day session, instructors went over the basic concepts and tools of
20

1998 Flagship Course on Health Sector Reform and Sustainable Financing
health economics. Through a series of short presentations followed by interactive discussions, Module 1 focused exclusively on reviewing the materials and answering specific questions from participants, rather than providing participants with materials at the start of the course.
The end-of-module questionnaire was completed by 85 out of 87 participants (97.7 percent). For two questions measuring their level of satisfaction, respondents' ratings exceeded 4.0 out of 5.0. The usefulness of the two-day review of the distance learning material received a mean score of 4.13, and the module's overall usefulness was 4.24. The percentage of answers falling in the 4 to 5 range, on a five-point scale, were 79.1 and 83.7, respectively. The results of the 1998 course appeared to be more positive than those for the same module in the pilot course, when the level of satisfaction was 4.54 on a six-point scale. When the two 1998 ratings were adjusted to the six-point scale using the scale adjustment factor, the mean scores were 4.91 on the review of distance learning materials and 5.02 on the overall usefulness of Module 1.
Among the highest ratings on specific aspects of Module 1 were trainers' knowledge of the issues (mean = 4.31), usefulness ofthe written materials (mean = 4.26), and effectiveness of the distance learning material in preparing partiCipants for the course (mean = 4.21). More than 85 percent of all respondents gave these indicators a rating of 4 or 5. By contrast, the usefulness of examples used in the materials (mean = 3.94) and quality of trainers' answers to questions from participants (mean = 3.95) did not reach the benchmark of 75 percent of responses falling in the 4 to 5 range. In the pilot evaluation, the degree to which examples or illustrations were useful and the degree to which trainers were clear were also cited as weaknesses (see Table D-1a in Annex D).
Table C-2 (Annex C) summarizes the results of five specific questions concerning the distance learning aspects of Module 1. Since the goal was intensive in-class review of the material, participants were expected to have completed all of the reading assignments prior to their arrival in Washington. When asked how much of the materials they had read, however, their answers varied. Among the 74 respondents who answered this question, 20 (27 percent) reported having read at least 75 percent of the material, 19 (25.7 percent) finished 51-75 percent, and 35 respondents (47.3 percent) had completed less than half of the reading assignment. Four (5.4 percent) had not read any of the material prior to the start of the course. Since the module dealt with health economics, it was particularly critical for participants without an economics background to familiarize themselves with key basic terms and concepts before their arrival. The results, broken down by background in economics, indicated that 15 of the 37 respondents (40.5 percent) with virtually no formal studies in economics had read less than half of the material prior to their arrival.
This relatively low level of preparation clearly suggests that participants need more encouragement to complete their pre-arrival reading aSSignments. Possible reasons for the low preparation level might be late receipt of materials, or simply neglect of the assignment. Questionnaire results indicated that many respondents, particularly those with no economics background, felt that the reading materials were "somewhat excessive" or "excessive," and had insufficient time available to do the reading. Respondents without an economics background also indicated that they would have preferred a longer module session in Washington, with readings provided as evening aSSignments. Perhaps partiCipants need to be reminded before attending the course that much of the work for Module 1 is designed be completed before their arrival, and that the purpose of the session is to ensure their mastery of the material rather than to provide new materials.
• The five-day Module 2, "Diagnostic Approaches to Assessing Strengths, Weaknesses, and Change of Health Systems," was conducted during the second week of the course and attended by 83 participants. This module was evaluated through an end-of-module feedback questionnaire that included the same set of 13 process and outcome questions that were asked in all other modules except Module 1 (see tables D-2a and D-2b in Annex D). The questionnaire also included 15 questions on specific subjects taught in the Module 2, and asked respondents
21

1998 Flagship Course on Health Sector Reform and Sustainable Financing
to self-assess their knowledge of each subject before and after the module (see Table 0-11 a in Annex 0). The end-of-module questionnaire was completed by all 83 participants.
Module 2 was one of two modules in the course (the other was Module 3) that had a rating exceeding 4.50 on the two key outcome questions: relevance of the module to current work (mean = 4.51) and the overall usefulness of the module for participants (mean = 4.53). More than 90 percent of respondents gave these indicators a rating of 4 or 5. These results were slightly higher than in the pilot study (adjusted mean = 5.29 on relevance in 1998 and 5.22 in 1997; and 5.31 on overall usefulness in 1998 and 5.21 in 1997).
On questions measuring specific aspects of module delivery, respondents gave a rating above 4.0 on all items, including the quality of content and instructors. They gave the highest rating to the general knowledge of instructors (mean = 4.60). This high regard for the instructors was consistent across demographic categories - education, professional background, and gender -with each subgroup rating this item at least 4.5. The other two items on instructors, clarity of presentations (mean = 4.42) and quality of answers to participant questions (mean = 4.35) also received very high ratings. The lowest rating of this module's performance was on the usefulness of evidence from country studies (mean = 4.19).
The percentage of respondents who selected "adequate" was below the 75 percent benchmark on three items: time allocated for discussion (67.5 percent), depth of treatment (65.9 percent), and amount of reading assigned in the evening (22.9 percent). Respondents found the amount of reading assigned particularly challenging. While every module in the course received similar comments, the degree to which they felt the amount of reading assignments was "adequate" was particularly low for this module. Those who did not have degrees in economics felt the assignments were particularly strenuous. Nearly 74 percent of these respondents answered either "excessive" or "somewhat excessive."
• Three parallel modules, 3, 6, and 9, were carried out during the third week of the course. Module 3, "Revenue Sources and Collection Modalities," was attended by a total of 41 partiCipants, all of whom completed the end-of-module questionnaire and pre and post knowledge tests.
Like Module 2, this module was characterized by respondents' high levels of satisfaction with two outcome indicators: perceived relevance of the module to own work (mean = 4.51) and overall usefulness of the module (mean = 4.63) (see Table 0-3a in Annex 0). On the overall usefulness of the module, all respondents gave a rating of 4 or 5 on a five-point scale, making this module's mean score the highest across all modules. When compared to the performance of the pilot, this year's Module 3 received a slightly higher rating (adjusted mean = 5.41 in 1998, 5.28 in 1997). A rating exceeding 4.5 on this indicator was evident across all demographic subgroups. Respondents without an economics background found Module 3 particularly beneficial, which gave this module the highest mean score of all the modules in terms of overall usefulness (mean = 4.77).
Respondents' views were consistently favorable on module content and delivery, including the quality of background materials, and usefulness of case studies and the case method of learning. More than 80 percent of respondents gave a 4 or 5 rating on all questions measuring content and delivery, resulting in a mean score exceeding 4.0 on all items. As in Module 2, respondents also gave the quality of instructors high ratings. Among the highest mean scores for this module were those for the performance of instructors, knowledge of the issues presented (mean = 4.63), clarity of presentations (mean = 4.58), and quality of answers to partiCipants' questions (mean = 4.44).
While all demographic subgroups gave a rating above 4.0 on all questions, there were some notable differences between two of the subgroups. The largest difference in mean scores between those with and without a background in economics was on the clarity of the background
22
1998 Flagship Course on Health Sector Reform and Sustainable Financing
materials, with those who did not have the background giving higher ratings (mean = 4.69) than their counterparts (mean = 4.25). Also, male respondents' views on how instructors answered participants' questions were more positive (mean = 4.64) than those of females (mean = 4.08).
When asked about the adequacy of aspects such as the time allocated for discussion, level of interaction with instructors, depth of coverage, and amount of evening reading, one item fell far below the 75 percent benchmark (Table D-3b). On the evening reading assignment, less than half of all respondents (41.5 percent) answered "adequate," and the response was particularly unfavorable among women respondents (23.1 percent) and those with no economics degree (30.8 percent). A large majority of these two groups, 77 percent of women and 61.6 percent of respondents without an economics background, reported that the assignments were either "excessive" or "somewhat excessive."
• Module 4/5 of the 1998 course, "Targeting Public Subsidies for Health and Designing a Benefits Package," was a combination of two modules - "Targeting Public Subsidies for Health" and "Designing a Benefits Package" - from the pilot course. The condensed module was carried out during the fourth week, in parallel with Modules 7 and 8. Forty-three participants attended the module, of whom 37 (86.0 percent) completed the evaluation forms (see tables D-4a and D-4b in Annex D).
The mean score for the module's overall usefulness was 4.47 out of 5.0. Adjusted to the pilot course's six-point scale, the mean was 5.25 - higher than the ratings for the earlier Module 4 (mean = 4.95) and Module 5 (mean = 4.67). On the standard set of questions assessing module content and delivery, all mean scores exceeded 4.0 out of 5.0 in the 1998 course, with at least 86 percent of the respondents rating each indicator a 4 or 5. One of the notable differences observed in the demographic subgroups was that background papers were seen to be more useful by those with more than 10 years of work experience (mean = 4.65) than by their counterparts with less experience (mean = 4.07).
The module was rated highly in the level of interaction between participants and instructors. Nearly 90 percent of respondents (89.2 percent) said the interaction was "adequate." This was the highest score given to this indicator across all course modules. Respondents' ratings on depth of issue coverage was also above the 75 percent benchmark (77.8 percent). The adequacy of time allocated for discussion was slightly below the 75 percent benchmark (73 percent), but this indicator still had one of the highest approval ratings across all modules.
• Module 6, "Separating Public Finance from Provision," was attended by 23 participants. The end-of-module evaluation was completed by all respondents but one (95.7 percent) (see Tables D-5a and D-5b in Annex D). Respondents were generally critical of this module. Ratings on all questions fell below 4.0 out of 5.0, except for clarity of background materials (mean = 4.14) and relevance of the module (mean = 4.05). The percentage of those who rated these items either 4 or 5 fell below the 75 percent benchmark, and was particularly low for how instructors answered participants' questions (40.9 percent, mean = 3.18) and for perceived usefulness of the case method of learning (45.5 percent, mean = 3.27). The overall usefulness of the module was rated 4 or 5 by only 59.1 percent of partiCipants (mean = 3.55). This module, along with Module 11, scored the lowest of all modules on usefulness (mean = 4.0).
One item that received a very positive response - the highest across all modules - was the amount of evening reading aSSignments. More than 80 percent of all respondents (81 percent) found the amount of reading "adequate." This result was fairly consistent across all demographic subgroups, with at least 70 percent in each subgroup reporting this item "adequate." The extent to which issues were covered in depth, by contrast, had a lower proportion of 4 or 5 ratings (38.1 percent). Nearly half the respondents (47.6 percent) reported the depth of treatment "insufficient" or "somewhat insufficient," particularly men, those with an economics background, and those with more than 10 years of work experience. On the time allocated for discussions, responses varied widely among subgroups. Women, respondents with an economics background, and
23
1998 Flagship Course on Health Sector Reform and Sustainable Financing
those with less work experience tended to view the discussion time more favorably than their counterparts, with 70 percent in each subgroup rating this indicator "adequate." While slightly below half of the other respondents also said the discussion time was "adequate," the remaining respondents found discussion time "excessive or somewhat excessive."
Written comments provided by 17 out of the 22 respondents in the end-of-module questionnaire on how the module could improve its performance concerned mainly two aspects: case studies and presenters' instructional skills. On case studies, respondents suggested that each study should be presented with more analysis of what approaches do and do not work, that there should be more emphasis on applying knowledge to the countries from which participants come, and that each case study presentation should end with a set of clear lessons drawn from the discussion. Several respondents commented on the timing of the case study presentations, noting that it was not appropriate to begin with case studies without first clearly explaining the module content. On presenters' instructional skills, respondents requested better coordination among the instructors to avoid repetition of background materials, more interesting lectures and presentations, and more approachable and engaging instructors.
• Module 7, "Provider Payment MeChanisms," was offered during the fourth week and attended by 23 participants, all of whom completed the evaluation questionnaire (see tables D-6a and D-6b in Annex D). All participants gave high ratings to nine standard questions (mean score = 4.17 to 4.70). The lowest average score was for usefulness of evidence from the country studies. The highest was for trainers' knowledge of the issues in general. There was no apparent pattern of differences between responses relating to course content and those relating to trainer performance. When viewing these results according to the 75 percent criterion, they appear quite favorable. The lowest percentage within the 4-to-5 range was 78.2 percent for the usefulness of background papers. The most impressive score was for clarity of the background papers, where almost 96 percent (95.7 percent) of participants gave a rating of 4 or 5.
There were, however, some noticeable differences when the results were broken down by level of economic training. Overall, it appears that respondents with some economics training gave higher ratings than those without this background. The one exception was for trainers' knowledge of the issues. Here those with no economic background gave a higher score (4.75) than their counterparts with training in economics (4.62). On all other items, it was the group with more extensive economics training that gave the module higher ratings. The greatest difference between the two groups was on the usefulness of evidence from country studies. Those respondents with no economics training gave this item a mean score of 3.75, while those with training rated it at 4.38. Collectively, these scores suggest that those with a background in economics may have found the course more valuable than those with different backgrounds.
A more mixed pattern of differences appears when we control for the level of work experience. Respondents with less work experience tended to rate the course lower than those with more than 10 years of experience. This pattern is evident on most, but not all, items. When responses are broken down by gender, we see a very different pattern for men and women. Women, on average, rated the course more highly than their male counterparts. On each item, the mean score for women was higher, with the greatest difference in their rating of the quality of trainers' answers to questions. The average score for men on this item was 4.20 versus 4.60 for women.
Table D-6b in Annex D shows the results of four questions for which the mid-point of the scale, "3," was the optimal score. Scores over 3 indicate "too much," while those under 3 represent "too little." Respondents generally felt that the time allocated for discussion, the interaction between participants and trainers, and the amount of reading required was slightly in the high range. This was especially true for the amount of reading, for which the mean score was 3.24 out of 5.0. Only on depth of treatment of the issue did the mean score fall at the optimal point of 3.0.
These results changed when broken down by subgroup. Generally, those participants without economics training felt that the time allocated for discussion and the amount of interaction with
24

1998 Flagship Course on Health Sector Reform and Sustainable Financing
trainers was at the optimal level. Those with some background in economics scored these two items in the "excessive" range. On the other two items, depth of treatment and amount of reading, this pattern was reversed, with those having some training in economics giving the optimal rating of 3.0. It appears from this pattern that participants with some training in economics felt that the procedure for conducting the training was more than needed, whereas the attention given to the subject matter was adequate. The pattern for groups with different levels of experience was much clearer. Persons with more experience gave each of the four items a score in the "too much" range. Ratings from those with less experience were closer to the optimal 3.0. This was the clearest group-based pattern for these items. When broken down by gender, the results were more mixed. Female respondents tended to give ratings closer to the optimal 3.0 than their male colleagues. The exception was depth of treatment of issues. On this indicator, females felt that too much time was spent, while males felt there was too little.
• Module 8, "Regulating Private Healthcare Markets and Insurance," was carried out during the fourth week and attended by 22 participants. The evaluation questionnaire was completed by 21 out of 22 partiCipants (95.5 percent) Table D-7a in Annex D shows the results of nine questions measured on a scale of 1 to 5, where 1 = low and 5 = high on each quality. Responses to this module were generally favorable. On most items, average ratings were 4.0 or higher, with at least 75 percent of respondents rating these items in the 4 to 5 range. There were exceptions to this pattern for the overall group. Noticeably on the item for clarity of trainers, the mean score was 3.81, with about 70 percent (71.4 percent) falling in the 4 to 5 range. And while the usefulness of the case method had an average rating of 4.0, the number of respondents giving this rating fell to 65 percent. It may be helpful to consider these responses when planning this module for future offerings.
Some very significant changes occurred when responses were broken down by demographic group. When we compared those with training in economics to those without such training, the differences on these items was striking. Uniformly, those without a background in economics rated these items much more highly, while less than 75 percent of those with such a background gave ratings of 4 or 5. This difference suggests a sensitivity of the topics covered in this module to this background characteristic. Persons with training in economics did not find the module as effective. Planners of future module presentations should consider the background of their audience when organizing the course.
The participants were also broken down by years of experience and gender. For the most part, those with greater experience gave higher ratings to these items than their less experienced counterparts. There were two exceptions to this pattern, for clarity of background papers and usefulness of background papers. These two items were rated more highly by persons with less experience. The pattern of difference was even more evident for the gender groups, with women giving lower ratings for each item than their male counterparts. Some of this difference may be explained by the interaction between gender and level of experience. Still, it is interesting to note that some major differences do surface between men and women in these course ratings.
Four items on the end-of-module questionnaire used the same five-point scale, but set the midpoint, 3.0, as the optimal score. Scores above 3.0 show "too much" of an item, while those below 3.0 represent "too little." The general population group rated three of the four items - time allocated to discussion, interaction between trainers and participants, and the amount of required reading - in the excessive range. Only for depth of treatment of the issue did respondents feel there was "too little" attention. When broken down by the various groups, some clear patterns emerge in these responses. Respondents with some background in economics rated all four items excessive. Similarly, participants with more experience tended to find these items "too much," unlike those with less experience. The pattern was more mixed when examining responses by gender. It may be helpful to understand why this may have occurred when designing future course offerings.
25
1998 Flagship Course on Health Sector Reform and Sustainable Financing
• Module 9, "Key Issues in Decentralization," was attended by 27 participants, and the evaluation questionnaire was completed by 25 participants (92.6 percent). Results from the end-of-module questionnaire are shown in Tables D-8a and D-8b in Annex D. Table D-8a shows the results of nine common questionnaire items measured on a scale of 1 to 5, where 1 = low and 5 = high. Results for all participants were characterized by their uniformly high ratings across almost all items. With only one exception, these scores were well above 4.0, with well over 75 percent falling in the 4 to 5 range. The one exception was usefulness of the evidence from country studies, which was rated 4.0, but had only 72 percent of responses in the 4 to 5 range. This one outlier, however, should not obscure the strong overall ratings obtained on these questions.
These results remain consistently high even when broken down by demographic group. When examined by training versus no training in economics, there was no clear pattern of differences among the nine items. The same item that rated low for the overall group, usefulness of evidence from country studies, also stands out as having a generally weaker rating. This item dropped to a mean of 3.63 for those with training in economics, with only 50 percent scoring in the 4 to 5 range. Results are similar for groups with different levels of work experience. Responses were uniformly strong among both groups, with the exception of the same item. The group with 10 years or less of experience dropped to a mean of 3.70, with only 60 percent of respondents giving a 4 or 5 rating. The same pattern persisted for men and women. Among men, this same item fell to a mean of 3.84, with 68.4 percent giving it a 4 or 5 rating, while other items remained consistently high among both groups. The persistent weakness of this item should alert planners to a potential difficulty when organizing future course offerings.
As shown in Table D-8b, four additional questions used the same five-point scale but had the mid-point, 3.0, as the optimal value. Results for all participants show that two of the items fell at or close to this optimal score. Time allocated to discussion (3.00) and depth of treatment of issues (3.04) were judged to be at the appropriate levels. The remaining two items, interaction between participants and trainers and amount of reading, were seen as excessive, with both receiving ratings of about 3.20. Generally, participants felt that presenters spent too much time or effort on these items, particularly the amount of time for discussion and the depth of treatment of issues.
Some changes occurred when the results were broken down by demographic group. On time allocated for discussion, persons with economics training appeared less likely to find there was enough time for this activity. This may reflect their greater understanding of the technical aspects of the issues discussed and their subsequent belief in the need for more attention to these issues. For two other items, interaction between participants and trainers, and depth of treatment of issues, participants with a background in economics felt that there was too much emphasis, unlike their colleagues without such training. There appear to be some real differences between these two groups with regard to how they view the efforts and emphasis of this module.
Similar differences can be seen when the group is broken down by years of experience and gender. Generally, participants with less experience felt that the efforts were "excessive." This varied, however, by item, and some of the differences between the groups were slight. There did not appear to be a large difference between men and women on these items, except on depth of treatment of the issue. For this item, female participants seemed to feel that the amount of time spent was not sufficient, unlike their male counterparts. Women respondents gave an average rating of 2.67, while males gave a rating of 3.11. This pattern does not appear to correspond to the other group differences, suggesting that gender was not masking other characteristics on this item. It remains an issue why female participants felt that issues were not treated in sufficient depth.
• A total of 83 participants attended the mandatory Module 11, "New Trends in Public Sector Management in Health," and all completed the evaluation questionnaire. Module 11 differed from the other modules in that it was designed as a general wrap-up. All participants were reconvened for this module after they had broken out into smaller groups for two other week-
26

1998 Flagship Course on Health Sector Reform and Sustainable Financing
long modules. Results from the end-of-module questionnaire are shown for all participants and for the three demographic groups in Tables D-9a and D-9b in Annex D.
Table D-9a shows the results of nine common questionnaire items measured on a scale of 1 to 5, where 1 = low and 5 = high. For the entire group, the ratings were lower than for previous modules. Only three of the items had average scores above 4.0 and met the 75 percent benchmark for ratings of 4 or 5. These highly rated items were clarity of background papers (mean = 4.07; 80.3 percent in 4 to 5 range), usefulness of background papers (mean = 4.09; 76.3 percent in 4 to 5 range) and trainers' knowledge of issues (mean = 4.22; 86.7 percent in 4 to 5 range). All other items fell below 4.0 and only one of these, clarity of trainers, had more than 75 percent of respondents (76.6 percent) fall within the 4 to 5 range. The weakest item was usefulness of evidence from country studies, which had a mean rating of 3.57, with slightly more than half (52.4 percent) of respondents rating it a 4 or 5.
Some clear differences emerge in the demographic groups. For all items, participants with no economics training rated the module more highly than those who had such training. The greater differences seemed to be related to course material rather than to trainers' performance. This suggests that those more familiar with economic concepts may have had less appreciation of what was presented. When broken out by years of experience, the differences were minor, with no clear pattern evident. This was not the case, however, when the breakout was by gender. Across all items, men rated the module more highly than women. Some of the differences were sUbstantial. The lowest average score seen among any group was the rating by female participants for usefulness of the evidence from country studies. The mean score for this item was 3.23, with only 34.6 percent of respondents rating it a 4 or 5. It may be worth exploring why female partiCipants found this module less than satisfactory.
Table D-9b in Annex D shows the results of four questions that used a five-point scale, but for which the mid-point was the optimal score. Scores over 3 indicate "too much," while those under 3 represent "too little." Results for the overall group show that participants felt there was too little emphasis or effort in three of the four areas. Only the amount of reading required in the evening was rated in the "too much" range. Other ratings suggest that more time should have been allocated to discussion, there should have been greater interaction between participants and trainers, and issues should have been treated in greater depth.
Some differences did emerge when the results were broken dc;>wn by major sub-groups. When viewed by economic degree or lack thereof, it appears that those with some training in economics felt more strongly that less than the optimal amount of time or emphasis was given to these items. For three of the four items, this meant that those with economics training gave ratings in the 2.0 range. However, on the issue of amount of reading assigned, their ratings were very near the optimal of 3.0 (3.03). This may be explained by their greater familiarity with the technical aspects of the assigned readings. Since they were able to understand the material more easily, they felt it was not excessive. Planners may want to keep this in mind when dealing with those individuals who do not have a background in economics.
When partiCipants were broken down by years of experience, there was little difference in their responses, except for amount of reading assigned. Respondents with less professional experience in the health sector found the amount of reading adequate, giving this item an optimal score of 3.0. However, those with more experience had an average score of 3.17, suggesting that they felt there was too much reading. While the score itself (3.17) was not high, the difference between the groups is significant. It may be that those with less professional experience were more willing to tolerate these assignments. It may be helpful to consider this difference when designing future modules.
Differences between men and women were mixed across the four items. While men felt that "too little" time was allocated for discussion (2.79), women found the amount of time nearly "adequate" (3.08). There was very little difference between these groups on the interaction
27

•
1998 Flagship Course on Health Sector Reform and Sustainable Financing
between participants and trainers. However, women did appear to feel more strongly that presenters did not cover issues adequately. It was on the last item, the amount of reading material assigned, that men and women showed the greatest difference. Men generally felt that there was "too much" assigned reading, giving this item a rating of 3.16. However, female respondents found that there was "too little" reading, and gave a rating of 2.88. Neither of these scores is far from the optimal score of 3.0. However, they do differ enough for the difference to be noted. This raises the question of why women found the outside reading to be less onerous than did the men.
Overall course: A total of 83 participants attended the final session, and 81 (97.6 percent)
... participants were completed the evaluation questionnaire. Results from an end-of-course questionnaire for the entire Flagship Course are shown in Tables 0-10a and 0-10b in Annex O. Table 0-10a shows the results of 11 questions measured on a scale of 1 to 5, where 1 = low and 5 = high. As is evident from these results, participants were very positive in their reactions to the various aspects of the course. On all but one item, the average scores were above 4.0, with almost all of these having 75 percent or more of the
very positive in their reactions to
the various aspects of the course
respondents giving ratings of 4 or 5. The one exception to ratings above 4.0 was the effectiveness of feedback sessions. These were in-course sessions conducted by the Evaluation Unit as a way of obtaining "formative" evaluation information so that mid-week corrections could be made to the modules. The average rating for this item was 3.71, with only 64 percent of respondents giving a rating of 4 or 5. A related question was asked about the usefulness of these sessions. The rating for this question was above 4.0 (4.05), with more than 78 percent (78.8) rating it 4 or 5. This may be because participants see the value of conducting feedback sessions but do not see any change as a result. Planners may wish to communicate the changes made as a result of these sessions more directly to participants in future offerings.
Three direct questions were asked about the value of the course: the degree to which participants' expectations were fulfilled; the relevance of the course to their work; and the overall usefulness of the course. All of these received very high ratings, with well over 75 percent of partiCipants giving ratings of 4 or 5. The weakest of these items was fulfillment of participants' expectations, although with an average score of 4.16 and 81 percent of participants giving a rating of 4 or 5, this was still a very encouraging result. Results from these questions strongly suggest that participants were pleased with the content of the overall course.
Results from the demographic groups were consistent with these findings, except for the gender groups. For those with and without economics training, the differences across items was not great and there was no clear pattern in terms of one group giving consistently higher ratings. The results were similar for those with varying degrees of professional experience. However, when broken out by gender, women tended to rate the course lower than men did. Their differences were greatest on how well the course met expectations. The average score for men on this item was 4.31, with more than 89 percent (89.6) of males giving ratings of 4 or 5. Female respondents, however, rated the course at 3.74, with slightly more than 56 percent (56.6) of women giving a rating of 4 or 5. This is a fairly large difference on an important item. It suggests that, overall, women were not as convinced as men that they got out of the course what they had expected. This feeling may account for some of the other module-specific results that showed women giving lower ratings on various items. It may be helpful to examine the expectations stated by women in greater depth to help determine why they were less enthusiastic about the course having met these expectations.
Table 0-10b in Annex D shows the results of eight end-of-course questions that used the same five-point scale, but for which 3.0 was the optimal score. Generally, respondents felt that most items were in the excessive range, averaging more than 3.0. There were two exceptions. For degree of participant involvement in the course, the score was close to the optimal value, at 3.07. Apparently, participants felt that there was an appropriate amount of their involvement in the course. The other exception was attention devoted to "how to do it" in the course. On this
28
1998 Flagship Course on Health Sector Reform and Sustainable Financing
indicator, the score was below the optimal, at 2.85. In other words, participants tended to feel that not enough time was devoted to this aspect of the course. This result is consistent with other course outcomes which stressed the need for the course to be more applied.
Results were broken down into standard groups representing differences in economics training, work experience, and gender. While there were differences among the groups, there was no defining pattern to these differences. The magnitude of the differences also showed no discernable pattern. Some differences were minor while others appeared significant. It would be worth examining each of these differences for clues as to where and how the course could be improved. For example, on the amount of attention devoted to evidence-based learning, women gave much higher ratings than men, 3.35 versus 2.96. This suggests that women felt that too much attention was devoted to this method, whereas men were inclined in the opposite direction. The other groups did not show such wide differences on this item. This raises the question of why women felt so differently on this issue and what could be done to adjust for their concern.
ii. Self-reported Learning Assessment
Two modules, 2 and 11, asked partiCipants to self-assess how much they learned in key areas. These were opinion questions, not a direct measure of learning as provided by the cognitive tests. Still, these results give us some idea of what and how much participants felt they had learned. Overall, it is clear that participants felt they gained a great deal of new information and skills from these two modules. The specific results from these module tests are given below.
• Module 2: As shown in Table D-11a in Annex D, the pre-module assessments given by all respondents ranged between 2.65 and 3.15, and post-module assessments ranged between 3.58 and 4.29, for 15 specific questions. Overall gains among all respondents ranged from 26.4 percent (understand the role of patients in shaping health system performance) to 56.0 percent (how to identify political strategies for policy reform).
Results by demographic group showed that respondents with degrees in economics conSistently had a higher mean score on their pre-module assessment than those without economics. A similar result had been observed in the pilot course, where respondents with an economics background had relatively smaller overall pre/post gains. These respondents showed a fairly high degree of familiarity with 10 of the 15 issues, giving them above a 3.0 rating on pre-module knowledge. Their pre mean scores were highest on how regulation can constrain the behavior of individuals and organizations (pre mean = 3.33, pre/post change = 19.8 percent); the need to coordinate leadership, authority, task assignments, promotion, and financial incentives in reforming institutions (pre mean = 3.33, change = 25.6 percent); and the complexity of causes that produce barriers to rational reform (pre mean = 3.31, change = 33.9 percent). They reported their largest percentage gain in how to identify political strategies for policy reform, which had one of lowest pre mean scores for this group (pre mean = 2.86, change = 46.1 percent). For respondents without an economics background, the gain was largest in understanding the basic aspects of the policy cycle (pre mean = 2.41, pre/post change = 72.0 percent).
Again in this year's evaluation, respondents with more than 10 years experience in health care reported larger gains in knowledge than did those with less work experience. Pre-module ratings by the respondents with longer work experience were consistently lower than those reported by the less experienced group. This may be due to the fact that nearly two thirds (65.8 percent) of respondents with more than 10 years of experience had no economics background. By contrast, about 70 percent of the less experienced group reported having a university degree in economics.
29
1998 Flagship Course on Health Sector Reform and Sustainable Financing
• Module 11: Table 0-11 b in Annex 0 shows that participants in this module self-reported gains in knowledge or skills of 40 to 60 percent-sizeable increases-across 12 items. Their average scores on the pre-course assessment were 2.0 to 3.0, suggesting that they felt their level of knowledge was initially relatively low.
It was expected that when broken down into demographic groups, those without economics training would have lower pre test scores but would show larger pre to post gains. This pattern generally held across the 12 items. However, the differences were not great for either indicator. Likewise, it was expected that those with less experience would post lower pre test scores but show a greater pre to post gain. Again, this pattern generally held across the 12 items, with some exceptions, but the differences were not great. It seems that neither of these demographic groups forms the basis for significant differences in perceived learning.
In the gender group, however, there was a noticeable pattern of some fairly large differences. Men and women did not differ greatly in their pre test scores. However, women seemed to feel that they gained significantly less than men in knowledge or skills as a result of the course. Men's post-test scores were higher across the 12 items and, subsequently, their pre to post percentage gain was much higher. This again shows that women tend to have different reactions to the course than their male counterparts. It may be worth exploring why women have such different reactions for future planning of this module.
C. Cross-Item Analysis
Information from two major domains - cognitive learning and participant feedback - was used in this evaluation. Items within and between each of these domains were of interest because of how they were related. For example, one of the questions we attempted to answer was how satisfaction is related to cognitive learning. Are participants who are more satisfied with course operations more likely to learn? We also identified a number of process and outcome indicators within the feedback set of items that led us to consider questions of how process is related to outcome. This section explores these relationships and shows the results of our cross-item analysis.
i. Cognitive Learning and Participant Satisfaction
The results show The first area we explored in the cross-item analysis was the relationship between some evidence that
participants who are more satisfied
may experience greater learning.
cognitive learning and participant satisfaction. We examined respondents' test scores to see whether there was a relationship between their degree of satisfaction with each module and the amount of change between their cognitive pre and post test scores. Figure 7 shows the changes in these scores for all modules (except Modules 2 and 11, which did not use cognitive tests), plotted against respondents' ratings for the overall usefulness of each module. The results show some evidence that participants who
are more satisfied may experience greater learning.
Modules 3 and 4/5 had the largest changes between the pre and post scores, and their module performance was rated among the highest. Modules 7 and 8, which had a relatively large gain, also had an overall usefulness rating eXGeeding 4.0. Module 6 had one of the smallest pre/post changes, and its overall usefulness was rated lower than other modules. This seems to suggest that the larger a module's gain in pre/post test scores, the higher its overall usefulness rating. A clear exception seems to have been Module 9, which showed little change between pre and post scores yet had one of the highest overall usefulness ratings. Some of the possible reasons for this scenario may be that 1) the modules were generally well received in regard to performance and design, and 2) respondents had relatively high pre test scores, indicating their high level of familiarity with the issues covered in the modules before attending the course. Also, the quality of test questions may need to be revisited, to assess the possibility of a bias.
30

1998 Flagship Course on Health Sector Reform and Sustainable Financing
Figure 7. Changes in Test Scores by Level of Module Satisfaction
n ~ 0 u ~ c: co Q)
~ c: ·iii (!)
~ "" ·c OJ 0 u
80.------------------------------------------,
70
60
50
40
30
3
t 3.55 (MS)
4.47(M4-5)
t • 4.44(M9) 4.24 (M1)
'" <"'l I 4
VI 4.35 (M7)
4.S3(M3)
"Overall Usefulness" of Module (5-p!. scale)
5
ii. Relationship of process to outcome
.. POST TEST
VI PRE TEST
For each module and the overall course, a correlation test (Person's r) was used to measure the relationship between sets of outcome and process indicators. The rationale for examining these relationships is that process, or operations, may influence the short-term results of the training. If true, this would allow course planners to make adjustments in operations aimed at improving individual modules and the overall course. Results from these correlation tests are reported below by module and for the overall course.
• Module 1: Results show (see Table E-1 in Annex E) that a number of process variables are significantly associated with outcome variables and especially with overall usefulness of the module. However, upon closer examination, only one of the process indicators appears to have a sizeable relationship with one of the outcome variables. This is the usefulness of written material, which positively correlates with overall usefulness of the course at r = .502. What participants thought about the written material used in the course appears to be moderately related to how well they assessed the overall usefulness of the training in Module 1. It may be worth noting the importance of these materials and how they may influence participant evaluation of the overall course.
• Module 2: Results show moderate to weak associations between some process and outcome indicators (see Table E-2 in Annex E). There appears to be a pattern among those which show a moderate correlation, in the 0.4 - 0.59 range. All four correlation coefficients within this range show a relationship between some manner of trainer activity and the two outcome indicators. The three trainer-related variables were knowledge of issues, clarity of presentations, and the quality of their answers. All of these are related to participants' judgment of the overall usefulness of the course. Only the clarity of trainers' presentations is related to participants' views on the relevance of the course to their work. Still, the sensitivity of these outcome
31
1998 Flagship Course on Health Sector Reform and Sustainable Financing
indicators to trainer activity should be noted. These appear to offer the greatest opportunity for increasing the module's relevance for participants.
• Module 3: A number of significant, moderate relationships are evident in these results (Table E-3, Annex E). The overall usefulness outcome variable is positively correlated with a number of the process variables that relate to both the module material and the performance of presenters. It appears from this result that participants' opinion of the module's general usefulness was influenced by the quality of both materials and presenters' performance. The strongest relationship observed for this outcome variable was with participants' views of the usefulness of the case studies, at r = .569. Case study quality and relevance may also have an important influence on how participants judged the overall course. On the more specific outcome variable, relevance to your work, only the quality of trainers appears to have a significant relationship. This, again, shows the importance of presenters in creating a constructive learning environment.
• Module 4/5: Few relevant relationships appear between the process and outcome indicators in Module 4/5 (see Table E-4 in Annex E). Only with the outcome indicator, overall usefulness, are there any significant and sizeable relationships. Two of the process indicators show a weak to moderate relationship with this outcome variable. Both trainers' knowledge of issues and the quality of trainers' answers are related to presenters' performance and not to material or content. There are no significant or sizeable relationships between the more speCific outcome indicator, relevance to your work, and the process variables. Thus, in seeking to identify factors that may affect how participants view the results of this module, planners will have to look beyond the content and presentation.'
• Module 6: As shown in Table E-5 in Annex E, the pattern of relationships between seven process and two outcome indicators is unusual when compared to other module correlational tests. There appears to be virtually no relationship between any of the process indicators and the specific outcome indicator, relevance to your work. However, with the more general outcome variable, overall usefulness, all but one of the process variables are related. Furthermore, these relationships are comparatively strong, with correlation coefficients in the 0.51 - 0.77 range. The strength of this relationship is surprising, given the relatively small number of cases (N = 20-21). These results suggest a strong sensitivity of how participants regard the general benefits of the module and how they view the quality of its content and delivery. It is also interesting to note that this pattern is not transferable to the more specific outcome indicator, relevance to your work. The module's content and how it is presented may affect how respondents feel generally about the training, but these factors appear unrelated to the specific utility of this training. This same pattern appears to a less extent in other modules.
• Module 7: Correlational results (Table E-6, Annex E) show an interesting and somewhat different pattern than in other modules. Whereas in other module results, the trainer-related indicators seemed most highly correlated with the outcome indicators, here the content-related indicators were strongest. Furthermore, this pattern largely holds for both the specific outcome indicator, relevance to your work, and the more general indicator, overall usefulness. Only one of the trainer-related variables, quality of trainers' answers, was significant and weakly related to the specific outcome indicator, relevance to your work (r = .414). It is also interesting to note that the strongest relationship (r = .806) was between one of the content-related process indicators and the more specific of the outcome indicators. This pattern suggests that participants may have been greatly influenced by the quality of the materials in how they assessed the overall and specific outcomes of the module. Usually the role of trainers is most highly related to these outcomes. Project planners may want to look more closely at these materials to explain why they appear to be more influential.
• Module 8: Results from these tests show evidence of relationships between both outcome indicators and process variables (Table E-7, Annex E). The general outcome variable, overall usefulness, shows a moderately significant relationship to two of the process indicators relating to content: usefulness of country study evidence, r = .492; and usefulness of case studies, r =
32
1998 Flagship Course on Health Sector Reform and Sustainable Financing
.502. It should be noted that these two content-related indicators involve the use of examples in delivering the module's message. Participants' desire for examples relevant to their home countries was a consistent theme in the evaluation results for the overall course. In looking at the correlation coefficients for the three trainer-related process indicators, we see that they are strongly related to the general outcome indicator, overall usefulness. This finding underscores the importance of the trainers' role in influencing satisfaction with the module. We see additional support for this in the more specific outcome indicator, relevance to your work. Only two of the trainer-related process indicators are significantly related to this variable (r = .552; r = .565), while none of the content-related indicators appears to be related. Together, these highlight the importance of trainer performance in affecting a high degree of satisfaction with the module.
• Module 9: These results (Table E-8, Annex E) show a number of significant relationships between process and outcome indicators that are in the moderate range. As has been the prevailing pattern, the general outcome variable, overall usefulness, correlates most frequently with a number of process indicators. But unlike in other modules, the process indicators in this module relate to both course content and trainer performance. In fact, the stronger correlations (r = .522, r = .610) are between this outcome variable and the two content-related indicators. For the specific outcome variable, relevance to your work, only one of the process variables is Significantly related, a pattern similar to other modules. The variable, usefulness of background papers (r = .424), also relates to content. These findings suggest that participants were more sensitive to materials in Module 9 than in other modules, where process indicators relating to trainers' performance were more prominent.
• Module 11: Results show a pattern similar to that of other modules (see Table E-9 in Annex E). The strongest relationships were found between process indicators and the general outcome variable, overall usefulness. All of the correlation coefficients fall in the strong-moderate range, indicating a sensitivity to both course content and trainers' performance for this outcome variable. Consistent with other modules, the specific outcome indicator, relevance to your work, is not as consistently or as strongly related to the process items. What is different from other modules is that the strongest associations are found between this specific outcome indicator and process indicators related to course content. Correlation with trainers' efforts is less clear for this variable.
• Overall Course: The correlation analysis conducted for the overall course used five process and four specific outcome indicators. The process indicators were effectiveness of the case method of teaching, usefulness and effectiveness of the evaluation feedback sessions, overall satisfaction with course organizers, and satisfaction with the course logistics. The outcome variables were degree to which participants would recommend the course to others, degree to which the course fulfilled participants' expectations, overall relevance of the course to partiCipants' work, and overall usefulness of the course. The results show almost no relationship between the two sets of variables (see Tables E-10a and E-10b in Annex E). While a number of correlation coefficients are statistically significant, they are all in the weak range. Given the sensitivity of this test to large numbers, it may be that those which are statistically significant reflect the large number of partiCipants responding to the end-of-course survey. We could not find in any of these process indicators information that would help influence the stated outcome variables in future courses. Course planners may have to look elsewhere for this information.
D. Multivariate Model Analysis
Two types of multivariate models were constructed to examine the results of the cognitive tests. The models simultaneously assessed the effects of economics training, years of professional experience, and gender on results from the cognitive tests. Only modules that used cognitive tests - Modules 1, 3, 4/5, 6, 7, 8, and 9 - were used in the analysis. The two types of models constructed were a Logit Regression Model and a Multiple Linear Regression Model with dummy variables that represented the three demographic characteristics. The models addressed different aspects of the cognitive test results. A full description of the models and their results are given in Annex F.
33

1998 Flagship Course on Health Sector Reform and Sustainable Financing
i. Logit Regression Models
Table 2 shows results from the pre test models for the overall course and the seven modules using cognitive tests. The overall results were obtained by combining the results from all seven modules. The focus in this set of models was on the pre test results, and whether participants scored above or below the arithmetic mean. This method used the Wald x2 test to assess whether the effects of each of the three demographic variables was significantly different from zero. A statistically significant value shows that the variable does affect the dependent variable, while controlling for the effects of the other independent variables. This procedure also produces an odds ratio that shows the direction and extent of that effect.
From these results, we can see that only two modules showed any effect from the three demographic variables. In the model for Module 1, the education variable is significant at p = .01. What is interesting about this result, however, is the direction and magnitude of the odds ratio. Since the education variable was measured at 1 = a degree in economics and 0 = no degree in economics, an odds ratio of 0.286 indicates that those participants with some training in economics were only about 25 percent as likely as those without such training to score above the mean on the pre test. It was expected that participants with a background in economics would grasp the concepts and material more easily and score in the higher range. But the opposite occurred. One explanation may be found in the special circumstances of Module 1. This was the distance learning module in which participants were asked to study the material before attending the course. The module consisted only of a two-day review of this material. It appears that those without a degree in economics may have been much more conscientious about preparing for the course than those who had such training.
Table 2: Logit Models for Module Pre Tests
EDUCATION EXPERIENCE GENDER
Odds Odds Odds Modules Waldx 2
p ratio Waldx 2 p ratio Waldx 2
p ratio Overall 0.0991 0.75 1.006 0.0142 0.91 1.001 0.4225 0.56 1.008
1 6.1314 0.01 0.286 0.0010 0.97 1.000 0.3248 0.57 1.052
3 1.5865 0.21 0.516 0.5160 0.45 1.57 0.1816 0.67 1.306
4/5 1.5640 0.21 0.477 3.3314 0.07 2.756 0.1541 0.69 0.764
6 0.5813 0.45 0.602 0.0776 0.78 0.826 0.8757 0.35 2.133
7 0.5068 0.48 1.604 0.3706 0.54 1.637 1.0158 0.31 0.404
8 2.3991 0.12 0.289 1.5607 0.21 9.551 0.9900 0.32 0.090
9 1.2215 0.27 0.410 0.9241 0.34 0.514 2.6786 0.10 5.176
The other module that showed an effect from one of these variables - years of experience in the health sector - on pre test scores was Module 4/5. The odds ratio in this model was, as expected, greater than 1.0, indicating that having more than 10 years of experience results in a greater probability of scoring above the mean on the pre test. What is most interesting is the magnitude of that odds ratio, at 2.756. This indicates that those with greater experience are more than two and three-quarter times as likely to score in the high range, and suggests the sensitivity of the issues covered in this module to practical professional experience. It is important to note that any effects from training in economics were controlled for in this model, so the sizeable impact of experience is independent of that factor.
Results from the models that focused on post test results are shown in Table 3. We can see that the effects of experience and economics training were evident in only two modules. The other modules, as well as the overall course, showed no sensitivity to these items in the post test. Again, Module 1
34
N
247
70
38
43
23
26
20
27
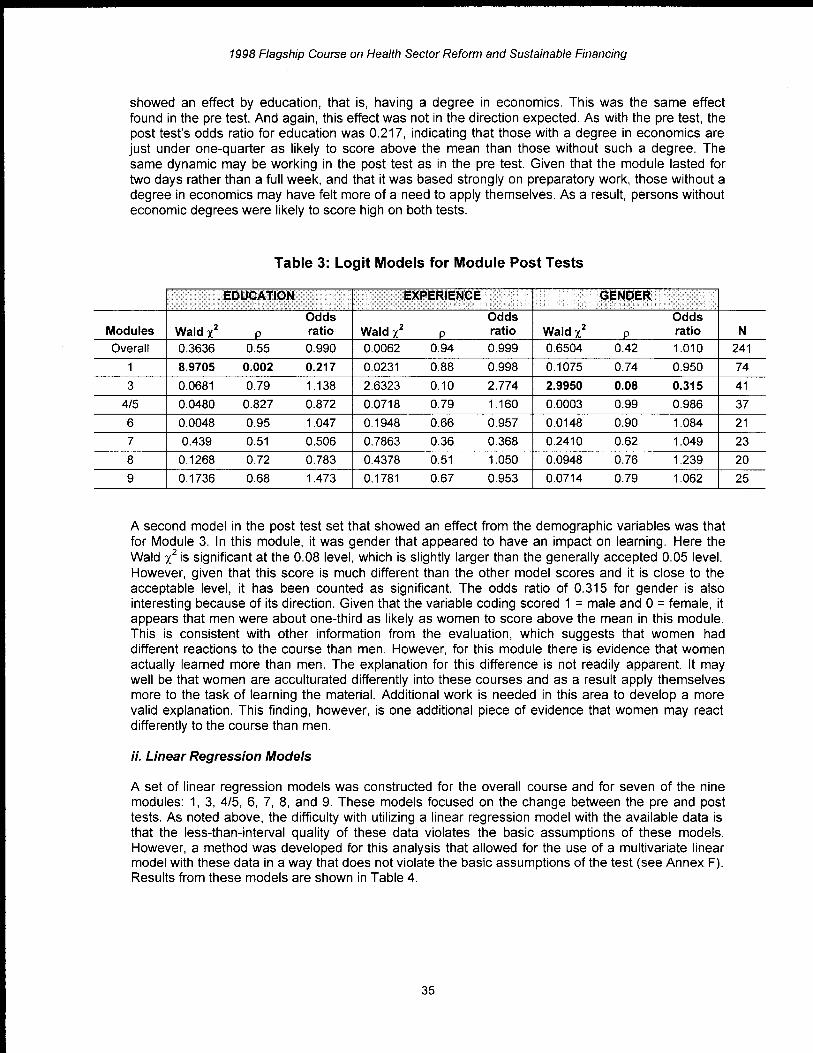
1998 Flagship Course on Health Sector Reform and Sustainable Financing
showed an effect by education, that is, having a degree in economics. This was the same effect found in the pre test. And again, this effect was not in the direction expected. As with the pre test, the post test's odds ratio for education was 0.217, indicating that those with a degree in economics are just under one-quarter as likely to score above the mean than those without such a degree. The same dynamic may be working in the post test as in the pre test. Given that the module lasted for two days rather than a full week, and that it was based strongly on preparatory work, those without a degree in economics may have felt more of a need to apply themselves. As a result, persons without economic degrees were likely to score high on both tests.
Table 3: Logit Models for Module Post Tests
EDUCATION EXPERIENCE GENDER
Odds Odds Odds Modules Waldx 2
p ratio Waldl p ratio WaldX 2 p ratio
Overall 0.3636 0.55 0.990 0.0062 0.94 0.999 0.6504 0.42 1.010
1 8.9705 0.002 0.217 0.0231 0.88 0.998 0.1075 0.74 0.950
3 0.0681 0.79 1.138 2.6323 0.10 2.774 2.9950 0.08 0.315
4/5 0.0480 0.827 0.872 0.0718 0.79 1.160 0.0003 0.99 0.986
6 0.0048 0.95 1.047 0.1948 0.66 0.957 0.0148 0.90 1.084
7 0.439 0.51 0.506 0.7863 0.36 0.368 0.2410 0.62 1.049
8 0.1268 0.72 0.783 0.4378 0.51 1.050 0.0948 0.76 1.239
9 0.1736 0.68 1.473 0.1781 0.67 0.953 0.0714 0.79 1.062
A second model in the post test set that showed an effect from the demographic variables was that for Module 3. In this module, it was gender that appeared to have an impact on learning. Here the Wald l is significant at the 0.08 level, which is slightly larger than the generally accepted 0.05 level. However, given that this score is much different than the other model scores and it is close to the acceptable level, it has been counted as significant. The odds ratio of 0.315 for gender is also interesting because of its direction. Given that the variable coding scored 1 = male and 0 = female, it appears that men were about one-third as likely as women to score above the mean in this module. This is consistent with other information from the evaluation, which suggests that women had different reactions to the course than men. However, for this module there is evidence that women actually learned more than men. The explanation for this difference is not readily apparent. It may well be that women are acculturated differently into these courses and as a result apply themselves more to the task of learning the material. Additional work is needed in this area to develop a more valid explanation. This finding, however, is one additional piece of evidence that women may react differently to the course than men.
ii. Linear Regression Models
A set of linear regression models was constructed for the overall course and for seven of the nine modules: 1, 3, 4/5, 6, 7, 8, and 9. These models focused on the change between the pre and post tests. As noted above, the difficulty with utilizing a linear regression model with the available data is that the less-than-interval quality of these data violates the basic assumptions of these models. However, a method was developed for this analysis that allowed for the use of a multivariate linear model with these data in a way that does not violate the basic assumptions of the test (see Annex F). Results from these models are shown in Table 4.
35
N
241
74
41
37
21
23
20
25
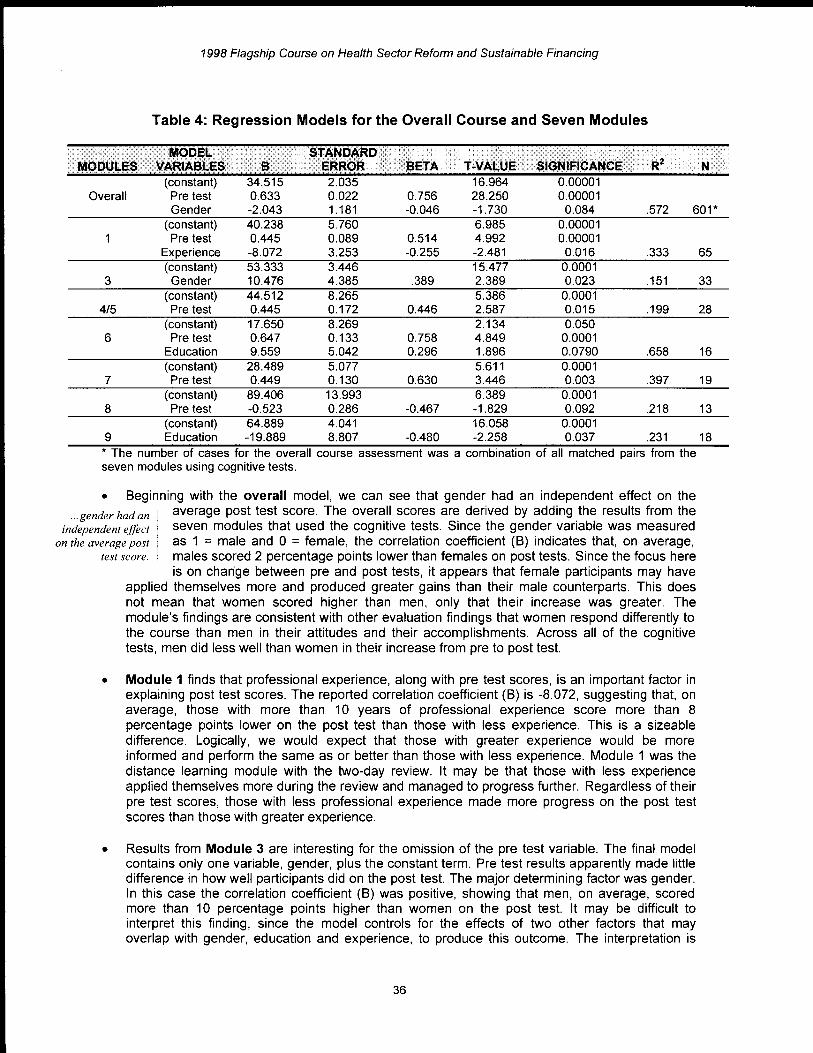
1998 Flagship Course on Health Sector Reform and Sustainable Financing
Table 4: Regression Models for the Overall Course and Seven Modules
MODEL STANDARD MODULES VARIABLES B ERROR BETA T-VALUE SIGNIFICANCE R2 N
(constant) 34.515 2.035 16.964 0.00001 Overall Pre test 0.633 0.022 0.756 28.250 0.00001
Gender -2.043 1.181 -0.046 -1.730 0.084 .572 601* (constant) 40.238 5.760 6.985 0.00001 Pre test 0.445 0.089 0.514 4.992 0.00001
Experience -8.072 3.253 -0.255 -2.481 0.016 .333 (constant) 53.333 3.446 15.477 0.0001
3 Gender 10.476 4.385 .389 2.389 0.023 .151 (constant) 44.512 8.265 5.386 0.0001
4/5 Pre test 0.445 0.172 0.446 2.587 0.015 .199 (constant) 17.650 8.269 2.134 0.050
6 Pre test 0.647 0.133 0.758 4.849 0.0001 Education 9.559 5.042 0.296 1.896 0.0790 .658 (constant) 28.489 5.077 5.611 0.0001
7 Pre test 0.449 0.130 0.630 3.446 0.003 .397 (constant) 89.406 13.993 6.389 0.0001
8 Pre test -0.523 0.286 -0.467 -1.829 0.092 .218 (constant) 64.889 4.041 16.058 0.0001
9 Education -19.889 8.807 -0.480 -2.258 0.037 .231 * The number of cases for the overall course assessment was a combination of all matched pairs from the seven modules using cognitive tests.
• Beginning with the overall model, we can see that gender had an independent effect on the
... gender had an independent effect
on the average post
average post test score. The overall scores are derived by adding the results from the seven modules that used the cognitive tests. Since the gender variable was measured as 1 = male and 0 = female, the correlation coefficient (B) indicates that, on average, males scored 2 percentage points lower than females on post tests. Since the focus here is on change between pre and post tests, it appears that female partiCipants may have
test score.
applied themselves more and produced greater gains than their male counterparts. This does not mean that women scored higher than men, only that their increase was greater. The module's findings are consistent with other evaluation findings that women respond differently to the course than men in their attitudes and their accomplishments. Across all of the cognitive tests, men did less well than women in their increase from pre to post test.
• Module 1 finds that professional experience, along with pre test scores, is an important factor in explaining post test scores. The reported correlation coefficient (B) is -8.072, suggesting that, on average, those with more than 10 years of professional experience score more than 8 percentage points lower on the post test than those with less experience. This is a sizeable difference. Logically, we would expect that those with greater experience would be more informed and perform the same as or better than those with less experience. Module 1 was the distance learning module with the two-day review. It may be that those with less experience applied themselves more during the review and managed to progress further. Regardless of their pre test scores, those with less professional experience made more progress on the post test scores than those with greater experience.
• Results from Module 3 are interesting for the omission of the pre test variable. The final model contains only one variable, gender, plus the constant term. Pre test results apparently made little difference in how well participants did on the post test. The major determining factor was gender. In this case the correlation coefficient (B) was positive, showing that men, on average, scored more than 10 percentage points higher than women on the post test. It may be difficult to interpret this finding, since the model controls for the effects of two other factors that may overlap with gender, education and experience, to produce this outcome. The interpretation is
36
65
33
28
16
19
13
18

1998 Flagship Course on Health Sector Reform and Sustainable Financing
further complicated by the fact that men did not differ greatly from women in their responses on the end-of-module questionnaire. There may have been something operating within the population of male participants that caused them to score so much higher than females on the post test.
• Module 6 also shows some effect from the dummy variables. In this case, the factor that appears to have a fairly large impact on post-test scores is having a degree in economics. Both presence of an economics degree and the pre test scores are retained in the model as significant contributors. The correlation coefficient (B) for having an economics degree is 9.559, showing that participants with such a degree scored, on average, almost 10 percentage pOints higher on the post test than those without such a degree. From this result, we might conclude that the nature of the module material made it easier for those with a more substantial background in economics to comprehend the material. This information should be considered when planning the next course. There may be a need to tailor the course to participants' level of training in economics, or to restrict registration to those with an economics background. Mixing the population and using the same course material may leave those without an economics background further behind.
• Like Module 3, the model for Module 9 also did not contain the pre test score. The only term not eliminated from the model was having a degree in economics. But unlike Module 6, the results for this term were quite different than expected. The correlation coefficient was -19.889, showing that those with an economics degree scored almost 20 percentage pOints lower on the post test than those without such training. Given that the pre-test score was controlled for but was not Significant, this finding shows that the degree of learning among those without training was much greater. This was a different direction than expected and the magnitude of the difference was by far the largest recorded in any of the models. A plausible explanation for this unexpected result may have to do with the nature of the two groups. Those without a background in economics may have felt the need to focus more on the course content and subsequently learned more about the subject matter than their colleagues who had economics training. Conversely, those with a background in economics may not have felt a need to focus as much on the material, assuming that their familiarity with basic terms and concepts would make it easier to comprehend the information. These areas need to be explored further to assess their validity as explanations of this sizeable difference.
37


1998 Flagship Course on Health Sector Reform and Sustainable Financing
PART V Findings and Conclusions
This section presents a set of conclusions and recommendations based on the evaluation findings, considering the developmental context of the course. In 1997, the course was offered for the first time using multiple modules presented in a month-long course. After that pilot offering, and based partially on the evaluation findings, revisions were made to the content and configuration of the modules for the 1998 course. Thus the course is not static, but an evolving structure that should be evaluated as such.
When viewed as an evolving program, the course can be continuously improved using the findings from the first two courses. The general conclusions from these findings are given below.
•
•
•
Perhaps the most significant finding of this evaluation is the extensive learning gain discovered using cognitive questions. Of the seven modules that used pre and post tests to measure learning, five showed significant gain between the two tests. These gains ranged from slightly over 3 percentage points to nearly 20 percentage points. The fact that so many of these modules were able to document that actual learning had occurred is an outstanding achievement. This was one of the major objectives of the course and is essential to the sequence of training for individuals who
Perhaps the most significant finding is the extensive learning gain discovered using cognitive questions.
will begin to effect needed changes in their nations' health systems. Not only did participants feel that they learned a great deal from the course, but there is empirical evidence that they actually did learn a significant amount.
Participants believe that they learned a great deal from this course. This is most Participants evident in the two modules that used the post-then design, Modules 2 and 11. This believe that they finding is also consistent with results from the 1997 evaluation, where the post-then learned a great design was used more extensively. There is further evidence of this assessment in deal/rom this some of the end-of-module and end-of-course questions, which addressed this issue course.
in different ways. That participants felt they learned a great deal from the course is significant. It shows how much they valued these modules for their substance and lets us know that the course is offering relevant and valued information, and that it is being offered in a way that is seen as highly effective.
It is evident from the end of course and end of module questionnaires that participants were highly satisfied with the course. Across both modules and topical areas, participants gave high ratings to course activities and content. Most items on the questionnaires met the established criteria of having at least 75 percent of respondents giving ratings of 4 or 5. This is significant, as it represents an improvement over last year's course results, where the benchmark was 66 percent. There were a number of exceptions to this general pattern. Specific items in each module and in the overall course had noticeably lower ratings. And one particular
It is evident from the end 0/ course and end o/module questionnaires that participants are highly satisfied with the course.
module, Module 6, seemed to stand out for its lower scores. The reasons for this should be examined. Still, at the general level, the course was highly successful by these measures.
39

1998 Flagship Course on Health Sector Reform and Sustainable Financing
• Results from the module-based correlation show a strong relationship between the two process indicators and the general outcome indicator, overall usefulness of the course. The relationship is less clear when the specific outcome indicator, relevance of the course to participants' work, is used. This pattern may relate to the difference in specificity between these two indicators. Participants appear to be more likely to respond favorably when the indicator is general. However, the more specific it becomes, the less likely we are to see favorable scores for both indicators. Participants appear to be more discriminating as the indicators become more specific.
• Generally, the correlation results show a pattern in the relationship between outcome indicators and the types of process variables. This pattern shows that those process indicators representing staff or trainer performance are more highly correlated with outcomes than the set of process indicators relating to the content or material of the module. This suggests the added importance of a well-presented module. Participants are more likely to rate outcomes more favorably if they are pleased with the trainer's performance. While content is important in determining satisfaction with the course, it is not as influential as how the trainer's performance is perceived.
• Results from the multivariate models show that the three demographic factors - training in ... there was no economics, years of professional experience, and gender - are important elements in
evidence that any learning. Despite several limitations to these models, we saw that each of these factors demographic/actor emerged as significant for different modules. Yet, while these are important for specific
had a systematic modules, there was no evidence that any of them exerted a systematic effect on effect on learning. learning. None of the variables was significant across all modules. This suggests that
their effects were module specific. It is certainly worth exploring further why and how a particular factor affects learning differently in different modules. It should not, however, be the basis for any course-wide changes.
• There appears to be a relationship between participant satisfaction with the course and learning This would give gain. This is seen in the results from the exploratory data analysis. If this pattern
added importance continues to emerge, it would be of great significance to this and other WSI courses. It to good pedagogy would suggest that by fully engaging participants, presenters are more likely to convey
as well as the needed information and learning is more likely to occur. This would give added substantive importance to good pedagogy as well as substantive expertise. In fact, the results
expertise. of the exploratory data analysis that looked at the relationship between satisfaction and learning across modules showed that while high satisfaction does not necessarily mean
there will be learning, the opposite is not true. All high learning modules were also high in satisfaction.
• Module 6 stands out as problematiC. This module had some of the lowest evaluation scores on the end-of-module questionnaire. It also was one of the two modules that showed no learning gain using the pre/post design with cognitive questions. Furthermore, results from the in-course feedback session suggested some dissatisfaction with presentation and content. The fact that three types of evaluations identified this module as problematiC gives some credence to this conclusion. Course planners should spend some time diagnosing these results and looking for the cause of this module's problems.
• Some common themes heard during the feedback sessions highlighted problems heard during last year's evaluation. Generally, participants felt that 1) there was a tendency to fall behind in presentation of material during the modules and then rush to cover all information completely by the end of the session; 2) technical terms were overused, so many participants were lost during the module; 3) the modules used too many examples from developed countries, and not enough from developing countries, which participants would have found more relevant; 4) there was too much reading required for evening and weekends; and 5) discussions during modules were often dominated by a few individuals, so that many participants did not have an opportunity to engage in discussion and debate.
40

1998 Flagship Course on Health Sector Reform and Sustainable Financing
• There is some question about the value of the in-course feedback sessions as a source of information for the formative evaluations. The sessions were designed to give participants an opportunity to provide inputs that would result in immediate changes to module operations. However, for both the pilot and the present course, participants rated these sessions lower than other aspects of the course. They were less concerned with the value of the input sessions than with their effect. They gave the lowest rating to the question of whether changes occurred as a result of the feedback sessions. It appears that they could not see any direct results from these sessions.
• For both the pilot and the present course, participants reported that they had little time to prepare for Module 1, the distance learning module, prior to attending the course. For both years, respondents said they were not able to read most of the material sent months in advance, even though they had relatively high pre test scores on the cognitive tests for this module. These results suggest there may be a need for an alternative method to prepare participants for this module.
41


1998 Flagship Course on Health Sector Reform and Sustainable Financing
ANNEXES
43


1998 Flagship Course on Health Sector Reform and Sustainable Financing
Annex A Description of the 1998 Flagship Program Course ModUles
Module 1: Review of Concepts and Analytical Tools of Health Sector Reform Reviews the core concepts related to efficiency and equity in health markets, and how market imperfections necessitate government intervention to correct distortions. Features the design of national health accounts, and different approaches to sustainable financing, funding, and remuneration practices. (Pedagogical instruments: distance learning method, lecture presentations, and discussions.)
Module 2: Diagnostic Approaches to Assessing Strengths, Weaknesses, and Change of Health Systems Diagnostic approaches to assessing goals of health care resource allocation and how the structure of national health systems are affected by history, ethics, politics, institutions, management, and incentives structures. Shows how different structures of health care systems affect performance. (Pedagogical instruments: lecture presentations, case studies, small group work, and discussions.)
Module 3: Revenue Sources and Collection Modalities Principles and practices of designing and implementing different financing schemes, including general revenue financing, mandated social insurance, private insurance, user fees, drug revolving funds, community financing, and medical savings accounts. (Pedagogical instruments: lecture presentations, computer exercises, case studies, case method of learning, and panel discussion.)
Module 4/5: Targeting Public Subsidies for Health, and Designing a Benefits Package Establishes the policy objectives of government health spending against which success can be measured in terms of equity goals and the application of incidence analysis. Assesses methods and experience of targeting health subsidies under different government health financing policies. Identifies different approaches to defining a basic package of health services, stressing the strengths and weaknesses of each. In stepwise fashion, designs a benefit package, using, first, effectiveness of health intervention, then cost considerations, followed by demand factors, and finally societal preferences. (Pedagogical instruments: lecture presentations, case studies, case method of learning, and discussions.)
Module 6: Separating Public Finance from Provision Explains why increasing numbers of governments are separating public finance from provision of services, what is involved in doing so (contracting), and lessons learned from major ongoing reforms. Illustrates functions of providers and purchasers under such arrangements, as well as implications for other shareholders in health. (Pedagogical instruments: lecture presentations, case studies and participants' case presentations, case method of learning, small group work, and discussions.)
Module 7: Provider Payment Mechanisms Shows how different payment or reimbursement mechanisms have a major impact on provider incentives, cost containment, and quality of services. Distinguishes strengths and weaknesses of fee for service, payments per episode of illness, diagnostic-related groups, capitation, and salaries within
45
1998 Flagship Course on Health Sector Reform and Sustainable Financing
different modes of health care delivery. (Pedagogical instruments: lecture presentations, case studies, case method of learning, and discussions.)
Module 8: Regulating Private Health Care Markets and Insurance Examines the role and importance of regulatory reform and functions in private health care delivery markets and public and private insurance. Assesses the importance of contractual factors on the efficacy of regulatory functions, including legal provisions, government capacities, information systems, and grievance procedures. (Pedagogical instruments: lecture presentations, case studies, case method of learning, and discussions.)
Module 9: Key Issues in Decentralization Explains the core functions served by decentralization, the importance of fiscal decentralization, and factors affecting the successes and failures of different decentralization initiatives. Shows how to determine the administrative and financial management capacity needed for successful decentralization reforms. (Pedagogical instruments: lecture presentations, case studies, case method of learning, small group work, and panel discussion.)
Module 11: New Trends in Public Sector Management in Health Examines why administrative, managerial, and institutional changes in health systems are being motivated by the doctrine of business-like practices, and how the new principles of public sector management are being used to foster continuous improvements in performance. Identifies how operational and management practices are being improved across several predominant institutional forms, ranging, for example, from "government department/entities" to "autonomous, managed public facilities," to "corporatized enterprises." (Pedagogical instruments: lecture presentations, case studies, case method of learning, and discussions.)
46

1998 Flagship Course on Health Sector Reform and Sustainable Financing
Annex B Description of Analytical Methods
• Pearson's Product-Moment Correlation Test. The Pearson's product-moment correlation test measures the strength of the bi-variate relationship between two items. It was used in this study to conduct a correlation analysis between measures of course "process" and measures of course "outcomes." Test results, in the form of a correlation coefficient, range from -1.0 to +1.0, with the higher the positive or negative score, the stronger the relationship, and 0 showing no association between items.
• Student's T- Test. The student's t-test is a parametric test for determining the differences in mean (average) values between two groups or populations. It was used in this study to measure the difference in average scores on cognitive tests between pre and post groups - groups of the same individuals taking tests before and after participation in the course. Test results include a tscore and a p-value, which shows the probability of the observed difference occurring by chance. We used the p = .05 level of significance to indicate a true difference.
• Multiple Regression with Dummy Variables. A multiple, linear regression method was used to examine the impact of education in economics, experience working in the health sector, and gender on the change in number of correct answers from pre to post test. A linear regression model can simultaneously assess the effects of multiple variables on a single dependent variable. Its advantage is that it is a robust method that can fully exploit the range of interval level measures and actually derive an estimated point value for specific estimates. The difficulty in using this method is that it requires that a number of fairly stringent assumptions be met, including the need for an interval level of measurement for the variables used. This limits the degree to which the method can be used in our analysis, given that many of the variables are derived from the use of a five-point Likert-type scale, and are, at best, only ordinal measures. In this analysis, we used a simple linear regression model with a set of nominal-level dummy variables representing education in economics, work experience, and gender as a means of overcoming some of these limitations.
The method used in this analysis was to regress the post test score results onto the pre test score results, creating a simple linear regression model that attempts to explain the percentage of correct answers given on the post test with how a participant scored on the pre test. To this model is then added a set of dummy variables representing the three characteristics-education in economics, work experience, and gender. These variables were measured as "0" or "1," depending on whether or not a participant possessed the characteristic. For the gender variable, 1 = male and 0 = not male, or female; for experience, 1 = more than 10 years experience and O· = 10 years or less experience; and, for education, 1 = a degree in economics and 0 = no degree in economics. A backward elimination method was used to assess whether these variables were statistically significant. This method begins with a fully specified model (a model that contains all of the variables) and then eliminates the weakest variable, repeating the process until only those that are Significant at a predetermined level of Significance remain. The conventional level of significance for the backward elimination method is p = 1.0, which was the level used in this analysis.
Remaining dummy variables that are Significant represent an intercept test for the regression equation. This is essentially a test of whether the average post test score for the group represented by the dummy variable is different from the average score for the entire group. For example, a significant correlation coefficient, or B, for the gender variable of 8.0 would indicate
47

1998 Flagship Course on Health Sector Reform and Sustainable Financing
that, on average, males scored 8 percent points higher than females on the post test. Since all other variables are also considered in this process, these findings are independent of the other two dummy variables. This method of using a combination of interval level measured variables plus a series of nominally measured dummy variables helps to overcome the constraints usually imposed by the model's assumptions.
• Logit Regression. The Logit model produces an odds ratio that can be used to assess the relative impact of a set of independent variables on a given dependent variable. Logit regression models were constructed for this evaluation to measure the simultaneous relationship among participant characteristics, process and outcome indicators, and cognitive test results. This model was selected over a standard linear regression model because the characteristics of the data made it difficult to meet the more stringent assumptions of the linear model. In order to avoid distortions in the final models, this method was selected because of its ability to handle non-interval level data.
48

1998 Flagship Course on Health Sector Reform and Sustainable Financing
Annex C Table C-1. Respondent Ratings on Evaluation Feedback Sessions
"Usefulness of "Effectiveness of R d t espon en s Rf a mg " db k ee ac sessions " " db k ee ac sessions "
All Respondents Mean (SO) / Adjusted Mean1 4.05 (0.79) /4.83 3.71 (0.94) / 4.49
% 4 or 5 78.8 64.0 Min/Max Rating 2/5 1/5 N 80 75 1997 Mean2 4.81 (0.78) 4.63 (1.02)
No economics Mean (SO) / Adjusted 4.28 (0.70) / 5.06 4.03 (0.66) / 4.81 training Mean
%4or5 86.1 80.0 Min/Max Rating 3/5 3/5 N 36 35 1997 Mean 4.74 (0.83) 4.58 (0.94)
Economics training Mean (SO) / Adjusted
3.84 (0.83) / 4.62 3.37 (1.09) /4.15 Mean % 4or5 73.0 48.6 Min/Max Rating 2/5 1/5 N 37 35 1997 Mean 4.92 (0.72) 4.73 (1.16)
10 years or less Mean (SO) / Adjusted 3.92 (0.85) /4.7 3.49 (0.98) /4.27 experience in health Mean
sector %4or5 76.3 51.4 Min/Max Rating 2/5 1/5 N 38 35 1997 Mean 4.59 (0.64) 4.67 (0.70)
More than 10 years of Mean (SO) / Adjusted 4.18 (0.72) /4.96 3.88 (0.88) / 4.66 experience in health Mean
sector % 4 or5 82.4 76.5 Min/Max Rating 3/5 1/5 N 34 34 1997 Mean 4.97 (0.84) 4.60 (1.19)
Men Mean (SO) / Adjusted
4.10 (0.85) / 4.88 3.78 (0.99) /4.56 Mean % 4 or 5 77.5 67.4 Min/Max Rating 2/5 1/5 N 49 46 1997 Mean nla nla
Women Mean (SO) / Adjusted 3.96 (0.71) / 4.74 3.52 (0.90) / 4.30
Mean % 4 or5 82.6 56.5 Min/Max Rating 2/5 1/5 N 23 23 1997 Mean nla nla
" " 1. Adjusted Mean: Mean score of the 1998 course Increased by the scale adjustment factor 0.78. 2. "1997 Mean": Mean score from 1997 on a six-point scale.
49
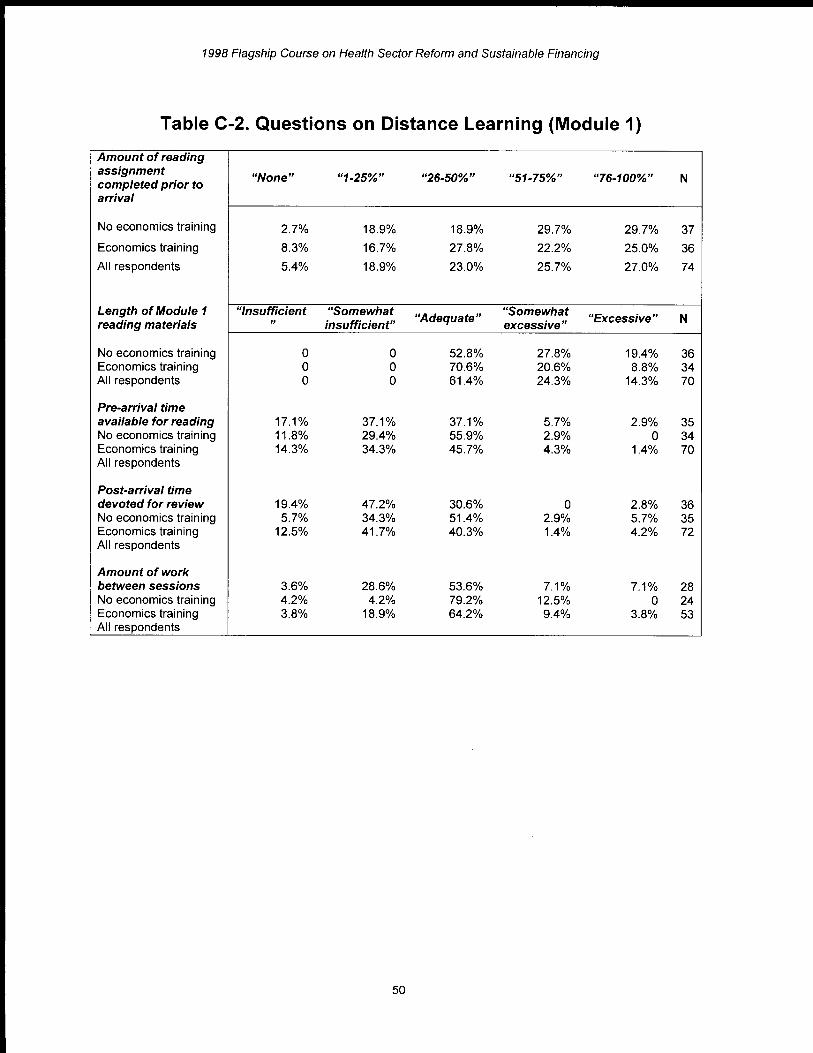
1998 Flagship Course on Health Sector Reform and Sustainable Financing
Table C-2. Questions on Distance Learning (Module 1)
Amount of reading assignment
"None" "1-25%" "26-50%" "51-75%" "76-100%" N completed prior to arrival
No economics training 2.7% 18.9% 18.9% 29.7% 29.7% 37
Economics training 8.3% 16.7% 27.8% 22.2% 25.0% 36
All respondents 5.4% 18.9% 23.0% 25.7% 27.0% 74
Length of Module 1 "Insufficient "Somewhat "Adequate"
"Somewhat "Excessive" N reading materials " insufficient" excessive"
No economics training 0 0 52.8% 27.8% 19.4% 36 Economics training 0 0 70.6% 20.6% 8.8% 34 All respondents 0 0 61.4% 24.3% 14.3% 70
Pre-arrival time available for reading 17.1% 37.1% 37.1% 5.7% 2.9% 35 No economics training 11.8% 29.4% 55.9% 2.9% 0 34 Economics training 14.3% 34.3% 45.7% 4.3% 1.4% 70 All respondents
Post-arrival time devoted for review 19.4% 47.2% 30.6% 0 2.8% 36 No economics training 5.7% 34.3% 51.4% 2.9% 5.7% 35 Economics training 12.5% 41.7% 40.3% 1.4% 4.2% 72 All respondents
Amount of work between sessions 3.6% 28.6% 53.6% 7.1% 7.1% 28 No economics training 4.2% 4.2% 79.2% 12.5% 0 24 Economics training 3.8% 18.9% 64.2% 9.4% 3.8% 53 All respondents
50
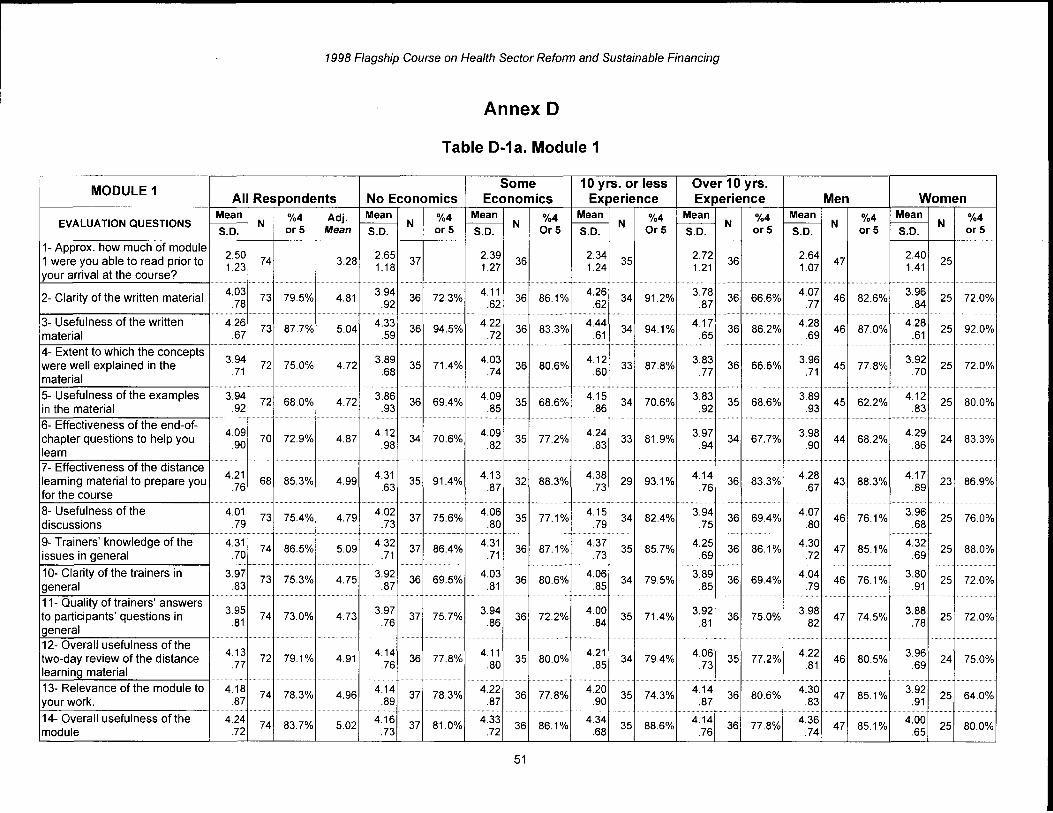
1998 Flagship Course on Health Sector Reform and Sustainable Financing
Annex D
Table 0-1a. Module 1
-Some 10 yrs. or less Over 10 yrs.
MODULE 1 All Respondents No Economics Economics Experience Experience Men Women
Mean %4 Adj. Mean %4 Mean %4 Mean %4 Mean %4 Mean %4 Mean %4 EVALUATION QUESTIONS - N r--- N r--- N r--- N N r--- N N
S.D. or 5 Mean S.D. or5 S.D. Or5 S.D. Or5 S.D. or 5 S.D. or 5 S.D. or5
1- Approx. how much of module 2.50 2.65 2.39 2.34 2.72 2.64 2.40
1 were you able to read prior to 1.23 74 3.28
1.18 37
1.27 36 1.24 35
1.21 36
1.07 47
1.41 25
your arrival at the course? ... . ................. ..........
2- Clarity of the written material 4.03 73 79.5% 4.81
3.94 36 72.3%
4.11 36 86.1%
4.26 34 91.2%
3.78 36 66.6%
4.07 46 82.6%
3.96 25 72.0%
.78 .92 .62 .62 .87 .77 .84
3- Usefulness of the written I·····
4.26 73 87.7% 5.04
4.33 36 94.5%
4.22 36 83.3%
4.44 34 94.1% 4.17 36 86.2%
4.28 46 87.0%
4.28 25 92.0%
material .67 .59 .72 .61 .65 .69 .61 .......................... ................................ ........... ........ i······················ ......... .....
4- Extent to which the concepts 3.94 3.89 4.03 4.12 3.83 3.96 3.92 were well explained in the .71
72 75.0% 4.72 .68
35 71.4% .74 36 80.6%
.60 33 87.8%
.77 36 66.6%
.71 45 77.8% .70
25 72.0% material
............ ............. ...... i······· ..... . ................. ................ _ ......
5- Usefulness of the examples 3.94 72 68.0% 4.72
3.86 36 69.4% 4.09
35 68.6% 4.15
34 70.6% 3.83
35 68.6% 3.89
45 62.2% 4.12
25 80.0% in the material .92 .93 .85 .86 .92 .93 .83
6- Effectiveness of the end-of-i ..................... .............................
chapter questions to help you 4.09 70 72.9% 4.87
4.12 34 70.6%
4.09 35 77.2%
4.24 33 81.9%
3.97 34 67.7% 3.98 44 68.2%
4.29 24 83.3%
learn .90 .98 .82 .83 .94 .90 .86
............. ...... .................. ..................
7- Effectiveness of the distance learning material to prepare you 4.21
68 85.3% 4.99 4.31
35 91.4% 4.13
32 88.3% 4.38
29 93.1% 4.14 36 83.3% 4.28
43 88.3% 4.17
23 86.9% for the course
.76 .63 .87 .73 .76 .67 .89 ..............
8- Usefulness of the 4.01 73 75.4% 4.79
4.02 37 75.6%
4.06 35 77.1%
4.15 34 82.4%
3.94 36 69.4% 4.07
46 76.1% 3.96
25 76.0% discussions .79 .73 .80 .79 .75 .80 .68
.................. . ....•.....
9- Trainers' knowledge of the 4.31 74 86.5% 5.09
4.32 37 86.4% 4.31
36 87.1% 4.37
35 85.7% 4.25
36 86.1% 4.30 47 85.1%
4.32 25 88.0%
issues in general .70 .71 .71 .73 .69 .72 .69
10- Clarity of the trainers in 1
3.97 73 75.3% 4.75 3.92
36 69.5% 4.03
36 80.6% 4.06
34 79.5% 3.89 36 69.4% 4.04
46 76.1% 3.80
25 72.0% general .83 .87 .81 .85 .85 .79 .91
............ .......
11- Quality of trainers' answers 3.95 3.97 3.94 4.00 3.92 3.98 3.88 to participants' questions in
.81 74 73.0% 4.73
.76 37 75.7%
.86 36 72.2% .84 35 71.4%
.81 36 75.0%
.82 47 74.5%
.78 25 72.0%
general ............. ......................
12- Overall usefulness of the two-day review of the distance
4.13 72 79.1% 4.91
4.14 36 77.8%
4.11 35 80.0%
4.21 34 79.4% 4.06
35 77.2% 4.22
46 80.5% 3.96
24 75.0% .77 .76 .80 .85 .73 .81 .69 learning material
............. ............. . ............. ........ . ....... . ............. 13- Relevance of the module to 4.18
74 78.3% 4.96 4.14
37 78.3% 4.22
36 77.8% 4.20
35 74.3% 4.14 36 80.6%
4.30 47 85.1%
3.92 25 64.0% your work. .87 .89 .87 .90 .87 .83 .91
...... ...... ......................... I················
8~.~~/ol 14- Overall usefulness of the 4.24 74 83.7% 5.02
4.16 37 81.0% 4.33
36 86.1% 4.34
35 88.6% 4.14
36 77.8% 4.36
47 85.1% 4.00
25 module .72 .73 .72 .68 .76 .74 .65 -_.
51
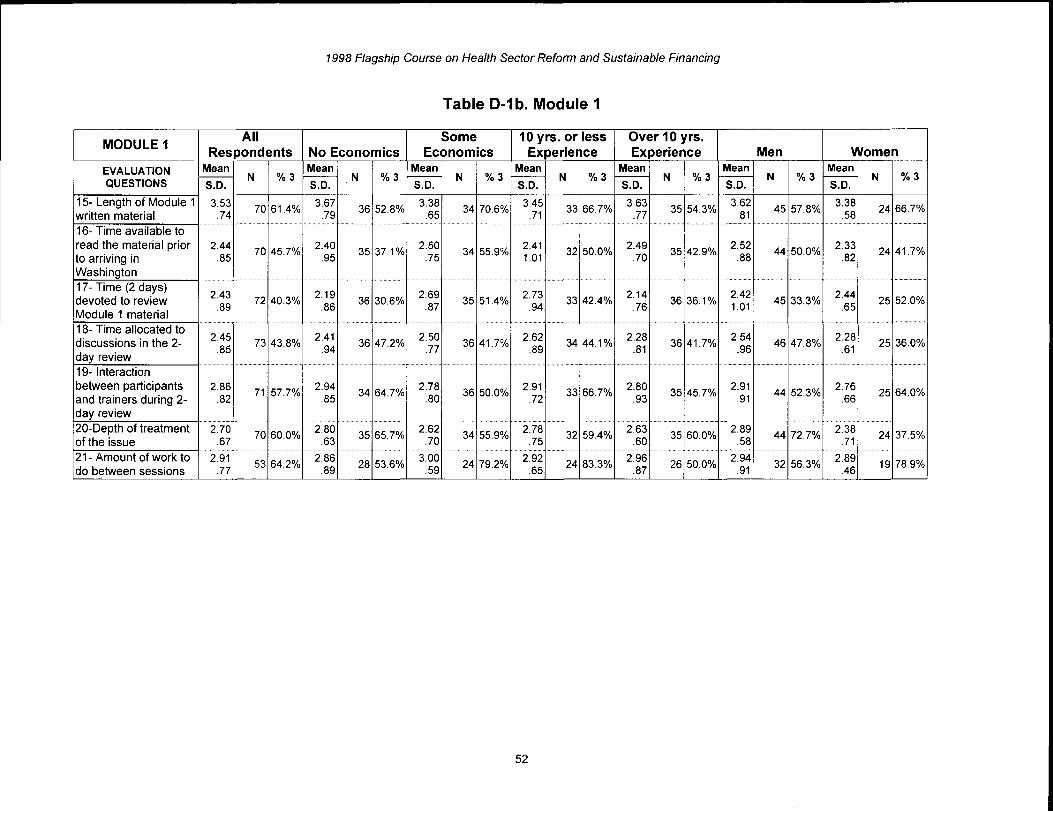
1998 Flagship Course on Health Sector Reform and Sustainable Financing
Table 0-1 b. Module 1
MODULE 1 All Some 10 yrs. or less Over 10 yrs.
Respondents No Economics Economics Experience Experience Men Women EVALUATION Mean Mean Mean Mean Mean Mean Mean
l- N %3 - N %3 r--- N %3 - N %3 l- N %3 l- N %3 l- N %3 QUESTIONS S.D. S.D. S.D. S.D. S.D. S.D. S.D.
15- Length of Module 1 3.53 70 61.4% 3.67
36 52.8% 3.38
34 70.6% 3.45 33 66.7%
3.63 35 54.3%
3.62 45 57.8%
3.38 24 66.7%
written material .74 .79 .65 .71 .77 .81 .58
16- Time available to ........... I·····
read the material prior 2.44 70 45.7% 2.40 35 37.1%
2.50 34 55.9%
2.41 32 50.0% 2.49
35 42.9% 2.52
44 50.0% 2.33
24 41.7% to arriving in .85 .95 .75 1.01 .70 .88 .82 Washington
.......
17- Time (2 days) 2.43 2.19 2.69 2.73 2.14 2.42 2.44
devoted to review .89 72 40.3%
.86 36 30.6%
.87 35 51.4%
.94 33 42.4%
.76 36 36.1% 1.01
45 33.3% .65
25 52.0% Module 1 material 18- Time allocated to
............................. .......................... ........................ ,' ............................. I
discussions in the 2- 2.45 73 43.8% 2.41
36 47.2% 2.50
36 41.7% 2.62 34 44.1% 2.28
36 41.7% 2.54
46 47.8% 2.28
25 36.0% day review
.85 .94 .77 .89 .81 .96 .61
19- Interaction between participants 2.86 71 57.7%
2.94 34 64.7%
2.78 36 50.0%
2.91 33 66.7%
2.80 35 45.7%
2.91 44 52.3%
2.76 25 64.0%
and trainers during 2- .82 .85 .80 .72 .93 .91 .66 day review 20-Depth of treatment 2.70 70 60.0% 2.80
35 65.7% 2.62
34 55.9% 2.78 32 59.4%
2.63 35 60.0%
2.89 44 72.7%
2.38 24 37.5%:
of the issue .67 .63 .70 .75 .60 .58 .71
;~·~~~I ............... ............ .... I .. .................... . ......................... ...................... I······· ......
21- Amount of work to 2.91 53 64.2%
2.86 28 53.6%
3.00 24 79.2%
2.92 24 83.3% 2.96 26 50.0%
2.94 32 56.3% 2.89
19 do between sessions .77 .89 .59 .65 .87 .91 .46
52
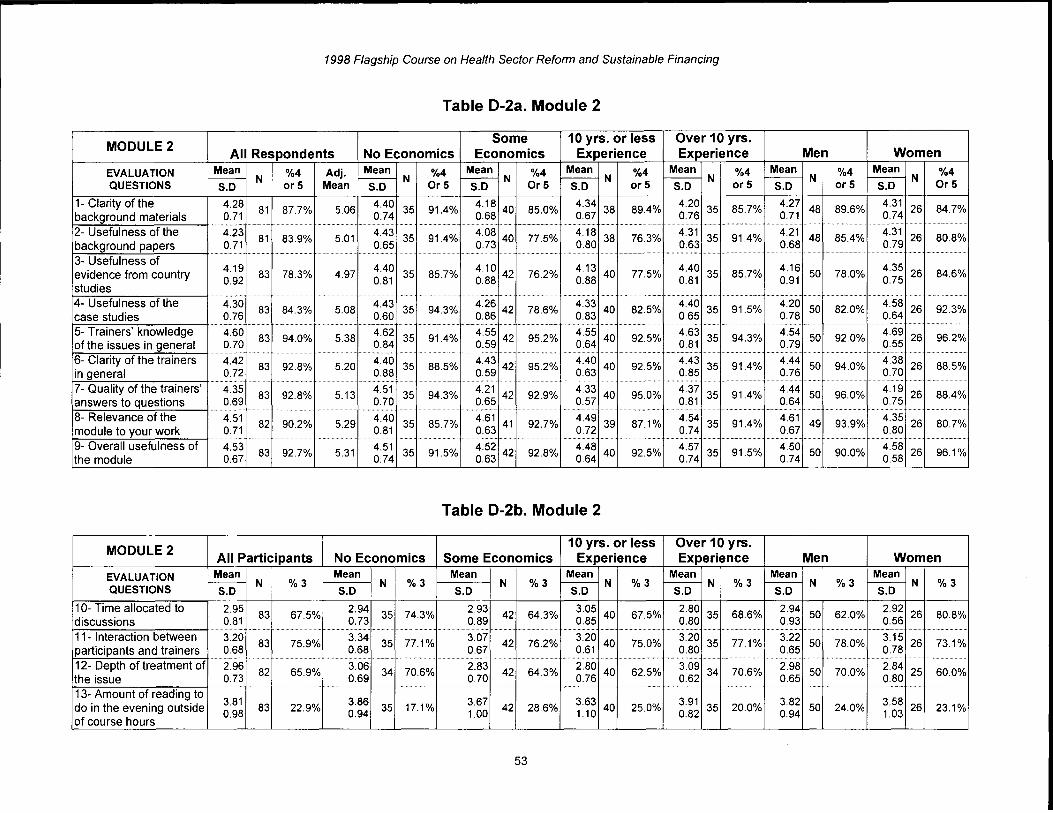
1998 Flagship Course on Health Sector Reform and Sustainable Financing
Table D-2a. Module 2
MODULE 2 Some 10 yrs. or less Over 10 yrs.
All Respondents No Economics Economics Experience Experience Men Women
EVALUATION Mean %4 Adjo Mean %4 Mean %4 Mean %4 Mean %4 Mean %4 Mean %4 f----- N f----- N f----- N f----- N r--- N r--- N r--- N
QUESTIONS SoD or5 Mean SoD Or5 SoD Or5 SoD or5 SoD or 5 SoD or 5 SoD Or5
1- Clarity of the 4.28 81 87.7% 5.06 4.40
35 91.4% 4.18
40 85.0% 4.34
38 89.4% 4.20
35 85.7% 4.27 48 89.6%
4.31 26 84.7%
background materials 0.71 0.74 0.68 0.67 0.76 0.71 0.74
2- Usefulness of the "4:23 ... ......... I··························
81 83.9% 5.01 4.43
35 91.4% 4.08
40 77.5% 4.18
38 76.3% 4.31
35 91.4% 4.21
48 85.4% 4.31
26 80.8% background papers 0.71 0.65 0.73 0.80 0.63 0.68 0.79
3- Usefulness of ........... I I···· ...........
evidence from country 4.19 83 78.3% 4.97 4.40
35 85.7% 4.10
42 76.2% 4.13
40 77.5% 4.40 35 85.7%
4.16 50 78.0%
4.35 26 84.6%
studies 0.92 0.81 0.88 0.88 0.81 0.91 0.75
4- Usefulness of the ................ ..................
4.30 83 84.3% 5.08
4.43 35 94.3%
4.26 42 78.6%
4.33 40 82.5%
4.40 35 91.5%
4.20 50 82.0%
4.58 26 92.3%
case studies 0.76 0.60 0.86 0.83 0.65 0.78 0.64
5- Trainers' knowledge ........................ 1
4.60 83 94.0% 5.38 4.62 35 91.4%
4.55 42 95.2%
4.55 40 92.5%
4.63 35 94.3%
4.54 50 92.0%
4.69 26 96.2%
of the issues in general 0.70 0.84 0.59 0.64 0.81 0.79 0.55
6- Clarity of the trainers ......... I ........ 1 ............. ........................... 1 ........... ......
4.42 83 92.8% 5.20
4.40 35 88.5%
4.43 42 95.2%
4.40 40 92.5%
4.43 35 91.4% 4.44
50 94.0% 4.38
26 88.5% in general 0.72 0.88 0.59 0.63 0.85 0.76 0.70
7- Quality of the trainers' I·················· I······· ..................... ...... 1 . ............ ..... ...............
4.35 83 92.8% 5.13 4.51
35 94.3% 4.21
42 92.9% 4.33
40 95.0% 4.37
35 91.4% 4.44 50 96.0% 4.19
26 88.4% answers to questions 0.69 0.70 0.65 0.57 0.81 0.64 0.75
8- Relevance of the ........ I I· ............................ .......................... I .... · I·
4.51 82 90.2% 5.29
4.40 35 85.7%
4.61 41 92.7%
4.49 39 87.1%
4.54 35 91.4%
4.61 49 93.9%
4.35 26 80.7%
module to your work 0.71 0.81 0.63 0.72 0.74 0.67 0.80
9- Overall usefulness of 1 .....................
4.53 83 92.7% 5.31
4.51 35 91.5%
4.52 42 92.8%
4.48 40 92.5%
4.57 35 91.5%
4.50 50 90.0%
4.58 26 96.1%
the module 0.67 0.74 0.63 0.64 0.74 0.74 0.58
Table D-2b. Module 2
MODULE 2 10 yrs. or less Over 10 yrs.
All Participants No Economics Some Economics Experience Experience Men Women f---
EVALUATION Mean Mean Mean Mean Mean Mean Mean
QUESTIONS r--- N %3 N %3 N %3 N %3 r--- N %3 r--- N %3 - N %3
SoD SoD SoD SoD SoD SoD SoD
10- Time allocated to 2.95 83 67.5%
2.94 35 74.3% 2.93
42 64.3% 3.05
40 67.5% 2.80
35 68.6% 2.94
50 62.0% 2.92
26 80.8% discussions 0.81 0.73 0.89 0.85 0.80 0.93 0.56
11- Interaction between I··············· ............. I·
3.20 83 75.9%
3.34 35 77.1%
3.07 42 76.2%
3.20 40 75.0%
3.20 35 77.1%
3.22 50 78.0%
3.15 26 73.1%
participants and trainers 0.68 0.68 0.67 0.61 0.80 0.65 0.78 I························ .................... .................................... I······················ .............
12- Depth of treatment of 2.96 82 65.9%
3.06 34 70.6%
2.83 42 64.3%
2.80 40 62.5%
3.09 34 70.6%
2.98 50 70.0%
2.84 25 60.0%
the issue 0.73 0.69 0.70 0.76 0.62 0.65 0.80 ............. ............ ............. .................... .............
1 ....................... . ..........
13- Amount of reading to 3.81 3.86 3.67 3.63 3.91 3.82 3.58
do in the evening outside 0.98 83 22.9% 0.94 35 17.1% 1.00
42 28.6% 1.10 40 25.0%
0.82 35 20.0% 0.94
50 24.0% 1.03
26 23.1% of course hours
53

1998 Flagship Course on Health Sector Reform and Sustainable Financing
Table D-3a. Module 3
MODULE 3 Some 10 yrs. or less Over 10 yrs. All Respondents No Economics Economics Experience Experience Men Women
EVALUATION Mean %4 Adj. Mean %4 Mean %4 Mean %4 Mean %4 Mean %4 Mean %4 f---- N f---- N - N N - N N f--- N
QUESTIONS S.D. or5 Mean S.D. or 5 S.D. Or5 S.D. or5 S.D. or 5 S.D. or 5 S.D. or 5
1- Clarity of the 4.43 40 92.5% 5.21
4.69 13 100%
4.25 24 87.5%
4.43 21 95.2% 4.38 16 87.5%
4.38 24 87.5%
4.46 13 100%
background materials .64 .48 .68 .60 .72 .71 .52
2- Usefulness of the ........................ I···
4.43 40 92.5% 5.21
4.62 13 100%
4.29 24 87.5%
4.42 21 95.2%
4.38 16 87.5% 4.42
24 87.5% 4.39
13 100% background papers .64 .51 .69 .60 .72 .72 .51
3- Usefulness of ........ ...............
1 ............
evidence from country 4.38
40 80.0% 5.16 4.31
13 76.9% 4.50
24 83.4% 4.33
21 76.1% 4.56 16 87.6% 4.54
24 83.3% 4.23
13 77.0%
studies .81 .85 .78 .86 .73 .78 .83
4- Usefulness of the 4.41 41 85.4% 5.19
4.54 13 92.3%
4.40 25 84.0%
4.41 22 86.3%
4.50 16 87.5%
4.48 25 84%
4.38 13 92.4%
case studies .74 .66 .76 73 .73 .77 .65
5- Trainers' knowledge ...... .............. , ................... I····· .' . ..........
4.63 41 97.6% 5.41
4.77 13 100%
4.60 25 100%
4.59 22 100% 4.75 16 100%
4.68 25 100%
4.62 13 100%
of the issues in general .54 .44 .50 .50 .45 .48 .51
6- Clarity of the trainers I·· ... ............................ I····· . ...........
4.58 40 100% 5.36
4.77 13 100%
4.48 25 100%
4.54 22 100% 4.63 16 100%
4.60 25 100% 4.54
13 100% in general .50 .44 .51 .51 .50 .50 .52
............ ..... . ..............
7- Quality of the trainers' 4.44 41 92.7% 5.22
4.62 13 92.3%
4.36 25 96.0%
4.32 22 90.9% 4.63 16 100%
4.64 25 100%
4.08 13 84.6%
answers to questions .63 .65 .57 .65 .50 .49 .64
8- Relevance of the I·············
4.51 41 87.8% 5.29
4.46 13 84.6%
4.56 25 92.0%
4.45 22 86.4%
4.63 16 93.8% 4.68 25 96%
4.23 13 77.9%
module to your work .71 .78 .65 .74 .62 .56 .83
9- Overall usefulness of 1 ............ ............. ........ . ...... ...... .......
1
4.63 41 100% 5.41
4.77 13 100%
4.56 25 100%
4.59 22 100%
4.69 16 100%
4.60 25 100%
4.69 13 100%
~dule .49 .44 .51 .50 .48 .50 .48
Table D-3b. Module 3
MODULE 3 All No Economics Some 10 yrs. or less Over 10 yrs. Men Women
Respondents Economics Experience Experience Mean Mean Mean Mean Mean Mean Mean
EVALUATION QUESTIONS S.D.
N %3 S.D.
N %3 S.D.
N %3 S.D.
N %3 S.D.
N %3 S.D.
N %3 S.D.
N %3
10- Time allocated to 2.90 41 63.4%
2.92 13 69.2%
2.92 25 60.0%
3.09 22 68.2% 2.69 16 56.3%
2.92 25 64.0%
2.92 13 61.5%
discussions .66 .76 64 .68 .60 .70 .64 ........... ........................... ......... ................. ..................• , .......... ............................. 1 .............. ........................... I······ ....... ....................... . ........
11- I nteraction between 3.15 41 80.5% 3.08
13 84.6% 3.16
25 80.0% 3.18
22 81.8% 3.06 16 81.3% 3.20
25 88.0% 3.00
13 69.2% participants and trainers .57 .64 .55 .66 .44 .58 .58
....................... .......... 3.23 ........ 1
I························ .......
12- Depth of treatment of the 3.17 41 73.2% 13 84.6%
3.12 25 68.0%
3.23 22 68.2% 3.06 16 81.3%
3.16 25 84.0%
3.15 13 53.8%
issue .63 .60 .67 .75 .44 .62 .69 ...................... ............................... I·· ............................. ...... I························ ........ . ............ ························1·
13- Amount of reading to do in 3.68 3.85 3.60 3.64 3.75 3.48 4.08 the evening outside of course .85
41 41.5% .99
13 30.8% .82
25 48.0% 85
22 45.5% .93
16 37.5% .87
25 52.0% .76
13 23.1% hours
54

1998 Flagship Course on Health Sector Reform and Sustainable Financing
Table 0-4a. Module 4 & 5
MODULE 4/5 Some 10 yrs. or less Over 10 yrs. All Respondents No Economics Economics Experience Experience Men Women
EVALUATION Mean %4 Adj. Mean %4 Mean %4 Mean %4 Mean %4 Mean %4 Mean %4 - N r---- N N r---- N - N - N ~ N QUESTIONS S.D. or 5 Mean S.D. or 5 S.D. Or5 S.D. or 5 S.D. or 5 S.D. or5 S.D. or 5
1- Clarity of the 4.39 36 91.6% 5.17 4.29
17 88.3% 4.33
15 93.3% 4.13
17 80.0% 4.47
17 100% 4.33 24 91.7% 4.25
8 87.5% background papers .64 .69 .62 .74 .51 .64 .71
................. ......... .................. ..... . ............ . ........
2- Usefulness of the 4.42 36 91.7% 5.20 4.41 17 88.2%
4.33 15 93.3%
4.07 17 80.0%
4.65 17 100%
4.38 24 91.7%
4.38 8 87.5%
background papers .73 .87 .62 .88 .49 .77 .74 ..................... . ............. .......................... .......... .............. ........................ ..................
3- Usefulness of evidence from country 4.38
37 86.5% 5.16 4.47
17 88.2% 4.31
16 87.6% 4.31
17 87.6% 4.47 17 88.2% 4.40 25 88.0%
4.38 8 87.5%
studies .72 .72 .70 .70 .72 .71 .74
4- Usefulness of the ........... .............................. ........ I················· .......................... ....... ........ . ........... . .........
4.32 37 89.1% 5.10 4.41 17 94.2%
4.31 16 87.6%
4.19 17 87.6%
4.53 17 94.1% 4.40 25 92.0%
4.25 8 87.5%
case method of learning .67 .62 .70 .66 .62 .65 .71
5- Trainers' knowledge ............ ........... I·············· . ......................... ............ I·· I····
4.59 37 94.6% 5.37 4.41 17 88.2%
4.69 16 100%
4.94 17 87.6%
4.65 17 100%
4.60 25 96.0%
4.38 8 87.5%
of the issues in general .60 .71 .48 .73 .49 .58 .74
6- Clarity of the trainers .... ...........................
'4.38 , . ....... , . I
4.35 37 91.8% 5.13 4.24 17 88.2% 16 93.8%
4.31 17 87.6%
4.29 17 94.1%
4.28 25
92% 4.38 8 87.5% in general .63 .66 .62 .70 .59 .61 .74
......... ......... .... . ...... .......... . ........
7- Quality of the trainers' 4.38 37 91.8% 5.16 4.47 17 94.1%
4.31 16 87.6%
4.31 17 87.6%
4.47 17 94.1%
4.36 25 92%
4.50 8 87.5%
answers to questions .64 .62 .70 .70 .62 .64 .75
8- Relevance of the 4.43 37 89.2% 5.21
4.36 17 88.3%
4.50 16 93.8%
4.38 17 87.5%
4.47 17 94.1%
4.36 25 92%
4.63 8 87.5%
module to your work .69 .70 .63 .72 .62 .64 .74
9- Overall usefulness of 4.47 ....
1
......... I· .......
36 94.5% 5.25 4.44 16 93.8%
4.56 16 100%
4.53 17 93.3% 4.47
17 100% 4.54 24 100% 4.38
8 87.5% the module .6~ .63 .51 .64 .51 .51 .74
-- - ---
Table 0-4b. Module 4 & 5
MODULE 4/5 10 yrs. or less Over 10 yrs. All Respondents No Economics Some Economics Experience Experience Men Women
EVALUATION Mean Mean Mean Mean Mean Mean Mean QUESTIONS r--- N %3 N %3 N %3 - N %3 N %3 - N %3 ~ N %3
S.D. S.D. S.D. S.D. S.D. S.D. S.D . . _--
10- Time allocated to 2.97 37 73.0%
3.12 17 88.2%
2.94 16 62.5%
3.06 17 75.0%
3.00 17 76.5% 2.96 25 76.0%
3.25 8 75.0% discussions .60 .33 .77 .68 .50 .61 .46
11- Interaction between . " ...... ...... ..... 1 ..................
3.14 37 89.2%
3.06 17 94.1% 3.25
16 81.3% 3.25
17 81.3% 3.06
17 94.1% 3.16 25 88.0% 3.13
8 87.5% participants and trainers .42 .24 .58 .58 .24 .47 .99
12- Depth of treatment of ........ ........... .............. ...........................
1 . ....
3.06 36 77.8%
3.13 16 87.5% 3.00 16 75.0%
3.06 16 81.3%
3.06 16 81.3% 3.04 25 80.0%
3.14 7 85.7% the issue .47 .34 .52 .44 .44 .45 .38
.............. ............
13- Amount of reading to 3.19 3.41 2.94 3.00 3.35 3.20 3.13 do in the evening outside
.70 37 64.9%
.71 17 70.6%
.68 16 56.3%
.63 17 62.5%
.79 17 64.7% .65
25 68.0% .99
8 50.0% of course hours
_. -
55
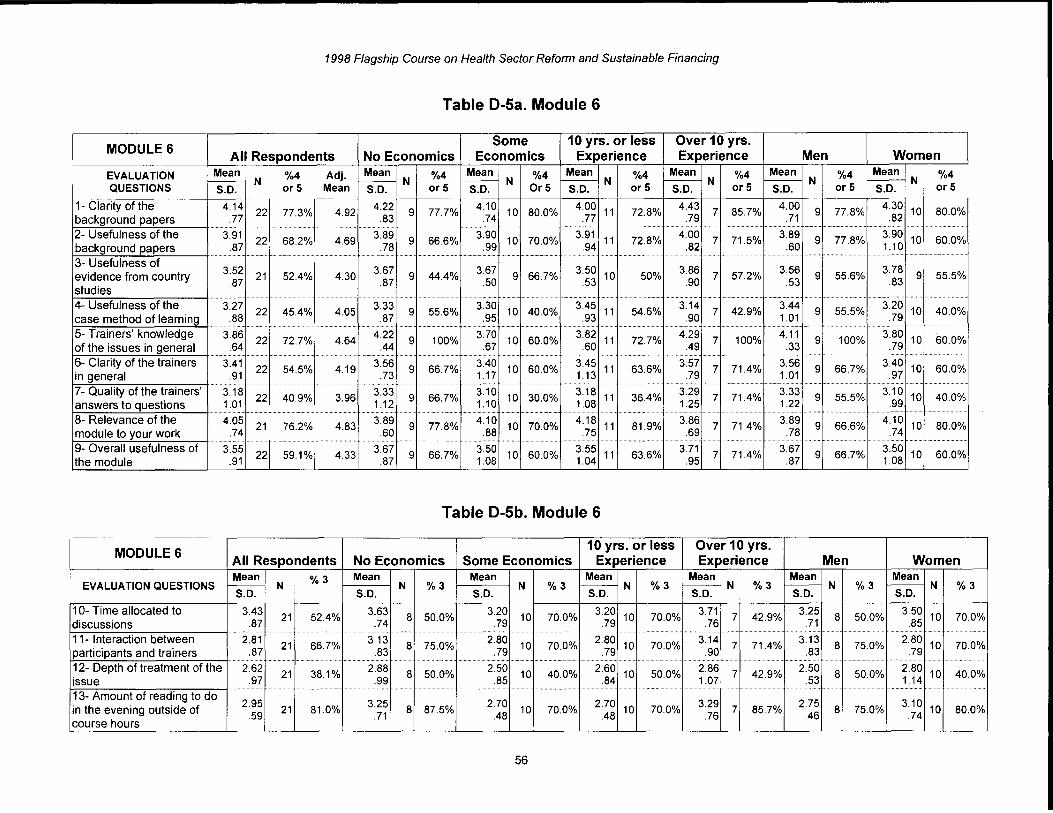
1998 Flagship Course on Health Sector Reform and Sustainable Financing
Table 0-5a. Module 6
MODULE 6 Some 10 yrs. or less Over 10 yrs.
All Respondents No Economics Economics Experience Experience Men Women
EVALUATION Mean %4 Adj. Mean %4 Mean %4 Mean %4 Mean %4 Mean %4 Mean %4 f--- N f--- N f--- N f.-- N f--- N - N - N
QUESTIONS S.D. or5 Mean S.D. or 5 S.D. Or5 S.D. or5 S.D. or5 S.D. or 5 S.D. or5 -
1- Clarity of the 4.14 22 77.3% 4.92
4.22 9 77.7%
4.10 10 80.0%
4.00 11 72.8%
4.43 7 85.7% 4.00 9 77.8%
4.30 10 80.0%
background papers .77 .83 .74 .77 .79 .71 .82 ", ......... I I
2- Usefulness of the 3.91 22 68.2% 4.69 3.89
9 66.6% 3.90
10 70.0% 3.91
11 72.8% 4.00
7 71.5% 3.89
9 77.8% 3.90 10 60.0%
background papers .87 .78 .99 .94 .82 .60 1.10
3- Usefulness of ............... I···· ............................ ........................... I· ... ······
evidence from country 3.52
21 52.4% 4.30 3.67
9 44.4% 3.67
9 66.7% 3.50
10 50% 3.86
7 57.2% 3.56 9 55.6%
3.78 9 55.5%
studies .87 .87 .50 .53 .90 .53 .83
4- Usefulness of the .......................... ....... I ............ ............. I·
3.27 22 45.4% 4.05 3.33
9 55.6% 3.30
10 40.0% 3.45
11 54.6% 3.14
7 42.9% 3.44
9 55.5% 3.20
10 40.0% case method of learning .88 .87 .95 .93 .90 1.01 .79
5- Trainers' knowledge I· .. I····
3.86 22 72.7% 4.64 4.22 9 100%
3.70 10 60.0%
3.82 11 72.7%
4.29 7 100% 4.11
9 100% 3.80 10 60.0%
of the issues in general .64 .44 .67 .60 .49 .33 .79
6- Clarity of the trainers ................ I I············ ............ ................................. ....................
1
3.41 22 54.5% 4.19 3.56
9 66.7% 3.40 10 60.0%
3.45 11 63.6%
3.57 7 71.4% 3.56 9 66.7%
3.40 10 60.0%
in general .91 .73 1.17 1.13 .79 1.01 .97
7- Quality of the trainers' .......................... .......... I ....... I·
3.18 22 40.9% 3.96
3.33 9 66.7%
3.10 10 30.0%
3.18 11 36.4%
3.29 7 71.4%
3.33 9 55.5%
3.10 10 40.0%
answers to questions 1.01 1.12 1.10 1.08 1.25 1.22 .99 I· .................................
8- Relevance of the 4.05 21 76.2% 4.83 3.89 9 77.8% 4.10
10 70.0% 4.18
11 81.9% 3.86
7 71.4% 3.89
9 66.6% 4.10
10 80.0% module to your work .74 .60 .88 .75 .69 .78 .74
9- Overall usefulness of .............
1 . ...........
3.55 22 59.1% 4.33
3.67 9 66.7%
3.50 10 60.0%
3.55 11 63.6%
3.71 7 71.4%
3.67 9 66.7%
3.50 10 60.0% the module .91 .87 1.08 1.04 .95 .87 1.08
Table 0-5b. Module 6 ....
10 yrs. or less Over 10 yrs. MODULE 6 All Respondents No Economics Some Economics Experience Experience Men Women
Mean %3 Mean Mean Mean Mean Mean Mean EVALUATION QUESTIONS - N N %3 N %3 N %3 f--- N %3 - N %3 - N %3
S.D. S.D. S.D. S.D. S.D. S.D. S.D.
10- Time allocated to 3.43 21 52.4% 3.63
8 50.0% 3.20
10 70.0% 3.20
10 70.0% 3.71 7 42.9%
3.25 8 50.0%
3.50 10 70.0%
discussions .87 .74 .79 .79 .76 .71 .85 .......... I ...... ........... ....... .................. . ....... ... .......
11- Interaction between 2.81 21 66.7% 3.13
8 75.0% 2.80
10 70.0% 2.80
10 70.0% 3.14
7 71.4% 3.13
8 75.0% 2.80
10 70.0% participants and trainers .87 .83 .79 .79 .90 .83 .79
.... ... .......................... ...........
2.62 12- Depth of treatment of the 21 38.1% 2.88
8 50.0% 2.50
10 40.0% 2.60
10 50.0% 2.86 7 42.9% 2.50
8 50.0% 2.80
10 40.0% issue .97 .99 .85 .84 1.07 .53 1.14
................ .................................. ... ........... ...................
13- Amount of reading to do 2.95 3.25 2.70 2.70 3.29 2.75 3.10
in the evening outside of .59 21 81.0%
.71 8 87.5%
.48 10 70.0%
.48 10 70.0%
.76 7 85.7%
.46 8 75.0%
.74 10 80.0%
course hours --
56

1998 Flagship Course on Health Sector Reform and Sustainable Financing
Table 0-6a. Module 7
MODULE 7 Some 10 yrs. or less Over 10 yrs.
All Respondents No Economics Economics Experience Experience Men Women EVALUATION Mean %4 Adj. Mean %4 Mean %4 Mean %4 Mean %4 Mean %4 Mean %4 - N r---- N f--- N - N f--- N - N f--- N QUESTIONS S.D. or 5 Mean S.D. or5 S.D. Or5 S.D. or 5 S.D. or5 S.D. or5 S.D. or 5
1- Clarity of the 4.57 23 95.7% 5.35
4.50 8 100%
4.54 13 92.3%
4.40 15 93.4%
4.83 6 100%
4.40 10 90% 4.60
10 100% background papers .59 .53 .66 .63 .41 .70 .52
2- Usefulness of the .......................... ........... I···· .........
4.35 23 78.2% 5.13
4.00 8 62.5%
4.46 13 84.6%
4.20 15 73.4%
4.50 6 83.4% 4.20 10 70%
4.30 10 80.0%
background papers .83 .93 .78 .86 .84 .92 .82 .... 1 .................. 1 . ............................ ............................ ! ........... ··1····· ................
3- Usefulness of 4.17 3.75 4.38 4.13 4.17 4.00 4.20
evidence from country .83 23 82.6% 4.95
.71 8 62.5%
.87 13 92.3%
.92 15 80.0%
.75 6 83.3%
1.05 10 70%
.63 10 90.0%
studies 4- Usefulness of the
....................... I .... ····· ......................... .......................... ..................
4.35 23 87.0% 5.13 4.00 8 75%
4.46 13 92.3%
4.40 15 86.7%
4.00 6 83.4% 4.20 10 80%
4.30 10 90.0%
case method of learning .83 1.07 .66 .91 .63 1.03 .67 ................... .............................. I····················· ........... ........
5- Trainers' knowledge 4.70 23 95.6% 5.48 4.75
8 100% 4.62
13 92.3% 4.60
15 93.4% 4.83
6 100% 4.50 10 90% 4.80
10 100% of the issues in general .56 .46 .65 .63 .41 .71 .42
6- Clarity of the trainers ......... ................................. ···1
4.61 23 91.3% 5.39
4.50 8 87.5%
4.62 13 92.3%
4.40 15 86.7%
5.00 6 100%
4.40 10 80%
4.70 10 100%
in general .89 1.07 .87 1.06 .00 1.26 .48
7- Quality of the trainers' .............................. ... ..., ...... . ............ 1 . ........ I·····
4.48 23 91.3% 5.26
4.38 8 87.5%
4.46 13 92.3%
4.27 15 86.6%
4.83 6 100%
4.20 10 80% 4.60
10 100% answers to questions .90 1.06 .88 1.03 .41 1.23 .52
8- Relevance of the ....... , ................. . ......... ........................ 1 . ........
4.39 23 87.0% 5.17
4.00 8 75%
4.54 13 92.3%
4.33 15 86.6%
4.33 6 83.4%
4.30 10 80%
4.40 10 90.0% module to your work .94 1.31 .66 .90 1.21 1.25 .70
9- Overall usefulness of ............ .......................... ......................... .......... 1···············1 . ........ I" . ...... ......... .......................... .................. 1
4.35 23 91.3% 5.13 3.88
8 75% 4.62
13 100% 4.40
15 93.3% 4.17
6 83.3% 4.20
10 80% 4.50 10 100%
the module .88 1.25 .51 .83 1.17 1.23 .53
Table 0-6b. Module 7
MODULE 7 10 yrs. or less Over 10 yrs. All Respondents No Economics Some Economics Experience Experience Men Women
EVALUATION Mean Mean Mean Mean Mean Mean Mean
QUESTIONS N %3 N %3 N %3 - N %3 ,..---- N %3 - N %3 r--- N %3
S.D. S.D. S.D. S.D. S.D. S.D. S.D.
10- Time allocated to 3.14 22 59.1%
3.00 8 75.0%
3.23 13 46.2%
3.00 15 60.0%
3.50 6 50.0%
3.20 10 40.0%
3.10 10 70.0%
discussions .64 .53 .73 .65 .55 .79 .57 ................. .............................. .................................. . ................ .................. ...... .............
11- Interaction between 3.18 22 72.7%
3.00 8 75.0% 3.23 13 76.9%
3.07 15 80.0%
3.33 6 66.7% 3.20 10 60.0%
3.10 10 90.0%
participants and trainers .50 .53 .44 .46 .52 .63 .32 ·····1··············· ................................. .......................... I· ........ .................
3.33 , .... , .... . ............................ ........................... " ..... ........
12- Depth of treatment of 3.00 21 52.4%
2.88 8 62.5%
3.00 12 50.0%
2.79 14 50.0% 6 66.7% 2.80 10 40.0%
3.10 10 70.0%
the issue .90 .64 1.04 .98 .52 1.14 .57
13- Amount of reading to ............ . ......................... .........
1 ..... . ..... I'
3.24 3.43 3.00 3.00 3.50 3.22 3.10 do in the evening outside .62 21 71.4%
.53 7 57.1%
.41 13 84.6%
.39 14 85.7%
.55 6 50.0% .67
9 55.6% .32
10 90.0% of course hours
-- -- -
57

1998 Flagship Course on Health Sector Reform and Sustainable Financing
Table 0-7a. Module 8
MODULE 8 Some 10 yrs. or less Over 10 yrs.
All Respondents No Economics Economics Experience Experience Men Women
EVALUATION Mean %4 Adj. Mean %4 Mean %4 Mean %4 Mean %4 Mean %4 Mean %4 r--- N - N f--- N f---- N - N N r--- N QUESTIONS S.D. or 5 Mean S.D. or 5 S.D. Or5 S.D. or 5 S.D. or5 S.D. or 5 S.D. or 5
1- Clarity of the 4.00 20 80.0% 4.78
4.18 11 81.9% 3.86
7 85.7% 4.09
11 90.9% 3.83
6 66.6% 4.3 10 90.0% 3.75
8 75.0% background papers .92 .98 .90 .83 1.17 .67 1.17
2- Usefulness of the + ............. I·
4.25 20 85.0% 5.03
4.36 11 91.0%
4.14 7 85.7%
4.27 11 90.9%
4.17 6 83.3%
4.50 10 100% 4.00
8 75.0% background papers .72 .67 .69 .65 .75 .53 .76
3- Usefulness of ........................ I···· ! . ....................... I·········
evidence from country 4.10 20 75.0% 4.88
4.27 11 81.9% 3.50
6 50.0% 3.80
10 60.0% 4.17
6 83.3% 4.20 10 80.0%
3.71 7 57.2%
studies .79 .79 .55 .79 .75 .79 .76
4- Usefulness of the .............
1 ! ............... ..... I············
4.00 20 65.0% 4.78 4.27 11 72.7%
3.57 7 42.9%
3.82 11 54.6%
4.17 6 66.7% 4.20 10 70.0%
3.75 8 50.0%
case method of learning .86 .90 .79 .87 .98 .92 .89
5- Trainers' knowledge ....
1 ................. . """ .................. I··· .+ ...
4.19 21 81.0% 4.97 4.55 11 100%
357 7 57.1%
3.91 11 72.7%
4.50 6 100% 4.50 10 100%
3.75 8 62.5%
of the issues in general .75 .52 .53 .70 .55 .53 .71 ........ ............. ... "" ................... .............. . .................... I·················· 1
6- Clarity of the trainers 3.81 4.36 3.29 3.64 4.33 4.20
3.63 21 71.4% 4.59 11 100% 7 57.1% 11 72.7% 6 100% 10 90.0% 8 75.0%
in general .87 .50 .95 .92 .52 .63
1.06 ................... . .......... .. ..... " ... "" ...... ............ ..........................
4.40 7- Quality of the trainers' 4.00 21 85.7% 4.78 4.45
11 100% 3.43
7 71.4% 3.73
11 81.8% 4.50
6 100% 10 100% 3.63
8 75.0% answers to questions .84 .52 .98 .90 .55
.52 1.06
..................... ...... ................. .......................... ............... .... ....................... I············ . .............. ............. . .......
8- Relevance of the 4.32 4.55 4.00 4.20 4.50 4.80 3.71
module to your work 1.00 19 89.4% 5.1
.52 11 100%
1.55 6 83.3%
1.23 10 90.0%
.55 6 100% 10 100%
1.25 7 85.7%
.42 ........... ..........
9- Overall usefulness of 4.29 21 95.2% 5.07
4.64 11 100%
3.86 7 85.7%
4.09 11 90.9%
4.67 6 100% 4.70 10 100%
3.88 8 87.5%
the module .72 .50 .90 .83 .52 .83 .48 .
Table 0-7b. Module 8
MODULE 8 10 yrs. or less Over 10 yrs.
All Respondents No Economics Some Economics Experience Experience Men Women EVALUATION Mean Mean Mean Mean Mean Mean Mean
QUESTIONS N %3 N %3 N %3 - N %3 N %3 N %3 r-- N %3
S.D. S.D. S.D. S.D. S.D. S.D. S.D.
10- Time allocated to 3.24 21 76.2%
3.27 11 81.8% 2.86 7 85.7%
2.91 11 90.9%
3.50 6 66.7%
3.12 10 80.0% 3.13
8 87.5% discussions .70 .65 .38 .30 .84 .74 .35
.................................. ............... ......... I···· .................... I··········· I· ...
11- Interaction between 3.19 21 61.9%
3.09 11 63.6% 3.00
7 71.4% 2.91
11 72.7% 3.17
6 66.7% 3.20 10 50.0% 2.88
8 87.5% participants and trainers .81 .83 .58 .54 .98
.92 .35
............... . ...................... 1 ............................ ............... ...........
12- Depth of treatment of 2.90 20 65.0%
3.10 10 80.0% 2.29 7 42.9%
2.55 11 63.6%
3.20 5 60.0%
3.00 10 70.0%
2.43 7 57.1%
the issue .91 .74 .76 .69 1.10 .82 .79 ............................ ......... I ............................. . .... "." .... "" ................... I· ...............
13- Amount of reading to 3.33 3.18 3.14 3.09 3.33 3.20 3.13 do in the evening outside .73
21 66.7% .40
11 81.8% .69
7 57.1% .54
11 72.7% .52
6 66.7% .42
10 80.0% .64 8 62.5% of course hours
-- - '----.- - -
58
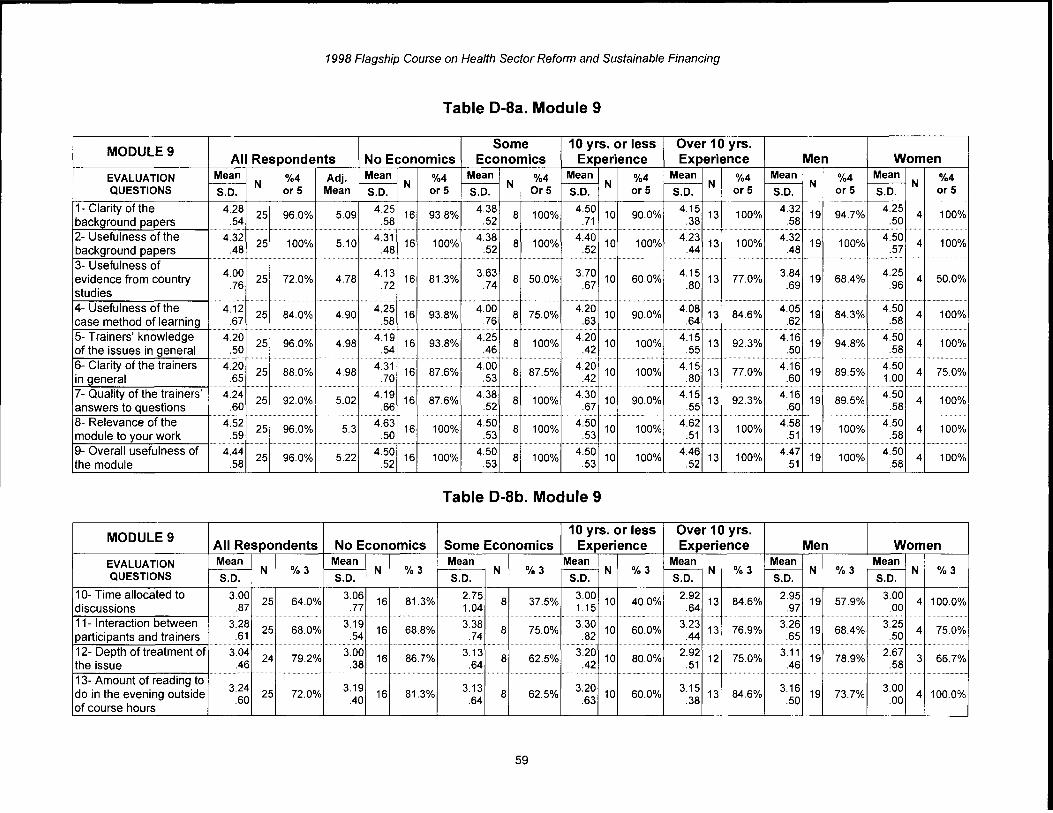
1998 Flagship Course on Health Sector Reform and Sustainable Financing
Table D-8a. Module 9
MODULE 9 Some 10 yrs. or less Over 10 yrs.
All Respondents No Economics Economics Experience Experience Men Women EVALUATION Mean %4 Adj. Mean %4 Mean %4 Mean %4 Mean %4 Mean %4 Mean %4 - N - N - N r-- N N I-- N - N QUESTIONS S.D. or 5 Mean S.D. or 5 S.D. Or5 S.D. or5 S.D. or 5 S.D. or 5 S.D. or5
1- Clarity of the 4.28 25 96.0% 5.09 4.25 16 93.8%
4.38 8 100%
4.50 10 90.0%
4.15 13 100%
4.32 19 94.7%
4.25 4 100%
background papers .54 .58 .52 .71 .38 .58 .50 ............................... .......... . ........
2- Usefulness of the 4.32 25 100% 5.10 4.31 16 100%
4.38 8 100%
4.40 10 100%
4.23 13 100%
4.32 19 100%
4.50 4 100%
background papers .48 .48 .52 .52 .44 .48 .57 .............................. ...................... . ......
3- Usefulness of evidence from country 4.00
25 72.0% 4.78 4.13 16 81.3% 3.63
8 50.0% 3.70
10 60.0% 4.15
13 77.0% 3.84
19 68.4% 4.25
4 50.0% studies
.76 .72 .74 .67 .80 .69 .96 ................................. ...................... ............... .........
4- Usefulness of the 4.12 25 84.0% 4.90
4.25 16 93.8%
4.00 8 75.0%
4.20 10 90.0%
4.08 13 84.6%
4.05 19 84.3% 4.50
4 100% case method of learning .67 .58 .76 .63 .64 .62 .58
5- Trainers' knowledge ........ f·····
4.20 25 96.0% 4.98 4.19 16 93.8% 4.25
8 100% 4.20
10 100% 4.15
13 92.3% 4.16
19 94.8% 4.50
4 100% of the issues in general .50 .54 .46 .42 .55 .50 .58
............... ............ ...................... .................. ............. ............... .................. . ...................... ,," I . ........... ............................. .. .
6- Clarity of the trainers 4.20 25 88.0% 4.98
4.31 16 87.6%
4.00 8 87.5%
4.20 10 100%
4.15 13 77.0%
4.16 19 89.5% 4.50
4 75.0% in general .65 .70 .53 .42 .80 .60 1.00
............................ ................. ............ .... ........... ......... ........ ........... .........
7- Quality of the trainers' 4.24 25 92.0% 5.02
4.19 16 87.6% 4.38
8 100% 4.30
10 90.0% 4.15
13 92.3% 4.16
19 89.5% 4.50
4 100% answers to questions .60 .66 .52 .67 .55 .60 .58
.......................... ............... . ..
8- Relevance of the 4.52 25 96.0% 5.3 4.63 16 100%
4.50 8 100%
4.50 10 100%
4.62 13 100%
4.58 19 100%
4.50 4 100%
module to your work .59 .50 .53 .53 .51 .51 .58 ......................... I ........... ............. ........................... ............ .. ............................
9- Overall usefulness of 4.44 25 96.0% 5.22
4.50 16 100%
4.50 8 100%
4.50 10 100%
4.46 13 100%
4.47 19 100%
4.50 4 100%
the module .58 .52 .53 .53 .52 .51 .58
Table D-8b. Module 9
MODULE 9 10 yrs. or less Over 10 yrs.
All Respondents No Economics Some Economics Experience Experience Men Women EVALUATION Mean Mean Mean Mean Mean Mean Mean
QUESTIONS N %3 N %3 N %3 ,--- N %3 N %3 I--- N %3 - N %3
S.D. S.D. S.D. S.D. S.D. S.D. S.D. ..-
10- Time allocated to 3.00 25 64.0%
3.06 16 81.3% 2.75
8 37.5% 3.00
10 40.0% 2.92
13 84.6% 2.95 19 57.9%
3.00 4 100.0%
discussions .87 .77 1.04 1.15 .64 .97 .00 ... ................. .... ... . ............. .......................... ........... ............................ .. .
11- I nteraction between 3.28 25 68.0%
3.19 16 68.8% 3.38 8 75.0%
3.30 10 60.0%
3.23 13 76.9%
3.26 19 68.4%
3.25 4 75.0%
participants and trainers .61 .54 .74 .82 .44 .65 .50
12- Depth of treatment of ·················1 ........................ I·············· f ............................ I·······················
3.04 24 79.2%
3.00 16 86.7% 3.13
8 62.5% 3.20
10 80.0% 2.92
12 75.0% 3.11 19 78.9% 2.67
3 66.7% the issue .46 .38 .64 .42 .51 .46 .58
···1 .... " ..........................
13- Amount of reading to 3.24 3.19 3.13 3.20 3.15 3.16 3.00 do in the evening outside .60
25 72.0% .40
16 81.3% .64
8 62.5% .63
10 60.0% .38
13 84.6% .50
19 73.7% .00
4 100.0% of course hours
'------- .. -- i .. -----
59

1998 Flagship Course on Health Sector Reform and Sustainable Financing
Table 0-9a. Module 11
MODULE 11 Some 10 yrs. or less Over 10 yrs.
All Respondents No Economics Economics Experience Experience Men Women
EVALUATION Mean %4 Adj. Mean %4 Mean %4 Mean %4 Mean %4 Mean %4 Mean %4 I-- N I---- N - N I---- N - N I---- N f-- N
QUESTIONS S.D. or 5 Mean S.D. or5 S.D. Or5 S.D. or 5 S.D. or 5 S.D. or 5 S.D. or 5
1- Clarity of the 4.07 81 80.3% 4.85 4.17
36 83.3% 3.92
38 73.7% 4.11
38 79.0% 3.94
35 77.1% 4.10
48 79.2% 3.92
25 76.0% background papers 0.72 0.70 0.75 0.73 0.73 0.72 0.76
.... 1 ................... 1 1 ......... I······ 2- Usefulness of the 4.09
80 76.3% 4.87 4.14 36 77.8%
3.95 38 71.0%
4.08 38 73.7%
3.97 35 74.3%
4.15 48 81.3%
3.84 25 60.0%
background papers 0.87 0.90 0.87 0.78 0.98 0.87 0.90 ···1· ..... .........
1 ............ . .......................... I· 1 . .....
3- Usefulness of 3.57 3.72 3.46 3.53 3.62 3.75 3.23
evidence from country 0.94
82 52.4% 4.35 0.97
36 52.8% 0.94
39 51.3% 0.9
40 52.5% 0.92
34 50.0% 0.96
48 60.4% 0.86
26 34.6%
studies .................. ... . ........ I···· . .......................... ......... .............................
4- Usefulness of the 3.89 83 67.5% 4.67 4.05
37 75.6% 3.72
39 61.6% 3.88
40 65.0% 3.86
35 71.5% 4.00
49 75.5% 3.62
26 53.8% case method of learning 0.91 0.81 0.97 0.94 0.88 0.87 0.94
5- Trainers' knowledge ........................... ........... , . . ............................... I·
4.22 83 86.7% 5.00
4.27 37 83.7%
4.13 39 87.2%
4.23 42 73.4%
4.14 35 80.0%
4.31 49 89.8%
4.00 26 76.9%
of the issues in general 0.70 0.73 0.70 0.62 0.81 0.65 0.80
6- Clarity of the trainers 3.93 I···· ... ........ , ............... ...... 1 . ................................ 13.77
81 76.6% 4.71 4.00
36 77.8% 3.82
38 71.0% 3.92
39 74.3% 3.85
34 73.5% 3.98
47 78.7% 26 65.3% in general 0.67 0.76 0.61 0.66 0.70 0.71 0.65
, .. ...........................
7- Quality of the trainers' 3.81 81 65.5% 4.59 3.92
36 69.4% 3.63
38 55.3% 3.76
38 63.1% 3.74
35 60.0% 3.89
47 68.1% 3.54
26 50.0% answers to questions 0.79 0.81 0.79 0.82 .78 0.79 0.81
... ........................... . ..... I······················
8- Relevance of the 3.94 83 71.1% 4.72
3.97 37 67.5%
3.90 39 74.4%
3.90 40 72.5%
3.94 35 68.6%
4.04 49 77.5%
3.73 26 57.7%
module to your work 0.93 0.93 0.97 0.93 0.97 0.96 0.92
9- Overall usefulness of I··········· .......... ....... 1 ......
3.86 83 67.5% 4.64
4.05 37 72.9%
3.62 39 56.4%
3.80 4 65.0%
3.83 35 62.9%
3.98 49 73.5%
3.54 26 46.1%
the module 0.91 0.85 0.99 0.94 0.95 0.92 0.95
Table 0-9b. Module 11
MODULE 11 10 yrs. or less Over 10 yrs.
All Respondents No Economics Some Economics Experience Experience Men Women EVALUATION Mean Mean Mean Mean Mean Mean Mean
N %3 N %3 N %3 N %3 - N %3 f-- N %3 f-- N %3 QUESTIONS S.D. S.D. S.D. S.D. S.D. S.D. S.D.
10- Time allocated to 2.90 81 66.7%
3.03 37 75.7%
2.76 37 56.8%
2.90 39 61.5%
2.88 34 70.6%
2.79 47 55.3% 3.08
26 84.6% discussions 0.60 0.50 0.68 0.68 0.54 0.69 0.39
11- Interaction between .......... . ......................... I················ I· .................... ioo . .. ..........
2.96 82 67.1%
2.97 37 70.3%
2.89 38 63.2% 39 61.5%
2.86 35 71.4%
2.94 48 66.7%
2.92 26 65.4%
participants and trainers 0.64 0.55 0.73 0.69 0.60 0.63 0.69
12- Depth of treatment of I····· ........................... . ........... I········ ......... 1 ......•..•••... . ...
2.77 81 54.3% 2.81
36 55.6% 2.74
38 55.3% 2.77
39 56.4% 2.76
34 52.9% 2.82
49 61.2% 2.67
24 41.7% the issue 0.75 0.71 0.79 0.74 0.78 0.70 0.87
13- Amount of reading to ..... ......... I ... , .............. I
3.10 3.14 3.03 3.00 3.17 3.16 2.88 do in the evening outside 0.62 83 75.9%
0.59 37 81.1%
0.67 39 71.8% 0.78
40 70.0% 0.38
35 82.9% 0.59
49 75.5% 0.65
26 80.8% of course hours
60

1998 Flagship Course on Health Sector Reform and Sustainable Financing
Table 0-10a. End-of-Course Evaluation
END OF COURSE Some 10 yrs. or less Over 10 yrs. All Respondents No Economics Economics Experience Experience Men Women
EVALUATION Mean %4 Adj. Mean %4 Mean %4 Mean %4 Mean %4 Mean %4 Mean %4 r----- N - N - N r----- N r----- N r----- N - N QUESTIONS S.D. or 5 Mean S.D. or 5 S.D. Or5 S.D. or 5 S.D. or5 S.D. or 5 S.D. or 5
1- Effectiveness of the 4.09 81 84.0% 4.87 4.06
36 86.1% 4.13
38 81.6% 4.13
39 84.6% 4.06
34 82.3% 4.14
49 83.7% 4.00
24 83.4% case method of learning .71 .75 .70 .66 .81 .79 .59
............. 1
............................. ............ I···················
2- Usefulness of the 4.05 80 78.8% 4.83 4.28 36
86.1% 3.84
37 73.0% 3.92
38 76.3% 4.18
34 82.4% 4.10
49 77.5% 3.96
23 82.6% feedback sessions .79 .70 .83 .85 .72 .85 .71
............................... ................. .... -.. ................. . ........................ ...........
3- Effectiveness of the feedback session in
3.71 75 64.0% 4.49 4.03
35 80.0% 3.37
35 48.6% 3.49
35 51.4% 3.88 34 76.5% 3.78 46 67.4%
3.52 23 56.5%
changing modules .94 0.66 1.09 .98 .88 .99 .90
.............. ............... ............
4- Satisfaction with the 4.56 81 95.1% 5.34
4.58 36 97.2%
4.47 38 92.1%
4.59 39 94.9%
4.44 34 94.1%
4.59 49 96.0%
4.38 24 91.6%
course organizers .59 .55 .65 .59 .61 .57 .65
5- Satisfaction with .... ... 1 .........................
logistical and practical 4.43 80 91.3% 5.21 4.44
36 91.7% 4.32
37 89.1% 4.42
38 89.4% 4.32
34 91.2% 4.39 49 93.9% 4.35
23 82.6% arrangement
.65 .65 .67 .68 .64 .61 .78 I···· ................
6- Satisfaction with 4.06 79 69.6% 4.84 3.86
35 60.0% 4.19
37 75.6% 4.14
37 70.2% 3.88 34 64.7%
3.98 49 67.4%
4.14 22 68.2%
social events .95 .94 .97 1.00 .91 1.01 .89 ............................... ............................ ............. .............................. I··························· . ........
7- Satisfaction with hotel 4.08 74 77.0% 4.86 4.14 35 80.0%
3.91 32 68.7%
4.00 35 71.4% 4.03
31 77.4% 4.11 46 80.5% 3.85 20 60.0%
accommodations .81 .73 .89 .91 .71 .82 .81
8- Degree you would ...... ... I··············· ........ ............ ......... I····· .. ......
4.56 4.63 4.47 4.59 4.48 4.63 4.35 recommend course to .61
80 93.8% 5.34 .60
35 94.3% .65 38 92.1% .59 39 94.9%
.67 33 90.9% .57
49 95.9% .71 23 86.9% others 9- Degree the course
...................... . ..................•••..••••. ............................ 1
4.16 4.09 4.19 4.24 4.00 4.31 3.74 fulfilled your .76
79 81.0% 4.95 .70
35 80.0% .84 37 78.3%
.88 38 76.3%
.61 33 81.8% .66
48 89.6% .86
23 56.5% expectations
........................ I··· . ........................ I················ 1
10- Relevance of the 4.43 81 93.8% 5.21 4.31
36 91.7% 4.53
38 97.4% 4.54
39 94.9% 4.26 34 94.2%
4.45 49 93.9%
4.38 24 95.9% course to your work .61 .62 .56 .60 .57 .61 .58
........................ ............................. ......................... ............. ........... 1 I· . .................... . .........
11- Usefulness of the 4.49 81 92.6%
5.27 4.50 36 88.9%
4.47 38 97.3%
4.46 39 89.8%
4.50 34 97.0% 4.63 49 97.9%
4.17 24 83.3%
course .67 .70 .65 .76 .56 .60 .70
61

1998 Flagship Course on Health Sector Reform and Sustainable Financing
Table 0-10b. End-of-Course Evaluation
END OF COURSE 10 yrs. or less Over 10 yrs.
All Respondents No Economics Some Economics Experience Experience Men Women
EVALUATION Mean Mean Mean Mean Mean Mean Mean
QUESTIONS N %3 N %3 N %3 r--- N %3 - N %3 - N %3 - N %3
S.D. S.D. S.D. S.D. S.D. S.D. S.D.
12- Depth of treatment of 3.13 80 70.0%
3.11 35 80.0%
3.08 38 63.2%
3.05 39 66.7%
3.15 33 75.8%
3.08 49 77.6%
3.09 23 60.9%
the Issue .60 .53 .67 .65 .57 .53 .73 ····1 ..................... . ........................... I·······
13- Degree of 3.07 2.97 3.21 3.13 3.09 3.21
involvement in the .65 81 65.4%
.61 36 63.9% .66 38 68.4%
.61 39 69.2%
.67 34 64.7% 3.02 49 71.4%
.72 24 58.3%
course .59 ...................... ............ I················
14- Attention devoted to 3.22 79 70.9%
3.06 36 75.0%
3.36 36 69.4%
3.31 39 71.8%
3.09 32 71.9%
3.11 47 74.5%
3.38 24 70.8%
the "what to do" .63 .58 .59 .66 .53 .56 .65 .............. . ........ ...................... ...................... ............. ..............
15- Attention devoted to 2.85 80 48.8%
2.83 36 55.6%
2.86 37 43.2%
2.82 39 43.6%
2.88 33 54.5%
2.85 48 50.0%
2.75 24 50.0%
the "how to do it" .87 .77 .95 .97 .74 .82 .85 ....................... . .........•... ............ ..............................
16- Amount of learning 3.47 81 51.9%
3.36 36 55.6%
3.58 38 47.4%
3.54 39 48.7%
3.44 34 55.9%
3.37 49 57.1% 367
24 41.7% materials .67 .64 .72 .79 .50 .70 .64
.......... ... ................................. •............. ............................. I .. ..................... I················ ......................... . ......
17- Attention devoted to 3.10 80 57.5%
3.09 35 68.6%
3.11 38 47.4%
3.15 39 56.4%
3.03 33 57.6% 2.96 49 65.3%
3.35 23 43.5%
evidence-based learning .70 .56 .83 .71 .73 .64 .78 .............. ... .................... I····
18- Attention devoted to 3.26 81 56.8%
3.28 36 69.4%
3.16 38 52.6%
3.21 39 51.3%
3.24 34 70.6%
3.14 49 65.3%
3.33 24 54.2%
country case studies .72 .57 .79 .83 .50 .58 .87 ............ .............. ....... ...................... ............................ .. ...................... 1
19- Overall length of the 3.37 81 46.9%
3.36 36 44.4%
3.34 38 47.4%
3.33 39 56.4% 3.35
34 35.3% 3.24
49 55.1% 3.50
24 29.2% course .86 .93 .81 .81 .95 .80 .93
62

1998 Flagship Course on Health Sector Reform and Sustainable Financing
Table 0-11a. Self-Assessment of Knowledge in Module 2
MODULE 2 --~.
Some 10 yrs. or less Over 10 yrs. SELF-REPORTED All Respondents No Economics Economics Experience Experience Men Women
RATINGS ON PRE/POST Mean Change Mean Change Mean Change Mean Change Mean Change Mean Change Mean Change
QUESTIONS Pre Post Total Pre Post
Total Pre Post Total Pre Post
Total Pre Post
Total Pre Post Total Pre Post
Total ('Yo) ('Yo) ('Yo) ('Yo) ('Yo) ('Yo) ('Yo)
Understand basic aspects of 2.85 4.20
1.35 2.41 4.17
1.74 3.24 4.24
1.02 3.05 4.20
1.13 2.63 4.24
1.65 2.98 4.31
1.33 2.65 4.04 1.38
the policy cycle (47.2) (72.0) (31.6) (37.0) (62.7) (44.7) (52.2)
Understand processes used I·················· I····················· .............. c .. 1 1 ........ I . ..............
2.66 4.01 1.37
2.39 3.94 1.55
2.90 4.08 1.20
2.79 3.97 1.18
2.56 4.03 1.52
2.73 4.13 1.43
2.56 3.80 1.24
to define problems (51.3) (64.6) (41.3) (42.5) (59.2) (52.2) (48.4)
Understand role of values to I······· ........ ........• ..... "" ................... t ............... I I ...........
2.72 4.13 1.44
2.56 4.09 1.53
2.93 4.17 1.29
2.82 4.20 1.38
2.63 4.03 1.47
2.80 4.22 1.48
2.65 3.92 1.27
determine problems (53.1) (59.8) (44.1) (49.1) (55.9) (52.9) (47.8)
Need for a causal diagnostic I I .............. c .. I .............. ................... t····················· I·············· ........................... t .. · ...... ··········· . ....
2.98 4.25 1.28
2.76 4.17 1.38 3.17 4.28
1.13 3.08 4.26
1.16 2.86 4.21
1.38 2.96 4.27 1.32
3.04 4.15 1.12
model (43.0) (50.0) (35.5) (37.6) (48.4) (44.6) (36.7)
Understand barriers to ............... . ................ f .................... I .
3.06 4.29 1.23
2.79 4.26 1.44
3.31 4.41 1.12
3.31 4.38 1.05
2.77 4.29 1.56
3.12 4.37 1.25
3.00 4.31 1.31
reform (40.3) (51.6) (33.9) (31.8) (56.2) (40.0) (43.6)
Understand role of I I···· .................... 1 ..........................
2.94 4.23 1.31
2.74 4.26 1.50 3.17 4.24
1.12 3.08 4.25
1.15 2.80 4.24
1.50 2.96 4.33
1.40 3.00 4.12
1.12 incentives (44.7) (54.8) (35.4) (37.5) (53.6) (47.2) (37.2)
Understand financial I ............... f ...... c .......... ~ .. ~.
3.06 4.24 1.21
2.91 4.23 1.32 3.19 4.27
1.12 3.23 4.28
1.05 2.83 4.21
1.44 3.08 4.35
1.31 3.04 4.08
1.04 incentive effects (39.5) (45.5) (35.2) (32.5) (51.0) (42.6) (34.2)
Understand the structure of I··· , .......................... I· ....................... . ..................
2.65 3.58 0.95
2.41 3.53 1.18
2.83 3.61 0.76 2.84
3.67 0.83
2.34 3.41 1.12
2.63 3.57 0.98
2.63 3.55 0.91
national health accounts (35.8) (49.0) (27.0) (29.2) (47.7) (37.2) (34.6)
Understand how macro I : .......................... 1'1.47
, ...•••..•........... I· . ..............
2.73 3.94 1.23
2.35 3.80 1.44 3.15 4.08
0.95 3.08 4.00
0.92 2.43 3.85 2.85 4.06 1.23
2.65 3.77 1.12
structure relates to finance (44.9) (61.3) (30.2) (29.9) (60.6) (43.2) (42.0)
Understand how regulation I .. ···· ................. I· ..................... . .................. , .
3.15 4.01 0.88 2.97 4.03
1.06 3.33 3.98
0.66 3.31 3.93
0.62 3.00 4.06
1.09 3.20 4.10
0.92 3.12 3.85
0.73 can affect behavior (27.9) (35.6) (19.8) (18.6) (36.3) (28.6) (23.5)
Understand role of patients I····· I· I ........ I···················
3.08 3.89 0.81
3.06 4.06 1.00 3.10 3.74 0.64
3.05 3.71 0.65
3.06 4.06 1.00
3.13 4.00 0.86 3.00 3.72 0.72
in shaping health system (26.4) (32.6) (20.7) (21.2) (32.7) (27.6) (24.0)
Understand how employee ............ , ........... ....................... ............ " ••...................... I············· I····················· ................................... ...................... ...........
2.95 3.88 0.93
2.71 3.86 1.15
3.14 3.88 0.73
3.00 3.78 0.77
2.83 3.94 1.12
3.00 3.94 0.94
2.85 3.77 0.92
behavior is Influenced (31.4) (42.4) (23.3) (25.6) (39.5) (31.3) .~:~) Understand role of
......... , ................. ....... . .. .. ...................
coordination in 3.06 4.17 1.11 2.79 4.17 1.35
3.33 4.17 0.85
3.31 4.30 0.97
2.80 4.00 1.24
3.06 4.18 1.13
3.15 4.15 1.00
institutional reform (36.3) (48.4) (25.6) (29.5) (44.1) (36.8) (317)
Know how to perform a ..................... ..................... ....... ,. ............................. I···· . ........ , ... , . .. .....
2.73 3.90 1.20 2.50 3.89
1.38 2.98 3.93
1.00 2.87 3.90
1.03 2.57 3.88
1.39 2.92 4.02
1.15 2.46 3.69
1.23
stakeholder analysis (43.9) (55.3) (33.6) (35.7) (54.2) (39.4) (50.0)
Identify political ................. ........... .......... ................... I .............
1.48 1.65 1.32 1.36 1.62 1.44 1.54 strategies for political 2.65 4.12
(56.0) 2.41 4.09
(68.3) 2.86 4.15
(46.1) 2.74 4.13 (49.5) 2.51 4.09
(64.3) 2.78 4.20
(51.8) 2.42 3.96
(57.2) reform
- - -'-- '-- _. '---- --.~ --
63

1998 Flagship Course on Health Sector Reform and Sustainable Financing
Table 0-11 b. Self-Assessment of Knowledge in Module 11
MODULE 11 Some 10 yrs. or less Over 10 yrs. SELF-REPORTED All Respondents No Economics Economics Experience Experience Men Women
RA TINGS ON PRE/POST Mean Change Mean Change Mean Change Mean Change Mean Change Mean Change Mean Change
QUESTIONS Pre Post Total
Pre Post 'fotal
Pre Post Total
Pre Post Total
Pre Post Total Pre Post
Total Pre Post
Total ("!o) (%) (%) (%) (%) (%) (%)
Why new public sector 2.67 4.00
1.33 2.62 3.92 1.33 2.82 4.08
1.24 2.75 4.03
1.26 2.66 3.94
1.32 2.71 4.08
1.37 2.77 3.83
1.08 management emerged (49.8) (50.9) (43.9) (45.7) (49.8) (50.4) (39.1)
Pros and cons of .............. ..... I···· I' ..........
importing business-like 2.75 3.91 1.19
2.68 3.86 1.22
2.82 3.97 1.16
2.78 3.95 1.18 2.74 3.88
1.18 2.76 4.00
1.24 2.73 3.75
1.08
practices (43.1) (45.7) (41.1) (42.5) (42.9) (45.2) (39.7)
The continuous result of ............ ......... .H ••••• I ......................... . .... I···························· . ................. ..... '. . ........... "" .... I···
3 building blocks of 2.46 3.93 1.49
2.49 3.94 1.50
2.49 3.95 1.47
2.50 4.03 1.54
2.46 3.85 1.44
2.39 3.96 1.57 2.66 3.92
1.33
NPSM (60.8) (60.3) (59.3) (61.5) (58.7) (65.8) (50.2)
The aims of personnel ......................... I "" ....................... ............. . .... . ................... I················· I···· I . . ................... . ............
1.23 1.17 1.22 1.13 1.27 1.34 0.92 management 2.91 4.13
(42.1) 2.94 4.09
(39.8) 2.97 4.19
(40.9) 2.97 4.11
(38.0) 2.91 4.15
(43.7) 2.94 4.28
(45.7) 3.00 3.88
(30.6) performance The aims of
................... I·········· . ........ .......................... I . ........ I······· ....................... .." . . .............................. .................... I······
performance-related 2.78 3.83 1.09
2.54 3.69 1.19 2.97 3.92
1.00 2.90 3.85
1.00 2.63 3.79
1.21 2.65 3.88
1.22 2.92 3.63 0.83
budgeting (39.0) (47.0) (33.6) (34.5) (45.9) (46.2) (28.5)
................ " .......... ................ I .... I·········· . ................... . ......................
The aims of 2.92 409
1.19 2.84 4.03 1.19 3.03 4.13 1.13
3.00 4.15 1.18
2.83 3.97 1.15
2.90 4.18 1.29
3.00 3.88 0.92
autonomizing hospitals (40.6) (42.1) (37.4) (39.3) (40.6) (44.4) (30.6)
The aims of managed I I···················· .... ...................•.....•.. ....................... ............ . ................... ......................................
1.14 1.22 1.11 1.13 1.21 1.31 0.83 competition and contract 2.71 3.85 (41.9)
2.54 3.75 (48.1)
2.79 3.92 (39.5) 2.78 3.92
(40.7) 2.54 3.74 (47.4) 2.55 3.86
(51.2) 2.92 3.79
(28.5) sale
......... ····1· .................. ............ . ............. . .................................
The aims of full 2.24 3.40
1.15 2.14 3.33
1.22 2.41 3.53
1.08 2.40 3.56
1.13 2.11 3.26
1.18 2.27 3.45
1.18 2.31 3.38
1.04 corporatization (51.2) (57.2) (44.8) (47.0) (55.6) (52.3) (45.1)
.................... I ................... . ........... ...................... . .•..•........................ 1 . .................... ................................. ............. ..................... .... ............................ ................ I··························
The role of efficiency and 2.42 3.51
1.11 2.24 3.39 1.17 2.64 3.66
1.05 2.60 3.67
1.10 2.29 3.35
1.09 2.29
3.55 1.27 2.73 3.46 0.79
equity in corporatization (45.9) (52.0) (39.9) (42.4) (47.6) (55.4) (29.0) ................... I ............
The reactions of 2.55 3.80
1.26 2.51 3.78 1.28 2.59 3.79 1.21
2.58 3.79 1.23
2.51 3.76 1.26
2.55 3.86 1.31 2.54 3.63 1.13
stakeholders to NPSM (49.3) (50.8) (46.7) (47.8) (50.3) (51.2) (44.3) ................. ........ ...... ..............
Handling antagonistic 2.41 3.56
1.16 2.32 3.50 1.19
2.54 3.57 1.03
2.43 3.45 1.03
2.40 3.59 1.21
2.49 3.65 1.16
2.31 3.26 1.00
stakeholder reactions (48.2) (51.4) (40.5) (42.3) (50.2) (46.7) (43.3)
The importance of ....... I I ................. ...... I···············
1.31 1.36 1.24 1.23 1.38 1.39 1.13 enabling environment 2.49 3.79
(52.5) 2.49 3.81
(54.7) 2.49 3.74 (49.7) 2.55 3.79
(48.3) 2.40 3.74
(57.6) 2.51 3.90
(55.3) 2.42 3.50
(46.4) conditions
-- - L-.. - --- - - L- - <--. - - '--- -- _ .. - - --
64
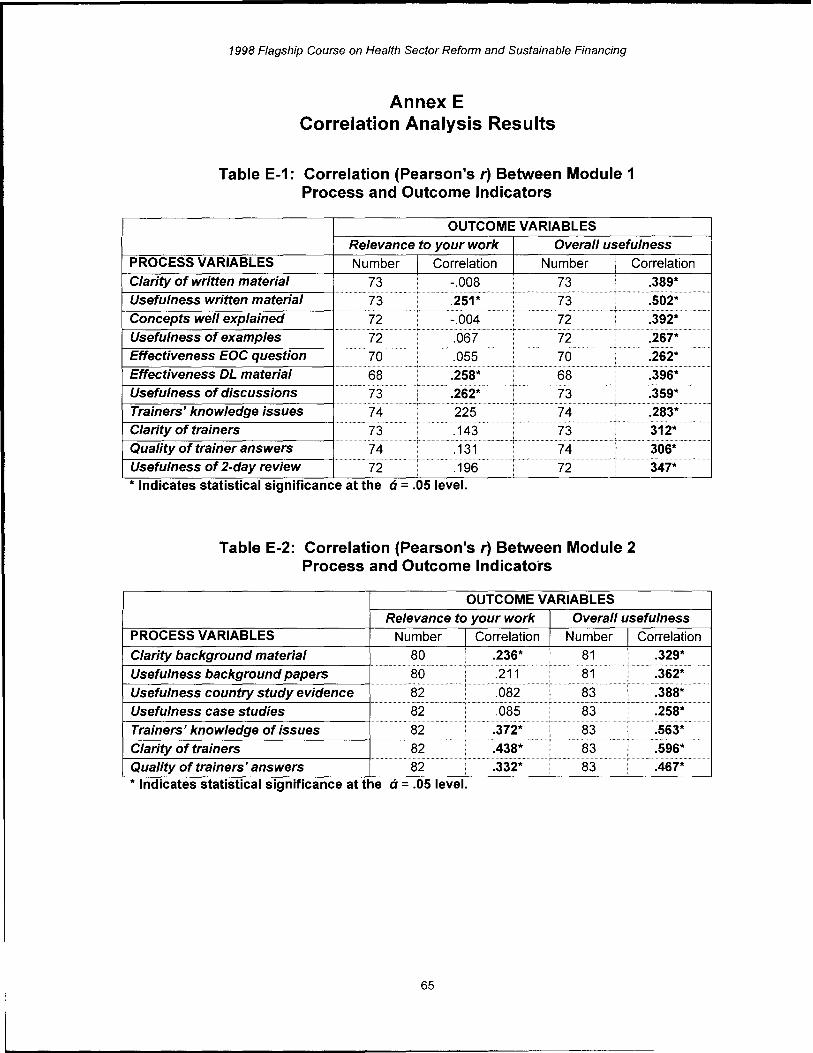
1998 Flagship Course on Health Sector Reform and Sustainable Financing
Annex E Correlation Analysis Results
Table E-1: Correlation (Pearson's r) Between Module 1 Process and Outcome Indicators
OUTCOME VARIABLES
Relevance to your work Overall usefulness PROCESS VARIABLES Number Correlation Number Correlation Clarity of written material 73 -.008 73 .389* Usefulness written material 73 .251* 73 .502* Concepts well explained 72 -.004 72 , .392* Usefulness of examples 72 .067 72 .267* Effectiveness EOC question 70······················· .................
.055 70 . .262* Effectiveness DL material 68 .258* 68 .396* Usefulness of discussions 73 .262* 73 .359* Trainers' knowledge issues ,;4
........ .283*···················· 225 74 Clarity of trainers '3 .143 73 312* Quality of trainer answers 74 .131 74 306* Usefulness of 2-day review 72 .196 72 347* .. , * Indicates statistical Significance at the a = .05 level.
Table E-2: Correlation (Pearson's r) Between Module 2 Process and Outcome Indicators
OUTCOME VARIABLES Relevance to your work Overall usefulness
PROCESS VARIABLES Number Correlation Number Correlation
Clarity background material 80 .236* 81 .329*
Usefulness background papers 80 .211 81 .362* ....
Usefulness country study evidence 82 .082 83 .388* .......
Usefulness case studies 82 .085 83 .258*
Trainers' knowledge of issues 82 ..........................
.372* 83 .563*
Clarity of trainers 82 .438* 83 .596*
Quality of trainers' answers 82 .......
.332* 83 .467* : .. , * Indicates statistical Significance at the a = .05 level.
65
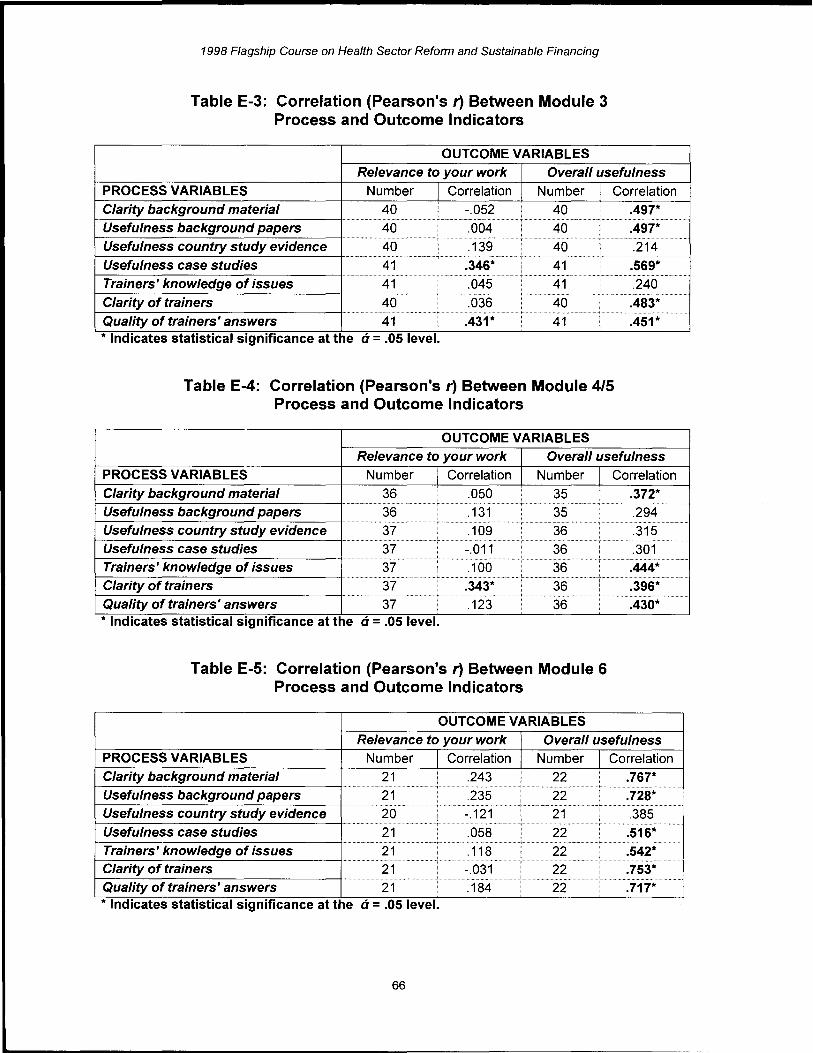
1998 Flagship Course on Health Sector Reform and Sustainable Financing
Table E-3: Correlation (Pearson's r) Between Module 3 Process and Outcome Indicators
OUTCOME VARIABLES Relevance to your work Overall usefulness
PROCESS VARIABLES Number Correlation Number Correlation Clarity background material 40 -.052 40 .497* Usefulness background papers 40 .004 40 .497*
.................... . ............
Usefulness country study evidence 40 .139 40 .214
Usefulness case studies 41 .346* 41 .569*···················
...................... _ ...••..
Trainers' knowledge of issues 41 .045 41 .240 Clarity of trainers 40 .036 40 .. 1.483* ........................
.451*" Quality of trainers' answers 41 .431* 41 · . ,
* Indicates statistical significance at the a = .05 level.
Table E-4: Correlation (Pearson's r) Between Module 4/5 Process and Outcome Indicators
OUTCOME VARIABLES Relevance to your work Overall usefulness
PROCESS VARIABLES Number Correlation Number Correlation Clarity background material 36 .050 35 : .372* Usefulness background papers 36
................ ...................... , .. ........ , ............... .131 35 .294
.......... ................. ................ '~315··················· Usefulness country study evidence 37 .109 • 36 .
Usefulness case studies 37 -.011 , .............. ,. . ....... 36 .301
Trainers' knowledge of issues 37 .100 36 .444* Clarity of trainers 37 .343* 36
.......... , .396* ................ .................
Quality of trainers' answers 37 .123 36 .430* · . ,
* Indicates statistical significance at the a - .05 level.
Table E-5: Correlation (Pearson's r) Between Module 6 Process and Outcome Indicators
OUTCOME VARIABLES Relevance to your work Overall usefulness
PROCESS VARIABLES Number Correlation Number Correlation Clarity background material 21 .243 22 .767*
.....................
Usefulness background papers 21 .235 22 .728* ......•............... . .....
Usefulness country study evidence 20 -.121 21 .385 Usefulness case studies 21 ! .058 22 .516*
...........
Trainers' knowledge of issues 21 .118 22 ,
.542* Clarity of trainers 21 -.031 22 .753*··················
..............
Quality of trainers' answers 21 .184 22 .717* * · . ,
Indicates statistical significance at the a - .05 level.
66
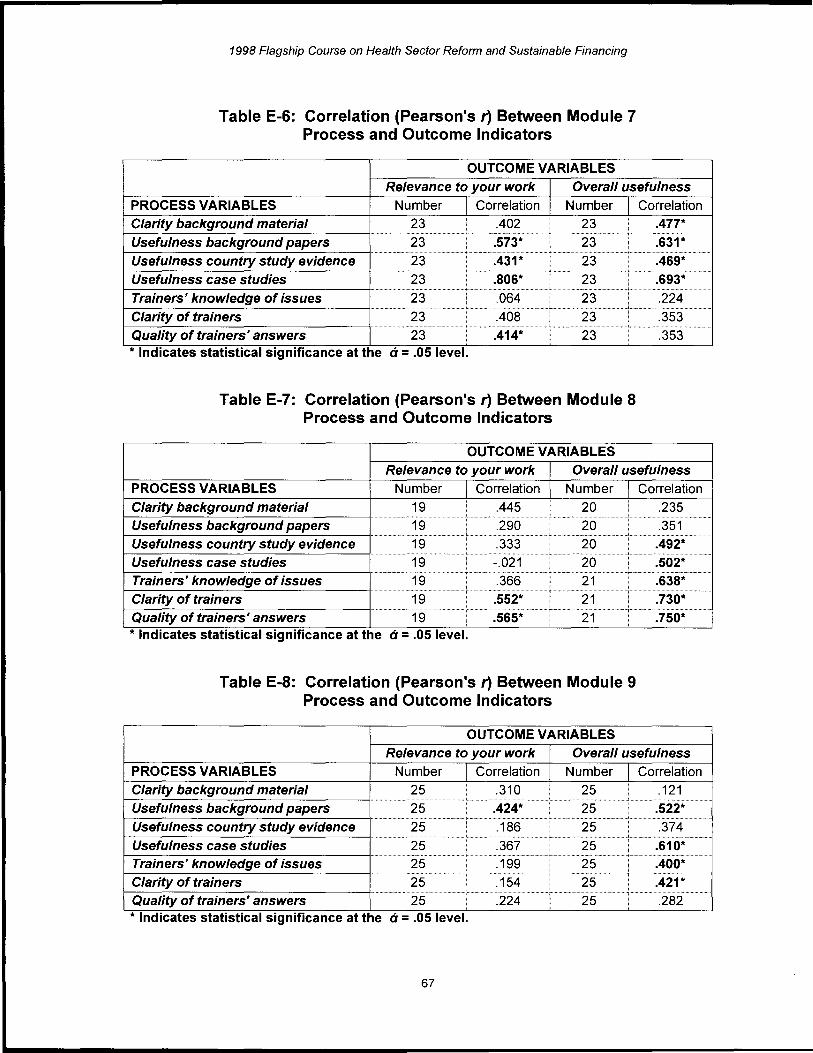
1998 Flagship Course on Health Sector Reform and Sustainable Financing
Table E-6: Correlation (Pearson's r) Between Module 7 Process and Outcome Indicators
OUTCOME VARIABLES Relevance to your work Overall usefulness
PROCESS VARIABLES Number I Correlation Number Clarity background material 23 .402 23
Usefulness background papers 23 .S73* 23
Usefulness country study evidence 23 .431* 23
Usefulness case studies 23 .806* 23
Trainers' knowledge of issues 23 .064 23 !
Clarity of trainers 23 .408 23 ! Quality of trainers' answers 23 I .414* 23
· . , * Indicates statistical Significance at the a = .OS level.
Table E-7: Correlation (Pearson's r) Between Module 8 Process and Outcome Indicators
OUTCOME VARIABLES
Correlation .477*
.631*
.469*
.693*
.224
.353
.353
Relevance to your work Overall usefulness PROCESS VARIABLES Number Correlation Number Correlation Clarity background material 19 .445 20..L .235
............
Usefulness background papers 19 . 290 20 .351
Usefulness country study evidence 19 .333 20 ............. ···················.492* ........
Usefulness case studies 19 -.021 20 ................. S02*··················
Trainers' knowledge of issues 19 .366 21 .638* ......
Clarity of trainers 19 .SS2* 21 .730*
Quality of trainers' answers 19 ; .S6S* 21 .7S0* · . ,
* Indicates statistical Significance at the a = .OS level.
Table E-8: Correlation (Pearson's r) Between Module 9 Process and Outcome Indicators
OUTCOME VARIABLES Relevance to your work Overall usefulness
PROCESS VARIABLES Number Correlation Number Correlation Clarity background material 25 .310 25 .121
Usefulness background papers 25 ":424* 25 .S22*
Usefulness country study evidence 25 .186 25 .374 ...................
Usefulness case studies 25 . 367 25 .610*
Trainers' knowledge of issues 25 ......................... : .. ,
25 ........... ......... .400····················
1.199
Clarity of trainers 25 .154 25 .421* ........................
Quality of trainers' answers 25 .224 25 . .282 · . ,
* Indicates statistical Significance at the a - .OS level.
67

1998 Flagship Course on Health Sector Reform and Sustainable Financing
Table E-9: Correlation (Pearson's r) Between Module 11 Process and Outcome Indicators
OUTCOME VARIABLES Relevance to your work Overall usefulness
PROCESS VARIABLES Number Correlation Number Correlation Clarity background material 81 .329* 81 .527* Usefulness background papers 80 .435*
80···················· . 691*
.........
Usefulness country study evidence 82 .416* 82 .510* Usefulness case studies 83 .382* 83
.597*················· .•.•....................
Trainers' knowledge of issues 83 .283* 83 .547* Clarity of trainers 81 .373*
................... 81 .509*
Quality of trainers' answers 81 .219* 81 .611* .............
.. · * Indicates statistical significance at the a = .05 level.
Table E-10a: Correlation (Pearson's r) Between Overall Course Process and Outcome Indicators
OUTCOME VARIABLES Degree recommend Degree fulfilled your
course to others expectations PROCESS VARIABLES Number Correlation Number Correlation Effectiveness of case method 80 -.073 79 .000
..........
Usefulness of evaluation feedback 79 .203 78 .119
Effectiveness of evaluation feedback 74 .230* 73 .313
Satisfaction with course organizers 80 .338* 79 .314* Satisfaction with overall logistics 79 .378* 78 .320* .. · * Indicates statistical significance at the a = .05 level.
Table E-10b: Correlation (Pearson's r) Between Overall Course Process and Outcome Indicators
OUTCOME VARIABLES Overall relevance to Overall usefulness of
your work course PROCESS VARIABLES Number Correlation Number Correlation Effectiveness of case method 81 .114 ; 81 .093
Usefulness of evaluation feedback 80 ;
.086 ,
80 .143
Effectiveness of evaluation feedback 75 .178 75 .342* Satisfaction with course organizers 81 .123 81 .213
Satisfaction with overall logistics 80 .257* 80 .288* .............
· * Indicates statistical significance at the a = .05 level.
68

1998 Flagship Course on Health Sector Reform and Sustainable Financing
Annex F Multivariate Model Analysis
Logit regression is a method that allows for the simultaneous assessment of multiple variables that are measured at a nominal level. It is analogous to multiple linear regression, but it does not require meeting the more stringent model assumptions associated with linear regression. When these assumptions are not met, linear regression can produce a set of biased or distorted results that can confound the analysis. Much of the data for this evaluation utilized a five-point scale, which, at best, makes the level of the data ordinal. However, clustering the scores in the upper ranges of that scale makes even this quality questionable. This clearly violates key assumptions of the linear regression model. A Logit model is not constrained by these assumptions and is capable of utilizing nominal level data in a multivariate model.
For this analysis, two separate sets of Logit models were produced using basically the same variables. One set of Logit models was constructed for the cognitive test's pre-test results and another set for the cognitive test's post-test results. A distinct model was constructed for each of the seven modules that used cognitive tests and for the overall course, making a total of eight models in each set. All variables in the models were recoded to a nominal level, and consisted of the following:
Pre or post-test results 1 = scored at or above the mean o = scored below the mean
Experience 1 = more than 10 years of professional job experience o = 1 0 years or less professional job experience
Training 1 = a degree in economics o = no degree in economics
Gender 1 = male 0= female
In each model, the pre or post-test was the dependent variable, and experience, training, and gender were the independent variables. Each model produces a Wald x2 (chi-squared) value along with probability of the model item being significantly different from zero (p) and an odds ratio. The odds ratio measures the extent that a positive score would be obtained on the dependent variable as a result of possessing the characteristic of the independent variable. For example, an odds ratio of 2.0 for gender would mean that men are twice as likely to score above the mean on either the pre or post-test than are women. Conversely, an odds ratio of 0.5 would mean that men are only half as likely as women of scoring above the mean on the pre or post-test.
The linear regression involved regressing the percentage of correct questions on the post-test (the dependent variable) onto the percentage correct on the pre-test (the independent variable). This created a simple linear model with two variables that were interval in quality and did not violate the model's basic assumptions. In this simple form, the model attempts to explain the percentage of correct questions on the post-test with how well a participant did on the pre-test. To this model were then added three dummy variables representing education, experience, and gender. Each of these variables was coded 1 and 0, as described above for the Logit models. Adding a dummy variable to the simple bi-variate equation represents an intercept test for significance. A significant dummy variable means that the quality it represents causes an increase or decrease in the average score of the dependent variable-the post-test score-while controlling for all other factors. For example, a
69
1998 Flagship Course on Health Sector Reform and Sustainable Financing
gender coefficient of 5.0 indicates that men, on average, scored 5 percentage points higher than females, while controlling for the independent effects of training and education. Conversely, a coefficient of -5.0 indicates that men, on average, scored 5 percentage points lower than women.
To build these models, a backward elimination method was used. This method begins with a fully saturated model that includes all of the independent terms. It then begins an assessment of each term to determine which variable to retain, dropping those that fall below a set level of significance. level. This level is based on the student's' t-test for each term in the model. The procedure continues to eliminate variables until only those which meet the set tolerance level remain. In these models, we used the standard 1.0 level of significance for retention. This is a higher level than the .05 level typically used for other model construction methods, such as the forward stepwise method. However, the higher tolerance is usually justified as an added feature of the method; this is somewhat more demanding because of its starting point, a fully specified model. In constructing these models, we used the standard 1.0 level for elimination.
Table 4 (Regression Models for the Overall Course and Seven Modules), found under heading ii. Linear Regression Models in the main text, shows a number of factors for each of the module's models. It reports the model variables, including the constant or intercept term. Also reported is the unstandardized regression coefficient, the B, which is an indicator of the amount of change in the dependent variable for each added increase or decrease in the independent variable. For dummy variables, it is the amount of increase or decrease in the dependent variable caused by introduction of the stated characteristic. The table also shows the standard error of the estimate from the Band the standardized regression coefficient, the beta. A beta represents the contribution of the variable to the overall explanatory power of the model. Since these figures are standardized, they figures can be compared for their size, or contribution to the model. The t-value, or score, and its significance are also shown. The significance is for the variable's ability to be retained in the model and is set at the 1.0 level or less. Finally, the table shows the overall variance explained by the variables in the model and the N, or number of cases. It should be noted that some models have small Ns, which may affect their ability to complete a full and robust assessment of all independent variables.
The basic statistical model contained the percentage correct on the pre-test regressed against the percentage correct on the post-test. This allowed for us to assess other factors, those represented by the dummy variables, after explaining as much variance as possible with the pre-test scores. The focus, then, of these models, was on that difference, or the change between pre and post-tests. Models that only contained the pre-test variable and no other showed that no other factor could explain additional variance beyond what was explained by how well the participants scored on the pre-test. As we can see in the table results, Modules 4/5, 7, and 8 were the modules that met this criterion. For these three modules, only the pre-test variable was significant. There was no effect by experience, education, or gender on the post-test scores in these modules. For the overall course and in the remaining modules, there were such effects.
70