Embed Size (px)
Citation preview
EVALUATION OF SEDIMENT MANAGEMENTSTRATEGIES ON RESERVOIR STORAGE
DEPLETION RATE: A CASE STUDY
Mazhar ALI1and Geert STERK2
1Land Degradation and Development Group, Department of Environmental Sciences, Wageningen University(P.O. Box 47, 6700 AA Wageningen, The Netherlands)
E-mail: [email protected] of Physical Geography, Utrecht University (P.O. Box 80115, 3508 TC Utrecht, The Netherlands)
E-mail: [email protected]
Sedimentation aspects have a major role during the design of new reservoir projects because life of thereservoir mainly depends upon sediment handling during reservoir operation. Therefore, proper sedimentmanagement strategies should be adopted to enhance the life span of reservoirs. Basha Reservoir is one ofthe mega water resources projects which are being planned to construct on the Indus river. Under this study,the efficiency of four sediment management strategies were evaluated by using the RESSASS model. Thereservoir management strategies considered for sediment simulation of Basha reservoir include the normaloperation, raising of MoL, draw-down the MoL (flushing) and controlling the sediment inflows. Undernormal operation, the model predicted the life span of Basha reservoir around 55 - 60 years. But by raisingof Mol 2.0 m/year implemented after 35 years of operation may add 10 - 15 years more to the life-span ofthe reservoir. However, by adopting the flushing operation to draw-down the MoL at El. 1010 m initiatedafter 35 years of operation, it may also add about 15 - 20 years more. Moreover, the results obtained byconsidering 50% reduction in sediment inflow due to implementation of river basin management projectsupstream of Basha within 30 years of reservoir operation, depicts that the life of the reservoir will be morethan 100 years. It is therefore concluded that proper sediment mitigation measure can significantly enhancethe life-span of planned reservoirs.
Key Words : flushing, minimum operation level (MoL), full reservoir level (FRL), Indus river, reser-voir sedimentation, draw-down, rule curve, reservoir operation strategy
1. INTRODUCTION
Irrigated agriculture is the backbone of Pakistan’seconomy (World Bank32)). The agricultural sectorin Pakistan is mainly relying on water supplies fromreservoirs. But irrigated agriculture is seriously con-fronted with major problems of water scarcity, un-equal distribution of irrigation water, low productivityand increasing soil salinity (Tahir and Habib23)). Thecountry is already facing a serious shortage of fooddue to fastly growing population and lack of sizeablewater storage (Pakistan Water Partnership18)). Withthe present rate of population growth and reductionof water availability due to siltation of existing reser-voirs, Pakistan is likely to reach the stage of “watershort country” by the year 2012 when the per capitasurface water availability will be reduced to 1000 cu-bic meter per year (Farooqi8)). Rising pressure to pro-duce more food with less water demands not only forthe efficient and integrated use of available water re-
sources but also demands the construction of new wa-ter reservoirs.
The two existing reservoirs in Pakistan, Tarbela andMangla are rapidly losing their storage capacities dueto sedimentation. The gross storage capacities of Tar-bela and Mangla reservoirs at the time of first im-poundment were 13.938 and 7.253 BCM respectively.These reservoirs collectively lost about 25% of theirstorage capacity by the end of the year 2003 (Ali etal.3)). The hydrographic survey of 2000 showed thatthe Mangla dam had lost about 20% of its gross stor-age capacity (Ali et al.3)). According to the hydro-graphic survey of 2005, Tarbela dam had lost about30% of its gross storage capacity (DBC7)). It is gener-ally known that the annual loss of storage in reservoirsis roughly 1% corresponding to about 50 km3 world-wide (Mahmood13)). But some reservoirs may havemuch higher storage loss, e.g., the Sanmenxia Reser-voir in China looses about 1.7% annually (Sloff21)).
In order to meet the growing requirement of wa-
Doboku Gakkai Ronbunshuu B Vol.66 No.2, 207-216, 2010.6
207
ter in the country, the Government of Pakistan (GoP)through the Water & Power Development Authority(WAPDA) plans to construct some mega water re-sources projects in additions to small and mediumstorage projects on the Indus river. Basha reservoiris one of the mega water resources projects which areplanned on the Indus river. The proposed Basha reser-voir will be located 315 km upstream of Tarbela reser-voir. But without any mitigation measures, the via-bility of existing and planned reservoirs will becomequestionable under the current high storage depletionrates. Therefore it is essential that proper attentionshould be paid to sedimentation aspects in the man-agement of the existing reservoirs as well as in thedesign of new reservoirs. If proper sediment mitiga-tion measures are adopted, life of the reservoir couldbe extended for a much longer time.
The reservoir depletion rate can be minimized intwo different ways i.e. by controlling the sedimentinflow rate to the reservoir or by adopting differentreservoir operation strategies. The sediment inflowrate can be controlled by adopting sediment man-agement practices in the upstream catchment area(Huang and Zhang9)). Nevertheless, two reservoiroperation strategies are being commonly used glob-ally for sediment management in reservoirs to con-serve the storage capacity and keep the power-intakesfree from sediment i.e., draw-down the minimum op-eration level (flushing) and raising of the minimumoperation level. Flushing is one of the most eco-nomic methods that partly recovers the depleted stor-age without dredging or other mechanical means ofremoving sediment. The success of flushing may de-pend upon the catchment and reservoir characteris-tics (White31)). Qian20) also argued that the flush-ing solution is only suitable in reservoirs where an-nually an excess amount of water is available. Forthe Tarbela reservoir, the raising of Minimum opera-tion Level (MoL) sediment management strategy hasbeen adopted to reduce the speed of delta movementtowards the dam body (TAMS24)).
Several one-dimensional numerical models are be-ing globally used for reservoir sediment simulatione.g., RESSASS (Wallingford29)), HEC-6 (HEC27)),GSTAR (Yang et al.33)), Fluvial (Chang5)). Thesemodels have been used as a tool to predict the stor-age capacity losses and reservoir bed levels after acertain specified simulation period due to sedimen-tation. RESSASS is a one-dimensional model whichwas developed by HR-Wallingford, UK, in 1995 tosimulate a long-term average pattern of scour and de-position in reservoirs. The model input includes ge-ometrical, hydrological and morphological data. Themodel output describes the flow velocities, water sur-face profile, trapping efficiency, storage depletion rateand reservoir bed levels. In this study, the RESSASS
model was used for simulation of the sediment dy-namics in the proposed Basha Reservoir. The mainaim of this study was to investigate the effects of dif-ferent reservoir operation strategies on the expectedlife-time of the planned Basha reservoir.
2. THE STUDY AREA
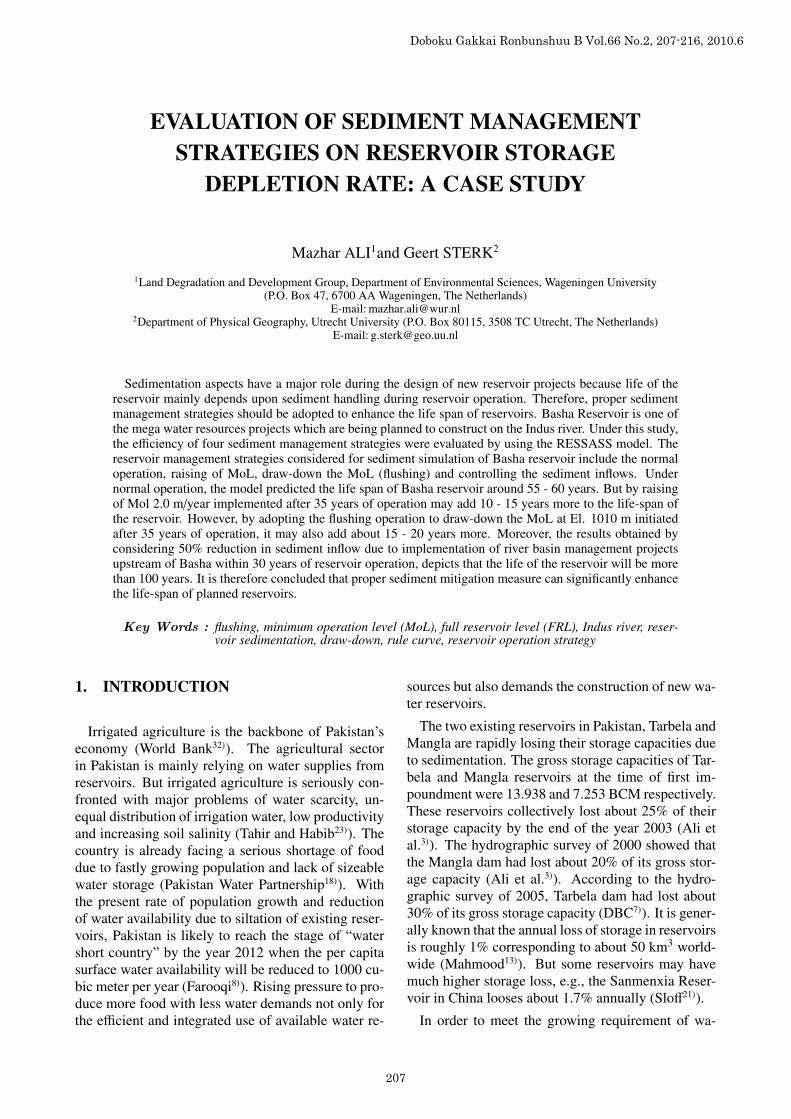
The planned Basha damsite is located about 315 kmupstream of Tarbela Dam on the Indus river and 165km downstream of the Northern Area capital Gilgitand 40 km downstream of Chilas town. The pro-posed dam is designed for a maximum height of 260m (NEAC17)). The total drainage area of the Indusriver above the damsite is 153,200 km2, which ex-tends from Pakistan into Tibet and Kashmir. Themajor tributaries that join the Indus river above theproposed damsite include the Hunza river, the Gilgitriver, the Astore river and the Shyok river (Fig. 1).The sub-basins formed by these tributaries have dis-tinct morphologic, climatic and hydrologic character-istics. Poor vegetal cover, steep slopes, and the factthat the soils and rocks of the Indus valley are geologi-cally young and easily erodible are some relevant fea-tures of the drainage basin responsible for high sedi-ment concentration in the water of the Indus river atthe proposed damsite (Sloff21)).
The Basha reservoir with full reservoir level (FRL)at El. 1160 m will have a gross storage volume of10.008 BCM and a dead storage level (MoL) at El.1060 m with dead storage volume of 2.10 BCM. Twopower-houses are planned at El. 1040 m, one on eachside of the main dam with total installed power gen-eration capacity of 4500 MW and low-level outletsare planned at El. 975 m (NEAC17)). The mean an-nual unregulated flow of the Indus river at the dam-site is 61.12 BCM that carries about 199.40 million
Fig. 1 Map showing the proposed Basha damsite with keygauging stations and main tributaries.
Doboku Gakkai Ronbunshuu B Vol.66 No.2, 207-216, 2010.6
208
tons of sand, silt and clay sized particles (NEAC17)).The stream flow data important for this study arefrom different agencies of WAPDA, mainly by theSurface Water Hydrology Project (SWHP) and theWater Resources Management Directorate (WRMD).Because no flow measuring and sediment samplingstation exists at the planned dam-site, the stream flowand sediment data of Partab bridge, Shatial and Be-sham Qila hydrometric stations have been used. ThePartab bridge gauging station is located on the pe-riphery of the Basha reservoir, whereas the Shatialand Besham Qila gauging stations are located down-stream of Basha reservoir. The proposed dam projectcovers an area of 110 km2 and extends 100 km up-stream of the damsite up to Raikot Bridge on Karako-ram Highway (KKH).
3. MODEL DESCRIPTION
RESSASS (Reservoir Survey Analysis and Sedi-mentation Simulation) is a one-dimensional steadystate windows-based program which was developedby HR Wallingford, UK in 1995 (Wallingford29)). Themodel is basically a combination of three sub-modelsi.e. Volume Analysis, Volume Prediction and Numer-ical Model. Under the current study, the volume anal-ysis and numerical components of RESSASS modelwere applied to assess the storage volume and pre-dict the storage depletion rate in the Basha reservoir.Due to the non-availability of hydrographic surveydata (after first impoundment), the volume predictioncomponent was not applied. Volume Analysis was ap-plied for the computation of initial reservoir volume.This component uses the “Stage - Width ModificationMethod” (Lea11)) to develop the stage - volume curvesfor the reservoir. The Numerical Model simulates thetime varying sediment buildup, delta formation, trap-ping efficiency and remaining storage capacity in thereservoir.
The RESSASS model simulates water flow andsediment movement for each time step and sectionalong the river. The model calculations are based ontwo sequential steps: backwater and sediment trans-port computations. In the first phase of computa-tions, the standard step method is used for backwa-ter computations to compute flow depth and velocityat each cross-section along the selected river reach.The model performs the hydraulic calculations whichincludes the determination of water surface profiles(flow velocities and water depths) along the studyreach. The water surface profile calculations are initi-ated from the downstream boundary (where the waterlevels are known) and proceeds upstream.
During the second phase of computations, the com-puted flow velocities and depths from backwater com-putation, are used in determining the potential sed-
iment transport rates from a sediment transport for-mula. If sediment transport capacity at any cross-section exceeds sediment inflow rate, scour wouldoccur. While on the other hand, if it declines, thenthere would be deposition to bring the flow systeminto equilibrium. The sediment transport computa-tions are initiated at the upstream boundary and pro-ceed downstream. Two empirical sediment transportequations are available in the RESSASS model for thecomputations. The transporting capacities of coarsesediments (> 0.063 mm) are calculated by using therevised version of Ackers & White1) sediment trans-port equation (Wallingford28)). Whereas, the Westrich& Jurashek’s30) method is used to calculate the trans-port capacities of fine sediment (< 0.063 mm).
The density of settled sediment is needed to convertthe mass of sediment deposited or eroded to a vol-ume change. There are two aspects that are consid-ered when deriving the representative sediment den-sity. The density of newly deposited sediment whichdepends on the relative proportions of sand, silt &clay and consolidation of settled material which re-sults in an increase in density with time. A methodbased on the Lara and Pemberton10) equation (1) isused to estimate the initial densities and the Miller15)
equation (2) is used for the prediction of consolida-tion.
W0 = Wc · Pc +Ws · Ps +Wsa · Psa (1)
Wt = W0 + 0.4343(k)[ tt − 1
(ln t) − 1]
(2)
Where W0 is the initial density, Pc, Ps and Psa arethe ratios of clay, silt and sand, Wc, Ws and Wsa arethe initial densities for clay, silt and sand, Wt is theaverage dry bulk density after t years of consolidationand k is the compaction factor.
The model provides output in various degrees of de-tail which is controlled by the user. The level of detailranges from limited output to the output that containsinformation of all major calculations. The model isusually used to make predictions over periods of yearswith a time-step of one day by default. Typical out-put combinations from an annual simulation would betrapping efficiencies, bed level changes, stage - stor-age capacity curves, water surface profiles and flowvelocities.
4. RESSASS MODEL APPLICATION
(1) Data categoriesThe required data have been collected from dif-
ferent agencies of WAPDA and project reports(NEAC17), DBC6)). Data required for the modelwere divided into four main categories; topographi-cal, hydrological, morphological and reservoir oper-ation, and details about each category are discussed
Doboku Gakkai Ronbunshuu B Vol.66 No.2, 207-216, 2010.6
209
Fig. 2 Schematic Layout of the Proposed Basha Reservoir with
over the study period.
Ali and De Boer
sources in the Indus valley includes channel erosio
gully erosion, and steep hill-slope erosion due to
combination of continuing tectonic instability,
glaciers melting and heavy monsoon rains. It is the
need of hour to practice river basin management
techniques to reduce sediment yield. Therefore, It
was assumed that the watershed management
projects in the Indus river basin may reduce the
sediment inflow rate to 50% (99.7 million tons/year
and may be implemented within 30 years after
execution of Basha reservoir. While the sediment Fig. 2 Schematic layout of the proposed Basha reservoir
with location of cross-sections.
below:
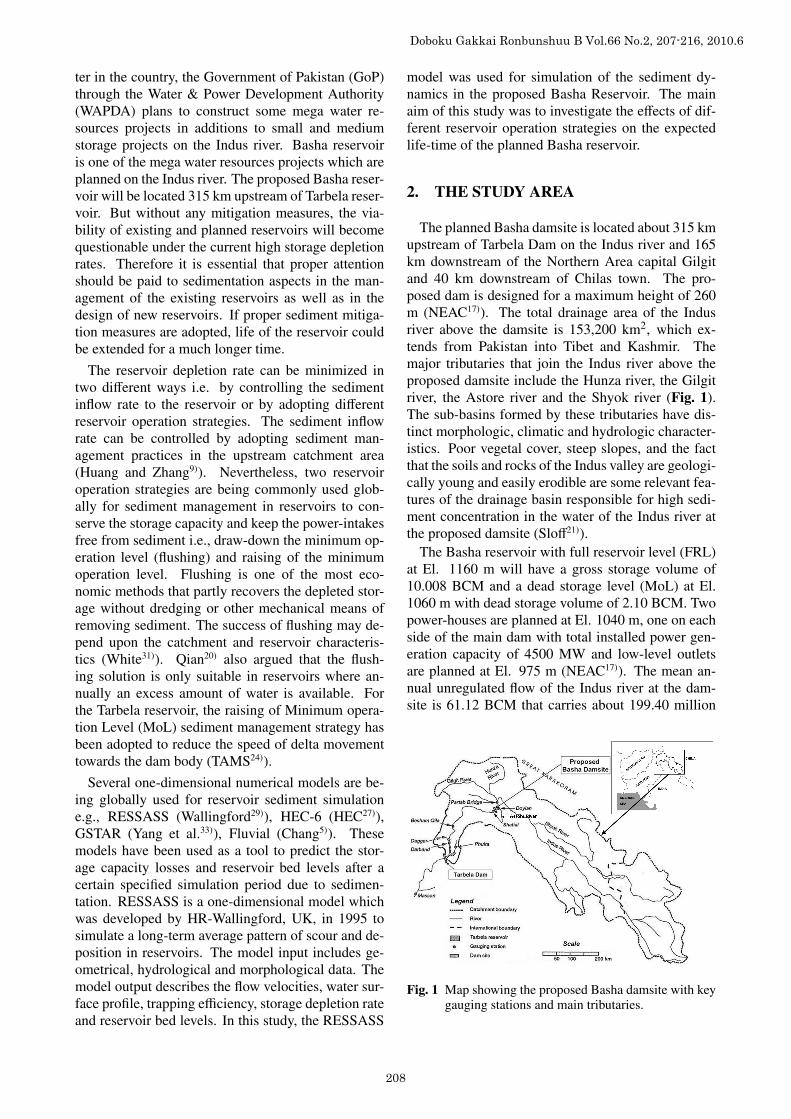
a) Topographic dataThe proposed Basha reservoir was represented in
the model by a series of 57 cross-sections from thedam-site to a point located beyond the upstream ex-tent of the reservoir (Fig. 2). DBC Consultants6) havederived a digital map of the Basha reservoir with 5m contour interval from the 70 topographic sheetsof the reservoir area (1:7500). The digital reservoirmodel was used to derive the river cross-sections ofBasha reservoir. Several minor tributaries enter intothe Basha reservoir from both banks and these tribu-taries contribute approximately five percent to the to-tal storage capacity of the Basha reservoir (DBC6)).However, due to unavailability of detailed informa-tion about these tributaries, only two tributaries wereconsidered to represent the storage capacity of all sidevalleys, located 8 and 14 km upstream of the dam onboth right and left bank.
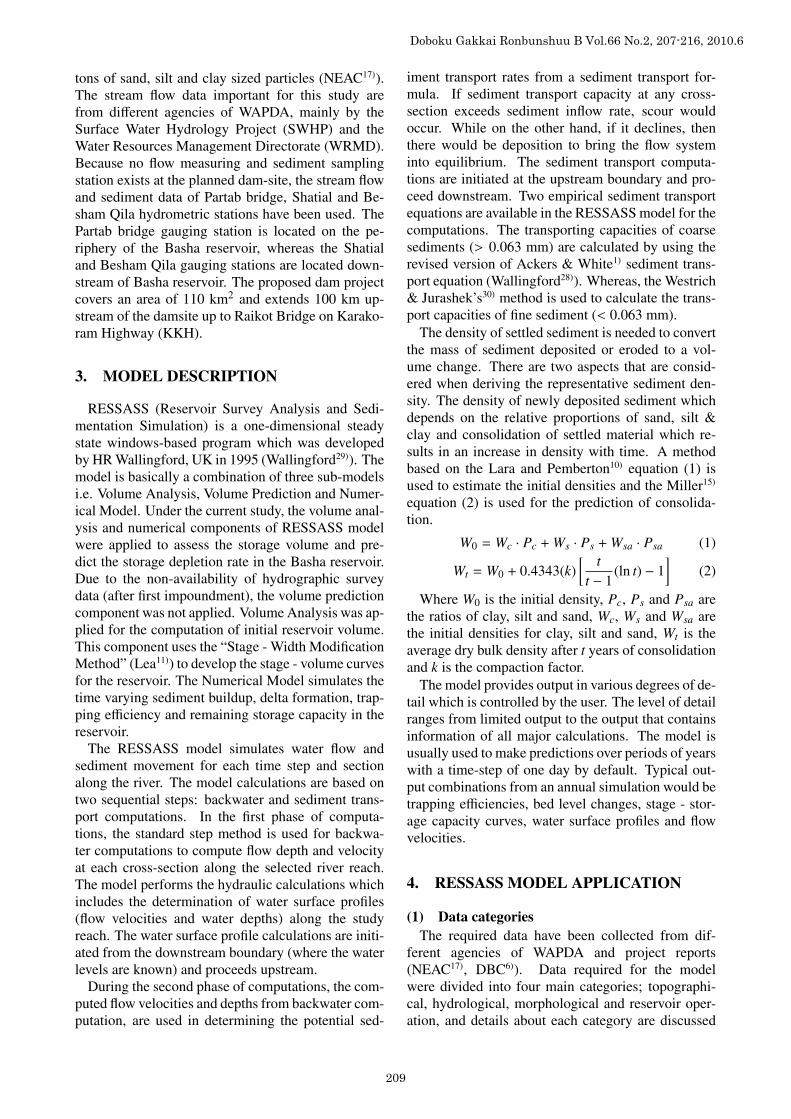
b) Hydrological dataInflow time series at the proposed damsite were de-
rived by DBC Consultants6) by using the daily dis-charge data of Shatial and Partab bridge gauging sta-tions. Daily inflow time series were available forthe period from 1969 to 2003. These 35 years ofrecords were converted into 10-daily discharges (bytaking the average), which were used as input datain the RESSASS model for the reservoir sedimenta-tion study. The mean annual discharge (1969 - 2003)estimated at the damsite was 61.12 BCM (Fig. 3).A considerable variation from one year to the otherwas observed and believed that it is a good indicationof probable future conditions and could cover all thepossible hydrological cycles, with some exceptions.However for simulation periods exceeding 35 years,the time series was extended for the next 35 yearsperiod on the basis of a stationary stochastic process(Mutreja16)). So these 70 years 10-daily discharges(the historical 35 years of record and extrapolated dis-
0.00
10.00
20.00
30.00
40.00
50.00
60.00
70.00
80.00
90.00
196
9
197
1
197
3
197
5
197
7
197
9
198
1
198
3
198
5
198
7
198
9
199
1
199
3
199
5
199
7
199
9
200
1
200
3
Years
Dis
char
ge
(BC
M/Y
ear)
Mean Value (61.12 BCM)
Fig. 3 Indus river inflows at Basha.
charges for next 35 years) were used in the model.c) Sediment data
A sediment rating curve for the planned damsitewas derived from sediment rating curves of PartabBridge and Besham Qila stream gauging stations(NEAC17)). From these rating curves, it was estimatedthat mean annual suspended sediment load at PartabBridge and Besham Qila was 151.57 and 215.54 mil-lion tons, respectively. The suspended sediment yieldat the Basha damsite was calculated by linear inter-polation. NEAC Consultants17) used USBR26) guide-lines to estimate unmeasured bed load at the damsiteon the basis of suspended sediment concentration andfound that the bed load is approximately equal to the10% of suspended load. Therefore on the basis of theNEAC17) results, the total annual sediment inflow toBasha reservoir was estimated as 199.40 million tonsconsisting of 181.27 million tons of suspended sedi-ment and 18.13 million tons of bed load.
Grain size analyses of suspended sediment sam-ples of Partab Bridge station were also availableand included 46% of sand and 54% of silt & clay(NEAC17)).d) Boundary conditions
NEAC17) Consultants developed the rule curves fornormal and flushing operation by keeping in view thedownstream requirement of water as well as fillingof the reservoir. These rule curves were selected toanalyze the sediment deposition patterns and storagecapacity depletion rate in Basha reservoir. Addition-ally, another scenario was also considered to studythe effect of implementation of watershed manage-ment projects in the upper Indus Basin on sedimentinflows. The following four scenarios were consid-ered as downstream hydraulic boundary conditionsfor reservoir sediment simulation of Basha reservoir:
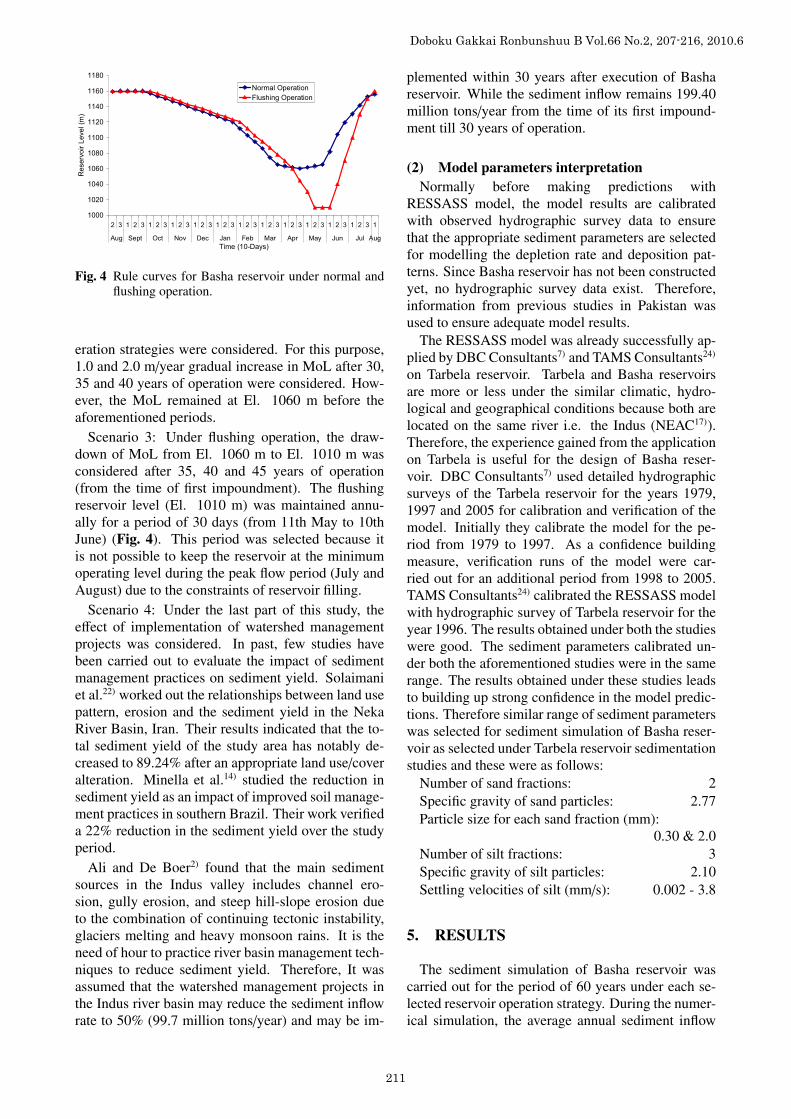
Scenario 1: Under normal operation, the reservoirlevel varies every year between Full Reservoir Level(FRL) of El. 1160 m and Minimum Operation Level(MoL) of El. 1060 m (Fig. 4).
Scenario 2: Under raising of MoL, six reservoir op-
Doboku Gakkai Ronbunshuu B Vol.66 No.2, 207-216, 2010.6
210
capacity depletion rate in Basha reservoir.
Additionally, another scenario was also considered
to study the effect of implementation of watershed
management projects in the upper Indus Basin on
considered as downstream hydraulic boundary
conditions for reservoir sediment simulation of
r
l
(FRL) of El. 1160 m and Minimum Operation Level
1000
1020
1040
1060
1080
1100
1120
1140
1160
1180
2 3 1 2 3 1 2 3 1 2 3 1 2 3 1 2 3 1 2 3 1 2 3 1 2 3 1 2 3 1 2 3 1 2 3 1
Aug Sept Oct Nov Dec Jan Feb Mar Apr May Jun Jul Aug
Time (10-Days)
Reserv
oir L
evel (m
)Normal Operation
Flushing Operation
Fig. 4 Rule curves for Basha reservoir under normal andflushing operation.
eration strategies were considered. For this purpose,1.0 and 2.0 m/year gradual increase in MoL after 30,35 and 40 years of operation were considered. How-ever, the MoL remained at El. 1060 m before theaforementioned periods.
Scenario 3: Under flushing operation, the draw-down of MoL from El. 1060 m to El. 1010 m wasconsidered after 35, 40 and 45 years of operation(from the time of first impoundment). The flushingreservoir level (El. 1010 m) was maintained annu-ally for a period of 30 days (from 11th May to 10thJune) (Fig. 4). This period was selected because itis not possible to keep the reservoir at the minimumoperating level during the peak flow period (July andAugust) due to the constraints of reservoir filling.
Scenario 4: Under the last part of this study, theeffect of implementation of watershed managementprojects was considered. In past, few studies havebeen carried out to evaluate the impact of sedimentmanagement practices on sediment yield. Solaimaniet al.22) worked out the relationships between land usepattern, erosion and the sediment yield in the NekaRiver Basin, Iran. Their results indicated that the to-tal sediment yield of the study area has notably de-creased to 89.24% after an appropriate land use/coveralteration. Minella et al.14) studied the reduction insediment yield as an impact of improved soil manage-ment practices in southern Brazil. Their work verifieda 22% reduction in the sediment yield over the studyperiod.
Ali and De Boer2) found that the main sedimentsources in the Indus valley includes channel ero-sion, gully erosion, and steep hill-slope erosion dueto the combination of continuing tectonic instability,glaciers melting and heavy monsoon rains. It is theneed of hour to practice river basin management tech-niques to reduce sediment yield. Therefore, It wasassumed that the watershed management projects inthe Indus river basin may reduce the sediment inflowrate to 50% (99.7 million tons/year) and may be im-
plemented within 30 years after execution of Bashareservoir. While the sediment inflow remains 199.40million tons/year from the time of its first impound-ment till 30 years of operation.
(2) Model parameters interpretationNormally before making predictions with
RESSASS model, the model results are calibratedwith observed hydrographic survey data to ensurethat the appropriate sediment parameters are selectedfor modelling the depletion rate and deposition pat-terns. Since Basha reservoir has not been constructedyet, no hydrographic survey data exist. Therefore,information from previous studies in Pakistan wasused to ensure adequate model results.
The RESSASS model was already successfully ap-plied by DBC Consultants7) and TAMS Consultants24)
on Tarbela reservoir. Tarbela and Basha reservoirsare more or less under the similar climatic, hydro-logical and geographical conditions because both arelocated on the same river i.e. the Indus (NEAC17)).Therefore, the experience gained from the applicationon Tarbela is useful for the design of Basha reser-voir. DBC Consultants7) used detailed hydrographicsurveys of the Tarbela reservoir for the years 1979,1997 and 2005 for calibration and verification of themodel. Initially they calibrate the model for the pe-riod from 1979 to 1997. As a confidence buildingmeasure, verification runs of the model were car-ried out for an additional period from 1998 to 2005.TAMS Consultants24) calibrated the RESSASS modelwith hydrographic survey of Tarbela reservoir for theyear 1996. The results obtained under both the studieswere good. The sediment parameters calibrated un-der both the aforementioned studies were in the samerange. The results obtained under these studies leadsto building up strong confidence in the model predic-tions. Therefore similar range of sediment parameterswas selected for sediment simulation of Basha reser-voir as selected under Tarbela reservoir sedimentationstudies and these were as follows:
Number of sand fractions: 2Specific gravity of sand particles: 2.77Particle size for each sand fraction (mm):
0.30 & 2.0Number of silt fractions: 3Specific gravity of silt particles: 2.10Settling velocities of silt (mm/s): 0.002 - 3.8
5. RESULTS
The sediment simulation of Basha reservoir wascarried out for the period of 60 years under each se-lected reservoir operation strategy. During the numer-ical simulation, the average annual sediment inflow
Doboku Gakkai Ronbunshuu B Vol.66 No.2, 207-216, 2010.6
211
& clay. The results obtained under each selected
r
capacity may reduce from 10.008 BCM to 2.63 BCM
0
). This shows that
0
2
4
6
8
10
12
950 1000 1050 1100 1150 1200
Water Level (m)
Res
erv
oir
Sto
rage
Cap
acit
y (
BC
M) Original
After 10 Years
After 20 Years
After 30 Years
After 40 Years
After 50 Years
After 60 Years
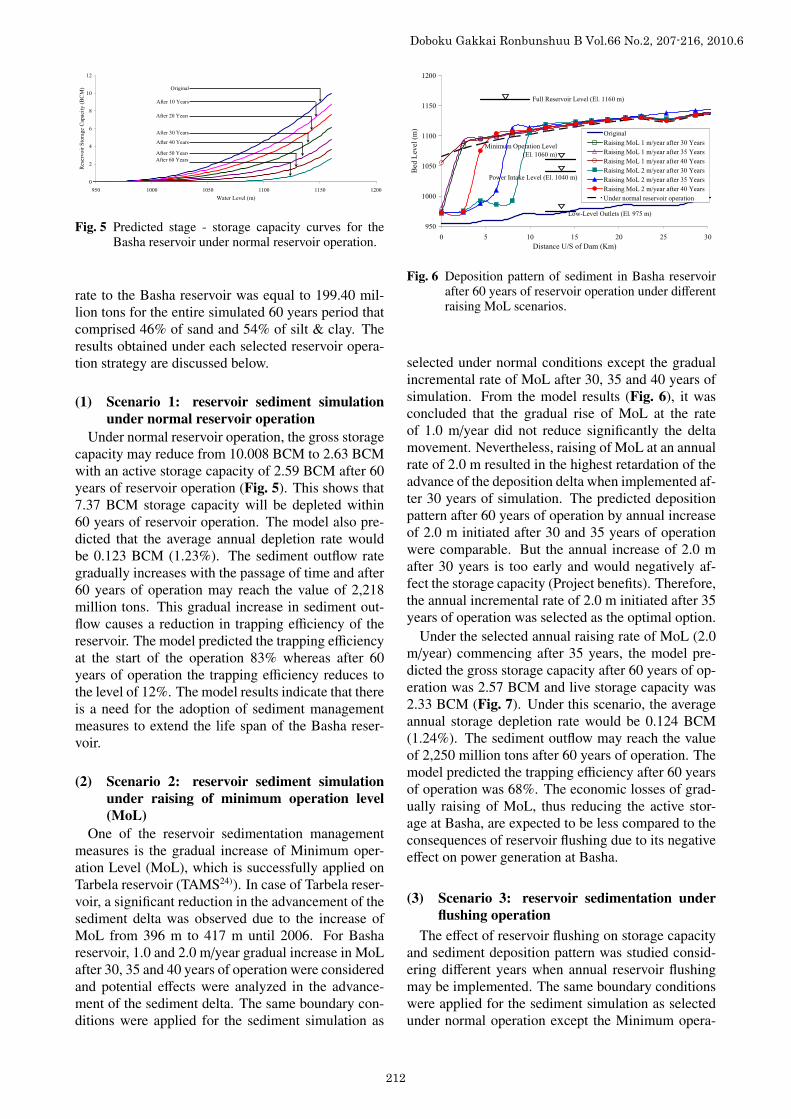
Fig. 5 Predicted stage - storage capacity curves for theBasha reservoir under normal reservoir operation.
rate to the Basha reservoir was equal to 199.40 mil-lion tons for the entire simulated 60 years period thatcomprised 46% of sand and 54% of silt & clay. Theresults obtained under each selected reservoir opera-tion strategy are discussed below.
(1) Scenario 1: reservoir sediment simulationunder normal reservoir operation
Under normal reservoir operation, the gross storagecapacity may reduce from 10.008 BCM to 2.63 BCMwith an active storage capacity of 2.59 BCM after 60years of reservoir operation (Fig. 5). This shows that7.37 BCM storage capacity will be depleted within60 years of reservoir operation. The model also pre-dicted that the average annual depletion rate wouldbe 0.123 BCM (1.23%). The sediment outflow rategradually increases with the passage of time and after60 years of operation may reach the value of 2,218million tons. This gradual increase in sediment out-flow causes a reduction in trapping efficiency of thereservoir. The model predicted the trapping efficiencyat the start of the operation 83% whereas after 60years of operation the trapping efficiency reduces tothe level of 12%. The model results indicate that thereis a need for the adoption of sediment managementmeasures to extend the life span of the Basha reser-voir.
(2) Scenario 2: reservoir sediment simulationunder raising of minimum operation level(MoL)
One of the reservoir sedimentation managementmeasures is the gradual increase of Minimum oper-ation Level (MoL), which is successfully applied onTarbela reservoir (TAMS24)). In case of Tarbela reser-voir, a significant reduction in the advancement of thesediment delta was observed due to the increase ofMoL from 396 m to 417 m until 2006. For Bashareservoir, 1.0 and 2.0 m/year gradual increase in MoLafter 30, 35 and 40 years of operation were consideredand potential effects were analyzed in the advance-ment of the sediment delta. The same boundary con-ditions were applied for the sediment simulation as
950
1000
1050
1100
1150
1200
0 5 10 15 20 25 30
Distance U/S of Dam (Km)
Bed L
evel
(m
)
Original
Raising MoL 1 m/year after 30 Years
Raising MoL 1 m/year after 35 Years
Raising MoL 1 m/year after 40 Years
Raising MoL 2 m/year after 30 Years
Raising MoL 2 m/year after 35 Years
Raising MoL 2 m/year after 40 Years
Under normal reservoir operation
Minimum Operation Level
(El. 1060 m)
Low-Level Outlets (El. 975 m)
Power Intake Level (El. 1040 m)
Full Reservoir Level (El. 1160 m)
Fig. 6 Deposition pattern of sediment in Basha reservoirafter 60 years of reservoir operation under differentraising MoL scenarios.
selected under normal conditions except the gradualincremental rate of MoL after 30, 35 and 40 years ofsimulation. From the model results (Fig. 6), it wasconcluded that the gradual rise of MoL at the rateof 1.0 m/year did not reduce significantly the deltamovement. Nevertheless, raising of MoL at an annualrate of 2.0 m resulted in the highest retardation of theadvance of the deposition delta when implemented af-ter 30 years of simulation. The predicted depositionpattern after 60 years of operation by annual increaseof 2.0 m initiated after 30 and 35 years of operationwere comparable. But the annual increase of 2.0 mafter 30 years is too early and would negatively af-fect the storage capacity (Project benefits). Therefore,the annual incremental rate of 2.0 m initiated after 35years of operation was selected as the optimal option.
Under the selected annual raising rate of MoL (2.0m/year) commencing after 35 years, the model pre-dicted the gross storage capacity after 60 years of op-eration was 2.57 BCM and live storage capacity was2.33 BCM (Fig. 7). Under this scenario, the averageannual storage depletion rate would be 0.124 BCM(1.24%). The sediment outflow may reach the valueof 2,250 million tons after 60 years of operation. Themodel predicted the trapping efficiency after 60 yearsof operation was 68%. The economic losses of grad-ually raising of MoL, thus reducing the active stor-age at Basha, are expected to be less compared to theconsequences of reservoir flushing due to its negativeeffect on power generation at Basha.
(3) Scenario 3: reservoir sedimentation underflushing operation
The effect of reservoir flushing on storage capacityand sediment deposition pattern was studied consid-ering different years when annual reservoir flushingmay be implemented. The same boundary conditionswere applied for the sediment simulation as selectedunder normal operation except the Minimum opera-
Doboku Gakkai Ronbunshuu B Vol.66 No.2, 207-216, 2010.6
212
.0
the model
of
operation was 2.57 BCM and live storage capacity
). Under this scenario, the
4
BCM (1.24 %). The sediment outflow may reach the
value of 2,250 million tons after 60 years of
0
2
4
6
8
10
12
950 1000 1050 1100 1150 1200
Water Level (m)
Res
ervoir
Sto
rage
Cap
acit
y (
BC
M) Original
After 10 Years
After 20 Years
After 30 Years
After 40 Years
After 50 Years
After 60 Years
Original
After 10 Years
After 20 Years
After 30 Years
After 40 Years
After 50 Years
After 60 Years
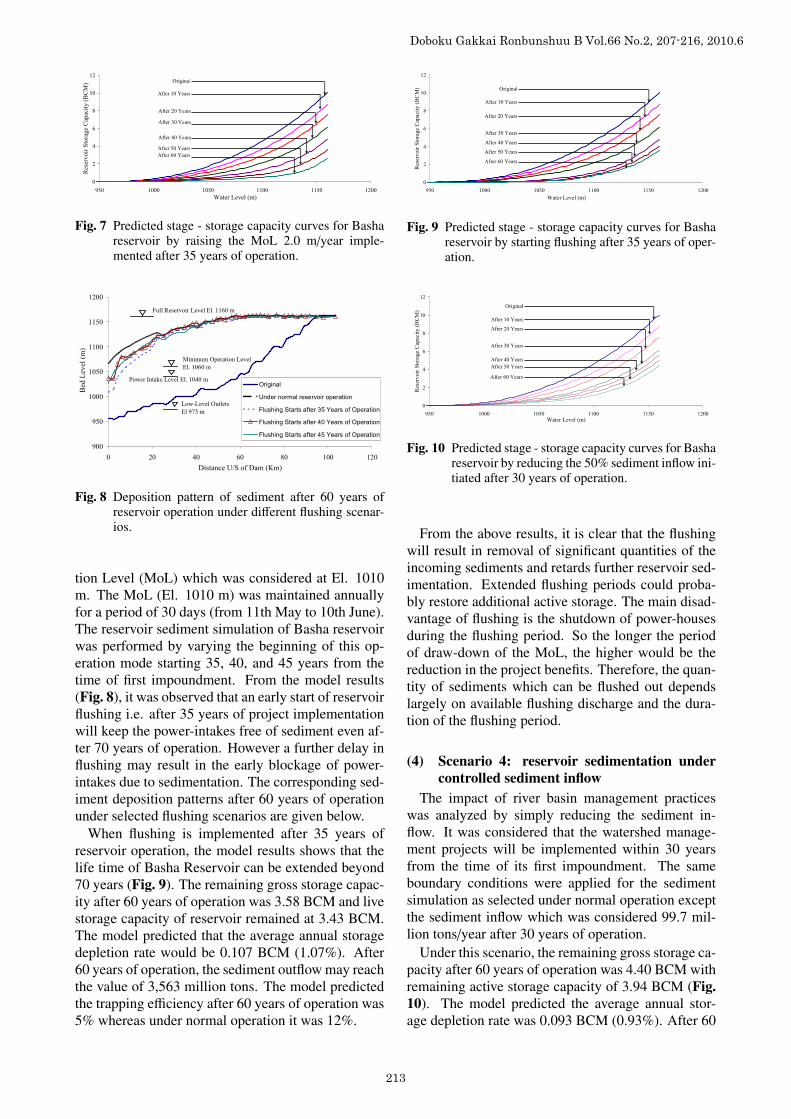
Fig. 7 Predicted stage - storage capacity curves for Bashareservoir by raising the MoL 2.0 m/year imple-mented after 35 years of operation.
to
be less compared to the consequences of reservoir
flushing due to its negative effect on power
hing
city
and sediment deposition pattern was studied
considering different years when annual reservoir
flushing may be implemented. The same boundary
900
950
1000
1050
1100
1150
1200
0 20 40 60 80 100 120
Distance U/S of Dam (Km)
Bed
Lev
el (
m)
Original
Under normal reservoir operation
Flushing Starts after 35 Years of Operation
Flushing Starts after 40 Years of Operation
Flushing Starts after 45 Years of Operation
Full Reservoir Level El. 1160 m
Minimum Operation Level
El. 1060 m
Low-Level Outlets
El 975 m
Power Intake Level El. 1040 m
Original
After 10 Years
After 20 Years
After 30 Years
After 40 Years
After 50 Years
After 60 Years
Fig. 8 Deposition pattern of sediment after 60 years ofreservoir operation under different flushing scenar-ios.
tion Level (MoL) which was considered at El. 1010m. The MoL (El. 1010 m) was maintained annuallyfor a period of 30 days (from 11th May to 10th June).The reservoir sediment simulation of Basha reservoirwas performed by varying the beginning of this op-eration mode starting 35, 40, and 45 years from thetime of first impoundment. From the model results(Fig. 8), it was observed that an early start of reservoirflushing i.e. after 35 years of project implementationwill keep the power-intakes free of sediment even af-ter 70 years of operation. However a further delay influshing may result in the early blockage of power-intakes due to sedimentation. The corresponding sed-iment deposition patterns after 60 years of operationunder selected flushing scenarios are given below.
When flushing is implemented after 35 years ofreservoir operation, the model results shows that thelife time of Basha Reservoir can be extended beyond70 years (Fig. 9). The remaining gross storage capac-ity after 60 years of operation was 3.58 BCM and livestorage capacity of reservoir remained at 3.43 BCM.The model predicted that the average annual storagedepletion rate would be 0.107 BCM (1.07%). After60 years of operation, the sediment outflow may reachthe value of 3,563 million tons. The model predictedthe trapping efficiency after 60 years of operation was5% whereas under normal operation it was 12%.
Minimum operation Level (MoL) which was
considered at El. 1010 m. The MoL (El. 1010 m) was
maintained annually for a period of 30 days (from
11th May to 10th June). The reservoir sediment
simulation of Basha reservoir was performed by
ng
35, 40, and 45 years from the time of first
), it was
0
2
4
6
8
10
12
950 1000 1050 1100 1150 1200
Water Level (m)
Rese
rvoir
Sto
rage C
apaci
ty (
BC
M) Original
After 10 Years
After 20 Years
After 30 Years
After 40 Years
After 50 Years
After 60 Years
Fig. 9 Predicted stage - storage capacity curves for Bashareservoir by starting flushing after 35 years of oper-ation.
of hypothetical nature and requires serious
the sediment transport in the Indus river. However,
the results show the potential positive effect of
watershed management projects in the upper Indus
0
2
4
6
8
10
12
950 1000 1050 1100 1150 1200Water Level (m)
Res
ervoir
Sto
rage C
apac
ity (
BC
M)
Original
After 10 Years
After 20 Years
After 30 Years
After 40 Years
After 50 Years
After 60 Years
Fig. 10 Predicted stage - storage capacity curves for Bashareservoir by reducing the 50% sediment inflow ini-tiated after 30 years of operation.
From the above results, it is clear that the flushingwill result in removal of significant quantities of theincoming sediments and retards further reservoir sed-imentation. Extended flushing periods could proba-bly restore additional active storage. The main disad-vantage of flushing is the shutdown of power-housesduring the flushing period. So the longer the periodof draw-down of the MoL, the higher would be thereduction in the project benefits. Therefore, the quan-tity of sediments which can be flushed out dependslargely on available flushing discharge and the dura-tion of the flushing period.
(4) Scenario 4: reservoir sedimentation undercontrolled sediment inflow
The impact of river basin management practiceswas analyzed by simply reducing the sediment in-flow. It was considered that the watershed manage-ment projects will be implemented within 30 yearsfrom the time of its first impoundment. The sameboundary conditions were applied for the sedimentsimulation as selected under normal operation exceptthe sediment inflow which was considered 99.7 mil-lion tons/year after 30 years of operation.
Under this scenario, the remaining gross storage ca-pacity after 60 years of operation was 4.40 BCM withremaining active storage capacity of 3.94 BCM (Fig.10). The model predicted the average annual stor-age depletion rate was 0.093 BCM (0.93%). After 60
Doboku Gakkai Ronbunshuu B Vol.66 No.2, 207-216, 2010.6
213
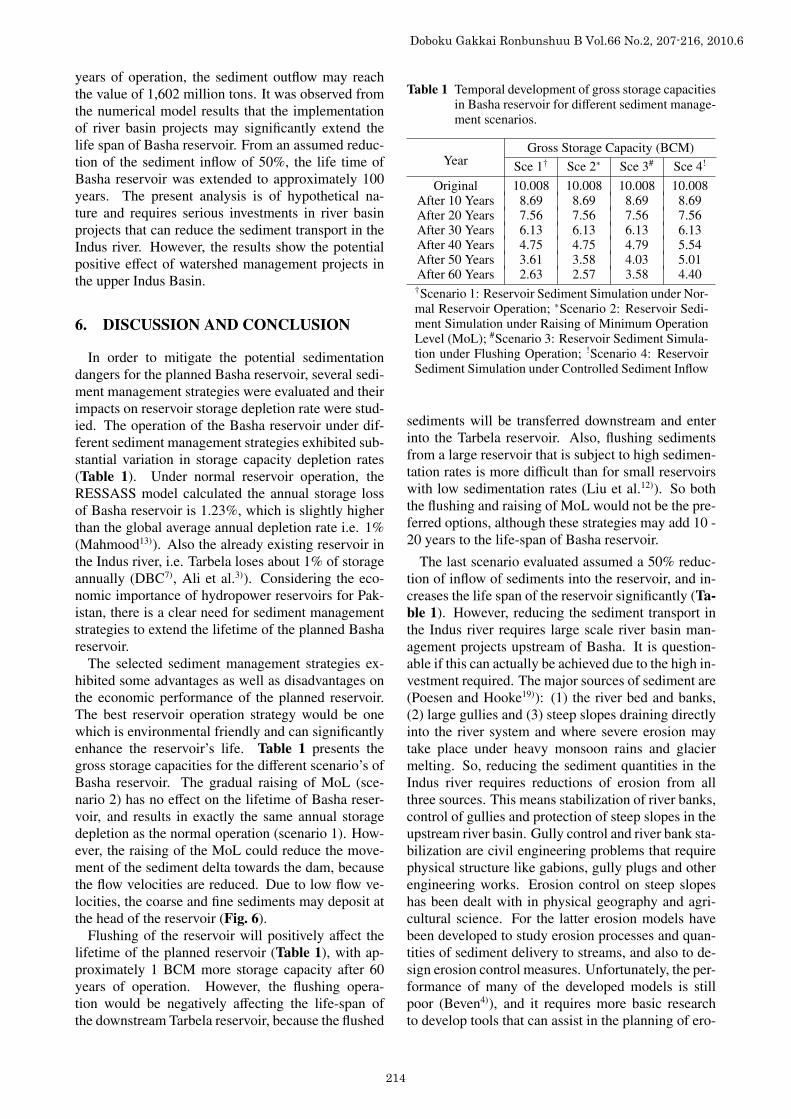
years of operation, the sediment outflow may reachthe value of 1,602 million tons. It was observed fromthe numerical model results that the implementationof river basin projects may significantly extend thelife span of Basha reservoir. From an assumed reduc-tion of the sediment inflow of 50%, the life time ofBasha reservoir was extended to approximately 100years. The present analysis is of hypothetical na-ture and requires serious investments in river basinprojects that can reduce the sediment transport in theIndus river. However, the results show the potentialpositive effect of watershed management projects inthe upper Indus Basin.
6. DISCUSSION AND CONCLUSION
In order to mitigate the potential sedimentationdangers for the planned Basha reservoir, several sedi-ment management strategies were evaluated and theirimpacts on reservoir storage depletion rate were stud-ied. The operation of the Basha reservoir under dif-ferent sediment management strategies exhibited sub-stantial variation in storage capacity depletion rates(Table 1). Under normal reservoir operation, theRESSASS model calculated the annual storage lossof Basha reservoir is 1.23%, which is slightly higherthan the global average annual depletion rate i.e. 1%(Mahmood13)). Also the already existing reservoir inthe Indus river, i.e. Tarbela loses about 1% of storageannually (DBC7), Ali et al.3)). Considering the eco-nomic importance of hydropower reservoirs for Pak-istan, there is a clear need for sediment managementstrategies to extend the lifetime of the planned Bashareservoir.
The selected sediment management strategies ex-hibited some advantages as well as disadvantages onthe economic performance of the planned reservoir.The best reservoir operation strategy would be onewhich is environmental friendly and can significantlyenhance the reservoir’s life. Table 1 presents thegross storage capacities for the different scenario’s ofBasha reservoir. The gradual raising of MoL (sce-nario 2) has no effect on the lifetime of Basha reser-voir, and results in exactly the same annual storagedepletion as the normal operation (scenario 1). How-ever, the raising of the MoL could reduce the move-ment of the sediment delta towards the dam, becausethe flow velocities are reduced. Due to low flow ve-locities, the coarse and fine sediments may deposit atthe head of the reservoir (Fig. 6).
Flushing of the reservoir will positively affect thelifetime of the planned reservoir (Table 1), with ap-proximately 1 BCM more storage capacity after 60years of operation. However, the flushing opera-tion would be negatively affecting the life-span ofthe downstream Tarbela reservoir, because the flushed
Table 1 Temporal development of gross storage capacitiesin Basha reservoir for different sediment manage-ment scenarios.
YearGross Storage Capacity (BCM)
Sce 1† Sce 2∗ Sce 3# Sce 4!
Original 10.008 10.008 10.008 10.008After 10 Years 8.69 8.69 8.69 8.69After 20 Years 7.56 7.56 7.56 7.56After 30 Years 6.13 6.13 6.13 6.13After 40 Years 4.75 4.75 4.79 5.54After 50 Years 3.61 3.58 4.03 5.01After 60 Years 2.63 2.57 3.58 4.40†Scenario 1: Reservoir Sediment Simulation under Nor-mal Reservoir Operation; ∗Scenario 2: Reservoir Sedi-ment Simulation under Raising of Minimum OperationLevel (MoL); #Scenario 3: Reservoir Sediment Simula-tion under Flushing Operation; !Scenario 4: ReservoirSediment Simulation under Controlled Sediment Inflow
sediments will be transferred downstream and enterinto the Tarbela reservoir. Also, flushing sedimentsfrom a large reservoir that is subject to high sedimen-tation rates is more difficult than for small reservoirswith low sedimentation rates (Liu et al.12)). So boththe flushing and raising of MoL would not be the pre-ferred options, although these strategies may add 10 -20 years to the life-span of Basha reservoir.
The last scenario evaluated assumed a 50% reduc-tion of inflow of sediments into the reservoir, and in-creases the life span of the reservoir significantly (Ta-ble 1). However, reducing the sediment transport inthe Indus river requires large scale river basin man-agement projects upstream of Basha. It is question-able if this can actually be achieved due to the high in-vestment required. The major sources of sediment are(Poesen and Hooke19)): (1) the river bed and banks,(2) large gullies and (3) steep slopes draining directlyinto the river system and where severe erosion maytake place under heavy monsoon rains and glaciermelting. So, reducing the sediment quantities in theIndus river requires reductions of erosion from allthree sources. This means stabilization of river banks,control of gullies and protection of steep slopes in theupstream river basin. Gully control and river bank sta-bilization are civil engineering problems that requirephysical structure like gabions, gully plugs and otherengineering works. Erosion control on steep slopeshas been dealt with in physical geography and agri-cultural science. For the latter erosion models havebeen developed to study erosion processes and quan-tities of sediment delivery to streams, and also to de-sign erosion control measures. Unfortunately, the per-formance of many of the developed models is stillpoor (Beven4)), and it requires more basic researchto develop tools that can assist in the planning of ero-
Doboku Gakkai Ronbunshuu B Vol.66 No.2, 207-216, 2010.6
214
sion control measures, especially in an environmentas extreme as the Indus river basin.
The model results showed that the reservoir lifecould be more than 100 years if the sediment in-flow would be reduced to 50% by implementing riverbasin management projects in the catchment area. Aliand De Boer2) already identified the main sedimentsources in the Indus valley which includes channelerosion, gully erosion, and steep hill-slope erosion.Therefore, the current challenge for the researchersis to identify the areas that are under high risk of soilerosion and also quantify their respective contributionin annual sediment yield. The following river basinmanagement practices can be adopted, which are be-ing globally used to abridge the erosion rate underchannel, gully, and steep hill-slopes.i. Due to meandering river patterns of the Indus, the
river banks are unstable because of the rapid lat-eral erosion, especially on the outside of mean-der bends (Ali and De Boer2)). So the river banksshould be protected by establishing vegetation andby placing rock-filled gabions (Toy et al.25)). Theplantation of trees can help to stabilize the riverbanks as well.
ii. Under gully erosion, the detachment and transportof sediment could be due to high flow velocitiesand steep slopes, which can be controlled by con-structing check dams to reduce the flow velocities(Zhou et al.34)). The check-dams would be effec-tive in both the glacier melt and rain induced areas.
iii. The soil losses on hill-slopes are mainly due tointerrill and rill erosion. Therefore, the detach-ment and transport capacity on hill slopes can bereduced by introducing strips of dense vegetation,terraces, flow diversions and armored waterwaysfor runoff disposal (Toy et al.25)). The vegetationmust be appropriate for the local climate and soilconditions.
The river basin management projects would notonly have positive impacts on the life of Basha reser-voir, but may also extend the life of projects that arebeing planned to construct upstream and downstreamof Basha. The proposed watershed management prac-tices may enhance the agriculture production in thearea, which would have direct impact on the life oflocal people.
ACKNOWLEDGEMENT: The authors are gratefulto several agencies (Surface Water Hydrology Projectand Water Management Directorate) of Water andPower Development Authority to provide the flowand sediment data used in this study.
REFERENCES1) Ackers, P. and White, W. R.: Sediment transport: new
approach and analysis, J. Hydr. Div., Vol. 99, No. 11,
pp. 2041-2060, 1973.2) Ali, K. F. and De Boer, D. H.: Spatial patterns and
variation of suspended sediment yield in the upperindus river basin, Northern Pakistan, J. Hydrol., Vol.334, pp. 368 - 387, 2007.
3) Ali, M., Ahmad, Z., Maqsood, R. and Siddique,M.: Performance of sediment transport functionsfor reservoir sediment simulation of mangla and tar-bela reservoirs, Proc. of the 8th International Sum-mer Symposium, Japan Society of Civil Engineers,Nagoya, Japan, pp. 87 - 90, 2006.
4) Beven, K. J.: Rainfall-Runoff Modeling, The Primer,Wiley, Chichester, UK, 2001.
5) Chang, H. H., Harrison, L., Lee, W. and Tu, S.: Nu-merical modeling for sediment pass through reser-voirs, J. Hydraul. Eng., Vol. 122, No. 7, pp. 381-388,1996.
6) DBC Consultants: Update of sediment transport of In-dus river at Partab Bridge/Bunji, Besham Qila and Di-amer Basha Damsite, Technical Memorandum, Waterand Power Development Authority, Pakistan, 2006.
7) DBC Consultants: Tarbela reservoir sedimentationstudy, Design Memorandum, Water and Power De-velopment Authority, Pakistan, 2007.
8) Farooqi, A.: Injudicious agricultural prac-tices are a source of breeding environmen-tal problems in Pakistan, Available from,http://www.ruralfuturesconference.org/2006/Farooqi.pdf, 2006.
9) Huang, M. and Zhang, L.: Hydrological responsesto conservation practices in a catchment of the LoessPlateau, China, J. Hydrol. Process, Vol. 18, pp. 1885- 1898, 2004.
10) Lara, J. M. and Pemberton, E. L.: Initial unit weightof deposited sediments, Proc. of Federal InteragencySedimentation Conference, Jackson. Miss, U.S. Dept.of Agriculture, Miscellaneous Publication No. 970,pp. 818 - 845, 1963.
11) Lea, N. J.: Analysis of reservoir range line surveys us-ing the stage width modification method, Report ODTN 56, HR Wallingford, Oxon, UK, 1991.
12) Liu, J., Liu, B. and Ashida, K.: Reservoir sedimenta-tion management in asia. Available from, http://kfki.baw.de/fileadmin/conferences/ICHE/2002-Warsaw/ARTICLES/PDF/128C4-SD.pdf,2002.
13) Mahmood, K.: Reservoir sedimentation: impact, ex-tent, and mitigation, Technical Paper No. 71, TheWorld Bank, Washington D.C., USA, 1987.
14) Minella, J. P. G., Merten, G. H., Walling, D. E. andReichert, J. M.: Changing sediment yield as an indi-cator of improved soil management practices in south-ern brazil, Catena, Vol. 79, pp. 228 - 236, 2009.
15) Miller, C. R.: Determination of unit weight of sedi-ment for use in sediment volume computations, Mem-orandum, Bureau of Reclamation, US Department ofthe Interior, Denver, Colorado, USA, 1953.
16) Mutreja, K. N.: Applied Hydrology, Tata-McGraw-Hill, India, 1986.
17) NEAC Consultants: Feasibility study of the Basha Di-amer dam project, hydrology and sedimentation re-port, Water and Power Development Authority, La-hore, 2004.
Doboku Gakkai Ronbunshuu B Vol.66 No.2, 207-216, 2010.6
215
18) Pakistan Water Partnership: The Framework for ac-tion (FFA) for achieving the pakistan water vision2025, Civil Society Response to FFA, 638 WAPDAHouse, The Mall Lahore, Pakistan, 2001.
19) Poesen, J. W. A. and Hooke, J. M.: Erosion, flood-ing and channel management in mediterranean envi-ronments of southern Europe, J. Progress in PhysicalGeography, Vol. 21, No. 2, pp. 157 - 199, 1997.
20) Qian, N.: Reservoir sedimentation and slope stabil-ity; technical and environmental effects, 14th Interna-tional Congress on Large Dams, Transactions No. 3,pp. 639 - 690, 1982.
21) Sloff, C. J.: Modelling reservoir sedimentation pro-cesses for sediment management studies, Proc. ofconference - Hydropower into the next Century, Por-toroz, Slovenia, pp. 513 - 524, 1997.
22) Solaimani, K., Modallaldoust, S. and Lotfi, S.: In-vesitgation of land use changes on soil erosion pro-cess using geographical information system, Int. J.Environ Sci. Tech., Vol. 6, No. 3, pp. 415 - 424, 2009.
23) Tahir, Z. and Habib, Z.: Land and water productiv-ity trends: across punjab canal, Pakistan, InternationalWater Management Institute (IWMI), Working PaperNo. 14: Pakistan, 2000.
24) TAMS Consultants: Tarbela dam sediment manage-ment study, Water and Power Development Authority,Pakistan, 1998.
25) Toy, T. J., Foster, G. R. and Renard, K. G.: Soil Ero-sion: Processes, Prediction, Measurement, and Con-trol, Wiley, New York, 2002.
26) U.S. Bureau of Reclamation (USBR): Design of smalldams, U. S. Department of the Interior, Bureau ofReclamation, Washington, D. C, 1987.
27) U.S. Army Corps of Engineers, Hydrologic Engineer-ing Centre (HEC): Guidelines for the Calibration andApplication of Computer Program HEC-6, TrainingDocument No. 13, HEC, Davis, Calif., USA, 1992.
28) Wallingford HR: Sediment transport: the Ackers andWhite theory revised, Report SR 237, HR Walling-ford, Oxon, UK, 1990.
29) Wallingford HR: Measuring and predicting reservoirvolume changes due to sedimentation, User manualfor RESSASS Version 1.5. HR Wallingford, Oxon,UK, 2001.
30) Westrich, B. and Jurashek, M.: Flow transport ca-pacity for suspended sediment, Presented at the21st Congress of the International Association forHydraulic Research (IAHR), Melbourne, Australia,1985.
31) White, R.: Flushing of sediments from reservoirs,ICOLD, World Register of Large Dams, HR Walling-ford, UK, 2000.
32) World Bank: A strategy for sustainable agriculturalgrowth, Agricultural and Natural Resources Division,South Asia Region. Pakistan, 1994.
33) Yang, C. T., Huang, J. V. and Greimann, B. P.: User’sManual for GSTAR-1D 1.0 (Generalized SedimentTransport for Alluvial Rivers - One Dimensional, Ver-sion 1.0), U. S. Bureau of Reclamation Technical Ser-vice Center, Denver, USA, 2004.
34) Zhou, X. X., Hong-wu, Z. and Ouyang, Z.: Develop-ment of check-dam systems in gullies on the LoessPlateau, China, J. Environmental Science & Policy,Vol. 7, pp. 79 - 86, 2004.
(Received October 14, 2009)
Doboku Gakkai Ronbunshuu B Vol.66 No.2, 207-216, 2010.6
216