Embed Size (px)
Citation preview

IN DEGREE PROJECT MATERIALS SCIENCE AND ENGINEERING,SECOND CYCLE, 30 CREDITS
, STOCKHOLM SWEDEN 2019
Evaluation of quantification methods for inclusion distribution in clean steel
FELICIA FRÖJD
KTH ROYAL INSTITUTE OF TECHNOLOGYSCHOOL OF INDUSTRIAL ENGINEERING AND MANAGEMENT

ABSTRACT
Ovako products are in many cases used in high fatigue applications. Currently Ovako use
ultrasonic evaluation at 10 MHz as a volumetric method for inclusion control. This study
intends to investigate two new methods for quantification of micro inclusions.
The aim of this study is to develop a method for large area scanning by creating a polishing
method that allows you to polish away a specified amount of material, in this case 60 µm. This
method will be used to capture the true distribution of critically sized non-metallic inclusions
by creating a 3D image out of several 2D scans from the light optical microscope. These results
will be compared to the results of high frequency ultrasonic testing at 125 MHz to get a
quantitative idea of what can be captured by the high frequency ultrasonic investigation.
Two different steel grades were studied, named Grade A and Grade B, with one sample of each.
Both grades have similar composition, except that Grade B contains more sulphur. Both grades
are of approximately the same hardness. The two steel samples were scanned with a scanning
acoustic microscope at the same time as a method to polish away 60 µm was developed. After
this, the method was used to scan several layers with an image recognition program in the light
optical microscope. The results from both methods were then compared.
After testing, it was concluded that the inclusion distribution pattern was completely different
for the two steel grades, however the same pattern could be seen for each grade in the LOM
and in the ultrasonic. This indicates that the same types of inclusions could be found. It was
also found that the ultrasonic enlarges the indications by a severe amount making it hard to
take any measurements directly from the ultrasonic images in this study. What is possible to
see in the ultrasonic images are the distribution of inclusions and the inclusion placement in
the sample. A result of 10 % matching inclusions between both methods is found, which is to
say that the same 50 inclusions out of the 500 largest indications from each method in the steel
sample is found. These 10 % is however not sufficient enough to conclude by how much the
ultrasonic enlarges the indications compared to the light optical microscope.
Keywords: large area scanning, high-frequency ultrasonic testing, light optical evaluation,
inclusion distribution

SAMMANFATTNING
Ovako i Hofors tillverkar stål för komponenter som kräver hög utmattningshållfasthet. För
närvarande utför Ovako ultraljudsundersökningar på 10 MHz som en volymetrisk testmetod
för inneslutningskontroll. Den har studien kommer att undersöka två nya testmetoder för
kvantifiering av mikroinneslutningar.
Syftet med denna studie är att skapa en slipmetod för att polera bort 60 µm material som sedan
kan användas för att bygga en 3D bild från ett flertal 2D scanningar i ett ljusoptiskt mikroskop.
Detta resultat kommer att jämföras med resultatet från högfrekvens ultraljud på 125 MHz för
att få en kvantitativ uppfattning av vad ett högfrekvens ultraljud kan undersöka.
Två stålsorter, ett prov av vardera, används i undersökningen, dessa benämns Prov A och Prov
B. Båda stålsorterna har ungefär samma hårdhet och sammansättning. Skillnaden i
sammansättningen finns i svavelhalten, där Prov B innehåller mer svavel än Prov A. De två
stålproverna skannades med ett akustiskt mikroskop samtidigt som en slipmetod för att polera
bort 60 µm skapades. Därefter användes metoden för att skanna flera lager med ett
bildigenkänningsprogram i det ljusoptiska mikroskopet. Resultatet från både metoderna
jämfördes sedan.
Ett resultat av studien är att samma inneslutningsmönster kan ses i ultraljudsresultaten och
de ljusoptiska resultaten, detta trots att de två olika stålsorterna uppvisade helt olika mönster
i sig. Ultraljudet tenderar att förstora upp inneslutningar vilket gör det svårt att mäta
inneslutningens storlek direkt från ultraljudsbilden i den här studien. Däremot går det att se
fördelningen och placeringen av inneslutningarna direkt i bilden. Ett resultat av 10 %
matchning av inneslutnings-indikationer mellan ultraljud och ljusoptiskt hittades. Med detta
resultat så går det i denna undersökning inte att jämföra samma inneslutning på ett bra sätt
mellan ultraljud och ljusoptiskt för att hitta en faktor av hur mycket ultraljudet förstorar
inneslutningarna.

LIST OFF ABBREVIATIONS
LOM Light Optical Microscope
SEM Scanning Electron Microscope
UST Ultrasonic Testing
SAM Scanning Acoustic Microscope
ECD Equivalent Circle Diameter
ISO International Organization for Standards
ASTM American Society for Testing and Materials
DIN Deutsches Institute für Normung
UIS Ultrasonic Indication Size
Piano 500, Piano 220 Grinding discs
Nap, Plus, Dac, Largo, Allegro Polishing discs

TABLE OF CONTENTS
1 Introduction ......................................................................................................................... 1
1.1 Inclusions effect on fatigue ........................................................................................... 1
1.2 Standards used today .................................................................................................. 2
1.3 Social and ethical aspects ............................................................................................ 3
1.4 Aim and objective ........................................................................................................ 3
2 Inclusions and methods for quantification ......................................................................... 5
2.1 Inclusions .................................................................................................................... 5
2.2 Methods for quantification .......................................................................................... 6
3 Method ................................................................................................................................ 8
3.1 Materials and sample preparation .............................................................................. 8
3.2 High frequency ultrasonic testing ............................................................................... 9
3.3 Method development ................................................................................................. 10
3.4 Light optical microscope ............................................................................................12
4 Results ................................................................................................................................ 13
4.1 Method development evaluation ................................................................................ 13
4.2 Results Grade A ..........................................................................................................16
Ultrasonic SAM results .......................................................................................16
LOM .................................................................................................................... 18
Ultrasonic vs. LOM..............................................................................................19
Non-matching indications ................................................................................. 25
4.3 Results Grade B ......................................................................................................... 26
Ultrasonic SAM results ...................................................................................... 26
LOM .................................................................................................................... 27
Ultrasonic vs. LOM............................................................................................. 29
5 Discussion ......................................................................................................................... 34
5.1 Method development evaluation ............................................................................... 34
5.2 Ultrasonic .................................................................................................................. 35
5.3 LOM ........................................................................................................................... 35
5.4 Ultrasonic vs. LOM .................................................................................................... 36
5.5 Sources of error ......................................................................................................... 39
6 Conclusions ....................................................................................................................... 43
7 Suggestions of further investigations ............................................................................... 44
8 Acknowledgement ............................................................................................................. 45
9 References ......................................................................................................................... 46

1
1 INTRODUCTION
Ovako develops high strength steels for applications exposed to fatigue such as bearings and
gears, often used in critical automotive powertrain components. To improve the fatigue life for
these applications clean steels are of utmost importance. If the inclusions size and distribution
can be measured and controlled there is a possibility to prolong the fatigue life by up to 50 %
[1].
1.1 INCLUSIONS EFFECT ON FATIGUE
Fatigue behaviour for applications are sensitive to several variables, including mean stress
level, geometric design, surface defects, environment and metallurgical variables like
inclusions. Around 90 % of component failures are caused by fatigue, a very dangerous form
of brittle failure, where there are no signs of warning before failure. Fatigue failure occurs due
to cyclic stresses and are typical in structures as bridges, cars and machine components. A
typical reversed stress cycle where the tension-compression relation is centred around zero can
be seen in Figure 1.1.
Figure 1.1 A reversed stress cycle. Demonstrating a typical stress cycle when evaluating the fatigue
life of a material through rotating bending fatigue testing. [2]
Due to the stress cycles the applied load at failure is significantly below the maximum stress
compared to what the material can withstand under static circumstances. The failure occurs
due to crack initiation. This is often caused by inclusions, assuming that the component has
the correct design, heat treatment and surface condition. In the close proximity of an inclusion
there are built in stresses that are higher than in the rest of the matrix material. This due to the
difference in hardness and microstructure between the inclusions and the matrix. After a crack
is initiated, the continuous stress loading and unloading makes the crack propagate through
the material. This can sometimes be seen with the naked eye on more ductile material as
beachmark ridges, which occurs if there are interruptions during the crack propagation. Each
prolongation in the crack propagation can be seen as striations in an electron microscope. Each
striation represent one loading step in the propagation. These two phenomena can be seen in
Figure 1.2. Brittle materials does normally not show either of these phenomena, just a smooth
fracture surface.

2
Figure 1.2 Fracture surface of a fatigue test sample showing, a) beachmark ridges, b) striations [2].
The crack propagates through the material until it exceeds the critical crack length, where final
failure occurs. For brittle materials this happens almost immediately after crack initiation, but
for ductile materials the crack can propagate in the unknown for an extensive amount of time.
The knowledge of inclusion type and its influence on the materials fatigue strength is therefore
crucial to understand the materials behaviour in an application and avoid sudden failure [2]
[3].
1.2 STANDARDS USED TODAY
The automotive industry is in need for high endurance fatigue materials. Each gear needs to
endure for a long time, and it is important, for safety reasons, that a critically placed gear do
not fracture during driving. Therefore, clean steels, and knowledge of their behaviour and
overall quality, are highly important to predict the fatigue life and know its limits before failure.
Today Ovako is requested to use current standards: ISO 4967, ASTM E45 and DIN 50602, to
evaluate non-metallic micro inclusions in light optical microscopy. Currently the amount of
tested material is too small to provide statistical confidence in predicting fatigue life [1].
Another standard test used by the automotive industry for these steels is ISO3763, blue
fracture testing, where a sample is hardened, fractured and then tempered blue to increase the
visibility of defects. Using this standardized testing method only macro inclusions larger than
2.5 mm can be detected, something Ovako have not found in their steels in over 30 years.
Therefore, Ovako has developed their own volumetric testing standard using ultrasonic
equipment at a frequency of 10 MHz where inclusions of approximately 120 µm can be found.
Ovako is of the opinion that standard methods to evaluate non-metallic inclusions are
incapable of determining the size and distribution of importance, based on the mismatch
between the area assessed and the probability to find inclusions of a critical size. Ovako
specializes in clean steels, with the focus on special products with high demands on fatigue life,
has increased their need to develop new methods for testing steel cleanliness. Some new
standards used in-house at Ovako have already been developed, but to be able to stay in the
lead for clean steel development there are always an interest to develop new methods for
quantification of micro and meso inclusions [1] [4].

3
1.3 SOCIAL AND ETHICAL ASPECTS
A topic highly present in today’s climate is how to work towards a more sustainable future,
both when it comes to emissions, but also the consumption culture which needs to be
redirected to products with a longer life span [5].
This work is dedicated to investigate methods for evaluation of inclusion distribution in clean
steel, where clean steel is the keyword. Clean steel is a suitable way to solve the problem with
fatigue failure, increasing the life span of an application. Ovako is always on the lookout for
new clean steels, since it has been proved in the past what clean steel can do. An example of
clean steels used to reduce the environmental impact is the IQ-steel. The IQ-steel has a high
cleanliness level and isotropic properties, something that when used the correct way can
enhance the performance and make it possible to use up to 20 % less material in an application
[6] [7]. For example, the IQ-steel has been used to improve the performance in diesel injection
application used in cars, trucks and ships. By using IQ-steel the pressure could be raised,
increasing the combustion efficiency, and by that reduced the diesel consumption with
approximately 1 litre/100 km. If only seeing to cars, using IQ-steel in critical components, it is
possible to calculate that the CO2 emissions has been reduced in total by approximately 80
million tons/10 years [8].
Since the climate is changing it is important to reduce all emissions possible, something that
is proved possible with clean steel. New methods to investigate inclusion distribution is
necessary to continue the development of clean steel, both to find new applications for already
existing products, and to come up with new products, since the inclusions are very small. The
quantification methods investigated in this work will be evaluated to see if they are suitable to
use to investigate inclusion distribution in clean steel.
1.4 AIM AND OBJECTIVE
Historically Ovako Group R&D in Hofors has not performed ultrasonic testing at 125 MHz or
polishing and grinding of a specified amount of material in this way. Previously the sample
have been polished close to the wanted surface and thereafter the material has been polished
by hand in series and examined until the wanted surface was found. The purpose of this work
is to develop a method to evaluate large areas by creating a polishing method that allows you
to polish off a specified amount of material in the range of 50-100 µm. This method will be
used to capture the true distribution of critically sized non-metallic inclusions by LOM and
compare this to the result of high frequency ultrasonic testing to get a quantitative idea of what
can be captured by the ultrasonic investigation. This will be done by the following steps.

4
• Scanning the samples using high frequency ultrasonic testing with a frequency
of 125 MHz to get a volumetric 3D image of the investigated volume built by
several layers.
• Develop a polishing method for a specific amount of material removal and use
this for large area scanning in a light optical microscope using a Clemex
software. This will determine a sort of 3D inclusions distribution by
interpolating the results from several 2D scans to a 3D image.
• Compare the distribution and size of indications found with LOM with the
results from high frequency ultrasonic testing, in order to evaluate the precision
of the ultrasonic scans and evaluate the possibility to find all types of inclusions.

5
2 INCLUSIONS AND METHODS FOR QUANTIFICATION
The presence of non-metallic inclusions in steel play a great role in the material properties.
Therefore, it is important to know the composition, size and distribution of the inclusions in
order to predict the materials behaviour during its lifetime. This chapter will cover the basis of
inclusions and an introduction of methods currently used to investigate the quantification of
inclusions.
2.1 INCLUSIONS
Inclusions come from different steps in the steel making process and is by that divided into
two categories: exogenous and endogenous inclusions. Exogenous inclusions are trapped in
the melted steel and are the result from chemical or mechanical reactions between the steel
and its surroundings. Examples of exogenous inclusions are slag particles or mould powder
due to entrainment. These inclusions are described as macro inclusions. These are often larger
than approximately 150 µm, and are commonly found in low quality steels. In modern high-
quality steels these are rarely found, most often these steels contain endogenous inclusions
smaller than 25 µm. Endogenous inclusions are small and are often mentioned as micro
inclusions and meso inclusions. These inclusions, also called non-metallic inclusions, are often
what causes problems in high quality steels. Endogenous inclusions are the result of reactions
that takes place between the chemical compounds during the cooling/solidification of the steel
melt. They are often formed from oxygen or sulphur that remain after the process and form
oxides and sulphides [1] [9] [10] [11].
At Ovako AB inclusions are divided into three categories, micro inclusions, meso inclusions
and macro inclusions. The size definition can be seen in Table 2.1. [4]
Table 2.1 A Table presenting the definition of micro, meso and macro inclusions according to Ovako
standards. [4]
Inclusion Size
Micro inclusions 5 – 30 µm, endogenous
Meso inclusions 25 – 200 µm, endogenous
Macro inclusions > 120 µm, exogenous
Endogenous micro inclusions comes in a variety of compositions, shapes and sizes. Therefore
they are divided into different types according to ASTM E45 or ISO 4967, which can be seen in
Figure 2.1.
6
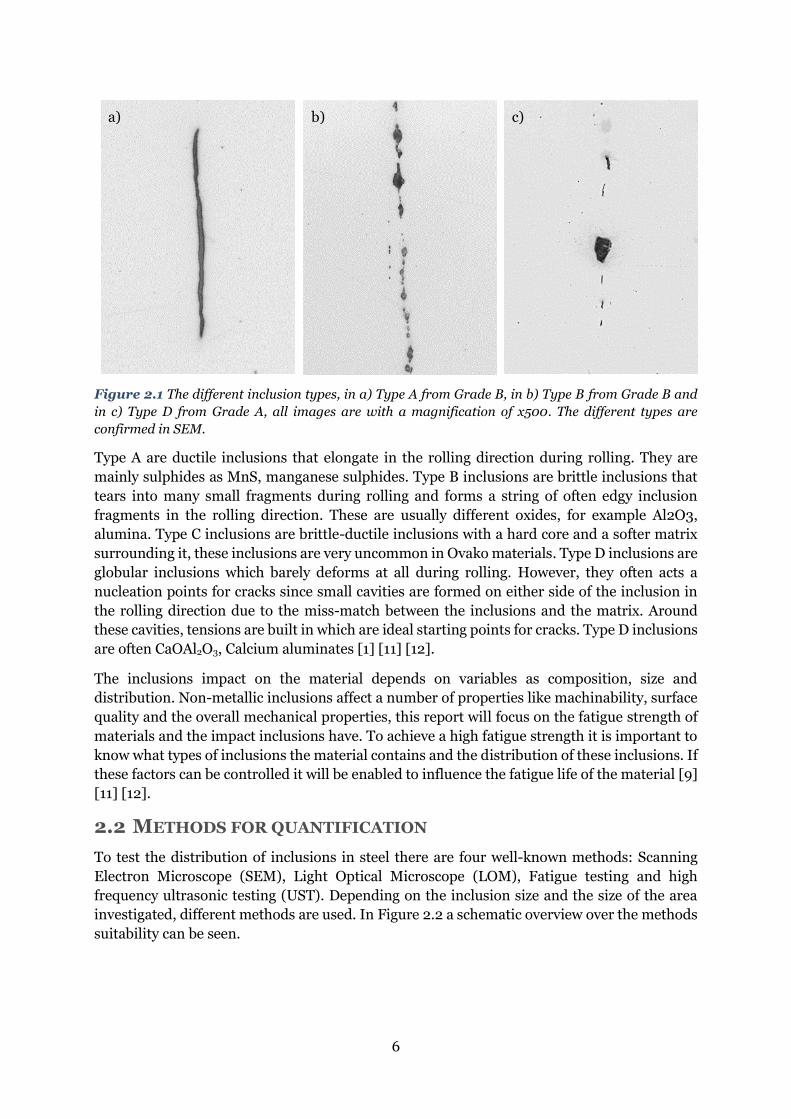
Figure 2.1 The different inclusion types, in a) Type A from Grade B, in b) Type B from Grade B and
in c) Type D from Grade A, all images are with a magnification of x500. The different types are
confirmed in SEM.
Type A are ductile inclusions that elongate in the rolling direction during rolling. They are
mainly sulphides as MnS, manganese sulphides. Type B inclusions are brittle inclusions that
tears into many small fragments during rolling and forms a string of often edgy inclusion
fragments in the rolling direction. These are usually different oxides, for example Al2O3,
alumina. Type C inclusions are brittle-ductile inclusions with a hard core and a softer matrix
surrounding it, these inclusions are very uncommon in Ovako materials. Type D inclusions are
globular inclusions which barely deforms at all during rolling. However, they often acts a
nucleation points for cracks since small cavities are formed on either side of the inclusion in
the rolling direction due to the miss-match between the inclusions and the matrix. Around
these cavities, tensions are built in which are ideal starting points for cracks. Type D inclusions
are often CaOAl2O3, Calcium aluminates [1] [11] [12].
The inclusions impact on the material depends on variables as composition, size and
distribution. Non-metallic inclusions affect a number of properties like machinability, surface
quality and the overall mechanical properties, this report will focus on the fatigue strength of
materials and the impact inclusions have. To achieve a high fatigue strength it is important to
know what types of inclusions the material contains and the distribution of these inclusions. If
these factors can be controlled it will be enabled to influence the fatigue life of the material [9]
[11] [12].
2.2 METHODS FOR QUANTIFICATION
To test the distribution of inclusions in steel there are four well-known methods: Scanning
Electron Microscope (SEM), Light Optical Microscope (LOM), Fatigue testing and high
frequency ultrasonic testing (UST). Depending on the inclusion size and the size of the area
investigated, different methods are used. In Figure 2.2 a schematic overview over the methods
suitability can be seen.
a) b) c)

7
Figure 2.2 Presenting measurement method for inclusion depending on inclusion size and
investigated area. [13]
There are two methods to investigate fatigue life. One is to actually test the fatigue life by
fatigue testing. The second one is to use inclusion distribution to get an idea about the fatigue
life. This can be done by three methods: UST, LOM and SEM. These methods cover different
areas when it comes to inclusions size which can be seen in Figure 2.2. Testing for fatigue by
performing fatigue testing is the most valid method since it tests for the actual problem.
However, the amount of samples tested needs to be large to get statistical confidence results
since the volume tested for each time is relatively small. Therefore, it can be good to
complement these tests with inclusion distribution by one of these methods. The most suitable
method depends on the steel and what types of inclusions it contains. If there are larger
inclusions to be investigated, ultrasonic testing is a good method since it is possible to cover a
large volume at a small amount of time. If there are only smaller inclusions present, LOM can
be a good option since it is quite fast and covers an acceptable amount of area over an
acceptable time [13].
UST 80 MHz
LOM
Fatigue testing
SEM/EDS

8
3 METHOD
This chapter will present the materials used, the sample preparation and the two investigation
methods, high frequency ultrasonic testing and light optical microscope method. There will
also be a summary over the method development for the LOM method. An overview over all
the steps included can be seen in Figure 3.1.
This project will investigate the inclusion distribution for same area, for the same samples,
using two different methods. Both by non-destructive testing and destructive testing and
thereafter compare the results and evaluate the veracity of both methods.
Figure 3.1 An overview over the different steps in the process.
3.1 MATERIALS AND SAMPLE PREPARATION
The materials investigated in this study are from the 20MnCr5 family and will be called Grade
A and Grade B. Where Grade B contains around 10 times more sulphur than Grade A. Grade B
is a through hardening bearing steel whereas Grade A is a case hardening steel. Both grades
are used in the automotive industry but differs when it comes to hardness, inclusion type and
distribution.
These steels are investigated in a hardened state presented in Table 3.1. In Table 3.2 the
expected inclusions distribution will be shown.
Table 3.1 Presenting the hardened states for the investigated steels, Grade A and Grade B.
Grade A Grade B
Hardness [HV10] 425 450
High frequency ultrasonic
testing
•Sample preparation- to 1µm diamond polishing
•Ultrasonic scanning
Method development
•Develop method to polish off 60µm
LOM with image
recognition
•Polishing off one layer•LOM scanning with image recognition
•Evaluation of scanned result

9
Table 3.2 Presenting the expected inclusions for Grade A and Grade B and the standards used to
classify the inclusions [14].
Micro inclusions – Grade A
Applied standard DIN 50602 K1
Sampling Random samples from final product dimension
Types present Type A Type B Type D
Micro inclusions – Grade B
Applied standard ASTM E45
Sampling ASTM A295
Types present Type A Type B Type D
The samples are taken from the middle of a rolled bar with a diameter of 90 mm, and is taken
from the centre line of that bar. The samples are 45 x 90 x 10 mm and an overview of the sample
placement can be seen in Figure 3.2.
Figure 3.2 A 10 mm thick slice is cut out from the centre line of the 90mm diameter bar. Final sample
size is 45 x 90 x 10 mm. The image is not according to scale.
3.2 HIGH FREQUENCY ULTRASONIC TESTING
The high frequency ultrasonic testing where performed by the company PVA TePla in Germany
with the help of a Scanning Acoustic Microscope, SAM, equipment [15]. The two steel grades
where polished with 1 µm diamond suspension beforehand to have an optimal surface.
The scanning was done with a frequency of 125 MHz where PVA TePla have an inclination that
inclusions down to around 30 µm can be found [15]. The SAM where set with a threshold above
the signal-noise ratio and has a total focal zone of 170 ns, around 510 µm. 17 scanning layers
with a depth of 30 µm built the total focal zone. In total the whole scanning of 1 sample took
around 30 minutes. This is described in Figure 3.3 and Figure 3.4.

10
Figure 3.3 An overview of the ultrasonic scanning process. The total area is split into a total of 17
layer, 30 µm each. The image is not according to scale.
Figure 3.4 A cross-section showing the area investigated and the x-scan layers. Every orange and
blue layer represents a depth of 30µm, with a total of 17 layers. The image is not according to scale.
3.3 METHOD DEVELOPMENT
To examine the same area using both testing methods a new method for polishing had to be
developed. It was decided that every other layer should be examined since the precision of the
polishing would be too rough to create an image over every layer. Therefore 60 µm should be
polished using the Tegramine polishing machine by Struers and a total of 8 layers would be
scanned and compared to the ultrasonic images.
To avoid errors that comes with having many steps in a process where something can go wrong
there was an interest in having a low amount of polishing steps. Therefore the method
development started with a polishing plate as close as possible to the plate used to get the
wanted polishing finish. If a poor result was attained a rougher polishing plate was added to
the method until an acceptable result was achieved. This method was based on a previously
developed polishing method from Struers. Before each try the samples were taped to the centre
of a mounting plate. A short presentation for the testing for the right amount of polishing steps
can be seen in Table 3.3. Nap, Plus, Dac, Largo, Allegro, Piano 500 and Piano 220 are
polishing/grinding plates of different roughness [16].

11
Table 3.3 Presenting the different trials in order to get a successful method to polish off 60 µm of
material [16].
Method Polishing plate and diamond suspension
Removal/time Outcome
Test 1 Plus with 3 µm diamond suspension
Nap with 1 µm diamond suspension
60 µm
3 min
60 µm step approx. 30 minutes
Much height difference
Test 2 Largo with 9 µm diamond suspension
Plus with 3 µm diamond suspension
Nap with 1 µm diamond suspension
60 µm
3 min
3 min
60 µm step approx. 25 minutes
Much height difference
Test 3 Allegro with 9 µm diamond suspension
Largo with 9 µm diamond suspension
Plus with 3 µm diamond suspension
Nap with 1 µm diamond suspension
60 µm
5 min
3 min
3 min
60 µm step approx. 25 minutes
Much height difference
Various amount taken for each try
Test 4 Piano 500
Allegro with 9 µm diamond suspension
Largo with 9 µm diamond suspension
Plus with 3 µm diamond suspension
Nap with 1 µm diamond suspension
60 µm
5 min
5 min
3 min
3 min
60 µm step approx. 15 minutes
Various amount material taken for each try
Smaller height difference
Test 5 Piano 220
Piano 500
Allegro with 9 µm diamond suspension
Largo with 9 µm diamond suspension
Plus with 3 µm diamond suspension
Nap with 1 µm diamond suspension
60 µm
2 min
5 min
5 min
3 min
3 min
60 µm step approx. 5 minutes
Small height difference
Varity taken material for each try +/- 5 µm
Test 6 Piano 220
Piano 500
Allegro with 9 µm diamond suspension
Largo with 9 µm diamond suspension
Dac with 3 µm diamond suspension
Nap with 1 µm diamond suspension
60 µm
1.5 min
2 min
4 min
5 min
1 min
60 µm step approx. 5 minutes
Small height difference
Some scratches
Varity taken material for each try +/- 10 µm
Several attempts were performed on each test, and if a good result was not reached a new step
with a rougher surface was added. The two Piano discs are grinding plates with the diamonds
directly fixed on instead of added through suspension. The two different plates for 9 µm
diamond suspension are of different hardness, where Allegro is a harder plate with a higher
removal rate and Largo is a softer plate which reduces the scratches. Between every step the
sample was washed with ethanol 99.5 % to avoid washing out some inclusions with water.

12
3.4 LIGHT OPTICAL MICROSCOPE
To evaluate the sample in the image recognition program, a Clemex software, several steps
needed to be conducted [17]. In Figure 3.5 an overview of the steps from sample preparation
to a finished sample can be seen and in Figure 3.6 a schematic Figure over the hardness
marking placement can be seen.
Figure 3.5 An overview over the steps performed during the LOM tests. The test of one layer took
approximately two hours including time to move the sample between each step. An entire sample, with
all the layers, had a testing time of approximately 16 hours.
After one layer scanning, an excessive amount of inclusions are found, over 10 000, therefore
they are sorted on the largest equivalent circle diameter (ECD [µm]) and only the 100 largest
are chosen from each layer. After the whole sample volume is scanned (8 layers), all layers are
put together, to a total amount of 800 inclusions, and again sorted after the ECD. Thereafter,
only the 500 largest inclusions are allowed to continue in the study.
Polishing 60µm
- 30 minutes
Hardness markings
Impressions are made 5 mm from the corner in the x and y direction, one impression in one corner and two impression in the other corner
- 12 minutes
Scanning
Scanning the whole area with a Clemex image recognition software at 100x magnification
- 37 minutes
Evaluation
Taking out the 100 larges inclusions and checking by hand that the "true structure" is evaluated. If not, the markings that do not represent inclusions are taken out
When needed the unclear inclusions are checked in the SEM
- 10-30 minutes
Height measurments
Taking 5 measurements, every corner and in the middle, and calculating an average
- 5 minutes

13
4 RESULTS
This chapter will present the results from the experimental procedures. A selected part is
presented, where it is possible to see and draw conclusions about the results. There is also a
summarized presentation of the result from the method development.
4.1 METHOD DEVELOPMENT EVALUATION
The method developed was supposed to take 60 µm for each polishing step. To evaluate the
precision in the polishing, data for the planned amount of material taken away has been plotted
against the data for the amount of material that actually was polished off for each step. For
comparison, the line for the planned amount of material taken away has been set to show each
layer in 30 µm step with error bars set to +/- 15 µm, in order to see if the actual amount of
material taken is outside the layer limits, this can be seen in figure 4.1 for Grade A and Figure
4.2 for Grade B.
Figure 4.1 A chart presenting the planned amount of material taken away for each step and the
actual amount of taken material for each step for Grade A. The error bars are set 15 µm from the
middle point. During the blue part of the curve polishing method 5 was used, during the red part
polishing method 6 is used.
8,7
8,8
8,9
9
9,1
9,2
1 2 3 4 5 6 7 8 9 10 11 12 13 14 15 16 17
Sam
ple
hei
ght
[mm
]
Layers
Amount of polished material - Grade A
Planned
Actual

14
Figure 4.2 A chart presenting the planned amount of material taken away for each step and the
actual amount of taken material for each step for Grade B. The error bars are set 15 µm from the
middle point. During the blue part of the curve polishing method 5 was used, during the red part
polishing method 6 is used.
The height difference of the sample is important to ensure that the comparison of the two
methods are at the same layers. Data from the maximum and minimum values for each layer
is therefore presented in Figure 4.3 for Grade A and Figure 4.4 for Grade B. The grey line
represents the acceptable limits, i.e. the maximum and minimum values for each 30 µm layer.
The red lines represent the actual maximum and minimum values for each layer. The bright
red colour marks where the line passes the acceptable limit.
In Table 4.1 and Table 4.2 for Grade A and Grade B respectively, the height difference is
presented in µm for the maximum and minimum values. A limit is set to 30 µm difference since
that is the depth of 1 layer, values outside that limit is marked red.
8,7
8,8
8,9
9,0
9,1
9,2
1 2 3 4 5 6 7 8 9 10 11 12 13 14 15 16 17
Sam
ple
hei
ght
[mm
]
Layers
Amount of polished material - Grade B
Planned
Actual

15
Figure 4.3 The height difference of Grade A. The grey line represents the planned max/min relation,
whereas the red line represents the actual max/min relation for each layer. The clear red is where the
values are outside the acceptable limits.
Table 4.1 Difference in µm between max and min values for each layer for Grade A. The values outside
the limit of 30 µm is marked red.
Grade A
Layer 1 3 5 8 10 12 14 16
Difference [µm]
Max/min
14 11 17 9 34 28 43 55
Figure 4.4 The height difference of Grade B. The grey line represents the planned max/min relation,
whereas the red line represents the actual max/min relation for each layer. The clear red is where the
values is outside the acceptable limits.
8,7
8,8
8,9
9
9,1
9,2
1 3 5 7 9 11 13 15
Hig
ht
[mm
]
Layers
Height difference - Grade A
Planned
Actual max
Actual min
8,650
8,750
8,850
8,950
9,050
9,150
2 4 6 8 10 12 14 16
Hig
ht
[mm
]
Layers
Height difference - Grade B
Planned
Actual max
Actual min

16
Table 4.2 Difference in µm between max and min values for each layer for Grade B. The values outside
the limit of 30 µm is marked red.
Grade B
Layer 2 4 7 9 11 13 15 17
Difference [µm]
Max/min
36 31 38 79 93 106 83 102
4.2 RESULTS GRADE A
Presentation of the Scanning Acoustic Microscope (SAM) results that can be found in Figure
4.5-4.7, the LOM results that can be found in Figure 4.8-4.10 and a comparison of the two
methods that can be found in Figure 4.11-4.19 and Table 4.3-4.5 for Grade A.
Ultrasonic SAM results
In the ultrasonic picture retrieved from the SAM scan the pixel density is 15 µm/pixel. Meaning
that the smallest point seen is 15 µm. Considering the inclusion size from the LOM
measurements the width are rarely over 10 µm, which is more correct than the rough
measurement from the ultrasonic testing where the smallest indication that can be shown is 15
µm. Therefore to not confuse the two measurements, the ultrasonic measurement unit will be
changed from µm to UIS, Ultrasonic Indication Size, a unit that correlates to µm but is not an
indication of the true size of the inclusion.
Figure 4.5 SAM picture as it was received from TePla, showing the whole volume with the depth of
510 µm of Grade A. The image is 90 x 45 mm.

17
Figure 4.6 SAM picture scanned in the Clemex software showing the 500 largest inclusions according
to ECD over the whole volume investigated, 510 µm. The different sizes of the indications are related
to the ultrasonic reading of the inclusion size.
Figure 4.7 Layer distribution from all inclusions found in all layers, 510 µm split into 17 layers of 30
µm each, a total of 2307 indications were found for Grade A.
-45000
-40000
-35000
-30000
-25000
-20000
-15000
-10000
-5000
0
0 10000 20000 30000 40000 50000 60000 70000 80000 90000
y
x
Ultrasonic scan - Grade A
Ultrasonic
0
100
200
300
400
500
1 2 3 4 5 6 7 8 9 10 11 12 13 14 15 16
Quan
tity
Layers
Layer distribution of all inclusions - Grade A
Ultrasonic

18
LOM
A Clemex software was used for the image recognition scanning with a magnification of x100
and pixel density of 0.55 µm/pixel.
Figure 4.8 Scanned sample area from the Clemex software showing the 500 largest inclusions
according to ECD over the whole volume investigated, total of 8 layers. The different sizes of the
indications correlates to the inclusion size.
Figure 4.9 An overview presenting an example of what the Clemex system finds when it comes to the
size and type distribution over one layer. This layer has the same inclusions distribution as when
compared to the entire sample.
-45000
-40000
-35000
-30000
-25000
-20000
-15000
-10000
-5000
0
0 10000 20000 30000 40000 50000 60000 70000 80000 90000
y
x
LOM - Grade A
LOM
Inclusion distribution over 1 layer - Grade A Type A Type B Type D

19
Figure 4.10 Distribution over type A, type B and type D for the entire sample of Grade A.
Ultrasonic vs. LOM
Figure 4.11 An overlapping image over the 500 largest indications from the whole volume
investigated according to ECD from both the ultrasonic scan and the LOM image recognition.
46%
15%
38%
0%
10%
20%
30%
40%
50%
Type distribution - Grade A
Type A Type B Type D
-45000
-40000
-35000
-30000
-25000
-20000
-15000
-10000
-5000
0
0 10000 20000 30000 40000 50000 60000 70000 80000 90000
y
x
Comparison over all layers, 500 largest ECD - Grade A
Ultrasonic
LOM

20
To be able to show statistics over the matching indications a match-criteria was decided.
1. The indications from the ultrasonic and LOM should be in a radius of 600 µm from
each other i.e. if the indication has the slightest connection in the image they are
considered a match. This to allow for the images to not be perfectly in line with each
other and for the possibility that the sound in the ultrasonic has a slight dispersion in
the material.
2. The indications are not more than 2 layers apart, maximum 90 µm. This to allow for
interference between the layers and to allow for a height difference in the samples after
polishing.
Table 4.3 Statistics over inclusion distribution, matching indications and actual matching indications
on the same layers.
Inclusion
type
Inclusion
distribution
out of 500
% Matches,
criteria 1
% Matches,
criteria 1 & 2
%
Type A 213 42,6 % 31 38,3 % 20 39,2 %
Type B 283 56,6 % 48 59,3 % 30 58,8 %
Type D 4 0,8 % 2 2,4 % 1 2 %
Total 500 81 51
From the 500 investigated indications by each method, 81 indications remained after applying
match-criteria 1, which is 16,2 % from the total amount. After applying both match-criteria 1
and 2 only 10,2 % matching indications where left.

21
Table 4.4 Information of 5 large matching inclusions from the image recognition in the LOM, the
ultrasonic and the difference between the two for Grade A. The X and Y values presented are the
coordinates of the indication were the upper left corner is considered as zero. The size is evaluated in
ECD, equivalent circle diameter, with µm as the unit for the LOM and Ultrasonic Indication Size, UIS,
for the ultrasonic.
Inclusion
type
Layer X
[µm]
Y
[µm]
ECD Length Width
Light optical microscope [µm] [µm] [µm]
Type B 16 37800 -11600 43,61 350,55 6,82
Type B 12 50000 -15400 41,01 275,82 5,85
Type A 5 35000 -3800 37,77 88,05 12,74
Type B 8 28700 -21200 34,11 200 7,65
Type D 3 51200 -27900 25,47 34,48 22,18
Ultrasonic [UIS] [UIS] [UIS]
16 38000 -11700 113,48 123,75 105
10 49700 -15100 87,9 105 75
5 35100 -3900 44,76 61,88 30
10 28700 -21100 89,51 108,75 88,13
5 51300 -28100 105,64 120 90
Difference
0 +200 -100 *2,6 *0,35 *15,4
-2 -300 -300 *2,14 *0,38 *12,82
0 +100 -100 *1,19 *0,7 *2,35
+2 0 +100 *2,62 *0,54 *11,52
+2 +100 -200 *4,15 *3,48 *4,06

22
Figure 4.12 Layer distribution of the 500 largest inclusions according to ECD for both ultrasonic and
LOM for Grade A.
Figure 4.13 An overlapping of the 81 matching inclusions from both ultrasonic and LOM.
Figure 4.14 Inclusion distribution according to ECD size in UIS of the 500 largest inclusions from
the SAM scan.
0
50
100
150
200
250
0 1 2 3 4 5 6 7 8 9 10 11 12 13 14 15 16
Quan
tity
Layers
Layer distribution out of 500 largest indications ECD - Grade A
Ultrasonic
LOM
0
2
4
6
8
10
12
14
16
0 5 10 15 20 25 30 35 40 45 50 55 60 65 70 75 80
Lay
er
Inclusions number
Layer distribution on inclusions matches - Grade AUltrasonic
LOM
0
20
40
60
80
100
120
140
160
180
20 30 40 50 60 70 80 90 100 150 200 More
Fre
quen
cy
ECD distribution [UIS]
Inclusion distribution - Grade A, ultrasonic

23
Figure 4.15 Inclusion distribution according to ECD size in µm of the 500 largest inclusions from
the LOM.
Figure 4.16 Inclusion distribution according to ECD size in UIS of the matching inclusions from the
SAM scan.
Figure 4.17 Inclusion distribution according to ECD size in µm of the matching inclusions from the
LOM.
0
50
100
150
200
250
300
350
20 25 30 35 40 45 50 60 More
Fre
quen
cy
ECD distribution [um]
Inclusion distribution - Grade A, LOM
0
5
10
15
20
25
30
20 30 40 50 60 70 80 90 100 150 200 More
Fre
quen
cy
ECD distribution [UIS]
Matching inclusions - Grade A, ultrasonic
0
10
20
30
40
50
60
20 25 30 35 40 45 50 60 More
Fre
quen
cy
ECD distribution [um]
Matching inclusions - Grade A, LOM

24
Figure 4.18 Inclusion distribution measured for length and width. LOM in µm and ultrasonic in
UIS.
0
50
100
150
Fre
quen
cy
Length distribution [um]
500 inclusions - Grade A, LOM
0
20
40
60
80
100
2 4 6 8
10
12
14
16
18
20
22
Mo
re
Fre
quen
cy
Width distribution [um]
500 inclusions - Grade A, LOM
0
50
100
150
200
250
300
Fre
quen
cy
Length distribution [UIS]
500 inclusions - Grade A, ultrasonic
0
50
100
150
200
Fre
quen
cy
Width distribution [UIS]
500 inclusions - Grade A, ultrasonic

25
Non-matching indications
There were 3 large indications from the LOM scan that did not have any matches in the SAM
scans. These three points where investigated further to bring clarity to why.
Figure 4.19 The three light blue indications represents large inclusions from LOM that do not have
any matching indications from the ultrasonic.
Table 4.5 Information about 3 large indications that do not have any matches in the ultrasonic scan.
Inclusion
type
Layer X Y ECD
[µm]
Length
[µm]
Width
[µm]
Type B 14 11100 -3600 58,4 815,66 3,36
Type B 14 9900 -31300 50,44 431,87 6,05
Type B 12 44500 -30200 46,87 468,13 4,78
-45000
-40000
-35000
-30000
-25000
-20000
-15000
-10000
-5000
0
0 10000 20000 30000 40000 50000 60000 70000 80000 90000
y
x
LOM - Grade A

26
4.3 RESULTS GRADE B
Presentation of the SAM results that can be found in Figure 4.20-4.22, the LOM results that
can be found in Figure 4.23-4.25 and a comparison of the two methods that can be found in
Figure 4.26-4.33 and Table 4.6-4.7 for Grade B. Statistics, layer distribution and histogram can
be found. The same criteria and settings as for Grade A was used throughout.
Ultrasonic SAM results
Figure 4.20 SAM picture as it was received from TePla, showing the whole volume with the depth of
510 µm of Grade B. The image is 90 x 45 mm.
Figure 4.21 SAM picture scanned in the Clemex software showing the 500 largest inclusions
according to ECD over the whole volume investigated, 510 µm in total split into 17 layers of 30 µm
each. The different sizes of the indications are related to the ultrasonic reading of the inclusion size.
-45000
-40000
-35000
-30000
-25000
-20000
-15000
-10000
-5000
0
0 10000 20000 30000 40000 50000 60000 70000 80000 90000
y
x
Ultrasonic - Grade B
Ultrasonic

27
Figure 4.22 Layer distribution from all inclusions found in layers, a total of 14049 indication were
found.
LOM
Figure 4.23 Scanned sample area from the Clemex software showing the 500 largest inclusions
according to ECD over the whole volume investigated. The different sizes of the indications correlates
to the inclusions size.
0
500
1000
1500
2000
2500
2 3 4 5 6 7 8 9 10 11 12 13 14 15 16 17
Quan
tity
Layers
Layer distribution of all inclusions - Grade B
Ultrasonic
-45000
-40000
-35000
-30000
-25000
-20000
-15000
-10000
-5000
0
0 10000 20000 30000 40000 50000 60000 70000 80000 90000
y
x
LOM - Grade B
LOM

28
Figure 4.24 An overview presenting an example of what the Clemex system finds when it comes to
the size and type distribution over one layer. This layer has the same inclusions distribution as when
compared to the entire sample.
Figure 4.25 Distribution over type A, type B and type D for Grade B for the entire sample of Grade
B.
Inclusions distribution over 1 layer - Grade B Type A Type B Type D
88%
9%4%
0%
10%
20%
30%
40%
50%
60%
70%
80%
90%
100%
Type distribution - Grade B
Type A Type B Type D

29
Ultrasonic vs. LOM
Figure 4.26 An overlapping image over the 500 largest indications from the whole volume
investigated according to ECD from both the ultrasonic scan and the LOM image recognition.
Table 4.6 Statistics over inclusions distribution, matching indications and actual matching
indications on the same layers.
Inclusion
type
Inclusion
distribution
out of 500
% Matches,
criteria 1
% Matches,
criteria 1 & 2
%
Type A 316 63,2 % 51 56,0 % 32 61,5 %
Type B 184 36,8 % 40 44,0 % 20 38,5 %
Type D 0 0 % 0 0 % 0 0 %
Total 500 91 52
From the 500 investigated indications by each method, 81 indications remained after applying
match-criteria 1, which is 18,2 % from the total amount. After applying both match-criteria 1
and 2 only 10,4 % matching indications where left.
-45000
-40000
-35000
-30000
-25000
-20000
-15000
-10000
-5000
0
0 10000 20000 30000 40000 50000 60000 70000 80000 90000
y
x
Comparison over all layers, 500 largest ECD - Grade B
Ultrasonic
LOM

30
Table 4.7 Information of 5 large matching inclusions from the image recognition in the LOM, the
ultrasonic and the difference between the two for Grade B. The X and Y values presented are the
coordinates of the indication were the upper left corner is considered as zero. The size is evaluated in
ECD, equivalent circle diameter. For LOM the unit is µm and for the ultrasonic result it is Ultrasonic
Indication Size, UIS, which correlates to µm but is not the true inclusions size
Inclusion
type
Layer X
[µm]
Y
[µm]
ECD Length Width
Light optical microscope [µm] [µm] [µm]
Type B 9 65600 -10200 72,86 670,60 6,22
Type A 7 26400 -38700 62,22 191,21 16,14
Type A 7 16200 -42000 62,66 268,13 11,51
Type A 9 31600 -11200 58,6 390,66 6,91
Type A 7 21100 -28000 57,37 301,79 8,57
Ultrasonic [UIS] [UIS] [UIS]
7 63600 -10400 198,00 405 105
7 26500 -39000 273,43 690 165
9 16500 -41900 179,83 375 105
9 31300 -11000 173,34 360 95,63
9 21200 -28300 191,39 391,88 133,13
Difference
-2 -200 -200 *2,72 *0,60 *32,61
0 +100 -300 *4,36 *3,61 *10,22
-2 +300 +100 *2,87 *1,31 *9,12
0 -300 +200 *2,91 *0,92 *13,84
-2 +100 -300 *3,34 *1,30 *15,21
31
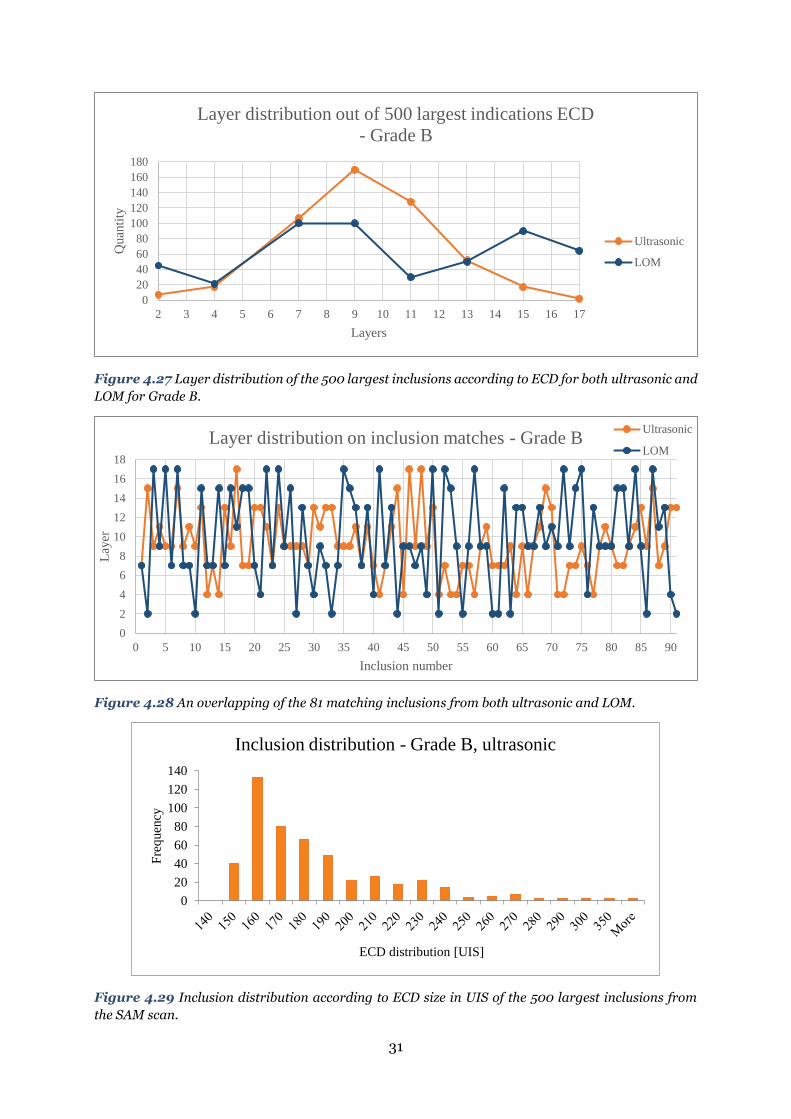
Figure 4.27 Layer distribution of the 500 largest inclusions according to ECD for both ultrasonic and
LOM for Grade B.
Figure 4.28 An overlapping of the 81 matching inclusions from both ultrasonic and LOM.
Figure 4.29 Inclusion distribution according to ECD size in UIS of the 500 largest inclusions from
the SAM scan.
0
20
40
60
80
100
120
140
160
180
2 3 4 5 6 7 8 9 10 11 12 13 14 15 16 17
Quan
tity
Layers
Layer distribution out of 500 largest indications ECD
- Grade B
Ultrasonic
LOM
0
2
4
6
8
10
12
14
16
18
0 5 10 15 20 25 30 35 40 45 50 55 60 65 70 75 80 85 90
Lay
er
Inclusion number
Layer distribution on inclusion matches - Grade BUltrasonic
LOM
0
20
40
60
80
100
120
140
Fre
quen
cy
ECD distribution [UIS]
Inclusion distribution - Grade B, ultrasonic

32
Figure 4.30 Inclusion distribution according to ECD size in µm of the 500 largest inclusions from the
LOM.
Figure 4.31 Inclusion distribution according to ECD size in UIS of the matching inclusions from the
SAM scan.
Figure 4.32 Inclusion distribution according to ECD size in µm of the matching inclusions from the
LOM.
0
50
100
150
200
250
35 40 45 50 55 60 65 70 75 More
Fre
quen
cy
ECD distribution [um]
Inclusions distribution - Grade B, LOM
0
5
10
15
20
25
30
140 150 160 170 180 190 200 250 300 350 More
Fre
quen
cy
ECD [UIS]
Matching inclusions - Grade B, ultrasonic
0
10
20
30
40
50
60
30 40 50 60 70 80 More
Fre
quen
cy
ECD [um]
Matching inclusions - Grade B, LOM

33
Figure 4.33 Inclusion distribution measured for length and width. LOM in µm and ultrasonic in UIS.
0
50
100
150
Fre
quen
cy
Length distribution [um]
500 inclusions - Grade B, LOM
0
20
40
60
80
100
120
Fre
quen
cy
Width distribution [um]
500 inclusions - Grade B, LOM
0
20
40
60
80
100
120
Fre
quen
cy
Length distribution [UIS]
500 inclusions - Grade B, ultrasonic
020406080
100120
Fre
quen
cy
Width distribution [UIS]
500 inclusions - Grade B, ultrasonic

34
5 DISCUSSION
5.1 METHOD DEVELOPMENT EVALUATION
The polishing method was built from a template, giving a good polishing result received from
Struers, since the machine was completely new and no one at Ovako Group R&D had
experience using it. The testing method development can be seen in table 3.3. The method was
built by starting at a polishing step close to the finished result and trying to polish off 60 µm.
This was done by using the settings given from Struers: pressure, amount of suspension and
co-rotation, only the time was changed from time to amount of removed material which was
set to 60 µm. If this was not achieved or the result was bad, this polishing step was set to the
template values given by Struers for the time and a new step with a coarser polishing was added
and set the same way. The procedure was repeated until a satisfactory result was reached. After
the entire study has been performed and more knowledge has been retrieved, a better option
would have been to increase the pressure and to use counter-rotation instead, enabling to stay
closer to the last polishing plate, and so avoid unnecessary errors.
During the LOM investigation there was a step where the indication was evaluated by hand to
conclude if there were inclusions or just dirt on the surface. In the beginning of the testing this
was done by looking at each and every indication to identify the character. When there were
uncertainties, the sample was placed in the SEM. Repeating this procedure it became easier to
see directly if the indication was an inclusion or not. This lead to a system were only the length-
width ratio needed to be looked at to know if the inclusion needed to be evaluated or not. This
system came from a conclusion drawn by the fact the all the true inclusions were long and very
thin, while the dirt was always long and quite thick. This resulted in that only the indications
that were long and thick were examined, and these were always just dirt. However this may
lead to missing dirt if the measurements are like the inclusions. This risk was taken since the
system shortened the evaluation time from around 1 hour to about 10 minutes.
In Figure 4.1 and Figure 4.2 the amount of material polished off for each step can be seen. Here
it is clear that the amount of material polished off for each step is not 60 µm each time. There
is a large variation even though there were attempts to remove more or less material depending
on how much that had been removed previously. There is however a large jump outside the
limit of 15 µm at layer 7 for Grade A and layer 6 for Grade B. There was need for a change in
both 9 µm polishing plates since they started to be worn, which resulted in that too much
material was removed. Therefore, a small change had to be made in the process where the time
of polishing on these steps where shortened. When this change was made another problem was
also dealt with. A slight relief phenomenon could be seen on the samples, something that also
can be called “orange peel effect”. This phenomenon made it hard to wash the sample properly
since water and alcohol had a tendency to get trapped around the inclusions were there was a
slight cavity in the surface. The inclusions were then contaminated making it hard to get a good
size reading. This was dealt with by changing the current 3 µm polishing plate, Plus, which was
very soft, to a harder polishing plate, Dac. It was the softness and the small hairs on the soft
plate that pulled out material around the inclusions. With a harder plate the problem vanished
completely. At the same time the last 1 µm polishing step was shortened since it brought back
the relief problem. With a shorter time there were some relief, but not extensive enough to
affect the result. Both methods can be found in table 3.3, where test 5 was first used and the
change was to test 6. To avoid this problem, the change of plates should be done before the
start of the polishing instead of in the middle of the testing.

35
Looking at Figure 4.3 and Figure 4.4 and Table 4.1 and Table 4.2 the height difference of the
sample can be seen. A perfect sample would have had the same height over the entire sample,
this was however not achieved. Both samples were at times outside the range of what was
considered to be approved. Grade B however showed more problems than Grade A, this could
not be traced back to anything specific. The problem was probably caused by the tape used to
mount the sample to the mounting plate. The tape was flexible causing the samples to tilt
during the polishing. For continued use of this method this problem needs to be dealt with.
5.2 ULTRASONIC
From the investigation performed by the company, Pva TePla, a focus zone of 510 µm was
estimated and divided in 17 layers of 30 µm each. Looking at Figure 4.7 and Figure 4.22, where
the total amount of inclusions for each layer is displayed, the 17 layers follow a distinct curve.
Both Grade A and Grade B reach a maximum amount of inclusions of layer 8 and 9. From the
LOM results an even amount of inclusions on all layer can be seen. This indicates that the focus
zone is smaller than assumed in this study, in fact only one layer is in complete focus for the
entire scanning. If a range of more than 30 µm is to be investigated, two layers in each direction
might be suitable, giving a total investigation depth of 150 µm, a smaller amount than 510 µm.
Another possibility is to make a deeper dive into the settings of the SAM equipment.
When looking at the curve for the 500 largest inclusions in Figure 4.12 and Figure 4.27 the
same behaviour can be seen. This suggests that the inclusions also look larger when the focus
is where it is supposed to be. Otherwise the curve should have been flatter when only the 500
largest indications were picked out. The LOM distribution however follows a more random
distribution curve, something that seems more reasonable when the focus is the same on each
layer. The random distribution seen from the LOM result could be a consequence of the
washing of the samples or some other part of the polishing method.
5.3 LOM
Looking at the two differnt steel grades in Figure 4.9 and Figure 4.24, which is a plot for one
layer from each grade and shows the same inclusion type distribution as the compiled results
presented as a bar diagram from all layers seen in Figure 4.10 and Figure 4.25. The two steel
grades clearly represents different steels when it comes to type distribution, which was desired
to invesitgate the possibility for the ultrasonic SAM equipment to find all types of inclusions.
An interesting observation done was that the type distribution differs when it comes to the 500
largest inclusions portrated in Table 4.3 and Table 4.5. Here it can clearly be seen that the
larger inclusions are Type A and Type B, which was expected. It is aslo possible to deduce that
for Grade A the type B inclusions are the largest and for Grade B the type A and type B
inclusions are around the same length. This is an interpretation made by the fact that in the
whole sample of Grade A it is 46 % of type A and only 15 % of type B, while looking at the 500
largest inclusions there are more type B inclusions than type A inclusions. In Grade B the same
thing can be seen even if it is not as destinctive, which may indicate that type A and type B are
around the same size.

36
5.4 ULTRASONIC VS. LOM
One of the goals for this project was to compare the LOM results with the ultrasonic result to
be able to see if the same inclusions could be found by both methods, ensuring that the quality
of both methods was close to each other. Both methods have pros and cons which can be seen
in Table 5.1, but the ultrasonic method is unbeatable when comparing the time it takes for one
investigation. One entire ultrasonic scan of one sample took approximately 30 minutes, with
approximately 20 minutes work that needed to be done in advance. This compared to the 16
hours the LOM investigation took for the same sample. Further, to get to the upper limit of
that volume, flat grinding another 4 hours needs to be added to that sample, adding up to 20
hours.
When studying the comparison of LOM and ultrasonic for Grade A and Grade B in Figure 4.11
and Figure 4.26 respectively, a distinct pattern can be seen. In Grade A most of the inclusions
are present in the centre of the sample, for both LOM and the ultrasonic. While for Grade B
most of the inclusions are at the half radius section, laying in two strings for both methods.
This is an indication that both methods show the same indication pattern.
To get a good match, the ultrasonic picture was cut since the scanning area was bigger than the
sample area. Both results were then matched by looking at inclusions clusters close to each
other and moving the ultrasonic results to fit. This is not an ideal way to fit both images against
each other, but it is important that both results are showing the indications at the same place
if they are the same. It would have been more ideal to have some sort of marking that was
visible in both results that could act as a guide when overlapping the results. This made it hard
to evaluate the matches by a perfect overlap. Therefore, a radius of 600 µm was allowed to
count as a match.
Match-percentage
In Table 4.3 and Table 4.6 some statistics over the matching indications can be seen. This
shows a matching inclusion result of around 10 % for both steel grades. It is debatable to call
this a good or bad result. 10 % is not a large amount of matching inclusions, however as a
reminder, one method evaluates a volume while the other evaluates an area, where the volume
investigated in the ultrasonic is 63 times larger than the area investigated in the LOM. As
discussed above this volume might be an over estimation of what the ultrasonic can handle
since the indication quantity varies over the layers. But the volume is still almost 19 times larger
if only 5 layers are taken into account for the ultrasonic. Considering this a 10 % match might
be considered good enough. What would be expected however is that all the largest inclusions
found in the LOM should have been found in the ultrasonic too. This will be discussed more
later on. The 10 % of matches, out of 500 inclusions to start with, might also be explained by
the amount of layers investigated. Looking at Figure 4.12 and Figure 4.27 it can be seen that
the amount of inclusions found by the LOM out of the 500 largest inclusions are randomly
distributed between the layers while the ultrasonic distribution follows a distinct pattern which
peaks around layer 8 or 9. If comparing the amount of indication points on each layer it might
not be strange to find very few matches on the first and last layers, since there are very few
indications from the ultrasonic scans on these layers. If considering Figure 4.13 and Figure
4.28, where all indication matches after using criteria 1 is plotted, it can be seen that if also
criteria 2 is applied most of the true matches are on the layers in the middle around layer 6 to
layer 10 for Grade A and layer 7 to layer 11 for Grade B. There are only a few matches outside
this range. What could be investigated further is if only the five layers in the middle were
37
investigated and more indication points for those layers were compared. This might increase
the match-percentage.
What is possible to conclude from Table 4.3 and Table 4.6 is that the ultrasonic has the
possibility to find all types of inclusions. This conclusion is draw from the fact that the type
distribution percentage is similar going from 500 inclusions to matching inclusions.
There was hope to find an enlargement variable by comparing the ultrasonic results to the LOM
results. For this type of comparison, the result of 10 % match is not sufficient enough. A distinct
pattern cannot be found in how much larger the inclusions seems to be in the ultrasonic. Only
five large inclusions are presented in Table 4.4 and Table 4.7, however the same pattern is seen
when looking at all matching inclusions, the distribution between the enlargements is too big.
However looking closer at the Type D inclusion from Table 4.4 it might be possible predict
something about the enlargement. Here it is possible to see that the length-width ratio is
approximately 35 – 22 µm in the LOM result, and 120 – 90 UIS in the ultrasonic result.
Knowing that the ultrasonic reports the result in 15 µm/pixel, it is possible to translate the
LOM result to three and two pixels respectively which is 45 – 30 UIS. This is far from the
ultrasonic result. However the ultrasonic is set by a signal-noise ratio and the transducer sound
beam is approximately 50 µm in diameter, this means that when enough sound is reflected
back, the ultrasonic will detect the inclusion. When a small inclusion is detected it will be at
the edge of the transducer beam. The indicated coordinate will be saved and thereafter the
transducer keeps moving over the inclusion. The transducer keeps on indicating the
coordinates until the signal-noise ratio is too small and the inclusion is reported to end. This
means that the transducer detects the inclusion when it passes the edge on one side and stop
seeing it when it passes the edge on the other side, even if the inclusion never covers the whole
transducer width of 50 µm. This means that approximately 50 µm is added to the inclusion
length and width. Adding this to the 45 – 30 UIS ratio gives us 95 - 80 UIS. This is still smaller
values than the ultrasonic scans reports. This scenario however is when the indication is
marked on three respectively two pixels, it might be that the indication is reported to be four
and three pixels respectively. This will, following the same arguments, give a result of 110 – 95
UIS, which falls close to the values reported.
This shows that it might not only be the 10 % of matches making it impossible to detect a true
pattern, it might also be that these steel grades are not appropriate to use to investigate this
since they both have small amount of large Type D inclusions. In both grades there is a high
amount of type A and type B inclusions which are very long and very thin, something that the
ultrasonic might have problems to detect and measure. To investigate the enlargement, type D
inclusion are more ideal since the length and width of the particles are almost the same,
meaning the calculated area of the inclusions is almost the same as the reflection area in the
ultrasonic. Something that is not the same when it comes to stringers.
Histogram overview
What can be seen when looking at the largest inclusions are that they are all only 300 µm from
each other in the LOM and the ultrasonic, knowing this 300 µm would perhaps have been a
better criteria to pick out the matching inclusions. This criteria would have made the matches
more correct from the beginning, less matches would have been found but they would probably
also have been on the correct layer from the beginning. In Figure 4.13 and Figure 4.28 there
are graphs showing the layer all matching inclusions first considered are presented. The
amount of false matches are approximately the same in both steel grades, which is probably an
effect of the matching criteria.

38
Considering the graphs shown in Figure 4.14-4.17 and Figure 4.29-4.32 for Grade A and Grade
B respectively, the same pattern can be seen for the ECD distribution for both the 500 largest
inclusions and for the matching inclusions. The curve is mostly just moved to show larger
indications for the ultrasonic than for the LOM. This is a clear indication that the ultrasonic
enlarges the indications.
However, if the same graphs are evaluated for the length and width, as seen in Figure 4.18 and
Figure 4.33, an interesting feature can be detected for both steel grades. While the width is
around 6 times bigger in the ultrasonic, the length is only half of the length found in LOM. The
behaviour of the length might be an effect of how thin the inclusions are at the top and bottom
of a long inclusion. Making it impossible for the ultrasonic to detect it at its edges. The
behaviour for the width comes from the fact that the images show 15 µm/pixel. Which means
that even if the mean width of an inclusion is 4-5 µm, the smallest width the ultrasonic can
indicate is 15 µm. The reason that many inclusions seems to be 30 µm wide might be that the
inclusion is on the border of two pixels, which makes the indication on both pixels.
Non-matching indications
The peculiarity of the three large inclusions found in the LOM that is not found in the ultrasonic
can be explained by looking at Table 4.5. The table shows the length and the width of the
inclusions, were it can be seen that they are very long but also very thin type B inclusions, also
referred to as stringers, since they are often fragments laying in a long line. This means that
the area calculated in the LOM is much larger than the actual area of each little fragment, which
is the reflective area that can be detected in the ultrasonic. Probably the reflection is too small
to be detected by the transducer in the SAM scan.
Figure 5.1 The frame to the left shows approximately what the Clemex software sees and calculates
as the area of the indication. The frame to the right approximately shows what the ultrasonic can
detect at the same time, showing a smaller indication pattern in that area, i.e. the reflection area. The
magnification in both images are 500x.

39
Table 5.1 The Table lists the pros and cons for each method.
Ultrasonic
Pro Con
Fast Cannot see actual inclusions size
Volume – large amount Hard to see the actual depth since inclusions
can cover each other
Impossible to know precisely what it is you
see
Cannot differ the different types from each
other.
5.5 SOURCES OF ERROR
Comparison
Both images needed to be corrected to show the entire sample, neither less nor more. For small
inclusions this causes large problems. The LOM images were first compensated for by using
the hardness impressions set 5 mm from the edge, these were set as precise as possible.
Thereafter the ultrasonic scans were cut by using the sample edge that could be seen in the
image when the contrast was increased. There were some problems doing this since the sample
had a slight rounding to the edge of around 100-200 µm. The ultrasonic results then needed
to be fine-tuned to match the LOM image. This was done by finding inclusion clusters of certain
patterns from the LOM results and thereafter see if the same pattern could be seen in the
ultrasonic scans. This is the reason why a radius of 600 µm was set as an outer limit to still call
two indications a match. For further investigations, there should be clearer markings to easier
match both results.
Ultrasonic investigation
The ultrasonic SAM investigation was done by a third part, the company Pva TePla. This makes
it hard to control all the variables and parameters that can go wrong during an investigation.
During the scanning of a sample, it is very important that the sample is in line with the
transducer, since it is hard to compensate for a crooked image in a correct way afterwards,
especially since a 100 µm is a long distance in this case. It is also important to keep in mind
LOM
Pro Con
Good measurement of inclusions Time consuming
Possible to sort inclusions according to type Can be hard to get good polishing and
washing
Easier to evaluate if you see the true
structure
Area – can never see a volume, many scans
to see the same amount
40
that the transducer should be set as close as possible to the edge of the sample for the same
reasons, even if it is easier to compensate for that afterwards.
One of the steel grades were set straight to the transducer and near the sample edge, this result
only needed a small correction to be even closer to the sample edge. The other sample was both
slightly crooked compared to the transducer and far from the edge. This was harder to
compensate for since the only thing to go on was the sample edge.
One of the largest problems when it came to the ultrasonic scanning is that the same inclusion
could be seen over several x-scan layers. It should be possible to see the same inclusion on two
layers, since the inclusion can be on both sides of the layer border. But, looking at the results
for the largest inclusions from LOM, none is larger than one x-scan layer of 30 µm. So it should
be impossible to see the same inclusion over 3 or 4 layers, this was probably caused by the
threshold setting for signal-noise ratio. Most often the possible right layer could be found by
finding the layer where the indication was largest. This was one of the reasons that the LOM
and ultrasonic results were compared for all layers at once. This was taken into account when
matching inclusions and a match-criteria of two layers in both direction was considered to be
a match.
LOM investigation
Figure 5.2 An overview of what we strive for to get as high accuracy of our testing as possible, made
according to LEAN [18].
Figure 5.2 represents what was important for the LOM investigation, to get both the true
structure of the sample, avoiding dirt and contaminated inclusions, and also to get a high
reproducibility of the true structure since several layers were scanned. There was also a need
to get a high reproducibility of the 60 µm that was supposed to be polished off each time. Figure
5.3 goes through the different steps and indicates what can go wrong for each step.

41
Figure 5.3 A short description of the errors that can occur during each step of the process, done
according to a LEAN structure.
Mounting of sample: It is important for the height difference in the sample that it is
mounted correctly. The sample weight needs to be in the centre of the mounting plate. If not
mounted in the centre, the pressure and rotational speed will be uneven over the sample
causing it to take more material where the speed and pressure is higher than on the rest of the
material. To avoid this problem as much as possible a matrix was constructed, and markings
placed out. The tape with which the samples was mounted to the mounting plate with had some
flexibility. This made it hard to know exactly how much material that was taken each time.
Quality of polishing paper: Worn polishing paper takes away less material than new
polishing paper. But new paper also has to be worn in before the result gets even. This was not
known before the change of paper and therefore the results got uneven. There is unfortunately
not a set number of runs for each disc on how long time it takes to wear them in, since it
depends on many factors as, pressure, sample size, sample hardness and time [19].
Washing of samples: Correctly washed samples will help to show the true structure. If there
are residues from the suspension, like diamonds stuck to the surface, the software in the LOM
will believe that they are inclusions. This is most often detected by the visual inspection of the
100 largest inclusions but can be misleading. There is also a risk of having residues from the
actual washing left on the sample, for example water or ethanol. These types of residues are
often around the inclusions, causing them to look larger than they actually are.
Impression placement: Since the ultrasonic scans and the LOM images needed to be
compared there where impressions made to be able to later compare the result against each
other. This was done since the image recognition program in LOM not could be run over the
whole sample, but had to be around 2 mm from the edge to avoid getting interfered by the edge
and by dirt that is hard to avoid close to the edge. The measuring point was as exactly as
possible set 5 mm from the edge, but it is always an interpretation and therefore some
mismatch in exact location of the inclusions was allowed.
Polishing 60µm
•Mounting of sample
•Quality of polishing paper
•Washing of samples
Hardness markings
•Impression placement
Scanning
•Software settings
Evaluation
•Visual inspection
Height measurments
•Placement of measuring points

42
Software settings: This work did not take the software settings into consideration. No effort
was put into understanding how the software calculated the area of each inclusion since it was
known that it, at least, will calculate it the same way every time.
Visual inspection: It is important to know the expected result to know that what is seen is
the true structure. To avoid letting false inclusions be a part of the result the SEM was used in
some cases when it was hard to evaluate in the LOM.
Placement of measuring points: When measuring the height of the samples after each try
5 measuring points where used. Each point was then evaluated against the same point before
the polishing, Trying to minimize the risk of getting measurements that where not comparable.
Since the measuring method scratched the surface this had to be done last, even thought it
would be better to do it before completing the investigation, since it was impossible to correct
the height.

43
6 CONCLUSIONS
The purpose of this work was to develop a method to polish and evaluate large areas in LOM
to capture the true distribution, together with an evaluation of high frequency ultrasonic
scanning to get a quantitative idea of what can be captured by the ultrasonic investigation. In
this study it was found that:
❖ A LOM method to evaluate large areas was developed for measurement of true
inclusion distribution in 3D, although more work has to be done to fine-tune grinding
and polishing of large samples.
❖ The ultrasonic scanning does not show the true shape of the inclusions, which is noticed
when comparing the ultrasonic results with the LOM results, making it hard to take
size measurements from the ultrasonic images. However it is possible to see the
distribution and the inclusion placement in the sample.
❖ 10 % of the inclusions found in LOM are found in the ultrasonic scan when comparing
the two results.
❖ The same pattern of indications can be seen in the ultrasonic testing and in the LOM
for the two different steel grades, even though the pattern in both grades are rather
different.

44
7 SUGGESTIONS OF FURTHER INVESTIGATIONS
If this type of testing will be continued there might be need for some further investigation to perfect both the polishing method and the testing method as a whole. Suggestions of further investigations is listed below:
❖ Look over the whole polishing program, reduce the amount of polishing steps by using
a higher pressure and counter rotation. Change the polishing disc as soon as it starts to
get worn.
❖ Use a magnetic mounting disc instead of tape to get rid of the problem with the
flexibility of the tape.
❖ This work was about large area scanning, but it would have been better to use smaller
samples to get smaller height difference, better polishing results, easier washing and
better reproducibility when it comes to finding the true structure. Maybe a possibility
is to mount the samples in plastic to avoid round edges and get a sharper edge.
❖ Large area scanning also caused problems with the image resolution which was very
coarse with 15 µm/pixel. With a smaller sample the resolution would have been better
since the program would have had an easier task handling the image.
❖ Drill small holes in the samples or mount them to get a better match when overlapping
the inclusion images from both methods.
❖ Use another steel grade with a lot of type D inclusions with a size of at least 30 µm to
be able to evaluate the enlargement of the indications in the ultrasonic. This will
increase the chance of finding the same inclusions with both methods since the area
calculated from the LOM will be more comparable to the reflection area in the
ultrasonic. From that it would be easier to draw conclusions about how much the
ultrasonic enlarges the true inclusion size.
❖ For this investigation a built-in program in the Clemex software was used. A better
result could be achieved if a new program was built from scratch which had a different
way of calculating the area of an inclusion.
❖ The ultrasonic was set with a threshold above the signal/noise ratio. To get a better
result from this part, the settings should be investigated to avoid backscattering, get
better focus and by that get a better reading of the sample. After changing settings, a
new check of the amount of found indications on each layer is needed to get a good
focus zone.
❖ The grey scale should be set differently in the ultrasonic after scanning, maybe only
using two colours, white and black. The percentage threshold of reflected sound could
also be changed to make it easier to evaluate the result.

45
8 ACKNOWLEDGEMENT
I would like to extend my sincerest appreciation to my supervisor Simon Lille at Ovako AB,
group R&D in Hofors, as well as to Professor Anders Eliasson at the Department of Material
Science at KTH for their guidance and ideas. I would also want to thank the rest of the Group
R&D department for helping me to solve tasks outside my knowledge and support me with
discussions and guidance.

46
9 REFERENCES
1 L. Kamjou, E. Claesson, J. Fagerlund, Patrik Ölund, ”How clean is your steel?,” Ovako, 2017. [Online]. Available: https://www.ovako.com/globalassets/steel-portfolio/brands/iq-steel/ovako_wp_how-clean-is-your-steel.pdf.
2 D. G. Rethwisch, W.D. Callister, Material Science and Engineering, 9 red., Wiley's, 2014, pp. 304-315.
3 S. Jonsson, Mechanical Properties of Metals and Dislocation Theory from an Engineer's Perspective, Stockholm, Sweden: Royal Institute of Technology, 2010, pp. 213-231.
4 K. Löfvenmark, L.G. Fröjd, S. Mostafaee, ”Pre-Study: Quantifacation of Meso-inclusions,” Ovako, only in house, Hofors, Sweden, 2019.
5 Regeringskansliet, ”Regeringskansliet - Miljö och Klimat,” Sveriges regering, 2019. [Online]. Available: https://www.regeringen.se/regeringens-politik/miljo-och-klimat/.
6 C. v. Schultz, ”Smärtsam resa mot nya idéer,” NyTeknik, 15 04 2014.
7 P. Ölund, ”IQ-Steel - a closer look at the isotropic quality process,” Ovako, Hofors, 2017.
8 Ovako AB, ”Ovako employee awarded prize for steel that reduces environmental impact,” Ovako AB, Hofors, 2013.
9 A. Roiko, ”Interaction of non-metallic inclusions, microstructure, and fatigue loading with small crack growth in high-strength steels,” Aalto University, Helsingfors, Finland, 2017.
10 L. Zang, B. Thomas, ”Inclusions in continous casting of steel,” National Steelmaking Symposium, Mexico, 2003.
11 T. Carlsson, A. Eliasson, H. Keife, C.M Nicolescu, B. Rundqvist. M. Bejhem, B. Sandberg, A. Jarfors, Tillverkningsteknologi, 4:2 red., Hungary: Studentlitteratur AB, 1999 (2010), pp. 228-229.
12 O. Wijk, L. Holappa, ”Inclusion Engineering,” i Treatise on Process Metallurgy, Volume 3, Elsevier Ltd., 2014.
13 F. Ryby-Meyer, B. Diawara, S. Hans, T. Poulain, C. Trempont, E. Henault, A. Rouffie, A. Franceschini, ”Overview Of Cleanliness Assessment Techniques For Low Alloyed Steel Grades,” Irt M2p, France, 2018.

47
14 Ovako AB, ”Ovako Steel Navigator,” Ovako AB, [Online]. Available: https://steelnavigator.ovako.com/steel-navigator/.
15 F. Merchi, M. Meheux-Millot, F. Midroit, ”Non-Metallic Inclusion Density in Bearing Steel Characterized by Ultrsonic Testing,” ASTM, 2015.
16 Struers, ”Products, Polishing, Cloths and Films,” Struers, 2019. [Online]. Available: https://e-shop.struers.com/US/EN/products/Polishing
17 Clemex, ”Clemex - Defining Intelligent Microscopy,” Clemex, 2019. [Online]. Available: https://www.clemex.com/.
18 H. Michaelsen. -. Struers, ”Materialography - In a Lean Six Sigma perspective,” Ballerup, Denmark, 2019.
19 B. Nielsen. -. Struers, ”Efficient Mechanical Preparation,” Ballerup, Denmark, 2019.

TRITA ITM-EX 2019:545
www.kth.se