Embed Size (px)
Citation preview
EVALUATION OF PATCH-BURN GRAZING ON SPECIES RICHNESS
AND DENSITY OF GRASSLAND BIRDS
_______________________________________
A Thesis
presented to
the Faculty of the Graduate School
at the University of Missouri-Columbia
_______________________________________________________
In Partial Fulfillment
of the Requirements for the Degree
Master of Science
_____________________________________________________
by
DAVID J. STROPPEL
Dr. Mark R. Ryan, Thesis Co-supervisor
Mike Hubbard, Thesis Co-supervisor
JULY 2009
The undersigned, appointed by the dean of the Graduate School, have examined the
thesis entitled
EVALUATION OF PATCH-BURN GRAZING ON SPECIES RICHNESS
AND DENSITY OF GRASSLAND BIRDS
presented by David J. Stroppel,
a candidate for the degree of master of science,
and hereby certify that, in their opinion, it is worthy of acceptance.
Professor Mark R. Ryan
Michael W. Hubbard
Professor Frank R. Thompson III
Professor Rose-Marie Muzika

ACKNOWLEDGEMENTS
I would like to thank Director of the School of Natural Resources Mark Ryan,
who served as my thesis co-advisor along with Mike Hubbard, Resource Science
Supervisor, Missouri Department of Conservation (MDC).I would also like to thank my
graduate committee members Dr. Frank R. Thompson III and Dr. Rose-Marie Muzika for
their feedback and thought-provoking questions.
I especially want to thank MDC staff Norman Murray, Resource Science
Supervisor, and Resource Scientist Brent Jamison, Resource Scientist, for their
cooperation and technical support, as well as for securing funding from the National
Resources Conservation Service, whose funds made this project possible.
MDC NE Regional Supervisors George Shurvington and Mike Jones supported
me throughout the entire three-year project, thank you for being forward-thinking,
receptive, and supportive of me furthering my education.
ii

TABLE OF CONTENTS
ACKNOWLEDGEMENTS ...................................................................................................ii
LIST OF ILLUSTRATIONS .................................................................................................iv
LIST OF TABLES .................................................................................................................v
Chapter
1. INTRODUCTION .....................................................................................................1
2. STUDY AREAS ........................................................................................................4
3. METHODS ................................................................................................................6
4. MODEL SELECTION AND STATISTICAL ANALYSIS ......................................9
Statistical analysis
5. RESULTS ..................................................................................................................11
Species Richness Analysis
Detection Function Model Selection
Density
6. DISCUSSION ............................................................................................................15
Species Richness
Density
7. Research and Management Recommendations .........................................................19
APPENDIX
A. Description and representation of a priori models based on treatment effects on
density of grassland birds in southwest Missouri ......................................................35
B. Total number of detections for each species, detection probabilities with SE, and
estimated densities (birds/ha) with SE at the treatment unit scale .............................35
LITERATURE CITED .........................................................................................................36
iii
LIST OF ILLUSTRATIONS
FIGURE PAGE
1. Spatial location of treatment units and patch burn year at Taberville CA .................24
2. Transect locations, patch number and units at Taberville CA ...................................25
3. Estimated density for each species by treatment .......................................................26
4. Dickcissel estimated density by years since burning with 95% confidence
intervals ......................................................................................................................27
5. Henslow’s Sparrow estimated density by years since burning with 95%
confidence intervals ...................................................................................................28
6. Eastern Meadowlark estimated density by years since burning with 95%
confidence intervals ...................................................................................................29
7. Grasshopper Sparrow estimated density by years since burning with 95%
confidence intervals ...................................................................................................30
8. Dickcissel estimated density by years since burning plus treatment with 95%
confidence intervals ...................................................................................................31
9. Henslow’s Sparrow estimated density by years since burning plus treatment with
95% confidence intervals ...........................................................................................32
10. Eastern Meadowlark estimated density by years since burning plus treatment with
95% confidence intervals ...........................................................................................33
11. Grasshopper Sparrow estimated density by years since burning plus treatment
with 95% confidence intervals ...................................................................................34
iv

LIST OF TABLES
TABLE PAGE
1. Mixed model group for each species from Program Distance which includes the
best supported non-covariate detection function, the best covariate model from
Group 1 and the best supported models from the Habitat covariate group ...............21
2. Species richness analysis results by treatment ...........................................................21
3. Species that occurred only in grazing units ...............................................................22
4. Species that occurred frequently in the grazing units but occurred less than three
times in the control unit .............................................................................................22
5. Species that occurred only in the control units ..........................................................22
6. Species richness analysis results by variable .............................................................23
v

1
Evaluation of patch-burn grazing on species richness and density of grassland birds
David J. Stroppel
When European settlers arrived in North America they found large, unfragmented,
tallgrass prairies. This historic presettlement prairie ecosystem in Missouri has been
described as a tallgrass plant community that was subject to frequent fire and grazing with
few trees and shrubs (Kurz 2003, Nelson 2005).
Mechanized agriculture converted much of the prairie into crop fields, fragmenting the
prairie, reducing the prevalence of fires and shrinking the tallgrass prairie to 5% of its
presettlement range (Sampson and Knopf 1994). Today, only about 36,000 hectares (90,000
acres) of Missouri’s original 6 million hectares (15 million acres) of prairie still exist (Kurz
2003). Along with the loss of the tallgrass prairie, grassland bird populations have undergone
dramatic declines in spite of management efforts. The North American Breeding Bird Survey
data show that 70% of the 29 bird species characteristic of North American prairies declined
between 1966 and 1993. These grassland bird species are declining faster than any other
guild of terrestrial birds on this continent (Knopf 1994). This suggests that techniques
currently used to mange rangelands may be insufficient to maintain biological diversity
(Holecheck et al. 1998). To reverse this decline, the remaining tracts of tallgrass prairie must
be managed in a way to provide the diverse habitat needs of the avian community.
The presence of grazing during the evolution of prairie ecosystems helped promote
biodiversity. This suggests that biodiversity could be enhanced on today’s grasslands by
2
mimicking the temporal and spatial grazing patterns of presettlement prairies (Fuhlendorf
and Engle 2001).
Heterogeneity when defined as variation in vegetation structure, composition, density and
biomass, influences species diversity, habitat variety and ecosystem function (Christensen
1997, Wiens 1997, Bailey et al 1998). Many species depend on the interspersion of diverse
habitat types scattered throughout a heterogeneous landscape (Fuhlendorf and Engle 2001).
Heterogeneity leads to biodiversity and should serve as the framework for ecosystem
management (Christensen 1997, Ostfeld 1997, Wiens 1997).
The variation in habitat requirements of grassland birds shows us that heterogeneity is
important. The structure of grassland avian communities is influenced by the structural
heterogeneity of the plant communities (Wiens 1974). Certain bird species require specific
structural characteristics in grasslands (Cody 1985). The variation in habitat requirements of
coexisting grassland bird species supports the necessity of heterogeneous grasslands for
maintaining diverse avian communities (Fuhlendorf and Engle 2001). For example, Greater
Prairie Chickens (Tympanuchus cupido) need short, sparsely vegetated ground for courtship
displays, sites with residual vegetation for nesting, and, in general, little woody vegetation
(Johnson et al. 2004). Upland Sandpipers (Bartramia longicauda) use short vegetation for
foraging, short to medium height vegetation for brood rearing, and taller vegetation for
nesting (Johnson et al. 2004). Grasshopper Sparrows (Ammodramus savannarum) prefer
short to intermediate height, clumped grasslands interspersed with patches of bare ground for
foraging and for nesting they require moderate amounts of litter (Bent 1968, Blankespoor
1980, Vickery 1996). The Eastern Meadowlark (Sturnella magna) prefers intermediate height
grasslands with a moderate amount of forbs and little woody vegetation. The meadowlark

3
forages for insects on the ground or in the soil and nests on the ground within short
grasslands that are moderately to heavily grazed (Skinner et al 1984). These species, and
others, prefer different habitats for different stages of their life cycle, and often they need
these habitats in close proximity to one another. To achieve this mix of habitats, juxtaposed
in such a way as to benefit several different species; a mix of management techniques is
needed that mimic the interaction of historic processes that shaped prairies.
The eastern tallgrass prairie community evolved under the interactive effects of climate,
topography, soil types and conditions, fire, and grazing (Axelrod 1985). The combined
effects resulted in diverse plant communities of grasses and forbs in different successional
stages scattered across the landscape. Today, large contiguous tracts of native prairie are rare,
and managers are trying to replicate the interaction of fire and grazing on relatively small,
isolated patches of native and restored prairie. These smaller prairies may function
differently than larger prairies of presettlement times, but the historical processes of fire and
grazing are still necessary to maintain functioning prairie systems.
One promising prairie management technique is patch-burn grazing (PBG). PBG mixes
annual burning with summer grazing to increase vegetation heterogeneity. This technique
may help create the mix of plant communities similar to what occurred historically. PBG
created diverse plant structure scattered across the landscape (Fuhlendorf and Engle 2001)
and has potential for enhancing grassland bird populations.
The benefits of PBG to grassland bird populations versus burning alone have not been
tested in Missouri. It has been investigated in other states with promising results. Our overall
objective was to conduct a confirmatory analysis of the effects of PBG on species richness
and density of grassland birds. The diversity in vegetative structure created by PBG, should
4
lead to greater species richness, and higher densities for some species (e.g. Grasshopper
Sparrow). We expect estimated density will be greater in the control unit for the DICK and
HESP and greater in the grazing unit for EAME and GRSP. We will use a student’s t-test to
check for significant differences in mean estimated density.
It is the goal of this study to determine where avian species richness and density is higher
relative to the treatment effects from grazing, years since burning and the interaction of
grazing and years since burning. This information could prove valuable to managers who
wish to provide habitat conditions for a large suite of grassland birds but are concerned about
making the lands they manage unsuitable to the species that are currently present or to
species of conservation concern.
Study Areas
The study areas were Taberville, Wah’Kon-Tah, Niawathe and Bethel Prairies. All areas
are owned by MDC, The Nature Conservancy or both and were located in either the Osage
Plains or Springfield Plateau Region in southwest Missouri. Both the Osage Plains and the
Springfield Plateau have soils formed from eroding rock and may have bedrock near the
surface (Kurz et al. 2003).
Taberville Prairie located in St. Clair County, is 651 hectares (1,608 acres). Taberville is
an Ozark border prairie with silt loam soils from shale and sandstone (Kurz et al. 2003).
Taberville was hayed and grazed on a three year rotation prior to the introduction of a PBG
system. The surrounding land use was 70% cropland and 30% grassland with 25% of the
grassland used as pasture while the other 5% is hayed (Gilmore, Pers, Comm.).
5
Wah’Kon-Tah prairie, in St. Clair and Cedar Counties, at 1,157 hectares (2,858 acres) is
the largest, easternmost tallgrass prairie in North America (Kurz et al. 2003). It also is an
upland Ozark border prairie, but unlike Taberville, Wah’Kon-Tah has cherty silt loam soils
from cherty limestone. Wah’Kon-Tah was under a hay, burn, and rest rotation prior to being
patch burned grazed. Surrounding land use was 95% grassland with 90% in pasture and 5%
hayed, the remaining 5% is cropland (Gilmore, Pers, Comm.).
The last two sites are smaller, with the entire conservation area being in the study. At 130
hectares (320 acres), Niawathe prairie in Dade County, is an Ozark border dry mesic upland
prairie, with silt loam soils formed from shale and sandstone (Kurz et al. 2003). Prior to the
application of PBG, about 30 hectares (80 acres) of Niawathe was hayed annually on
rotation. Additionally, Niawathe was burned on a five-year rotation. Both the control and
grazing units were under the same management. The surrounding landscape was 50% fescue
(Festuca sp), 25% native prairie, and 25% cropland (Hedges, Pers, Comm.).
Bethel Prairie, a small (105 hectare [260 acre]) tract in Barton County is an upland prairie
over shallow sandstone (Kurz et al. 2003). Until the late 1990’s Bethel was grazed
continuously and rarely burned. The area surrounding Bethel was 15% cropland, 60% native
grassland and 25% fescue and Caucasian bluestem (Bothriochloa ischaemum). All
neighboring grasslands are hayed and continuously grazed. These sites were selected for
PBG because they were all native grasslands in similar landscapes making comparisons
between sites possible.
6
Methods
Field Methods
In this study, PBG is a management strategy which was applied by dividing a prairie into
three patches one of which was burned each spring. Patch 1 was burned in 2005, patch 2 in
2006 and patch 3 in 2007 (Map 1). Cattle are introduced shortly following the burn (mid-
April) and are allowed to graze until mid-August. The only fence is a perimeter fence to
contain the cattle, allowing them to graze freely across all three patches of the grazing unit.
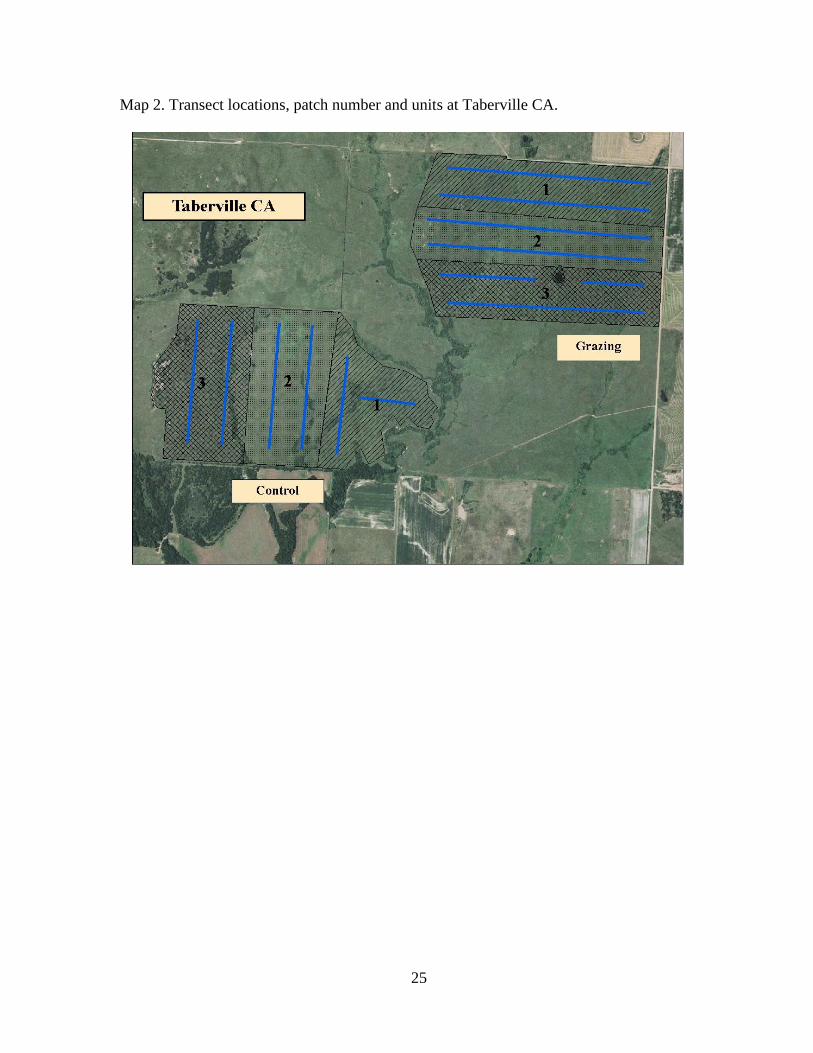
To obtain information on species richness and density, transects were laid out in each
patch of each unit in a stratified random sampling pattern (Map 2). Each patch typically had
two transects and each unit had six. In March 2006 an arson fire burned much of the PBG
unit on Wah’Kon-Tah. Surveys were conducted in the portions of Wah’Kon-Tah that were
burned on the same rotation as the other study areas. No surveys were conducted in the arson
burn area.
We used a distance sampling method where bird observations were recorded from
transects. Distance sampling is based on determining a detection function. We used line
transect sampling and program DISTANCE (version 5.0; Thomas et al. 2005) to compute the
probability of detection (p) for the avian species we detected in this study (Buckland et al.
2001). The detection function compensated for the fact that detectability decreases with
increasing distance from the observer (Rosenstock et al. 2002). Distance sampling also
allowed us to model detection probability by observer, study site, treatment and other habitat
characteristics.

7
We placed the first transect within a patch a random distance between 50 m and 90 m
from the perimeter of the patch. Additional transects were placed at least 100 m from the
previous transect and all transects ended at least 50 m from the perimeter of the patch.
Distance sampling requires estimates or measures of the distance to each bird
perpendicular to the transect (x). Three assumptions (Buckland et al. 2001) critical to
acquiring accurate detection function estimates are: (1) birds on the line are always detected;
(2) birds are detected before any movement triggered by the observer and (3) distances are
estimated or measured accurately. To meet assumptions one and two, trained observers
traveled slowly or stopped occasionally along the line to listen and observe the line ahead of
them (Rosenstock et al. 2002) and focused on identifying birds on the line before they were
disturbed. We used Bushnell Yardage Pro 800 laser rangefinders to measure perpendicular
distance to eliminate distance estimation errors.
Counts were conducted in treatment and control units on all four study sites. On three of
the four prairies the control unit was immediately adjacent to the grazing unit. At Taberville
the control and treatment units were separated by 325 m (Map 1). Each count was conducted
between 30 minutes before sunrise and 1000 hours. Transects were walked when the sky was
clear, no precipitation or fog was present and winds were less than 16 kph (<10 mph). On the
two larger prairies treatment and controls units were approximately 90 ha (220 acres) each.
On Bethel and Niawathe prairies (the two smaller sites), treatment and control units were
approximately 53 ha (130 acres) and 65 ha (160 acres) respectively.
A team of four observers sampled two prairies each day. Two observers sampled all
transects on one area while the other observers sampled a different prairie. Transects were
rotated so that the first transect and the starting point of each transect was different each day.

8
We conducted 12 surveys of each patch on each site in 2006 and in 2007. Two sites were
sampled simultaneously each morning with one observer in the control unit while another
observer surveyed the treatment unit. To obtain a precise density estimate with a coefficient
of variation of less than 0.15 we needed a sample size (n) between 60-100 for each species
(Rosenstock et al. 2002, Buckland et al. 2001).
Cover board readings were taken from each site in June. The percent of visual obstruction
from 0 – 10 cm and maximum vegetation height in centimeters was recorded at dozens of
plots within each patch of each unit. The number of plots varied depending on the size and
shape of each patch with a range of 55 – 110 vegetation plots per patch.
The expected relationships between avian density, grazing and years since burning for the
species covered in this paper are listed in Appendix A. For both Dickcissel (DICK) and
Henslow’s Sparrow (HESP) we expected a negative response to grazing and a positive
response to years since burning. That is, we expected estimated density of these two species
to increase as the number of years since burning increased or to decrease with grazing. For
Eastern Meadowlark (EAME) and Grasshopper Sparrow (GRSP) we expected a positive
relationship to grazing and for GRSP, a negative response to increasing time since burning.
EAMEs prefer mid-height grasslands so we predicted they would vary in their response to
fire. Mean estimated densities will be pooled across years, averaged, and then a student’s t-
test will be used to check for significant differences between means.
We chose to analyze data for DICK and HESP for three reasons. One, they were the two
largest datasets respectively, two: both species are associated with dense stands of tallgrass
prairies and three; HESP are in decline and DICK are a species of management concern in
Missouri (MDC 2009). We expected both species to show preference for the taller, thicker
9
grasslands found in the control units and have lower density estimates in the grazed units and
even lower numbers in the grazed and burned patches.
To get a picture of how PBG affects other species, we chose to also evaluate EAME and
GRSP densities. These species are associated with short to medium height grasslands and
their sample sizes were adequate for evaluating patch level abundances. The EAME is
common in Missouri but the GRSP is designated a species of management concern (MDC
2009).
Model Selection and Statistical Analysis
Models for this paper were ranked using an information theoretic approach. We chose to
use Akaike’s Information Criterion (AIC) to select the best supported model from the given
candidate models (Burnham and Anderson 2002). We used AICc (AIC adjusted for small
sample size) to rank the candidate models (Buckland et al. 2001). Models were ranked using
∆AICc which is the difference between the best supported model and all other models in the
model set. Models that were within two AICc units of the best supported model were
considered well supported (Burnham and Anderson 2002).
We estimated detection probability and avian abundance with program DISTANCE.
Detection function models were determined for each species by evaluating non-covariate and
covariate models. The non-covariate model group included; uniform, hazard rate and half-
normal key functions with simple polynomial, hermite polynomial and cosine series
expansion combinations. For the covariate analysis only half-normal or hazard rate functions
were used as the uniform function does not allow for the evaluation of covariates and the
exponential key function has an implausible shape near zero distance (Thomas et al. 2006).

10
The hazard rate and half-normal models are suggested for Multiple Covariate Distance
Sampling (MCDS) by Buckland et al. (1993). MCDS analysis allowed us to determine which
variable or combinations of variables produced a better supported detection function. To
reduce variance in the density and abundance estimation calculations, we right truncated the
data 5% (Buckland et al. 1993).
The first set of covariate models included study site, observer, treatment, sample year and
years since burning. The second set of covariate models incorporates vegetation data from
cover board readings including mean cover at ground level from 0 – 10 cm (Mean CS 1),
mean cover at maximum height (Mean Max) and coefficients of variation from each of these
strata, denoted CV CS 1 and CV Max respectively.
All well supported models from the first three groups were combined to form the mixed
model group. This allowed us to evaluate if the covariates improved the fit of the detection
function beyond the basic non-covariate models. We used AICc values to rank the models in
the candidate set and the best supported model from this group was then used to estimate
density. The mixed model group is listed on Table 1.Total number of detections for each
species, detection probabilities with standard error (SE), and density with SE are listed in
Appendix B.
Statistical Analysis
To determine PBG effects on avian species richness and density we referenced the bird
survey results to the patch or unit they were located in to show their response to burning,
grazing or the combination of burning and grazing. Species richness was the number of avian
species observed in each patch. To test for differences in species richness we performed an

11
ANOVA in SAS using the GLM procedure (SAS Institute 2000). We looked for differences
in species richness and abundance by study site, treatment, years since burning, and treatment
plus years since burning.
Visual analysis of the data indicated a problem in the 2007 observations with more
detections at zero distance than expected. Buckland et al. (2001) report that if >10% of
detections are at zero distance this could result in unreliable distance measurements. The data
were then left truncated at 0.9 m because of these excess detections. We compared the data
with and without left truncation and found it did not change the density estimates but left
truncation of the data did reduce the confidence intervals and resulted in lower coefficients of
variation. Even though the 2006 data did not have an issue with greater than expected
observations at zero distance we truncated both the 2006 and 2007 datasets.
To evaluate density at the patch level, estimated density was evaluated by years since
burning with Year 0 denoting the patches that were burned the spring immediately preceding
the survey, and Year 1 or 2 being one or two years of growth since they were last burned.
Results
Species richness analysis
Species richness was greater in PBG units (x̄ = 20.2 +/- SD 2.77) than in control units (x̄
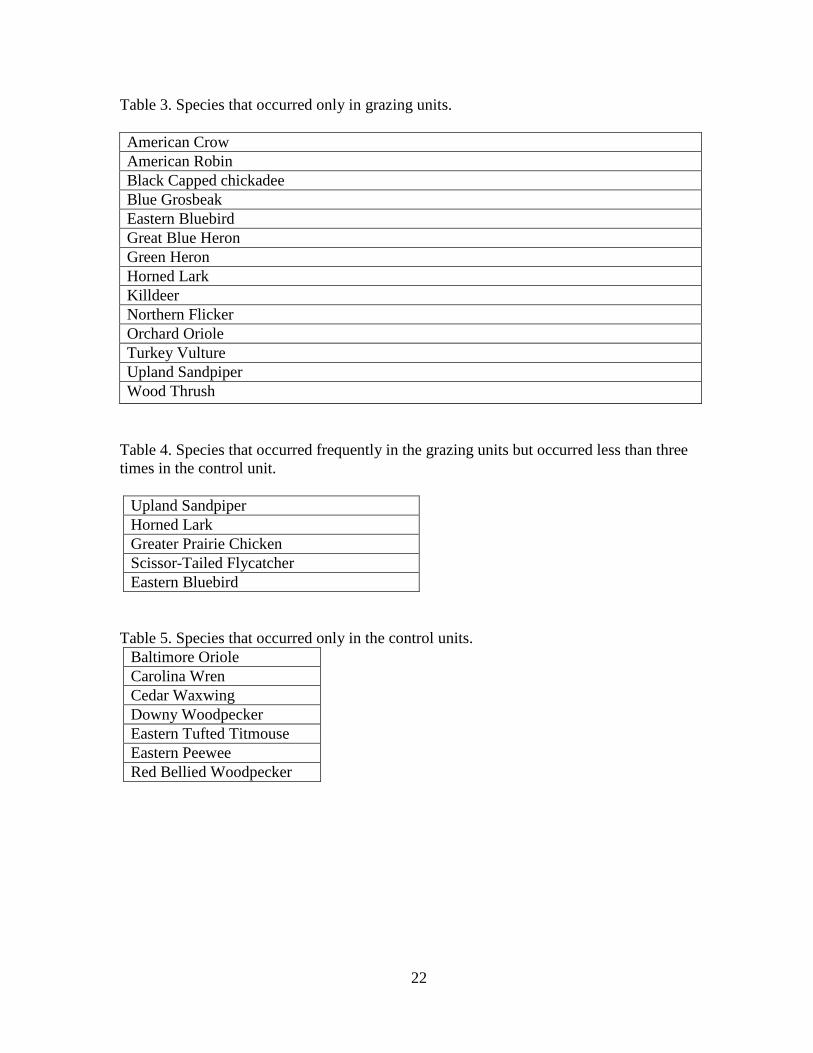
= 17.5 +/- SD 3.09; p = 0.02) (Table 2). Fourteen species occurred uniquely on PBG units
(Table 3). The Upland Sandpiper, Horned Lark, Greater Prairie Chicken, Scissor-Tailed
Flycatcher and Eastern Bluebird occurred frequently on PBG sites, but only rarely (<3
observations) on control units (Table 4). Seven species occurred uniquely or frequently on
control units, but only rarely (< 3 observations) on PBG units (Table 5). Of these, none were
12
true grassland species, none were state endangered and one, the Eastern Wood-Pewee, is a
species of management concern.
The Greater Prairie Chicken occurred frequently in the Year 0 and Year 2 grazing patches
and once in the Year 0 control patch. Prairie chickens were never detected in the other
control patches. The Upland Sandpiper and Horned Lark were detected in all three grazing
patches but were never found in the control units. The Scissor-Tailed Flycatcher occurred
frequently in the Year 0 and Year 2 grazing patches and once in the Year 1 control patch but
was never found in the other control patches.
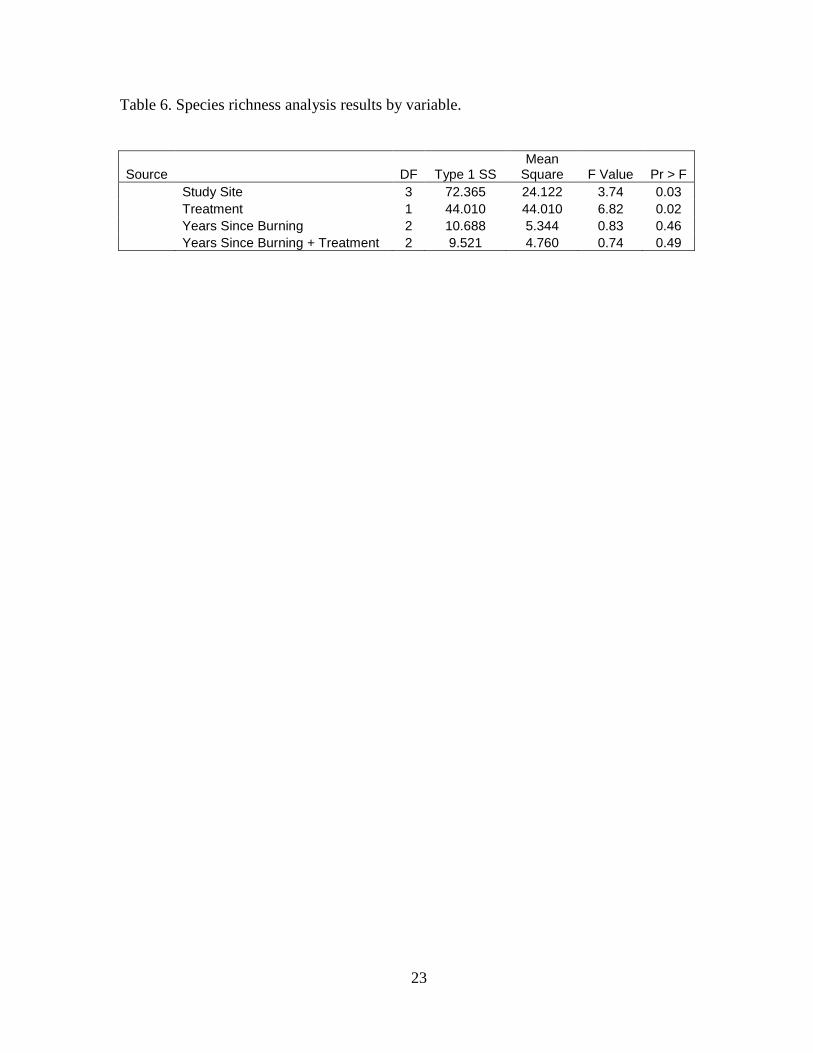
The ANOVA analysis showed significant differences in species richness between study
sites (P = 0.03), no significant difference between years since burning (P = 0.46) and no
significant difference with the years since burning plus treatment interaction (P = 0.49; Table
6). The difference in species richness between study sites was expected, all four study sites
were native prairies but they varied in size, shape, latitude and terrestrial natural community.
Detection function model selection
For both DICK and EAME the uniform simple polynomial detection function was the
best supported (Table 1) with the lowest AICc score as well as having a wi = 1.00. For the
GRSP the non-covariate hazard rate key function with a simple polynomial series expansion
was the best supported. It too had the lowest AICc score and a wi = 1.00. The observer
covariate model was the best fit for the HESP with the lowest AICc score and a wi = 1.00.
This means that a large portion of the variance in the abundance estimate can be explained by
variables other than distance, in this case the observer (Buckland et al. 2004). This could
represent differences in the observer’s vision, hearing or experience identifying HESPs or it

13
could be related to the bird’s behavior, coloration or song which makes it a challenge for the
observer to detect.
Density
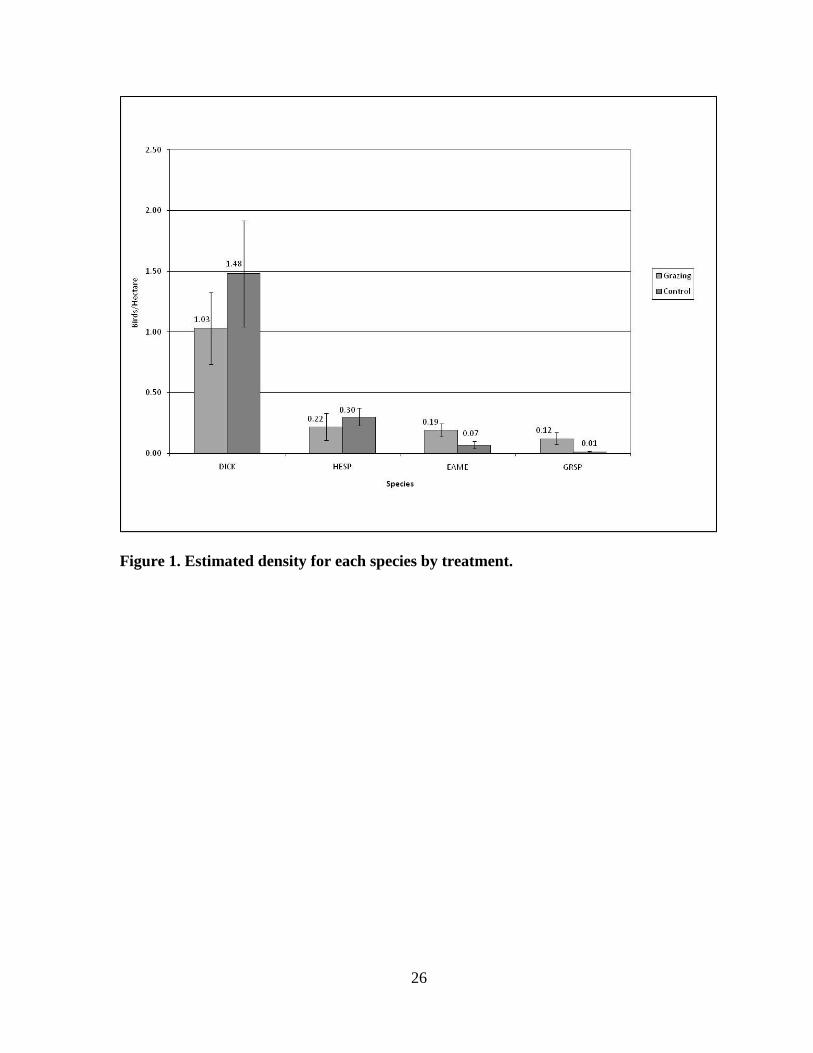
DICK and HESP estimated densities were higher in the control units while EAMEs and
GRSPs had higher estimated densities in the grazing units (Fig 1). Mean estimated density
for the DICK in the grazing units was x̄ = 1.03 birds/ha (+/- SD 0.466) and x̄ = 1.48 birds/ha
(+/- SD 0.687) in the control units (two-tailed t-test: p = 0.071). HESP mean estimated
density was x̄ = 0.22 birds/ha (+/- SD 0.176) and x̄ = 0.30 birds/ha (+/- SD 0.116) for the
grazing and control units respectively (p = 0.1924).
For the EAME grazing unit mean estimated density was x̄ = 0.19 birds/ha (+/- SD 0.081)
whereas control unit estimated density was only x̄ = 0.07 birds/ha (+/- SD 0.045; p =
0.0002). The GRSP was also much more prevalent in the grazing units with an estimated
density of x̄ = 0.12 birds/ha (+/- SD 0.077) and only x̄ = 0.01 birds/ha (+/- SD 0.010) in the
control units (p = 0.0001).
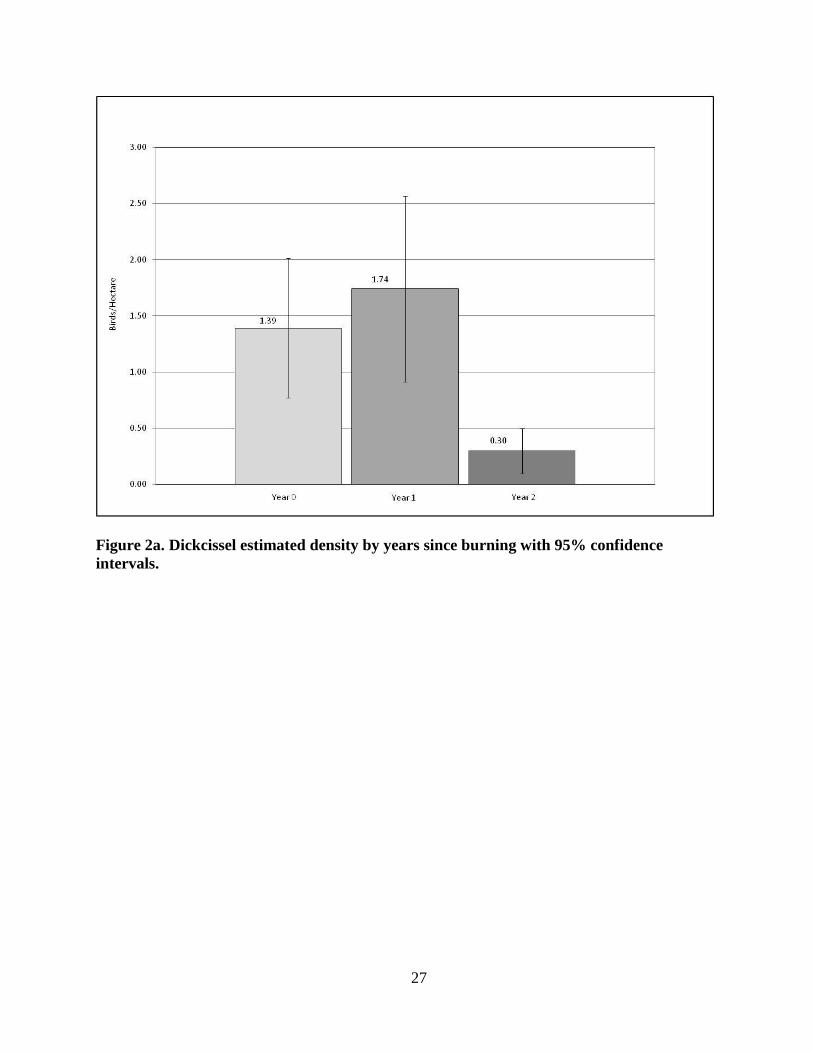
When densities were analyzed by years since burning (control patches, Fig. 2a-d), DICK
mean estimated density (Fig. 2a) was lowest in the Year 2 patches with x̄ = 0.30 birds/ha
(+/- SD 0.241), the lowest estimated density observed for this species in any patch, and
highest in Year 1 with x̄ = 1.74 birds/ha (+/- SD 0.988). A two-tailed t-test revealed no
significant difference in estimated density between the Year 0 (x̄ = 1.39 +/- 0.743 SD) and
Year 1 (p = 0.4399) patches. There were significant differences in DICK estimated density
between the Year 0 and Year 2 (p = 0.0014) patches and between the Year 1 and Year 2 (p =
0.0013) patches.
14
HESP estimated density (Fig. 2b) was lowest in the Year 0 patches with x̄ = 0.09
birds/ha (+/- SD 0.074) and highest in the Year 1 patches with x̄ = 0.49 birds/ha (+/- SD
0.190; p = 0.0001). HESP densities in Year 2 were intermediate (x̄ = 0.33 +/- SD 0.269;
Year 0 vs. Year 2: p = 0.0249; Year 1 vs. Year 2: p = 0.2047).
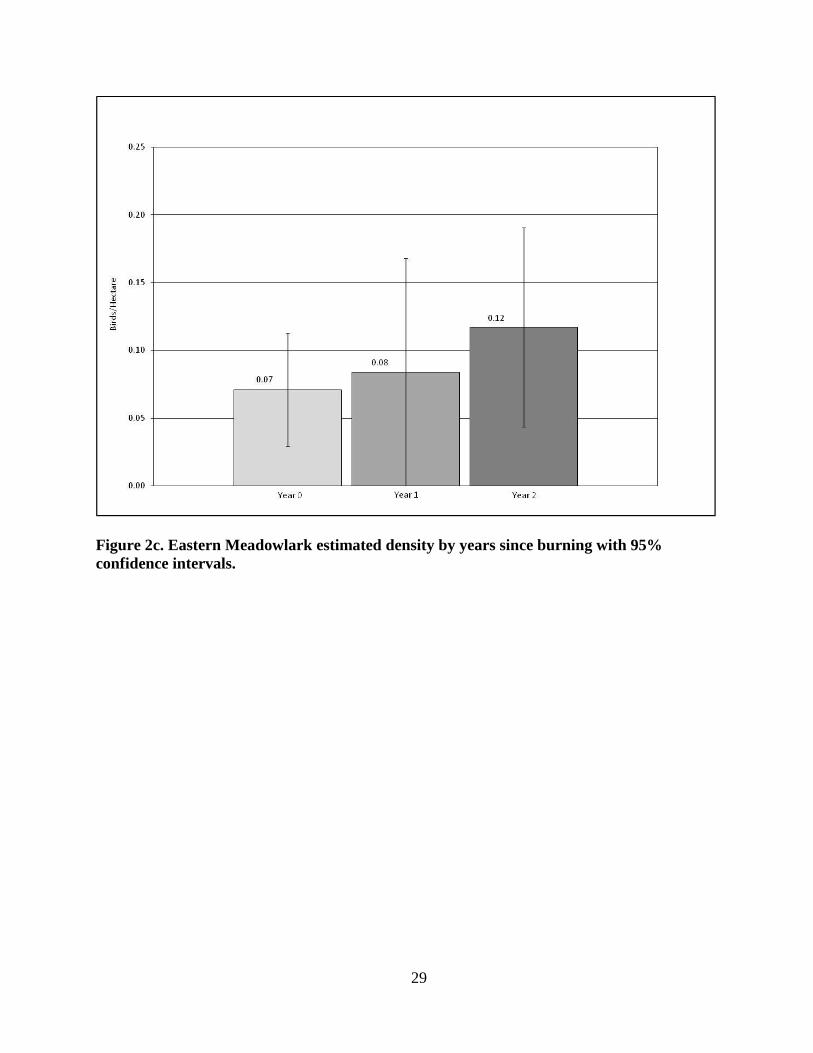
The lowest estimated densities for EAMEs (Fig. 2c) occurred in the Year 0 patches with
x̄ = 0.07 birds/ha (+/- SD 0.050), the lowest estimated density observed for this species in
any patch, and the highest estimated densities occurred in the Year 2 patches with x̄ = 0.11
birds/ha (+/- SD 0.088; p = 0.2183; Year 0 vs. Year 1; p = .7504; Year 1 vs. Year 2; p =
0.4913).
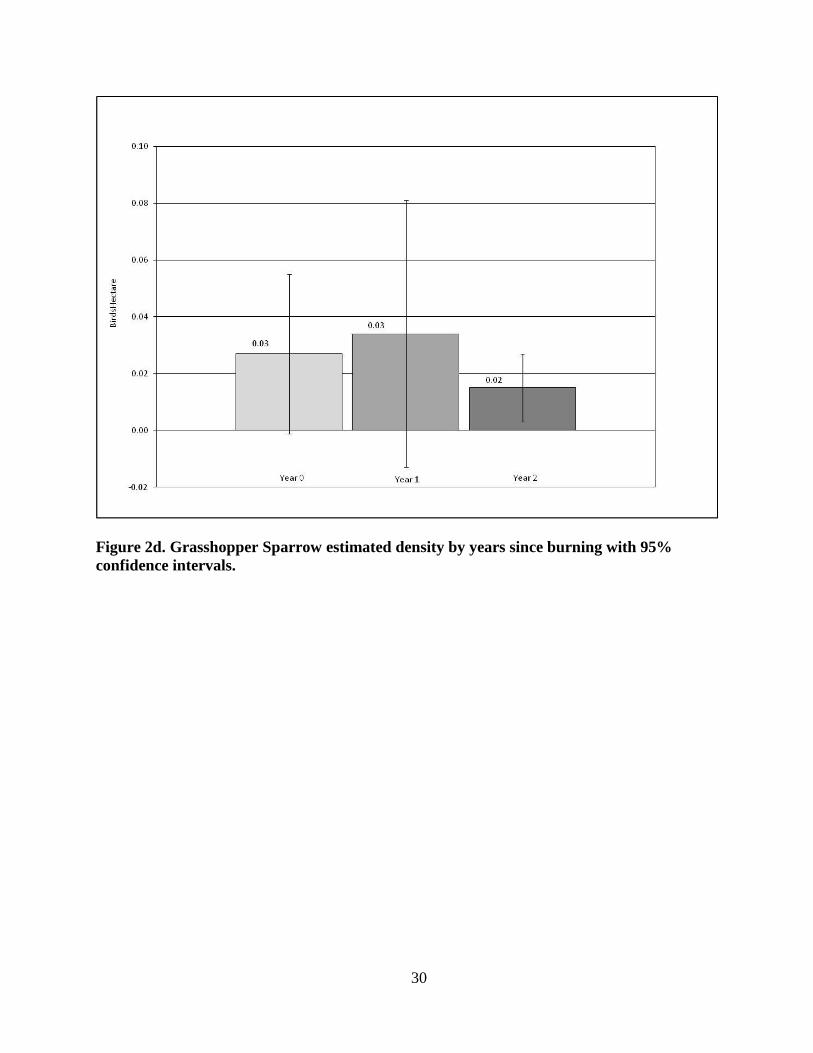
The greatest GRSP estimated density (Fig. 2d) occurred in Year 1 at x̄ = 0.03 birds/ha
(+/-SD 0.056) and lowest in Year 2, the lowest estimated density for this species in any
patch, with x̄ = 0.02 birds/ha (+/- SD 0.014; p = 0.3512: Year 0 vs. Year 1; p = .6818: Year 0
vs. Year 2; p = 0.4484).
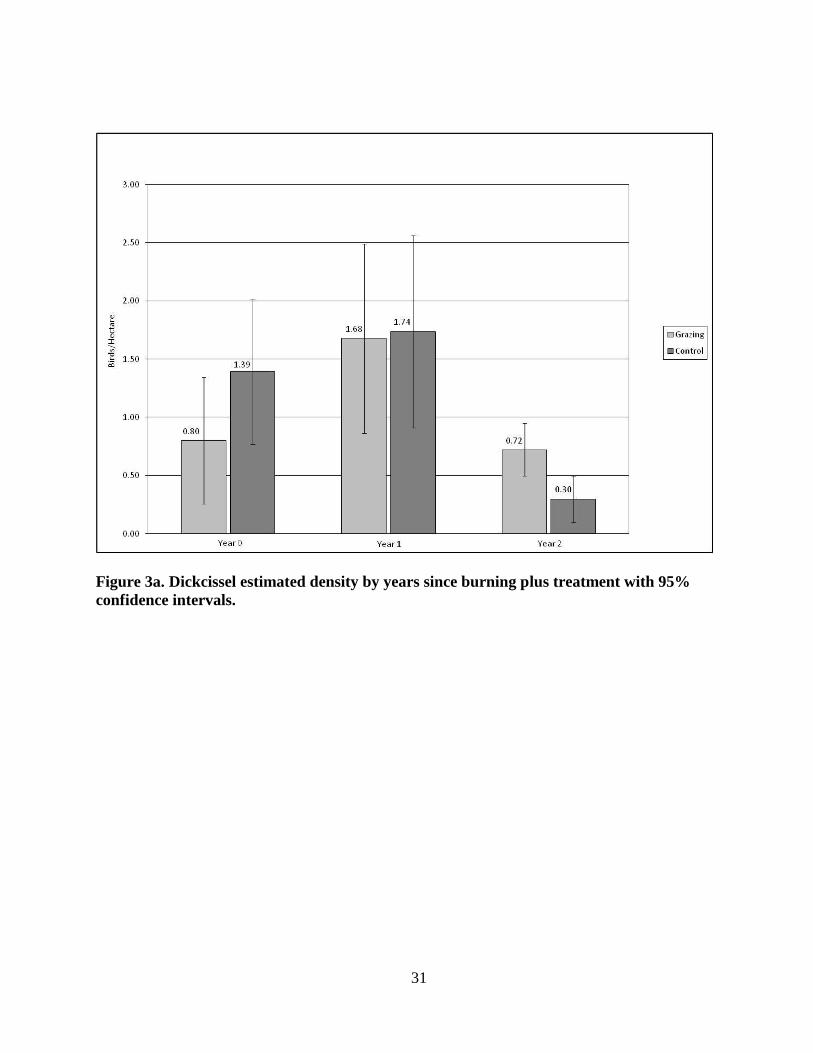
When densities were analyzed for the grazing patches by years since burning, the highest
DICK estimated density (Fig. 3a) was in the Year 1 patches (x̄ = 1.68 birds/ha +/- SD 0.971;
p = 0.9043) followed by Year 0 (x̄ = 0.80 birds/ha +/-SD 0.651; p = 0.1133) and the lowest
estimated density was found in the Year 2 patches (x̄ = 0.72 birds/ha +/- SD 0.270; p =
0.0052).
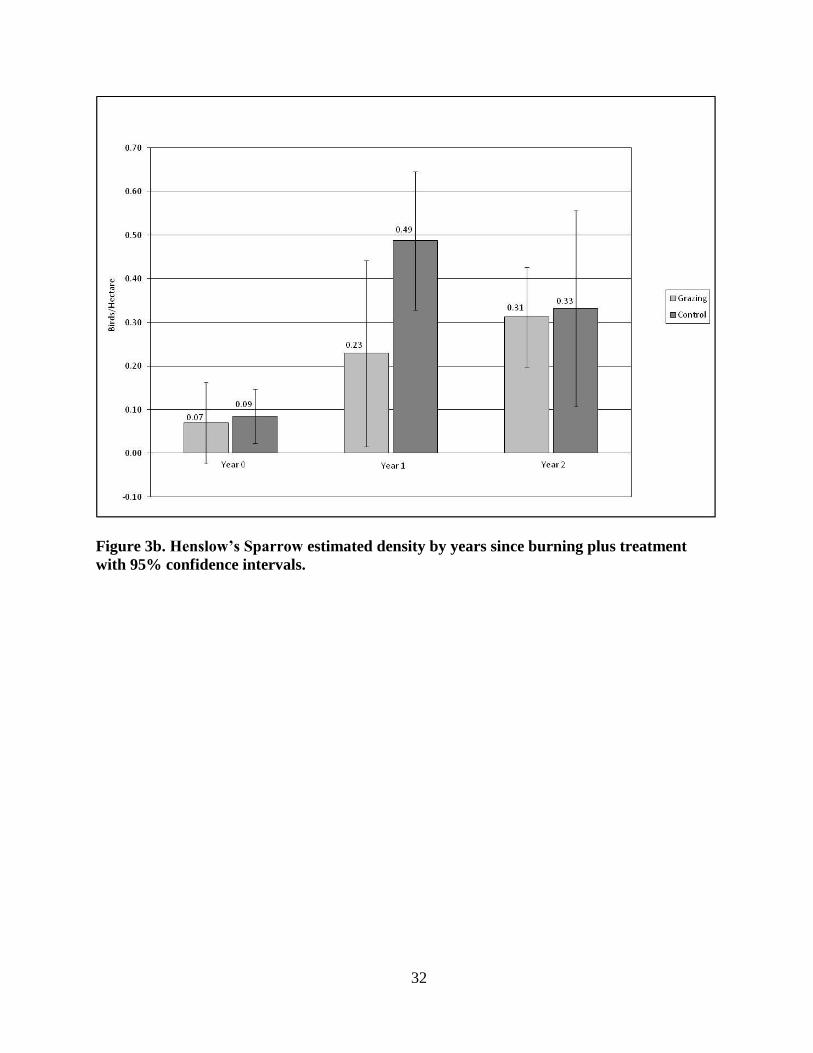
In the grazing patches, HESP estimated density (Fig. 3b) was lowest in the Year 0 patches
(x̄ = 0.07 birds/ha +/- SD 0.111; p = 0.7615,), the lowest estimated density we observed for
this species in any patch, higher in Year 1 (x̄ = 0.23 birds/ha +/-SD 0.254; p = 0.0373) and
highest in Year 2 (x̄ = 0.31 birds/ha +/- SD 0.138; p = 0.8539).

15
EAME estimated density (Fig. 3c) in the grazing patches was lowest in Year 0 (x̄ = 0.12
birds/ha +/- SD 0.91; p = 0.2131) and equal in Year 1 (x̄ = 0.24 birds/ha +/- SD 0.152; p =
0.0341) and Year 2 (x̄ = 0.24 birds/ha +/- SD 0.108; p = 0.0303), respectively.
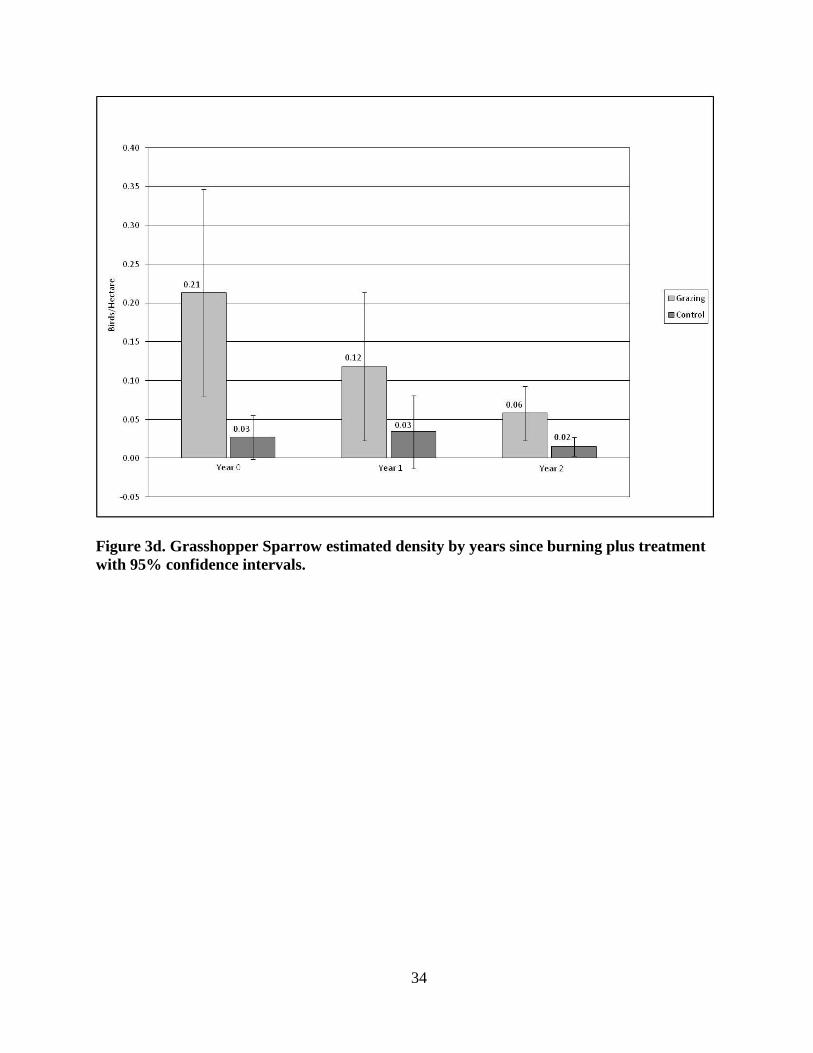
GRSP estimated density (Fig. 3d) in the grazing patches was highest in Year 0 (x̄ = 0.21
birds/ha +/- SD 0.160; p = 0.0062), lower in Year 1 (x̄ = 0.12 birds/ha +/- SD 0.114; p =
0.0843) and lowest in Year 2 (x̄ = 0.06 birds/ha +/- SD 0.042; p = 0.0153).
Discussion
Species Richness
Patch-burned grazed units show increased species richness and increased EAME and
GRSP estimated density, the latter identified as a species of management concern in Missouri
(MDC 2009). This supports other researchers (Fuhlendorf et al. 2006, Coppedge et al. 2008)
who concluded that PBG provides habitat for a wider suite of grassland birds than burning
alone.
In this two-year study, only one observation of a Greater Prairie Chicken and one of a
Scissor-Tailed Flycatcher were recorded in a control unit. These are important observations
as the prairie chicken is a state endangered species and the Scissor-Tailed Flycatcher is a
species of management concern in Missouri (MDC 2009). The Greater Prairie Chicken has
been shown to be area sensitive and was absent on prairie fragments less than 77 ha (Winter
and Faaborg 1998) in southwest Missouri. It appears that to enhance grassland habitats for
these species, a combination of grazing and fire provides the range of habitat conditions they
utilize during the breeding season. To create the diversity of habitats needed by a wide

16
variety of species, grasslands should include areas that are burned, unburned, grazed,
ungrazed, burned and grazed, as well as rested (unburned and ungrazed).
Species richness was not significantly related to years since burning or years since
burning plus treatment. This was expected as it’s the heterogeneity across the PBG unit that
would provide the habitat diversity needed to support a wider suite of grassland birds, not the
habitat created within a given patch (burn year) or patch treatment.
Density
EAME and GRSP estimated densities were significantly greater in the PBG units. This
result is consistent with the literature for these two species as they prefer short to
intermediate height grasslands, which were abundant in the grazing units (Roseberry and
Klimstra 1970, Wiens 1973, Vickery 1996). This response was expected given both species’
preference for grazed grasslands (Walk et al. 2000, Ryan et al. 2003, Skinner et al. 1984) and
is also consistent with others (Powell 2006) who found grazing to have a positive effect on
GRSP abundance.
No significant difference in estimated density was detected between grazed and ungrazed
units for the DICK or HESP. Given both species reported preference for taller, dense
grasslands with deep litter and forbs (Wiens 1973, Skinner et al. 1984, Winter 1998, Winter
1999) it was expected that their densities would be greater in the control units which are
characterized by taller, denser grasslands with high litter. However, many studies have
reported that the DICK (Overmire 1963, Wiens 1973, Skinner et al. 1984, Bock et al. 1993)
and HESP (Skinner et al. 1984, Swengel 1996) use light to moderately grazed grasslands.
17
Because the patch-burn grazed units were moderately grazed, the grasslands could recover
quickly from fire and were therefore very attractive to both species.
DICK estimated density related to years since burning was significantly lower in Year 2.
We detected no difference in Year 0 or Year 1 estimated densities, with a peak in estimated
density occurring in Year 1. Zimmerman (1992) also reported that spring burning (Year 0)
did not affect DICK abundance in Kansas, and Powell (2006) reported DICK abundance in
burned sites to be highest in Year 1 and then declined over the next two years. Other studies
have shown DICK abundance to be unrelated to years since burning (Zimmerman 1993,
Swengel 1996, Winter 1999). It appears that the vigorous growth of the grasslands following
spring burning resulted in suitable habitat within the year of burning and for the following
year, but this continued growth resulted in less desirable habitat conditions in Year 2,
significantly reducing estimated density.
In the grazing patches, DICK estimated density was significantly greater than the control
patches in Year 2 and peaked in Year 1. Powell (2006) reported similar results in grazed
pastures with DICK estimated abundance highest in Year 1, and declining in Year 2. This
would suggest that the addition of grazing animals extends the impact of the prescribed fire
for an additional year creating habitat capable of supporting densities in Year 2 greater than
that of burning alone.
HESP density was strongly influenced by fire in this study, with estimated density related
to years since burning lowest in Year 0, highest in Year 1, and down in Year 2, all three
responses were significant. These results are consistent with other studies that show this
species preferring taller grasslands with high litter cover (Wiens 1969, Skinner et al. 1984)
and with studies (Herkert 1994, Powell 2006) that found HESP abundance to be lowest in

18
recently burned habitats. It is likely that HESP density was lowest in Year 0 due to the lack
of litter, lack of standing dead vegetation and/or lack of forbs for song perches.
The peak in HESP estimated density in Year 1 and the decrease in Year 2 differs from
other studies that found HESP abundance increased over time, peaking two (Herkert 1994)
and three years following burning (Powell 2006), but is consistent with Powell’s (2006)
findings in Kansas where HESP abundance was greater in the control patches for both Year 1
and Year 2. This decrease in Year 2 could be attributed to the aggressive growth of the
grasslands following spring burning resulting in less desirable habitat than in the Year 1
patches.
In the grazing patches, HESP estimated density was lower than the control patches for
Year 0, Year 1 and for Year 2. Estimated densities were significantly greater only for Year 1.
This is consistent with Powell’s (2006) findings in Kansas where HESP abundance was
greater in the control patches for both Year 1 and Year 2. Powell (2006) also reported
grazing eliminated or nearly eliminated HESP from grazed sites, but this study does not show
elimination or near elimination of HESPs from the PBG units.
EAME estimated density was not related to years since burning. Estimated density was
lowest in Year 0 and peaked in Year 2 control patches. In the grazing patches, estimated
density was greater in all three patches with a peak in Year 1 and Year 2 estimated density
equal to Year 1. This is consistent with Powell (2006) who found EAME abundance lowest
in recently burned sites (Year 0) and highest in Year 2. Results show significantly greater
estimated density in the PBG patches in Year 1 and Year 2. This was expected as the
meadowlark usually responds positively to grazing (Bock et al. 1993).

19
GRSP estimated density was not related to years since burning. Estimated density was
very low in all three years with the lowest density in Year 2 and highest in Year 1. In the
grazing patches estimated density was greater in all three patches with a peak in Year 0.
Estimated densities were significantly greater in Year 0 and Year 2. Powell (2006) reported
estimated abundance to be lowest in Year 0, highest in Year 1 with Year 2 being nearly equal
to Year 1 for both grazed and ungrazed sites. The results of this study differ from Powell as
we detected the greatest density for GRSPs in Year 0 grazing patches and then a decline in
each of the following years. This was expected given the GRSP’s preference for short, grazed
grasslands (Wiens 1973, Ryan et al. 2003, Vickery 1996). It appears that PBG is a viable
management technique to boost densities of this and other species associated with short
grasslands.
Research and Management Recommendations
PBG increases avian species richness and density of some species during the breeding
season when applied to native tallgrass prairies. Further research is needed to assess its
effects on avian species richness and density on warm season grass restorations. Winter
habitat use of patch-burn grazed prairies by resident species also should be evaluated.
As with any management technique, some species will benefit from PBG and some will
not. Spring burning results is grass-dominated prairies that lack the plant diversity needed to
support a wider suite of grassland birds, while PBG provides short, heavily grazed grasslands
as well as taller less disturbed areas adjacent to each other. This heterogeneity in the prairie
landscape is capable of supporting a wider range of bird species than burning alone. This
combination of habitats supplies what is needed to maintain acceptable densities of species
20
associated with tall grasslands while increasing densities of uncommon species that rely on
shorter grasslands.
Managers who wish to boost densities of GRSPs, Upland Sandpipers, Greater Prairie
Chickens, and other short-grass associated species should consider the application of PBG to
the prairies they manage but must be aware of the species that already occur on these sites
and the potential impact it might have on them. For example, species like the DICK and
HESP, which are associated with tall, dense grasslands, may have lower densities on PBG
prairies. Attention should also be paid to the size of the grazing units to ensure they are large
enough to support populations of area-sensitive species such as the Greater Prairie Chicken
who did not occur on Missouri prairies smaller than 77 ha (Winter and Faaborg 1988).
Budget limitations pressure managers to impact as many hectares as possible for the
purpose of reporting accomplishments to maximize federal aid reimbursements. The goal of
burning, grazing or managing prairies can be impacted by the bottom line. We suggest the
goal of prescribed burning and grazing be focused on enhancing biodiversity in the plant and
bird communities of the prairie ecosystem rather than on accomplishment reporting.

21
Table 1. Mixed model group for each species from Program Distance which includes the best
supported non-covariate detection function, the best covariate model from Group 1 and the
best supported models from the Habitat covariate group.
DICK Mixed Models
Name ∆AICc AICc LogL K wi
Uniform Simple Polynomial 0.00 65028.30 -32509.15 0 1.00
CV CS 1 77.58 65105.88 -32549.94 1 0.00
Study Site 91.28 65119.58 -32554.79 3 0.00
1.00
HESP Mixed Models
Name ∆AICc AICc LogL K wi
Observer 0.00 10522.92 -5252.39 7 1.00
Hazard Rate Simple Polynomial 34.20 10557.12 -5275.55 0 0.00
CV CS 1 49.94 10572.86 -5283.42 1 0.00
CV Max 51.94 10574.86 -5284.42 1 0.00
Mean Max 51.94 10574.86 -5284.42 1 0.00
Mean CS 1 51.94 10574.86 -5284.42 1 0.00
1.00
EAME Mixed Models
Name ∆AICc AICc LogL K wi
Uniform Simple Polynomial 0.00 10269.74 -5129.85 0 1.00
Study Site 11.96 10281.70 -5136.83 3 0.00
Observer 12.52 10282.26 -5133.07 7 0.00
Mean Max 16.04 10285.78 -5140.88 1 0.00
1.00
GRSP Mixed Models
Name ∆AICc AICc LogL K wi
Hazard Rate Simple Polynomial 0.00 4627.16 -2310.56 0 1.00
Observer 18.58 4645.75 -2313.71 7 0.00
Sample Year 18.84 4646.00 -2319.98 1 0.00
CV CS 1 22.92 4650.09 -2322.02 1 0.00
Mean CS 1 23.55 4650.72 -2322.34 1 0.00
CV Max 23.58 4650.75 -2322.35 1 0.00
Mean Max 23.61 4650.77 -2322.36 1 0.00
1.00
Table 2. Species richness analysis results by treatment.
Treatment Mean Std Dev
Control 17.5 3.09
PBG 20.2 2.77
22
Table 3. Species that occurred only in grazing units.
American Crow
American Robin
Black Capped chickadee
Blue Grosbeak
Eastern Bluebird
Great Blue Heron
Green Heron
Horned Lark
Killdeer
Northern Flicker
Orchard Oriole
Turkey Vulture
Upland Sandpiper
Wood Thrush
Table 4. Species that occurred frequently in the grazing units but occurred less than three
times in the control unit.
Upland Sandpiper
Horned Lark
Greater Prairie Chicken
Scissor-Tailed Flycatcher
Eastern Bluebird
Table 5. Species that occurred only in the control units.
Baltimore Oriole
Carolina Wren
Cedar Waxwing
Downy Woodpecker
Eastern Tufted Titmouse
Eastern Peewee
Red Bellied Woodpecker
23
Table 6. Species richness analysis results by variable.
Source DF Type 1 SS Mean
Square F Value Pr > F
Study Site 3 72.365 24.122 3.74 0.03
Treatment 1 44.010 44.010 6.82 0.02
Years Since Burning 2 10.688 5.344 0.83 0.46
Years Since Burning + Treatment 2 9.521 4.760 0.74 0.49

24
Map 1. Spatial location of treatment units and patch burn year at Taberville CA.
25
Map 2. Transect locations, patch number and units at Taberville CA.
26
Figure 1. Estimated density for each species by treatment.
27
Figure 2a. Dickcissel estimated density by years since burning with 95% confidence
intervals.

28
Figure 2b. Henslow’s Sparrow estimated density by years since burning with 95%
confidence intervals.
29
Figure 2c. Eastern Meadowlark estimated density by years since burning with 95%
confidence intervals.
30
Figure 2d. Grasshopper Sparrow estimated density by years since burning with 95%
confidence intervals.
31
Figure 3a. Dickcissel estimated density by years since burning plus treatment with 95%
confidence intervals.
32
Figure 3b. Henslow’s Sparrow estimated density by years since burning plus treatment
with 95% confidence intervals.

33
Figure 3c. Eastern Meadowlark estimated density by years since burning plus treatment
with 95% confidence intervals.
34
Figure 3d. Grasshopper Sparrow estimated density by years since burning plus treatment
with 95% confidence intervals.

35
Appendix A. Description and representation of a priori models based on treatment effects on
density of grassland birds in southwest Missouri.
Treatment Models
Model Model Structure
Expected
Result
DICK
Expected
Result
HESP
Expected
Result
EAME
Expected
Result
GRSP
Yrs Since Burn Bo + B1(Burn Year) + + +/- -
Grazing
Bo + B1(G vs. C) _ _ + +
Years Since
Burning and
Grazing
Bo + B1(Burn Year) +
B2 (G vs. C) +/- +/- +/- +/-
Appendix B. Total number of detections for each species, detection probabilities with SE,
and estimated densities (birds/ha) with SE at the treatment unit scale.
Species
Total
detections
Treatment
Total
detections
Control
Detection
probability
w/ SE –
Treatment
Detection
probability
w/ SE -
Control
DICK 3789 4084 .93 (.039) 1.00 (.049)
HESP 675 651 .67 (.073) .87 (.064)
EAME 909 262 .87 (.069) 1.1 (.152)
GRSP 513 53 1.12 (.111) 1.97(.874)
36
LITERATURE CITED
Axelrod, D. I. 1985. Rise of the grassland biome, central North America. The Botanical
Review 51:163-202.
Bailey, D. W., Dumont, B. Wallis DeVries M. F. 1998. Utilization of heterogeneous
grasslands by domestic herbivores: Theory to management. Annals of Zootechnology
47:321-333.
Bent, A. C. 1968. Life histories of north American cardinals, grosbeaks, buntings,
towhees, finches, sparrows and allies. Dover Publications, Inc., New York, New York.
Blankespoor, G. W. 1980. Prairie restoration: effects on nongame birds. Journal of
Wildlife Management 44:667-672.
Bock, C. E., V. A. Saab, T. D. Rich, and D. S. Dobkin. 1993. Effects of livestock grazing
on Neotropical migratory landbirds in western North America. Pages 296-309 in D. M.
Finch and P. W. Stangel, editors. Status and management of Neotropical migratory birds.
U.S.D.A. Forest Service, General Technical Report RM-229.
Briggs, J.M., Knapp, A.K., Blair, J.M., Heisler, J.L., Hoch, G.A., Lett, M.S. and
McCarron J.K. 2005.An Ecosystem in Transition: Causes and Consequences of the
Conversion of Mesic Grassland to Shrubland. Bioscience 55:243-254.
Buckland, S.T., Anderson, D. R., Burnham, K. P. and J. L. Laake. 2001. Introduction to
Distance Sampling: Estimating abundance of biological populations. Chapman and Hall,
New York.
Buckland, S. T., Anderson, D. R., Burnham, K. P., Laake, J. L., Borchers, D. L. and L.
Thomas. 2004. Advanced Distance Sampling: Estimating abundance of biological
populations. Oxford University Press Inc., New York.
Burnham, K. P., and D. R. Anderson. 2002. Model selection and multimodel inference: a
practical information-theoretic approach. Second edition. Springer-Verlag Inc., New
York, New York, U.S.A.
Burnham, K. P. and D. R. Anderson. 1998. Model selection and inference: A practical
information-theoretic approach. Springer-Verlag, New York.
Christensen, N. L. 1997. Managing for heterogeneity and complexity on dynamic
landscapes. Pages 176-185 in Pickett S.T.A., Ostfeld R.S., Shachak, M., Likens, G. E.
eds. The Ecological Basis for Conservation: Heterogeneity, Ecosystems and Biodiversity.
New York: Chapman and Hall.
Churchwell, R. T., C. A. Davis, S. D. Fuhlendorf, and D. M. Engle. 2007. Effects of
patch-burn management on Dickcissel nest success in a tallgrass prairie. Journal of
Wildlife Management 72:1596-1604.

37
Cochran, W.G. 1977. Sampling Techniques. Wiley, New York.
Cody, M. L. 1985. Habitat selection in grassland and open-country birds. Pages 191-226
in Cody, M. L. ed. Habitat Selection in Birds Orlando (FL): Academic Press.
Collins, S. L. 1987. Interaction of Disturbances in Tallgrass Prairie: A Field Experiment.
Ecology 68:1243-1250.
Coppedge, B. R., S. D. Fuhlendorf, W. C. Harrell, and D. M. Engle. 2008. Avian
community response to vegetation and structural features in grasslands managed with fire
and grazing. Biological Conservation 141:1196-1203.
Coppedge, B. R., Engle D. M., Toepfer, C. S. and J. H. Shaw 1998a. Effects of seasonal
fire, bison grazing, and climatic variation on tallgrass prairie vegetation. Plant Ecology
139:235-246.
Coppedge, B. R., Leslie Jr., D. M. and J. H. Shaw 1998b. Botanical composition of bison
diets on tallgrass prairie in Oklahoma. J. Range Management 51:379-382.
Davis, D. E. 1981. Summarizing remarks: Observer variability. Studies in Avian Biology
6:390.
Diefenbach, D. R., Brauning, D. W. and J. A. Mattice. 2003. Variability in grassland bird
counts related to observer differences and species detection rates. The Auk 120:1168-
1179.
Faanes, C. A. and D. Bystrak. 1981. The role of observer bias in the North American
breeding bird survey. Studies in Avian Biology 6:353-359.
Fahnestock J. T. and Knapp A. K. 1994. Plant responses to selective grazing by bison:
interactions between light, herbivory, and water stress. Vegetatio 115:123-131.
Fuhlendorf, S. D., and D. M. Engle. 2001. Restoring Heterogeneity on Rangelands:
Ecosystem Management Based on Evolutionary Grazing Patterns. BioScience 51:625-
632.
Fuhlendorf, S. D., W. C. Harrell, D. M. Engle, R. G. Hamilton, C. A. Davis, and D. M.
Leslie, Jr. 2006. Should heterogeneity be the basis for conservation? Grassland bird
response to fire and grazing. Ecological Applications 16:1706-1716.
Hartnett, D. C., Hickman K. R. and F. L. Fischer-Walter 1996. Effects of bison grazing,
fire and topography on floristic diversity in tallgrass prairie. J. Range Management
49:413-420.
38
Hartnett, D. C., Stetuer, A. A. and K. R. Hickman 1997. Comparative ecology of native
versus introduced ungulates. Ppg 72-101 in Ecology and Conservation of Great Plains
Vertebrates. Knopf and Sampson eds. New York Spring-Verlag.
Herkert, J. R. 1994. Status and habitat selection of the Henslow’s Sparrow in Illinois.
Wilson Bulletin 106:35-45.
Holecheck, J. L., R.D. Pieper and C. H. Herbel. 1998. Range management principles and
practices. Upper Saddle River (NJ). Prentice Hall.
Johnson, Douglas H., Lawrence D. Igl, and Jill A. Dechant Shaffer (Series
Coordinators). 2004. Effects of management practices on grassland birds. Northern
Prairie Wildlife Research Center, Jamestown, ND. Jamestown, ND: Northern Prairie
Wildlife Research Center
http://www.npwrc.usgs.gov/resource/literatr/grasbird/grasbird.htm
(Version 12AUG2004).
Kay, C. E. 1998. Are ecosystems structured from the top-down or bottom-up? A new
look at an old debate. Wildlife Society bulletin 26:484-494.
Knapp, A. K., Blair J. M., Briggs J. M., Collins S. L., Hartnett, D. C., Johnson L. C. and
E. G. Towne. 1999. The keystone Role of bison in North American tallgrass prairie.
BioScience 49:39-50.
Knopf, F. L. 1994. Avian assemblages on altered grasslands. Studies in Avian Biology
15: 247-257.
Kurz, D. Editor 2003. Public Prairies of Missouri. Missouri Dept. of Conservation.
48ppg.
Leach, M. K. and T. J. Givnish 1996. Science 273:1555-1561.
Missouri Department of Conservation. Missouri Fish and Wildlife Information System.
June 24, 2009. http://mdc4.mdc.mo.gov/applications/mofwis/Mofwis_Search1.aspx
Nelson, P.W. 2005. The terrestrial natural communities of Missouri. Revised Edition.
Missouri Natural Areas Committee. 550 pages.
Ostfeld, R. S., Pickett S. T. A., Shachak, M. and Likens G. E. 1997. Defining scientific
issues. Pages 3-10 in Pickett S.T.A., Ostfeld R.S., Shachak M., Likens, G. E. eds. The
Ecological Basis for Conservation: Heterogeneity, Ecosystems and Biodiversity. New
York: Chapman and Hall.
Overmire, T. G. 1963. The effects of grazing upon habitat utilization of the Dickcissel
(Spiza americana) and Bell’s Vireo (Vireo bellii) in north central Oklahoma. Ph.D.
dissertation. Oklahoma State University, Stillwater, Oklahoma. 57 pages.

39
Powell, A. F. L. A. 2006. Effects of prescribed burns and Bison (Bos bison) grazing on
breeding bird abundances in tallgrass prairie. The Auk 123:183-197.
Ralph, C. J., Droege S. and J. R. Sauer 1995. Managing and Monitoring Birds Using
Point Counts: Standards and Applications. USDA Forest Service Technical Report PSW-
GTR-149:161-169.
Rohrbaugh Jr., R. W., D. L. Reinking, D. H. Wolfe, S. K. Sherrod, and M. A. Jenkins.
1999. Effects of prescribed burning and grazing on nesting and reproductive success of
three grassland passerine species in tallgrass prairie. Studies in Avian Biology 19:165-
170.
Roseberry, J. L. and W. D. Klimstra. 1970. The nesting ecology and reproductive
performance of the Eastern Meadowlark. Wilson Bulletin 82:243-267.
Rosenstock, S. S., Anderson, D. R., Giesen, K. M., Leukering, T. and M. F. Carter. 2002.
Landbird counting techniques: Current practices and an alternative. The Auk 119:46-53.
Ryan, M. R., R. A. Pierce, III, K. M. Suedkamp-Wells, and C. K. Kerns. 2003. Assessing
bird population responses to grazing. In W. Hohman, editor. Migratory bird responses to
grazing. USDA, Natural Resources Conservation Service, Washington D.C.
Sampson, F. and F. Knopf 1994. Prairie conservation in North America. BioScience
44:418-421.
SAS Institute Inc., 2000-2004. Release: SAS 9.1.3 Edition. SAS Institute,
Cary, N. C.
Skinner, R. M., T. S. Baskett, and M. D. Blendon. 1984. Bird habitat on Missouri
prairies.Terrestrial Series 14. Missouri Department of Conservation, Jefferson City,
Missouri. 37 pages.
Swengel, S. R. 1996. Management responses of three species of declining sparrows in
tallgrass prairie. Bird Conservation International 6:241-253.
Thomas, L., J. L. Lake, S. Strindberg, F. F. C. Marques, S. T. Buckland, D. L. Borchers,
D. R. Anderson, K. P. Burnham, S. L. Hedley, J. H. Pollard, J. R. B. Bishop, and T.A.
Marques. 2005. Distance 5.0 Release 2, in Research Unit for Wildlife Population
Assessment, University of St. Andrews, UK.
Vickery, P. D. 1996. Grasshopper Sparrow (Ammodramus savannarum). In A. Poole and
F. Gill, editors. The birds of North America, 239. The Academy of Natural Sciences,
Philadelphia, Pennsylvania; The American Ornithologists’ Union, Washington, D. C.

40
Walk, J. W. and R. E. Warner. 2000. Grassland management for the conservation of
songbirds in the Midwestern USA. Biological Conservation 94:165-172.
Wiens, J. A. 1969. An approach to the study of ecological relationships among grassland
birds. Ornithological Monographs 8.
Wiens, J. A. 1973. Pattern and process in grassland bird communities. Ecological
Monographs 43:237-270.
Wiens, J. A. 1974. Habitat heterogeneity and avian community structure in North
American grassland birds. American Midland Naturalist. 91:195-213.
Wiens, J. A. 1997. The emerging role of patchiness in conservation biology. Pages 93-
107 in Pickett S.T.A., Ostfeld R.S., Shachak M., Likens, G. E. eds. The Ecological Basis
for Conservation: Heterogeneity, Ecosystems and Biodiversity. New York: Chapman and
Hall.
Winter, M. 1998. Effect of habitat fragmentation on grassland-nesting birds in
southwestern Missouri. Ph.D. dissertation. University of Missouri, Columbia, Missouri.
215 pages.
Winter, M. and J. Faaborg. 1998. Patterns of area sensitivity in grassland-nesting birds.
Conservation Biology 13:1424-1436.
Zimmerman, J. L. 1992. Density-independent factors affecting the avian diversity of the
tallgrass prairie community. Wilson Bulletin 104:85-94.
Zimmerman, J. L. 1993. The birds of Konza: the avian ecology of the tallgrass prairie.
University of Kansas Press, Lawrence, Kansas. 186 pages.