Embed Size (px)
Citation preview
Volume 2021, 1-19 | Article ID : IJETS-2106272112359
International Journal of Engineering & Technology Sciences
Journal homepage: http://htpub.org/International-Journal-Of-Engineering-&-
Technology-Sciences/
ISSN 2289-4152
Evaluation of Organizations Agility Using ANP FUZZY and Fuzzy
VIKOR Method Case Study: Amol Dairy Companies
Ahmad Bathaei*a, Siti Rahmah Awanga, Tahir Ahmadb
a Azman Hashim International Business School, Universiti Teknologi Malaysia (UTM), Skudai 81310, Johor, Malaysia b Department of Mathematical Sciences, Faculty of Science, Universiti Teknologi Malaysia, 81310 Skudai, Johor, Malaysia
Article
Abstract
Article history: Received: 1st June 2021 Received in revised form: 20th June 2021 Accepted: 28th June 2021
Recently, most organizations forced to quit the competition, because they cannot compete with the environment, and they are not responsible to customers. Most of them forced to find a new strategy to reserve. In Iran, many companies are working in Dairy products, most of them want to be more successful in this field but they cannot participate in the competition. Therefore, they need strategies to fix this problem, Agility organization is one of the strategies to help companies stay in the competition. Companies should be agile to stay in the competition, and they can use agile correctors and abilities. In this research agile model designed by reliable research results and experts' recommendations whit using the Fuzzy ANP which they were working on the respective companies. After finding proper factors, this research sort these companies from an agility point of view whit using the Fuzzy TOPSIS Method. The results of this study show the best factors that can help Dairy companies’ to be agile. In addition, these companies ranked based on agility.
Keywords: Multi-Criteria Decision making, Dairy companies, Agility, Agile Factors
1. Introduction
Agility, in the embrace of change, is aggressive and developmental. Agility seeks success in profit,
market share and gaining customers in competitive markets that many companies are afraid to enter
because they are turbulent centers. Ultimate agility is not assumed and there are no defects that the
company or individual has reached the ultimate agility and completed it. Agility is constantly changing
the performance of personnel and organization, the value of products and services, and constant
changes in the opportunities of recruitment. The customer pays attention and requires constant
readiness to face fundamental and superficial changes, and agile companies are always ready to learn
anything new that will increase the profitability of taking advantage of new opportunities [1].
An agile organization and processes to meet customer needs with advanced technology to provide
high quality products and services in a relatively short time together. Agility organization's ability to
Ahmad Bathaei et al., IJETS, Vol. (2021), Article ID: IJETS-2106272112359, 19 pages
provide high quality goods and services increases, so it is important to increase the competitiveness of
the organization [2].
This study shows good agility for companies like Amul Dairy, Haraz, Gela and Kallh is. Since the
company's products in the field of dairy products and various products for our customers interesting
and because of market competition between companies in these types of products, so the company
should measure the factors and the agility to identify. So in this study tried to identify the factors and
criteria and provide a way to measure the agility of the organization and the agility of the company
compared to each other.
2. Definition of Agility
Agility is defined as the ability to thrive in environments that are constantly changing and
unpredictable. In this regard, organizations should not be afraid of and avoid changes in their work
environment, but should see change as an opportunity to gain a competitive advantage in the market
environment. Since 1991, the term agility has been used for the first time. Agility means the ability to
respond quickly and successfully to clean changes in the environment [3].
3. Organization’s Agility
It is an organization that has the ability to respond to unforeseen and unexpected changes in
appropriate ways and at the right time, as well as to take advantage of change and gain the benefits of
change as opportunities. An agile organization must be able to recognize environmental changes and
view them as factors in growth and prosperity [4].
Every organization needs planned changes, which is a regular step towards restructuring the
organization in a way that can adapt to the changing conditions of its external environment and
achieve new goals. So this is difficult and sometimes costly, but such changes are important because
they help the organization adapt to changes that occur in the organization and the environment that
will threaten its survival. Because the dynamism and continuity of the movement of organizations
depends on these changes and the necessary flexibility in each of the operations based on the goals of
the organization. Another important point is that change and its method is very important, which
means that if a method is successful in time and place and can not be successful in another nation and
country. Therefore, all models of change should be used with in-depth study of the organization and
society, so that the full potential of the country and society, and especially the efficient and specialized
forces in management can be used optimally, and this is effective in terms of effort and cooperation,
even if Cases of failure. It is also important to note that if change is accompanied by proper
management, it can be used positively for the organization, but if the manager does not have the ability
Ahmad Bathaei et al., IJETS, Vol. (2021), Article ID: IJETS-2106272112359, 19 pages
to deal properly with change, change will become a crisis that can Some can even lead to
organizational failure. Top executives also need to change their perspective when faced with complex
situations and changes. Just as Edison had changed his mindset more than anything else when he
invented electricity. For this reason, he never spent his time improving the performance of the candle,
because he knew he had to devise a new plan. Organizational change is a continuous process of
experimentation and adaptation that adapts the organization's capabilities to the needs of today's
dynamic and uncertain environment. Information gathering, communication and organizational
learning are key elements of this process. Because learning acts as a catalyst.
On the other hand, one of the principles of agility is training and learning organization. In addition, the
main driving force of agility is change. As can be seen and according to the above, there is a correlation
between change with agility and organizational learning as well as learning with organizational agility.
Although these concepts have been related to commercial and manufacturing organizations in the
past, they can also be used in the service sector. And will gradually expand in this area. Therefore,
regardless of the type of change, this article introduces auxiliary tools to make useful changes, use
opportunities, adapt to change, and so on. Tools that can help the health system to cope with
environmental changes and make changes to improve the situation, better access to health system
goals and meet customer needs are organizational agility and learning are two important factors that
Enable the manager to deal with change more accurately, quickly and effectively [3].
2- Literature review
From the late 1980s to the mid-1990s, following extensive economic and political
developments, many measures were taken in the field of new global business systems. The
United States took the helm of the movement when it saw a significant downturn in global
business, especially in manufacturing. In 1991, a group of industry experts observed that the
rate of change in the business environment was faster than the ability of traditional
manufacturing organizations to adapt.
These organizations were unable to take advantage of the opportunities that were
offered to them, and this inability to adapt to changing conditions could lead to their
bankruptcy and failure in the long run. Thus, for the first time, a new paradigm was published
by the Yakuka Institute in a report entitled The Enterprise Strategy of the 21st Century: The
Perspective of Industrial Experts. Immediately, the term agile manufacturing became
commonly used with the publication of this report.
To supplement the above, in 1991, the US Navy-sponsored Layhae University, together
with the Yakoka Institute, conducted studies on 13 major manufacturing organizations,
including General Motors, General Electric, and I.A M, Texas Instrument and… did. The
purpose of this study was to answer the question of what will be the characteristics of
successful organizations in the years of the 21st century. Since then, more than 100 other
Ahmad Bathaei et al., IJETS, Vol. (2021), Article ID: IJETS-2106272112359, 19 pages
organizations have been studied, and in 1991 the study was dubbed the Study of
Manufacturing Companies in the 21st Century, and later in 1995, the results of a study in
Steven Goldman, Nigel, and Press: Agile competitors and virtual organizations were released
Research method
In order to choose the best factors in assessing and evaluating research papers agility
agility and the introduction of various factors, including management responsibility, agility,
production management, IT agility, agility and agile workforce strategy. Technology,
customers, partnerships with companies, external factors such as weather, economy,
shareholders, government, competitors [15] Process, information, technology, production
management and production strategy, staff, organization, resources and environmental
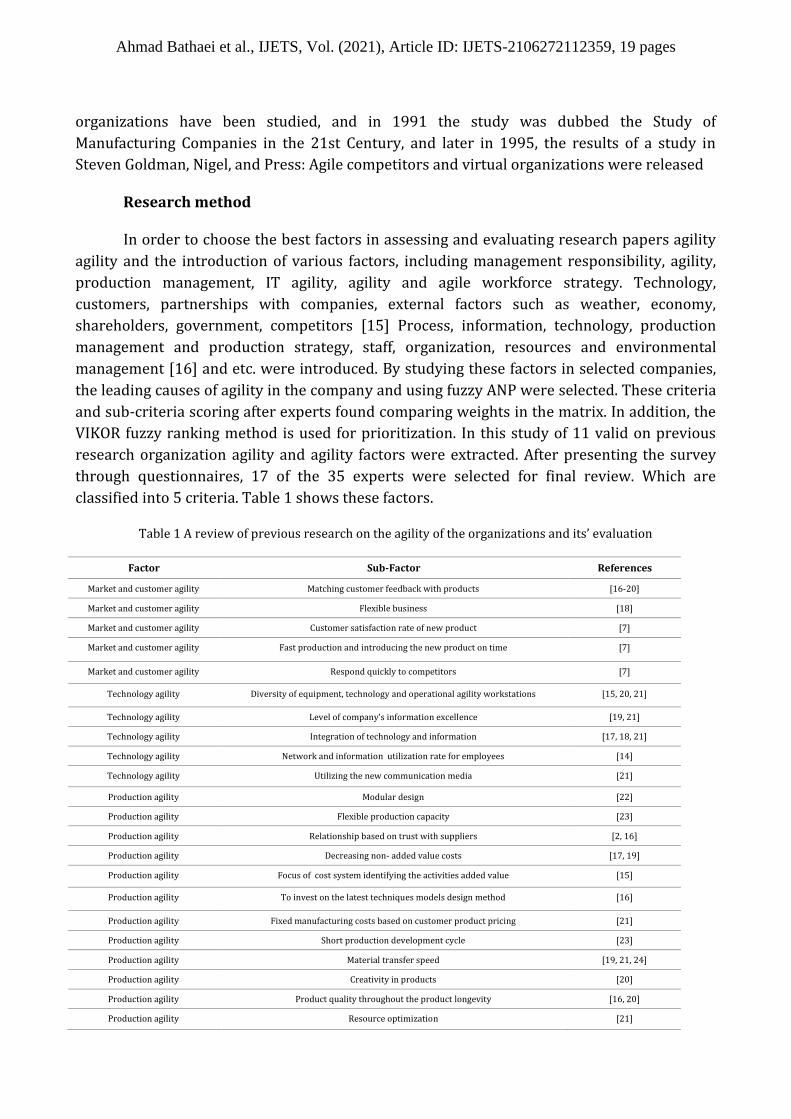
management [16] and etc. were introduced. By studying these factors in selected companies,
the leading causes of agility in the company and using fuzzy ANP were selected. These criteria
and sub-criteria scoring after experts found comparing weights in the matrix. In addition, the
VIKOR fuzzy ranking method is used for prioritization. In this study of 11 valid on previous
research organization agility and agility factors were extracted. After presenting the survey
through questionnaires, 17 of the 35 experts were selected for final review. Which are
classified into 5 criteria. Table 1 shows these factors.
Table 1 A review of previous research on the agility of the organizations and its’ evaluation
Factor Sub-Factor References
Market and customer agility Matching customer feedback with products [16-20]
Market and customer agility Flexible business [18]
Market and customer agility Customer satisfaction rate of new product [7]
Market and customer agility Fast production and introducing the new product on time [7]
Market and customer agility Respond quickly to competitors [7]
Technology agility Diversity of equipment, technology and operational agility workstations [15, 20, 21]
Technology agility Level of company’s information excellence [19, 21]
Technology agility Integration of technology and information [17, 18, 21]
Technology agility Network and information utilization rate for employees [14]
Technology agility Utilizing the new communication media [21]
Production agility Modular design [22]
Production agility Flexible production capacity [23]
Production agility Relationship based on trust with suppliers [2, 16]
Production agility Decreasing non- added value costs [17, 19]
Production agility Focus of cost system identifying the activities added value [15]
Production agility To invest on the latest techniques models design method [16]
Production agility Fixed manufacturing costs based on customer product pricing [21]
Production agility Short production development cycle [23]
Production agility Material transfer speed [19, 21, 24]
Production agility Creativity in products [20]
Production agility Product quality throughout the product longevity [16, 20]
Production agility Resource optimization [21]
Ahmad Bathaei et al., IJETS, Vol. (2021), Article ID: IJETS-2106272112359, 19 pages
Production agility Cope with the change [25]
Production agility Regarding quality standards in production of new products [7]
Management agility Hierarchy organizational chart beds [2, 16]
Management agility Delegating management [17, 19]
Management agility Management’s interest in full automation [22]
Management agility Management’s Interest to deliver new models [15]
Management agility Promoting a culture of transformation and modernization [16]
Workforce agility New and existing employees’ enthusiasm toward Learning and training [21]
Workforce agility Team work [23]
Workforce agility Institutionalizing staff design proposals [19, 21, 24]
Workforce agility Multi-skilled and flexible Staff [20]
Workforce agility Collaboration interface [16, 20]
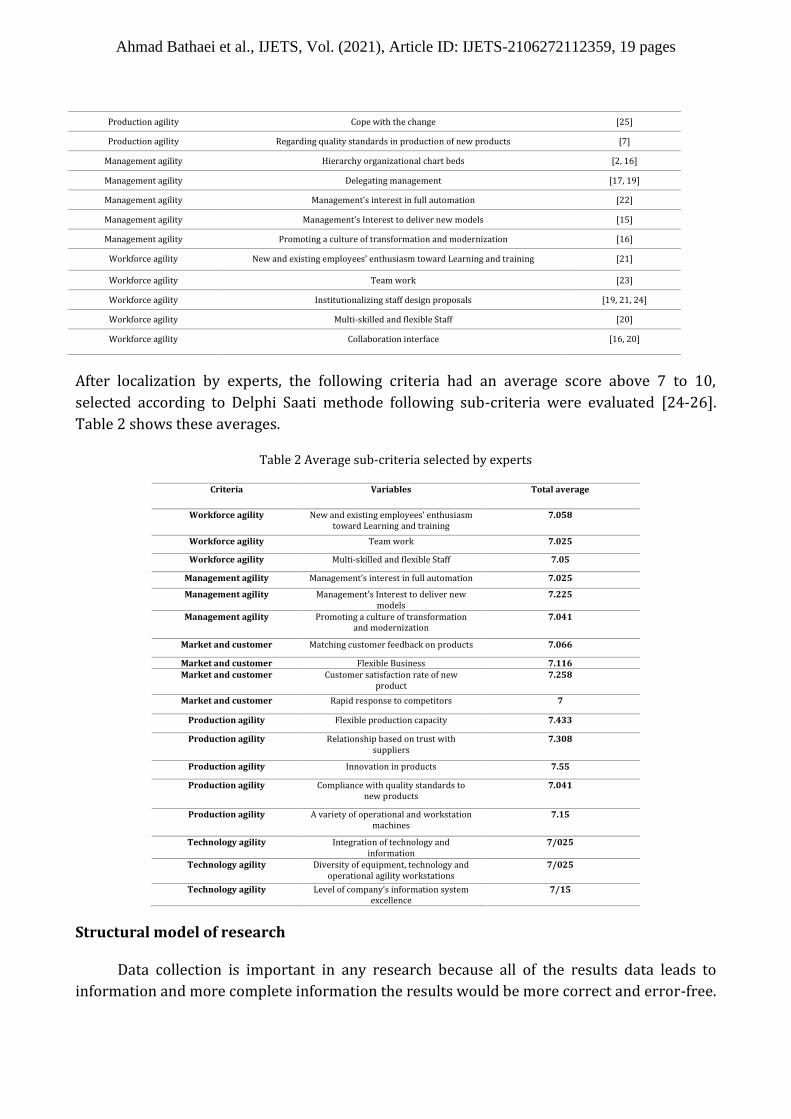
After localization by experts, the following criteria had an average score above 7 to 10,
selected according to Delphi Saati methode following sub-criteria were evaluated [24-26].
Table 2 shows these averages.
Table 2 Average sub-criteria selected by experts
Criteria Variables Total average
Workforce agility New and existing employees’ enthusiasm toward Learning and training
7.058
Workforce agility Team work 7.025
Workforce agility Multi-skilled and flexible Staff 7.05
Management agility Management’s interest in full automation 7.025
Management agility Management’s Interest to deliver new models
7.225
Management agility Promoting a culture of transformation and modernization
7.041
Market and customer Matching customer feedback on products 7.066
Market and customer Flexible Business 7.116 Market and customer Customer satisfaction rate of new
product 7.258
Market and customer Rapid response to competitors 7
Production agility Flexible production capacity 7.433
Production agility Relationship based on trust with suppliers
7.308
Production agility Innovation in products 7.55
Production agility Compliance with quality standards to new products
7.041
Production agility A variety of operational and workstation machines
7.15
Technology agility Integration of technology and information
7/025
Technology agility Diversity of equipment, technology and operational agility workstations
7/025
Technology agility Level of company’s information system excellence
7/15
Structural model of research
Data collection is important in any research because all of the results data leads to
information and more complete information the results would be more correct and error-free.
Ahmad Bathaei et al., IJETS, Vol. (2021), Article ID: IJETS-2106272112359, 19 pages
Therefore, the information gathered about the criteria, sub-criteria are all collected from
credible sources.
Also the research model is the result of experts’ opinions. To collect the data from the selected
companies 3 separate questionnaire was prepared and filled by the participating specialists of
the companies to have high credibility. The first questionnaire investigates and selects the
studied sub-criteria. The experts were asked to give the score of one to ten
(from lowest to highest Importance) to sub-criteria and 17 sub-criteria from 35 sub-criteria
were finally assessed. In the second questionnaire Paired comparisons were made between
sub-criteria and criteria, since the research was to compare fuzzy criteria, Nine hour fuzzy
spectrum was used. were used that are preferably the same, interstitial, less preferred, in
between, very little, Intermediate, very high priority, and very little in between. In the third
questionnaire after certain criteria and sub-criteria optimization
Companies were evaluated on their environment with a list of seven degrees to evaluate the
options. Spectrum seven with language Variables such as very weak, weak, weak to moderate,
moderate, relatively good, good, very good which were used for the evaluation of criteria and
sub-criteria within the company.
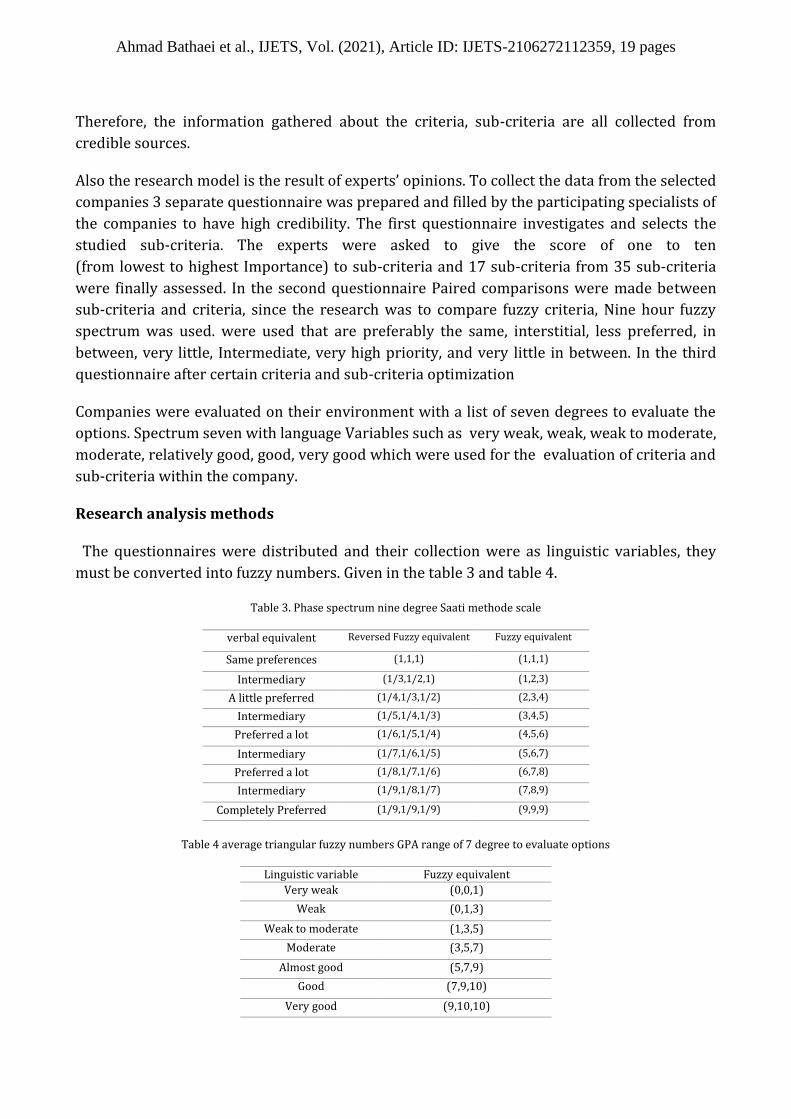
Research analysis methods
The questionnaires were distributed and their collection were as linguistic variables, they
must be converted into fuzzy numbers. Given in the table 3 and table 4.
Table 3. Phase spectrum nine degree Saati methode scale
Fuzzy equivalent Reversed Fuzzy equivalent verbal equivalent
(1,1,1) (1,1,1) Same preferences
(1,2,3) (1/3,1/2,1) Intermediary
(2,3,4) (1/4,1/3,1/2) A little preferred
(3,4,5) (1/5,1/4,1/3) Intermediary
(4,5,6) (1/6,1/5,1/4) Preferred a lot
(5,6,7) (1/7,1/6,1/5) Intermediary
(6,7,8) (1/8,1/7,1/6) Preferred a lot
(7,8,9) (1/9,1/8,1/7) Intermediary
(9,9,9) (1/9,1/9,1/9) Completely Preferred
Table 4 average triangular fuzzy numbers GPA range of 7 degree to evaluate options
Fuzzy equivalent Linguistic variable
(0,0,1) Very weak
(0,1,3) Weak
(1,3,5) Weak to moderate
(3,5,7) Moderate
(5,7,9) Almost good
(7,9,10) Good
(9,10,10) Very good
Ahmad Bathaei et al., IJETS, Vol. (2021), Article ID: IJETS-2106272112359, 19 pages
3-1- Summary of experts’ opinion
Phase average method is used for summing up the experts opinions.
Equation 1:
Equation 2:
For certain building Fuzzy numbers district center methods is used. And its’ assessment for
triangular fuzzy number M= (a, b, c) is as follows:
Equation3:
𝐶𝐴 =(𝑐 − 𝑎) + (𝑏 − 𝑎)
3+ 𝑎
M is the district center of the triangular number
3-2- Network compatibility level analysis
Vinod et al. 2011 [27] introduced a method for calculating the fuzzy pairwise comparison
matrices level and compatibility. In this way, from each pairwise comparison matrices An,n
two separate matrices Am and Ag are made, and it is necessary to verify compatibility. Am is
achieved from median values of each expert preferences of the (median values of triangular
fuzzy numbers). [Am =aijm] the second matric is (Ag) which is made from the geometric mean
of the upper and lower limit of triangular fuzzy numbers.
Equation 4:
𝑤𝑚 = [𝑤𝑖𝑚] 𝑤ℎ𝑒𝑟𝑒 𝑤𝑖
𝑚 =1
𝑛∑
𝑎𝑖𝑗𝑚
∑ 𝑎𝑖𝑗𝑚𝑚𝑖=1
𝑛
𝑖=1
Equation 5:
Ahmad Bathaei et al., IJETS, Vol. (2021), Article ID: IJETS-2106272112359, 19 pages
𝑤𝑔 = [𝑤𝑖𝑔
] 𝑤ℎ𝑒𝑟𝑒 𝑤𝑖𝑔 =
1
𝑛∑
√𝑎𝑖𝑗𝑢. 𝑎𝑖𝑗𝑖
∑ √𝑎𝑖𝑗𝑢. 𝑎𝑖𝑗𝑖
𝑚𝑖=1
𝑛
𝑖=1
N is matric dimension. (λmax) the biggest special value is calculated for each of the matrix
from the following relationship:
Equation 6:
Equation 7:
λ𝑚𝑎𝑥𝑔 =
1
𝑛∑ ∑ √𝑎𝑖𝑗𝑢
. 𝑎𝑖𝑗𝑙(𝑤𝑗
𝑔
𝑤𝑖𝑔⁄
𝑛
𝑖=1
𝑛
𝑖=1
)
According to the Saati method, the index of compatibility (CI) which shows the deviation from
full compatibility, is calculated as follows:
Equation 8:
𝐶𝐼𝑚 =(λ𝑚𝑎𝑥
𝑚 − 𝑛)
(𝑛 − 1)
Equation 9:
𝐶𝐼𝑔 =(λ𝑚𝑎𝑥
𝑔 − 𝑛)
(𝑛 − 1)
Equation 10:
𝐶𝑅 =𝐶𝐼
𝑅𝐼
To calculate the compatibility rate CR=CI / RI random parameters of Rm and Rg. If both (CRm
and CRg compatibility rate) each paired comparison matrix is bigger than 0.1. It should be
requested from the expert to reconsider his/her preferences.
Sub-criteria are the results of library studies in the selection process, and the excel software
was used for the selection of sub-criteria and scoring by experts and the fuzzy processes,
making certain and making Super matrices of network analysis process and VIKOR ranking. In
addition, for the final weighting of super matrix in the network analysis process MATLAB
software was used.
4- Results
Ahmad Bathaei et al., IJETS, Vol. (2021), Article ID: IJETS-2106272112359, 19 pages
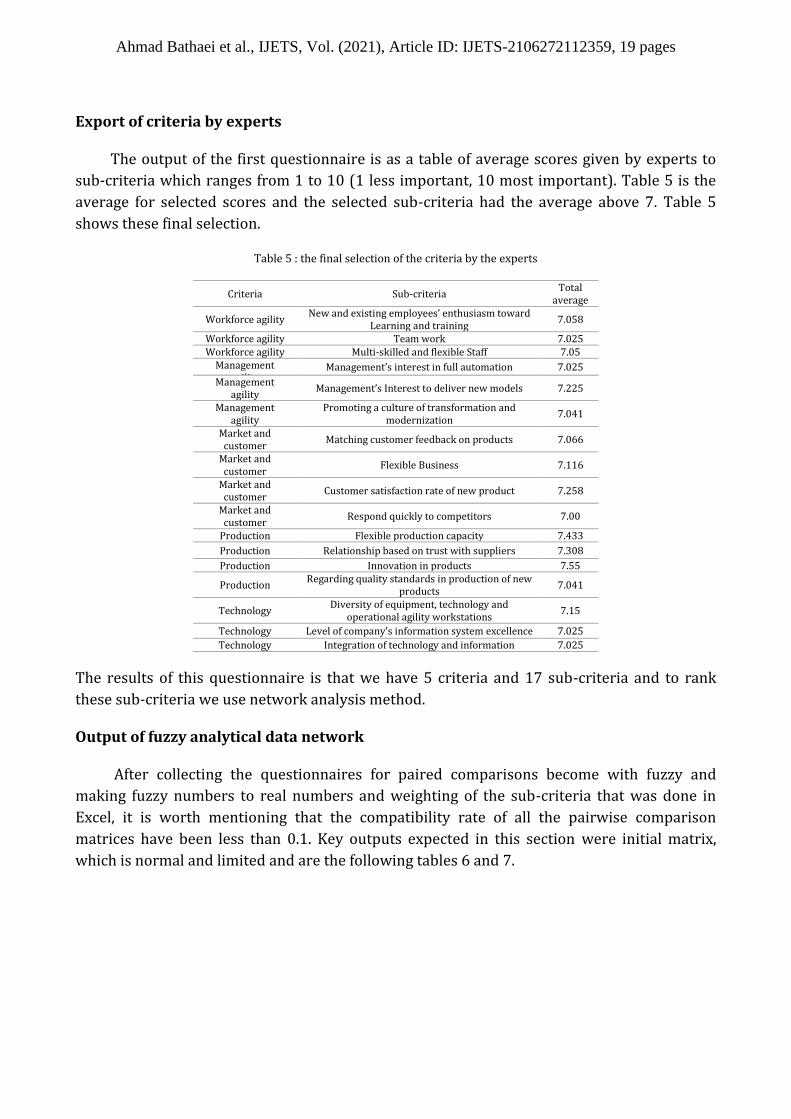
Export of criteria by experts
The output of the first questionnaire is as a table of average scores given by experts to
sub-criteria which ranges from 1 to 10 (1 less important, 10 most important). Table 5 is the
average for selected scores and the selected sub-criteria had the average above 7. Table 5
shows these final selection.
Table 5 : the final selection of the criteria by the experts
Total average
Sub-criteria Criteria
7.058 New and existing employees’ enthusiasm toward
Learning and training Workforce agility
7.025 Team work Workforce agility 7.05 Multi-skilled and flexible Staff Workforce agility
7.025 Management’s interest in full automation Management agility
7.225 Management’s Interest to deliver new models Management
agility
7.041 Promoting a culture of transformation and
modernization
Management agility
7.066 Matching customer feedback on products Market and
customer
7.116 Flexible Business Market and
customer
7.258 Customer satisfaction rate of new product Market and
customer
7.00 Respond quickly to competitors Market and
customer 7.433 Flexible production capacity Production
7.308 Relationship based on trust with suppliers Production
7.55 Innovation in products Production
7.041 Regarding quality standards in production of new
products Production
7.15 Diversity of equipment, technology and
operational agility workstations Technology
7.025 Level of company’s information system excellence Technology
7.025 Integration of technology and information Technology
The results of this questionnaire is that we have 5 criteria and 17 sub-criteria and to rank
these sub-criteria we use network analysis method.
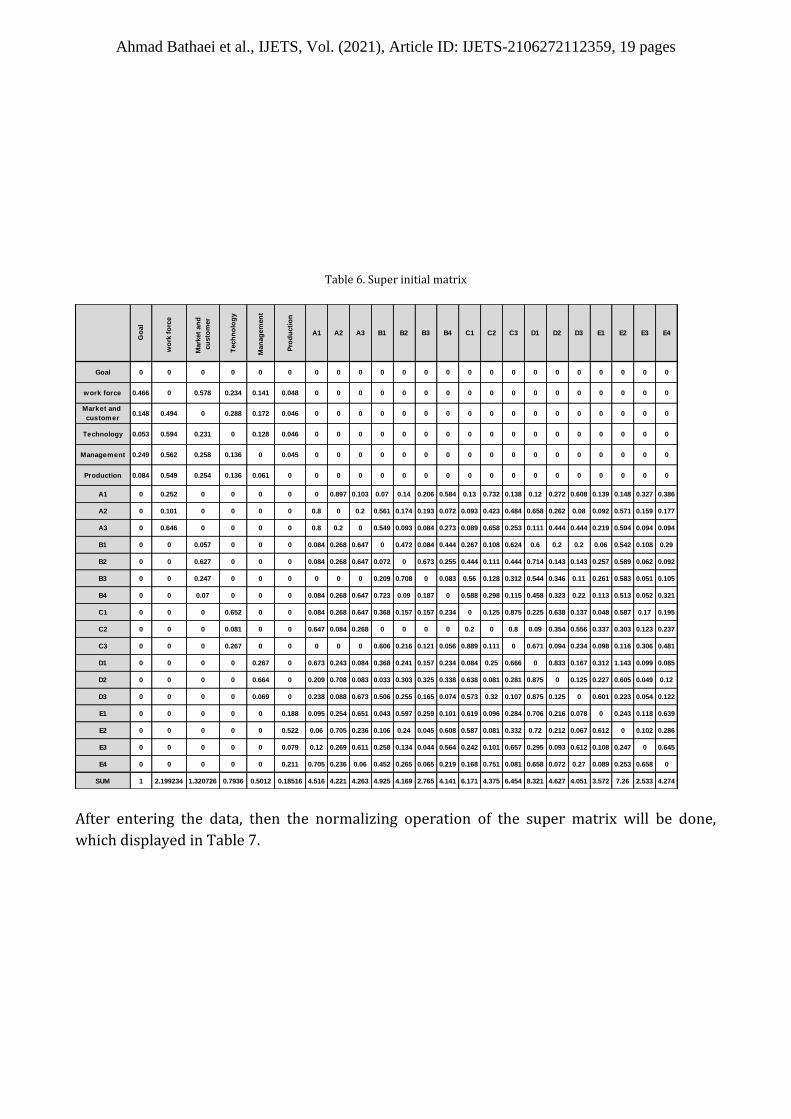
Output of fuzzy analytical data network
After collecting the questionnaires for paired comparisons become with fuzzy and
making fuzzy numbers to real numbers and weighting of the sub-criteria that was done in
Excel, it is worth mentioning that the compatibility rate of all the pairwise comparison
matrices have been less than 0.1. Key outputs expected in this section were initial matrix,
which is normal and limited and are the following tables 6 and 7.
Ahmad Bathaei et al., IJETS, Vol. (2021), Article ID: IJETS-2106272112359, 19 pages
Table 6. Super initial matrix
After entering the data, then the normalizing operation of the super matrix will be done,
which displayed in Table 7.
Go
al
wo
rk f
orc
e
Mark
et
an
d
cu
sto
mer
Tech
no
log
y
Man
ag
em
en
t
Pro
du
cti
on
A1 A2 A3 B1 B2 B3 B4 C1 C2 C3 D1 D2 D3 E1 E2 E3 E4
Goal 0 0 0 0 0 0 0 0 0 0 0 0 0 0 0 0 0 0 0 0 0 0 0
work force 0.466 0 0.578 0.234 0.141 0.048 0 0 0 0 0 0 0 0 0 0 0 0 0 0 0 0 0
Market and
customer0.148 0.494 0 0.288 0.172 0.046 0 0 0 0 0 0 0 0 0 0 0 0 0 0 0 0 0
Technology 0.053 0.594 0.231 0 0.128 0.046 0 0 0 0 0 0 0 0 0 0 0 0 0 0 0 0 0
Management 0.249 0.562 0.258 0.136 0 0.045 0 0 0 0 0 0 0 0 0 0 0 0 0 0 0 0 0
Production 0.084 0.549 0.254 0.136 0.061 0 0 0 0 0 0 0 0 0 0 0 0 0 0 0 0 0 0
A1 0 0.252 0 0 0 0 0 0.897 0.103 0.07 0.14 0.206 0.584 0.13 0.732 0.138 0.12 0.272 0.608 0.139 0.148 0.327 0.386
A2 0 0.101 0 0 0 0 0.8 0 0.2 0.561 0.174 0.193 0.072 0.093 0.423 0.484 0.658 0.262 0.08 0.092 0.571 0.159 0.177
A3 0 0.646 0 0 0 0 0.8 0.2 0 0.549 0.093 0.084 0.273 0.089 0.658 0.253 0.111 0.444 0.444 0.219 0.594 0.094 0.094
B1 0 0 0.057 0 0 0 0.084 0.268 0.647 0 0.472 0.084 0.444 0.267 0.108 0.624 0.6 0.2 0.2 0.06 0.542 0.108 0.29
B2 0 0 0.627 0 0 0 0.084 0.268 0.647 0.072 0 0.673 0.255 0.444 0.111 0.444 0.714 0.143 0.143 0.257 0.589 0.062 0.092
B3 0 0 0.247 0 0 0 0 0 0 0.209 0.708 0 0.083 0.56 0.128 0.312 0.544 0.346 0.11 0.261 0.583 0.051 0.105
B4 0 0 0.07 0 0 0 0.084 0.268 0.647 0.723 0.09 0.187 0 0.588 0.298 0.115 0.458 0.323 0.22 0.113 0.513 0.052 0.321
C1 0 0 0 0.652 0 0 0.084 0.268 0.647 0.368 0.157 0.157 0.234 0 0.125 0.875 0.225 0.638 0.137 0.048 0.587 0.17 0.195
C2 0 0 0 0.081 0 0 0.647 0.084 0.268 0 0 0 0 0.2 0 0.8 0.09 0.354 0.556 0.337 0.303 0.123 0.237
C3 0 0 0 0.267 0 0 0 0 0 0.606 0.216 0.121 0.056 0.889 0.111 0 0.671 0.094 0.234 0.098 0.116 0.306 0.481
D1 0 0 0 0 0.267 0 0.673 0.243 0.084 0.368 0.241 0.157 0.234 0.084 0.25 0.666 0 0.833 0.167 0.312 1.143 0.099 0.085
D2 0 0 0 0 0.664 0 0.209 0.708 0.083 0.033 0.303 0.325 0.338 0.638 0.081 0.281 0.875 0 0.125 0.227 0.605 0.049 0.12
D3 0 0 0 0 0.069 0 0.238 0.088 0.673 0.506 0.255 0.165 0.074 0.573 0.32 0.107 0.875 0.125 0 0.601 0.223 0.054 0.122
E1 0 0 0 0 0 0.188 0.095 0.254 0.651 0.043 0.597 0.259 0.101 0.619 0.096 0.284 0.706 0.216 0.078 0 0.243 0.118 0.639
E2 0 0 0 0 0 0.522 0.06 0.705 0.236 0.106 0.24 0.045 0.608 0.587 0.081 0.332 0.72 0.212 0.067 0.612 0 0.102 0.286
E3 0 0 0 0 0 0.079 0.12 0.269 0.611 0.258 0.134 0.044 0.564 0.242 0.101 0.657 0.295 0.093 0.612 0.108 0.247 0 0.645
E4 0 0 0 0 0 0.211 0.705 0.236 0.06 0.452 0.265 0.065 0.219 0.168 0.751 0.081 0.658 0.072 0.27 0.089 0.253 0.658 0
SUM 1 2.199234 1.320726 0.7936 0.5012 0.18516 4.516 4.221 4.263 4.925 4.169 2.765 4.141 6.171 4.375 6.454 8.321 4.627 4.051 3.572 7.26 2.533 4.274
Ahmad Bathaei et al., IJETS, Vol. (2021), Article ID: IJETS-2106272112359, 19 pages
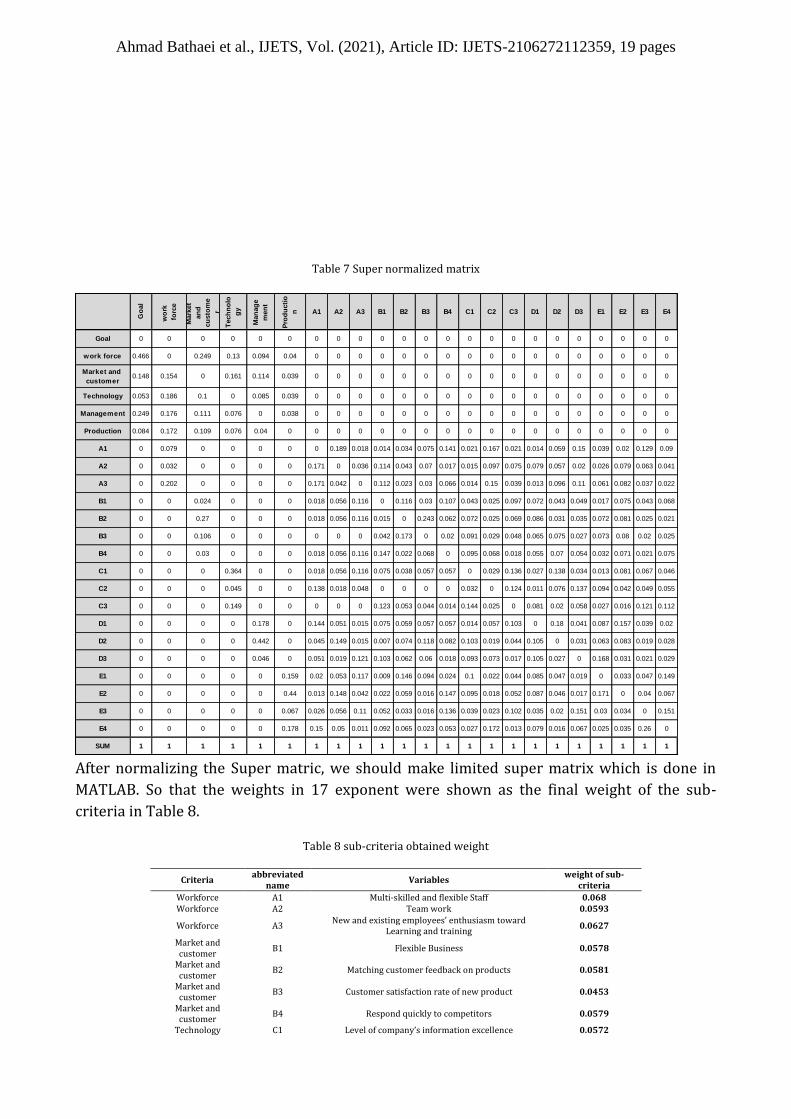
Table 7 Super normalized matrix
After normalizing the Super matric, we should make limited super matrix which is done in
MATLAB. So that the weights in 17 exponent were shown as the final weight of the sub-
criteria in Table 8.
Table 8 sub-criteria obtained weight
weight of sub-criteria
Variables abbreviated
name Criteria
0.068 Multi-skilled and flexible Staff A1 Workforce
0.0593 Team work A2 Workforce
0.0627 New and existing employees’ enthusiasm toward
Learning and training A3 Workforce
0.0578 Flexible Business B1 Market and customer
0.0581 Matching customer feedback on products B2 Market and customer
0.0453 Customer satisfaction rate of new product B3 Market and customer
0.0579 Respond quickly to competitors B4 Market and customer
0.0572 Level of company’s information excellence C1 Technology
Go
al
wo
rk
forc
e
Mark
et
an
d
cu
sto
me
r
Tech
no
lo
gy
Man
ag
e
men
t
Pro
du
cti
o
n A1 A2 A3 B1 B2 B3 B4 C1 C2 C3 D1 D2 D3 E1 E2 E3 E4
Goal 0 0 0 0 0 0 0 0 0 0 0 0 0 0 0 0 0 0 0 0 0 0 0
work force 0.466 0 0.249 0.13 0.094 0.04 0 0 0 0 0 0 0 0 0 0 0 0 0 0 0 0 0
Market and
customer0.148 0.154 0 0.161 0.114 0.039 0 0 0 0 0 0 0 0 0 0 0 0 0 0 0 0 0
Technology 0.053 0.186 0.1 0 0.085 0.039 0 0 0 0 0 0 0 0 0 0 0 0 0 0 0 0 0
Management 0.249 0.176 0.111 0.076 0 0.038 0 0 0 0 0 0 0 0 0 0 0 0 0 0 0 0 0
Production 0.084 0.172 0.109 0.076 0.04 0 0 0 0 0 0 0 0 0 0 0 0 0 0 0 0 0 0
A1 0 0.079 0 0 0 0 0 0.189 0.018 0.014 0.034 0.075 0.141 0.021 0.167 0.021 0.014 0.059 0.15 0.039 0.02 0.129 0.09
A2 0 0.032 0 0 0 0 0.171 0 0.036 0.114 0.043 0.07 0.017 0.015 0.097 0.075 0.079 0.057 0.02 0.026 0.079 0.063 0.041
A3 0 0.202 0 0 0 0 0.171 0.042 0 0.112 0.023 0.03 0.066 0.014 0.15 0.039 0.013 0.096 0.11 0.061 0.082 0.037 0.022
B1 0 0 0.024 0 0 0 0.018 0.056 0.116 0 0.116 0.03 0.107 0.043 0.025 0.097 0.072 0.043 0.049 0.017 0.075 0.043 0.068
B2 0 0 0.27 0 0 0 0.018 0.056 0.116 0.015 0 0.243 0.062 0.072 0.025 0.069 0.086 0.031 0.035 0.072 0.081 0.025 0.021
B3 0 0 0.106 0 0 0 0 0 0 0.042 0.173 0 0.02 0.091 0.029 0.048 0.065 0.075 0.027 0.073 0.08 0.02 0.025
B4 0 0 0.03 0 0 0 0.018 0.056 0.116 0.147 0.022 0.068 0 0.095 0.068 0.018 0.055 0.07 0.054 0.032 0.071 0.021 0.075
C1 0 0 0 0.364 0 0 0.018 0.056 0.116 0.075 0.038 0.057 0.057 0 0.029 0.136 0.027 0.138 0.034 0.013 0.081 0.067 0.046
C2 0 0 0 0.045 0 0 0.138 0.018 0.048 0 0 0 0 0.032 0 0.124 0.011 0.076 0.137 0.094 0.042 0.049 0.055
C3 0 0 0 0.149 0 0 0 0 0 0.123 0.053 0.044 0.014 0.144 0.025 0 0.081 0.02 0.058 0.027 0.016 0.121 0.112
D1 0 0 0 0 0.178 0 0.144 0.051 0.015 0.075 0.059 0.057 0.057 0.014 0.057 0.103 0 0.18 0.041 0.087 0.157 0.039 0.02
D2 0 0 0 0 0.442 0 0.045 0.149 0.015 0.007 0.074 0.118 0.082 0.103 0.019 0.044 0.105 0 0.031 0.063 0.083 0.019 0.028
D3 0 0 0 0 0.046 0 0.051 0.019 0.121 0.103 0.062 0.06 0.018 0.093 0.073 0.017 0.105 0.027 0 0.168 0.031 0.021 0.029
E1 0 0 0 0 0 0.159 0.02 0.053 0.117 0.009 0.146 0.094 0.024 0.1 0.022 0.044 0.085 0.047 0.019 0 0.033 0.047 0.149
E2 0 0 0 0 0 0.44 0.013 0.148 0.042 0.022 0.059 0.016 0.147 0.095 0.018 0.052 0.087 0.046 0.017 0.171 0 0.04 0.067
E3 0 0 0 0 0 0.067 0.026 0.056 0.11 0.052 0.033 0.016 0.136 0.039 0.023 0.102 0.035 0.02 0.151 0.03 0.034 0 0.151
E4 0 0 0 0 0 0.178 0.15 0.05 0.011 0.092 0.065 0.023 0.053 0.027 0.172 0.013 0.079 0.016 0.067 0.025 0.035 0.26 0
SUM 1 1 1 1 1 1 1 1 1 1 1 1 1 1 1 1 1 1 1 1 1 1 1
Ahmad Bathaei et al., IJETS, Vol. (2021), Article ID: IJETS-2106272112359, 19 pages
0.0497 Diversity of equipment, technology and operational
agility workstations C2 Technology
0.05 Integration of technology and information C3 Technology
0.0676 Promoting a culture of transformation and
modernization D1 Management
0.0575 Management’s Interest to deliver new models D2 Management
0.0591 Management’s interest in full automation D3 Management
0.0601 Regarding quality standards in production of new
products E1 Production
0.0619 Innovation in products E2 Production
0.0606 Relationship based on trust with suppliers E3 Production
0.0673 Flexible production capacity E4 Production
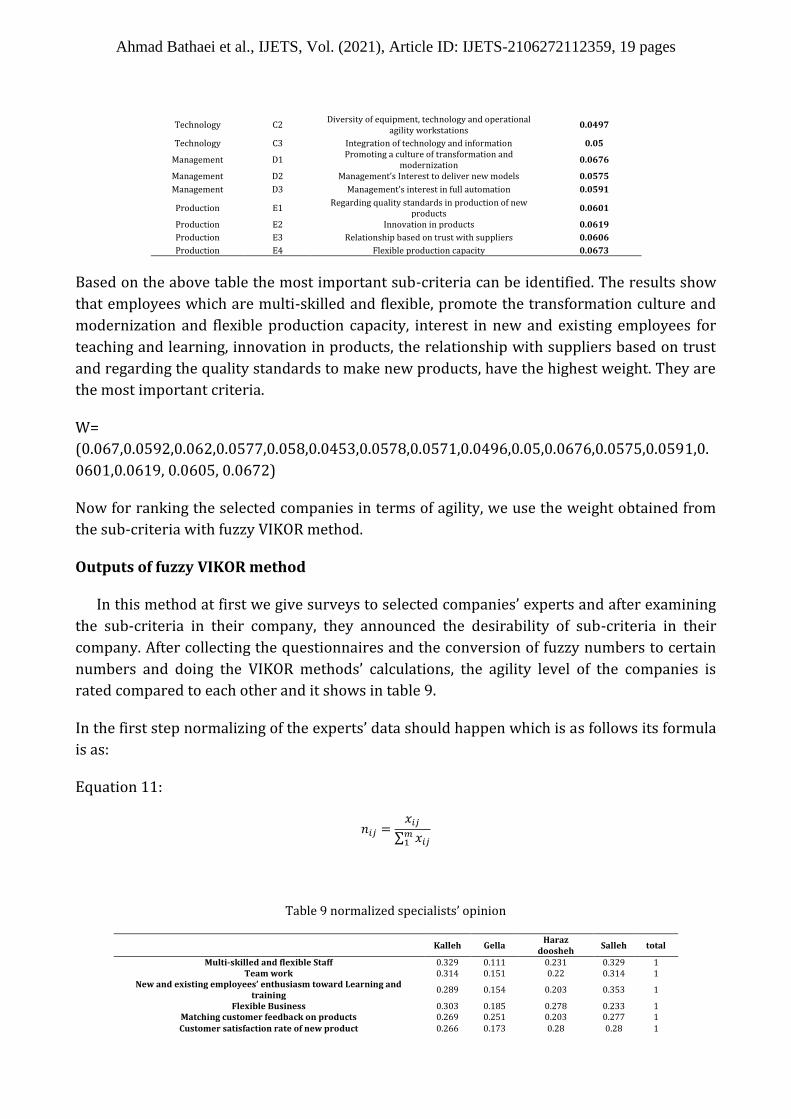
Based on the above table the most important sub-criteria can be identified. The results show
that employees which are multi-skilled and flexible, promote the transformation culture and
modernization and flexible production capacity, interest in new and existing employees for
teaching and learning, innovation in products, the relationship with suppliers based on trust
and regarding the quality standards to make new products, have the highest weight. They are
the most important criteria.
W=
(0.067,0.0592,0.062,0.0577,0.058,0.0453,0.0578,0.0571,0.0496,0.05,0.0676,0.0575,0.0591,0.
0601,0.0619, 0.0605, 0.0672)
Now for ranking the selected companies in terms of agility, we use the weight obtained from
the sub-criteria with fuzzy VIKOR method.
Outputs of fuzzy VIKOR method
In this method at first we give surveys to selected companies’ experts and after examining
the sub-criteria in their company, they announced the desirability of sub-criteria in their
company. After collecting the questionnaires and the conversion of fuzzy numbers to certain
numbers and doing the VIKOR methods’ calculations, the agility level of the companies is
rated compared to each other and it shows in table 9.
In the first step normalizing of the experts’ data should happen which is as follows its formula
is as:
Equation 11:
𝑛𝑖𝑗 =𝑥𝑖𝑗
∑ 𝑥𝑖𝑗𝑚1
Table 9 normalized specialists’ opinion
Kalleh Gella Haraz
doosheh Salleh total
Multi-skilled and flexible Staff 0.329 0.111 0.231 0.329 1 Team work 0.314 0.151 0.22 0.314 1
New and existing employees’ enthusiasm toward Learning and training
0.289 0.154 0.203 0.353 1
Flexible Business 0.303 0.185 0.278 0.233 1 Matching customer feedback on products 0.269 0.251 0.203 0.277 1 Customer satisfaction rate of new product 0.266 0.173 0.28 0.28 1
Ahmad Bathaei et al., IJETS, Vol. (2021), Article ID: IJETS-2106272112359, 19 pages
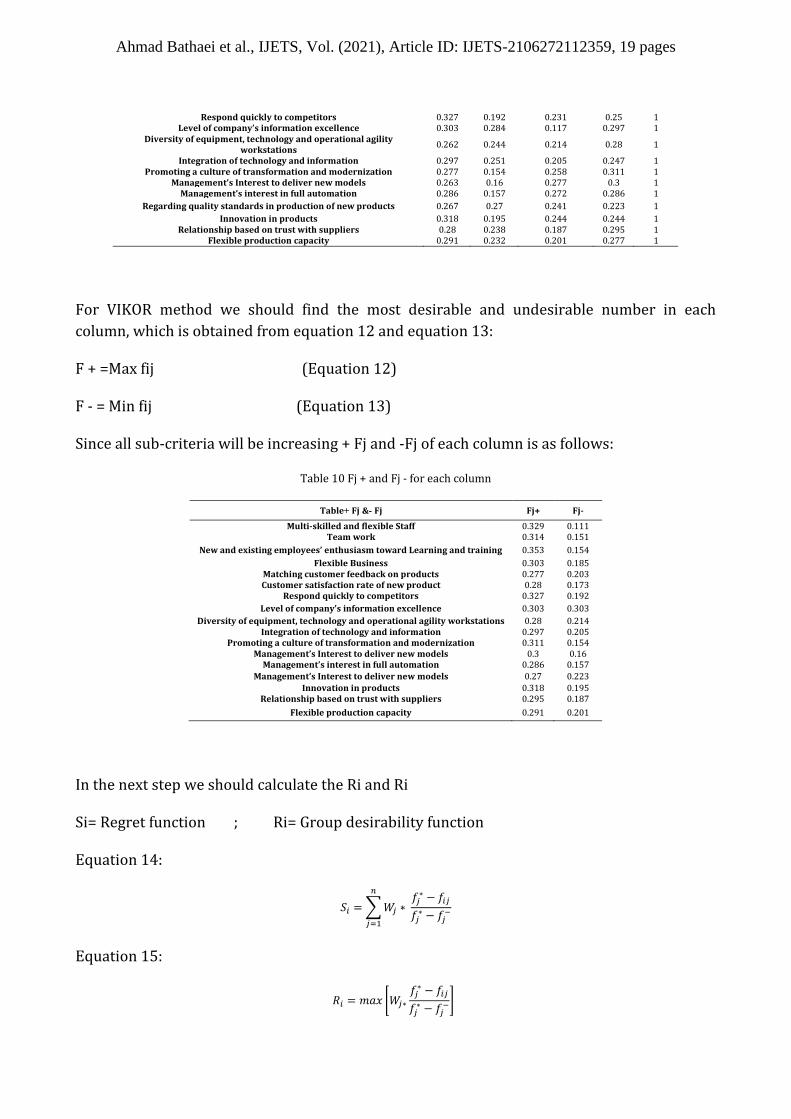
Respond quickly to competitors 0.327 0.192 0.231 0.25 1 Level of company’s information excellence 0.303 0.284 0.117 0.297 1
Diversity of equipment, technology and operational agility workstations
0.262 0.244 0.214 0.28 1
Integration of technology and information 0.297 0.251 0.205 0.247 1 Promoting a culture of transformation and modernization 0.277 0.154 0.258 0.311 1
Management’s Interest to deliver new models 0.263 0.16 0.277 0.3 1 Management’s interest in full automation 0.286 0.157 0.272 0.286 1
Regarding quality standards in production of new products 0.267 0.27 0.241 0.223 1
Innovation in products 0.318 0.195 0.244 0.244 1 Relationship based on trust with suppliers 0.28 0.238 0.187 0.295 1
Flexible production capacity 0.291 0.232 0.201 0.277 1
For VIKOR method we should find the most desirable and undesirable number in each
column, which is obtained from equation 12 and equation 13:
F + =Max fij (Equation 12)
F - = Min fij (Equation 13)
Since all sub-criteria will be increasing + Fj and -Fj of each column is as follows:
Table 10 Fj + and Fj - for each column
Table + Fj & - Fj Fj+ Fj-
Multi-skilled and flexible Staff 0.329 0.111 Team work 0.314 0.151
New and existing employees’ enthusiasm toward Learning and training 0.353 0.154
Flexible Business 0.303 0.185 Matching customer feedback on products 0.277 0.203 Customer satisfaction rate of new product 0.28 0.173
Respond quickly to competitors 0.327 0.192
Level of company’s information excellence 0.303 0.303
Diversity of equipment, technology and operational agility workstations 0.28 0.214 Integration of technology and information 0.297 0.205
Promoting a culture of transformation and modernization 0.311 0.154 Management’s Interest to deliver new models 0.3 0.16
Management’s interest in full automation 0.286 0.157
Management’s Interest to deliver new models 0.27 0.223
Innovation in products 0.318 0.195 Relationship based on trust with suppliers 0.295 0.187
Flexible production capacity 0.291 0.201
In the next step we should calculate the Ri and Ri
Si= Regret function ; Ri= Group desirability function
Equation 14:
𝑆𝑖 = ∑ 𝑊𝑗
𝑛
𝑗=1
∗ 𝑓𝑗
∗ − 𝑓𝑖𝑗
𝑓𝑗∗ − 𝑓𝑗
−
Equation 15:
𝑅𝑖 = 𝑚𝑎𝑥 [𝑊𝑗∗
𝑓𝑗∗ − 𝑓𝑖𝑗
𝑓𝑗∗ − 𝑓𝑗
−]
Ahmad Bathaei et al., IJETS, Vol. (2021), Article ID: IJETS-2106272112359, 19 pages
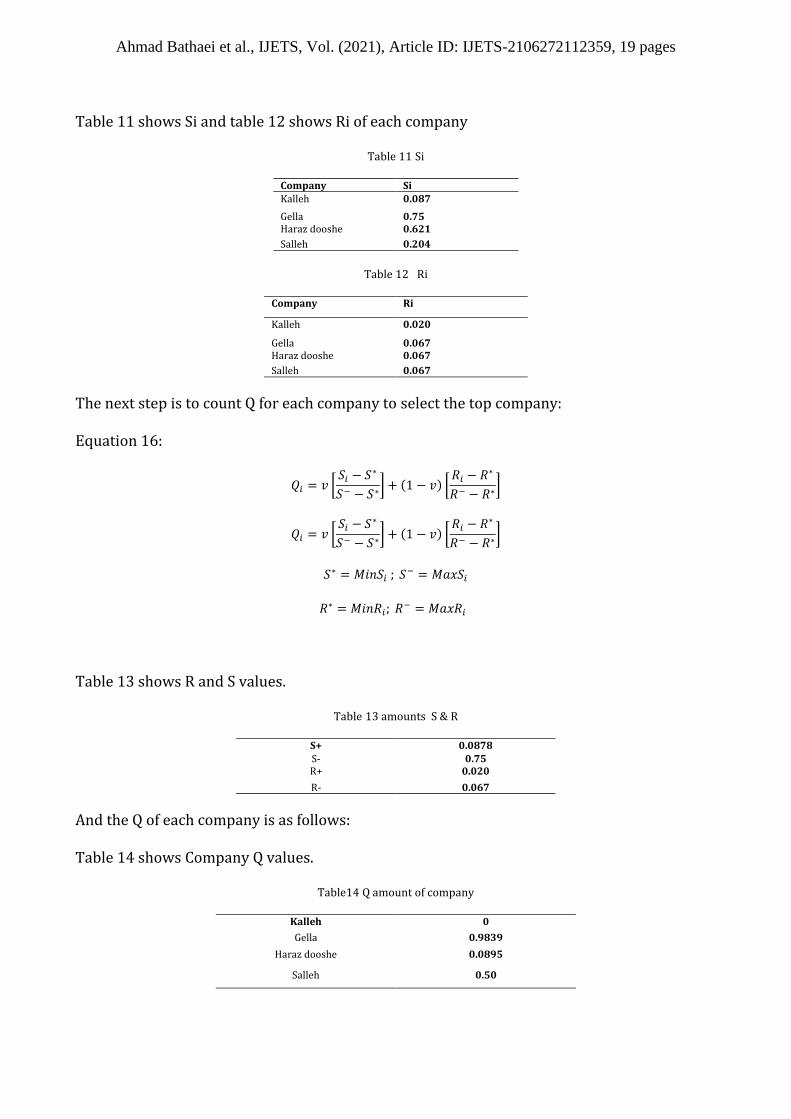
Table 11 shows Si and table 12 shows Ri of each company
Table 11 Si
Si Company
0.087 Kalleh
0.75 Gella
0.621 Haraz dooshe
0.204 Salleh
Table 12 Ri
Ri Company
0.020 Kalleh
0.067 Gella
0.067 Haraz dooshe
0.067 Salleh
The next step is to count Q for each company to select the top company:
Equation 16:
𝑄𝑖 = 𝑣 [𝑆𝑖 − 𝑆∗
𝑆− − 𝑆∗] + (1 − 𝑣) [
𝑅𝑖 − 𝑅∗
𝑅− − 𝑅∗]
𝑄𝑖 = 𝑣 [𝑆𝑖 − 𝑆∗
𝑆− − 𝑆∗] + (1 − 𝑣) [
𝑅𝑖 − 𝑅∗
𝑅− − 𝑅∗]
𝑆∗ = 𝑀𝑖𝑛𝑆𝑖 ; 𝑆− = 𝑀𝑎𝑥𝑆𝑖
𝑅∗ = 𝑀𝑖𝑛𝑅𝑖; 𝑅− = 𝑀𝑎𝑥𝑅𝑖
Table 13 shows R and S values.
Table 13 amounts S & R
0.0878 S+
0.75 S- 0.020 R+
0.067 R-
And the Q of each company is as follows:
Table 14 shows Company Q values.
Table14 Q amount of company
0 Kalleh
0.9839 Gella
0.0895 Haraz dooshe
0.50 Salleh
Ahmad Bathaei et al., IJETS, Vol. (2021), Article ID: IJETS-2106272112359, 19 pages
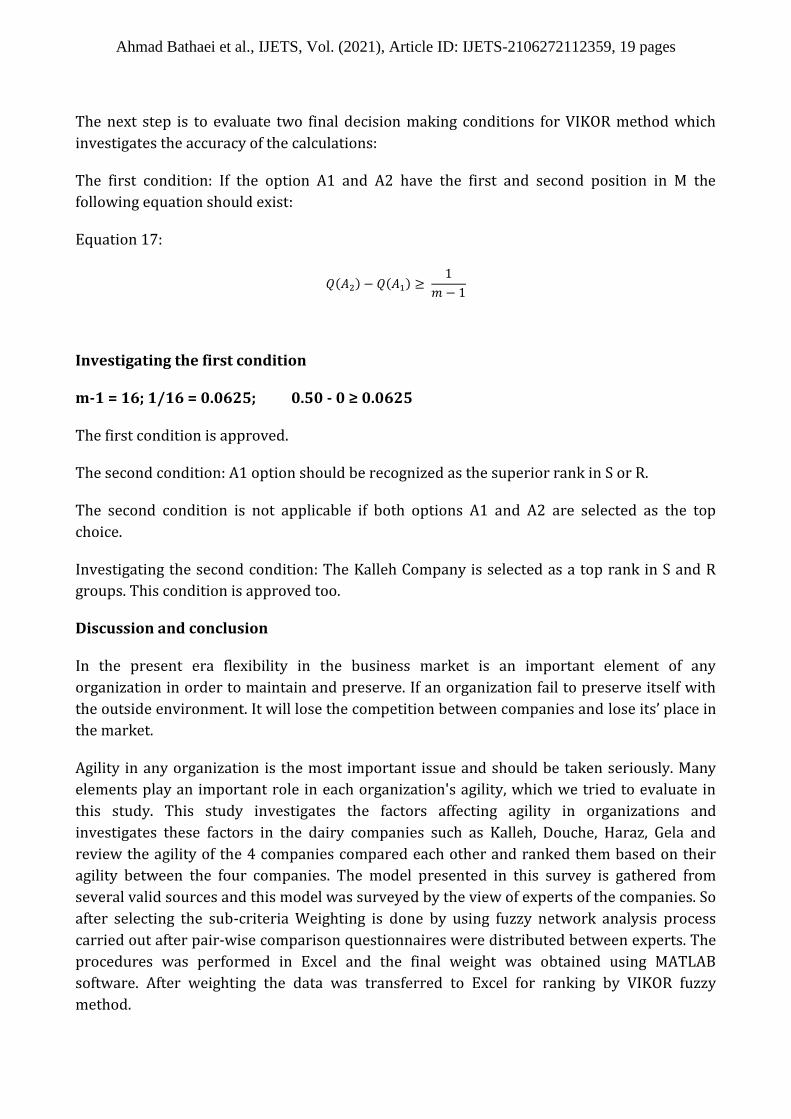
The next step is to evaluate two final decision making conditions for VIKOR method which
investigates the accuracy of the calculations:
The first condition: If the option A1 and A2 have the first and second position in M the
following equation should exist:
Equation 17:
𝑄(𝐴2) − 𝑄(𝐴1) ≥ 1
𝑚 − 1
Investigating the first condition
m-1 = 16; 1/16 = 0.0625; 0.50 - 0 ≥ 0.0625
The first condition is approved.
The second condition: A1 option should be recognized as the superior rank in S or R.
The second condition is not applicable if both options A1 and A2 are selected as the top
choice.
Investigating the second condition: The Kalleh Company is selected as a top rank in S and R
groups. This condition is approved too.
Discussion and conclusion
In the present era flexibility in the business market is an important element of any
organization in order to maintain and preserve. If an organization fail to preserve itself with
the outside environment. It will lose the competition between companies and lose its’ place in
the market.
Agility in any organization is the most important issue and should be taken seriously. Many
elements play an important role in each organization's agility, which we tried to evaluate in
this study. This study investigates the factors affecting agility in organizations and
investigates these factors in the dairy companies such as Kalleh, Douche, Haraz, Gela and
review the agility of the 4 companies compared each other and ranked them based on their
agility between the four companies. The model presented in this survey is gathered from
several valid sources and this model was surveyed by the view of experts of the companies. So
after selecting the sub-criteria Weighting is done by using fuzzy network analysis process
carried out after pair-wise comparison questionnaires were distributed between experts. The
procedures was performed in Excel and the final weight was obtained using MATLAB
software. After weighting the data was transferred to Excel for ranking by VIKOR fuzzy
method.
Ahmad Bathaei et al., IJETS, Vol. (2021), Article ID: IJETS-2106272112359, 19 pages
This ranking was done after distributing the questionnaire and the results are according to
the table.
1-5 The results of the survey questions.
1-1-5 Which one of the indicators examined in more efficient in organizations’ agility?
The results show that multi-skilled and flexible employees, promoting the transformation
culture and modernization, flexible production capacity,
New and existing employees interest in teaching and learning, product innovation,
relationship with suppliers based on trust and respect
Regarding quality standards to make a new product have the highest impact on the agility of
organizations and companies from Experts’ view.
1- Multi-skilled and flexible employees are the most important asset of the organization and
the employees which are more capable and multi-skilled
Have the ability to help organizations in the hour of need, they may require an employee to
work in another part and multi-skilled employee will help to solve the problem and the
organization can meet their customers' needs and compete with their rivals.
2- Promoting culture of change and modernity, culture transformation and modernization are
important factors in an organization for changing and adapting as quickly as possible with
their outside environment. As organizations promote culture of change and renewal
employees will know the meaning of premature change easier and cooperate better in order
to create change in their organization.
3- Flexible production capacity: in the present era customers’ needs don’t have complete
consistency with the development of technology and new up to date products, customers are
attracted to new products, so companies need to make their capacity flexible In order to meet
the needs of previous clients and keep them and also meet the needs of new customers and to
compete with their counterparts in the field of business and does not fall behind. Falling
behind and losing the business to a competitor actually makes the company continue working
hardly, and they may be withdrawn from the competition completely.
4- Interests of existing and new employees in teaching and learning: motivation and
satisfaction among employees of an organization enhance the growth and excellence of
creativity in organizations and can provide solutions to respond to competitors and the
market. Discussion about employee training is one of the most important responsibilities of
the organization to make their employees ready toward the threads and the new
opportunities in order to take the greatest advantage of their expertise and ability.
5- Product innovation: Nowadays, products will change and progress faster than we think.
The longevity of the products has come down to such an extent that the organization have to
Ahmad Bathaei et al., IJETS, Vol. (2021), Article ID: IJETS-2106272112359, 19 pages
think about what the next product will be at the beginning of introducing a product. A product
become more accepted, if it helps the customers more.
6- Relationship based on trust with the suppliers: It’s one of the most important factors is the
agility of the organization. Whatever the organization makes its’ relationship better with
suppliers and could meet their needs of more needed raw materials or changes in raw
material and presentations of materials with the help of the suppliers. So it can better respond
to the needs of the market and changes in the business arena. The Faster the adaption to
change the more agile an organization will be.
7- Regarding the quality standards to produce a new product: the quality is always the choice
of the customer and is the sign of superiority of one company over the other. Regarding the
quality standards will enhance the quality of the products easier for customers to choose their
products and with improvements in quality the customers will choose the products easier.
Quality is always in sight and every organization is always improving the quality to have an
advantage in competition with their peers.
2-1-5- Saleh, Haraz, Gela, and Kalleh dairy companies are at what level of agility?
As shown in table 14-4 Kalleh company was more agile than the other companies because of
product innovation, enthusiasm of employees to learn which made this company the best.
In addition to the competition in the domestic market it also thinks about the exports of its
products and exported its products outside the country borders. Which shows the ability of
the company in all areas of production, management, and staff. In each of the criteria there are
important sub-criteria for making the selected dairy companies agile. The important sub-
criteria of agility are such as agility in the workforce, multi-skilled and flexible employees, in
market dimension and customers, the implementation of customer feedback on products, in
terms of the variety of machines in operation and workstation in technology dimension, in
agility management, promoting the culture of innovation and transformation, and in the
relationship based on trust with the suppliers in production dimension.
References
1. Aqaei, R., Aqaei, Milad, presented a conceptual model of organizational agility. Journal of Technology, 2014(39): p. -.
2. Zitkiene, R. and M. Deksnys, Organizational Agility Conceptual Model. Montenegrin Journal of Economics, 2018. 14: p. 115-129.
3. Oosterhout, M., Business Agility and Information Technology in Service Organizations. 2010.
4. Karbasian. Mehdi, J.M., Kheboshani. Azam, Zanjirchi. Seyed Mahnood, , Application Model (ISM) index for the selection of provider's agile and rank vendors using fuzzy TOPSIS-AHP. Production and Operations Management, 2011. 2: p. 107-134.
5. Khobian, M., et al., Dynamic organizational capabilities and flexibility. Quarterly Journal of Strategic Management Studies,, 2018. 9(36).
Ahmad Bathaei et al., IJETS, Vol. (2021), Article ID: IJETS-2106272112359, 19 pages
6. Marvati Sharif Abadi, A., Younesi Far, Seyed Abdol Aziz,Agha Baqeri, Hosein, Keshvar Shahi, Mohammad Kazem, Provide a conceptual framework for evaluating agility and ranking organizations, using Interval Fuzzy Electre (Case Study: Iran Alloy Steel Plant). Production and Operations Management, 2013. 2.
7. Seyed Hoseini, S.M., Ay Ahmadi, Alireza, Fekri, Roksana, Fathian, Mohammad, Designing a model of agility in the process of new product development by using structural equation modeling in Iran's automobile industry. International Journal of Industrial Engineering & Production Management, 2009. 4(20).
8. Farsijani, H., Explain and identify factors affecting organizational agility in universities. business management perspective, 2013(14).
9. Mohaqar, A., Marvati Sharif Abadi, Ali, Younesi Far, Seyed Abdol Aziz, Agility Assessment using linguistic variables and fuzzy logic ranking fuzzy numbers using the technique of the central core and TOPSIS (Case Study: Yazd Alloy Steel Company). Journal of Management Studies Industrial ninth year, 2013. 23.
10. Fathian, M., Atefe, Sheikh, Present a model for the development of agility in organizations. industrial engineering and management Sharif, 2009. 2.
11. Asnawi, A.L., A.M. Gravell, and G.B. Wills. Empirical investigation on agile methods usage: issues identified from early adopters in Malaysia. in International Conference on Agile Software Development. 2011. Springer.
12. Erande, A.S. and A.K. Verma, Measuring agility of organizations-a comprehensive agility measurement tool (CAMT). International journal of applied management and technology, 2008. 6(3).
13. Tanner, M. and U. von Willingh, Factors leading to the success and failure of agile projects implemented in traditionally waterfall environments. Human Capital without Borders: Knowledge and Learning for the Quality of Life. Portoroz, Slovenia: Make Learn, 2014: p. 693-701.
14. Papadopoulos, G., Moving from traditional to agile software development methodologies also on large, distributed projects. Procedia-Social and Behavioral Sciences, 2015. 175: p. 455-463.
15. Yauch, C.A., Measuring agility as a performance outcome. Journal of Manufacturing Technology Management, 2011.
16. Imache, R., S. Izza, and M. Ahmed-Nacer, An enterprise information system agility assessment model. Computer science and information systems, 2012. 9(1): p. 107-133.
17. Vinodh, S., et al., Agility index measurement using multi-grade fuzzy approach integrated in a 20 criteria agile model. International Journal of Production Research, 2010. 48(23): p. 7159-7176.
18. Vinodh, S. and S. Aravindraj, Agility evaluation using the IF–THEN approach. International Journal of Production Research, 2012. 50(24): p. 7100-7109.
19. Rajesh, G. and R. Raju, A FUZZY INFERENCE APPROACH TO SUPPLIER SEGMENTATION FOR STRATEGIC DEVELOPMENT. The South African Journal of Industrial Engineering, 2021. 32(1): p. 44-55.
20. Sreenivasa, C., S. Devadasan, and R. Murugesh, Thirty criteria-based assessment of agility in a pneumatic enabling products manufacturing company. International Journal of Services and Operations Management, 2012. 11(2): p. 201-221.
21. Aravindraj, S. and S. Vinodh, Forty criteria based agility assessment using scoring approach in an Indian relays manufacturing organization. Journal of Engineering, Design and Technology, 2014.
Ahmad Bathaei et al., IJETS, Vol. (2021), Article ID: IJETS-2106272112359, 19 pages
22. Misra, S.C., V. Kumar, and U. Kumar, Identifying some important success factors in adopting agile software development practices. Journal of Systems and Software, 2009. 82(11): p. 1869-1890.
23. Qumer, A. and B. Henderson-Sellers, An evaluation of the degree of agility in six agile methods and its applicability for method engineering. Information and software technology, 2008. 50(4): p. 280-295.
24. Bathaei, A., S.R. Awang, and T. Ahmad, Important Factors for Agile Supply Chain in Iranian Automobile Industries. 2021.
25. Valipour Khatir, M., A. Bathaei, and B. Bahrami Mianrood, Comparative study of factors affecting organizational agility in Iran.
26. Bathaei, A., et al., Application of fuzzy analytical network process (ANP) and VIKOR for the assessment of green agility critical success factors in dairy companies. Symmetry, 2019. 11(2): p. 250.
27. Vinodh, S., R.A. Ramiya, and S. Gautham, Application of fuzzy analytic network process for supplier selection in a manufacturing organisation. Expert Systems with Applications, 2011. 38(1): p. 272-280.