Embed Size (px)
Citation preview
1
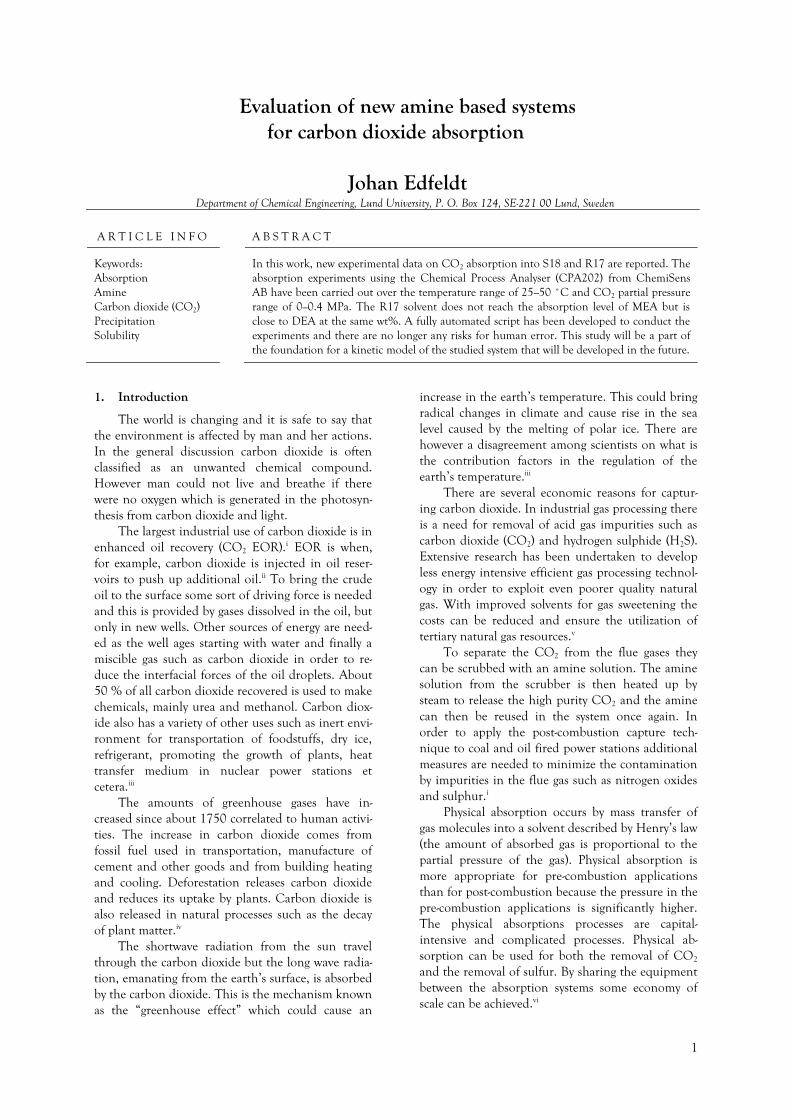
Evaluation of new amine based systems for carbon dioxide absorption
Johan Edfeldt
Department of Chemical Engineering, Lund University, P. O. Box 124, SE-221 00 Lund, Sweden A R T I C L E I N F O A B S T R A C T
Keywords: Absorption Amine Carbon dioxide (CO2) Precipitation Solubility
In this work, new experimental data on CO2 absorption into S18 and R17 are reported. The absorption experiments using the Chemical Process Analyser (CPA202) from ChemiSens AB have been carried out over the temperature range of 25–50 ˚C and CO2 partial pressure range of 0–0.4 MPa. The R17 solvent does not reach the absorption level of MEA but is close to DEA at the same wt%. A fully automated script has been developed to conduct the experiments and there are no longer any risks for human error. This study will be a part of the foundation for a kinetic model of the studied system that will be developed in the future.
1. Introduction
The world is changing and it is safe to say that the environment is affected by man and her actions. In the general discussion carbon dioxide is often classified as an unwanted chemical compound. However man could not live and breathe if there were no oxygen which is generated in the photosyn-thesis from carbon dioxide and light.
The largest industrial use of carbon dioxide is in enhanced oil recovery (CO2 EOR).i EOR is when, for example, carbon dioxide is injected in oil reser-voirs to push up additional oil.ii To bring the crude oil to the surface some sort of driving force is needed and this is provided by gases dissolved in the oil, but only in new wells. Other sources of energy are need-ed as the well ages starting with water and finally a miscible gas such as carbon dioxide in order to re-duce the interfacial forces of the oil droplets. About 50 % of all carbon dioxide recovered is used to make chemicals, mainly urea and methanol. Carbon diox-ide also has a variety of other uses such as inert envi-ronment for transportation of foodstuffs, dry ice, refrigerant, promoting the growth of plants, heat transfer medium in nuclear power stations et cetera.iii
The amounts of greenhouse gases have in-creased since about 1750 correlated to human activi-ties. The increase in carbon dioxide comes from fossil fuel used in transportation, manufacture of cement and other goods and from building heating and cooling. Deforestation releases carbon dioxide and reduces its uptake by plants. Carbon dioxide is also released in natural processes such as the decay of plant matter.iv
The shortwave radiation from the sun travel through the carbon dioxide but the long wave radia-tion, emanating from the earth‟s surface, is absorbed by the carbon dioxide. This is the mechanism known as the “greenhouse effect” which could cause an
increase in the earth‟s temperature. This could bring radical changes in climate and cause rise in the sea level caused by the melting of polar ice. There are however a disagreement among scientists on what is the contribution factors in the regulation of the earth‟s temperature.iii
There are several economic reasons for captur-ing carbon dioxide. In industrial gas processing there is a need for removal of acid gas impurities such as carbon dioxide (CO2) and hydrogen sulphide (H2S). Extensive research has been undertaken to develop less energy intensive efficient gas processing technol-ogy in order to exploit even poorer quality natural gas. With improved solvents for gas sweetening the costs can be reduced and ensure the utilization of tertiary natural gas resources.v
To separate the CO2 from the flue gases they can be scrubbed with an amine solution. The amine solution from the scrubber is then heated up by steam to release the high purity CO2 and the amine can then be reused in the system once again. In order to apply the post-combustion capture tech-nique to coal and oil fired power stations additional measures are needed to minimize the contamination by impurities in the flue gas such as nitrogen oxides and sulphur.i
Physical absorption occurs by mass transfer of gas molecules into a solvent described by Henry‟s law (the amount of absorbed gas is proportional to the partial pressure of the gas). Physical absorption is more appropriate for pre-combustion applications than for post-combustion because the pressure in the pre-combustion applications is significantly higher. The physical absorptions processes are capital-intensive and complicated processes. Physical ab-sorption can be used for both the removal of CO2 and the removal of sulfur. By sharing the equipment between the absorption systems some economy of scale can be achieved.vi
2
In chemical absorption the enthalpy of absorp-tion is higher because of a greater temperature de-pendence of the chemical solubility but it also de-creases much more rapidly with increased loading than the physical absorption. If, for example, the amines in the solvent are neutralized by the ab-sorbed acid gases the chemical enthalpy of absorp-tion decreases and approach the physical absorption enthalpy. The other main difference between physi-cal and chemical absorption is that chemical absorp-tion have nonlinearity in the absorption isotherms which is why Henry’s law does not hold.vii
The amine scrubbing technology has been in use for over 60 years in the chemical and oil in-dustries for removal of hydrogen sulphide and CO2 from gas streams. The main concerns with MEA and other amine solvent are corrosion in the presence of O2 and other impurities, the large amounts of energy required for regeneration and high solvent degrada-tion rates from reaction with SO2 and NO2. These factors generally contribute to large equipment, large energy losses and high solvent consumption. In order to improve this there is a great need for im-proved solvents with faster absorption rates, higher absorption capacities, high degradation re-sistance and low corrosiveness and energy use for regenera-tion.i
Together with the physical solvent a chemical solvent, in the form of a sterically hindered amine, is used in this study. The advantages with this sterically hindered amine, compared to primary or secondary amines, is that it provides twice the equilibrium CO2-loading capacity (like the tertiary amine MDEA) but it also has a much faster reaction rate than MDEA.v
The amine provides an easy regeneration. The stability of the carbamate amine, formed by the CO2-amine reaction, is lowered because of the steric hin-drance of the bulky substituent adjacent to the ami-no group of the sterically hindered amine.viii
2. Methodology
2.1. Reaction mechanism
The mechanism for carbon dioxide reaction with the specific amine (R17) has the following appearance. First one amine reacts with a single carbon dioxide molecule to form a carbamate and then this reacts with a second amine to form a car-bamate anion and a protonated cation.ix
The mechanism is somewhat sensitive to water. In the presence of water the carbamate reacts with water to form bicarbonate.x For the work presented
in this study no water is present which should en-sure that no bicarbonate is generated, however there is always the possibility of leakage from the sur-rounding water in the calorimeter. The reaction between a carbamate ion and water is as follows:
If the amine (R17) is in an aqueous solution
carbon dioxide reacts to form a zwitterion, which is the controlling stage of the process, and then bicar-bonate and a protonated cation as such:xi
2.2. Precipitation
In the studied literature no precipitation for-mation has been described for the commonly used amine systems with primary, secondary or tertiary amines.
In this study an organic solvent, S18, is used to-gether with the amine while other studies often tend to use a mixture of amine and water. The precipita-tion is formed because the organic solvent is used and that the system is free from water. The precipita-tion does not take place in the reaction which should make is possible for the next amine to react with new CO2 or available CO2-complex, RNHCOOH, to form more precipitation until the remaining amine have been consumed. Shou Xu et al.x confirm that a white carbamate precipitate was present during the process when the concentration of the sterically hindered amine R17 and loading of CO2 was high.
2.3. Equipment
The Chemical Process Analyser (CPA202), was used in all the conducted experiments in this thesis. CPA202 is a factory calibrated reaction calorimeter from ChemiSens AB measuring true heat flow with a stable baseline (no reaction zero baseline). A CPA202 reactor of glass and stainless steel was filled with the specific reactants and used in the experi-ments.
ChemiCall v2 is a software developed by ChemiSens AB. The software is used to monitor and control the experimental equipment. Data and graphs are extracted from the program and integrat-ed in CC-report to be able to conduct all calcula-tions, mainly integrations.
In general two different ProFind Automation scripts were created with some help from ChemiSens in order to automate the process as much as possible to reduce human error. The main experiments used script number 1 which seeks stability in the True Heat Flow (THF) between each step and script num-
3
ber 2 seeks stability in Pressure and THF between each step to better study the absorption abilities when the system moves to equilibrium. Each exper-iment was conducted with 100 grams of total sample with different amounts of the included solvents:
1. 100 wt% S18
2. 85 wt% S18 and 15 wt% R17
3. 75 wt% S18 and 25 wt% R17
2.4. Equations
Henry‟s constant, is calculated from a line-ar regression between partial pressure and the molar fraction or between partial pressure and concentra-tion. In physical absorption, the concentration of a dissolved gas in a solvent increases in proportion to the partial pressure of the gas, |Equation 1.
|Equation 1
However in chemical absorption Henry‟s law does not hold because the chemical absorption isotherm is nonlinear.vii Because of this the Henry‟s constants are calculated for the pure physical solvent and then used for the mixtures with the sterically hindered amine to give an approximated heat of crystallization value.
Change of enthalpy per mole when a substance dissolves to form a very dilute solution is called the enthalpy of solution. The dissolution can be both exothermic (ΔHsol<0) and endothermic (ΔHsol>0).xii
The heat of solution is calculated with |Equation 2.xiii
∫ ( )
|Equation 2
The absorbed amount of carbon dioxide was calculat-ed according to |Equation 3.xiii
∫ ( )
|Equation 3
Reactor head space volume (Pure S18: 160.6 10-6
m3 R17 15 wt%: 159.2 10-6 m3, R17 25 wt%: 158.2 10-6 m3)
Mass flow conversion factor (0.0050 g V-1 s-1) Partial pressure of CO2 (Pa) Molar weight of CO2 (44.01 g mole-1) Gas constant (8.3145 m3 Pa K-1 mole-1) Reactor temperature (K) Absorbed amount of CO2 (mole)
The heat of crystallization is calculated with
|Equation 4 and |Equation 5.xiii
|Equation 4
Henry' s constant for the solubility of CO2 in solvent
(Pa m3 mole-1)
Volume of solvent in the sample (m3) Amount of CO2 reacted with the amine (mole)
∫ ( )
∫ ( )
|Equation 5
3. Results 3.1. Henry’s constants
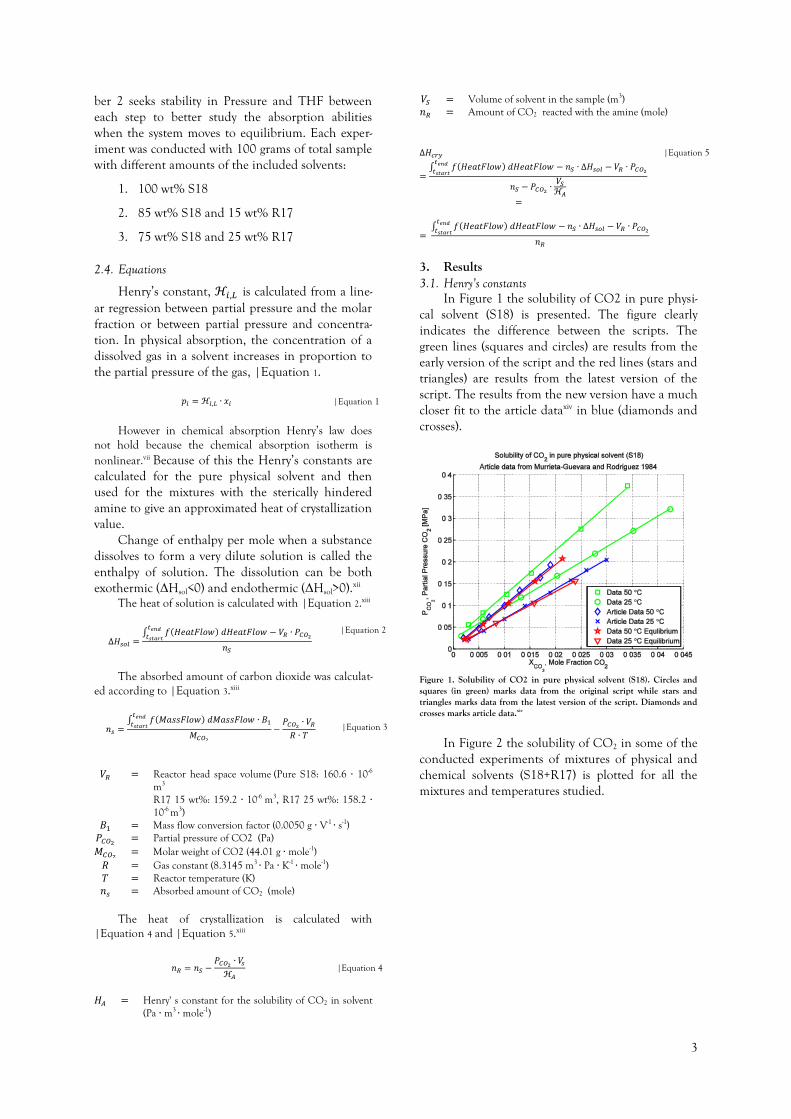
In Figure 1 the solubility of CO2 in pure physi-cal solvent (S18) is presented. The figure clearly indicates the difference between the scripts. The green lines (squares and circles) are results from the early version of the script and the red lines (stars and triangles) are results from the latest version of the script. The results from the new version have a much closer fit to the article dataxiv in blue (diamonds and crosses).
Figure 1. Solubility of CO2 in pure physical solvent (S18). Circles and squares (in green) marks data from the original script while stars and triangles marks data from the latest version of the script. Diamonds and crosses marks article data.xiv
In Figure 2 the solubility of CO2 in some of the conducted experiments of mixtures of physical and chemical solvents (S18+R17) is plotted for all the mixtures and temperatures studied.
4
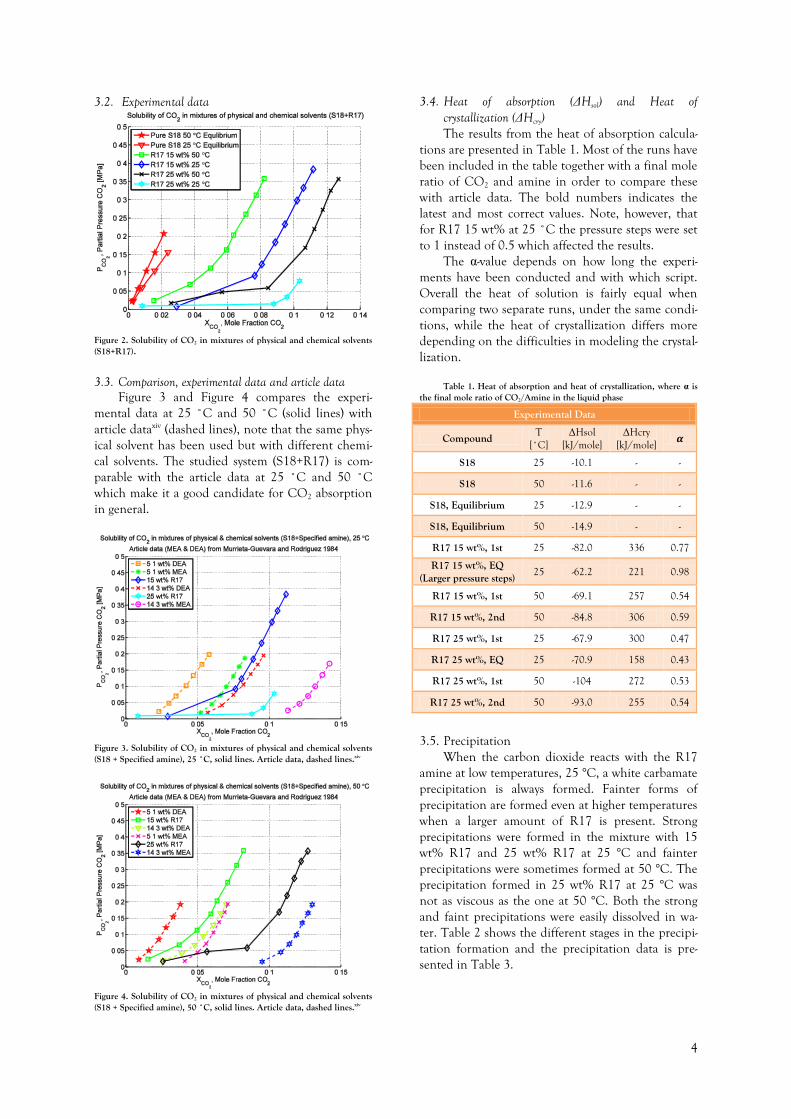
3.2. Experimental data
Figure 2. Solubility of CO2 in mixtures of physical and chemical solvents (S18+R17).
3.3. Comparison, experimental data and article data Figure 3 and Figure 4 compares the experi-
mental data at 25 ˚C and 50 ˚C (solid lines) with article dataxiv (dashed lines), note that the same phys-ical solvent has been used but with different chemi-cal solvents. The studied system (S18+R17) is com-parable with the article data at 25 ˚C and 50 ˚C which make it a good candidate for CO2 absorption in general.
Figure 3. Solubility of CO2 in mixtures of physical and chemical solvents (S18 + Specified amine), 25 ˚C, solid lines. Article data, dashed lines.xiv
Figure 4. Solubility of CO2 in mixtures of physical and chemical solvents (S18 + Specified amine), 50 ˚C, solid lines. Article data, dashed lines.xiv
3.4. Heat of absorption (ΔHsol) and Heat of crystallization (ΔHcry) The results from the heat of absorption calcula-
tions are presented in Table 1. Most of the runs have been included in the table together with a final mole ratio of CO2 and amine in order to compare these with article data. The bold numbers indicates the latest and most correct values. Note, however, that for R17 15 wt% at 25 ˚C the pressure steps were set to 1 instead of 0.5 which affected the results.
The α-value depends on how long the experi-ments have been conducted and with which script. Overall the heat of solution is fairly equal when comparing two separate runs, under the same condi-tions, while the heat of crystallization differs more depending on the difficulties in modeling the crystal-lization.
Table 1. Heat of absorption and heat of crystallization, where α is the final mole ratio of CO2/Amine in the liquid phase
Experimental Data
Compound T
[˚C] ΔHsol
[kJ/mole] ΔHcry
[kJ/mole]
S18 25 -10.1 - -
S18 50 -11.6 - -
S18, Equilibrium 25 -12.9 - -
S18, Equilibrium 50 -14.9 - -
R17 15 wt%, 1st 25 -82.0 336 0.77
R17 15 wt%, EQ (Larger pressure steps)
25 -62.2 221 0.98
R17 15 wt%, 1st 50 -69.1 257 0.54
R17 15 wt%, 2nd 50 -84.8 306 0.59
R17 25 wt%, 1st 25 -67.9 300 0.47
R17 25 wt%, EQ 25 -70.9 158 0.43
R17 25 wt%, 1st 50 -104 272 0.53
R17 25 wt%, 2nd 50 -93.0 255 0.54
3.5. Precipitation
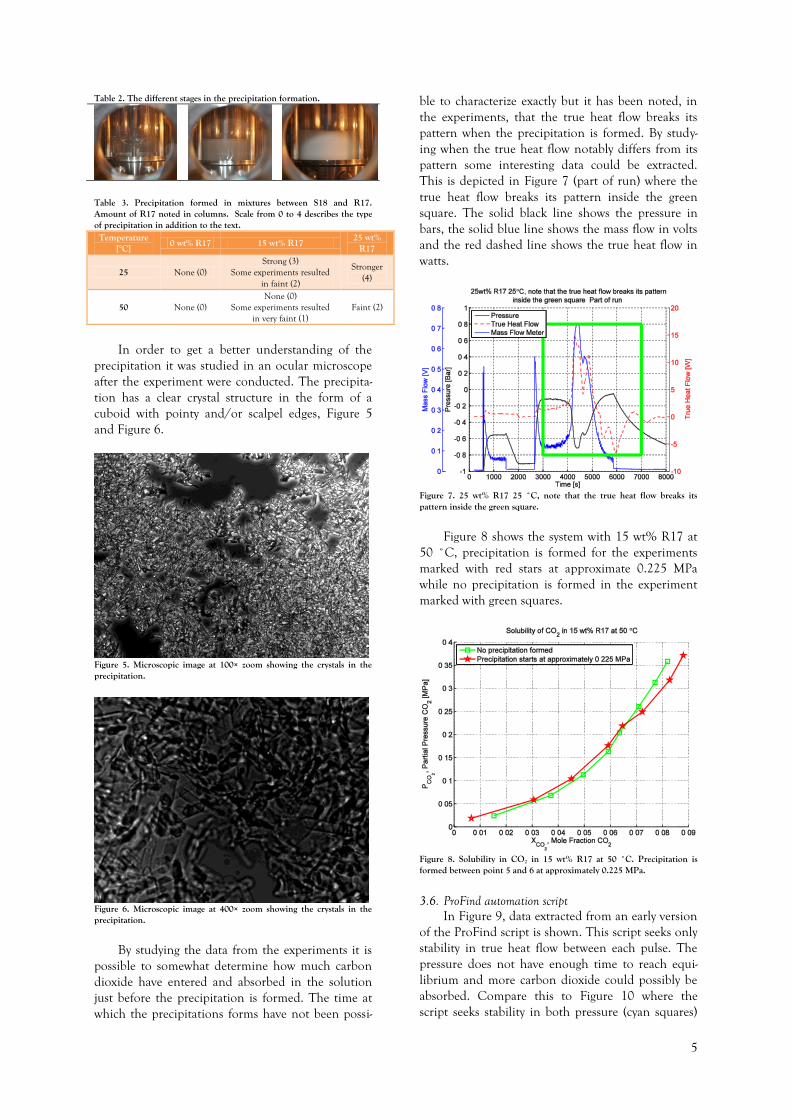
When the carbon dioxide reacts with the R17 amine at low temperatures, 25 °C, a white carbamate precipitation is always formed. Fainter forms of precipitation are formed even at higher temperatures when a larger amount of R17 is present. Strong precipitations were formed in the mixture with 15 wt% R17 and 25 wt% R17 at 25 °C and fainter precipitations were sometimes formed at 50 °C. The precipitation formed in 25 wt% R17 at 25 °C was not as viscous as the one at 50 °C. Both the strong and faint precipitations were easily dissolved in wa-ter. Table 2 shows the different stages in the precipi-tation formation and the precipitation data is pre-sented in Table 3.
5
Table 2. The different stages in the precipitation formation.
Table 3. Precipitation formed in mixtures between S18 and R17. Amount of R17 noted in columns. Scale from 0 to 4 describes the type of precipitation in addition to the text.
Temperature [°C]
0 wt% R17 15 wt% R17 25 wt%
R17
25 None (0) Strong (3)
Some experiments resulted in faint (2)
Stronger (4)
50 None (0) None (0)
Some experiments resulted in very faint (1)
Faint (2)
In order to get a better understanding of the precipitation it was studied in an ocular microscope after the experiment were conducted. The precipita-tion has a clear crystal structure in the form of a cuboid with pointy and/or scalpel edges, Figure 5 and Figure 6.
Figure 5. Microscopic image at 100× zoom showing the crystals in the precipitation.
Figure 6. Microscopic image at 400× zoom showing the crystals in the precipitation.
By studying the data from the experiments it is possible to somewhat determine how much carbon dioxide have entered and absorbed in the solution just before the precipitation is formed. The time at which the precipitations forms have not been possi-
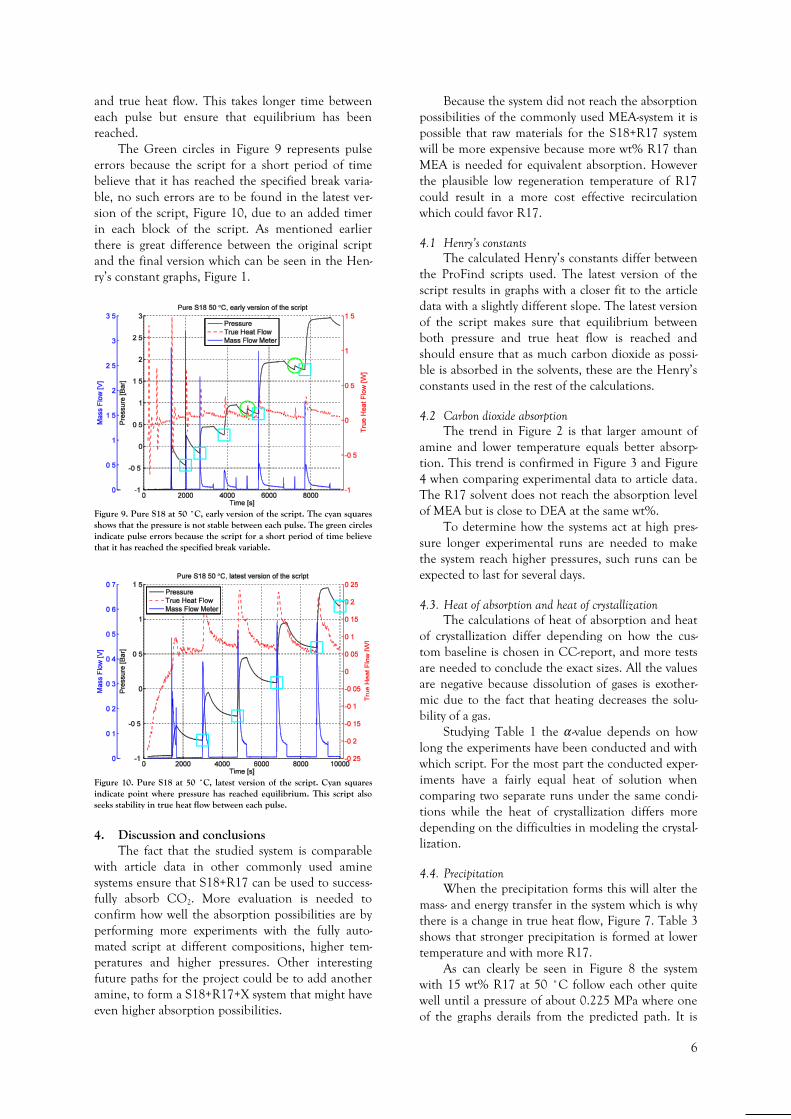
ble to characterize exactly but it has been noted, in the experiments, that the true heat flow breaks its pattern when the precipitation is formed. By study-ing when the true heat flow notably differs from its pattern some interesting data could be extracted. This is depicted in Figure 7 (part of run) where the true heat flow breaks its pattern inside the green square. The solid black line shows the pressure in bars, the solid blue line shows the mass flow in volts and the red dashed line shows the true heat flow in watts.
Figure 7. 25 wt% R17 25 ˚C, note that the true heat flow breaks its pattern inside the green square.
Figure 8 shows the system with 15 wt% R17 at 50 ˚C, precipitation is formed for the experiments marked with red stars at approximate 0.225 MPa while no precipitation is formed in the experiment marked with green squares.
Figure 8. Solubility in CO2 in 15 wt% R17 at 50 ˚C. Precipitation is formed between point 5 and 6 at approximately 0.225 MPa.
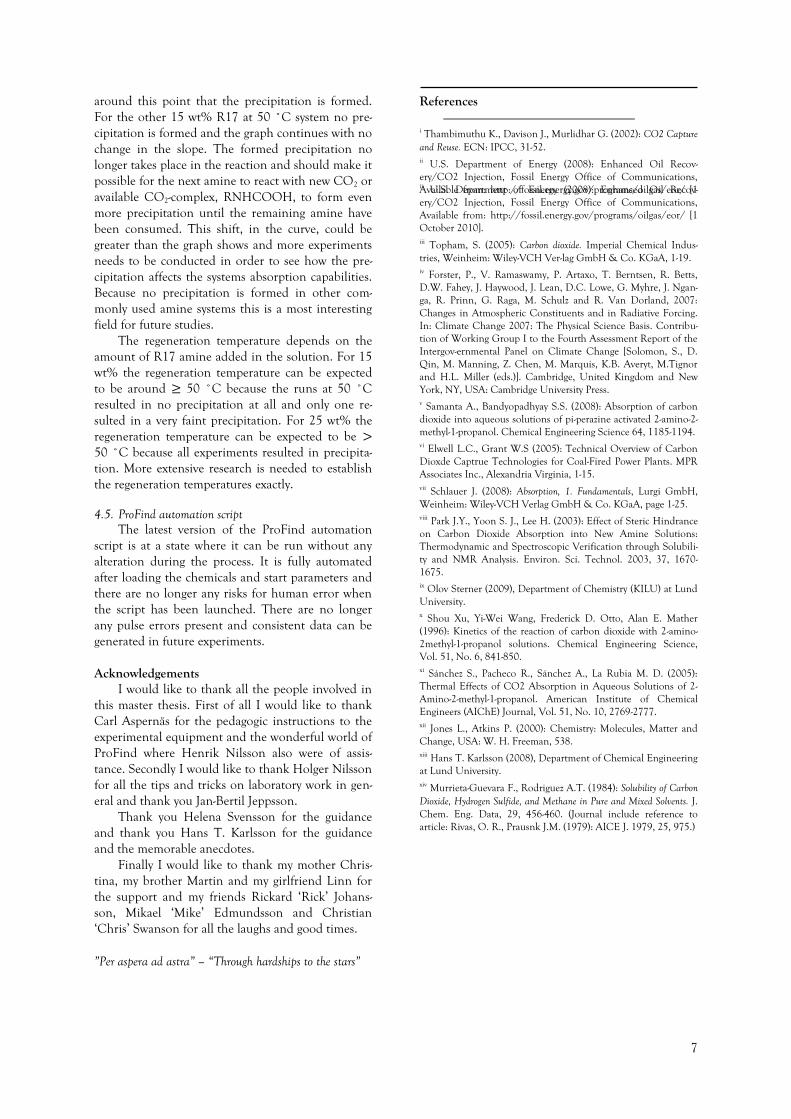
3.6. ProFind automation script In Figure 9, data extracted from an early version
of the ProFind script is shown. This script seeks only stability in true heat flow between each pulse. The pressure does not have enough time to reach equi-librium and more carbon dioxide could possibly be absorbed. Compare this to Figure 10 where the script seeks stability in both pressure (cyan squares)
6
and true heat flow. This takes longer time between each pulse but ensure that equilibrium has been reached.
The Green circles in Figure 9 represents pulse errors because the script for a short period of time believe that it has reached the specified break varia-ble, no such errors are to be found in the latest ver-sion of the script, Figure 10, due to an added timer in each block of the script. As mentioned earlier there is great difference between the original script and the final version which can be seen in the Hen-ry‟s constant graphs, Figure 1.
Figure 9. Pure S18 at 50 ˚C, early version of the script. The cyan squares shows that the pressure is not stable between each pulse. The green circles indicate pulse errors because the script for a short period of time believe that it has reached the specified break variable.
Figure 10. Pure S18 at 50 ˚C, latest version of the script. Cyan squares indicate point where pressure has reached equilibrium. This script also seeks stability in true heat flow between each pulse.
4. Discussion and conclusions The fact that the studied system is comparable
with article data in other commonly used amine systems ensure that S18+R17 can be used to success-fully absorb CO2. More evaluation is needed to confirm how well the absorption possibilities are by performing more experiments with the fully auto-mated script at different compositions, higher tem-peratures and higher pressures. Other interesting future paths for the project could be to add another amine, to form a S18+R17+X system that might have even higher absorption possibilities.
Because the system did not reach the absorption possibilities of the commonly used MEA-system it is possible that raw materials for the S18+R17 system will be more expensive because more wt% R17 than MEA is needed for equivalent absorption. However the plausible low regeneration temperature of R17 could result in a more cost effective recirculation which could favor R17.
4.1 Henry’s constants The calculated Henry‟s constants differ between
the ProFind scripts used. The latest version of the script results in graphs with a closer fit to the article data with a slightly different slope. The latest version of the script makes sure that equilibrium between both pressure and true heat flow is reached and should ensure that as much carbon dioxide as possi-ble is absorbed in the solvents, these are the Henry‟s constants used in the rest of the calculations.
4.2 Carbon dioxide absorption The trend in Figure 2 is that larger amount of
amine and lower temperature equals better absorp-tion. This trend is confirmed in Figure 3 and Figure 4 when comparing experimental data to article data. The R17 solvent does not reach the absorption level of MEA but is close to DEA at the same wt%.
To determine how the systems act at high pres-sure longer experimental runs are needed to make the system reach higher pressures, such runs can be expected to last for several days.
4.3. Heat of absorption and heat of crystallization The calculations of heat of absorption and heat
of crystallization differ depending on how the cus-tom baseline is chosen in CC-report, and more tests are needed to conclude the exact sizes. All the values are negative because dissolution of gases is exother-mic due to the fact that heating decreases the solu-bility of a gas.
Studying Table 1 the -value depends on how long the experiments have been conducted and with which script. For the most part the conducted exper-iments have a fairly equal heat of solution when comparing two separate runs under the same condi-tions while the heat of crystallization differs more depending on the difficulties in modeling the crystal-lization.
4.4. Precipitation When the precipitation forms this will alter the
mass- and energy transfer in the system which is why there is a change in true heat flow, Figure 7. Table 3 shows that stronger precipitation is formed at lower temperature and with more R17.
As can clearly be seen in Figure 8 the system with 15 wt% R17 at 50 ˚C follow each other quite well until a pressure of about 0.225 MPa where one of the graphs derails from the predicted path. It is
7
around this point that the precipitation is formed. For the other 15 wt% R17 at 50 ˚C system no pre-cipitation is formed and the graph continues with no change in the slope. The formed precipitation no longer takes place in the reaction and should make it possible for the next amine to react with new CO2 or available CO2-complex, RNHCOOH, to form even more precipitation until the remaining amine have been consumed. This shift, in the curve, could be greater than the graph shows and more experiments needs to be conducted in order to see how the pre-cipitation affects the systems absorption capabilities. Because no precipitation is formed in other com-monly used amine systems this is a most interesting field for future studies.
The regeneration temperature depends on the amount of R17 amine added in the solution. For 15 wt% the regeneration temperature can be expected to be around 50 ˚C because the runs at 50 ˚C resulted in no precipitation at all and only one re-sulted in a very faint precipitation. For 25 wt% the regeneration temperature can be expected to be 50 ˚C because all experiments resulted in precipita-tion. More extensive research is needed to establish the regeneration temperatures exactly.
4.5. ProFind automation script The latest version of the ProFind automation
script is at a state where it can be run without any alteration during the process. It is fully automated after loading the chemicals and start parameters and there are no longer any risks for human error when the script has been launched. There are no longer any pulse errors present and consistent data can be generated in future experiments.
Acknowledgements
I would like to thank all the people involved in this master thesis. First of all I would like to thank Carl Aspernäs for the pedagogic instructions to the experimental equipment and the wonderful world of ProFind where Henrik Nilsson also were of assis-tance. Secondly I would like to thank Holger Nilsson for all the tips and tricks on laboratory work in gen-eral and thank you Jan-Bertil Jeppsson.
Thank you Helena Svensson for the guidance and thank you Hans T. Karlsson for the guidance and the memorable anecdotes.
Finally I would like to thank my mother Chris-tina, my brother Martin and my girlfriend Linn for the support and my friends Rickard „Rick‟ Johans-son, Mikael „Mike‟ Edmundsson and Christian „Chris‟ Swanson for all the laughs and good times.
”Per aspera ad astra” – “Through hardships to the stars”
References
i Thambimuthu K., Davison J., Murlidhar G. (2002): CO2 Capture and Reuse. ECN: IPCC, 31-52. ii U.S. Department of Energy (2008): Enhanced Oil Recov-ery/CO2 Injection, Fossil Energy Office of Communications, Available from: http://fossil.energy.gov/programs/oilgas/eor/ [1 ii U.S. Department of Energy (2008): Enhanced Oil Recov-ery/CO2 Injection, Fossil Energy Office of Communications, Available from: http://fossil.energy.gov/programs/oilgas/eor/ [1 October 2010]. iii Topham, S. (2005): Carbon dioxide. Imperial Chemical Indus-tries, Weinheim: Wiley-VCH Ver-lag GmbH & Co. KGaA, 1-19. iv Forster, P., V. Ramaswamy, P. Artaxo, T. Berntsen, R. Betts, D.W. Fahey, J. Haywood, J. Lean, D.C. Lowe, G. Myhre, J. Ngan-ga, R. Prinn, G. Raga, M. Schulz and R. Van Dorland, 2007: Changes in Atmospheric Constituents and in Radiative Forcing. In: Climate Change 2007: The Physical Science Basis. Contribu-tion of Working Group I to the Fourth Assessment Report of the Intergov-ernmental Panel on Climate Change [Solomon, S., D. Qin, M. Manning, Z. Chen, M. Marquis, K.B. Averyt, M.Tignor and H.L. Miller (eds.)]. Cambridge, United Kingdom and New York, NY, USA: Cambridge University Press. v Samanta A., Bandyopadhyay S.S. (2008): Absorption of carbon dioxide into aqueous solutions of pi-perazine activated 2-amino-2-methyl-1-propanol. Chemical Engineering Science 64, 1185-1194. vi Elwell L.C., Grant W.S (2005): Technical Overview of Carbon Dioxde Captrue Technologies for Coal-Fired Power Plants. MPR Associates Inc., Alexandria Virginia, 1-15. vii Schlauer J. (2008): Absorption, 1. Fundamentals, Lurgi GmbH, Weinheim: Wiley-VCH Verlag GmbH & Co. KGaA, page 1-25. viii Park J.Y., Yoon S. J., Lee H. (2003): Effect of Steric Hindrance on Carbon Dioxide Absorption into New Amine Solutions: Thermodynamic and Spectroscopic Verification through Solubili-ty and NMR Analysis. Environ. Sci. Technol. 2003, 37, 1670-1675. ix Olov Sterner (2009), Department of Chemistry (KILU) at Lund University. x Shou Xu, Yi-Wei Wang, Frederick D. Otto, Alan E. Mather (1996): Kinetics of the reaction of carbon dioxide with 2-amino-2methyl-1-propanol solutions. Chemical Engineering Science, Vol. 51, No. 6, 841-850. xi Sánchez S., Pacheco R., Sánchez A., La Rubia M. D. (2005): Thermal Effects of CO2 Absorption in Aqueous Solutions of 2-Amino-2-methyl-1-propanol. American Institute of Chemical Engineers (AIChE) Journal, Vol. 51, No. 10, 2769-2777. xii Jones L., Atkins P. (2000): Chemistry: Molecules, Matter and Change, USA: W. H. Freeman, 538. xiii Hans T. Karlsson (2008), Department of Chemical Engineering at Lund University. xiv Murrieta-Guevara F., Rodriguez A.T. (1984): Solubility of Carbon Dioxide, Hydrogen Sulfide, and Methane in Pure and Mixed Solvents. J. Chem. Eng. Data, 29, 456-460. (Journal include reference to article: Rivas, O. R., Prausnk J.M. (1979): AICE J. 1979, 25, 975.)