Embed Size (px)
Citation preview
Hellenic Petroleum Group
Company update
July 2012
11
Contents
• Introduction - Group overview
•Strategy and delivery
•Group business units
•Enhancing competitiveness
•Funding
•Financials
22
A diversified regional energy player undergoing a significant transformation
• A leading regional energy Group, built around its strong R&M asset base
• Hellenic Petroleum has completed its transformational investmentplan, moving to the delivery phase of a significant cash generation improvement
• Solid financial position throughout the cycle, enabling to successfully complete the heavy capex period and manage through Greek crisis and challenges in the region
• Involved in two major privatisations (HP and DEPA)
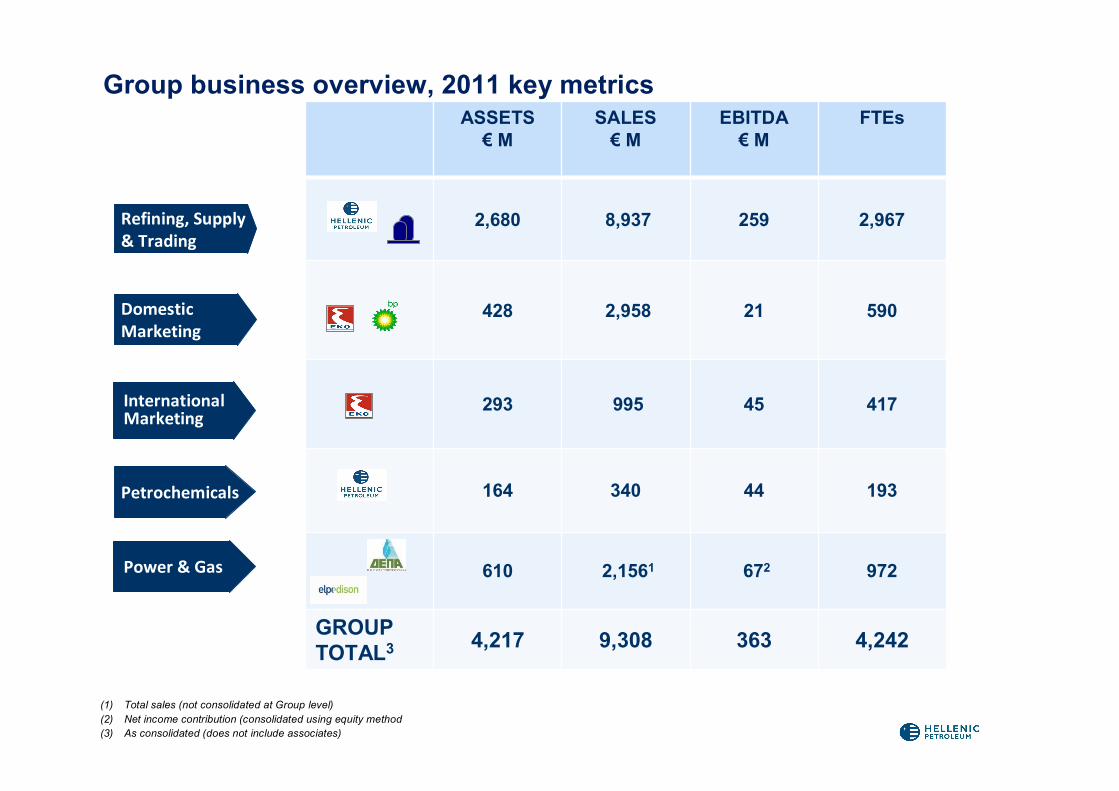
Group business overview, 2011 key metrics
Refining, Supply & Trading
Domestic Marketing
InternationalMarketing
Petrochemicals
Power & Gas
(1) Total sales (not consolidated at Group level)(2) Net income contribution (consolidated using equity method(3) As consolidated (does not include associates)
ASSETS€ Μ
SALES€ Μ
EBITDA€ Μ
FTEs
2,680 8,937 259 2,967
428 2,958 21 590
293 995 45 417
164 340 44 193
610 2,1561 672 972
GROUP TOTAL3 4,217 9,308 363 4,242
44
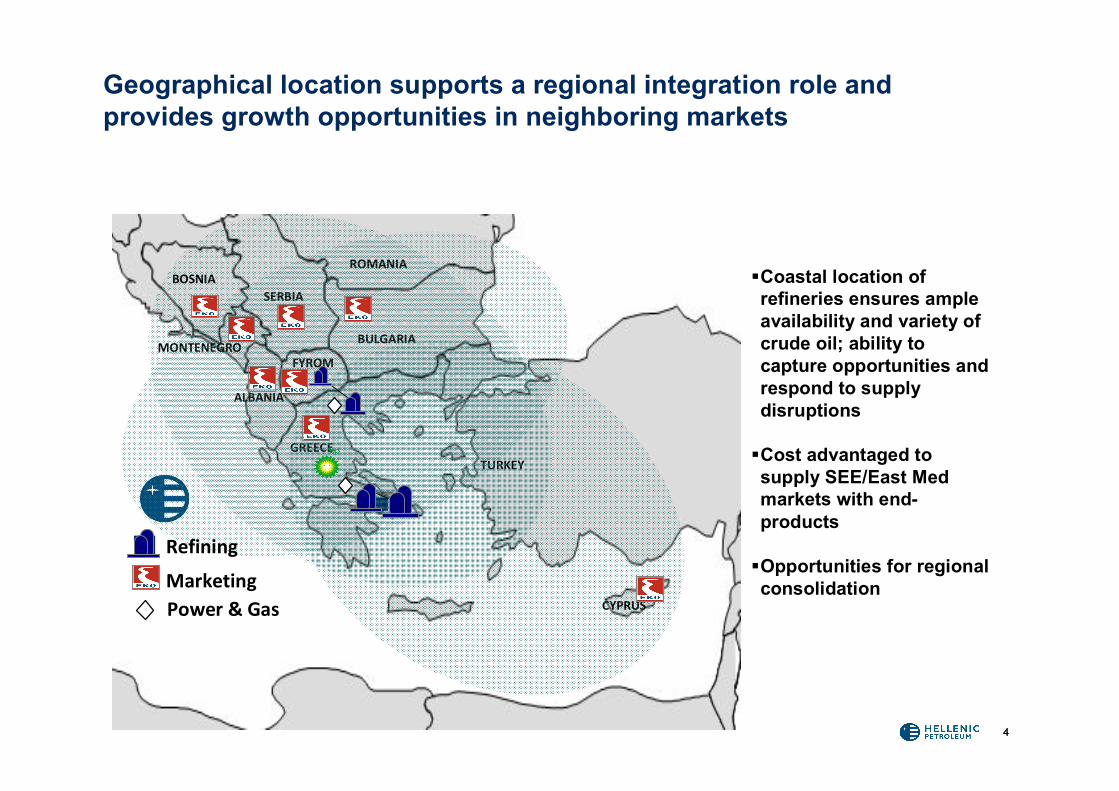
Geographical location supports a regional integration role and provides growth opportunities in neighboring markets
Coastal location of refineries ensures ample availability and variety of crude oil; ability to capture opportunities and respond to supply disruptions
Cost advantaged to supply SEE/East Med markets with end-products
Opportunities for regional consolidation
ROMANIA
TURKEY
BULGARIA
SERBIA
CYPRUS
FYROM
GREECE
ALBANIA
BOSNIA
MONTENEGRO
Refining
MarketingPower & Gas
55
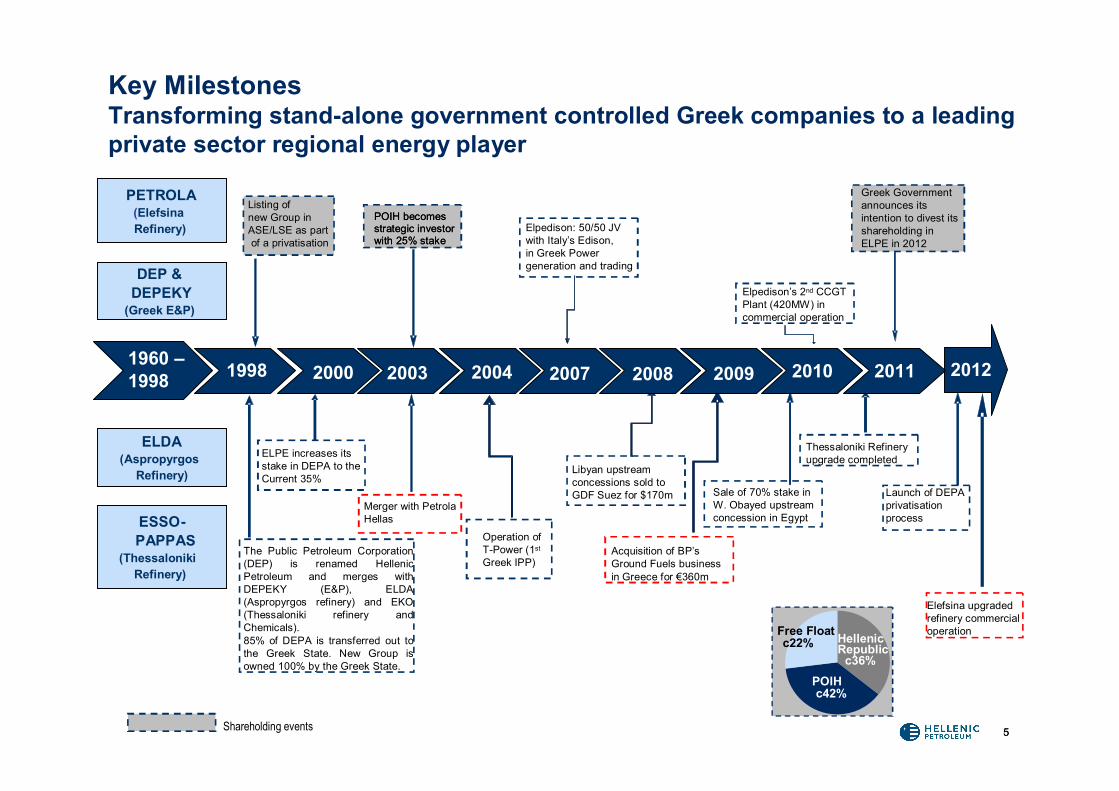
Key MilestonesTransforming stand-alone government controlled Greek companies to a leading private sector regional energy player
PETROLA(ElefsinaRefinery)
DEP & DEPEKY
(Greek E&P)
ELDA(Aspropyrgos
Refinery)
ESSO-PAPPAS
(ThessalonikiRefinery)
PETROLA(ElefsinaRefinery)
DEP & DEPEKY
(Greek E&P)
ELDA(Aspropyrgos
Refinery)
ESSO-PAPPAS
(ThessalonikiRefinery)
1998
ELPE increases itsstake in DEPA to the Current 35%
1960 –1998 2000 2003 2004 2007 2008 2009 2012
Merger with PetrolaHellas
Operation ofT-Power (1st
Greek IPP)
Elpedison: 50/50 JV with Italy’s Edison, in Greek Power generation and trading
Libyan upstreamconcessions sold toGDF Suez for $170m Sale of 70% stake in
W. Obayed upstream concession in Egypt
Elpedison’s 2nd CCGTPlant (420MW) incommercial operation
2010
Thessaloniki Refinery upgrade completed
Free Floatc22%
POIHc42%
Hellenic Republic
c36%
Acquisition of BP’sGround Fuels businessin Greece for €360m
The Public Petroleum Corporation (DEP) is renamed Hellenic Petroleum and merges with DEPEKY (E&P), ELDA (Aspropyrgos refinery) and EKO (Thessaloniki refinery and Chemicals).85% of DEPA is transferred out to the Greek State. New Group is owned 100% by the Greek State.
Shareholding events
Listing of new Group in ASE/LSE as partof a privatisation
POIH becomes strategic investor with 25% stake
POIH becomes strategic investor with 25% stake
Greek Government announces its intention to divest its shareholding in ELPE in 2012
2011
Launch of DEPA privatisation process
Elefsina upgraded refinery commercial operation
66
Contents
• Introduction - Group overview
•Strategy and delivery
•Group business units
•Enhancing competitiveness
•Funding
•Financials
7
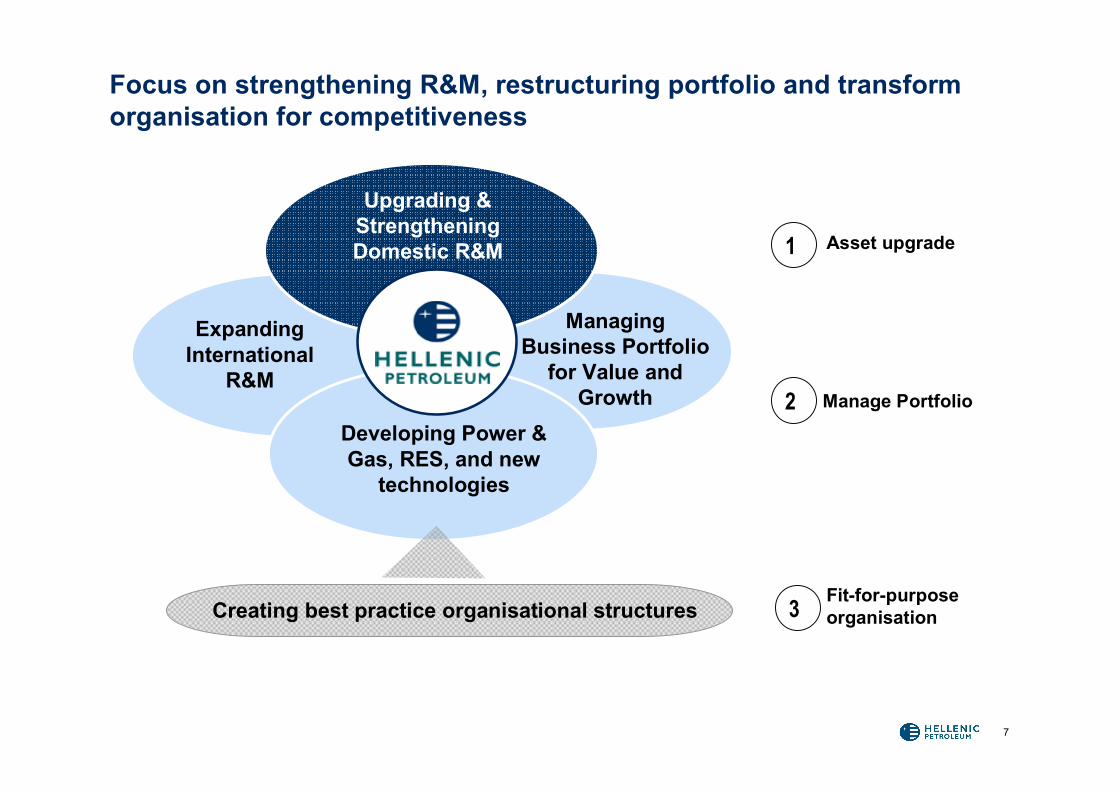
Focus on strengthening R&M, restructuring portfolio and transform organisation for competitiveness
Expanding International
R&M
Managing Business Portfolio
for Value and Growth
Upgrading & Strengthening Domestic R&M
Creating best practice organisational structures
Developing Power & Gas, RES, and new
technologies
1
2
3
Asset upgrade
Manage Portfolio
Fit-for-purpose organisation
450
Historic Average Refining Assets Marketing Assets PortfolioRationalisation
PerformanceImprovement
Medium Term
88
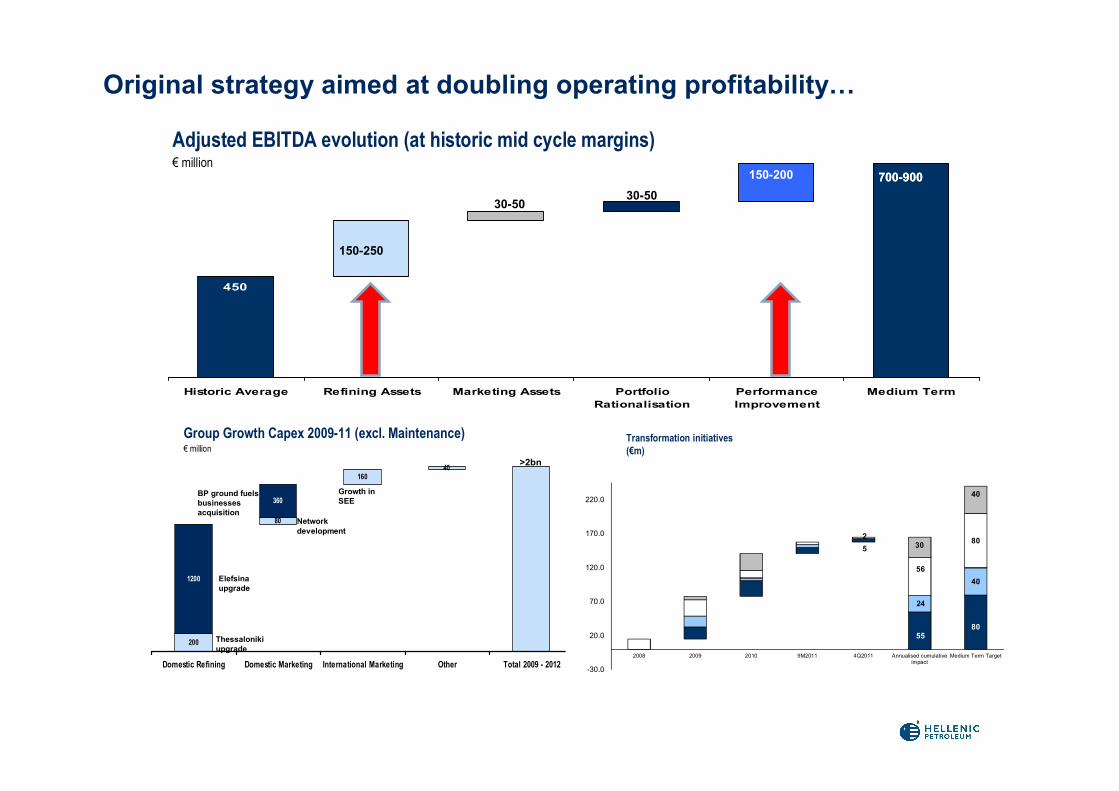
Original strategy aimed at doubling operating profitability…
Adjusted EBITDA evolution (at historic mid cycle margins)€ million
700-900
80
16040
200
360
1200
Domestic Refining Domestic Marketing International Marketing Other Total 2009 - 2012
>2bn
Group Growth Capex 2009-11 (excl. Maintenance)€ million
Elefsina upgrade
Thessaloniki upgrade
BP ground fuels businesses acquisition
Network development
Growth in SEE
Other
5
5580
24
40
2
56
8030
40
-30.0
20.0
70.0
120.0
170.0
220.0
2008 2009 2010 9M2011 4Q2011 Annualised cumulativeimpact
Medium Term Target
Transformation initiatives (€m)
150-250
150-200
30-5030-50
700-900
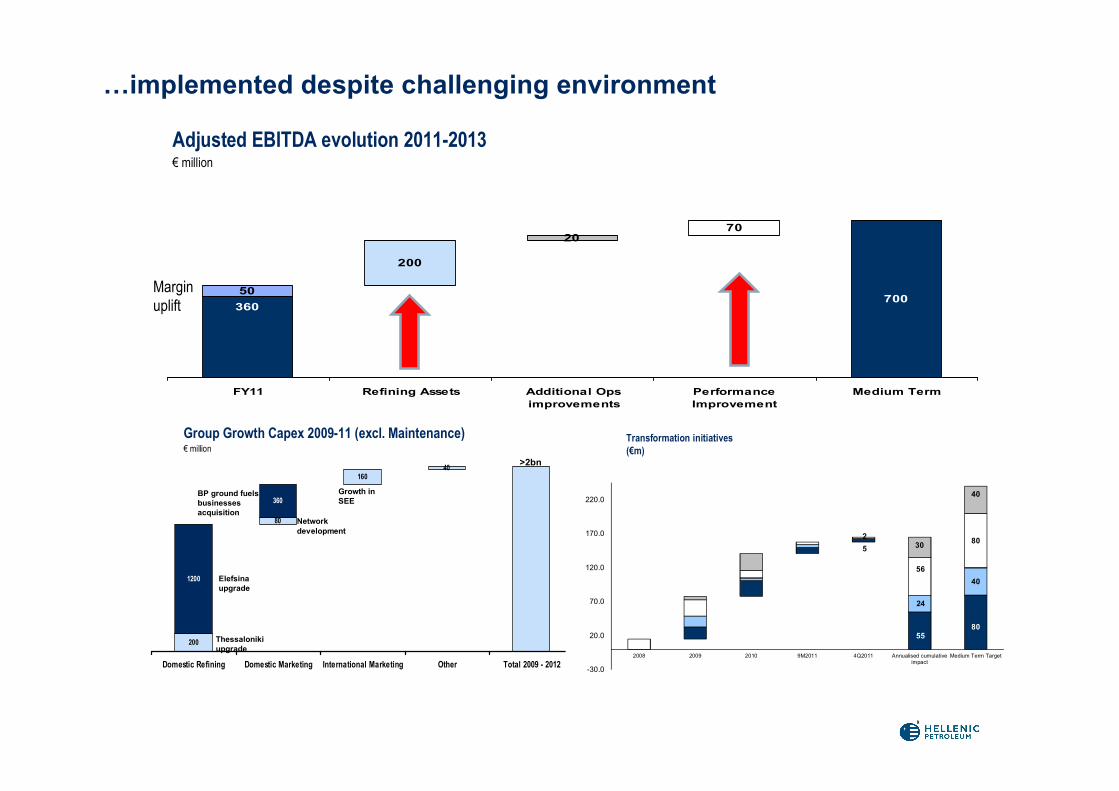
36050
200
2070
700
FY11 Refining Assets Additional Opsimprovements
PerformanceImprovement
Medium Term
99
…implemented despite challenging environment
Adjusted EBITDA evolution 2011-2013€ million
700-900
80
16040
200
360
1200
Domestic Refining Domestic Marketing International Marketing Other Total 2009 - 2012
>2bn
Group Growth Capex 2009-11 (excl. Maintenance)€ million
Elefsina upgrade
Thessaloniki upgrade
BP ground fuels businesses acquisition
Network development
Growth in SEE
Other
5
5580
24
40
2
56
8030
40
-30.0
20.0
70.0
120.0
170.0
220.0
2008 2009 2010 9M2011 4Q2011 Annualised cumulativeimpact
Medium Term Target
Transformation initiatives (€m)
150-200 700-900
Margin uplift
1010
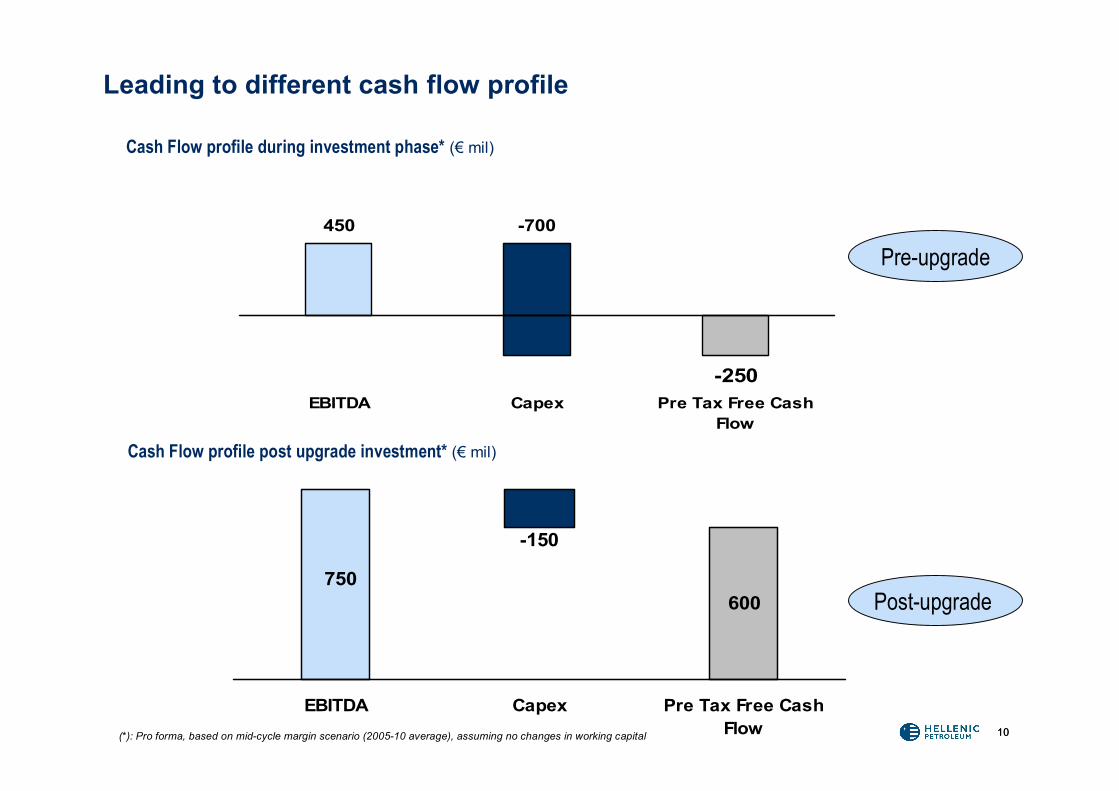
600
-150
750
EBITDA Capex Pre Tax Free CashFlow
Leading to different cash flow profile
Cash Flow profile during investment phase* (€ mil)
Cash Flow profile post upgrade investment* (€ mil)
(*): Pro forma, based on mid-cycle margin scenario (2005-10 average), assuming no changes in working capital
450 -700
-250EBITDA Capex Pre Tax Free Cash
Flow
Pre-upgrade
Post-upgrade
1111
Contents
• Introduction - Group overview
•Strategy and delivery
•Group business units
•Enhancing competitiveness
•Funding
•Financials
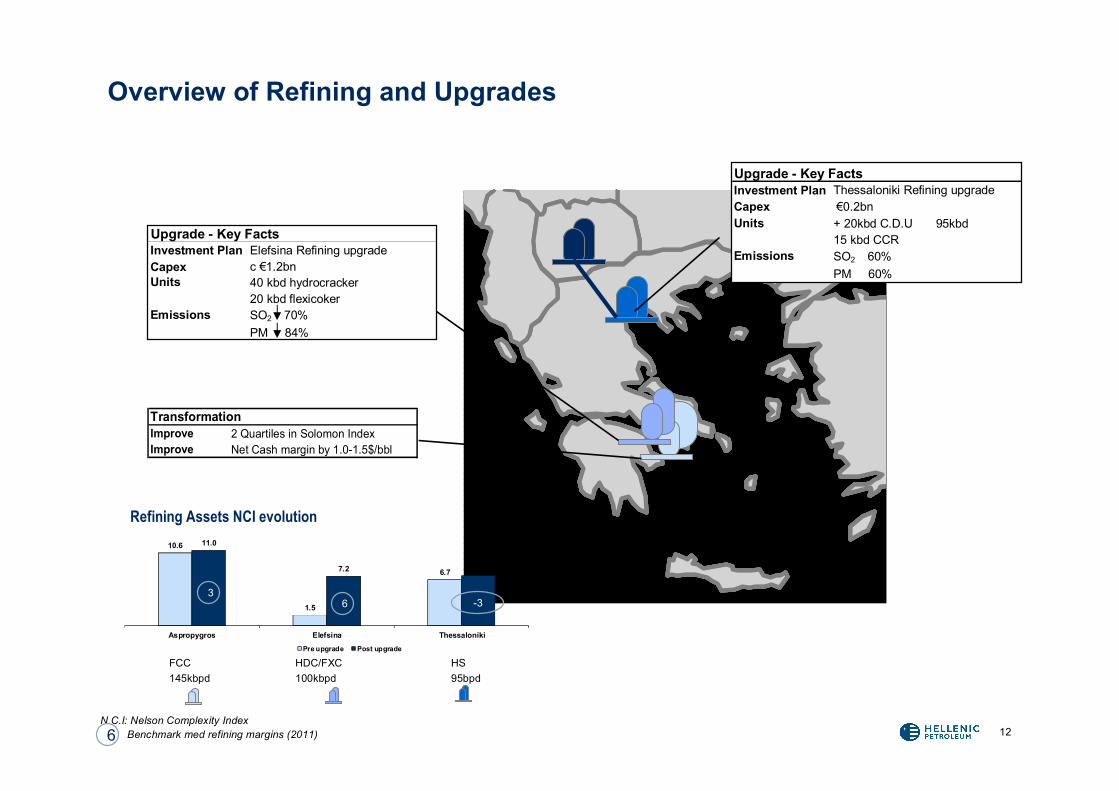
10.6
1.5
6.7
11.0
7.2 7.3
Aspropygros Elefsina Thessaloniki
Pre upgrade Post upgrade
12
Upgrade - Key FactsInvestment Plan Elefsina Refining upgrade Capex c €1.2bn Units 40 kbd hydrocracker
20 kbd flexicoker Emissions SO2 70%
PM 84%
Overview of Refining and Upgrades
N.C.I: Nelson Complexity IndexBenchmark med refining margins (2011)
Transformation
Improve Net Cash margin by 1.0-1.5$/bblImprove 2 Quartiles in Solomon Index
c. €200m
Upgrade - Key Facts (Completed) Upgrade - Key FactsInvestment Plan Thessaloniki Refining upgrade Capex €0.2bnUnits + 20kbd C.D.U 95kbd
15 kbd CCREmissions SO2 60%
PM 60%
FCC HDC/FXC HS145kbpd 100kbpd 95bpd
Refining Assets NCI evolution
6
6
-33
13
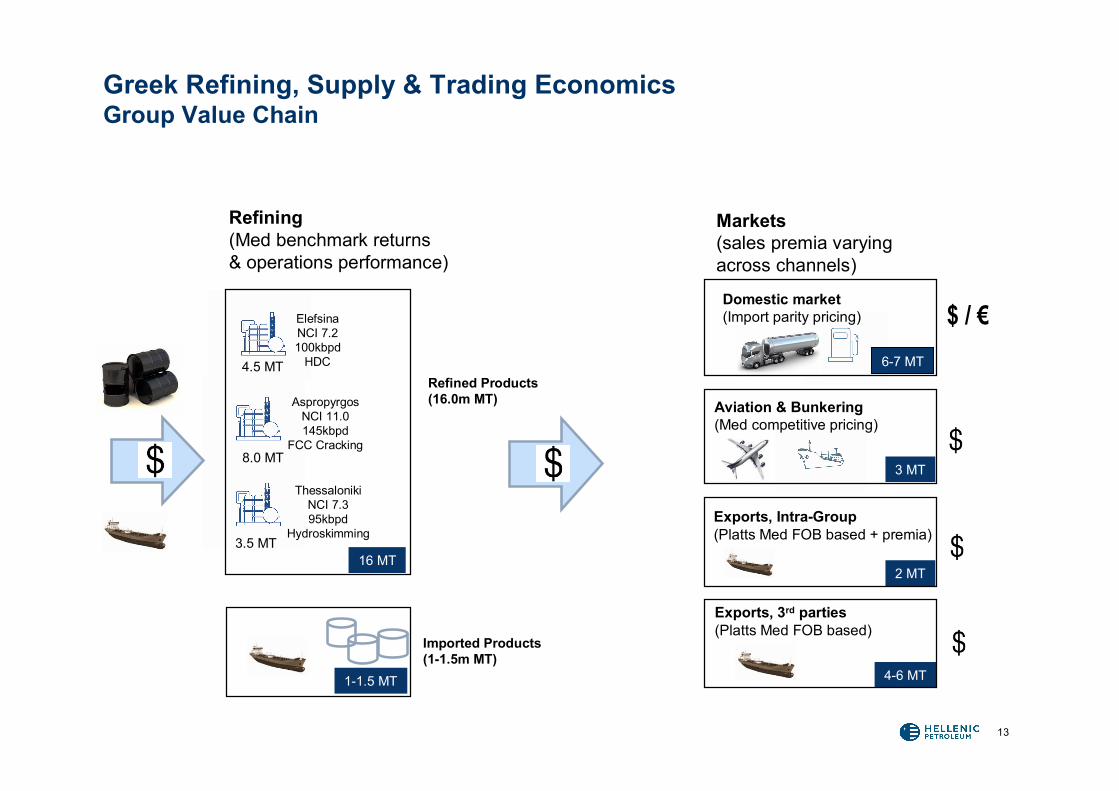
Greek Refining, Supply & Trading EconomicsGroup Value Chain
Markets(sales premia varying across channels)
Refining(Med benchmark returns & operations performance)
Refined Products(16.0m MT)
Imported Products(1-1.5m MT)
Aviation & Bunkering (Med competitive pricing)
Exports, Intra-Group (Platts Med FOB based + premia)
Domestic market (Import parity pricing)
4-6 MT
3 MT
Exports, 3rd parties (Platts Med FOB based)
2 MT
6-7 MT
AspropyrgosNCI 11.0145kbpd
FCC Cracking
ThessalonikiNCI 7.395kbpd
Hydroskimming
ElefsinaNCI 7.2100kbpd
HDC
3.5 MT
8.0 MT
4.5 MT
16 MT
1-1.5 MT
$ / €
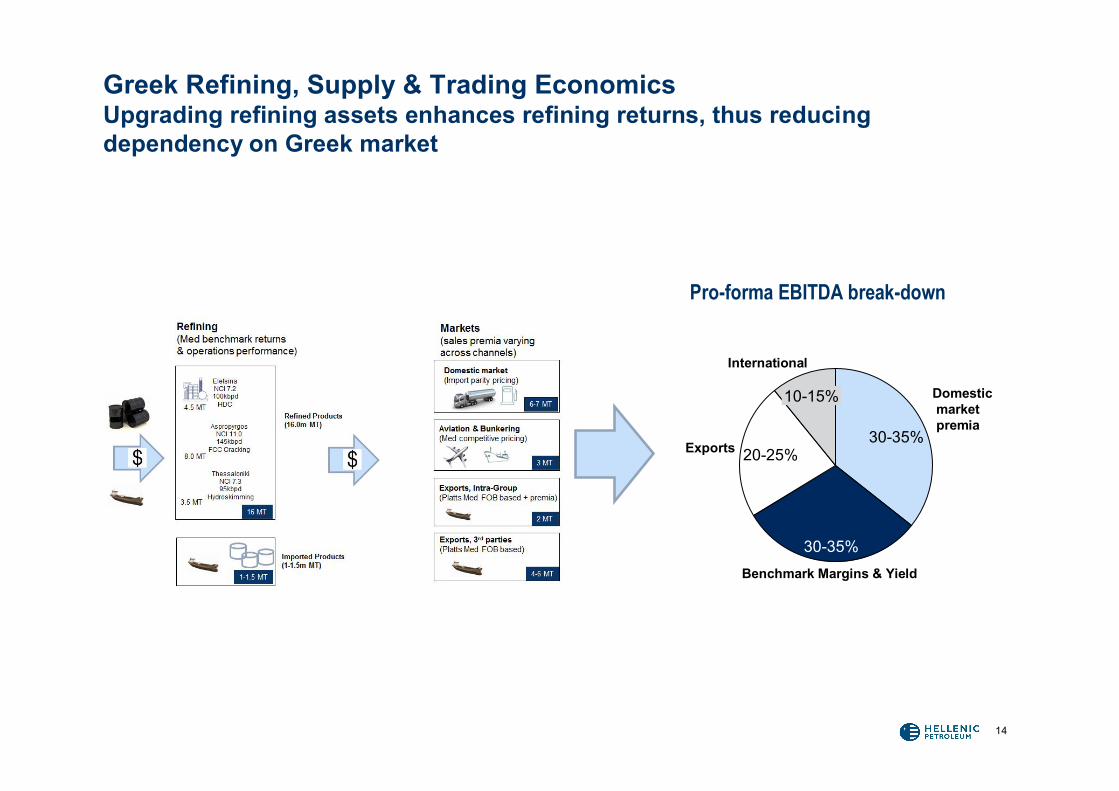
Greek Refining, Supply & Trading EconomicsUpgrading refining assets enhances refining returns, thus reducing dependency on Greek market
12%
Benchmark Margins & Yield
20-25%
Domesticmarketpremia
30-35%
International
10-15%
30-35%
Exports
14
Pro-forma EBITDA break-down
15
Elefsina Refinery Upgrade Overview
• Elefsina Refinery, a 100kbpd coastal topping refinery with private port and a tank farm of 3,3 mln M3, is transformed to a top cash net-back refinery through a major upgrade
• Largest manufacturing project in SEE Europe:– Second fully converted European refinery combining a hydrocracker and a flexicocker– Middle distillates and naphtha producer
• Event-free commissioning phase; commercial operation over the next few weeks
• Start-up teams and new refinery organisation fully in place
• Elefsina Refinery upgrade will impact Group cash generation from 3Q12 onwards
• Incremental export capacity reduces Group’s dependence on Greek market
16
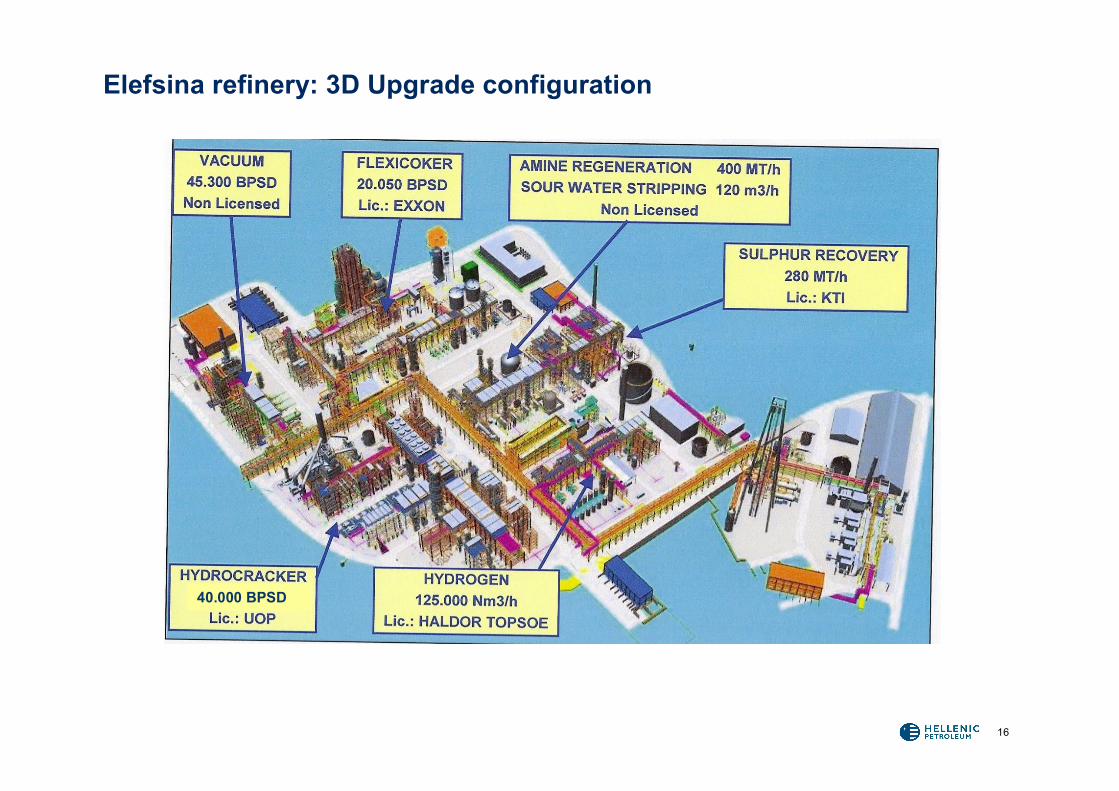
Elefsina refinery: 3D Upgrade configuration
40.000 BPSD
17
Vacu
umU
nit
Atm
osph
eric
Dis
tilla
tion
Hyd
rocr
acke
r (U
OP)
Flex
icok
er(E
xxon
Mob
il)
Ker
osen
eSw
eete
ning
New units, Sulphur, Amine, SWS
Die
sel
Des
ulph
uriz
atio
n
LPG
Naphtha
Jet Fuel
AutoDiesel
Petcoke or Flexigas
Sulphur
Propane
HeatingDiesel
MarineDiesel
Ligh
t End
s
Rec
over
y
Crude
Existing Units
New Units
Hydrogen (Haldor Topsoe)
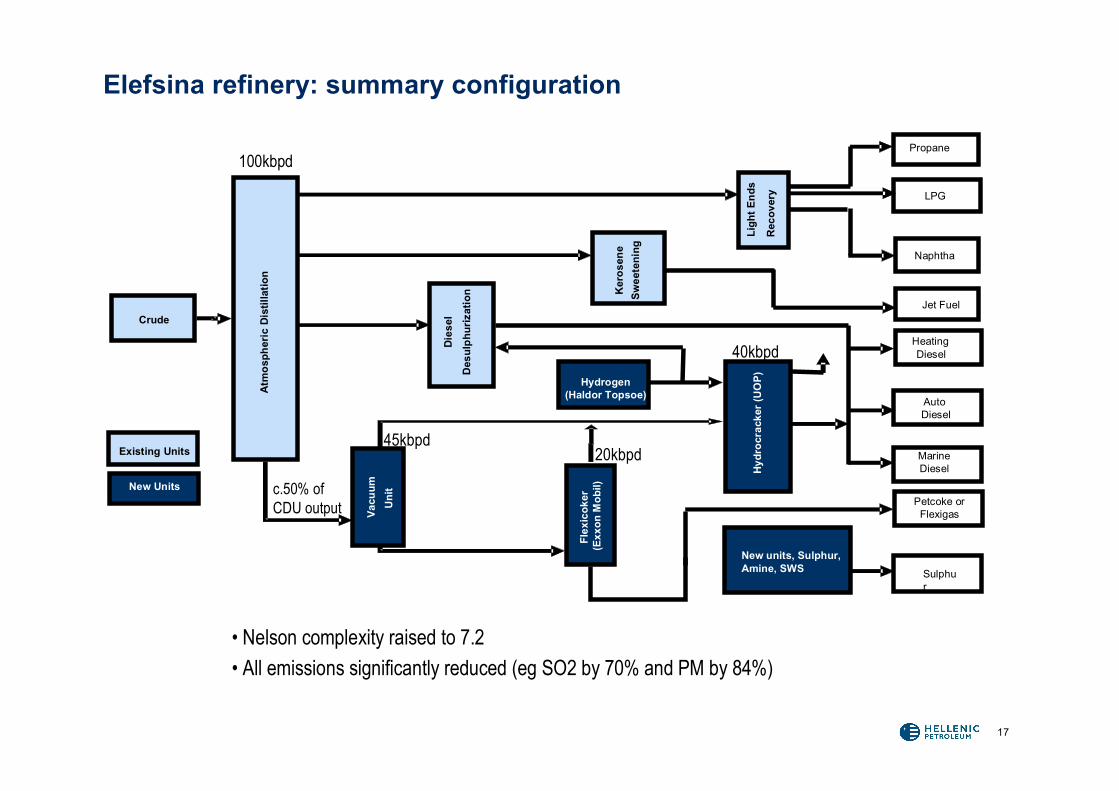
Elefsina refinery: summary configuration
20kbpd
40kbpd
c.50% of CDU output
• Nelson complexity raised to 7.2• All emissions significantly reduced (eg SO2 by 70% and PM by 84%)
100kbpd
45kbpd
-5
0
5
10
15
20
25
JAN
07
APR
07
JUL0
7
OC
T07
JAN
08
APR
08
JUL0
8
OC
T08
JAN
09
APR
09
JUL0
9
OC
T09
JAN
10
APR
10
JUL1
0
OC
T10
JAN
11
APR
11
Jul-1
1
Oct
-11
Jan-
12
Apr
-12
Aspropyrgos Elefsina
0
100
200
300
400
Jan
09
Mar
09
May
09
Jul 0
9Se
p 09
Nov
09
Jan
10M
ar 1
0
May
10
Jul 1
0
Sep
10
Nov
10
Jan
11
Mar
11
May
11
Jul 1
1
Sep
11N
ov 1
1
Jan
12
Mar
12
May
12
18
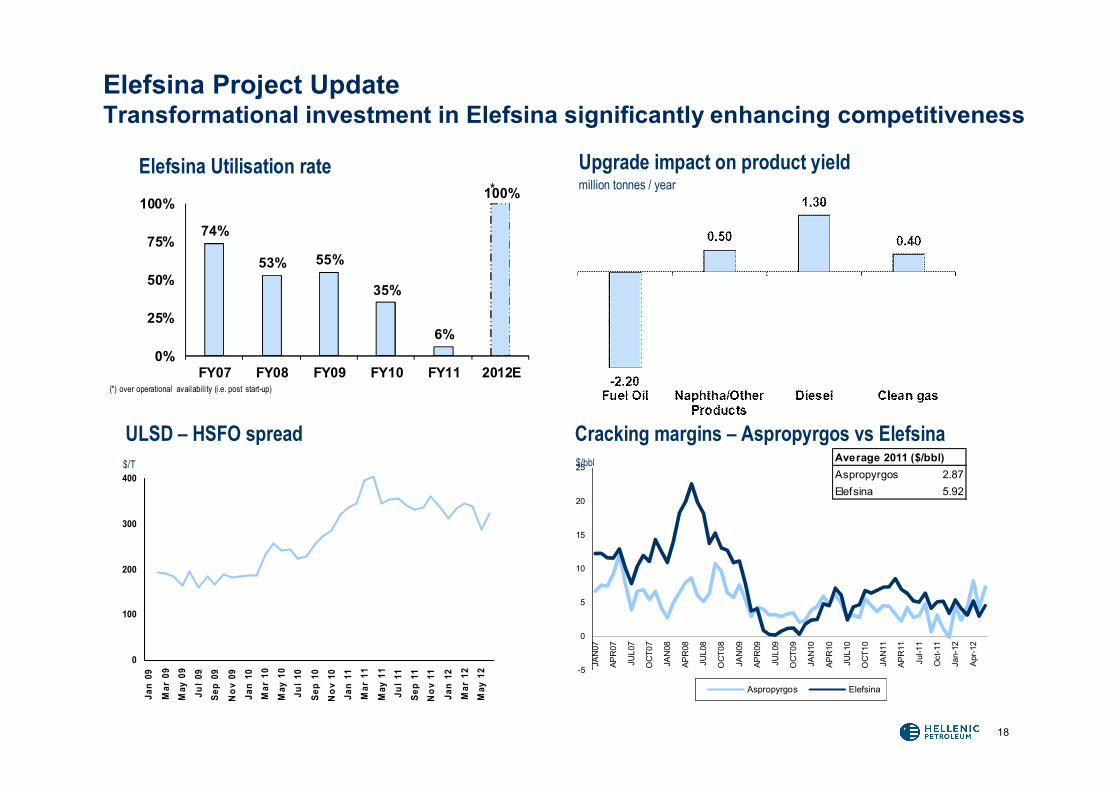
Elefsina Project UpdateTransformational investment in Elefsina significantly enhancing competitiveness
$/bbl$/T
ULSD – HSFO spread Cracking margins – Aspropyrgos vs ElefsinaAverage 2011 ($/bbl)Aspropyrgos 2.87Elefsina 5.92
Elefsina Utilisation rate*
Upgrade impact on product yieldmillion tonnes / year
74%
53% 55%
35%
6%
100%
0%
25%
50%
75%
100%
FY07 FY08 FY09 FY10 FY11 2012E(*) over operational availabili ty (i.e. post start-up)
19
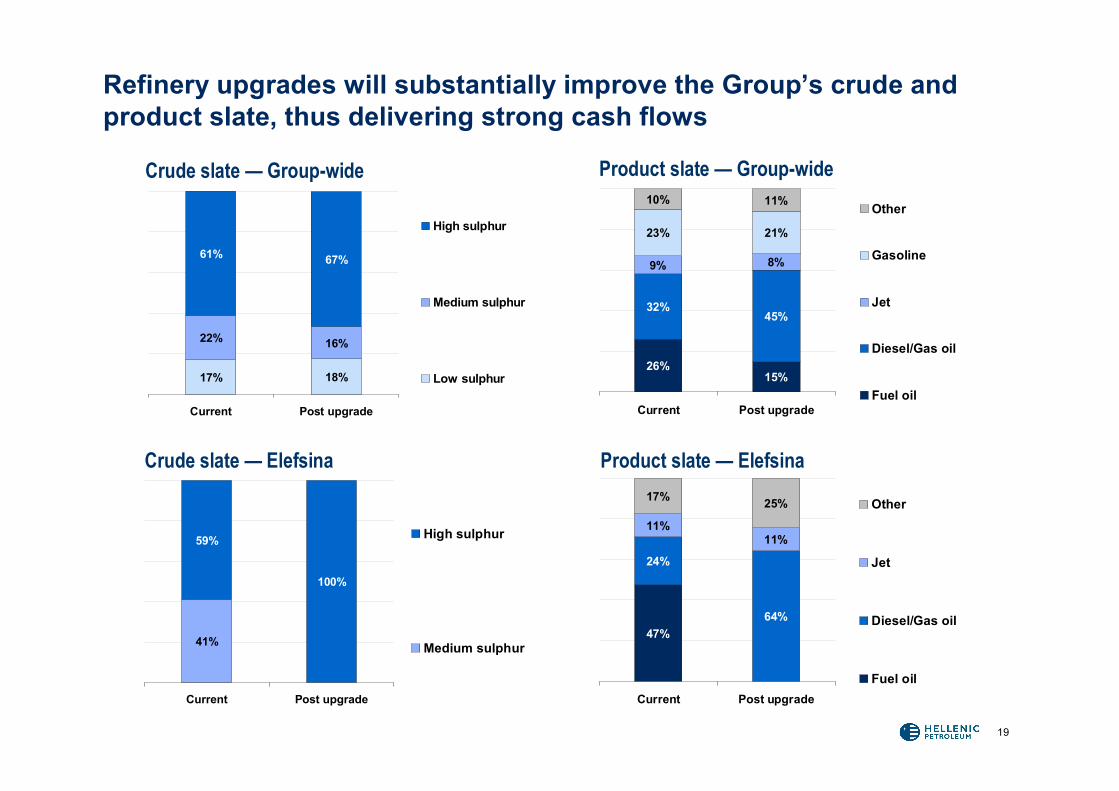
Refinery upgrades will substantially improve the Group’s crude and product slate, thus delivering strong cash flows
26%15%
32%45%
9% 8%
23% 21%
10% 11%
Current Post upgrade
Other
Gasoline
Jet
Diesel/Gas oil
Fuel oil17% 18%
22% 16%
61% 67%
Current Post upgrade
High sulphur
Medium sulphur
Low sulphur
47%
24%
11%11%
17% 25%
64%
Current Post upgrade
Other
Jet
Diesel/Gas oil
Fuel oil
Crude slate — Group-wide Product slate — Group-wide
Crude slate — Elefsina Product slate — Elefsina
41%
59%
100%
Current Post upgrade
High sulphur
Medium sulphur
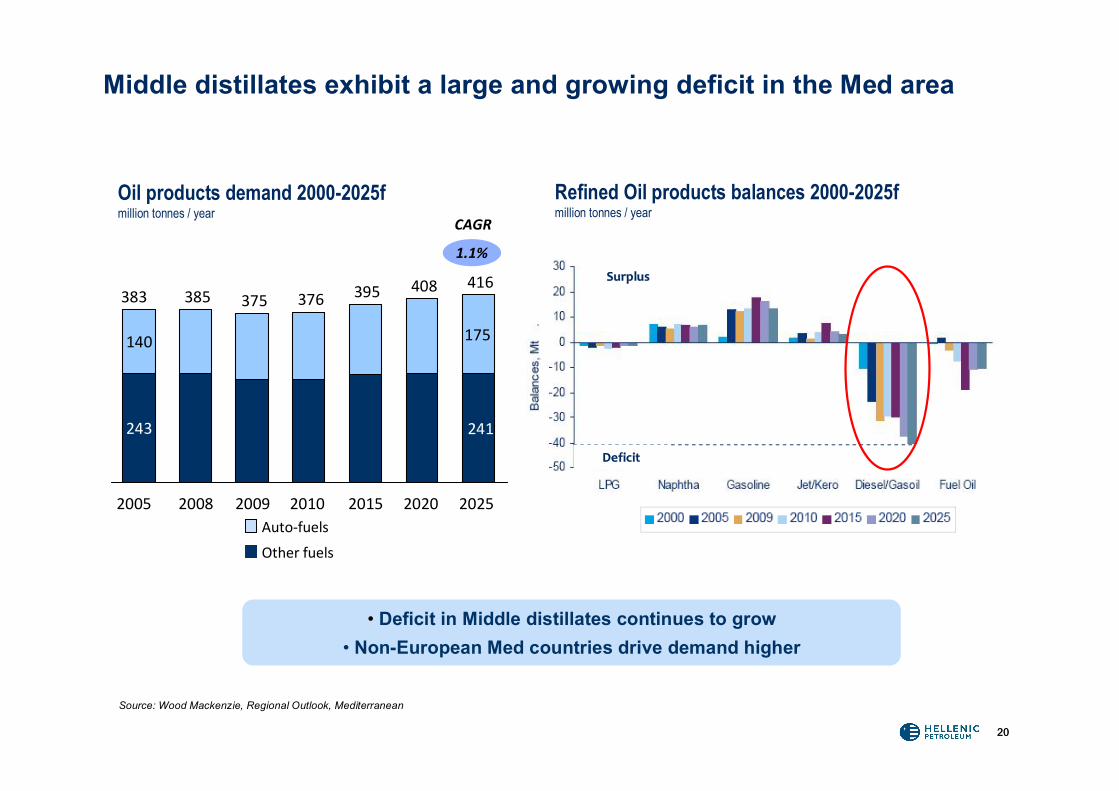
2020
Source: Wood Mackenzie, Regional Outlook, Mediterranean
Other fuels
Auto-fuels
CAGR
1.1%
SurplusSurplus
DeficitDeficit
Oil products demand 2000-2025fmillion tonnes / year
• Deficit in Middle distillates continues to grow• Non-European Med countries drive demand higher
Refined Oil products balances 2000-2025fmillion tonnes / year
Middle distillates exhibit a large and growing deficit in the Med area
140
243
383
2005
385
2008
375
2009
376
2010
395
2015
408
2020
175
241
416
2025
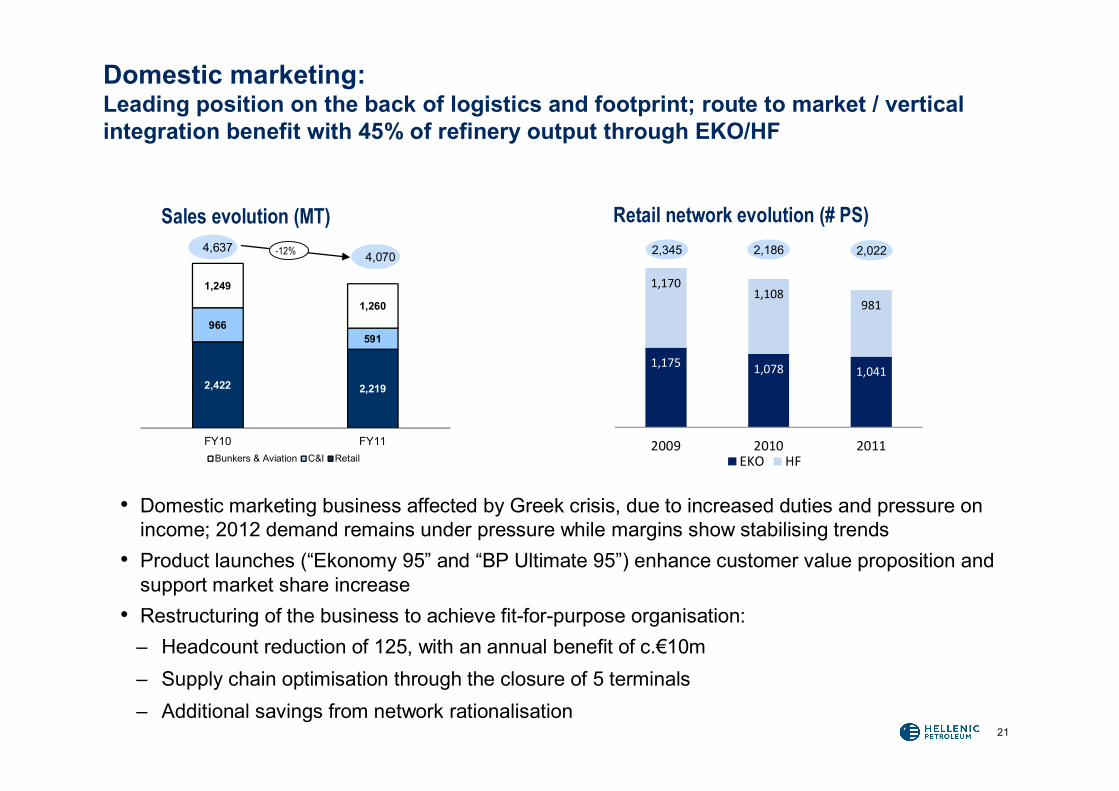
1,175 1,078 1,041
1,1701,108
981
2009 2010 2011EKO HF
21
Domestic marketing: Leading position on the back of logistics and footprint; route to market / vertical integration benefit with 45% of refinery output through EKO/HF
Sales evolution (MT) Retail network evolution (# PS)2,345 2,186 2,022
2,422 2,219
966591
1,249
1,260
FY10 FY11Bunkers & Aviation C&I Retail
4,6374,070-12%
• Domestic marketing business affected by Greek crisis, due to increased duties and pressure on income; 2012 demand remains under pressure while margins show stabilising trends
• Product launches (“Ekonomy 95” and “BP Ultimate 95”) enhance customer value proposition and support market share increase
• Restructuring of the business to achieve fit-for-purpose organisation:– Headcount reduction of 125, with an annual benefit of c.€10m – Supply chain optimisation through the closure of 5 terminals– Additional savings from network rationalisation
2222
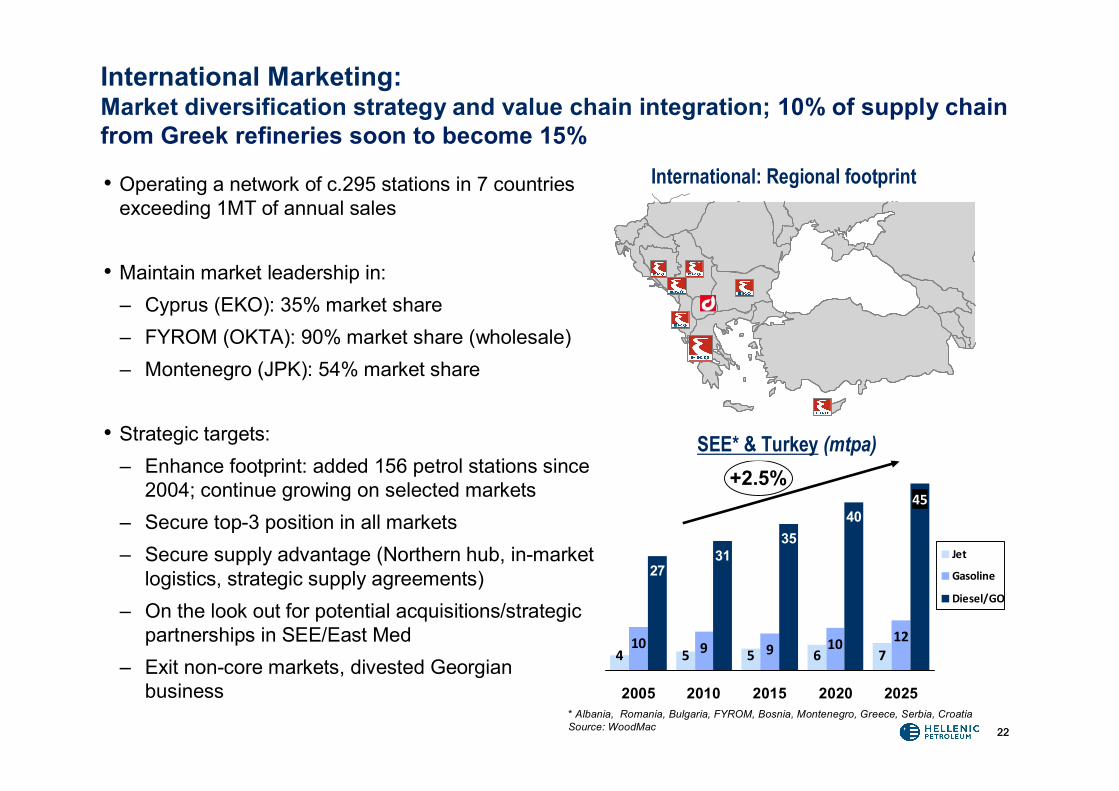
• Operating a network of c.295 stations in 7 countries exceeding 1MT of annual sales
• Maintain market leadership in:– Cyprus (EKO): 35% market share– FYROM (OKTA): 90% market share (wholesale)– Montenegro (JPK): 54% market share
• Strategic targets:– Enhance footprint: added 156 petrol stations since
2004; continue growing on selected markets– Secure top-3 position in all markets– Secure supply advantage (Northern hub, in-market
logistics, strategic supply agreements)– On the look out for potential acquisitions/strategic
partnerships in SEE/East Med– Exit non-core markets, divested Georgian
business
International Marketing: Market diversification strategy and value chain integration; 10% of supply chain from Greek refineries soon to become 15%
International: Regional footprint
4 5 5 610 9 9 10
2731
3540
712
45
2005 2010 2015 2020 2025
Jet
Gasoline
Diesel/GO
+2.5%SEE* & Turkey (mtpa)
* Albania, Romania, Bulgaria, FYROM, Bosnia, Montenegro, Greece, Serbia, CroatiaSource: WoodMac
2323
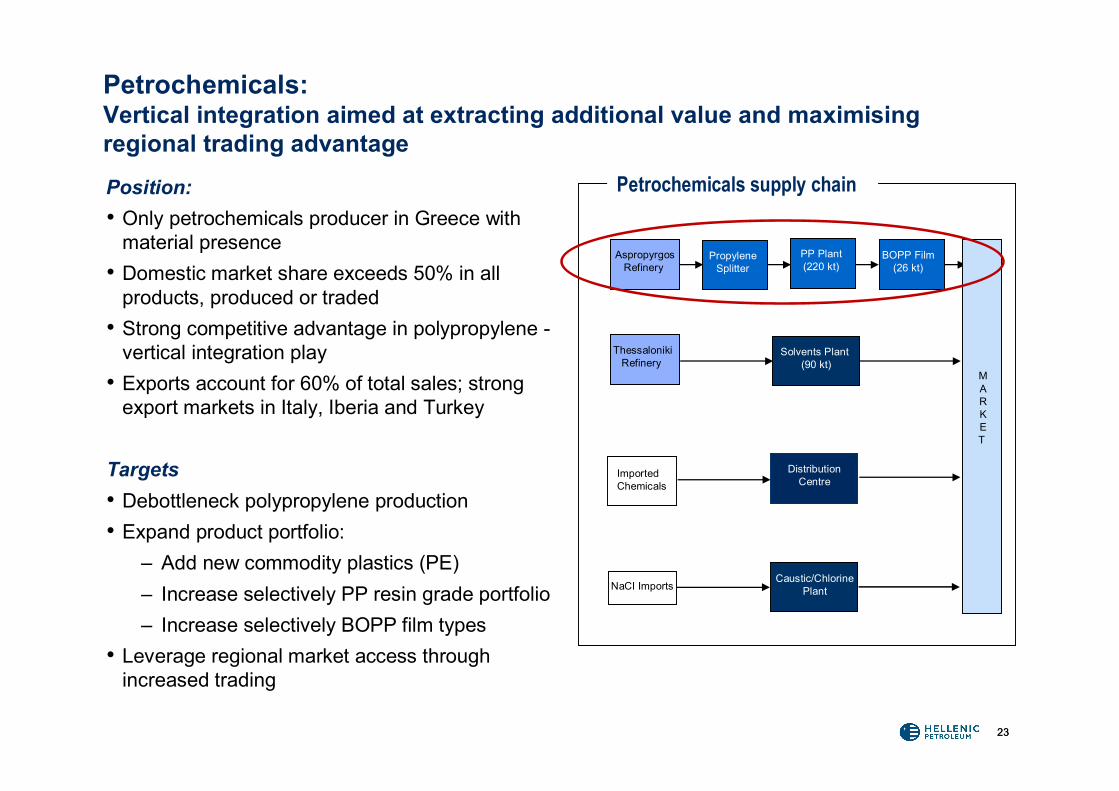
Petrochemicals: Vertical integration aimed at extracting additional value and maximising regional trading advantage
Position:• Only petrochemicals producer in Greece with
material presence• Domestic market share exceeds 50% in all
products, produced or traded• Strong competitive advantage in polypropylene -
vertical integration play• Exports account for 60% of total sales; strong
export markets in Italy, Iberia and Turkey
Targets• Debottleneck polypropylene production • Expand product portfolio:
– Add new commodity plastics (PE)– Increase selectively PP resin grade portfolio– Increase selectively BOPP film types
• Leverage regional market access through increased trading
Petrochemicals supply chain
(90 kt)
ThessalonikiRefinery
Solvents Plant (90 kt)
Caustic/ChlorinePlantNaCI Imports
AspropyrgosRefinery
BOPP Film(26 kt)
PP Plant(220 kt)
PropyleneSplitter
ImportedChemicals
DistributionCentre
MARKET
2424
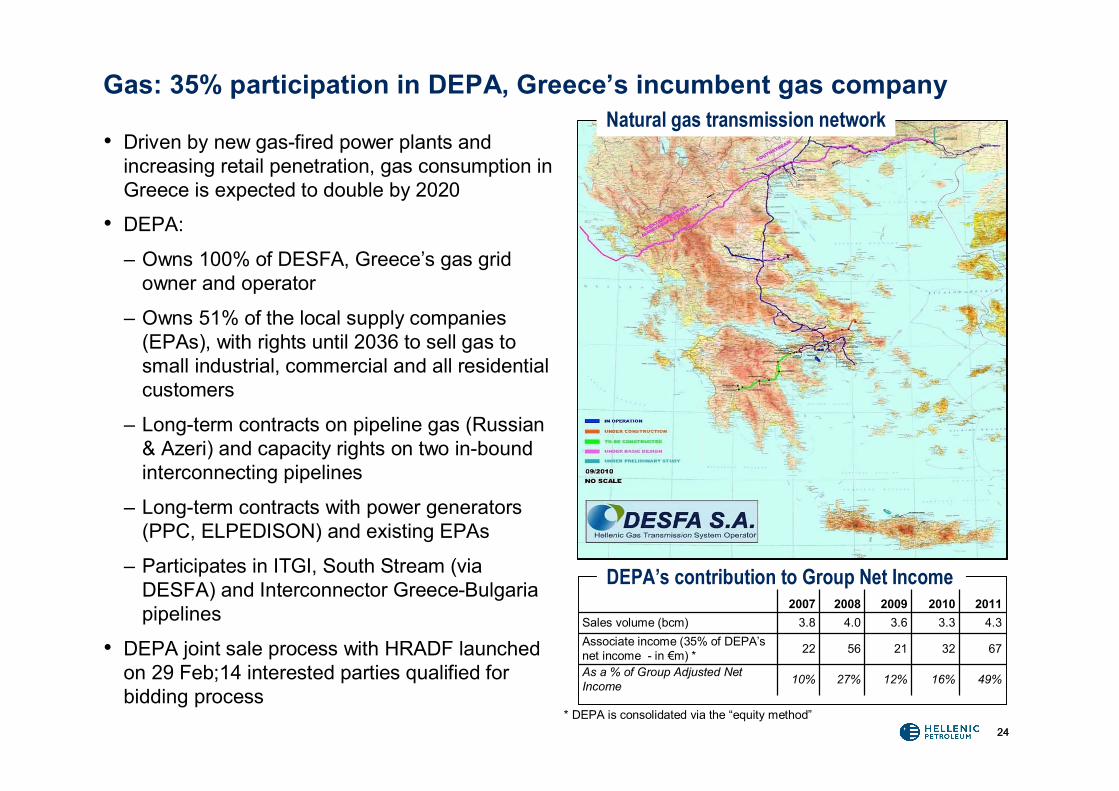
Gas: 35% participation in DEPA, Greece’s incumbent gas company
• Driven by new gas-fired power plants and increasing retail penetration, gas consumption in Greece is expected to double by 2020
• DEPA:
– Owns 100% of DESFA, Greece’s gas grid owner and operator
– Owns 51% of the local supply companies (EPAs), with rights until 2036 to sell gas to small industrial, commercial and all residential customers
– Long-term contracts on pipeline gas (Russian & Azeri) and capacity rights on two in-bound interconnecting pipelines
– Long-term contracts with power generators (PPC, ELPEDISON) and existing EPAs
– Participates in ITGI, South Stream (via DESFA) and Interconnector Greece-Bulgaria pipelines
• DEPA joint sale process with HRADF launched on 29 Feb;14 interested parties qualified for bidding process
DEPA’s contribution to Group Net Income2007 2008 2009 2010 2011
Sales volume (bcm) 3.8 4.0 3.6 3.3 4.3Associate income (35% of DEPA’s net income - in €m) * 22 56 21 32 67
As a % of Group Adjusted Net Income 10% 27% 12% 16% 49%
* DEPA is consolidated via the “equity method”
Natural gas transmission network
2525
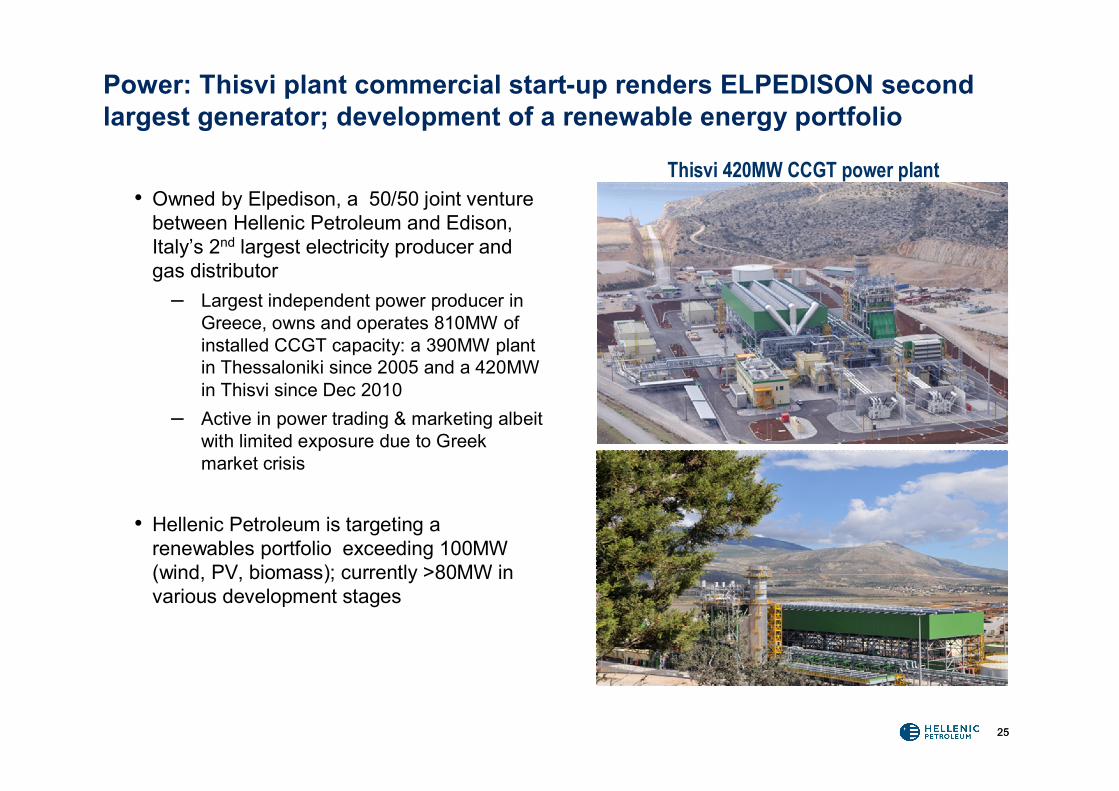
Power: Thisvi plant commercial start-up renders ELPEDISON second largest generator; development of a renewable energy portfolio
Thisvi 420MW CCGT power plant • Owned by Elpedison, a 50/50 joint venture
between Hellenic Petroleum and Edison, Italy’s 2nd largest electricity producer and gas distributor
– Largest independent power producer in Greece, owns and operates 810MW of installed CCGT capacity: a 390MW plant in Thessaloniki since 2005 and a 420MW in Thisvi since Dec 2010
– Active in power trading & marketing albeit with limited exposure due to Greek market crisis
• Hellenic Petroleum is targeting a renewables portfolio exceeding 100MW (wind, PV, biomass); currently >80MW in various development stages
2626
Contents
• Introduction - Group overview
•Strategy and delivery
•Group business units
•Enhancing competitiveness
•Funding
•Financials
3
5880
3
27
40
2
58
80
4
34
40
-30
20
70
120
170
220
2008 2009 2010 2011 1Q2012 Annualised cumulativeimpact
Medium Term Target
2727
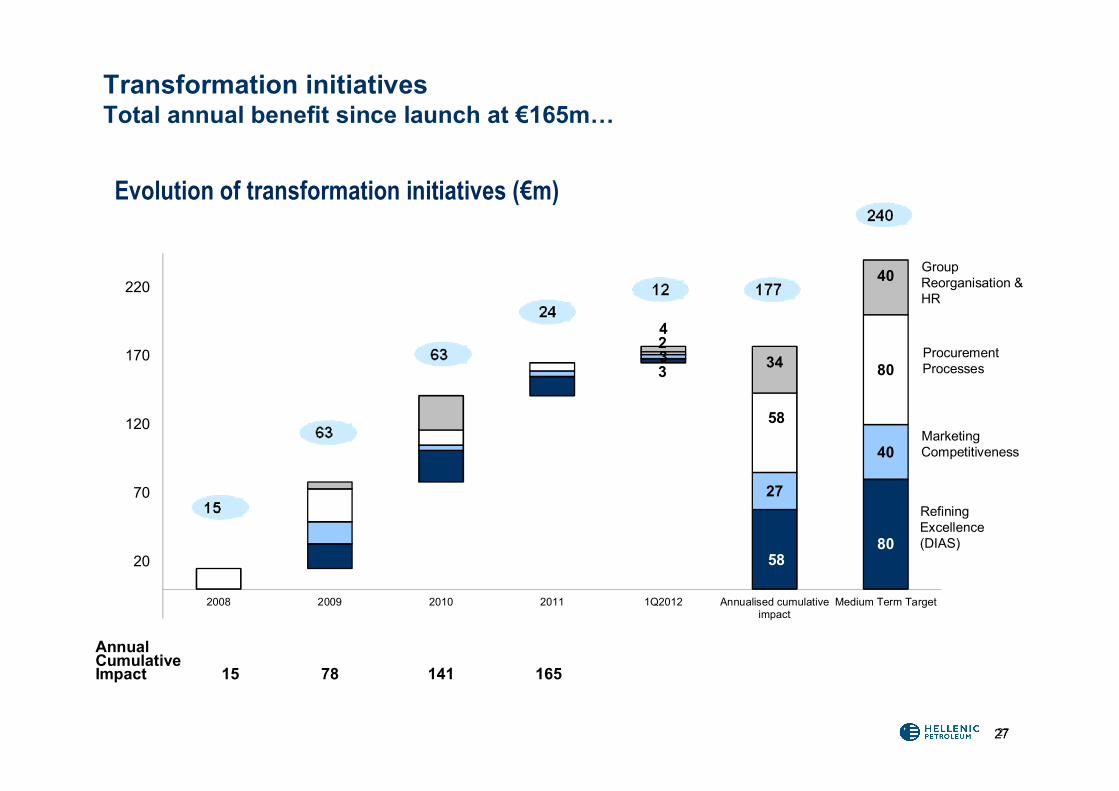
Transformation initiativesTotal annual benefit since launch at €165m…
Evolution of transformation initiatives (€m)
Annual Cumulative Impact 15 78 141 165
Group Reorganisation & HR
Procurement Processes
Marketing Competitiveness
Refining Excellence (DIAS)
466526
458506
301357
233
7
61
117
130
7.3 7.22 7.076.77
3.74
4.38
2.87
0
100
200
300
400
500
600
700
800
2005 2006 2007 2008 2009 2010 2011
EURm
28
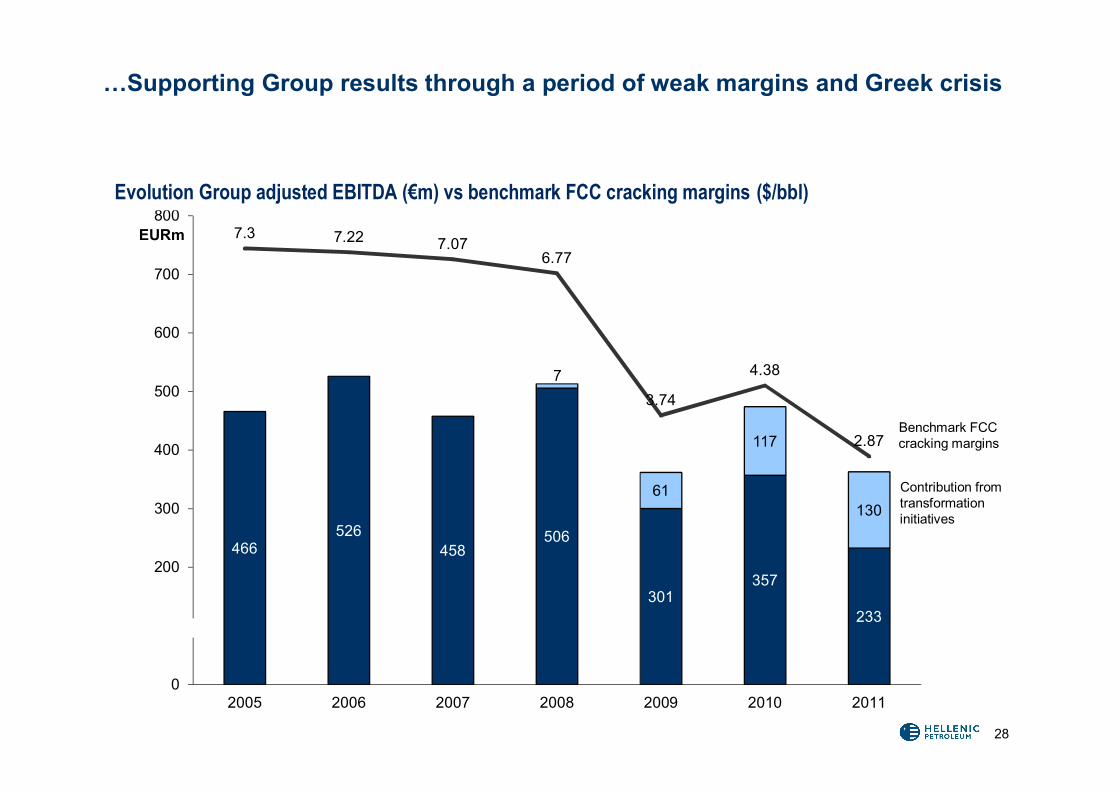
…Supporting Group results through a period of weak margins and Greek crisis
Evolution Group adjusted EBITDA (€m) vs benchmark FCC cracking margins ($/bbl)
Benchmark FCC cracking margins
Contribution from transformation initiatives
29
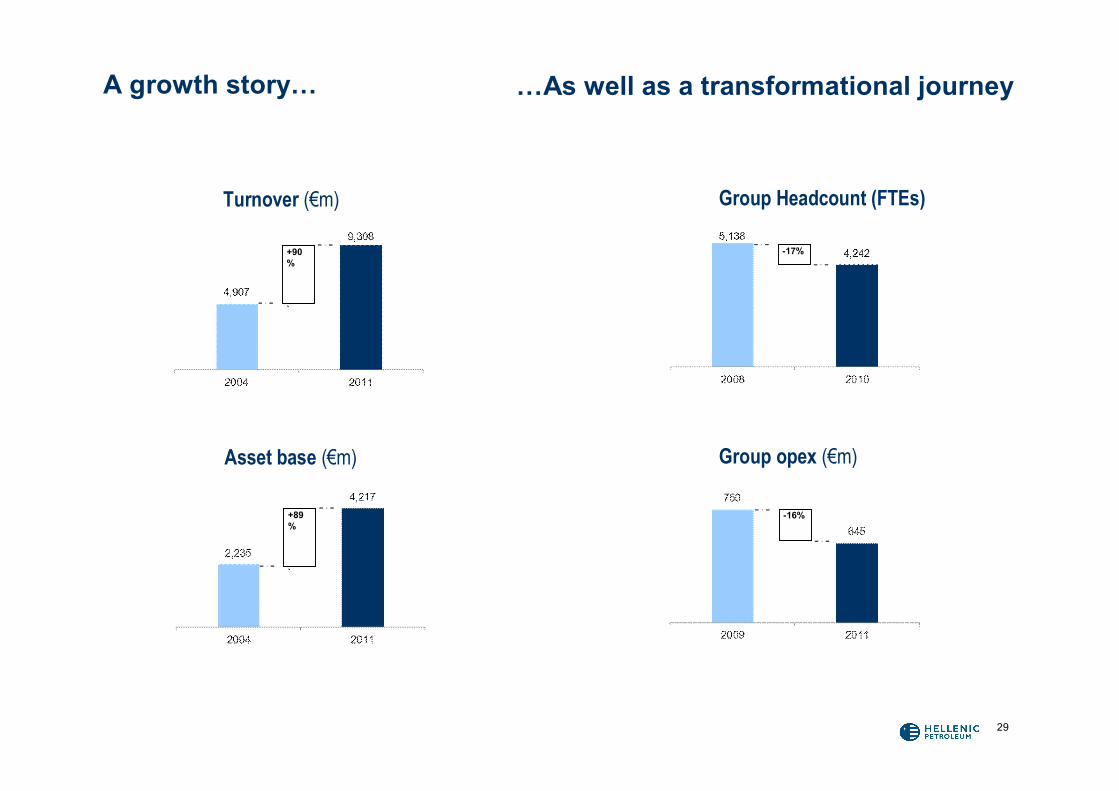
A growth story…
Group opex (€m)
Group Headcount (FTEs)
-17%
-16%
Turnover (€m)
+90%
`
Asset base (€m)
+89%
`
…As well as a transformational journey
30
Contents
• Introduction - Group overview
•Strategy and delivery
•Group business units
•Enhancing competitiveness
•Funding
•Financials
31
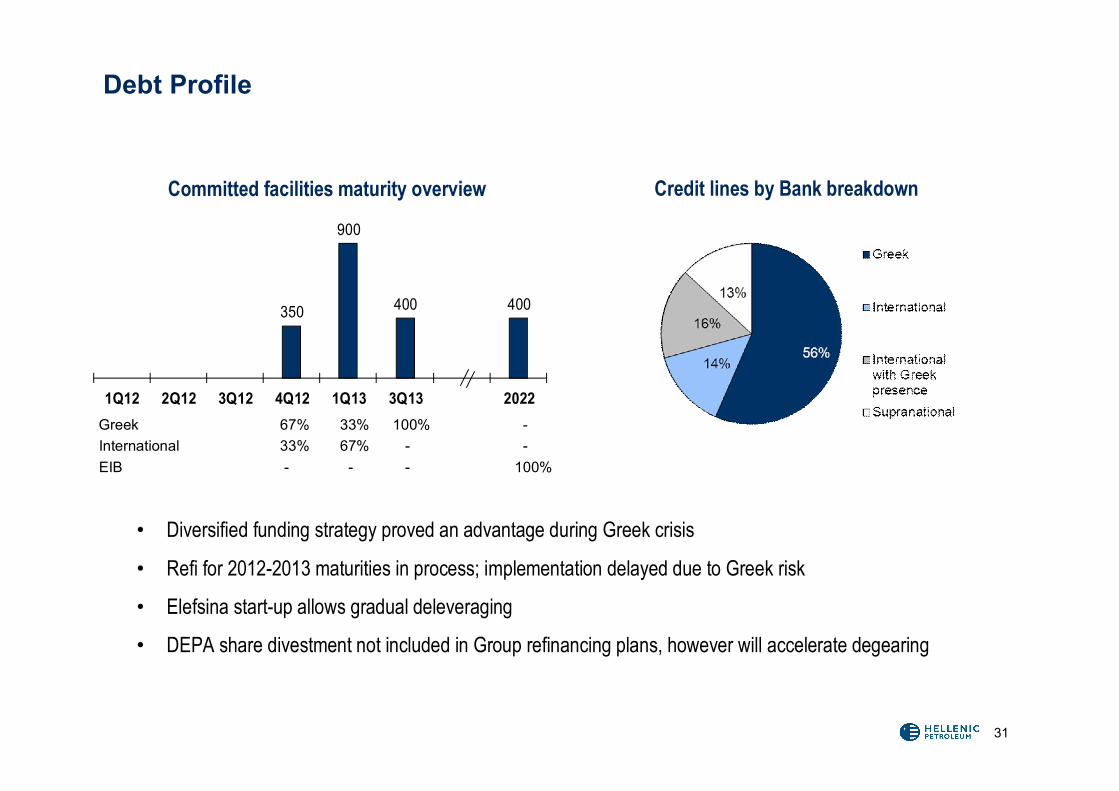
Debt Profile
350
900
400 400
1Q12 2Q12 3Q12 4Q12 1Q13 3Q13 2022
Committed facilities maturity overview Credit lines by Bank breakdown
Greek 67% 33% 100% -International 33% 67% - -EIB - - - 100%
• Diversified funding strategy proved an advantage during Greek crisis
• Refi for 2012-2013 maturities in process; implementation delayed due to Greek risk
• Elefsina start-up allows gradual deleveraging
• DEPA share divestment not included in Group refinancing plans, however will accelerate degearing
32
Contents
• Introduction - Group overview
•Strategy and delivery
•Group business units
•Enhancing competitiveness
•Funding
•Financials
33
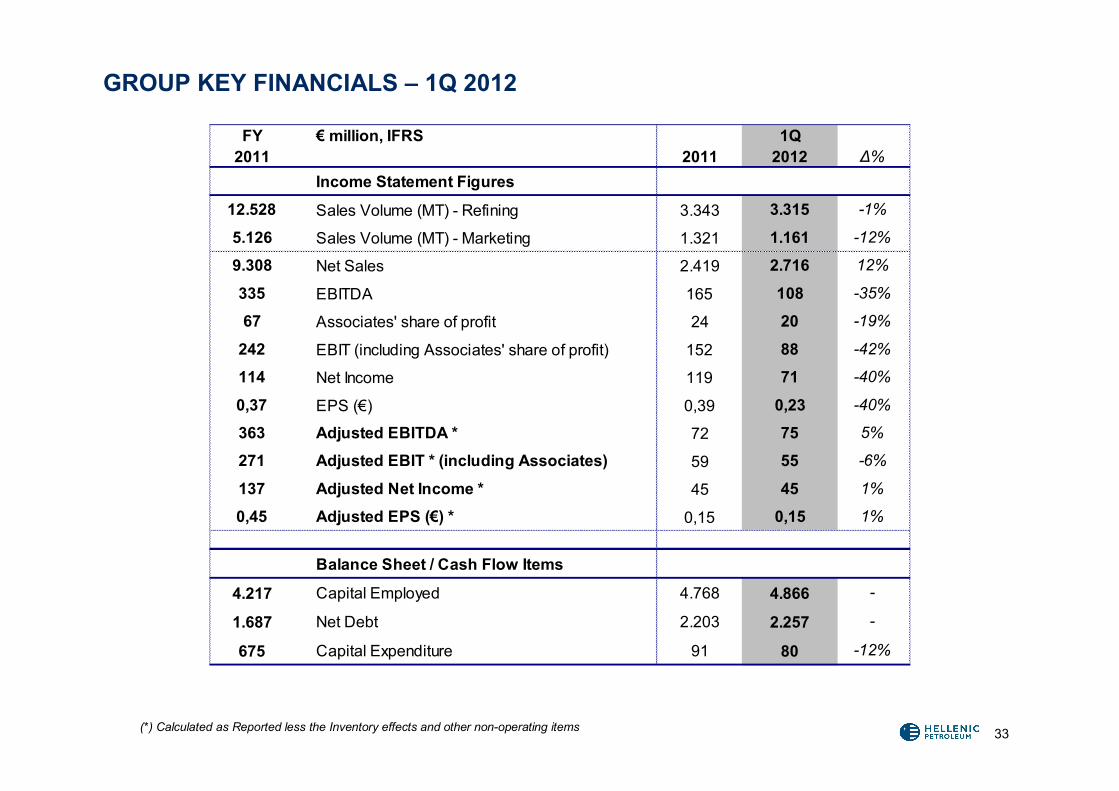
GROUP KEY FINANCIALS – 1Q 2012
(*) Calculated as Reported less the Inventory effects and other non-operating items
FY € million, IFRS 1Q2011 2011 2012 Δ%
Income Statement Figures
12.528 Sales Volume (MT) - Refining 3.343 3.315 -1%
5.126 Sales Volume (MT) - Marketing 1.321 1.161 -12%
9.308 Net Sales 2.419 2.716 12%
335 EBITDA 165 108 -35%
67 Associates' share of profit 24 20 -19%
242 EBIT (including Associates' share of profit) 152 88 -42%
114 Net Income 119 71 -40%
0,37 EPS (€) 0,39 0,23 -40%
363 Adjusted EBITDA * 72 75 5%
271 Adjusted EBIT * (including Associates) 59 55 -6%
137 Adjusted Net Income * 45 45 1%
0,45 Adjusted EPS (€) * 0,15 0,15 1%
Balance Sheet / Cash Flow Items
4.217 Capital Employed 4.768 4.866 -
1.687 Net Debt 2.203 2.257 -
675 Capital Expenditure 91 80 -12%
34
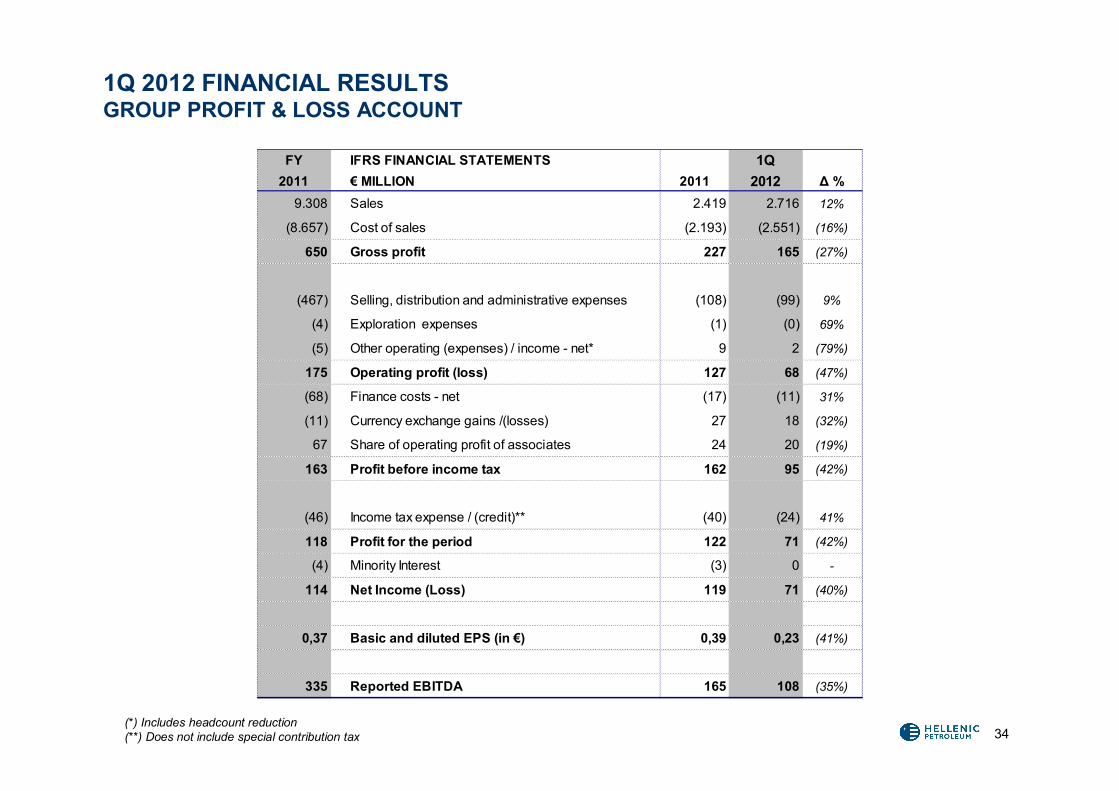
1Q 2012 FINANCIAL RESULTS GROUP PROFIT & LOSS ACCOUNT
(*) Includes headcount reduction(**) Does not include special contribution tax
FY IFRS FINANCIAL STATEMENTS 1Q2011 € MILLION 2011 2012 Δ %
9.308 Sales 2.419 2.716 12%
(8.657) Cost of sales (2.193) (2.551) (16%)
650 Gross profit 227 165 (27%)
(467) Selling, distribution and administrative expenses (108) (99) 9%
(4) Exploration expenses (1) (0) 69%
(5) Other operating (expenses) / income - net* 9 2 (79%)
175 Operating profit (loss) 127 68 (47%)
(68) Finance costs - net (17) (11) 31%
(11) Currency exchange gains /(losses) 27 18 (32%)
67 Share of operating profit of associates 24 20 (19%)
163 Profit before income tax 162 95 (42%)
(46) Income tax expense / (credit)** (40) (24) 41%
118 Profit for the period 122 71 (42%)
(4) Minority Interest (3) 0 -
114 Net Income (Loss) 119 71 (40%)
0,37 Basic and diluted EPS (in €) 0,39 0,23 (41%)
335 Reported EBITDA 165 108 (35%)
35
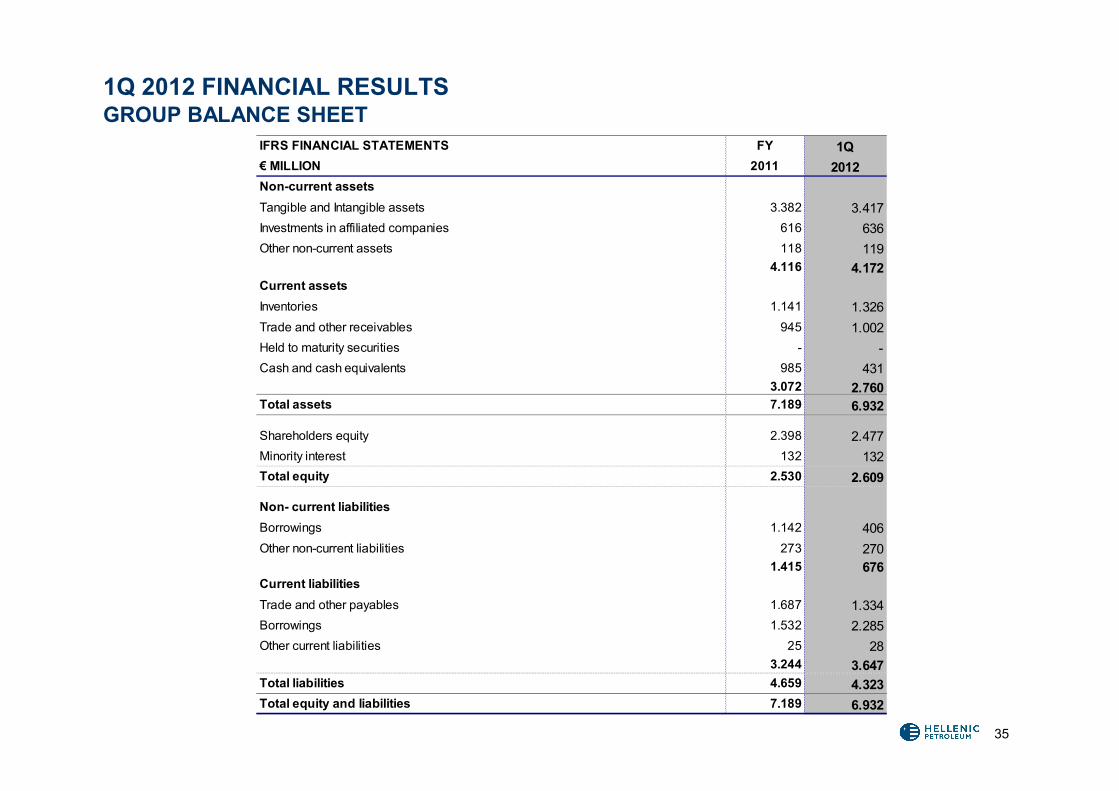
1Q 2012 FINANCIAL RESULTSGROUP BALANCE SHEET
IFRS FINANCIAL STATEMENTS FY 1Q€ MILLION 2011 2012Non-current assetsTangible and Intangible assets 3.382 3.417Investments in affiliated companies 616 636Other non-current assets 118 119
4.116 4.172Current assetsInventories 1.141 1.326Trade and other receivables 945 1.002Held to maturity securities - -Cash and cash equivalents 985 431
3.072 2.760Total assets 7.189 6.932
Shareholders equity 2.398 2.477Minority interest 132 132Total equity 2.530 2.609
Non- current liabilitiesBorrowings 1.142 406Other non-current liabilities 273 270
1.415 676Current liabilitiesTrade and other payables 1.687 1.334Borrowings 1.532 2.285Other current liabilities 25 28
3.244 3.647Total liabilities 4.659 4.323Total equity and liabilities 7.189 6.932
36(*) Calculated as Reported less the Inventory effects and other non-operating items
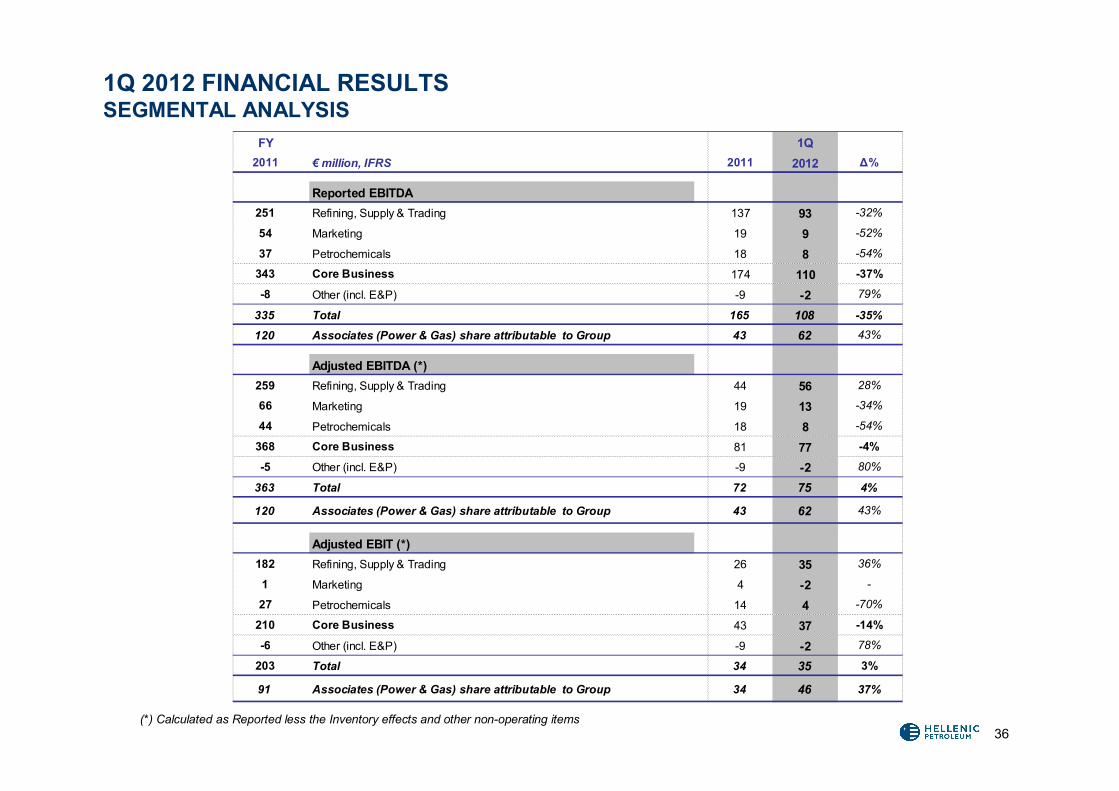
1Q 2012 FINANCIAL RESULTSSEGMENTAL ANALYSIS
FY 1Q2011 € million, IFRS 2011 2012 Δ%
Reported EBITDA251 Refining, Supply & Trading 137 93 -32%
54 Marketing 19 9 -52%
37 Petrochemicals 18 8 -54%
343 Core Business 174 110 -37%
-8 Other (incl. E&P) -9 -2 79%
335 Total 165 108 -35%
120 Associates (Power & Gas) share attributable to Group 43 62 43%
Adjusted EBITDA (*)259 Refining, Supply & Trading 44 56 28%
66 Marketing 19 13 -34%
44 Petrochemicals 18 8 -54%
368 Core Business 81 77 -4%
-5 Other (incl. E&P) -9 -2 80%
363 Total 72 75 4%
120 Associates (Power & Gas) share attributable to Group 43 62 43%
Adjusted EBIT (*)182 Refining, Supply & Trading 26 35 36%
1 Marketing 4 -2 -
27 Petrochemicals 14 4 -70%
210 Core Business 43 37 -14%
-6 Other (incl. E&P) -9 -2 78%
203 Total 34 35 3%
91 Associates (Power & Gas) share attributable to Group 34 46 37%
37
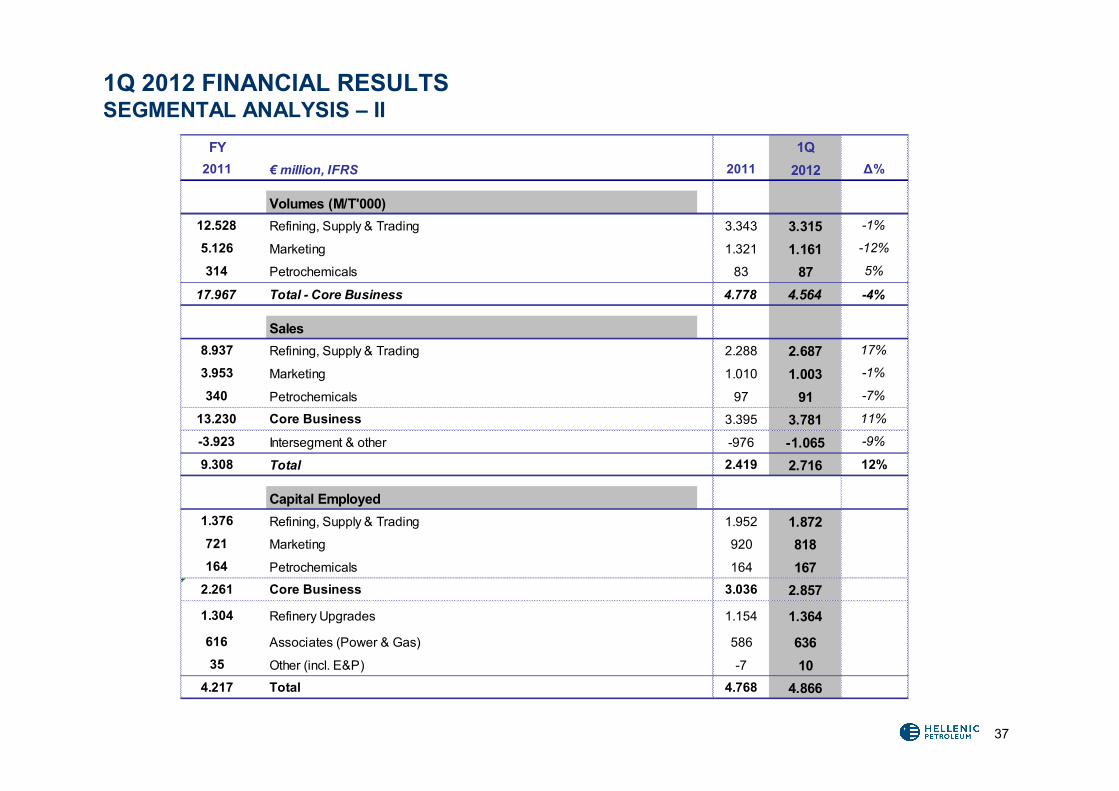
1Q 2012 FINANCIAL RESULTSSEGMENTAL ANALYSIS – II
FY 1Q2011 € million, IFRS 2011 2012 Δ%
Volumes (M/T'000)12.528 Refining, Supply & Trading 3.343 3.315 -1%
5.126 Marketing 1.321 1.161 -12%
314 Petrochemicals 83 87 5%
17.967 Total - Core Business 4.778 4.564 -4%
Sales 8.937 Refining, Supply & Trading 2.288 2.687 17%
3.953 Marketing 1.010 1.003 -1%
340 Petrochemicals 97 91 -7%
13.230 Core Business 3.395 3.781 11%
-3.923 Intersegment & other -976 -1.065 -9%
9.308 Total 2.419 2.716 12%
Capital Employed1.376 Refining, Supply & Trading 1.952 1.872721 Marketing 920 818164 Petrochemicals 164 167
2.261 Core Business 3.036 2.857
1.304 Refinery Upgrades 1.154 1.364
616 Associates (Power & Gas) 586 63635 Other (incl. E&P) -7 10
4.217 Total 4.768 4.866
38
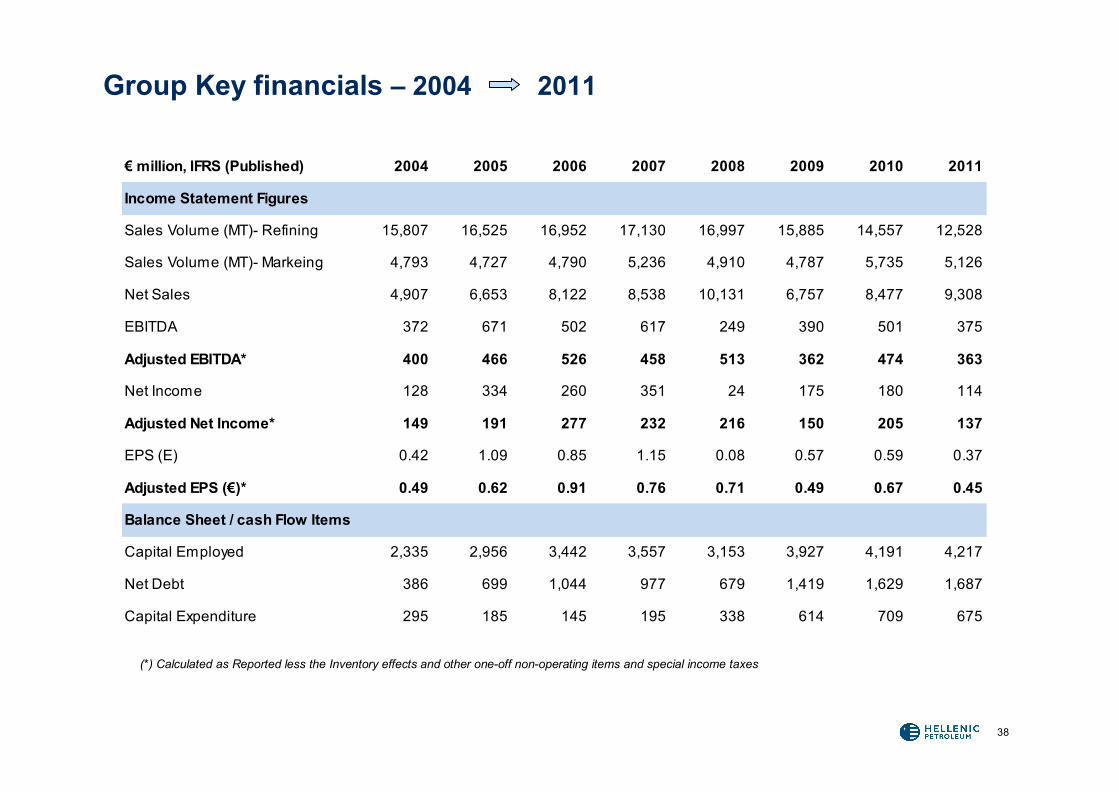
Group Key financials – 2004 2011
(*) Calculated as Reported less the Inventory effects and other one-off non-operating items and special income taxes
€ million, IFRS (Published) 2004 2005 2006 2007 2008 2009 2010 2011
Income Statement Figures
Sales Volume (MT)- Refining 15,807 16,525 16,952 17,130 16,997 15,885 14,557 12,528
Sales Volume (MT)- Markeing 4,793 4,727 4,790 5,236 4,910 4,787 5,735 5,126
Net Sales 4,907 6,653 8,122 8,538 10,131 6,757 8,477 9,308
EBITDA 372 671 502 617 249 390 501 375
Adjusted EBITDA* 400 466 526 458 513 362 474 363
Net Income 128 334 260 351 24 175 180 114
Adjusted Net Income* 149 191 277 232 216 150 205 137
EPS (E) 0.42 1.09 0.85 1.15 0.08 0.57 0.59 0.37
Adjusted EPS (€)* 0.49 0.62 0.91 0.76 0.71 0.49 0.67 0.45
Balance Sheet / cash Flow Items
Capital Employed 2,335 2,956 3,442 3,557 3,153 3,927 4,191 4,217
Net Debt 386 699 1,044 977 679 1,419 1,629 1,687
Capital Expenditure 295 185 145 195 338 614 709 675
39
Disclaimer
Forward looking statementsHellenic Petroleum do not in general publish forecasts regarding their future financial results. The financial forecasts contained in this document are based on a series of assumptions, which are subject to the occurrence of events that can neither be reasonably foreseen by Hellenic Petroleum, nor are within Hellenic Petroleum's control. The said forecasts represent management's estimates, and should be treated as mere estimates. There is no certainty that the actual financial results of Hellenic Petroleum will be in line with the forecasted ones.
In particular, the actual results may differ (even materially) from the forecasted ones due to, among other reasons, changes in the financial conditions within Greece, fluctuations in the prices of crude oil and oil products in general, as well as fluctuations in foreign currencies rates, international petrochemicals prices, changes in supply and demand and changes of weather conditions. Consequently, it should be stressed that Hellenic Petroleum do not, and could not reasonably be expected to, provide any representation or guarantee, with respect to the creditworthiness of the forecasts.
This presentation also contains certain financial information and key performance indicators which are primarily focused at providing a “business” perspective and as a consequence may not be presented in accordance with International Financial Reporting Standards (IFRS).