Embed Size (px)
Citation preview

Evaluation of the
National Assessment of Educational Progress
Final Report
Prepared by:
Chad W. BuckendahlSusan L. Davis
Barbara S. PlakeBuros Institute for Assessment Consultation and Outreach
Buros Center for TestingUniversity of Nebraska–Lincoln
and
Stephen G. SireciRonald K. Hambleton
April L. ZeniskyCraig S. Wells
Center for Educational AssessmentUniversity of Massachusetts–Amherst
2009

This congressionally mandated report was done under Contract Number ED04CO0159 with the Buros Institute for Assessment Consultation and Outreach, a Division of the Oscar and Luella Buros Center for Testing, University of Nebraska, Lincoln, and the Center for Educational Assessment, University of Massachusetts, Amherst. Jay Noell served as the contracting officer’s representative. The views expressed herein do not necessarily represent the positions or policies of the Department of Education. No official endorsement by the U.S. Department of Education of any product, commodity, service or enterprise mentioned in this publication is intended or should be inferred.
U.S. Department of EducationArne DuncanSecretary
Office of Planning, Evaluation and Policy DevelopmentCarmel MartinAssistant Secretary
Policy and Program Studies ServiceAlan GinsburgDirector
September 2009
This report is in the public domain. Authorization to reproduce it in whole or in part is granted. While permission to reprint this publication is not necessary, the citation should be: U.S. Department of Education, Office of Planning, Evaluation and Policy Development, Evaluation of the National Assessment of Educational Progress, Final Report, Washington, D.C., 2009.
To order copies of this report:
Write to: ED Pubs, Education Publishing Center, U.S. Department of Education, P.O. Box 1398, Jessup, MD 20794-1398.
Or fax your request to 301-470-1244.
Or e-mail your request to: [email protected].
Or call in your request toll-free: 1-877-433-7827 (1-877-4-ED-PUBS). If 877 service is not yet available in your area, call 1-800-872-5327 (1-800-USA-LEARN). Those who use a telecommunications device for the deaf (TDD) or a teletypewriter (TTY), should call 1-877-576-7734.
Or order online at: www.edpubs.ed.gov.
This report is also available on the Department’s Web site at: www.ed.gov/about/offices/list/opepd/ppss/index.html.
On request, this publication is also available in alternate forms, such as Braille, large print, audiotape, or computer diskette. For more information, please contact the Department’s Alternate Format Center at 202-260-0852 or 202-260-0818.

Contents
List of Figures and Tables ................................................................................................v
Preface..............................................................................................................................vii
Acknowledgments.............................................................................................................ix
Foreword by the Technical Work Group.......................................................................xi
Executive Summary...........................................................................................................1
Chapter 1: The Mandate for the Evaluation.................................................................31Policy Context for Evaluating NAEP................................31Congressional Mandate......................................................35Key Questions..................................................................35
Chapter 2: Our Approach to the Evaluation................................................................37Standards for Educational andPsychological Testing........................................................37Challenges of the Evaluation.............................................39Evaluation Procedure.........................................................40Technical Work Group......................................................48
Chapter 3: Analysis and Findings..................................................................................49How Consistent Are NAEP’s Procedures WithProfessional Testing Standards?........................................49How Consistent Are NAEP’s Procedures for SettingAchievement Levels With ProfessionalTesting Standards?.............................................................69How Valid Are State Comparisons Using NAEP?............77How Clearly and Accessibility Are NAEP Reports andResults Communicated to Stakeholders?..........................86
Chapter 4: Summary and Next Steps............................................................................91The Mandate and the Findings...........................................91NAEP and the Challenge of the Future..............................93Conclusion.........................................................................98
iii
References.........................................................................................................................99
Appendix AGlossary of acronyms and commonly used terms...........107
Appendix BLegislation authorizing the evaluation of NAEP.............117
Appendix CTechnical Work Group and evaluation team members....119
CDSix study reports supporting theFinal Report..............................................Inside Back Cover
iv

Figures and Tables
FiguresFigure 1: The path to a NAEP score..............................9, 44Figure 2: NAEP average scores and achievement levels for
the nation and select states for the 2005 grade 8 mathematics assessment......................................71
Figure 3: Sample results from the 2003 mathematics NAEP-TIMSS comparison—TIMSS results
displayed in terms of NAEP achievementlevels...................................................................75
Figure 4: Exclusion and accommodation rates for students with disabilities and English language learners
for 2005 NAEP fourth-grade mathematics.........82Figure 5: Cross-state comparisons of average mathematics scale scores, grade 8 public schools: 2005..........87Figure 6: NAEP pantyhose chart for 2005 grade 4 reading TUDA....................................................89
TablesTable 1: Congressional and evaluation questions organized
by studies and policy significance..................5, 36Table 2: Organizations within the NAEP consortium and
their current roles and functions ........................41Table 3: Selected recent NAEP validity research.............55 Table 4: Selected NAEP results and technical reports
disseminated November 2004–June 2007.........64 Table 5: Combined school and student national response
rates before substitution by grade and year: NAEP reading................................................................83
Table 6: Combined school and student response rates of the national public before substitution by grade and year: NAEP mathematics ...................................83
v

This page left intentionally blank
vi

Preface
The Evaluation of the National Assessment of Educational Progress: Final Report describes the activities of a project that began in 2004. This report is designed to provide information about the evaluation to readers representing a range of stakeholders.
In the final report, we present a practical discussion of the evaluation studies to its primary, intended audience, namely policymakers. In this report, readers will find a foreword prepared by the Technical Work Group for the evaluation that provides a broader context for the findings and recommendations. The Executive Summary then presents a condensed version of the report that can be further explored in the body of the report or in the background study reports that are included on the accompanying CD.
In the first chapter of the final report we discuss the Mandate for the Evaluation that was specified by Congress and the policy context that served as a point of reference for the evaluation. We then describe how this mandate was interpreted through the development of operational questions to guide the evaluation design.
This design is then described in the second chapter of the final report, Our Approach to the Evaluation. Here, we discuss the professional expectations that guided our data collection efforts as well as the limitations of the evaluation design and conclusions. In this chapter we also discuss the Technical Work Group, an external panel of experts in education policy, psychometrics, and evaluation, which provided input on the evaluation design and provided critical reviews of the activities at various points of the project.
Based on the design described earlier, we then discuss the Analysis and Findings in the third chapter of the final report. Within this chapter, findings and recommendations for each of the evaluation questions (e.g., How consistent are NAEP’s procedures with professional testing standards? How consistent are procedures for setting NAEP achievement levels with professional testing standards?) are discussed.
Finally, in the fourth chapter of the final report, Summary and Next Steps, we summarize the results and discuss the findings and recommendations in the context of the legislative mandate and the challenges that policymakers face with a longstanding program like NAEP.
Following the text of the report are a series of references and appendixes that include information for readers who desire more information about the report and the sources of evidence that informed it. However, for all readers, we want to highlight Appendix A as a useful resource. Within this appendix is a glossary of acronyms and commonly used terms to help readers become more familiar with some of the organizations, acronyms, and technical terms that are an integral part of understanding NAEP.
As additional evidence to support our findings and recommendations, we have included an accompanying CD that contains six study reports. The study reports represent summaries of the data collection, analysis, and findings of the different lines of inquiry that comprised the evaluation design.
vii

This page left intentionally blank
viii

Acknowledgments
This final report of the evaluation of the National Assessment of Educational Progress (NAEP) benefited from the contributions of many people outside and within the U.S. Department of Education. The evaluation team would like to extend its appreciation to these individuals and acknowledge those whose assistance made this final report possible.
First, the evaluation was conducted under the guidance of a Technical Work Group (TWG), whose members’ names and affiliations appear in the Foreword. The TWG was co-chaired by Suzanne Lane of the University of Pittsburgh and Bruno Zumbo of the University of British Columbia who both served as liaisons between the evaluators and the full group. Their contributions were invaluable as they provided advice and input on the design, evaluation activities, and reports.
Second, we wish to thank the individuals we worked with in the Department’s Policy and Program Studies Service (PPSS). Specifically, Jay Noell provided continuous support and advice throughout the evaluation on how to better characterize our findings in reports that would be meaningful for policymakers. We also want to thank Alan Ginsburg, David Goodwin, and Maggie Cahalan for their valuable contributions during the evaluation.
Third, we appreciate the efforts of the staff of the National Assessment Governing Board (NAGB), particularly Charles Smith, Susan Loomis, Mary Crovo, and Sharif Shakrani, now affiliated with Michigan State University, to provide documentation, clarification, and feedback, on the components of NAEP for which they are responsible. Likewise, we extend our thanks to the Assessment Division of the National Center for Education Statistics (NCES) and specifically to Peggy Carr, Andrew Malizio, Janis Brown, and Andy Kolstad for their assistance during the evaluation. Although many of the documents we requested remained in the internal review process for the duration of the evaluation, draft reports and documents were provided, when possible.
Fourth, we want to thank the organizations and individuals that serve as contractors for the components of NAEP that were included in the evaluation. These organizations in alphabetical order were, ACT, Inc., American Institutes for Research (AIR), Educational Statistics Services Institute (ESSI), Educational Testing Service (ETS), Government Micro Resources, Inc., Hager Sharp, Human Resources Research Organization (HumRRO), the NAEP State Coordinators, Pearson Educational Measurement (PEM), and Westat, Inc.
Finally, because the foundation for this report is based on multiple studies and data collection efforts that comprised the evaluation, there were a number of people who played key roles in the project. We appreciate the efforts of these individuals in contributing to the success of the evaluation. Specifically, we want to thank: Jim Impara, Brett Foley, Teresa Eckhout, Elaine Rodeck, Anja Römhild, Rebecca Norman, Theresa Glanz, Janice Nelsen, and Kurt Geisinger of the Buros Center for Testing at the University of Nebraska, Lincoln; Lisa Keller, Drey Martone, Kelly Smiaroski, Jeffrey Hauger, Su Baldwin, Kyung T. (Chris) Han, Stephen Jirka, Ana Karatonis, Robert Keller,
ix

Jill Delton, Christine Lewis, Polly Parker, and Zachary Smith of the Center for Educational Assessment at the University of Massachusetts, Amherst; Deborah Bandalos of the University of Georgia; Edward Wiley of the University of Colorado; and Barbara Badgett of the University of Nevada, Las Vegas. A special thanks also to Cathy Cohen of C.J. Cohen Associates and Mickey Boisvert of MBDesign for their assistance in providing technical and style editing services through multiple drafts of the report.
Although we have received feedback from the U.S. Department of Education, NAGB, NCES, and the TWG during the evaluation, the judgments expressed in this report are those of the authors. This fulfills the spirit and requirement of the law that this evaluation be independent. The views expressed in this report do not necessarily reflect those of the University of Nebraska, Lincoln, or the University of Massachusetts, Amherst.
Chad W. BuckendahlSusan L Davis*
Barbara S. PlakeStephen G. SireciRonald K. HambletonApril L. ZeniskyCraig S. Wells
After October 2007, work on this project by Buckendahl and Davis occurred as employees of Alpine Testing Solutions.
x

l F o r e w o r d l
Foreword by the Technical Work Group
The Changing Context of Large-Scale Assessments
The purposes, uses, and consequences of large-scale assessments have changed fundamentally over the past few decades. While the consequences of large-scale assessment results have steadily mounted, the attention paid to making the purposes of and uses of such assessments explicit has not always kept pace. Yet the meanings given to assessment results and the uses to which the results are put are valid only to the degree that supporting evidence exists.
However, if the proposed interpretations and uses of the assessment results are not made explicit during the design and ongoing implementation phases, it lessens the likelihood that appropriate validity evidence will be collected—evidence essential both for supporting the interpretations and uses of the assessment results and for evaluating and monitoring any unintended uses and consequences. Careful delineation of the proposed interpretations and uses of an assessment also draws attention to issues of fairness and equity.
These issues are of particular importance because of the increased use of large-scale assessments to examine and monitor the performance of aggregated subgroups, defined by demographic conditions such as geographic location, race, and ethnicity. When interpretations and uses are clarified and made explicit, fairness and equity issues can be addressed, intended consequences can be evaluated, and unintended, potentially negative consequences can be minimized. It is difficult therefore to overstate the importance of assessment programs being clear and specific about intended interpretations and uses.
What is true for large-scale assessment programs in general is especially true for the National Assessment of Educational Progress (NAEP), given its emerging role as a policy tool to interpret state assessment and accountability systems. While it is the case that there have been numerous validity studies to support many of the interpretations and uses of NAEP results, NAEP has not had the benefit of a comprehensive framework to guide the systematic accumulation of evidence in order to substantiate the ways in which its assessment results may be reasonably interpreted and applied. As new uses for NAEP continue to emerge, delineating a validity framework—an organized plan for collecting evidence to support intended uses and interpretations of test scores—must become a priority. The emphasis here is on using the validity framework as an organizing tool, not simply a call for research.
xi

Historical View of NAEP and Its Evolution
The ways in which NAEP results are reported and used have evolved over the nearly 40 year history of the NAEP assessment program. What began as a relatively straightforward, low visibility measure of student achievement at the national level has been transformed to a multilayered measure, extending to states and districts, and increasingly in the public eye. Each change in the structure and reach of the NAEP assessment program has made the process of reporting, interpreting and communicating the results more challenging. A chronology of NAEP’s history reveals that many incremental changes were made along the way. Nonetheless, some shifts in practice can be thought of as “turning points,” in which key changes in the characteristics and direction of the assessment program surface.
The first administration of NAEP was in 1969. The assessments targeted content and processes characteristic of what the majority of students at a given age would have had an opportunity to study and learn. Results were reported on an item-by-item basis for the nation, regions of the country, and certain demographic groups. The items were easily related to the curriculum and trend data was reported while, at the same time, giving teachers, curricular developers, and school officials information about performance at the national level. NAEP’s focus on learning was a hallmark of the program throughout its initial development.
Although the item-by-item results were of considerable interest to curriculum specialists, they received limited attention from policymakers and the general public. Starting with the 1984 NAEP assessment, the reporting shifted from emphasizing item results to emphasizing scale scores, which had a number of advantages. Scale scores were familiar to a public accustomed to college admission scores, facilitated summarizing results for an overall content area, such as mathematics, allowed for comparisons among demographic groups, and expedited monitoring changes in student performance over time. The shift in focus from item-by-item results to overall results in a content area served to heighten the interest of policymakers in NAEP results and NAEP became known as the “Nation’s Report Card.”
In the early 1990s two additional changes were introduced that made NAEP results even more important to stakeholders: For the first time, results were reported state-by-state and in terms of achievement levels—categories specifying the percentage of students who meet established standards of proficiency (in NAEP these are basic, proficient, and advanced). These changes in reporting had the effect of diminishing the attention given to what students know and can do and its inherent relation to curriculum, and increasing the attention on performances by various subgroups of students, defined by demographic conditions related to geographical, racial, ethnic, sociological, and poverty markers.
xii

l F o r e w o r d l
The technical and procedural complexity of NAEP deepened in the 1980s and 1990s to accommodate new features of the program and to take advantage of some of the sophisticated developments in assessment methodology. The main NAEP assessment, which is administered to national samples in grades 4, 8, and 12, now uses complex psychometric scaling techniques, marginal estimation procedures, and sampling procedures at the state level. National samples for grades 4 and 8 are used for state-by-state reporting of NAEP results in mathematics, reading, science, and writing.
Most recently, the enactment of the No Child Left Behind Act (NCLB) in 2002 required states to participate in NAEP at grades 4 and 8 in reading and mathematics every other year, to administer state assessments in reading and mathematics every year in grades 3–8 and once in high school, and to use the state’s own test results to track school accountability. As NAEP’s assessment arm extended to individual states and to a sampling of urban districts, the interpretation of results has become more challenging—and more contestable—as decision-makers at the national, state and district levels apply the results, sometimes inappropriately, to policies and program planning. Thus, what was once a low-stakes monitor of student achievement has gradually evolved into a high-stakes measure that may be used directly or indirectly for purposes of accountability.
Congressional Mandate for Evaluation of NAEP
In light of NAEP’s rapid ascendancy as a powerful policy lever, Congress’ call for an independent evaluation of NAEP in 2002 was timely. The congressional mandate, broadly stated, directed that the evaluators examine whether the assessment program follows accepted professional standards, with particular emphasis given to the achievement levels, sampling procedures, and fairness issues. Given the complexity of NAEP, planning and conducting an extensive evaluation to examine the major components of NAEP is a considerable undertaking.
The evaluation team initially proposed a comprehensive set of studies to analyze multiple facets of the assessment program. However, not all of the studies were funded, and some that were had to be narrowed due to imposed budget constraints. Based on discussions between the Technical Working Group and the evaluation team, the evaluation focused on four carefully defined issues: the consistency of NAEP’s overall procedures with professional testing standards, the consistency of NAEP procedures for setting NAEP achievement levels with professional testing standards, the validity of state comparisons using NAEP, and the accessibility and understandability of NAEP reports and results to stakeholders.
xiii

Uses and Interpretations of NAEP Results
CURRENT USES, INTERPRETATIONS AND ISSUES
NAEP results are currently used for three major purposes: monitoring trends in student achievement; providing evaluative statements regarding the level of student achievement; and making state-by-state comparisons. To allow for the ongoing examination of trends in student achievement, some design characteristics of NAEP have been maintained. However, supporting additional uses of NAEP—evaluating rather than simply describing student achievement and making state-by-state comparisons—required new methodologies.
Evaluating the level of student achievement required NAEP to create standards of student performance by defining levels of student performance (basic, proficient, and advanced) and establishing cut scores along the score scale. Setting achievement levels requires evaluative judgments regarding the meaning of different levels of achievement, moving NAEP from making descriptive statements about students’ achievements to making evaluative statements about students’ achievements compared to standards of student performance (NAEP achievement levels). As the current evaluation points out there has been considerable debate regarding the extent to which the achievement levels being employed with NAEP are too high.
Comparing student achievement on NAEP across states is complicated. To appreciate the challenges in making state-by-state comparisons, it is necessary to understand the sampling design adopted by NAEP and its potential impact on the results and their interpretations. In NAEP’s multistage cluster sampling procedure, not all students take the assessment, and those students who do take NAEP respond to a subset of the NAEP items in each content area. While this allows for a broad sampling of items from any one content domain, the extent to which subgroups of students are represented adequately in NAEP’s state samples is of concern.
As reported in the current evaluation, NAEP’s sampling procedures do not ensure adequate representation of various subgroups (including those defined by race and ethnicity) within some states, putting valid interpretations about subgroup performances within a state and across states at risk. Using NAEP to verify state results regarding the achievement of students with disabilities is also problematic because decisions about inclusion and allowable accommodations are made at the state level. Because states vary in their inclusion rates and in their treatment of accommodations for NAEP, the validity of state-by-state comparisons is debatable.
Interpreting NAEP results for grade 12 is very difficult. While states have been required to participate in NAEP at grades 4 and 8 in reading and mathematics every other year under NCLB, there is no similar requirement for grade 12. Consequently, the response rates and participation rates have increased
xiv

l F o r e w o r d l
considerably for grades 4 and 8 but not for grade 12. Even if there were a mandate for participation of all students in grade 12, the motivation level of grade 12 students would most likely remain a problem. Concerns with the nonresponse rates and participation rates for grade 12 means any interpretations of the results as an accurate measure of grade 12 student achievement need to be made with caution. These concerns need to be addressed if there are additional uses planned for the grade 12 results, including potential state-by-state comparisons.
A more recent use of NAEP—one that emerged in response to the expressed needs of policymakers and users—is the reporting of district-level results. In 2002, on a trial basis, sampling procedures were modified for several large urban school districts to allow for NAEP results to be reported at the district-level. This additional use of NAEP requires validity evidence to support its use, as does any use of NAEP, as well as consideration of unintended, potentially negative consequences.1
EMERGING USES, INTERPRETATIONS AND ISSUES
NAEP as a benchmark for state content standards
In an era when concern for accountability is acute, it is inevitable that policymakers will want to use NAEP state results to confirm students’ achievement on state tests. However, there is an inherent disconnect between the call for higher-level accountability and the tradition of local control, which has been a hallmark of the nation’s public education system and a deeply held value. The tension between the press for higher-level accountability and the prerogatives of local control—for example in determining the scope and sequence of content across the grades—is most apparent in the growing use of NAEP for verifying state assessment results and accountability programs. It is problematic to use NAEP as a benchmark for state assessments due to differences in content standards, population characteristics, standard-setting policies and procedures, and a number of other factors.
In using NAEP to verify a state’s assessment results, there is an implicit assumption that the content and skills being assessed by NAEP are similar to the content and skills being assessed by the state assessment. If a state’s policymakers perceive that this assumption does not hold, they may alter the state’s content standards to be more aligned to the content assessed by NAEP so as to reap the potential benefits of a closer alignment.2 The issue at stake is the extent to which state and local content standards and curriculum should be influenced by a national assessment. Such influence may raise concern for local educators, education policymakers, and national content-oriented professional
1 Although not every unintended consequence can be anticipated, the Standards require reasonable effort to prevent negative consequences and to encourage sound interpretations (Standards, at 117).2 Alignment is illustrated here in one context but can also be used more broadly for describing the degree of concurrence of policies, curriculum, instruction, and assessments within and across grade levels in an education system.
xv

organizations that have always prided themselves with knowing what is best for educating and assessing their students.
NAEP as a benchmark for state assessments
Another issue in using NAEP to verify state assessment results is related to the comparability of achievement levels across NAEP and state assessment programs. It is common to see comparisons of the percentage of students who are at or above the NAEP proficient achievement level and the percentage of students who are at or above the proficient achievement level on state assessments. Although there is considerable variability in the discrepancy between these two percentages across states, with the exception of a few states, NAEP results generally indicate a considerably smaller percentage of students at or above its proficient level compared to state assessment results. Discrepancies between NAEP and state results can be due to a number of factors—differences in the content being assessed, differences in the definition of the achievement levels, and differences in the standard-setting policies and procedures used to establish achievement levels and cut scores. Another factor contributing to these discrepancies is the purposes of these programs. While NAEP has been historically a low stakes assessment for students, schools, and states, state assessments may have higher stakes for schools (i.e., for NCLB accountability) and for students (i.e., graduation tests).
We might argue however that the differences in percent proficient or above on NAEP and on some state assessments are so large that they are due to differences primarily in the stringency of the NAEP achievement levels rather than due to differences in content coverage. While it is convenient to use the same term, proficient, on NAEP and state assessments, it can be misleading because the definition varies across assessment programs. Setting achievement levels and defining the meaning of proficient involves evaluative judgments made within the context in which the assessment is used. Differences in NAEP and state assessment programs, and potential misuses of NAEP in verifying state assessment results, underscore the need for a clear statement of the current and evolving uses, and potential misuses, of NAEP as well as a validity framework to organize the evidence supporting its intended uses.
The utility study in the current evaluation revealed that the differences between NAEP’s definition of proficient and individual states’ definitions of proficient are not readily transparent to users, leading to potentially inaccurate inferences, comparisons, and related actions. Further, the context of education policy in which achievement levels are set is important to consider when interpreting student results relative to the achievement levels. Evaluations that examine whether NAEP’s achievement levels are set too high should take into account the policy context in which NAEP’s achievement levels were set relative to the NCLB policy environment in which achievement levels were set for state assessments.
xvi

l F o r e w o r d l
A national dialogue regarding priorities in public education and the breadth and depth of local versus state or national authority and control is overdue. Without a frame of reference and explicit delineation of the expectations for degrees of correspondence in both assessed content and achievement levels across states, the use of a national test based on a broadly defined curriculum to verify state assessment results appears to be premature—largely because such interpretations are without a defined reference, making it difficult to gather appropriate evidence to support such interpretations and uses.
Using NAEP in international comparisons
The achievement levels of NAEP have been evaluated by comparing performance of students in the United States and other countries on the Trends in International Mathematics and Science Study (TIMSS) and Program for International Student Assessment (PISA). The current evaluation compared NAEP achievement scores for eighth-grade mathematics with results from TIMSS and PISA. The findings indicated that eighth-grade mathematics students from several other countries performed better than students in the U.S. The proposed validity framework for NAEP needs to address whether international comparisons provide reasonable sources of external validity evidence for NAEP achievement levels. To the extent that they do provide a reasonable basis for comparisons, the framework will need to address how they should be used.
Need for an Organized Validity Framework Given the Complexity and Multiple Uses of NAEP
The Standards for Educational and Psychological Testing (AERA, APA, and NCME, 1999) clearly state the primacy of validity and call for greater attention to continued efforts of validation for all intended interpretations and uses of assessment results. Validation is an ongoing process because it is the interpretation or use of assessment results that are supported (validated), not the assessment instrument itself. The most important technical characteristics of any assessment are those that address aspects of validity.
Current theory indicates that validation should be comprehensive and explicit, and the higher the stakes the greater the requirement for evidence supporting the proposed interpretations and uses. Thus, as the stakes attached to NAEP results have risen (for example, those implicit in NCLB), so has the need for continued validation. Defensibility is not only inherent in the validation process, but has become a legal requirement as well in that case law explicitly recognizes the role of the Standards in determining if a particular use of assessment results is defensible.
An organized validity framework takes into account the history of the assessment program, current learning theory, and content-performance expectations from the subject-matter field and related professions. It also addresses contemporary
xvii

issues in current interpretations and uses of the assessment and anticipates future appropriate and inappropriate uses and consequences of the assessment.
The framework must specify explicitly the interpretations and uses, the assumptions underlying these interpretations and uses, and the kinds of evidence—theoretical, logical, and empirical—that could be brought forth to support these interpretations, uses, and assumptions. A complete treatment of validity would also include the exploration of alternative or competing interpretations or counterarguments. This specification would help the program prioritize validation efforts and resources.
NAEP’s design as a cross-sectional survey is effective and cost-efficient for achieving its original purposes. However, with each change, policy and legislative customers of NAEP results have been increasingly tempted to use them for new and unanticipated purposes—the attribution of causality in relating background characteristics to achievement, the development of state-by-state comparisons, using national or state results as a benchmark for state assessment programs, and as a measure of the full curriculum in the subject matter domains assessed.
The increased pressure to apply NAEP results in new ways underscores the need for the development of a sound, organized validity framework for the program—one that clearly documents the program’s goals and purposes and the appropriate uses of NAEP results along with the uses deemed inappropriate. This would include clear statements of the intended interpretations and uses of NAEP and the types of validity evidence that would support them. An important benefit is that future evaluations of NAEP could then be guided by the validity framework.
Recommendations
The current evaluation identifies a number of worthy recommendations that will enhance and strengthen the NAEP assessment program.
Need for an organized validity framework
As new uses for NAEP continue to emerge, the need for a comprehensive validity framework becomes increasingly critical. The Standards for Educational and Psychological Testing (AERA, APA, and NCME, 1999) provide the foundation for the development of a comprehensive validity framework and a process for identifying the types of evidence that are needed to support the interpretation and use of assessment results. Given the nature of the current and proposed uses and interpretations of NAEP results, multiple levels and sources of evidence are needed in a validity framework for NAEP.
The validity framework should address using NAEP at the national level to measure and monitor student achievement, at the state level to measure student achievement and to make state-by-state comparisons, and at the district level for
xviii

l F o r e w o r d l
monitoring student achievement. A validity framework will need to address the multiple levels for which NAEP is used, and the intended uses and interpretations, as well as the potential misuses that can be reasonably anticipated, at each of these levels.
Additional research on achievement levels
The current evaluation examined the application of a new methodology for setting achievement levels on the 2005 grade 12 NAEP mathematics assessment and evaluated the NAEP’s achievement levels on the 2003 grade 8 math test using the performance on TIMSS and PISA. It is important to further investigate the stringency of NAEP’s achievement levels if they continue to be used as a benchmark in evaluating the results of state assessment programs. NAEP’s validity framework will need to address the types of studies that can provide external validity evidence for NAEP achievement levels, including the extent to which international comparisons can provide external validity evidence for NAEP achievement levels.
Additional research
Additional studies are warranted if NAEP is to be used to verify state assessment results. As reported in the current evaluation, there are numerous factors that can jeopardize the validity of interpretations when using NAEP to verify state results. These include differences in content being assessed, differences in standard-setting policies and procedures, differences in the definition of the achievement levels, and differences in the representation of the NAEP state samples. Additional alignment studies that evaluate the congruency between the content assessed by NAEP and state content standards and assessment are crucial. The sampling procedures for NAEP should also be studied. Representation of subgroups across states varies considerably as do the inclusion and exclusion rates for students with disabilities, impacting the validity of the use of NAEP results for state-by-state comparisons and for verifying state assessment results.
The provision of appropriate accommodations for special needs student populations is an area that also needs more study. Additional validity evidence is needed about the accommodations that are used in NAEP for both English language learners and students with disabilities. Furthermore, the criteria for selecting and using accommodations for these students are not defined clearly by NAEP. Only a fraction of these students who are included in the NAEP sample are accommodated. Other studies regarding accommodations for subgroups are also needed, such as an evaluation of the extent to which the accommodations used in NAEP have an impact on the construct being measured, and the implications this may have on interpreting aggregated data.
Given the shifts in demographics, education accountability demands, and the nature of local control of public education, attention to unintended consequences will become even more urgent. Thus the validity framework should not only
xix

identify the intended uses and interpretation of NAEP assessment results but also identify potential misuses of NAEP assessment results to help minimize any unintended, potentially negative consequences.
Effective communication strategies to policymakers and relevant stakeholders of NAEP will be essential in promoting valid uses and interpretations of NAEP results. Within this changing landscape, the evolving uses of NAEP need to be considered within a validity framework and future evaluation studies need to be prioritized to support the uses and interpretations of NAEP results in the near future.
Signed,The Technical Work Group
Jamal Abedi Cindy Paredes-ZikerJeri Benson Michael RodriguezJohn Dossey Gregg SchrawStephen N. Elliott Jean SlatteryMichael Kane Veronica ThomasSuzanne Lane (co-chair) Joe WillhoftRobert Linn Bruno Zumbo (co-chair)
xx

Executive Summary
What Is the National Assessment of Educational Progress?
NAEP is a nationally representative measure of student achievement in multiple content
areas over time. Branded as the Nation’s Report Card, NAEP results inform stakeholders
about the academic achievement of elementary, middle, and secondary school students in
the United States.
Almost 40 years ago, the federal government began to measure the achievements of the nation’s public and private school students at the elementary, middle, and secondary levels. With the advent of the National Assessment of Educational Progress (NAEP2) in 1969, now known as the Nation’s Report Card, students’ academic achievements have been assessed regularly in more than a dozen content areas including mathematics, reading, science, writing, U.S. history, civics, geography, arts, economics, social studies, music, and career and occupational development.
Although the structure and content of NAEP have evolved over the years in response to congressional directives, the results have been used for a variety of purposes by many stakeholders. Both the number and type of customers and stakeholders who interpret and use the results have grown over time, as changing federal education policy has given NAEP increased visibility. In addition, the processes by which the assessments are developed, maintained, evaluated and publicly communicated have shifted, introducing a range of outside organizations that play a central role in supporting the NAEP program. As a national indicator of educational achievement, NAEP assessment results have also become a benchmark for some states as they measure the progress of their students.
At a time when accountability in education has become a priority at the federal level, the quality and effectiveness of testing procedures and practices require careful evaluation, particularly in light of their impact on future education policy decisions. As Congress considers the reauthorization of the No Child Left Behind Act of 2001 (NCLB), an
2 A glossary of acronyms and commonly used technical terms is included as Appendix A.
1

independent evaluation of the NAEP program is of particular interest. As part of the Education Science Reform Act of 2002, the NAEP Authorization Act mandated an evaluation3 that was conducted by the Buros Institute for Assessment Consultation and Outreach (BIACO), at the University of Nebraska, Lincoln, and the Center for Educational Assessment (CEA), at the University of Massachusetts, Amherst.
The primary purpose of this report is to inform policymakers as they respond to shifts in the NAEP program and the emerging needs of customers and stakeholders. As NAEP’s potential impact, usefulness, and accessibility expand nationally and internationally, the report’s implications for the future of NAEP are considerable. The report is based on multiple studies and analyses that broadly evaluated whether NAEP is consistent with generally accepted testing practices.
Overview of the NAEP Program
In its earliest days, the NAEP program focused on assessing what students knew and could demonstrate. NAEP reports provided results question by question, offering educators and the public a measure of students’ performance on particular questions. Teachers were thought to benefit from such results as they could modify their teaching to focus on the specific content areas in which students lacked proficiency.
In the early 1980s, NAEP was redesigned in response to stakeholders’ difficulties in understanding these reports. The test results were changed to a numerical scale score ranging from 0 to 500 for most assessments. The public had become familiar with the scale scores used for college admissions tests, such as the ACT and the SAT. Developing a similarly interpretative scale for NAEP helped communicate results to broad audiences. Scale scores also made it possible to compare achievement among demographic groups and regions and to assess changes over time.
The 1980s were a time of great debate in education, perhaps best exemplified by the 1983 report A Nation at Risk. Although NAEP results were central to many 3 A copy of the legislation authorizing the evaluation is included as Appendix B.
2

l E x e c u t i v e S u m m a r y l
discussions of the quality of education at the time, many thought NAEP could be made even more informative. The secretary of education established a panel to review NAEP and in 1987, the Alexander-James Panel recommended that NAEP begin a state-level assessment program.
In its reauthorization of NAEP in 1988, Congress called for several major changes. It authorized state-level assessments and in addition to existing scale scores, it called for establishing standards-based reporting. This part of the mandate was interpreted to create “achievement levels.” Such reports would identify percentages of students who met standards of achievement such as “basic, proficient or advanced.”
At the same time, Congress also established the National Assessment Governing Board (NAGB) as an independent nonpartisan body to set policy for NAEP. The U.S. Department of Education’s National Center for Education Statistics (NCES) was to continue administering NAEP with external organizations contracted to develop and supervise the actual assessments.
In 1990, the first NAEP results using standards-based achievement levels were presented. The initial achievement levels were widely criticized and underwent revision by NAGB in 1992. Using achievement levels introduced an element of value judgment. By using them to report NAEP findings, the purpose of the assessment had changed. NAEP moved from simply describing students’ achievements to evaluating them based on a set of standards of student performance.
The controversy over using achievement levels existed at many levels: NCES resisted using achievement levels, determining that they should be used on a trial basis and interpreted with caution (e.g., Mead and Sandene, 2007). An evaluation by the National Research Council (1999) called the achievement levels “fundamentally flawed.” Yet many customers and stakeholders found achievement levels useful to interpret NAEP findings. Part of the controversy focused on the standards of performance set across individual states and how they differed from those set on NAEP.
With the enactment of the No Child Left Behind Act of 2001 (NCLB) on Jan. 8, 2002, NAEP’s achievement levels
3
Part of the controversy over using achievement levels focused on how states’ standards differed from those of NAEP.

gained new attention. NCLB requires that states receiving federal funds test their students in grades 3–8 annually and once in high school and report the results using at least three achievement levels such as basic, proficient, and advanced. State assessment results are used to determine students’ performance and to hold schools accountable for that performance. In considering enactment of NCLB, some members of Congress expressed concern that states could establish low standards of performance or achievement levels that resulted in their students appearing to meet levels of proficiency when they actually did not. In this context, NAEP was considered as a means to assess the rigor of state standards. From an intuitive perspective, the common metric of NAEP could allow comparisons of a state’s results on its own assessments to its results on NAEP.
Although there was no legislative mandate to officially use NAEP as a tool in NCLB’s accountability system, there have been calls to formally include it in future policies. Thus, NAEP’s intended purpose has potentially expanded from description and evaluation to include, at least for some stakeholders, accountability.
Congressional Mandate for This Evaluation
Within the current policy context Congress mandated an independent evaluation of NAEP4 to respond to four wide-ranging questions. These questions asked whether the program was following acceptable testing practices but also highlighted specific areas such as setting achievement levels, sampling, and fairness. The educational measurement community defines its expectations for test program quality in the Standards for Educational and Psychological Testing (AERA, APA, and NCME, 1999).
Because the congressional questions were broadly stated, it was necessary to identify specific areas of study that would respond to the mandate. The evaluation was also bound by time and resource limitations. In consultation with the Technical Work Group, four more specific evaluation questions were formulated and served as the focus for this report. Table 1 illustrates how the congressional questions were specified as evaluation questions, how the studies were conducted to respond to those evaluation questions, and what the policy
4 The full text for this legislative mandate is included as Appendix B.
4
Although NAEP was not officially included as an accountability tool for NCLB, some believe it should be included in future policies.
Congress mandated an independent evaluation of NAEP to determine whether it used acceptable testing practices across several dimensions.

l E x e c u t i v e S u m m a r y l
significance of each one was. Brief descriptions of the evaluation studies5 are provided following the table.
57 Full reports for each of the studies in the evaluation can be found on the CD included with this report.
5
Table 1. Congressional and evaluation questions organized by studies and policy significance.
Congressional Questions Evaluation Questions Evaluation
Studies Policy Significance
1. Whether NAEP is properly administered, producing high-quality data that are valid and reliable, and is consistent with relevant widely accepted professional standards.
1. How consistent are NAEP’s procedures with professional testing standards?
3. How valid are state comparisons using NAEP?
Lifecycle audit Review of
alignment methodologies
Score equity assessment studies
Standards for Educational and Psychological Testing (AERA, APA, and NCME, 1999) specify expectations that testing programs should follow to support intended uses of test scores.
Policies require valid data to inform decision-making processes.
2. Whether student achievement levels are reasonable, valid, reliable, and informative to the public.
2. How consistent are procedures for setting NAEP achievement levels with professional testing standards?
4. How accessible and understandable are NAEP reports and results to stakeholders
Lifecycle audit Achievement
levels studies Utility of
NAEP reports studies
Achievement levels translate policy definitions into scale scores to add interpretability to the data. Evidence to support validity of these levels is critical.
NAEP data need to be communicated in ways that are meaningful for stakeholders.
3. Whether NAEP is being administered as a random sample and is reporting trends in a valid and reliable manner.
1. How consistent are NAEP’s procedures with professional practice and testing standards?
3. How valid are state comparisons using NAEP?
Lifecycle audit Score equity
assessment studies
Included populations and participation rates can influence score interpretations.
Fairness of score interpretations for subgroups (e.g., states) across time impacts policy decisions.
4. Whether any test questions are biased, and whether the assessments are measuring reading and mathematics ability.
1. How consistent are NAEP’s procedures with professional testing standards?
3. How valid are state comparisons using NAEP?
Lifecycle audit Review of
alignment methodologies
Score equity assessment studies
Fairness of score interpretations for subgroups (e.g., states, gender, ethnicity) impacts policy decisions.
Comparability of what is expected or measured by NAEP versus state score interpretations.

Overview of Evaluation Studies
Audit of the NAEP assessment lifecycleThis study served as an organizing framework for the evaluation. Its purpose was to evaluate the breadth of NAEP’s test development, administration, scoring, reporting, and maintenance processes by applying the professionally adopted standards of practice (i.e., Standards for Educational and Psychological Testing, AERA, APA, and NCME, 1999). The lifecycle audit included a review of documented processes and results from the organizations responsible for NAEP. To supplement the document review, we collected additional information through interviews with key personnel during site visits to these organizations. Elements of the audit responded to each of the four congressional questions.
Achievement levels studiesThese studies evaluated two areas of interest with respect to achievement levels. Achievement levels are policy definitions that are transformed into cut scores on NAEP score scales to classify students’ performance into descriptive categories. NAEP has developed definitions for basic, proficient, and advanced levels of performance. In the first study, we evaluated the application of a new methodology for setting achievement levels on the 2005 grade 12 NAEP mathematics assessment. For the second study, we evaluated evidence from two international assessments to examine the utility of these external measures of achievement in the context of NAEP’s achievement levels.
Utility of NAEP score reports studiesThese studies evaluated how stakeholders used and interpreted NAEP results and achievement levels presented in printed and Web-based formats. This area of evaluation represents a unique emphasis compared to previous evaluations and is of particular interest given NAEP’s increased visibility. Data collection for these evaluation activities included interviews, focus groups, analyses of Web usage data, and studies of how consumers interpreted results reported in print and on the NAEP Web site.
6
The evaluation questions and associated studies responded to the congressional mandate by identifying specific, relevant areas of inquiry.

l E x e c u t i v e S u m m a r y l
Score equity assessment studiesThese studies addressed an important issue of fairness by evaluating whether methods of calculating NAEP scale scores were consistent across states. Specifically, we evaluated whether the results for selected states would differ if NAEP assessments were statistically placed on the same score scale (i.e., equated) across time using only data from the state, as opposed to data from the entire nation, as is standard operating procedure. Because there are multiple steps involved the process of estimating scale scores, we evaluated whether any of those steps might affect the results for particular states. We also compared item statistics and achievement level results across national and state-specific replications.
Review of alignment methodologiesThis study reviewed alignment methodologies currently used by most states. Alignment generally refers to the degree of overlap among content standards, curriculum, instruction, and assessments. As a primary source of validity evidence in contemporary educational assessment programs, alignment studies also represent a critical policy consideration when interpreting and using scores. This review provides some context for policymakers as they consider potential uses and interpretations of NAEP results.
7

Key FindingsThis evaluation allowed us to investigate the core elements of the NAEP program. However, our findings and recommendations were limited to the evidence that was available to us during the course of the evaluation. Consistent with the congressionally mandated questions, we focused broadly on how NAEP complied with professionally adopted testing principles. Table 1, above, illustrates how the congressional questions were made operational, how they were addressed through relevant studies, and what their significance to policy discussions is.
A number of agencies and organizations, identified in this evaluation as the NAEP consortium, contributed to the program. Descriptions of those organizations currently responsible for different NAEP activities are provided in the body of this report. Note that the organizations can and have changed over the history of the program based on the results of competitive bids. However, the core activities of the program remain constant. Figure 1 provides a simple illustration of the path that NAEP uses to develop, administer, disseminate, and maintain the program. Descriptions of the agencies and organizations that carry out the tasks in Figure 1 can be found in the body of this report. Although the agencies and organizations associated with given activities may change in the future, Figure 1 illustrates the basic organizational structure of the program, listing activities and responsible organizations for various activities.
8
Although contracted organizations responsible for NAEP activities change over time, the core activities of the program remain constant.

l E x e c u t i v e S u m m a r y l
9
Figu
re 1
. The
Pat
h to
a N
AEP
Sco
re

Evaluation Question 1:
How consistent are NAEP’s procedures with professional testing standards?
This evaluation question is directly connected to the primary congressional question of whether NAEP is following procedures that are consistent with the Standards for Educational and Psychological Testing (AERA, APA, and NCME, 1999) and with good measurement practice. The size of the NAEP program, limited time, and funding constraints precluded a comprehensive evaluation of the entire program. However, after receiving input from multiple sources, we prioritized our efforts around the Main (national) and State NAEP assessments in reading and mathematics as they have undergone changes and received greater scrutiny since reauthorization in 2002.
The procedures for developing and maintaining NAEP are generally consistent with professional testing standards. However, two issues of concern have the potential to threaten the program if they are not addressed.
Strengths of NAEP Procedures
Our review of NAEP’s practices allowed us to explore many aspects of the NAEP program. Except for the few noted areas of concern below, the methods and procedures used for the Main and State NAEP assessments in reading and mathematics were found to be in compliance with the Standards and with commonly accepted standards of practice. This compliance was noted throughout the development, implementation, and maintenance of the program. For example,
Processes used to create assessment frameworks are consistent with common approaches to assessment development.
Methods used by the NAEP program’s Alliance contractors6 for developing and reviewing the NAEP assessment questions and background questions for
6 See p. 41 for a description of NAEP Alliance contractors. These contractors are one part of what this report terms the NAEP Consortium.
10
Except for a few noted areas of concern, NAEP practices were in compliance with accepted standards.
l E x e c u t i v e S u m m a r y l
content and bias were consistent with the Standards and followed sound measurement practices.
Methods used for field-testing items before operational use were technically sound.
Methods for sampling schools, for collecting data, for scoring results, for scaling results, and for reporting results were consistent with current practice.
Although the majority of the processes in the NAEP system were found to be compliant with the Standards, our evaluation of the technical (i.e., psychometric) quality is limited for two reasons: 1) the intended uses and interpretations of NAEP were not clearly defined, and 2) we did not have current NAEP technical manuals during the evaluation. These limitations are discussed in the next section.
Issues of Concern
An organized program of validation research based on clearly defined, intended uses and interpretations of NAEP is not evident in the program.Through a synthesis of our findings from the evaluation studies, a common question emerged, “What are the intended and unintended uses and interpretations of NAEP?” Our approach to the evaluation was based on the Standards for Educational and Psychological Testing (AERA, APA and NCME, 1999), that state:
‘Validity refers to the degree to which evidence and theory support the interpretations of test scores entailed by proposed uses of tests. Validity, therefore, is the most fundamental consideration in developing and evaluating tests.’ (p. 9)
and
‘Validation logically begins with an explicit statement of the proposed interpretation of test scores, along with a rationale for the relevance of the interpretation to the proposed use.’ (p. 9)
Validity is evaluated by starting with a coherent argument marshalling the theory and evidence for a proposed use or interpretation. Underlying the validity argument are the
11
Notably absent were clearly defined intended uses and interpretations of NAEP and current NAEP technical manuals.

sources of available theory and evidence for making the argument. These sources are collected and prioritized in the context of each proposed use and interpretation.
A testing program such as NAEP that expands and evolves over time has a need for systematically revisiting the validity arguments supporting its uses and interpretations, including both the current theory and evidence. A strategy for organizing these efforts is a validity framework.
A validity framework is an organizing tool that guides collection and prioritization of the theory and evidence needed to evaluate the proposed uses and interpretations of a test. This framework includes those unintended uses and interpretations that can be reasonably expected. It encompasses a logical argument for a valid use or interpretation based on theory as well as the evidence supporting that argument. This evidence may be procedural (e.g., test question development and review procedures, conditions of test administration) or empirical (e.g., reliability coefficients, relationships with external criteria). A program of validation research is a core element of a validity framework.
NAEP has not developed and maintained an articulated validity framework ensuring that current theory and evidence continue to support the proposed uses and interpretations of its test scores.
As noted earlier, NAEP initially focused on reporting and interpreting results were focused on students’ performance on particular assessment tasks (items or questions) at a given age or grade level. In the early 1980s, the focus shifted to overall performance on content domains specified by the assessment frameworks, with student performance described by scores on a scale. The results reported in NAEP publications were then interpreted in terms of overall performance of a representative sample of students in a particular content area (e.g., mathematics, reading, geography) at a particular grade level in a particular year. This was not the only interpretation, but given the role of NAEP as the “Nation’s Report Card,” it was a core interpretation.
A second major component in interpreting NAEP results has been the analysis of trends in performance. Although
12
A validity framework is an organized plan for collecting evidence to support intended uses and interpretations of test scores.

l E x e c u t i v e S u m m a r y l
many testing programs are designed to answer questions about individual examinees at some stage of their education, NAEP is designed to answer questions about populations of students (and subpopulations defined by various categories), and the changes in performance in these populations over time. Because it is a unique and complex testing program, it requires a tailor-made validity framework.
For the sake of illustration, some of the assumptions inherent in these core interpretations of NAEP performance are:
The NAEP assessment framework for a particular content area and grade level specifies an appropriate content domain for the content area and grade level.
Included assessment tasks (items or questions) constitute a representative sample from the content domain and are free of substantial sources of irrelevant variability or content not in the domain.
The selected sample of students is assumed to be representative of the target population and to be large enough to provide good estimates of the performance in the population.
There are, of course, many additional assumptions built into the core interpretation of NAEP results (e.g., assumptions about participation rates, accommodations, student motivation, administration procedures), and in particular, the statistical models used to analyze NAEP data employ a host of complicated statistical assumptions. In developing a comprehensive validity framework, all of the main interpretations inherent in reporting conclusions about performance in various populations would be spelled out and evaluated within the validity framework. Such evidence might include descriptions of 1) how the assessment frameworks were developed and by whom, 2) descriptions of task development and review, 3) field testing data, 4) statistical analyses of sampling plans and implementations, and 5) post-administration analyses of the results.
13

Many of the specific studies called for in such an organizing framework have been carried out over the years; however, the interpretation and relevance of these studies to the overall validity of NAEP have not been clearly identified and the results from different analyses have not been organized in a way that needed information can be identified and accessed. We recommend that the NAEP program include an evaluation process by which the assumptions articulated by these core interpretations be reviewed to identify any gaps in the necessary evidence. Any identified gaps should be the basis for future validity research efforts.
The need for an organized validity framework becomes more pressing when we consider newer interpretations and uses of NAEP results. As noted above, NAEP is a unique program for which standard validation frameworks (AERA, et al., 1999; Kane, 2006) are not completely adequate. In addition, results are now reported mainly in terms of the percentages of students achieving defined achievement levels. This shift introduces new assumptions to be evaluated and also raises questions about more basic assumptions. Two illustrations are:
Is the sample of tasks sufficiently demanding to provide adequate information about advanced performance?
Are state-by state comparisons using NAEP appropriate in the context of the NCLB legislation, given that different states have adopted different content standards?
Our analyses did not reveal a process by which these assumptions were evaluated to determine if associated inferences and uses were appropriate. Therefore, there is a need for an ongoing, systematic appraisal of the validity of the interpretations and uses being built on the NAEP assessments. This is especially important during this period when the interpretations and uses may be evolving dramatically. In NAEP, responsibility for evaluating various assumptions and inferences tends to be distributed across multiple organizations and individuals, but it is not clear that any group within the NAEP Consortium has ongoing responsibility for making sure that common and new interpretations of NAEP data are justified.
14
l E x e c u t i v e S u m m a r y l
Although an articulated validity framework is not currently apparent, the NAEP program does have many opportunities within its existing infrastructure to collect evidence when the intended uses and interpretations are clearly defined and is addressing many of the validity issues that would be included in a validity framework. The NAEP Validity Studies Panel’s development of an Agenda for NAEP Validity Research (Stancavage, et al., 2002) is one of these examples and could serve as a starting point for developing an organized validity framework.
NAGB and NCES both support research efforts to gather validity evidence for the program. The contractors responsible for developing, administering, and maintaining NAEP also have systems in place to inform and document evidence to support a range of uses of the assessments. Examples of these research efforts can be found in the body of this report. However, work connecting these various research programs to an organized validity framework is needed to strengthen the NAEP program.
The concept of an organized validity framework and the evidence needed to support it, serves as an overarching theme for other key findings in the evaluation. These subsequent findings represent possible components of a validity framework for NAEP and are organized by the evaluation questions. Only consolidated findings are included here. For additional detail on these findings, readers are directed to the full study reports contained in the published CD that accompanies this evaluation.
NAEP does not release technical manuals in a timely manner.
Similar to the financial records a company provides for an independent audit, a technical manual documents the procedures, results, and decisions of a testing program. This information enables users to evaluate the processes used to produce the results, and is an important component of the program. For a testing program as complex as NAEP, a technical manual serves a number of purposes. Specifically, a technical manual provides:
Documentation of the procedures and practices that are part of the development and maintenance of the testing program. This evidence allows users to evaluate the credibility and the usability of the results.
15
An overarching theme of the evaluation's findings is the concept of an organized validity framework based on NAEP's intended uses and interpretations.

Knowledge transfer of procedures and practices for those who may not be intimately familiar with the program. This evidence can be used to train new staff members and inform stakeholders.
A record of judgmental and empirical decisions that influenced the direction of the program. These records can also be used to assist with problem resolution.
Greater transparency of the program’s activities for external scrutiny.
According to Standard 6.1, technical documentation for a test “should be made available to prospective test users…at the time a test is published or released for use” (AERA et al., p. 68). The current timeline for the release of NAEP technical documentation is often years after the results have been released. For example, the 1999 Long Term Trend technical manual was released in 2005—more than five years after scores from the 1999 assessment were being used and interpreted. Released versions of the more recent studies were not available during the data collection phase of this evaluation, making it difficult to comment on the quality of processes.
This delay exceeds what a testing program should tolerate and is out of compliance with the Standards. Other large-scale testing programs release technical reports on a faster schedule. For example, the technical report from the 2003 Trends in International Mathematics and Science Study (TIMSS) was published the following year (Martin, Mullis, and Chrostowski, 2004). Factors that may contribute to NAEP’s documentation delays, such as a six-month reporting timeline for select NAEP assessments and an effort to shift to online versions of this documentation, are described in more detail in the body of this report.
Recommendation 1: Develop an organized validity framework that includes a clear definition of the intended uses and interpretations of NAEP scores.
Based on our evaluation, this primary recommendation is a fundamental need for all testing programs. As the Standards clearly specify, a rationale and supporting research and documentation should be provided for each intended use and interpretation of a test’s scores. Because NAEP is used by a range of stakeholders, defining intended
16
Currently, release of NAEP technical documentation can be years after results have been released, exceeding what testing programs should tolerate.

l E x e c u t i v e S u m m a r y l
uses and developing a validity framework are shared responsibilities for the agencies that oversee NAEP. By developing a validity framework with defined intended uses and interpretations, validation efforts can be guided by a common plan to support those uses and actively discourage unintended or inappropriate uses.7 All of the findings and recommendations described in this report are connected to this primary recommendation that NAEP develop a validity framework.
Recommendation 2: Revise review processes for NAEP technical reports and manuals that facilitate their timely release.
Communicating results without documentation of the processes that led to those results does not allow readers to evaluate their credibility or limitations. According to the Standards, it is the responsibility of the testing program to provide documentation of the technical quality of the results at the time scores are released. This is a rigorous expectation of quality that NAEP is not currently meeting. As described above, there are a number of reasons why releasing technical documentation is important. For NAEP, providing this information in a timely manner greatly increases the transparency of the testing program and assists users in understanding the appropriate uses of scores as defined in the validity framework.
Evaluation Question 2:
How consistent are procedures for setting NAEP achievement levels with professional testing standards?
Currently, a prominent method of reporting NAEP results is the use of achievement level categories. NAGB defines three achievement levels: basic, proficient, and advanced. Student achievement, however, is often reported at four levels below basic, basic, proficient, and advanced. Results reported as achievement levels are readily accessed and appreciated by consumers of NAEP data. However, the topic of setting achievement levels on NAEP is
7 Although not every unintended consequence can be anticipated, the Standards require reasonable effort to prevent negative consequences and to encourage sound interpretation (Standards, at p. 117).
17
There are several reasons for releasing timely technical documentation; primarily, it assists users in understanding appropriate uses and limitations of NAEP scores.

controversial and has spurred ongoing professional debate about the processes, interpretation, and validity evidence.
The process of setting achievement levels on NAEP has been criticized in previous evaluations (e.g., Shepard, Glaser, Linn, and Bohrnstedt, 1993; U.S. General Accounting Office, 1993; Pellegrino, Jones and Mitchell, 1999) and defended (e.g., Cizek, 1993; Kane, 1993; Hambleton et al. 2000; Reckase, 2000; Loomis and Bourque, 2001; Bourque, 2004). In this evaluation, we a) reviewed a new method that was used to set the achievement level standards on the 2005 grade 12 NAEP math assessment and b) reviewed evidence from international assessments to evaluate their utility as external sources that could inform the achievement level development process.
Many of the procedures for setting achievement levels for NAEP are consistent with professional testing standards. However, there is a notable exception regarding external evidence to inform the policy decision.
Strengths of NAEP Achievement Levels
As a policy decision, achievement levels can be set with consideration of multiple factors that inform the final decision. In education, a primary source of evidence comes from studies that involve educators’ judgments of students’ performance based on a policy definition. Although the judgments are based on a structured, deliberate process, these studies are inherently judgmental in nature. Further, they include an element of value in yielding a recommendation from the panel for what is “good enough” to represent performance at a given achievement level (Hambleton and Pitoniak, 2006). Therefore, reasonableness is a matter of perspective and relative to the purpose for which the achievement levels are set.
Because NCES is charged with certifying achievement levels yet has been critical of their use and refers to them as “developmental,” there is residual tension between NAGB and NCES concerning their establishment. This has led to confusion among stakeholders and an uneven use of the achievement level terminology. Some of this confusion reflects the ambiguity in the intended uses of NAEP’s achievement levels relative to other types of achievement levels (e.g., those used by states) with which stakeholders
18

may be familiar.8 Defining the purpose of NAEP’s achievement levels should be part of the validity framework described above.
The use of achievement levels or cut scores for evaluative decisions is not a novel concept. For example, in education these types of judgments are also made at the state level (e.g., levels of student achievement), in classroom grading practices (e.g., assigning letter grades of A, B, C, D, or F), and for individual students (e.g., appropriate instructional strategies). Similarly, one sees the use of poverty thresholds by the Census Bureau, or poverty guidelines used by agencies, such as the Department of Health and Human Services and the Department of Agriculture, to assist with statistical or administrative purposes.9 Empirical data and additional policy considerations inform the final decision but do not change the value-laden component of the judgments and perceptions of reasonableness.
When we evaluate the processes that result in recommended achievement levels for policy consideration, there are different sources of validity evidence that we expect to see in a credible process. Kane (2001) suggested a framework for evaluating standard-setting that relies on three different sources of validity evidence: internal (characteristics of the participants’ judgments), procedural (systematic activities that are understood by qualified participants), and external (additional sources of evidence beyond the methodology that inform the policy decision). When we reviewed the Mapmark10 methodology (Schulz and Mitzel, 2005) as applied to the 2005 grade 12 mathematics assessment, we found the following validity evidence that could be attributed to these three sources: internal, procedural, and external evidence.
8 NAEP has historically been a low-stakes assessment for students, schools and states. In the context of state policies and NCLB, state assessments often have high-stakes for schools and students.9 Additional information about federal measures of poverty can be accessed at http://aspe.hhs.gov/poverty/05poverty.shtml. 10 A more detailed description of the Mapmark method is provided in the body of this report and on the CD accompanying this evaluation.
19
The validity framework includes a clear definition of the purpose of NAEP’s achievement levels, without which, there is confusion and ambiguity.

Internal evidence:
Variation in panelists’ judgments generally decreased from their initial recommendation to their final recommendation suggesting greater agreement.
Procedural evidence:
Panelists for the studies met eligibility qualifications to participate in the study. Specifically, panelists were experts in the content or familiar with the abilities of students who took the assessment or both.
Evaluations of the panelists’ experiences suggested that they understood their task (the judgments they were asked to render) and had confidence that their ratings would lead to appropriate achievement levels.
Facilitators followed structured procedures for orientation, training, and implementation of the achievement level methodology.
External evidence:
Pilot studies conducted with a previous standard-setting methodology and the new methodology converged to yield similar results.
Additional, limited data regarding 2005 12th grade students’ math performance were not inconsistent with NAEP results.
From these observations, we concluded that the internal and procedural evidence supports the validity of the process; however, the external evidence11 could be strengthened.
11 Policymakers and researchers use external evidence as additional information when evaluating the achievement levels recommended by qualified subject matter experts. Its function is distinct from the content expert role of the panelists.
20

Issues of Concern
Other measures of U.S. students’ educational achievement do not provide strong sources of external validity evidence for NAEP achievement levels.It is a challenge to gather validity evidence from multiple sources outside a standard-setting study that can be used to evaluate achievement levels. Furthermore, external data are not perfect evaluation evidence due to potential differences in content, sample, and purpose. For example, some tests (like well-known college admissions tests—e.g., the SAT and ACT) involve self-selected samples of college-bound seniors, not a nationally representative sample. In many cases external tests serve purposes that are very different from NAEP. As the differences between what tests purport to do and what they measure increase, the utility of these measures as external evidence decreases.
Beyond the sources that focus on measures of student achievement solely in the United States, NAEP may also consider international measures as a potential source of external validity evidence. Although we could not evaluate this source for the 2005 grade 12 mathematics assessment, we did compare 2003 NAEP achievement levels for eighth-grade mathematics with 2003 results of the Trends in International Mathematics and Science Study (TIMSS) and Program for International Student Assessment (PISA).
The appropriateness of using domestic or international sources of external validity evidence to aid policymakers clearly rests on the uses and interpretations of achievements as defined in the validity framework. It is possible that NAEP achievement levels are not intended to converge with achievement levels developed by other assessment systems. If so, then documenting this anticipated, yet unintended, use in the validity framework would help to reduce misinterpretation.
Recommendation 3: NAEP should continue to explore methodologies for setting achievement levels.
Stakeholders continue to use achievement levels as one means of interpreting NAEP results. NAEP has engaged in extensive research on standard-setting since 1992 to improve its practice. Some of this research includes the pilot studies done on the new Mapmark method (Schulz
21

and Mitzel, 2005). However, because this new methodology is not widely used, more research on whether it is appropriate for other NAEP subject areas is needed. Although we conclude that the new methodology worked well with the experts involved in the study on the 2005 grade 12 mathematics assessment, the degree to which the method will work with experts from other subject areas cannot be determined from this evaluation. More information on the details of this new methodology is included in the body of this report and in a report included on the CD accompanying this evaluation.
Recommendation 4: NAEP should prioritize gathering external validity evidence that evaluates the intended uses and interpretations of its achievement levels.
The validity evidence collected by NAEP from internal and procedural sources suggest that the methodology was implemented as intended and that panelists had a positive experience with the process. However, the reasonableness of the results is a judgmental decision by policymakers who should consider additional sources of information. External validity evidence is an additional source of information to help policymakers make the final policy decisions about NAEP achievement levels. Such evidence may include results from additional standard-setting methods, state university entrance levels at the high school level, and transcript studies that evaluate course performance.12 The extent to which the sources of evidence may converge is affected by the intended uses and interpretations of NAEP’s achievement levels as articulated in a validity framework.
12 External evidence may be considered by policymakers and researchers in evaluating recommendations for setting achievement levels made by panels of subject matter experts. These panels are charged with providing judgments about appropriate achievement expectations given their knowledge of the content and the abilities of the students who are being assessed. Policymakers may accept or modify panel recommendations.
22
External validity evidence can influence achievement level decisions. At grade 12, it may include state university entrance level results or transcript studies evaluating course performance.
Evaluation Question 3:
How valid are state comparisons using NAEP?
From an intuitive perspective, a common measure administered across states should yield results that are comparable on the measure. The common metric of NAEP and the ease of some of the Web-based reporting tools make these comparisons seductively simple for users. However, there are some assumptions inherent in the choice between norm-referenced (i.e., comparisons to other states or the national average) or criterion-referenced (i.e., comparisons to NAEP achievement levels) interpretations that need to be understood in evaluating their appropriateness.
Although data to make state comparisons on NAEP are available, the appropriateness of these interpretations is influenced by many factors.
Strengths of Using NAEP for State Comparisons
NAEP assessments are administered over time and connected through statistical processes to make them comparable. One of the primary purposes of NAEP is to monitor the progress of the nation’s students over time. However, the connections among scores across years and reported subgroups must be appropriate and fair for all subgroups included to be valid. Overall, the studies in this evaluation that examined this one particular aspect of fairness (sometimes called score equity assessment) support the comparability of the processes used to estimate scores for states. More information about this study can be found in the body of this report. However, other issues that impact comparability of NAEP scores across states are important to consider.
23
One purpose of NAEP is to monitor the progress of the nation's students over time.
Issues of Concern
Evidence of alignment between NAEP assessment frameworks and state content standards, curriculum, and assessments is lacking.
In making comparisons of achievement among states using NAEP, a critical issue is the degree of alignment between the assessment (i.e., the NAEP assessment framework and questions) and states' educational systems characterized by their content standards, curricula, instructional practices, and assessments.13 Only when an assessment is aligned with an educational system can it be an accurate indicator of how well students are meeting expectations with respect to what they have been taught. Alignment can be demonstrated at many levels. For example, as part of its peer review process NCLB requires states to demonstrate that their state assessments have been independently judged to align with state content standards to ensure valid interpretations of achievement.
Alignment methods could be used to evaluate a) the degree to which NAEP tests are congruent with the content and cognitive dimensions in the NAEP frameworks (e.g., Sireci, Robin, Meara, Rogers, and Swaminathan, 2000), and b) the degree to which different state assessments are congruent with NAEP assessments and with each other. Alignment methods allow for a useful summarization of the congruence among specific aspects of an assessment system. Alignment studies for NAEP exams, or for NAEP-state comparisons, that focus on the most general level of alignment (e.g., WestEd, 2002) could provide valuable information for understanding discrepancies in NAEP and state test results. These types of studies might also be extended to evaluate unique features of state curriculum and instructional practices relative to NAEP frameworks. More information on alignment methods that could be useful to the NAEP program is provided in a study found on the CD accompanying this report.
13 Alignment can be more broadly characterized as including the multidimensional considerations of policy, curriculum, instruction, and assessment both within and across grade levels.
24
The critical issue of alignment between NAEP and state level educational systems must be addressed.

Current NAEP inclusion and participation policies and rates may not provide evidence to support intended uses and interpretations of NAEP.
As mentioned earlier, the intended uses and interpretations of NAEP results should be defined in a validity framework and related to how different types of students and schools are included in the results. Unlike state assessment programs developed for NCLB, all students do not take NAEP. Further, those who take NAEP do not take a full assessment but rather a sample of its content. Thus, those included or excluded can influence the results and any score interpretations. This is particularly true for students with disabilities (SWD) and English language learners (ELL). Decisions about inclusion and accommodations of SWD and ELL are made at the state level.
Because state policies vary, diverse practices across states threaten any state-by-state comparisons. For example, of SWD and ELL subgroups in California (representing 40 percent of the total state sample), 4 percent of those students were excluded from participating, 5 percent were assessed with accommodations, and 31 percent were assessed without accommodations. In contrast, Ohio’s SWD and ELL subgroups represent 13 percent of its total state sample. In this state, 3 percent were excluded, 8 percent were assessed with accommodations, and 2 percent were assessed without accommodations (see Figure 5 in the body of the report). Although a comprehensive evaluation of the comparability of NAEP’s sample characteristics was not part of this evaluation, these differential policies raise additional questions.
Beyond inclusion policies, participation is also an important consideration. NAEP remains a voluntary assessment for students. Therefore, nonresponse and refusal to participate represent potential threats to the validity of NAEP scores, particularly for grade 12 and private school samples. For example, Chromy (2005) noted that recent student participation rates for grade 12 (74 percent) were considerably lower than grade 4 (94 percent) and grade 8 (92 percent). It is also unclear whether current sampling plans include all potential subgroups of interest within a state, such as students with specific ethnicities, disabilities, varying language proficiencies, and free and reduced-
25
Because not every student takes NAEP, those included or excluded influence both the results and the interpretation of scores.
NAEP remains a voluntary assessment for students. Nonresponse and refusal to participate are potential threats to its validity.

priced lunch program status. Additional information about these topics can be found in the body of this report.
Recommendation 5: Conduct additional validation research in the area of alignment of NAEP with state content standards, curricula, and assessments.
As used here, alignment refers to the overlap among a) NAEP assessment frameworks and state academic content standards, b) state assessments and NAEP assessment frameworks, and c) state assessments and NAEP assessments. NAEP is often used by stakeholders as a basis for assessing the results of state assessments, whether defined as an intended use or not in its validity framework. Therefore, it is imperative for NAEP to further explore the multiple questions raised by this topic to support valid score interpretations. If the intended uses of NAEP are expanded to more directly evaluate student performance as reported by states under NCLB, alignment evidence of the comparability of states’ curriculum, instruction, and assessment practices to NAEP’s assessment frameworks and items are a necessary source of validity evidence to support or refute the appropriateness of these comparisons.
Recommendation 6: Conduct studies that evaluate issues of concern related to participation in NAEP.
As discussed in the findings, states currently have different policies for exclusion and providing accommodations for students with disabilities (SWD) and English language learners (ELL) on NAEP. This raises the potential issue of fairness of comparisons of these subgroups across states. Although strategies for estimating the impact of exclusion appear promising as a means of improving the comparability of State NAEP scores (e.g., McLaughlin, 2000; Wise, Le, Hoffman, and Becker, 2004), these results are not conclusive.
For NAEP to yield valid results, data need to be based on sufficient, representative samples to estimate performance for each intended subgroup defined in its validity framework. Chromy, et al. (2007) suggest that full census data may be needed in many states for some of the comparative achievement gap analyses to be conducted. This may amplify an existing concern about participation. Unlike fourth and eighth grade, participation for reading and mathematics at the 12th grade is voluntary for schools
26
To make valid comparisons between NAEP and state assessments, there must be evidence of curriculum, instruction, and assessment comparability.

(as well as for students). Further, 12th grade NAEP is only conducted at the national level, so additional state-level information is unavailable. Unless meaningful incentives are implemented to encourage schools and students to participate, 12th grade NAEP results will have limited utility for policymakers (Chromy, 2005).
Evaluation Question 4:
How accessible and understandable are NAEP results and reports to stakeholders?
Communicating NAEP results and reports clearly and meaningfully to stakeholders is a considerable challenge. The reporting strategies used by NAEP represent a transition from data collection and analysis to usability. As new strategies for reporting are implemented, increasingly diverse stakeholders access and interpret results at different levels. It is also important to ensure that these results and reports are consistent with a validity framework.
NAEP’s Web site contains both depth and breadth of information; however, the information may not be reaching some intended stakeholders in ways that allow for appropriate interpretation.
Strengths of NAEP Reporting
Through a special study in this evaluation, we found that participants in focus groups expressed positive impressions of the NAEP Web site. Also, NAEP incorporates a number of graphical displays in its reporting materials, ranging from bar charts and line graphs to interactive state comparison maps. Many of these displays were easily understood and interpreted by the participants in several focus groups. Because NAEP reports results for both scale scores and achievement levels, the use of color-coded, purposeful visual displays to communicate results is an essential component of NAEP reports. Black and white illustrations of the types of tables and figures that participants explored are included in the body of this report.
In addition to a review of stakeholder understanding of sample graphic and tabular displays, the evaluation conducted a review of Web statistics. Results from these
27
With increasingly diverse stakeholders, there are considerable challenges to communicate NAEP results effectively.

analyses suggested that interest was particularly strong with respect to the State Profiles, the NAEP Question Tool, results for subgroups, the Initial Release Site (www.nationsreportcard.gov), and the NAEP Data Explorer. Each of these elements generated a higher level of traffic relative to other features of the site. Although these aspects of the site are viewed at higher rates, additional questions that could not be answered here include: a) the reasons why these features are increasingly popular and b) how well these features meet the information needs of users.
Issues of Concern
Intended users were not familiar with NAEP scale scores and had difficulty distinguishing between achievement levels on NAEP and those that were developed by states for NCLB reporting purposes.
Most participants in our utility studies identified NAEP with state-level results. This represents a communications challenge for the future because of stakeholders’ familiarity with the reporting scales and achievement levels used for their state’s own NCLB assessment. For example, there was confusion among participants between state and NAEP achievement level results. This led to recognition that states’ definitions of Proficient are perhaps different from NAEP’s definition of Proficient. However, the nature of such differences is not readily apparent. Another source of confusion is that NAEP defines three achievement levels (i.e. basic, proficient, and advanced), yet often indirectly reports student performance at four levels (i.e. below basic, basic, proficient, and advanced). No policy definition for the achievement level below basic exists.
Participants’ lack of familiarity with the score scale and achievement levels extends to data displays of scale scores that report subgroup differences. Participants’ lack of understanding of the NAEP score scale limited the extent to which they could assign meaning to scale score results and subgroup differences. Although they were able to recognize where the differences were abstractly “significant,” participants sought ways to interpret different points on the NAEP score scale with practical meaning. Similarly, participants wanted to ascribe practical meaning to scale
28
Participants’ lack of understanding of score scale and achievement levels seems to warrant the dissemination of more basic public information.

score difference for subgroups but did not have the information to do so.
Recommendation 7: Prioritize score reporting and interpretation as an area for research in the NAEP program.
Systematic studies of methods to report NAEP scale scores and achievement levels should be carried out with stakeholder groups prior to their operational use. Although some of this research may include print media, a more critical focus for evaluation is the expanding presence of NAEP on the World Wide Web. Where appropriate, the NAEP elements on the Web should be revised to represent empirical findings about ease of use, stakeholder interests, and accepted Web site development practices. Because NAEP reporting continues to invest in the use of interactive, online tools, the utility of these features must also be assessed.
Challenges to the interpretability of NAEP scale scores serve as one reason for the development of achievement levels. This initiative has been promoted as a strategy to assist the public and policymakers in understanding students’ performance. It is important for NAEP to continue to refine its achievement level descriptors to guide users’ understanding of the meaning of different levels of NAEP achievement and how they may connect with state assessment results.
As NAEP defines its intended and unintended uses, research into score reporting can help to ensure the information disseminated is clear and promotes appropriate score interpretations. Methods such as focus groups and interviews can provide considerable information about how test results are used and understood, and for NAEP such studies can be a functional aspect of a validity framework.
29
As NAEP’s presence on the World Wide Web continues to expand, it may be a critical focus for future development.

Conclusion
As the Nation’s Report Card, the NAEP program continues to be a valuable tool for policymakers to broadly monitor the achievement of students. However, the evolving uses of NAEP scores among subgroups (e.g. states, urban districts, multiple student subgroups) require additional consideration, namely the extent to which intended uses and interpretations are supported by evidence collected in response to the validity framework for the program.
NAEP’s evolving uses present challenges to a program that is currently at capacity with established operational responsibilities. The findings and recommendations in the final evaluation report are designed to inform policymakers’ discussions about the key components of the NAEP program when judging the program’s intended purposes against expectations in the Standards for Educational and Psychological Testing (AERA, APA, and NCME, 1999).
30

l E v a l u a t i o n o f N A E P F i n a l R e p o r t l
Chapter 1: The Mandate for the Evaluation
Policy Context for Evaluating NAEP
For almost 40 years, the National Assessment of Educational Progress (NAEP) has regularly measured the achievement of the nation’s public and private school students at the elementary, middle, and secondary levels. Since 1969, NAEP, also known as the Nation’s Report Card, has measured students’ achievement in over a dozen instructional areas, including mathematics, reading, science, writing, U.S. history, civics, geography, arts, economics, social studies, music, and career and occupational development.
In its earliest days, NAEP focused on what students knew and could demonstrate. The first NAEP reports provided results question by question—a strategy intended to provide educators and the public with a measure of American students’ performance on particular questions or items. Teachers in particular, were thought to benefit from such results because they could modify their teaching to help students learn the content associated with areas in which they were not proficient.
Since the early 1980s, NAEP has reported results based on estimates for groups of students, for example, by race, ethnicity, gender, and region. Students who participate in NAEP take a sample of test questions rather than an entire assessment. This method is known as matrix sampling and allows estimates of group ability to be made even though no single student completes an entire assessment. The benefits that might be gained from having students complete an entire assessment were limited by the length of a full assessment and time restrictions for administering NAEP.
Many stakeholders found it difficult to understand NAEP’s findings based on item results, and in the early 1980s NAEP was redesigned. Using a modern educational measurement approach known as item response theory (IRT), NAEP began reporting results based on a whole test, although students continued to take only a sample of questions. Similar to the scale of SAT scores, from 200 to 800 or ACT scores, from 1 to 36, NAEP adopted a numerical score scale for most assessments that ranged
31

from 0 to 500. Instead of reporting achievement growth based on changes in the percentages of students who correctly answered each question, NAEP reported average scale scores and their changes over time. Scale scores offered the advantage of comparisons in achievement among demographic groups and regions as well as change over time.
The 1980s were a time of great debate in education, perhaps best exemplified by the 1983 report, A Nation at Risk. Although NAEP results were used in many discussions of the quality of education in that decade, many policymakers thought NAEP could be even more informative. The secretary of education established a panel to review NAEP, and in 1987, the Alexander-James Panel recommended that NAEP begin a state-level assessment program.
In 1988, when Congress reauthorized NAEP, it called for several major changes. First, it authorized state assessments, and in 1990 trial state assessments started with Grade 8 mathematics with 37 states and some additional jurisdictions participating. A series of evaluation studies of the trial state assessment was done by the National Academy of Education, which generally concluded that state assessments were successful (Glaser, Linn, and Borhnstedt, 1992) and should be continued (Glaser, Linn, and Bohrnstedt, 1993). The results from this assessment offered states an opportunity to track changes in their students’ achievement over time. They also enabled states to compare themselves to other states and to the nation, on NAEP.
Second, in addition to scale scores, the 1988 legislation called for standards-based reporting of NAEP results in the form of the percentages of students who met established standards of achievement. One of the problems with NAEP scale scores is that many people had trouble understanding what the scores meant. What was good? What was bad? Although the public was familiar with scale scores for tests like the ACT or SAT, their understanding was based on repeated, frequent exposure and to the tests’ relevance for individuals and college admissions, neither of which was true for NAEP.
32

l E v a l u a t i o n o f N A E P F i n a l R e p o r t l
Perhaps anticipating the political implications of these changes, Congress also established the National Assessment Governing Board (NAGB) as an independent, nonpartisan body to set policy for NAEP. The U.S. Department of Education’s National Center for Education Statistics (NCES) was to continue to administer NAEP. The actual assessments continued to be developed and maintained through external organizations under contract.
NAGB’s policy role was not only to establish achievement levels for standards-based reporting of NAEP findings but also to undertake the politically charged task of developing the specifications for the content that would be assessed, known as assessment frameworks. Crafting frameworks for assessments is challenging because of the many ways content (through curriculum and instruction) is presented and emphasized across states.
The first time that NAEP results were presented using the standards-based “achievement levels” established by NAGB was in 1990, when findings were presented in terms of the percentages of students meeting basic, proficient, and advanced levels of achievement. Many criticized these initial achievement levels (including the Government Accountability Office, 1993), and NAGB undertook a new standard-setting effort for the 1992 mathematics and reading assessments. Although some educational measurement specialists (also called psychometricians) continued to criticize these standards (e.g., Shepard, Glaser, Linn, and Borhnstedt, 1993; Pellegrino, Jones, and Mitchell, 1999), others defended them (e.g., Cizek, 1993; Kane, 1993; Hambleton, Brennan, Brown, Dodd, Forsyth, Mehrens, Nellhaus, Reckase, Rindone, van der Linden, and Zwick, 2000).
From a broader perspective, using achievement levels to report NAEP findings expanded the purpose of the assessment. Previously only descriptive, it now included evaluation. Achievement levels involve an element of value judgment—what is basic, or proficient, or advanced?—applied to a numerical scale in the form of “cut scores” that separate, for example, basic from proficient from advanced levels of achievement. As a result, NAEP shifted from simply describing the achievement of American students as a “social indicator” to providing an evaluation
33

of how well students were doing relative to the achievement levels established by NAGB.
NCES, which was responsible for NAEP policy before NAGB was established, resisted reporting NAEP findings using achievement levels, characterizing them as “developmental,” in published reports (e.g., Mead and Sandene, 2007). This position was supported by the findings of previous evaluations. For example an evaluation by the National Research Council (1999) continued the criticism of achievement levels, calling them “fundamentally flawed.” However, many stakeholders have found achievement levels useful in helping them interpret what they believe NAEP findings mean.
With the enactment of the No Child Left Behind Act of 2001 (NCLB), NAEP’s achievement levels have gained additional attention. NCLB requires that states receiving federal funds annually test their students in grades 3–8 and once in high school, and report the results using at least three achievement levels (e.g., basic, proficient, and advanced). State assessment results are used to determine students’ performance and to hold schools accountable for that performance.
In considering enactment of NCLB, some members of Congress expressed concern that states could establish low standards of performance or achievement levels that result in their students appearing to meet levels of proficiency, when they actually did not. In this context, NAEP was considered as a means to assess the rigor of state standards. From an intuitive perspective, the common metric of NAEP could allow comparisons of state results on state assessments to state results on NAEP. However, this is a simplistic interpretation that may not consider the limitations of such comparisons. It also leads to a perception of a “gold standard” that places more value in one test over another—even if the tests were designed for different purposes.
34
Part of the controversy over using achievement levels focused on how states’ standards differed from those of NAEP.

l E v a l u a t i o n o f N A E P F i n a l R e p o r t l
Although there was no legislative mandate to officially use NAEP as a tool in NCLB’s accountability system, there have been calls to formally include it in future policies. Thus, NAEP’s purpose has expanded from description and evaluation to include, at least among some stakeholders, accountability. Some states are using NAEP frameworks to guide development of their achievement standards. States have also used NAEP achievement level descriptors and results to inform their own achievement level development.
Congressional Mandate
It is within this current policy context that Congress, through the NAEP Authorization Act as a component of the Education Science Reform Act of 2002, mandated an independent evaluation of the NAEP program14 to respond to four broad questions. In summary, these questions asked the evaluation to determine whether the program was following generally acceptable testing practices. The professional testing community defines their expectations for sound practice in assessment programs in the Standards for Educational and Psychological Testing (American Educational Research Association [AERA], American Psychological Association [APA], and National Council on Measurement in Education [NCME], 1999). Within this broad mandate there were requests to consider such topics as the validity of achievement levels and sampling practices.
Because these questions were broad, it was necessary for the evaluation to identify specific areas of study that would be responsive to the mandate, yet stay within the limitations of the evaluation. Four questions emerged from the evaluation and serve as an outline for this report.
Key Questions
Findings and recommendations from this evaluation are drawn from a series of studies that were identified to respond to the congressional questions. However, the findings were limited to the information available to the evaluators when the data collection phase of the evaluation occurred. Brief
14 The text for this legislative mandate is included as Appendix B.
35
Although NAEP was not officially included as an accountability tool for NCLB, some believe it should be included in future policies.
Congress mandated an independent evaluation of NAEP to determine whether it used acceptable testing practices across several dimensions.
The evaluation questions and associated studies responded to the congressional mandate by identifying specific, relevant areas of inquiry.

descriptions of each of these studies are included in the next section of the report.
Table 1 illustrates how the congressional questions were interpreted as evaluation questions, connects them to the studies that were conducted to respond to the questions, and describes the policy significance of each. This table provides contextual information to demonstrate how these mandated questions were interpreted for the evaluation.
36

l E v a l u a t i o n o f N A E P F i n a l R e p o r t l
37
Table 1. Congressional and evaluation questions organized by studies and policy significance.
Congressional Questions Evaluation Questions Evaluation
Studies Policy Significance
1. Whether NAEP is properly administered, producing high quality data that are valid and reliable, and is consistent with relevant widely accepted professional standards.
1. How consistent are NAEP’s procedures with professional testing standards?
3. How valid are state comparisons using NAEP?
Lifecycle audit Review of
alignment methodologies
Score equity assessment studies
Standards for Educational and Psychological Testing (AERA, APA, and NCME, 1999) specify expectations that testing programs should follow to support intended uses of test scores.
Policies require valid data to inform decision-making processes.
2. Whether student achievement levels are reasonable, valid, reliable, and informative to the public.
2. How consistent are procedures for setting NAEP achievement levels with professional testing standards?
4. How accessible and understandable are NAEP reports and results to stakeholders
Lifecycle audit Achievement
levels studies Utility of NAEP
reports studies
Achievement levels translate policy definitions into scale scores to add interpretability to the data. Evidence to support validity of these levels is critical.
NAEP data need to be communicated in ways that are meaningful for stakeholders.
3. Whether NAEP is being administered as a random sample and is reporting trends in a valid and reliable manner.
1. How consistent are NAEP’s procedures with professional practice and testing standards?
3. How valid are state comparisons using NAEP?
Lifecycle audit Score equity
assessment studies
Defining populations and participation rates can influence score interpretations.
Fairness of score interpretations for subgroups (e.g., states) across time impacts policy decisions.
4. Whether any test questions are biased, and whether the assessments are measuring reading and mathematics ability.
1. How consistent are NAEP’s procedures with professional testing standards?
3. How valid are state comparisons using NAEP?
Lifecycle audit Review of
alignment methodologies
Score equity assessment studies
Fairness of score interpretations for subgroups (e.g., states, gender, ethnicity) impacts policy decisions.
Comparability of what is expected or measured by NAEP versus states impacts score interpretations.

Chapter 2: Our Approach to the Evaluation
Standards for Educational and Psychological Testing
When evaluating a testing program, the first step is to ask, “What are the intended and unintended uses and interpretations of the testing program?” Our approach to the evaluation was based on the Standards for Educational and Psychological Testing (AERA, APA and NCME, 199915), that state:
‘Validity refers to the degree to which evidence and theory support the interpretations of test scores entailed by proposed uses of tests. Validity, therefore, is the most fundamental consideration in developing and evaluating tests.’ (p. 9)
and
‘Validation logically begins with an explicit statement of the proposed interpretation of test scores, along with a rationale for the relevance of the interpretation to the proposed use.’ (p. 9)
Validity is evaluated by starting with a coherent argument marshalling the theory and evidence for a proposed use or interpretation. Underlying the validity argument are the sources of available theory and evidence for making the argument. These sources are collected and prioritized in the context of each proposed use and interpretation.
A testing program such as NAEP that expands and evolves over time has a need for systematically revisiting the validity arguments supporting its uses and interpretations, including both the current theory and evidence. A strategy for organizing these efforts is a validity framework.
A validity framework is an organizing tool that guides collection and prioritization of the theory and evidence
15 The Standards are in the process of a revision to the current version. Although no timetable is set for the next iteration, these have historically been produced when the field believes a revision is needed. Previous versions that defined professional expectations for educational testing over the course of the NAEP’s existence were produced in 1955, 1974, and 1985.
38

l E v a l u a t i o n o f N A E P F i n a l R e p o r t l
needed to evaluate the proposed uses and interpretations of a test. This framework includes those unintended uses and interpretations that can be reasonably expected. It encompasses a logical argument for a valid use or interpretation based on theory as well as the evidence supporting that argument. This evidence may be procedural (e.g., test question development and review procedures, conditions of test administration) or empirical (e.g., reliability coefficients, relationships with external criteria). A program of validation research is a core element of a validity framework.
NAEP has not developed and maintained an articulated validity framework ensuring that current theory and evidence continue to support the proposed uses and interpretations of its test scores.
It is important to emphasize two concepts here. First, validity is a matter of degree, not something that a test has or does not have. Rather, validity is evaluated relative to the interpretations made of the test scores and the strength of the evidence to support that interpretation. Second, no test is valid for all purposes. For example, a classroom teacher’s unit test about systems of equations cannot provide state- or national-level information about students’ achievement. Likewise, NAEP scores have limited utility for educators who want to adjust their instructional strategies in their classroom during the semester. In conducting this evaluation we wanted to focus on the types and quality of evidence that supported the defined, intended uses and interpretation of NAEP scores. We discuss this concept further in our findings.
The Standards are organized to provide guidance to test developers, test takers, and test users about the fundamental components of educational and psychological testing. Chapters in the Standards describe expectations for topic areas including Validity; Reliability and Errors of Measurement; Test Development and Revision; Scales, Norms, and Score Comparability; Test Administration, Scoring, and Reporting; Supporting Documentation for Tests; Fairness in Testing and Test Use; Rights and Responsibilities of Test Takers; Testing Individuals of Diverse Linguistic Backgrounds; Testing Individuals with Disabilities; Responsibilities of Test Users; and Educational Testing and Assessment.
39

Because the Standards are inclusive of educational and psychological tests, all standards do not apply to all testing programs. However, at their core is a set of expectations that can be applied to any testing program.
Challenges of the Evaluation
Several factors limited the comprehensiveness of the evaluation design. Given the size of the NAEP program, our greatest limitations were constraints in time and funding. As mentioned above, our findings and recommendations were limited by the availability of information obtained during the evaluation. If one were conducting a financial audit, the quality of the evidence in documented records of the company would impact an auditor’s ability to draw strong conclusions. The same holds true for testing programs. A key source of validity evidence for testing programs is the documentation provided in a program’s technical manual. Typically, this manual documents the qualifications of the individuals responsible for the process, the actual processes and procedures, the results of these processes, and the subsequent actions taken. Current, published technical manuals documenting the program were not available during this evaluation. This omission required the collection of information from previous technical manuals and reports, published professional literature, draft Web-based documentation, and interviews with key personnel responsible for NAEP.
Evaluating any testing program begins with a clear definition of the intended uses and interpretations of the scores (Standards, 1999). Because the current purposes of NAEP are broadly defined, evaluating validity evidence for the range of possible uses would have quickly become an overwhelming task. Therefore, after input from the Technical Working Group (TWG) and stakeholders, we limited the focus of this evaluation primarily to Main and State NAEP in Reading and Mathematics. These have undergone changes and received greater scrutiny since 2002 in response to additional demands placed on the program as a result of NCLB. Even within this narrowed scope, there were proposed studies that could not be included due to prioritization and funding constraints. Some of the proposed studies targeted users’ familiarity
40

l E v a l u a t i o n o f N A E P F i n a l R e p o r t l
and understanding of NAEP; alignment of NAEP with state content standards and assessments; and an in-depth study of sampling.
These delimitations were also influenced by discussions about potential uses of NAEP in the reauthorization of NCLB. If Congress expresses an interest in establishing a stronger connection between a revision of NCLB and NAEP, the findings from this evaluation will be informative for these discussions. This targeted evaluation design required prioritization of some evaluation studies over other parts of the NAEP program that may also warrant review. For example, studies that evaluated NAEP’s 12th-Grade Assessment, the Trial Urban District Assessment (TUDA), Educators’ Understanding and Use of NAEP, or the Utility of Background Questions may also be of interest to policymakers and could be considered in future studies or evaluations.
Evaluation Procedure
Understanding the NAEP Consortium
It is necessary to briefly describe how NAEP is organized for readers to better understand the complex organizational structure that is unique to this testing program. NAEP is an integrated system of policy and operations that comprise multiple agencies and contractors. Brief descriptions of each of these organizations and their responsibilities are described in Table 2.
41
Although contracted organizations responsible for NAEP activities change over time, the core activities of the program remain constant.

Table 2. Organizations within the NAEP Consortium and their roles and functions
Organization Role and Function
National Assessment Governing Board (NAGB)
This independent federal body is appointed by the secretary of education to set policy for the NAEP program. NAGB is responsible for the development of the assessment frameworks, approval of all questions included in an assessment, creation of the achievement level descriptions, setting achievement level standards, and disseminating the initial release of NAEP results.
National Center for Education Statistics (NCES)
This agency is a division of the Institute of Education Sciences (IES) in the U.S. Department of Education, implements the policies articulated by NAGB and is responsible for the full production and administration of NAEP. NCES is also responsible for the contractual relationships with the members of the NAEP Alliance and additional contractors (e.g., Hager Sharp, HumRRO, NESSI), and reviews and releases all technical reports generated by members of the NAEP Alliance.
NAEP Alliance This a term used to describe the organization of contractors selected by NCES whose responsibilities include the development of the test and background questions, creating the assessments, administering and scoring of the assessments, scoring, data analyses, and disseminating results.
Educational Testing Service (ETS)
This Princeton, N.J., organization provides a range of test development, research, and support services in education, admissions, and credentialing; and coordinates the NAEP Alliance contractors, develops test questions for some content areas, creates scale scores, conducts data analyses, and prepares reports of the results.
American Institutes for Research (AIR)
This Washington, D.C. (AIR-DC), and Palo Alto, Calif. (AIR-CA), organization’s offices provide research in education, human development, and health and serve different roles in NAEP. Their D.C. office develops test items or questions for some content areas as well as background questions; their California office conducts state analyses and coordinates the NAEP Validity Studies Panel.
Continues next page
42

l E v a l u a t i o n o f N A E P F i n a l R e p o r t l
Table 2. Organizations within the NAEP Consortium and their roles and functions (Continued)
Organization Role and Function
NAEP-Educational Statistics Services Institute (NESSI)
A part of American Institutes for Research, NESSI, formerly known as ESSI, provides technical support services (e.g., item review, report review) for operational components of NAEP.
Pearson Educational Measurement (PEM)
This Iowa City, Iowa, organization is a division of a multinational company that publishes books, develops testing programs, and offers test scoring services. PEM prepares NAEP test booklets for administration, ships test booklets to administration sites, and monitors inventory control of all assessment materials; scores constructed response items; and prepares score records and database for transmittal to ETS for creating scale scores.
ACT, Inc. This Iowa City, Iowa, organization develops tests and conducts research for a range of admissions, placement, and workforce development programs. One of their tasks within NAEP, under subcontract with NAGB, has been to conduct the standard-setting process for achievement levels. These studies were accomplished for the 12th-grade mathematics assessment in this contract period. ACT is also one of the organizations awarded a contract with NAGB to develop assessment frameworks.
Westat This Rockville, Md., organization specializes in sampling, surveys, and research methodology, develops the sampling plan for the administration of NAEP and oversees the administrations in the field. Westat also provides a support system for the network of NAEP state coordinators.
Government Micro Resources, Inc. (GMRI)
This Manassas, Va., organization provides information technology solutions and services for a range of government agencies and supports the communication systems for members of the Alliance, including creating and maintaining an information sharing Web site for the Alliance. GMRI also provides technology solutions for the Web-based reports, releases, and tools. The company was acquired in October 2006 by PC Mall Gov.
Continues next page
43

Table 2. Organizations within the NAEP Consortium and their roles and functions (Continued)
Organization Role and Function
Hager Sharp This Washington, D.C., organization specializes in communications for education, government, health, and safety organizations. They serve as an external contractor to NCES to support and enhance the messaging and imaging of the NAEP program.
Human Resources Research Organization (HumRRO)
This Alexandria, Va., organization provides diverse research and evaluation services in education, credentialing, and employment; and serves as an external contractor to NCES to assist with quality control across the NAEP Alliance.
NAEP State Coordinators
These individuals are hired and paid by each state’s Department of Education to assist with recruitment and administration of NAEP within states and provide guidance to their constituencies on the interpretation and use of NAEP results. These states then contract with NCES to receive funds that pay for the positions and training.
Figure 1 illustrates how the organizations’ different roles currently form the path to a NAEP score. Although the contractors may change depending on the procurement process, the activities for development of NAEP assessments remain relatively stable.
44
l E v a l u a t i o n o f N A E P F i n a l R e p o r t l
45
Figu
re 1
. The
Pat
h to
a N
AEP
Sco
re
Figu
re 1
. The
Pat
h to
a N
AEP
Sco
re

The path shown in Figure 1 is a simplistic illustration of how the NAEP program develops their assessments, collects data, scores, and reports results of students’ achievement and progress. Descriptions of each study in the evaluation are included here.
An audit of the NAEP assessment lifecycle
This study served as an organizing framework for the evaluation. Its purpose was to evaluate the breadth of NAEP’s test development, administration, scoring, reporting, and maintenance processes by applying the professionally adopted standards of practice (i.e. Standards for Educational and Psychological Testing; AERA, APA, and NCME, 1999). The lifecycle audit included a review of documented processes and results from the organizations responsible for NAEP. To supplement the document review, we collected additional information through interviews with key personnel during site visits to these organizations. This approach is more fully described in Buckendahl and Plake, (2006). Elements of the audit responded to each of the four congressional questions.
We used the Standards to develop a series of review dimensions that follow the Path to a NAEP Score illustrated in Figure 1. These dimensions represent key steps in the development, maintenance, and improvement of NAEP. Each of the 13 dimensions (in bold italics) is briefly described below and corresponds to the steps illustrated in Figure 1.
We first reviewed the organizational characteristics of the NAEP program including structure, oversight, staffing, communication, and problem resolution.
We also reviewed the defined intended uses and interpretations of NAEP as the Standards identify this as the cornerstone for validity of any assessment score.
46

l E v a l u a t i o n o f N A E P F i n a l R e p o r t l
We then evaluated the policies and procedures used to develop the NAEP frameworks, develop the NAEP test questions and background questions, and the pre-administrative tasks of creating the draft assessments and conducting the field tests.
Several steps about the procedures used to collect data on the NAEP were also reviewed. The construction of the final assessments involves coordination with multiple contractors and relies on communication and cooperation among members of the NAEP Alliance.
After the final exam forms are created, the samples of schools and students are selected; NAEP contractors then work together to administer the assessment. Note that students selected for NAEP do not take the full assessment but rather a sample of the full assessment.
The data from the assessments are then transferred to other NAEP contractors who are responsible for the processes used to score NAEP. The scored data are then used to create the NAEP scales and links and analyze the data. Results from the score equity assessment special topic study also provided relevant information for these activities.
The final NAEP dataset is then prepared for reporting purposes. Because reporting achievement levels has become a central feature of the interpretation of NAEP results, this evaluation included a review of the processes used for setting achievement levels. This dimension also received additional focus in a special topic study that evaluated a new methodology applied to the 2005 12th grade NAEP mathematics assessment and the comparability of international assessments.
After the achievement levels have been set, the final phase of the NAEP process is writing, reviewing, issuing, and disseminating reports and data. Another special topic study evaluated the utility of the NAEP reports in print and Web-based formats for selected stakeholders.
Finally, we examined strategies in the NAEP program for renewing and improving the assessment process through innovations for future assessments.
47

These dimensions reflect many of the key components inherent in developing, maintaining, and improving any assessment program.
Special topics investigated
Although the evaluation was organized around the lifecycle audit to provide feedback on the breadth of the program, topics that warranted greater depth of analysis were also investigated. Brief descriptions of each of these special topics included in the evaluation design are provided here. However, full reports for each of these special topic studies are available on the CD accompanying this report.
Achievement levels studiesThese studies evaluated two areas of interest with respect to achievement levels. Achievement levels are policy definitions that are transformed into cut scores on NAEP score scales to classify students’ performance into descriptive categories. NAEP has developed definitions for Basic, Proficient, and Advanced levels of performance. In the first study, we evaluated the application of a new methodology for setting achievement levels on the 2005 Grade 12 NAEP Mathematics assessment. For the second study, we evaluated evidence from two international assessments to examine the utility of these external, national measures of achievement in the context of NAEP’s achievement levels.
Utility of NAEP’s printed and Web-based reports studiesThese studies evaluated how stakeholders used and interpreted NAEP results and achievement levels presented in printed and Web-based formats. This area of evaluation represents a unique emphasis compared to previous evaluations and is of particular interest given NAEP’s increased visibility. Data collection for these evaluation activities included interviews, focus groups, analyses of Web usage data, and studies of how appropriately consumers of NAEP results interpreted them.
Score equity assessment studiesThese studies addressed an important issue of fairness by evaluating whether methods to calculate NAEP scale scores produce comparable score scales across states. NAEP scale scores are estimates of group performance (e.g., nation,
48

l E v a l u a t i o n o f N A E P F i n a l R e p o r t l
state, gender, ethnicity) based on students’ responses to test questions. There are multiple steps involved in the process of estimating scale scores. Therefore, it was important to independently replicate these processes for selected states. After doing these state-specific replications, we compared the item statistics and achievement level results across the national and state-specific results. These studies evaluated the fairness of estimated NAEP results for all sampled students, regardless of the state in which they attended school.
Review of alignment methodologiesThis study reviewed alignment methodologies currently used by most states. Alignment generally refers to the degree of overlap among content standards, curriculum, instruction, and assessments. As a primary source of validity evidence in contemporary educational assessment programs, alignment studies also represent a critical policy consideration when interpreting and using scores. This review provides some context for policymakers as they consider potential uses and interpretations of NAEP results.
Technical Work Group
To assist in the evaluation, we convened a Technical Work Group (TWG) comprised of 14 nationally and internationally known experts from state assessment, higher education, and research organizations. TWG members operated independently of the U.S. Department of Education (ED) to provide feedback on draft reports and evaluation activities. These individuals offered expertise in psychometrics, sampling, statistics, educational research, evaluation, testing special populations, and educational policy. The group met five times during the three-year evaluation to review the work of the evaluation team and provide feedback on its progress. The members of the TWG and their affiliations are included as Appendix C.
49
Chapter 3: Analysis and Findings
How Consistent Are NAEP’s Procedures With Professional Testing Standards?
This initial question served as an underlying theme for the evaluation. We responded to the question primarily through the lifecycle audit study, supplemented by findings from the special topic studies. In this section, we discuss some of the key findings regarding NAEP’s practices. In the last part of this section we provide recommendations for areas that pose the greatest threat to the validity of uses and interpretations of NAEP. For additional detail about strengths and areas of concern, please see the lifecycle audit study report on the CD accompanying this evaluation.
Many of the procedures for developing and maintaining NAEP are consistent with professional testing standards. However, two issues of concern have the potential to threaten the program if they are not addressed.
Strengths of NAEP Procedures
Our review of NAEP’s practices allowed us to explore many aspects of the NAEP program. Except for the few noted areas of concern below, the methods and procedures used for the Main and State NAEP Assessments in Reading and Mathematics were found to be in compliance with the Standards. This compliance was noted throughout the development, implementation, and maintenance of the program. For example,
Processes used to create assessment frameworks are consistent with common approaches to assessment development.
Methods used by Alliance contractors for developing and reviewing the NAEP assessment questions and background questions for content and bias were consistent with the Standards and followed sound measurement practices.
Methods used for field-testing items before operational use were technically sound.
50
Except for a few noted areas of concern, NAEP practices were in compliance with accepted Standards.
l E v a l u a t i o n o f N A E P F i n a l R e p o r t l
An additional strength of the NAEP program is the contractual structure for the NAEP Alliance contractors. Under the new procurement model that began with the 2002 contracts, previous subcontract relationships were replaced by direct contractual relationships with NCES. One characteristic of this contract was the establishment of a coordination role to facilitate activities among NAEP Alliance contractors. A notable feature of these contracts is the use of incentives for the members of the Alliance to meet mutually beneficial goals and timelines. This system facilitates an atmosphere of cooperation as all contractors benefit when the system is working and all lose financial incentives if the system does not meet expected timelines and deliverables.
A related strength is the infrastructure of the Information Management System (IMS), a communication system used among Alliance contractors. This Web-based tool serves as a method for supporting the exchange of ideas. It also facilitates communication among contractors regarding progress, timelines, discussions, and the resolution of problems. This online tool provides a common language and structure for the Alliance when integrating systems from different organizations. The IMS also allows for greater decentralization of key personnel because it was developed as a secure, Web-based technology solution and provides a forum for contractors to discuss issues or problems that may arise.
Although the majority of the processes in the NAEP system were found to be compliant with the Standards, our evaluation of the technical (i.e. psychometric) quality was limited. First, the Standards clearly specify that evaluating evidence of psychometric quality is related to the defined, intended uses and interpretations of the assessment. The intended scope and use of NAEP assessment results are only defined broadly (see below), resulting in confusion and lack of clarity about which uses and interpretations are intended and which are not.
Second, our review of technical criteria was limited by the currency of NAEP technical manuals (e.g., Draft 2003 NAEP Technical Manual) available at the time of the audit study within the evaluation. Some of our conclusions were based on assumptions drawn from dated documentation of the NAEP assessment program.
51
Notably absent were clearly defined intended uses and interpretations of NAEP and current NAEP technical manuals.

Issues of Concern
An organized program of validity research based on clearly defined, intended uses and interpretations of NAEP is not evident in the program.
Through our synthesis of findings from the evaluation studies, a common question emerged, “What are the intended and unintended uses and interpretations of NAEP?” As described above, our approach to the evaluation was based on the Standards for Educational and Psychological Testing (AERA, APA and NCME, 1999). Thus, we searched for a clear description of intended uses and interpretations of NAEP as a starting point to evaluate the types and quality of validity evidence for the testing program.
Validity is evaluated by starting with a coherent argument marshalling the theory and evidence for a proposed use or interpretation. Underlying the validity argument are the sources of available theory and evidence for making the argument. These sources are collected and prioritized in the context of each proposed use and interpretation.
A testing program such as NAEP that expands and evolves over time has a need for systematically revisiting the validity arguments supporting its uses and interpretations, including both the current theory and evidence. A strategy for organizing these efforts is a validity framework.
A validity framework is an organizing tool that guides collection and prioritization of the theory and evidence needed to evaluate the proposed uses and interpretations of a test. This framework includes those unintended uses and interpretations that can be reasonably expected. It encompasses a logical argument for a valid use or interpretation based on theory as well as the evidence supporting that argument. This evidence may be procedural (e.g., test question development and review procedures, conditions of test administration) or empirical (e.g., reliability coefficients, relationships with external criteria). A program of validation research is a core element of a validity framework.
52

l E v a l u a t i o n o f N A E P F i n a l R e p o r t l
NAEP has not developed and maintained an articulated validity framework ensuring that current theory and evidence continue to support the proposed uses and interpretations of its test scores.
As noted earlier, the original design of NAEP reporting and interpreting results were focused on students’ performance on particular assessment tasks at a given age or grade level. In the early 1980s, the focus shifted to overall performance on content domains specified by the assessment frameworks, with student performance described by scores on a scale. The results reported in the NAEP report cards were then interpreted in terms of overall performance of a representative sample of students in a particular content area (e.g., mathematics, reading, geography) at a particular grade level in a particular year. This was not the only interpretation, but given the role of NAEP as the “Nation’s Report Card”, it was a core interpretation.
A second major component of the interpretation of NAEP results has been the analysis of trends in performance. Although many testing programs are designed to answer questions about individual examinees at some stage of their education, NAEP is designed to answer questions about populations of students (and subpopulations defined by various variables), and the changes in performance in these populations over time. Because it is a unique and complex testing program, it requires a tailor-made, multifaceted validity framework (Zumbo, 2007).
For the sake of illustration, some of the assumptions inherent in these core interpretations of NAEP performance are outlined here.
The NAEP assessment framework for a particular content area and grade level is taken to specify an appropriate content domain for the content area and grade level.
Assessment tasks constitute a representative sample from the domain and are free of substantial sources of irrelevant variability.
The sample of students is assumed to be representative of the target population and to be large enough to provide good estimates of the performance in the population.
53

There are, of course, many additional assumptions built into the core interpretation of NAEP results (e.g., assumptions about participation rates, accommodations, student motivation, administration procedures), and, in particular, the statistical models used to analyze NAEP data employ a host of complicated, statistical assumptions. In developing a comprehensive validity framework, all of the main interpretations inherent in reporting conclusions about performance in various populations would be spelled out and evaluated within the validity framework. Such evidence might include descriptions of 1) how the assessment frameworks were developed and by whom, 2) descriptions of task development and review, 3) field testing data, 4) statistical analyses of sampling plans and implementations, and 5) post-administration analyses.
Many of these specific studies called for in such a framework have been carried out over the years; however, the interpretation and relevance of these studies to the overall validity of NAEP has not been clearly identified and the results from different analyses have not been organized in a way that needed information could be identified and accessed. We recommend that the NAEP program include an evaluation process by which the assumptions articulated by these core interpretations be reviewed to identify any gaps in the necessary evidence. Any gaps should be the basis for future validity research.
The need for a comprehensive validity framework becomes more pressing when we consider newer interpretations and uses of NAEP results. As noted above, NAEP is a unique program for which standard validation frameworks (AERA, et al., 1999; Kane, 2006) are not completely adequate. In addition, the results are now reported mainly in terms of the percentages of students achieving defined achievement levels. This shift introduces new assumptions to be evaluated and also raises questions about more basic assumptions. Two illustrations are:
Is the sample of tasks sufficiently demanding to provide adequate information about advanced performance?
Are state-by state comparisons using NAEP appropriate in the context of the NCLB legislation, given that different states have adopted different content standards?
54

l E v a l u a t i o n o f N A E P F i n a l R e p o r t l
Our analyses did not reveal a process by which these assumptions were evaluated to determine if associated inferences and uses were appropriate. Therefore, there is a need for an ongoing, systematic appraisal of the validity of the interpretations and uses being built on the NAEP assessments. This is especially important during this period when the interpretations and uses may be evolving dramatically. In NAEP, responsibility for evaluating various assumptions and inferences tends to be distributed across multiple organizations and individuals, but it is not clear that any group within the NAEP organization has ongoing responsibility for making sure that common and new interpretations of NAEP data are justified.
Although an organized validity framework is not currently transparent, the NAEP program does have many opportunities in its existing infrastructure to collect evidence when the intended uses and interpretations are clearly defined. The NAEP Validity Studies Panel’s development of an Agenda for NAEP Validity Research (Stancavage, et al., 2002) is one of these examples and could serve as a starting point for developing a comprehensive validity framework.
NAGB and NCES also support research efforts to gather validity evidence for the program. The contractors responsible for developing, administering, and maintaining NAEP also have systems in place to inform and document evidence to support a range of uses of the assessments. Examples of these research efforts are illustrated in Table 3. Although many of these studies were found through NCES-sponsored research programs, NAGB has also independently supported research. Connecting these various programs of research to an organized validity framework would strengthen the NAEP program.
55

Table 3. Selected, Recent NAEP Validity Research
Topic Area Illustrative Research
Developing NAEP Assessment Frameworks
A content comparison of the NAEP and PIRLS fourth-grade reading assessments (NCES, 2003a)
The impact of changes implemented in 2003 NAEP—Study 2 (Jenkins, Qian, Braun, Davis, Laplan, and Pitoniak, 2004)
Developing Test Items (Questions) and Background Questions
Considerations in the use of constructed (open-ended) response items in NAEP (Pitoniak, Bridgeman, Braun, Donoghue, and Kaplan, 2003)
Sampling Schools and Students
The effects of finite sampling on state assessment sample requirements (Chromy, 2003)
Federal sample sizes for confirmation of state tests in the No Child Left Behind Act (Mosquin and Chromy, 2004)
Participation standards for 12th-Grade NAEP (Chromy, 2005)
An evaluation of NAEP state samples (Chromy, Ault, Black, and Mosquin, 2007).
Administering NAEP SD/LEP inclusions/exclusions in NAEP: Research design and instrument development study (proposal, ETS, 2004)
Including special-need students in the NAEP 1998 Reading Assessment Part II (ETS, 2004)
Using state assessment to assign booklets to NAEP students to minimize measurement error: An empirical study in four states (McLaughlin et al., 2005)
Scoring NAEP Using rater effects models in NAEP (Donoghue and McClellan, n.d.)
Creating Scales and Links and Analyzing Data
A study of equating in NAEP (Hedges, and Vevea, 1997)
Using state assessments to impute achievement of students absent from NAEP: An empirical study in four states (McLaughlin, Scarloss, Stancavage, and Blankenship, 2005)
Continues next page
56

l E v a l u a t i o n o f N A E P F i n a l R e p o r t l
Table 3. Selected, Recent NAEP Validity Research (Continued)
Topic Area Illustrative ResearchInterpreting NAEP Scores
Statistical power analysis and empirical results for NAEP combined national and state samples (Qian, 2003)
Writing, Reviewing, and Disseminating Reports and Data
Reporting the results of the National Assessment of Educational Progress (Jaeger, 2003)
Improving NAEP Working group on alternative estimation methodologies: Review of proposed study comparing high dimensional and low dimensional conditioning models (Mazzeo, Donoghue, and Dresher, n.d.)
Marginal estimation in NAEP: Current operational procedures and AM (Mazzeo, Donoghue, and Johnson, 2003)
NAEP quality assurance checks of the 2002 reading assessment results for Delaware (NCES, 2003b)
It is clear from the selected research topics noted in Table 3 that they span the dimensions of the program that we identified in the lifecycle audit. However, we were concerned that a strategy for these research opportunities was neither systematic nor integrated. Because a validity framework for NAEP would likely define multiple intended uses, it is important that the program have opportunities for research that is guided by the validity framework.
The concept of a multifaceted validity framework and the evidence in the program that supports it, serves as an overarching theme for other key findings in the evaluation. These subsequent findings represent different possible components of a validity framework for NAEP and are organized by the evaluation questions. Only consolidated findings are included here. For additional detail on these findings, readers are directed to the full study reports contained on the CD accompanying this report.
57
An overarching theme of the evaluation's findings is the concept of a multifaceted validity framework based on NAEP's intended uses and interpretations.

Defining intended uses and interpretations of NAEP
The Standards for Educational and Psychological Testing (AERA, APA, and NCME, 1999) include specific expectations for test publishers regarding definitions of intended uses and interpretations of test scores. Standard 1.1 indicates that a rationale needs to be presented for each interpretation or use of test scores. Tests are not inherently “valid” or “invalid.” Rather, validity refers to the use of a test for a specific, defined purpose.
The Standards further specify that intended and unintended interpretations and uses of test scores must be clearly articulated (Standards 1.2 and 1.4) to place boundaries on these uses and prevent misinterpretation. No test is a gold standard (i.e., valid) for all purposes for which the results may be used. Because the specific, intended uses of NAEP are not clearly defined, stakeholders may be using NAEP results for purposes that are not supported by validity evidence.
Clarifying intended and unintended uses is a critical first step in developing a validity framework for NAEP by which an organized program of validity research efforts can be prioritized to target those intended uses and interpretations.
Purpose of NAEP: Multiple Perspectives
Because this finding lays the groundwork for the whole of NAEP, we offer some different perspectives on how people within and outside the NAEP Consortium view the intended uses and interpretations of NAEP.
NAGB’s and NCES’s defined purpose of NAEP
NAGB and NCES have consistently reported that the primary purpose of the program is to measure student achievement and change at the national level. These general purposes are found in documents on their respective Web sites:
‘The primary purpose of NAEP is to report to the American public on academic achievement and its change over time.’ (Background Information Framework for the NAEP, http://www.nagb.org/pubs/backinfoframenew.pdf).
58
l E v a l u a t i o n o f N A E P F i n a l R e p o r t l
‘NAEP has two major goals: to measure student achievement in the context of instructional experiences and to track change in achievement of fourth-, eighth-, and twelfth-graders over time in selected content domains.’ (http://nces.ed.gov/nationsreportcard/faq).
As currently defined, these intended purposes are broadly stated without specific guidance or limits regarding its operational definition and scope. Any lack of clarity is then subject to interpretation by policymakers and stakeholders.
Given such ambiguous definitions, there have been additional calls to use NAEP for more specific purposes than these general statements suggest. Such calls for refinement in the defined scope of NAEP are not new. Almost 20 years ago Morganthau (1990) noted that the Trial State Assessment was implemented as a pilot program after reformers called for Congress to change its policy on the release of state results. State NAEP has now become commonplace. Recent efforts to conduct the Trial Urban District Assessment (TUDA)16 suggest that the level of refinement in terms of reporting student achievement has progressed to another level for select districts. Although some flexibility in how the legislation is interpreted may be warranted to allow the program to evolve, the current environment of educational policy requires greater guidance in how NAEP should be interpreted (e.g., Stoneberg, 2007).
Further, a study released by NCES (2007) incorporates the use of school level NAEP data in research analyses of student performance while the NCES Web site claims, “NAEP does not provide scores for individual students or schools.” The statement here is accurate—no scores are provided because the assessment is not designed to sample at the level needed to provide scores for schools or students. However, such information is being used in research that is being released to the media. This can be frustrating and confusing for stakeholders.
The No Child Left Behind Act of 2001 (NCLB) has broadened the calls for more diverse, higher stakes uses of NAEP than were originally intended. Some of these are highlighted here.
16 Additional information about the Trial Urban District Assessment (TUDA) program can be found at http://nces.ed.gov.
59

Calls for NCLB-related uses of NAEP
‘There is no reason that 50 states should have 50 different definitions of proficiency. The reading and math skills required to flourish economically and participate politically across the United States are increasingly the same.’—Robert Gordon (Center for American Progress; Olson and Hoff, 2005).
‘The law thus views NAEP as an independent measure of a state’s success in meeting NCLB’s goals. . .because state tests and standards vary widely, NAEP will provide a national benchmark so the public can see how students in their state do on their state test compared to NAEP.’ —National Education Association (n.d., ¶ 3)
‘The National Assessment of Educational Progress (NAEP), which is administered in every state, should become an official benchmark for evaluating states’ standards.’ — Jeb Bush, then governor of Florida and member of the National Assessment Governing Board, and Michael Bloomberg, mayor of New York City, Washington Post (2006, ¶ 4).
Such calls signify an increase in the stakes associated with NAEP results. NAEP has sponsored research to respond to such calls for evaluating how state definitions of proficiency compare to those used by NAEP (e.g., Braun and Qian, 2007; Bandeira de Mello, Crowley, Madsen, McLaughlin, and William, 2008; NAGB, 2001). However, efforts to compare state-level and NAEP achievement levels also communicate a perception that states’ achievement level definitions and actual achievement should be comparable to NAEP.
Although this research uses NAEP as a common measure to compare state expectations, NAEP was not originally designed for this purpose; therefore, these comparisons may not be appropriate.
The education research community has historically and again recently, cautioned against these types of comparisons as they are based on the assumption that the tests (e.g., state NCLB tests and NAEP) measure the same content domain. For example, the first issue of the Journal of Educational Measurement (1964) published prior to NAEP’s existence devoted four articles to the topic of
60

l E v a l u a t i o n o f N A E P F i n a l R e p o r t l
interpreting scores of tests that are not designed to measure the same thing (i.e. parallel). The cautions of Angoff (1964), Flanagan (1964), Lennon (1964) and Lindquist (1964) remain valid.
Linn (2005; 1993) also reminds us that such attempts to link state data to NAEP data are not new or unique to the current federal education policy of NCLB. In research that evaluated the interpretation of state-NAEP achievement level mapping, Ho and Haertel (2007a; 2007b) cautioned against the overinterpretations of NAEP data that were encouraged by these types of analyses and presentations of data.
However, the increased desire for accountability and a desire to compare state results have surpassed an adherence to these long-standing principles of good practice in testing.
Beyond intuitive calls for using NAEP as a common metric, other stakeholders already consider NAEP results as appropriate evidence of the effects of NCLB on educational attainment (e.g., Finn, Julian, and Petrilli, 2006). However, without evidence to support the appropriateness of these comparative or causal interpretations, these conclusions should be viewed critically.
Using NAEP as NCLB Evaluation Evidence
‘The No Child Left Behind Act is working across the country….Fourth graders are reading better. They’ve made more progress in five years than the previous 28 years combined….In math, 9-year-olds and 13-year-olds earned the highest scores in the history of the test.’ —George W. Bush (March 2, 2007).
‘NAEP results show NCLB is contributing to progress in education’ —George W. Bush (July 14, 2005, ¶ 3).
‘Standards and accountability are working. According to the National Assessment of Educational Progress (NAEP), the achievement of young students has risen since 2002. In 2005, American’s fourth graders post the best reading and math scores in the test’s history’ —George W. Bush (Jan. 9, 2006, ¶ 7).
61
Such interpretations of NAEP data have been appropriately criticized by researchers who point to the gains in NAEP test scores that were occurring prior to the onset of the NCLB program (e.g., Hoff and Manzo, 2007).
Peggy Carr, associate commissioner, NCES, also noted that the NAEP program is not designed to address such purposes:
“NAEP data [are] of particular use to policymakers, because it provides reliable information about students’ achievement—indicating whether or not we are meeting our educational goals. As a large-scale assessment survey, however, it is not designed to answer causal questions—or explain why results look the way they do” —Peggy Carr (2005, ¶ 6).
Validity evidence to support these various purposes is necessary before any claims can be made about possible causes of NAEP results and before extending the uses of NAEP results to serve as a benchmark for other programs. In their evaluation of NAEP to state assessment mapping research, Ho and Haertel (2007b) remind us that multiple methods exist for evaluating the match in content and cognitive complexity (two dimensions of alignment) between two tests. They propose this is necessary information to have prior to linking scores between two tests or comparing the percentage of examinees deemed “proficient.”
Validity evidence can be found through multiple sources: judgmental and empirical. Judgmental sources may include recommendations from advisory committees, consensus decisions by representative panels of subject matter experts, or position papers from individuals or organizations. Empirical sources of validity may include results from a variety of statistical analyses. However, no single source can support the validity of a test score’s use or interpretation.
Including information from varied sources illustrates that there are often no absolute rules for acceptability of procedures or results. Expert judgment is necessary to consider the context of multiple interpretations of scores in combination with the other available judgmental and empirical evidence, and then to appropriately weight evidence in the decision-making process. Because NAEP is
62

l E v a l u a t i o n o f N A E P F i n a l R e p o r t l
considered by many to offer the most comprehensive analysis of the condition of education in the United States, it is imperative that the information provided by the program support its intended purposes, particularly if these intended uses and interpretations have expanded beyond historical purposes.
NAEP does not release technical manuals in a timely manner.
Similar to the financial records a company provides for an independent audit, a technical manual serves to document the procedures, results, and decisions that are the basis of a testing program. Having this information available enables users to evaluate the processes used to produce the results and is an important component of the program. A technical manual serves a number of purposes for a testing program, particularly one as complex as NAEP. Specifically, a technical manual provides:
Documentation of the procedures and results that are part of the development and maintenance of the testing program. This evidence allows users to evaluate the credibility and the usability of the results.
Knowledge transfer of procedures and activities for those who may not be intimately familiar with the program. This evidence can train and inform.
A record of judgmental and empirical decisions that influenced the direction of the program. These records can also be used to assist with problem resolution.
Greater transparency of the program’s activities for external scrutiny.
The Standards expect testing programs to provide timely technical documentation about the program (e.g., test manuals, technical manuals, users’ guides, and supplemental material) to prospective test users and other qualified persons at the time a test is published or released for use (Standard 6.1). This documentation should include the rationale for the test, recommended uses, supporting evidence for such uses, and information that assists in score interpretations (Standard 6.3). Furthermore, when misuses of a test can be reasonably anticipated, cautions against such misuses should be specified. The current timeline for
63

the release of NAEP technical documentation is often years after the results have been released. This delay exceeds what a program should tolerate, and is in violation of the Standards.
For example, the 1999 Long Term Trend technical manual was released in 2005. Released versions of the more recent studies were not available during the data collection phase of this evaluation, making it difficult to comment on the quality of processes. Another illustration can be seen in the release of the 2005 NAEP 12th-Grade Reading and Mathematics assessment results that did not occur until Feb. 22, 2007. Technical manuals for these studies were not released during the data collection phase of this evaluation.
This delay exceeds what a testing program should tolerate and is out of compliance with the Standards. Other large-scale testing programs release technical manuals closer to the time when results are released. For example, the technical report from the 2003 Trends in International Mathematics and Science Study (TIMSS) was published the following year (Martin, Mullis, and Chrostowski, 2004). Factors that may contribute to this delay include such things as a six-month reporting timeline for select NAEP assessments, efforts to transition to online versions of this documentation, and prioritization of other reports and operational activities.
However, it would be inaccurate to suggest that NAEP has not released any reports during the course of this evaluation. Table 4 illustrates some of the results and technical reports that have been released during the course of this evaluation.
64
Currently, release of NAEP technical documentation can be years after results have been released, exceeding what testing programs should tolerate.

l E v a l u a t i o n o f N A E P F i n a l R e p o r t l
Table 4. Selected NAEP results and technical reports disseminated November 2004–June 2007
Date Type Title2004 ResultsNov. Trends in Educational Equity of Girls and Women: 2004Dec. America's Charter Schools: Results From the NAEP 2003 Pilot
Study2005 ResultsJuly NAEP 2004 Trends in Academic Progress Three Decades of
Student Performance in Reading and MathematicsAug. Online Assessment in Mathematics and Writing: Reports From
the NAEP Technology-Based Assessment Project, Research and Development Series
Sept. The Nation’s Report Card: Mathematics 2003Sept. The Nation’s Report Card: Reading 2003Oct. The Nation’s Report Card: Mathematics 2005Oct. Fourth-Grade Students Reading Aloud: NAEP 2002 Special
Study of Oral ReadingOct. NAEP Reading 2005 State Snapshot ReportsOct. The Nation's Report Card: Reading 2005Oct. NAEP Mathematics 2005 State Snapshot ReportsDec. The Nation's Report Card: Trial Urban District Reading 2005
Snapshot ReportsDec. Student Achievement in Private Schools: Results from NAEP
2000–2005Dec. The Nation's Report Card: Trial Urban District Mathematics
2005 Snapshot Reports2005 Technical or
Informational
Jan. The Nation's Report Card: An Introduction to The National Assessment of Educational Progress
Feb. Education Statistics Quarterly—Vol. 6 Issues 1 and 2Apr. NAEP 1999 Long-Term Trend Technical Analysis Report:
Three Decades of Student PerformanceAug. 2000 NAEP—1999 TIMSS Linking ReportAug. The 2000 High School Transcript Study User's Guide and
Technical ReportContinues next page
65

Table 4. Selected NAEP results and technical reports disseminated November 2004–June 2007 (Continued)
Date Type Title2006 ResultsMay National Indian Education Study: Part I: The Performance of
American Indian and Alaska Native Fourth- and Eighth-Grade Students on NAEP 2005 Reading and Mathematics Assessments
May The Nation’s Report Card: Science 2005May NAEP Science 2005 State Snapshot ReportsJune The Nation's Report Card: Trial Urban District Assessment,
2005 Mathematics Report CardJune The Nation's Report Card: Trial Urban District Assessment,
2005 Reading Report CardJuly Comparing Private Schools and Public Schools Using
Hierarchical Linear ModelingAug. A Closer Look at Charter Schools Using Hierarchical Linear
ModelingOct. National Indian Education Study: Part II: The Educational
Experiences of Fourth- and Eighth-Grade American Indian and Alaska Native Students
Nov. The Nation's Report Card: Science 2005 Trial Urban District Assessment
2006 Technical or Informational
Apr. Comparing Science Content in the NAEP 2000 and TIMSS 2003 Assessments
May NCES Studies on American Indian and Alaska Native Education
May Comparing Mathematics Content in the NAEP, TIMSS, and PISA 2003 Assessments
2007 Results [through June]
Feb. The Nation's Report Card: 12th-Grade Reading and Mathematics 2005
Feb. America’s High School Graduates: Results from the 2005 NAEP High School Transcript Study
Mar. The Nation's Report Card: Mathematics 2003 and 2005 Performance in Puerto Rico—Highlights
Mar. The Nation's Report Card: Mathematics 2005 Performance in Puerto Rico—Focus on the Content
Continues next page
66

l E v a l u a t i o n o f N A E P F i n a l R e p o r t l
Table 4. Selected NAEP results and technical reports disseminated November 2004–June 2007 (Continued)
Date Type Title2007 Technical or
InformationMay Findings from the Condition of Education 2007: High School
CoursetakingJune Mapping 2005 State Proficiency Standards Onto the NAEP
Scales
SOURCE: National Center for Education Statistics
In Table 4 it is apparent that there were a number of technical reports and results released during the past three years. The efforts to produce and disseminate these reports focusing on results are commendable. However, the current review process for technical manuals that document the processes on which these reports are based represents a missed opportunity to share high-quality, technically and factually accurate information about the NAEP program.
Although factors noted above have contributed to the delay, even prior to the six-month reporting requirements, NAEP technical manuals have often not been publicly released for five or more years after results have been disseminated. Clearly, the process for releasing technical documentation must be revised to bring NAEP up to professional standards in these areas. This is necessary to communicate the characteristics of the program but also to provide a model of excellence for other large scale testing programs. This is particularly important when state assessment programs are required to provide technical documentation for NCLB’s Peer Review process. Additional factors, however, have also contributed to some of the observed delays in the review process.
For example, the current staffing capacity in the Assessment Division of NCES may not be able to sustain continued growth in the program. NAEP relies on a series of interactions among the organizations responsible for policy, development, administration, and dissemination of NAEP results (see Figure 1). NCES’s Assessment Division plays a number of roles in the operations of the lifecycle
67

including overseeing approximately 1,30017 permanent and temporary full-time equivalent employees working for NAEP contractors. These contractors include those in the NAEP Alliance but also contractors that provide other support services (e.g., AIR-CA, Hager Sharp, HumRRO, NESSI).
However, the Assessment Division of NCES has only 20 full-time employees. This represents a small staff when compared with other divisions within NCES that have similar budgets, but 80 or more full-time employees. The limited staff of the Assessment Division at NCES compromises their organizational capacity to respond to the needs of the NAEP program and represents another potential threat to validity. Because staff members need to have specialized skills in testing to oversee the work of contractors, increasing the number of additional, qualified staff members will be a challenge. Although this has been an issue faced by the educational testing community for many years, the additional testing requirements of NCLB in states has added to a shortage of professionals trained in educational measurement.
Shortage of Testing Experts
David Herszenhorn in a New York Times article noted, “The [testing] experts are needed in virtually every aspect of developing, administering and scoring exams, from deciding what test will best measure certain skills to drawing up questions and answer sheets. Doctoral programs are producing at most 50 graduates a year in the field.”—David Herszenhorn (May 5, 2006, ¶ 5).
Similarly, Thomas Toch conducted a review of the testing industry in light of changes brought about by the No Child Left Behind legislation. He indicated:
“The surge in state testing under NCLB has created a severe shortage of the specialists who do the analyses of how test items perform in field trials and other heavy statistical lifting in test-making. Though the work of these experts, who are trained in measurement theory and statistics and are known as psychometricians, is crucial to creating high-quality tests, only a handful of them enter the workforce each year. . . .”—Thomas Toch (January 31, 2006, p. 9)
17 Personnel estimates provided by NCES as of March 22, 2006.
68

l E v a l u a t i o n o f N A E P F i n a l R e p o r t l
Some of the challenges faced by NAEP are related to the availability of additional, qualified staff and resources to monitor contractors and the activities that have evolved beyond NAEP’s historical role.
Recommendations
From our assessment of findings from the first evaluation question, we have identified the following recommendations.
Recommendation 1: Develop an organized validity framework that includes a clear definition of the intended uses and interpretations of NAEP scores.
Our primary recommendation from the evaluation is a fundamental need for all testing programs. The Standards clearly specify that a rationale and supporting research and documentation should be provided for each intended use and interpretation of a test’s scores. Because NAEP is used by a range of stakeholders, defining intended uses and the development of a validity framework is a responsibility shared by the agencies that oversee NAEP. By developing a validity framework with defined intended uses and interpretations, validation efforts can be guided by a common plan to support those uses and actively discourage unintended or inappropriate uses. Each of the findings and recommendations described in this report are connected to this primary recommendation that NAEP develop a validity framework.
Recommendation 2: Revise review processes for NAEP technical reports and manuals that facilitate their timely release.
Communicating results without documentation of the processes that led to those results does not allow readers to evaluate the credibility and limitations of those results. According to the Standards, it is the responsibility of the testing program to provide documentation of the technical quality of the results at the time scores are released. This is a rigorous expectation of quality that NAEP is not currently meeting. As described above, there are a number of reasons why releasing technical documentation is important. For NAEP, providing this information in a timely manner greatly increases the transparency of the testing program and assists users in understanding the appropriate uses of scores as defined in the validity framework.
69
There are several reasons for releasing timely technical documentation: primarily, it assists users in understanding appropriate uses and limitations of NAEP scores.

How Consistent Are Procedures for Setting NAEP Achievement Levels With Professional Testing Standards?
Currently, a primary method for reporting NAEP results is the use of achievement level categories. NAGB defines three achievement levels: Basic, Proficient, and Advanced. Student achievement, however, is reported at four levels Below Basic, Basic, Proficient, and Advanced. Results reported as achievement levels are readily accessed and appreciated by consumers of NAEP data. However, the topic of setting achievement levels on NAEP is controversial and has spurred ongoing professional debate about the processes, interpretation, and validity evidence.
The process of setting achievement levels on NAEP has been criticized in previous evaluations (e.g., Shepard, Glaser, Linn, and Bohrnstedt, 1993; U.S. General Accounting Office, 1993; Pellegrino, Jones and Mitchell, 1999) and defended (e.g., Cizek, 1993; Kane, 1993; Hambleton et al. 2000; Reckase, 2000; Loomis and Bourque, 2001; Bourque, 2004). In this evaluation, we reviewed a new method that was used to inform the process of setting achievement levels on the 2005 Grade 12 NAEP Math assessment. In addition, we reviewed evidence from international assessments to evaluate their utility as external sources to inform the achievement level setting process.
Many of the procedures for setting achievement levels for NAEP are consistent with professional testing standards. However, there is a notable exception regarding external evidence to inform the policy decision.
Strengths of NAEP Achievement Levels
As a policy decision, achievement levels can be set with consideration of multiple factors that inform the final decision. In education, a primary source of evidence comes from studies that involve educators’ judgments about students’ performance based on a policy definition. Although the decisions are based on a structured, deliberate process, these studies are inherently judgmental in nature. Further, they include an element of value in yielding a recommendation from the panel for what is “good enough” to represent performance at a given achievement level
70
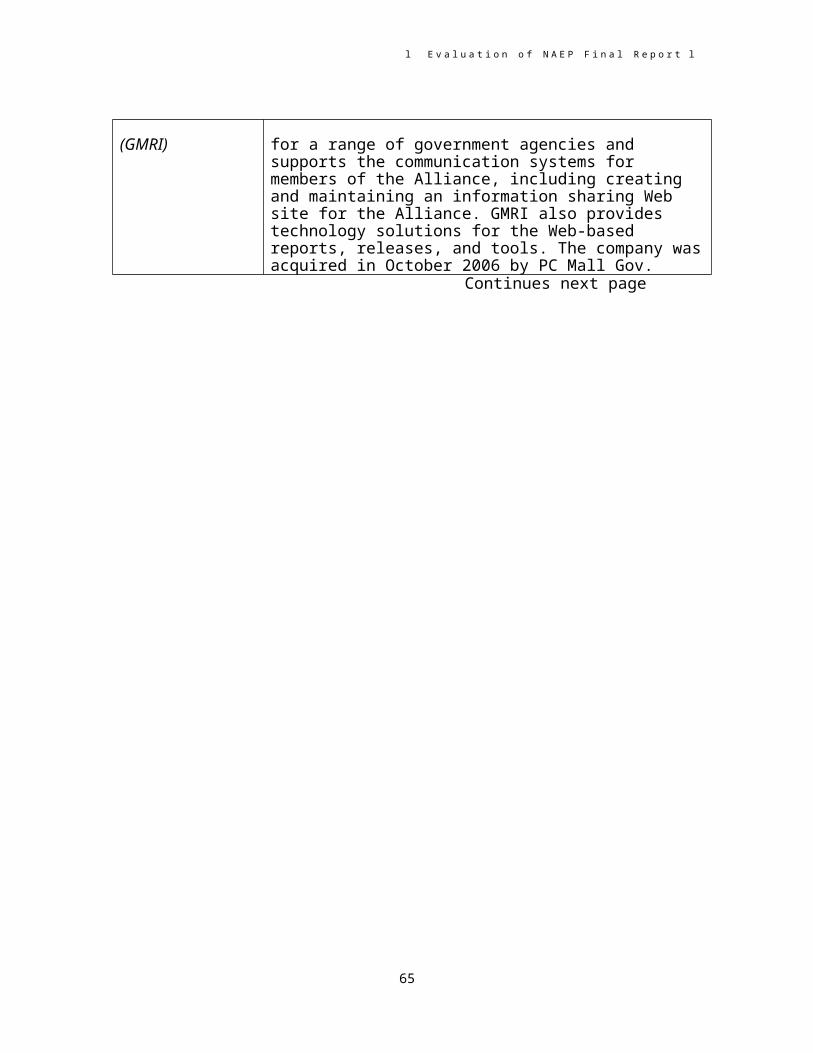
l E v a l u a t i o n o f N A E P F i n a l R e p o r t l
(Hambleton and Pitoniak, 2006). Therefore, reasonableness is a matter of perspective and relative to the purpose for which the achievement levels are set.
Because NCES is charged with certifying achievement levels, yet has been critical of their use and continues to call them “developmental,” there is residual tension between NAGB and NCES concerning their establishment. This has led to confusion among stakeholders and uneven use of the achievement level terminology. Some of this confusion rests in the ambiguity about the intended uses of NAEP’s achievement levels relative to other types of achievement levels with which stakeholders may be familiar. Defining the purpose of NAEP’s achievement levels is part of the validity framework that serves as an overarching guide for the program. However, another challenge to the use of achievement levels is that there are no “true” cut scores.
The use of achievement levels or cut scores for evaluative decisions is not a novel concept. For example, in education these types of judgments are also made at the state level (e.g., levels of student achievement), in classroom grading practices (e.g., assigning letter grades of A, B, C, D, or F), and for individual students (e.g., appropriate instructional strategies).
Cut scores are also used for different purposes that are defined in a program’s validity framework. For example, in a professional licensure program (e.g., law, nursing, medicine) the cut score targets the minimum competency needed for public protection. The use and interpretation of this cut score is different from a certification exam (e.g., Board Certified Surgeons, National Board for Professional Teaching Standards) that seek to recognize more advanced or specialized skills in a given profession. Cut scores for these different programs cannot be interpreted in a similar way.
An illustration in another area of policy is the use of the poverty thresholds by the Census Bureau or poverty guidelines by the Department of Health and Human Services and the Department of Agriculture, to assist with statistical or administrative functions.18 Empirical data and additional policy considerations inform the final decision, 18 Additional information about federal measures of poverty can be accessed at http://aspe.hhs.gov/poverty/05poverty.shtml.
71
The validity framework includes a clear definition of the purpose of NAEP’s achievement levels, without which, there is confusion and ambiguity.
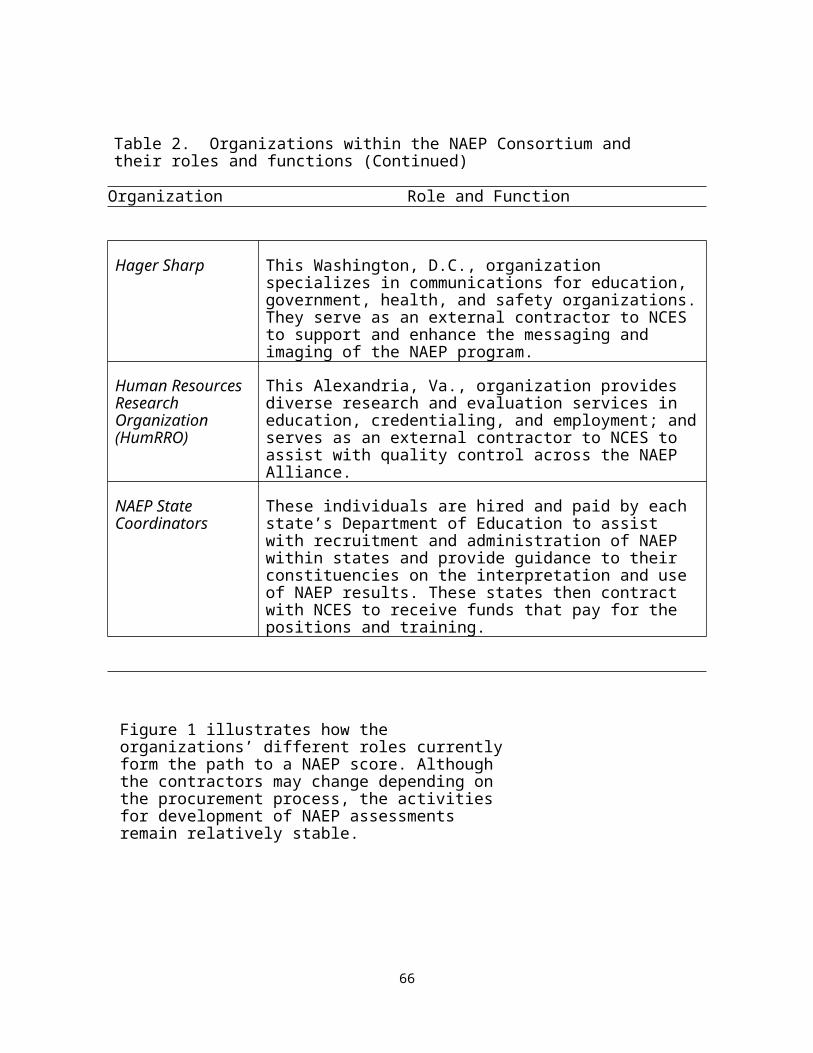
but do not change the value-laden component of the judgments.
Figure 2 illustrates one way that NAEP achievement level results are presented to assist users in their interpretation of scores. In the figure, comparisons of state level to other states or national level results on NAEP are possible.
Figure 2. NAEP average scores and achievement levels for the nation and select states for the 2005 grade 8 mathematics assessment. SOURCE: U.S. Department of Education, Institute of Education Sciences, National Center for Education Statistics, National Assessment of Educational Progress (NAEP), 2005 mathematics assessment.
72

l E v a l u a t i o n o f N A E P F i n a l R e p o r t l
The Standards provide guidance on appropriate practice with respect to setting achievement levels including sufficient documentation of the rationale and procedures used for establishing cut scores (Standard 4.19). This information was provided by NAGB’s standard-setting contractor. Another expectation is that test performance should be related to relevant criteria in the standard-setting process (Standard 4.20). Standard 4.21 suggests that, “. . . the judgmental process should be designed so that judges can bring their knowledge and experience to bear in a reasonable way” (p. 60). Panelists who participate in this process are well-qualified to make judgments about what students know and are able to do.
In evaluating the processes that result in recommended achievement levels for policy consideration, one expects to see different sources of validity evidence in a credible process. Kane (2001) suggests a framework for evaluating standard-setting that relies on three different sources of validity evidence: internal (characteristics of the participants’ judgments), procedural (systematic activities that are understood by qualified participants), and external (additional sources of evidence beyond the methodology). When we reviewed the Mapmark19 methodology (ACT, 2005a, 2005b; Schulz and Mitzel, 2005) as applied to the 2005 Grade 12 Mathematics assessment, we found the following validity evidence that could be attributed to these three sources:
Internal evidence:
Variation in panelists’ judgments generally decreased from their initial recommendation to their final recommendation suggesting greater agreement.
Procedural evidence:
Panelists for the studies met eligibility qualifications to participate in the study. Specifically, panelists were experts in the content or familiar with the abilities of students who took the assessment.
19 A more detailed description of the Mapmark method is provided in the full study report contained on the CD accompanying this evaluation.
73

Evaluations of the panelists’ experiences suggest that they understood their task, understood the judgments they were asked to render, and had confidence that their ratings would lead to appropriate achievement levels.
Facilitators followed the structured procedures for orientation, training, and implementation of the achievement level methodology.
External evidence:
Pilot studies conducted with previous standard-setting methodology and the new methodology converged to yield similar results.
Additional, limited data regarding 2005 12th grade students’ math performance were not inconsistent with NAEP results.
From these observations, the internal and procedural evidence supports the validity of the process; however, the external evidence could be strengthened.
Issues of Concern
Other measures of U.S. educational achievement do not provide strong sources of external validity evidence for NAEP achievement levels.
It is a challenge to gather validity evidence from multiple sources outside the standard-setting study that supports achievement levels. Such external data are not perfect evaluation criteria due to potential differences in content, sample, and purpose. For example, a range of mathematics tests may be compared; however, they may each assess different aspects of mathematics, with different content and emphasis. Some tests, such as well-known college admissions tests like the SAT and ACT, involve self-selected samples of college-bound seniors, not a nationally representative sample. In each of these instances, the tests may serve purposes that are very different from NAEP.20
20 NAEP has historically been a low-stakes assessment for students, schools, and states. This use contrasts with many state assessments that have high-stakes for schools (e.g., NCLB) and students (e.g., graduation tests).
74

l E v a l u a t i o n o f N A E P F i n a l R e p o r t l
As differences between what tests purport to do and measure increase, the utility of these measures as compelling, external evidence decreases.
Beyond other sources that may focus on measures of student achievement solely in the United States, NAEP may also consider international measures as a potential source for external validity evidence for national estimates of student achievement. Although we could not evaluate this source for NAEP’s 2005 Grade 12 Mathematics assessment, this evaluation did compare NAEP achievement levels for eighth-grade mathematics with results of the Trends in International Mathematics and Science Study (TIMSS) and Program for International Student Achievement (PISA).
Beyond the previously mentioned sources of external validity evidence, international measures of achievement may also guide those making policy decisions about achievement levels. This evaluation included a comparison of NAEP achievement levels for eighth-grade mathematics with those from the Trends in International Mathematics and Science Study (TIMSS) and Program for International Student Achievement (PISA). The findings from this study (see the accompanying CD to this report) showed that in 2003, eighth-grade students in mathematics from several other countries such as Singapore outperformed students in the United States. However, these countries did not necessarily outperform U.S. students in other subjects (e.g., science). These results can provide one source of evidence to evaluate the reasonableness of the NAEP achievement level standards. Figure 3 provides an example of the results obtained from this study showing how one could display the results from the TIMSS assessment using the NAEP achievement levels.
75

Figure 3. Sample results from the 2003 mathematics NAEP-TIMSS comparison—TIMSS results displayed in terms of NAEP achievement levels. SOURCE: U.S. Department of Education, Institute of Education Sciences, National Center for Education Statistics, National Assessment of Educational Progress (NAEP), 2003 mathematics assessment; Trends in International Mathematics and Science Study (TIMSS), 2003 mathematics assessment.
Studies that attempt to relate two tests of the same large domain (e.g., mathematics) are likely to result in differences in estimated achievement levels due to a number of factors, including how each test has specified the content within the domain. These factors should be evaluated before any comparative use. Each of these different tests provides information, but does not suggest interchangeability. One cannot simply make multiple measures interchangeably with a simple equating process (Braun and Mislevy, 2005; Flanagan, 1964). For example, in this report we have discussed the use of NAEP and researchers comparing NAEP results to other assessments in this country and also international assessments.
76

l E v a l u a t i o n o f N A E P F i n a l R e p o r t l
Regardless of the comparison, differences are likely to arise. Specifying how differences are interpreted is another component of a comprehensive validity framework. Linn (2003) reminds us, “Objectives mandated by the accountability system should be ambitious, but should also be realistically obtainable with sufficient effort” (p. 4). If there is an attempt to associate an accountability system that uses NAEP achievement levels, they must be set at levels that are credible and achievable.
Ultimately, the appropriateness of using domestic or international sources of external validity evidence to guide a policy decision rests on the uses and interpretations of achievements as defined in the validity framework. It is possible that NAEP achievement levels are not intended to converge with achievement levels developed by other assessment programs. If so, then documenting this anticipated, unintended use in the validity framework serves as preventative maintenance to reduce misinterpretation.
Recommendations
Recommendation 3: NAEP should continue to explore methodologies for setting achievement levels.
Stakeholders continue to use achievement levels as one means of interpreting NAEP results. NAEP has engaged in extensive research on standard-setting since 1992, to improve their practice. Some of this research includes the pilot studies done on the new Mapmark method (Schulz and Mitzel, 2005). However, more research on whether panelists in other subject areas would have similar experiences with this method is needed if it is applied to other NAEP subject areas. Although procedural evidence suggests that experts involved in the study on the 2005 Grade 12 Mathematics Assessment understood the process and were confident in their judgments, the degree to which the method may work with experts from other subject areas cannot be determined from this evaluation.
77

Recommendation 4: NAEP should prioritize gathering external validity evidence that supports the intended uses and interpretations of its achievement levels.
The validity evidence collected by NAEP from internal and procedural sources suggests that the methodology was implemented as intended and that panelists had a positive experience with the process. However, the reasonableness of the results is a judgmental decision by policymakers who can consider additional sources of information. The external validity evidence provides additional sources of evidence that may guide the final policy decision about NAEP achievement levels.21 Such sources may include results from additional methods, state university entrance level requirements on SAT or ACT, high school transcript studies that evaluate course performance, and AP exam performance. By triangulating these sources of evidence, the cut scores and their impact would strengthen the validity evidence. The extent to which the sources of evidence converge is determined by the intended uses and interpretations of NAEP’s achievement levels as articulated in its validity framework.
How Valid Are State Comparisons Using NAEP?
From an intuitive perspective, if there is a common measure administered across states, that measure should serve as a common yardstick for making comparisons across states. The common metric of NAEP and the ease of some of the Web-based reporting tools make these comparisons seductively simple for users. However, there are some assumptions about making these interpretations norm-referenced (i.e. comparisons to other states or the national average) or criterion-referenced (i.e. comparisons to NAEP achievement levels). It is necessary to understand these interpretations when evaluating their appropriateness.
There are different sources of evidence for evaluating the validity of comparisons across states. Some of these were explored in this evaluation. Although the content is the same, there are differences in populations across states. Because NAEP samples from these populations, the 21 External evidence is considered by policymakers and researchers in evaluating the recommendations for setting achievement levels made by a qualified panel of subject matter experts.
78
External validity evidence can influence achievement level decisions. At Grade 12, it may include state university entrance level results or transcript studies evaluating course performance.

l E v a l u a t i o n o f N A E P F i n a l R e p o r t l
samples will naturally represent some of these existing differences across states. However, additional factors can also influence the interpretability of results based on these samples, particularly as it applies to subgroup performance. Another factor is whether the scores for each state or subgroup are calculated in ways that are fair. A special topic study of this evaluation looked at states at subgroups to respond to this element of fairness.
Although data to make state comparisons on NAEP is available, the appropriateness of these interpretations is influenced by many factors.
Strengths of Using NAEP for State Comparisons
NAEP assessments are administered across years, but they are connected through a statistical process called “equating” to place scores onto the same scale to make them comparable. This process is necessary to track the progress of our nation’s students over time. Because one of the primary purposes of NAEP is to monitor the progress of important subgroups (e.g., diverse ethnicities, gender, states) over time, the connections among scores over time must be appropriate and fair for all subgroups to interpret the results in a valid way.
We evaluated this aspect of fairness across selected states. Five states were selected for NAEP Math (California, Florida, Massachusetts, North Carolina, and Oklahoma) and five were selected for NAEP Reading (California, New York, North Carolina, Oklahoma, and Texas). The results of the score equity assessment studies supported the comparability of the processes used to estimate NAEP scale scores across selected states included in this analysis. This means that state-to-state comparisons for grade 8 mathematics or reading do not appear to be influenced by any difference in the score estimation or achievement level classification procedures. For additional detail on how these studies were conducted, the full report can be found on the CD accompanying this evaluation.
79
One purpose of NAEP is to monitor the progress of the nation's students over time.

The evidence gathered in the score equity assessment studies serves as one important source of validity evidence for comparing states’ NAEP results. However, additional issues with state comparisons still exist. These studies were not intended to consider concepts such as content fairness or opportunity to learn. Specifically, the content included in NAEP may be different from what is specified in state content standards and assessed by any given state. This and other topics are discussed in the next section.
Issues of Concern
Evidence of alignment between NAEP assessment frameworks and state content standards, curriculum, and assessments is lacking.
As Braun and Mislevy (2005) remind us, one cannot judge the content of the test by simply reading the title (e.g., “Mathematics test”). Users must delve deeper to understand how different conceptualizations of a content area can lead to different types of assessments. When making comparisons of achievement among states using NAEP, a critical issue is the degree of alignment between the assessment (i.e. the NAEP assessment framework and questions) and states' education systems characterized in their content standards, curricula, instructional practices, and assessments. Only when an assessment is aligned with such an education system can it be an accurate indicator of their achievement and a basis for comparison. Alignment can be demonstrated at many levels. For example, as part of its peer review process NCLB requires states to demonstrate that their own assessments have been independently judged to align with state content standards to ensure valid interpretations of achievement.
Alignment methods could be used to evaluate (a) the degree to which NAEP tests are congruent with the content and cognitive dimensions in the NAEP frameworks (e.g., Sireci, Robin, Meara, Rogers, and Swaminathan, 2000), and (b) the degree to which different state assessments are congruent with NAEP assessments and with each other. Alignment methods allow for a useful summarization of the congruence among specific aspects of an assessment system. Alignment studies for NAEP exams, or for NAEP-
80
The critical issue of alignment between NAEP and state level education systems must be demonstrated.
l E v a l u a t i o n o f N A E P F i n a l R e p o r t l
state comparisons, that focus on the most general level of alignment (e.g., WestEd, 2002) could provide valuable information for understanding discrepancies in NAEP and state test results. These types of studies can also be extended to evaluate unique features of state curriculum and instructional practices relative to NAEP frameworks.
There are a number of ways that NAEP-state alignment could be evaluated.22 Some of these comparisons include: (a) comparing NAEP assessment frameworks with state content standards, (b) comparing NAEP assessments and state assessments, (c) comparing NAEP assessment frameworks with state assessments, and (d) comparing NAEP assessments to state content standards. However, direct comparisons of state-level content standards or assessments with NAEP assessments are problematic due primarily to the confidentiality of NAEP items.
Additional challenges with these types of studies include the complexities of interpreting alignment with NAEP’s balanced, incomplete block design used to divide the NAEP item pool across samples of students. Therefore, approaches that evaluate the overlap between NAEP assessment frameworks and state content standards may be most practical (e.g., Gatti, 2004; Smithson, 2004; and WestEd, 2002). Nevertheless, comparing state assessments with NAEP frameworks is also possible for a more complete analysis of NAEP-state alignment. However, sponsoring analyses of NAEP-state alignment issues also comes with a particular caution. These studies may be perceived as efforts to develop or promote national content standards that would evolve into a national curriculum. Anticipating such uses or interpretations is another reason why these need to be defined in a program’s validity framework.
Current inclusion and participation policies and rates may not provide evidence to support intended uses and interpretations of NAEP.
22 Alignment can also be characterized more broadly as including multiple dimensions, such as policies, curriculum, instruction, and assessment within and across grade levels.
81

The intended uses and interpretations of NAEP should be defined in its validity framework and relate to how students and schools are included in the results. Unlike the state assessment programs developed for NCLB, all students do not take NAEP. Furthermore, those who take NAEP do not take a full assessment, but rather a sample of its content. Thus, those included or not included can influence the results and any score interpretations. This is particularly true for students with disabilities (SWD) and English language learners (ELL). Decisions about inclusion and accommodations of SWD and ELL students are made at the state level.
Because these policies are not the same, differential practices across states threaten any state-by-state comparisons. For example, for their SWD and ELL subgroups that represent 40 percent of their total sample, California excludes 4 percent of these students from participating, assesses 5 percent of these students with accommodations, and assesses 31 percent of these students without accommodations. In contrast, Ohio’s SWD and ELL subgroup represent 13 percent of its total sample. Of this, 3 percent are excluded, 8 percent are assessed with accommodations, and 2 percent are assessed without accommodations. Although a comprehensive evaluation of the comparability of sample characteristics was not part of this evaluation, these differential policies raise additional questions and can threaten any state-by state comparisons (Chromy, Ault, Black, and Mosquin, 2007). Figure 4 illustrates differential exclusion rates that were observed in select states.
82
Because not every student takes NAEP, those included or excluded influence both the results and the interpretation of scores.

l E v a l u a t i o n o f N A E P F i n a l R e p o r t l
Figure 4. Exclusion and accommodation rates for students with disabilities and English language learners for 2005 NAEP Fourth-Grade mathematics. SOURCE: U.S. Department of Education, Institute of Education Sciences, National Center for Education Statistics, National Assessment of Educational Progress (NAEP), 2005 mathematics assessment.
Beyond inclusion policies, participation is also an important consideration. NAEP remains a voluntary assessment for students’ participation. Therefore, nonresponse and refusal to participate represent potential threats to the validity of NAEP scores, particularly for Grade 12 and private school samples. For example, Chromy (2005) noted that recent student participation rates for Grade 12 (74 percent) were considerably lower than Grade 4 (94 percent) and Grade 8 (92 percent). It is also unclear whether current sampling plans include all potential subgroups of interest within a state, such as specific ethnicity, students with disabilities, language proficiency, and free or reduced-price lunch status.
Chromy (2005) also noted that the Grade 12 response rates before substitution for the combined school and student national sample were 56 percent in 1998, 55 percent in 2002, and 55 percent in 2005. Table 5 illustrates how the results for the Grade 12 assessment compare with Grades 4 and 8 in Reading, when evaluating the combined school and student national response rates before substitution.
83
NAEP remains a voluntary assessment for students. Nonresponse and refusal to participate are potential threats to its validity.
0
5
10
15
20
25
30
35
40
3 48
4 3 3
10 5
710
815
10
31
5 7
2
8
Perc
ent o
f Tot
al S
ampl
e
Assessed without accomodations
Assessed with accomodations
Excluded

Table 5. Combined School and Student National Response Rates Before Substitution by Grade and Year: NAEP Reading
1998 2002 2003 2005Grade 4 78% 79% 92% 90%Grade 8 71% 75% 89% 88%Grade 12 56% 55% N/A 55%
SOURCE: Chromy, 2005; National Center for Education Statistics.
The response rates before substitution for the combined school and student national sample in Grade 12 Mathematics were also below expectations, yielding 62 percent in 1996, 60 percent in 2000, and 57 percent in 2005. Table 6 shows the Grade 12 response rates in comparison to Grades 4 and 8.
Table 6. Combined School and Student Response Rates of the National Public Before Substitution by Grade and Year: NAEP Mathematics
1996 2000 2003 2005Grade 4 81% 82% 94% 93%Grade 8 75% 76% 91% 90%Grade 12 62% 60% N/A 57%
SOURCE: Chromy, 2005; National Center for Education Statistics.
These response rates at Grade 12 were below NCES’s (2002) statistical standards requirements of 80 percent for school response rates and 85 percent for student level response rates. Thus, without improvements, the results pose a serious threat to the validity of the Grade 12 assessment program.
Finally, state samples must also appropriately represent intended populations to provide reliable estimates of students’ performance. Policymakers’ interest in NAEP scores may extend to specific subgroups within a state (e.g., ethnicity, students with disabilities, language proficiency, and free or reduced-price lunch status). To evaluate this question, Chromy et al., (2007) reviewed sampling characteristics for grades 4 and 8 in the context of the requirements of NCLB. Under some of these scenarios, many states would need to conduct a full census of some subgroups to be able evaluate achievement gap statistics.
84
l E v a l u a t i o n o f N A E P F i n a l R e p o r t l
This would change NAEP’s current practices of sampling students.
Using a scenario that would provide more precise estimates, many states would be required to have all students within certain subgroups included in the sample. Under these more stringent conditions, six states would require inclusion of all white students; 27 states at Grade 4 and 28 states at Grade 8 would require inclusion of all English language learners; and 19 states at Grade 4 and 20 states at Grade 8 would require inclusion of all black students to meet these estimation requirements (Chromy et al., 2007). Under less stringent requirements, these census expectations would be dramatically reduced.
Recommendations
Recommendation 5: Conduct additional validation research in the area of alignment of NAEP with state content standards, curricula, and assessments.
As used here, alignment refers to the overlap among (a) NAEP assessment frameworks and state academic content standards, (b) state assessments and NAEP assessments, and (c) state assessments and NAEP assessment frameworks. NAEP is often used by stakeholders as a basis for comparing results from state assessments, whether defined as an intended use in its validity framework, or not. Therefore, it is imperative for NAEP to further explore the multiple questions raised by this topic to support valid score interpretations. The intended uses of NAEP could be expanded to more directly evaluate student performance as reported by states under NCLB. If this occurs, alignment evidence of the comparability of states’ curriculum, instruction, and assessment practices to NAEP’s assessment frameworks and items would be a necessary source of validity evidence to support or refute the appropriateness of these comparisons.
Recommendation 6: Conduct studies that evaluate issues of concern related to participation in NAEP.
As discussed in the findings, states currently have different policies for exclusion and for providing accommodations for students with disabilities (SWD) and English language
85
To make valid comparisons between NAEP and state assessments, there must be evidence of curriculum, instruction, and assessment comparability.

learners (ELL) on NAEP. This potentially raises the issue of fairness of comparisons of these subgroups across states. Although strategies for estimating the impact of exclusion appear promising as a means of improving the comparability of State NAEP scores, these results are not conclusive (e.g., McLaughlin, 2000; Wise, Le, Hoffman, and Becker, 2004).
For NAEP to yield valid results, data need to be based on sufficient, representative samples to estimate performance for each intended subgroup defined in its validity framework. Chromy et al. (2007) suggest that full census data may be needed in many states for some of the comparative achievement gap analyses to be conducted. This may amplify an existing concern about participation. Unlike participation at fourth- and eighth-grade, 12th-Grade school participation for reading and mathematics is voluntary. Further, 12th-Grade NAEP is only conducted at the national level, making additional state-level information unavailable. Unless meaningful incentives are implemented to encourage schools and students to participate, 12th-Grade NAEP results will have limited utility for policymakers (Chromy, 2005).
86

l E v a l u a t i o n o f N A E P F i n a l R e p o r t l
How Clearly and Accessibly Are NAEP Reports and Results Communicated to Stakeholders?
Communicating NAEP results and reports clearly and meaningfully to stakeholders is a considerable challenge. Over time, the reporting strategies used by NAEP represent a transition from data collection and analysis to usability. As new strategies for reporting are implemented, an increasingly diverse array of stakeholders access and interpret results at different levels. It is also important to ensure that those results and reports are consistent with the validity framework.
NAEP’s Web site contains both depth and breadth of information; however, the information may not be reaching some intended stakeholders in ways that allow for appropriate interpretation.
Strengths of NAEP Reporting
Through a special study within this evaluation, we found that participants in interviews expressed positive impressions of the NAEP Web site. Also, NAEP incorporates a number of graphical displays in its reporting materials, ranging from bar charts and line graphs to interactive state comparison maps. Many of these displays were easily understood and interpreted by the participants in focus groups. Because NAEP reports results for both scale scores and achievement levels, the use of color-coded, purposeful visual displays to communicate results is an essential component of NAEP reports. Additional detailed information about the utility studies is included in the full study report contained on the CD accompanying this evaluation.
In addition to stakeholder understanding of sample graphic and tabular displays, the evaluation conducted a review of Web statistics. Results from these analyses suggested that interest was particularly high with respect to the State Profiles, the NAEP Question Tool, results for subgroups, the www.nationsreportcard.gov Initial Release Site, and the NAEP Data Explorer. Each of these elements generated a higher level of traffic relative to other features of the site. Because these aspects of the site are viewed at higher rates, additional questions that could not be explored here include: a) the reasons why these features are increasingly popular,
87
With increasingly diverse stakeholders, there are considerable challenges to communicate NAEP results effectively.

and b) how well these features meet the information needs of users.
Figure 5 illustrates one example of a graphic display of NAEP that stakeholders were generally able to understand to compare state performance.
Figure 5. Cross-state comparison with Texas as the focal state. SOURCE: U.S. Department of Education, Institute of Education Sciences, National Center for Education Statistics, National Assessment of Educational Progress (NAEP), 2005 mathematics assessment.
88
Figure 5
Figure 5

l E v a l u a t i o n o f N A E P F i n a l R e p o r t l
Issues of Concern
Intended users were not familiar with NAEP scale scores and had difficulty distinguishing between achievement levels on NAEP and those developed by states for NCLB reporting purposes.
Most participants across focus groups in the utility studies identified NAEP with state-level results. This represents a communications challenge for the future because of stakeholders’ familiarity with the reporting scales and achievement levels used for their state’s assessment. There was confusion among participants between state and NAEP achievement levels results. This led to recognition that states’ definitions of Proficient may differ from NAEP’s definition of Proficient. This recognition included how the term is defined but also the potential for different uses at the state versus national level. Another source of confusion is that NAEP defines three threshold achievement levels (i.e. Basic, Proficient, and Advanced), yet reports student performance at four levels (i.e. Below Basic, Basic, Proficient, and Advanced). There is not a policy definition for performance below Basic.
Participants’ lack of familiarity with the score scale and achievement levels extends to data displays of scale scores that report subgroup differences. Participants’ lack of understanding of the NAEP score scale limited the extent to which they could assign meaning to scale score results and subgroup differences. Although they were able to recognize when the differences were abstractly ‘significant,’ participants sought ways to interpret different points on the NAEP score scale with practical meaning. Figure 6 illustrates one example of a visual display that presented greater challenges for participants. This was of particular concern because focus groups were comprised of stakeholders who are likely to use this information.
89
Participants’ lack of understanding of score scale and achievement levels seems to warrant the dissemination of more basic public information.

Figure 6. NAEP Pantyhose Chart for 2005 Grade 4 Reading TUDA. SOURCE: Lutkus, A.D., Rampey, B.D., and Donahue, P. (2006). The Nation’s Report Card: Trial Urban District Assessment Reading 2005 (NCES 2006–455r). U.S. Department of Education, National Center for Education Statistics. Washington, D.C.
Many users appreciated the breadth and depth of information provided, but also reported finding particular aspects of the NAEP homepage confusing or illogical. There was confusion regarding the inclusion or exclusion of items in the left navigation bar, the presence of multiple search boxes, and the placement of the link to return to the NAEP homepage with other pages on the site. These difficulties identified by participants then raised further
90

l E v a l u a t i o n o f N A E P F i n a l R e p o r t l
questions in some cases about the overall structure of the site. Many difficulties experienced by participants were reflective of their prior knowledge of Web browsing and data analysis. Additional detailed information about the findings from these utility studies is provided on the CD accompanying this report.
Recommendation 7: Prioritize score reporting and interpretation as an area for research in the NAEP program.
Systematic studies of methods to report NAEP score and achievement levels should be carried out with stakeholder groups prior to their operational use. Although some of this research may include print media, a more critical evaluation medium is NAEP’s presence on the World Wide Web. The NAEP elements on the Web should be revised to reflect empirical findings on ease of use, stakeholder interests, and accepted Web site development practices. Because NAEP reporting continues to make use of interactive, online tools, the utility of those features must also be assessed. Thus, defining intended audiences for communicating NAEP results and then targeting reporting efforts to those groups is part of the program’s validity framework.
Challenges to a functional interpretation of NAEP scale scores serve as one rationale for the development of achievement levels. This initiative has been promoted as a strategy to assist the public and policymakers in understanding students’ performance. It is important for NAEP to continue to refine its achievement level descriptors to guide users’ understanding of the meaning of different levels of NAEP achievement and their connection with state assessment results.
91
As NAEP’s presence on the World Wide Web continues to expand, it may be a critical focus for future development.

Chapter 4: Summary and Next Steps
The Mandate and the Findings
Since the federal government began to measure the achievements of the nation’s public and private school students at the elementary, middle, and secondary levels in 1969, the National Assessment of Educational Progress (NAEP) has regularly assessed the achievement of the nation’s students’ across more than a dozen content areas.
Over time, both the number and type of stakeholders who interpret and use the test results have grown, as changing federal educational policy has given NAEP increased visibility. The process by which the tests are developed, administered, evaluated, and shared with the public has shifted, introducing a range of external organizations whose central role in coordinating the NAEP program has added to its effectiveness. As a national indicator of education achievement, NAEP assessment results have also become a benchmark for many states as they measure the progress of their students on NAEP.
Accountability in education has become an increasingly high priority at the federal level. The quality and effectiveness of testing procedures and practices require greater study and evaluation than ever before, particularly in light of their impact on future policy decisions. Currently, as Congress begins to consider the reauthorization of the No Child Left Behind Act of 2001 (NCLB), this independent evaluation of the NAEP program is of particular importance. The evaluation included a number of studies designed to respond to four broad questions mandated by Congress. Collectively, these studies investigated the validity of the testing program, its applicability and uses, and its accessibility to stakeholders.
92
l E v a l u a t i o n o f N A E P F i n a l R e p o r t l
Primary Findings by Evaluation Question
1. How consistent are NAEP’s procedures with professional testing standards?
Many of the procedures for developing and maintaining NAEP are consistent with professional testing standards. However, two issues of concern have the potential to threaten the program if they are not addressed.
First, an articulated validity framework for the program that includes specific intended uses and interpretations of NAEP scores was not evident. Any evaluation of validity evidence for a testing program begins with this definition of intended uses and interpretations of the test. Second, NAEP is missing an opportunity to communicate the activities of its program when it releases technical manuals years after results are disseminated.
2. How consistent are procedures for setting NAEP achievement levels with professional testing standards?
Many of the procedures for setting achievement levels for NAEP are consistent with professional testing standards. However, there is a notable exception regarding the use of external evidence to aid policymakers. Multiple sources of evidence can be used develop policy, yet there is always a value judgment implicit in final policy decisions. The use and interpretation of achievement levels are also components of a program’s validity framework.
3. How valid are state comparisons using NAEP?
Using a national testing program to assess states’ educational achievements raises certain questions about both comparability and participation among schools and students. Although data to make state comparisons on NAEP are available, the appropriateness of these interpretations is influenced by many factors. Some of the factors discussed in the evaluation include the alignment of NAEP to state content standards and assessments, inclusion policies, and participation rates. Each of these issues is related to the intended uses and interpretations as defined in the program’s validity framework.
93

4. How clearly and accessibly are NAEP reports and results communicated to stakeholders?
Communicating NAEP results clearly and meaningfully to diverse groups of stakeholders is a considerable challenge. NAEP’s Web site contains both depth and breadth of information; however, the information may not be reaching some intended stakeholders in ways that allow for appropriate interpretation. Although stakeholders understood many of the reports and tools that NAEP communicates, some confusion remains regarding appropriate interpretations of scale scores and achievement levels.
NAEP and the Challenge of the Future
In its earliest days, the NAEP program focused on assessing what students knew and could demonstrate. NAEP reports provided results question by question, providing educators and the public with a measure of students’ performance on particular questions. As a result, teachers were able to modify their teaching to focus on specific content areas in which students lacked proficiency.
Throughout the years, the NAEP program has matured through a number of notable phases (e.g., reporting scale scores, creating an independent policy body to oversee the program, and establishing achievement levels to interpret and communicate achievement). The next steps in NAEP’s further development as a program begin with the recommendations of this evaluation. These recommendations are related to the evaluation questions and are briefly summarized here.
94

l E v a l u a t i o n o f N A E P F i n a l R e p o r t l
1. Recommendations for how to ensure greater consistency of NAEP’s procedures with professional testing standards:
Recommendation 1: Develop an organized validity framework that includes a clear definition of the intended uses and interpretations of NAEP scores.
Based on the evaluation, our primary recommendation reflects a fundamental need for all testing programs. The Standards clearly specify that a rationale and supporting research and documentation should be provided for each intended use and interpretation of a test’s scores. Because NAEP is used by a range of stakeholders, defining intended uses and the development of a validity framework are shared responsibilities for the agencies that oversee NAEP. By developing a validity framework with defined intended uses and interpretations, validation efforts can be guided by a common plan to support those uses and actively discourage unintended or inappropriate uses.23 All of the findings and recommendations described in this report are connected to this primary recommendation for NAEP to develop a validity framework.
Recommendation 2: Revise review processes for NAEP technical reports and manuals that facilitate their timely release.
Communicating results without documentation of the processes that led to those results prevents readers from evaluating the credibility or limitations of those results. According to the Standards, it is the responsibility of the testing program to provide documentation of the technical quality of the results at the time scores are released. This is a rigorous expectation of quality that NAEP is not currently meeting. There are a number of reasons why releasing technical documentation is important. For NAEP, providing this information in a timely manner would greatly increase the transparency of the testing program and assist users in understanding the appropriate uses of scores as defined in the validity framework.
23 Although not every unintended consequence can be anticipated, the Standards require reasonable effort to prevent negative consequences and to encourage sound interpretation (Standards, at 117).
95

2. Recommendations for ensuring greater consistency with procedures for setting NAEP achievement levels and professional testing standards:
Recommendation 3: NAEP should continue to explore methodologies for setting achievement levels.
Stakeholders continue to use achievement levels as one means of interpreting NAEP results. NAEP has engaged in extensive research on standard-setting since 1992 to improve its practice. Some of this research includes the pilot studies performed on the new Mapmark method in Mathematics (Schulz and Mitzel, 2005). However, more research on whether panelists in other NAEP subject areas would have similar experiences with this method is needed if it is applied to other NAEP subject areas. Although internal and procedural evidence suggested that experts involved in the study on the 2005 Grade 12 Mathematics Assessment understood the process and were confident in their judgments, the degree to which the method will work with experts from other subject areas cannot be determined from this evaluation.
Recommendation 4: NAEP should prioritize gathering external validity evidence that supports the intended uses and interpretations of its achievement levels.
The validity evidence collected by NAEP from internal and procedural sources suggest that the methodology was implemented as intended and that panelists had a positive experience with the process. However, the reasonableness of the results is a judgmental decision by policymakers that can consider additional sources of information. The external validity evidence serves as these additional sources to aid policymakers in making the final policy decision about NAEP achievement levels. Such sources may include results from additional methods, state university entrance level requirements on the SAT or ACT, high school transcript studies that evaluate course performance, and AP exam performance. Synthesizing these sources of evidence when considering the recommended cut scores and its impact would strengthen the validity evidence. The extent to which the sources of evidence converge is determined by the intended uses and interpretations of NAEP’s achievement levels as articulated in its validity framework.
96

l E v a l u a t i o n o f N A E P F i n a l R e p o r t l
3. Recommendations for further evaluating the validity of state comparisons using NAEP:
Recommendation 5: Conduct additional validation research in the area of alignment of NAEP with state content standards, curricula, and assessments.
As used here, alignment refers to the overlap among the NAEP assessment frameworks and state academic content standards for elementary and secondary education; state assessments and NAEP; and state assessments and NAEP assessment frameworks. NAEP is often used by stakeholders as a basis for comparing results from state assessments, whether defined as an intended use in its validity framework or not. Therefore, it is imperative for NAEP to further explore the multiple questions that are raised by this topic to support valid score interpretations. The intended uses of NAEP could be expanded to more directly evaluate student performance as reported by states under NCLB. If this occurs, alignment evidence of the comparability of states’ curriculum, instruction, and assessment practices to NAEP’s assessment frameworks and items would be a necessary source of validity evidence to support or refute the appropriateness of these comparisons.
Recommendation 6: Conduct studies that evaluate issues of concern related to participation in NAEP.
States currently have different policies for exclusion and for providing accommodations for students with disabilities (SWD) and English language learners (ELL) on NAEP. This potentially raises the issue of fairness of comparisons of these subgroups across states. Although strategies for estimating the impact of exclusion appear promising as a means of improving the comparability of State NAEP scores, these results are not conclusive.
For NAEP to yield valid results, data need to be based on sufficient, representative samples to estimate performance for each intended subgroup defined in its validity framework. Chromy et al. (2007) suggest that full census data may be needed in many states for some of the comparative achievement gap analyses to be conducted. This may amplify an existing concern about participation. Unlike fourth- and eighth-grade participation, participation
97

for reading and mathematics at 12th-grade is voluntary. Further, 12th-grade NAEP is only conducted at the national level, making additional state-level information unavailable. Unless meaningful incentives are implemented to encourage schools and students to participate, 12th-grade NAEP results will have limited utility for policymakers (Chromy, 2005).
4. Recommendation for how to further evaluate the accessibility and understanding of NAEP Reports and Results for Stakeholders:
Recommendation 7: Prioritize score reporting and interpretation as an area for research in the NAEP program.
Systematic studies of methods to report NAEP score and achievement levels should be carried out with stakeholder groups prior to their operational use. Although some of this research may include print media, a more critical evaluation medium is NAEP’s presence on the World Wide Web. The NAEP elements on the Web should be revised to reflect empirical findings on ease of use, stakeholder interests, and accepted Web site development practices. Because NAEP reporting continues to invest in the use of interactive, online tools, the utility of these features must also be assessed. Thus, defining intended audiences for communicating NAEP results and then targeting reporting efforts to those groups is part of the program’s validity framework.
Challenges to a functional interpretation of NAEP scale scores serve as one rationale for the development of achievement levels. This initiative has been promoted as a strategy to assist the public and policymakers in understanding students’ performance. It is important for NAEP to continue to refine its achievement level descriptors to guide users’ understanding of the meaning of different levels of NAEP achievement and how they do or do not connect with state assessment results.
98

l E v a l u a t i o n o f N A E P F i n a l R e p o r t l
ConclusionAs a national measure of student achievement, the NAEP program continues to be a valuable tool for policymakers to broadly monitor the education of the nation’s students. Our findings and recommendations are limited by the time and resources available for studies and by the information that was available to us during the evaluation. However, given what we were able to evaluate, we found the processes underlying the development, administration, and scoring of NAEP assessments generally consistent with professional testing standards. However, the evolving uses of NAEP scores with subpopulations (e.g., states, urban districts, student subgroups) require additional consideration, namely the extent to which intended uses and interpretations are supported by evidence in the program as defined in the validity framework.
NAEP’s evolving uses present challenges to a program that is currently at capacity with established operational responsibilities. The findings and recommendations in the final evaluation report are designed to inform policymakers’ discussions about the key components of the NAEP program as judged against the Standards for Educational and Psychological Testing (AERA, APA, and NCME, 1999).
99
References
ACT. (April, 2005a). Developing achievement levels on the 2005 National Assessment of Educational Progress in grade 12 mathematics: Executive summary. Iowa City, Iowa: Author.
ACT. (April, 2005b). Developing achievement levels on the 2005 National Assessment of Educational Progress in grade 12 mathematics: Process report. Iowa City, Iowa: Author.
ACT. (May, 2005c). Developing achievement levels on the 2005 National Assessment of Educational Progress in grade 12 mathematics: Special studies report. Iowa City, Iowa: Author.
American Educational Research Association, American Psychological Association, and National Council on Measurement in Education (1999). Standards for Educational and Psychological Testing. Washington, D.C.: American Educational Research Association.
Angoff, W. H. (1971). Scales, norms, and equivalent scores. In R. L. Thorndike (ed.), Educational measurement (2nd ed., pp. 508–597). Washington, D.C.: American Council on Education.
Angoff, W.H. (1964). Technical problems of obtaining equivalent scores on tests. Journal of Educational Measurement, 1(1), p. 11–14.
Bandeira de Mello, V., Crowley, J., Madsen, S., McLaughlin, D., and William, P. (March, 2008). Measuring the validity of the placement of a state standard onto the NAEP scale. Paper presented at the annual meeting of the American Educational Research Association. New York, N.Y.
Bourque, M. L. (2004). A history of the National Assessment Governing Board. In L. V. Jones and I. Olkin (eds.) The Nation’s Report Card: Evolution and perspectives (pp. 201–231). Bloomington, Ind.: Phi Delta Kappa Educational Foundation.
Bourque, M. L., and Byrd, S. (eds.). (Nov., 2000). Student performance standards on the National Assessment of Educational Progress: Affirmations and Improvements. Washington, D.C.: National Assessment Governing Board.
Braun, H.I., and Mislevy, R. (2005). Intuitive test theory. Phi Delta Kappan, 86(7), 488–497.
Braun, H.I., and Qian, J. (2007). Mapping state performance standards onto the NAEP scale. Retrieved Sept. 15, 2007, from http://nces.ed.gov/nationsreportcard/pdf/studies/2007482.pdf.
Brennan, R. L. (ed.) (2006). Educational measurement (4th ed.). Westport, Conn.: American Council on Education and Praeger.
Buckendahl, C. W. and Plake, B. S. (2006). Evaluating tests. In S. Downing and T. Haladyna (eds.). Handbook of Test Development (pp. 725–738). Mahwah, N.J.: Lawrence Erlbaum Associates.
100
l E v a l u a t i o n o f N A E P F i n a l R e p o r t l
Bush, G. (April 24, 2007). President Bush encourages the reauthorization of No Child Left Behind (transcript from speech delivered). Retrieved May 1, 2007, from http://www.whitehouse.gov/news/releases/2007/04/20070424-9.html.
Bush, G. (Jan. 9, 2006). White House fact sheet: No Child Left Behind—Strengthening America’s education system. Retrieved May 1, 2007, from http://www.whitehouse.gov/news/releases/2006/01/print/20060109.html.
Bush, G. (July 14, 2005). White House fact sheet: Ensuring the promise of America reaches all Americans. Retrieved May 1, 2007, from http://www.whitehouse.gov/news/releases/2005/07/print/20050714.html.
Bush, J., and Bloomberg, M. (Aug. 13, 2006). How to help our students: Building on the “No Child” law. The Washington Post, p. B07.
CCSSO. (2002). Models for alignment analysis and assistance to states. Retrieved Aug. 28, 2005, from http://www.ccsso.org/content/pdfs/AlignmentModels.pdf.
Carr, P. (2005). The nation’s report card—Results from the 2005 NAEP assessment programs in reading and mathematics (transcript from NCES Statchat). Accessed May 1, 2007, from http://www.nces.ed.gov/whatsnew/statchat/transcripts/ts10192005.asp.
Cavanagh, S. (2006). Statistics agency gauging state ‘proficiency’ thresholds. Education Weekly, 26(13), 13.
Chromy, J., Ault, K., Black, S., and Mosquin, P. (2007). An evaluation of NAEP state samples. Final report for the U.S. Department of Education’s Office of Planning, Evaluation, and Policy Development’s Policy and Program Studies Service.
Chromy, J. (2005). Participation standards for 12th-grade NAEP. Accessed Sept. 10, 2007, from http://www.nagb.org/pubs/chromy_paper_revised.doc.
Cizek, G. J., Bunch, B. B., and Koons, H. (2004). Setting performance standards: Contemporary methods [An NCME instructional module]. Educational Measurement: Issues and Practice, 23(4), 31–50.
Cizek, G. J. (ed., 2001). Setting performance standards: Concepts, methods, and perspectives (pp. 3–17). Hillsdale, N.J.: Erlbaum.
Cizek, G. J. (1996a). Setting passing scores. Educational Measurement: Issues and Practice, 15(1), 12–21.
Cizek, G. J. (1996b). Standard setting guidelines. Educational Measurement: Issues and Practice, 15(2), 20–31.
Cizek, G. J. (1993). Reconsidering standards and criteria. Journal of Educational Measurement, 30, 93–106.
101

College Board (2005). 2005 College bound seniors: Total group profile report. Retrieved Jan. 7, 2006, from http://www.collegeboard.com/prod_downloads/about/news_info/cbsenior/yr2005/2005-college-bound-seniors.pdf.
College Board (2004). 2004 College bound seniors: A profile of SAT program test takers. Retrieved Jan. 7, 2006, from http://www.collegeboard.com/prod_downloads/about/news_info/cbsenior/yr2004/2004_CBSNR_total_group.pdf.
College Board (2003). 2003 College bound seniors: A profile of SAT program test takers. Retrieved Jan. 7, 2006, from http://www.collegeboard.com/prod_downloads/about/news_info/cbsenior/yr2003/pdf/2003_TOTALGRP_PRD.pdf.
Dorans, N. J. (2004). Using subpopulation invariance to assess score equity. Journal of Educational Measurement, 41, 43–68.
Flanagan, J.C. (1964). Obtaining useful comparable scores for non-parallel tests and test batteries. Journal of Educational Measurement, 1(1), 1–4.
Gatti, G. G. (Oct., 2004). Alignment of state-to-NAEP content standards in 4th grade Scott Foresman and 8th grade Prentice Hall mathematics textbooks. Paper presented at the Northern Rocky Mountain Educational Research Association, Custer, S.D.
Glaser, R., Linn, R. L., and Borhnstedt, G. W. (1993). The trial state assessment: Prospects and realities. Stanford, Calif.: National Academy of Education.
Glaser, R., Linn, R. L., and Borhnstedt, G. W. (1992). Assessing achievement in the states. Stanford, Calif.: National Academy of Education.
Hambleton, R. K. and Pitoniak, M. J. (2006). Setting performance standards. In R. L. Brennan (ed.), Educational measurement (4th ed., pp. 433–470). Westport, Conn.: American Council on Education and Praeger.
Hambleton, R. K. (2001). Setting performance standards on educational assessments and criteria for evaluating the process. In G. J. Cizek (ed.), Setting performance standards: Concepts, methods, and perspectives (pp. 89–116). Hillsdale, N.J.: Erlbaum.
Hambleton, R. K., Brennan, R. L., Brown, W., Dodd, B., Forsyth, R. A., Mehrens, W. A., Nellhaus, J., Reckase, M., Rindone, D., van der Linden, W. J., and Zwick, R. (2000). A response to “setting reasonable and useful performance standards” in the National Academy of Sciences “Grading the Nation’s Report Card.” Educational Measurement: Issues and Practice, 19(2), 5–14.
Hambleton, R. K. and Powell, S. (1990). A framework for viewing the process of standard setting. Evaluation and the Health Professions, 6, 3–24.
Herszenhorn, D. M. (May 5, 2006). As test-taking grows, test-makers grow rarer. New York Times.
102

l E v a l u a t i o n o f N A E P F i n a l R e p o r t l
Ho, A. (June, 2007). State-NAEP standard mappings: Cautions and alternatives. Paper presented at the annual meeting of the Council of Chief State School Officers, Nashville, Tenn.
Ho, A., and Haertel, E., (2007a). (Over)-Interpreting mappings of state performance standards onto the NAEP scale. Washington, D.C.: Council of Chief State School Officers. Accessed July 2, 2007, from: http://www.ccsso.org/content/PDFs/Ho%20Haertel%20CCSSO%20Brief1%20Final.pdf.
Ho, A., and Haertel, E. (2007b). Apples to apples? The underlying assumptions of state–NAEP comparisons. Accessed July 2, 2007, from: http://www.ccsso.org/content/PDFs/Ho%20Haertel%20CCSSO%20Brief2%20Final.pdf.
Hoff, D., and Manzo, K. (March 9, 2007). Bush claims about NCLB questioned. Education Week. Accessed March 28, 2007 from http://www.edweek.org.
Jaeger, R. M. (1991). Selection of judges for standard setting. Educational Measurement: Issues and Practice, 10(2), 3–6, 10, 14.
Kane, M. T. (2006). Validation. In R. L. Brennan (ed.), Educational measurement (4th ed., 17–64). Westport, Conn.: American Council on Education and Praeger.
Kane, M. T. (2001). So much remains the same: Conception and status of validation in setting standards. In G. Cizek (ed.), Setting performance standards: Concepts, methods and perspectives (pp. 53–88). Mahwah, N.J.: Erlbaum.
Kane, M. (1994). Validating the performance standards associated with passing scores. Review of Educational Research, 64, 425–461.
Kingsbury, G. G., Olson, A., Cronin, J., Hauser, C., and Houser, R. (2003). The state of state standards. Portland, Oreg.: Northwest Evaluation Association.
Lennon, R. T. (1964). Equating non-parallel tests. Journal of Educational Measurement, 1(1), 15–18.
Lindquist, E. F. (1964). Equating scores on non-parallel tests. Journal of Educational Measurement, 1(1), p. 5–10.
Linn, R. L. (2005). Adjusting for differences in tests. Paper presented in the symposium on the use of school-level data for evaluating federal education programs. Washington, D.C.: The board on Testing and Assessment, National Research Council.
Linn, R. L. (2004). The influence of external evaluations. In L. V. Jones and I. Olkin (eds.), The Nation’s Report Card: Evolutions and perspectives (pp. 291–308). Bloomington, Ind.: Phi Delta Kappa Educational Foundation.
Linn, R. L., (2003). Accountability: Responsibility and reasonable expectations. Educational Researcher, 32(7), 3–13.
103

Linn, R. L. (1998). Validating inferences from National Assessment of Educational Progress achievement-level reporting. Applied Measurement in Education, 11, 23–47.
Linn, R. L. (1993). Linking results of distinct assessments. Applied Measurement in Education, 6(1), 83–102.
Linn, R. L. (ed.) (1989). Educational Measurement (3rd ed.). New York, N.Y.: American Council on Education: Macmillan.
Loomis, S. C., and Bourque, M. L. (2001). From tradition to innovation: Standard setting on the National Assessment of Educational Progress. In G. J. Cizek (ed.), Standard setting: Concepts, methods, and perspectives (pp. 175–217). Mahwah, N.J.: Erlbaum.
Martin, M. O., Mullis, I. V. S., and Chrostowski, S. J. (eds.) (2004). TIMSS 2003 Technical Report. Chesnut Hill, Mass.: TIMSS and PIRLS International Study Center, Boston College.
McLaughlin, D. H. (2000). Protecting state NAEP trends from changes in SD/LEP inclusion rates (Report to the National Institute of Statistical Sciences). Palo Alto, Calif.: American Institutes for Research.
Mead, N. and Sandene, B. (2007). The Nation’s Report Card: Economics 2006 (NCES 2007-475). Washington, D.C.: National Center for Education Statistics, Institute of Education Sciences, U.S. Department of Education.
Mitzel, H.C., Lewis, D.M., Patz, R.J., and Green, D.G. (2001). The bookmark procedure: Psychological perspectives. In G. Cizek (ed.), Setting performance standards: Concepts, methods and perspectives (pp. 53–88). Mahwah, N.J.: Erlbaum.
Morganthau, T. (1990). The future is now. Newsweek, Fall/Winter special issue, 72–76.
National Assessment Governing Board (2004). Mathematics framework for the 2005 National Assessment of Educational Progress. [online] Available: http://www.nagb.org/pubs/m_framework_05/761607-Math%20Framework.pdf.
National Assessment Governing Board (March, 2002). Using the National Assessment of Educational Progress to confirm state test results: A report of the ad hoc committee on confirming test results. Washington, D.C.: Author.
National Education Association (n.d.). NAEP and NCLB testing: Confirming state test results. Retrieved Sept. 25, 2006, from http://www.nea.org/accountability/naep-accountability.html.
National Center for Education Statistics (NCES), (2007). Mapping 2005 proficiency standards onto the NAEP scales: Research and development report. U.S. Department of Education, NCES report 2008-482.
Olson, L., and Hoff, D. (2006). Framing the debate. Education Week, 26(15), 22, 24, 26–27, 29–30.
104

l E v a l u a t i o n o f N A E P F i n a l R e p o r t l
Pellegrino, J. W., Jones, L. R., and Mitchell, K. J. (1999). Grading the nation’s report card: Evaluating NAEP and transforming the assessment of educational progress. Washington, D.C.: National Academy Press.
Porter, A. C. (2002). Measuring the content of instruction: Uses in research and practice. Educational Researcher, 31(7), 3–14.
Porter, A. C., and Smithson, J. L. (2001). Defining, Developing, and Using Curriculum Indicators. CPRE Research Report Series (No. RR-048). Philadelphia, Pa.: Consortium for Policy Research in Education.
Porter, A. C., and Smithson, J. L. (2002). Alignment of assessments, standards and instruction using curriculum indicator data. Paper presented at the Annual Meeting of American Educational Research Association, New Orleans, La.
Rothman, R., Slattery, J. B., Vranek, J. L., and Resnick, L. B. (2002). Benchmarking and alignment of standards and testing. CSE Technical Report (No. CSE-TR-566). Los Angeles, Calif.: National Center for Research on Evaluation, Standards, and Student Testing.
Schulz, E. M., and Mitzel, H. (April, 2005). The Mapmark standard setting method. Paper presented at the annual meeting of the National Council on Measurement in Education. Montreal, Quebec.
Shakrani, S. (June, 2005). In English language learners in state NAEP and state assessments—Shall the twain ever meet? Session presented at the 35th Annual National Conference on Large Scale Assessment, Council of Chief State School Officers, San Antonio.
Shepard, L., Glaser, R., Linn, R. L., and Bohrnstedt, G. (1993). Setting performance standards for student achievement: A report of the National Academy of Education panel on the evaluation of the NAEP trial state assessment: An evaluation of the 1992 achievement levels. Stanford, Calif.: National Academy of Education.
Sireci, S. G., Robin, F., Meara, K., Rogers, H. J., and Swaminathan, H. (2000). An external evaluation of the 1996 Grade 8 NAEP Science Framework. In N. Raju, J.W. Pellegrino, M.W. Bertenthal, K.J. Mitchell and L.R. Jones (eds.), Grading the nation’s report card: Research from the evaluation of NAEP (pp. 74–100). Washington, D.C.: National Academy Press.
Sireci, S. G. (1998). Gathering and analyzing content validity data. Educational Assessment, 5(4), 299–321.
Smithson, J. L. (Sept., 2004). Summary report on alignment analyses of Prentice Hall mathematics test forms to gr. 8 NAEP benchmarks and state mathematics standards in five states. Unpublished research report, University of Wisconsin, Madison: Madison, Wisc.
105

Stancavage, F. B., Beaton, A. E., Behuniak, P., Bock, R. D., Bohrnstedt, G. W., Champagne, A., Chromy, J. R., Cole, S., DeMauro, G., Duran, R. P., Grissmer, D., Hedges, L., Hughes, G., McLaughlin, D. H., Mullis, I. V. S., Pearson, P. D., and Shepard, L. (Oct., 2002). An agenda for NAEP validity research. Palo Alto, Calif.: American Institutes for Research.
Stoneberg, B. (2007). Using NAEP to confirm state test results in the No Child Left Behind Act. Practical Assessment, Research, and Evaluation, 12(5). Available online: http://pareonline.net/getvn.asp?v=12andn=5.
Toch, T. (January, 2006). Margins of error: The education testing industry in the No Child Left Behind era. Washington, D.C.: Education Sector.
U.S. Department of Health and Human Services. (2006). Research-based web design and usability guidelines. Washington, D.C.: Author.
U.S. Government Accountability Office, (1993). Educational achievement standards: NAGB's approach yields misleading interpretations (GAO/PEMD Publication No. 93-12). Washington, D.C.: Author.
Webb, N. L. (1999). Research monograph no. 18: Alignment of science and mathematics standards and assessments in four states. Washington, D.C.: Council of Chief State Schools Officers.
Webb, N. L. (1997). Research monograph no. 6: Criteria for alignment of expectations and assessments in mathematics and science education. Washington, D.C.: Council of Chief State Schools Officers.
WestEd (April, 2002). A comparison of NAEP content to reading, writing, and mathematics content standards for Arizona, California, Nevada, and Utah. San Francisco, Calif.: Author.
Wise, L. L., Becker, D. E., and Ramsberger, P. F. (July, 2003). Report on past NAEP problems. Alexandria, Va.: Human Resources Research Organization.
Wise, L. L., Le, H., Hoffman, R. G., and Becker, D. E. (2004). Final report. Technical report TR-04-05: Testing NAEP full population estimates for sensitivity to violation of assumptions. Alexandria, Va.: Human Resources Research Organization.
Yen, W. (1997). The technical quality of performance assessments: Standard errors of percents of pupils reaching standards. Educational Measurement: Issues and Practice, 16(3), 5–15.
Zumbo, B. D. (2007). Validity: Foundational issues and statistical methodology. In C. R. Rao and S. Sinharay (eds.) Handbook of Statistics, Vol. 26: Psychometrics, (pp. 45–79). Amsterdam, Netherlands: Elsevier Science B. V.
106

l E v a l u a t i o n o f N A E P F i n a l R e p o r t l
This page left intentionally blank
107

Appendix A: Glossary of acronyms and commonly used terms
AA—see Assessment Administrator
Achievement Level—category used in reporting assessment results of student performance based on scale scores. In NAEP, three achievement levels are used in reporting: Basic, Proficient, and Advanced.
Achievement Level Description/Descriptor (ALD)—the expected knowledge and skills of students categorized within each achievement level.
Achievement Level Standards—test performance expectations for specific achievement levels. The NAEP achievement level standards are typically set by NAGB based on recommendations derived from a standard-setting process that involves the judgment of expert panelists familiar with the content and target population of students being tested.
ADC—Assessment Design Committee of NAGB
Administration Accommodation—alterations to the administration procedures for students with disabilities or other limitations when such disabilities or limitations unfairly influence test performance. An example of an administration accommodation would be providing large print test materials for visually impaired test-takers.
AERA—American Educational Research Association (http://www.aera.net)
AIR—American Institutes for Research (http://www.air.org)
AIR-DC—American Institutes for Research, Washington, D.C., office
AIR-CA—American Institutes for Research, Palo Alto, Calif., office
ALD—see Achievement Level Descriptor
Alignment—degree of overlap between (a) the knowledge, skills, and expertise measured by a test (as indicated by the test items), and (b) the knowledge and skills included within the test content specifications. Alignment can also refer to the degree of consistency between more than one set of content specifications or more than one assessment.
APA—American Psychological Association (http://www.apa.org)
Assessment Administrator (AA)—individual who assists with the administration of NAEP in the schools.
109

Assessment Coordinator (AC)—individual responsible for coordinating the administration of NAEP including preparation of sites and materials for administration sites.
Assessment Framework—see Content Specifications
Assessment Mode—the format used to administer an assessment. Assessment modes include, but are not limited to, paper and pencil, computer-based (linear and adaptive), and performance assessments.
Background Variables—information about an examinee’s demographic and education background. In NAEP, this information is used to estimate an examinee’s scores on the assessment.
Backreading—a quality control procedure in scoring question responses whereby an experienced scorer supervisor checks the accuracy of assigned scores. In NAEP, scoring supervisors backread a small percentage of student responses to monitor scorer accuracy.
Backscoring—see Backreading
BIACO—Buros Institute for Assessment Consultation and Outreach (University of Nebraska, Lincoln) (http://www.unl.edu/buros)
Bias—see Item Bias
CCD—see Common Core of Data
CCSSO—Council of Chief State School Officers (http://www.ccsso.org)
CEA—Center for Educational Assessment (University of Massachusetts, Amherst) (http://www.umass.edu/remp)
Common Core of Data (CCD)—This program, part of NCES, collects annual data about all public schools (e.g., students and staff demographic data) and state education agencies across the United States.
Conditioning—a process used to incorporate information (see Background Variables) into the estimation of an examinee’s score on an assessment in addition to their responses to the test questions. In NAEP, background information provided by examinees is incorporated in the score estimation process.
Constructed Response Item—a test question which requires students to create (write) a response, versus selecting a response from among multiple alternatives.
Content Specifications—an outline or framework of the specific knowledge or ability domains which will be assessed by the test and the number and types of items that will represent each test domain
110

Contextual Variable Inference Map (C-VIM)—In NAEP, this is a system used by AIR-DC to understand the influence of background characteristics in test performance.
Contract Officer’s Representative (COR)—This individual represents the federal contract officer and advises on technical contract matters as well as serves as a liaison between the contractors and various stakeholders (ED, NCES, NAGB, external evaluators).
COR—see Contract Officer’s Representative
COSDAM—Committee on Study Design and Methodology of NAGB
C-VIM—see Contextual Variable Interference Map
DAC—NAGB Design and Analysis Committee
DIF—See Differential Item Functioning
Differential Item Functioning (DIF)—a difference in estimated difficulty of an item between two groups after controlling for any differences between the groups in subject-matter knowledge.
ED—U.S. Department of Education (http://www.ed.gov)
ELL—English language learner (see Limited English Proficiency)
Equating—the practice of relating test scores from two or more test forms that are built to the same content to make the test scores comparable. A popular equating design utilizes information gathered from a set of common items (also referred to as anchor items or an anchor test) that are administered to all students in order to establish linkage between test scores.
ESSI—Education Statistics Services Institute—provides technical support to NCES for non-NAEP work. (http://www.air.org/essi) See also NESSI. ETS—Educational Testing Service (http://www.ets.org)
Field testing—See Pilot Testing
Framework—See Content Specifications
GMRI—Government Micro Resources Inc. (http://www.gmri.com)
HumRRO—Human Resources Research Organization (http://www.humrro.org)
IDEA—Individuals with Disabilities Education Act
111

IEP—Individualized education program—these programs are created for students with disabilities and in NAEP, these are reviewed to determine if a student qualifies for an accommodation.
IES—Institute of Education Sciences, U. S. Department of Education (http://ies.ed.gov)
IMS—Integrated Management System—this system was created by GMRI as a way for the NAEP Alliance contractors to communicate with one another.
Inter-rater Agreement Reliability—the consistency (agreement) of scores or ratings given by two or more raters for the same set of responses.
IRT—See Item Response Theory
Item—a question included on the assessment which may be designed to collect demographic information (see Background Variables) or assess the knowledge, skills, or abilities of examinees.
Item Bias—item or test bias occurs when one group is unfairly disadvantaged based on a background or environmental characteristic that is unique to their group.
Item Pool—the group of test questions created for a testing program from which a test publisher/administrator will create a test form.
Item Response Theory (IRT)—a measurement model that mathematically defines the relationships between observed item responses (that examinees provide when taking a test) and one or multiple latent (i.e., not directly observable) traits (e.g., mathematics ability, U.S. history knowledge).
ITS—item tracking system
LEP—limited English proficiency (also known as English language learners [ELL])
Linking—the practice of relating scores from two different tests. Equating is a special (stringent) type of Linking.
Mapmark—a standard-setting methodology used to set cut scores for the 12th-grade NAEP for mathematics.
Matrix sampling—a process used to select a sample of items to be administered to examinees from an item pool that adequately covers the construct of interest. In a NAEP administration, examinees are only administered a portion of a full exam (e.g., fourth-grade mathematics exams). Examinees’ performance on the full exam is estimated based on background variables (e.g., math classes taken) and other NAEP data (e.g., how other students did on the other parts of the NAEP mathematics test).
112

NAEP—National Assessment of Educational Progress
NAEP Alliance—The group of contractors selected by NCES to carry out the development, administration, and scoring of NAEP under the coordination of the Educational Testing Service (ETS).
NAEP Consortium—Agencies, contractors, and organizations involved in the NAEP process that were of consideration for this evaluation.
NAGB—National Assessment Governing Board (http://www.nagb.org)
NCES—National Center for Education Statistics (http://nces.ed.gov)
NCLB—No Child Left Behind Act of 2001
NCME—National Council on Measurement in Education (http://www.ncme.org)
NESSI—NAEP–Educational Statistics Services Institute (formerly ESSI), provides technical support for NAEP-related work (http://www.air.org/essi) .
NRC—National Research Council (http://www.nas.edu/nrc)
NVS—NAEP Validity Studies Panel.
OMB—Office of Management and Budget of the U.S. government
Open ended Item—See Constructed Response Item
Operational Scoring—scoring of actual examinee item responses using scoring procedures determined during the test development process.
Oversampling—a sampling procedure that disproportionately selects a higher percentage of members from a subgroup than from other groups to be included in a sample. In NAEP, this procedure is used to achieve better precision in the ability estimates for small subgroups.
Parameter Estimate—a statistical quantity which is derived from a sample and is used to make an inference about a population. In NAEP this may refer to an estimate of ability for a particular group or performance on an item.
PEM—Pearson Educational Measurement (http://www.pearsonedmeasurement.com)
Performance Assessment—the measurement of intended knowledge and skills of students, which require students to engage in some type of activity. Performance assessments may include such tasks as writing, conducting a science experiment, or analysis of a portfolio of work.
113

Performance Standards—also referred to as achievement levels, these represent the expected performance of examinees on a measure to be classified within specific achievement levels. In NAEP, performance standards are set for classifying examinees into the Basic, Proficient, and Advanced achievement levels on each assessment.
PIL—Process Improvement Log—This log is maintained by HumRRO and includes the minutes from any meetings of the QCT and QAC to discuss specific issues.
Pilot Testing—part of the test construction process whereby the assessment is administered to a sample of examinees, prior to the operational administration, to assess the psychometric quality of test items. The results of pilot tests are used to develop the final test form.
PIRLS—Progress in International Reading Literacy Study (http://nces.ed.gov/surveys/pirls/)
PISA—Programme for International Student Assessment (http://www.pisa.oecd.org)
Principal Components Analysis—a statistical method that detects relationships within a group of variables in order to reduce a data set to a minimal number of variables. In NAEP, the background information gathered about examinees is reduced to a smaller number of variables using this process.
Psychometrics— the theory and techniques of educational and psychological testing. Psychometrics involves construction of appropriate assessments with the goal of providing valid and fair test score interpretations.
QAC—Quality Assurance Council—The QAC consists of representatives from NCES, the NAEP Alliance, and HumRRO. The purpose of QAC is to facilitate the discussion of quality matters, develop broad quality control policies and standards, and promote a highly functional cross-organizational atmosphere.
QAP—Quality Assurance Panel—This is an external panel whose members serve in an advisory role to HumRRO in their NAEP quality assurance responsibilities.
QC—quality control
QCT—See Quality Control Team
Quality Control Team (QCT)—The QCT consists of representatives from each Alliance member and HumRRO, who implement standards and policies articulated by QAC, coordinate quality control activities across the Alliance, develop tools and methods to address quality control issues, and inform QAC of critical quality control issues.
114

Reliability—the consistency of measurement. In educational assessment, reliability typically refers to internal consistency (consistency of items within an assessment) or test-retest reliability (consistency of test scores across repeated measurements). See also Inter-Rater Agreement Reliability.
Response Format—the mode in which examinees respond to an item. Common response formats include selection of the correct response among options and constructed response.
RFP—Request for Proposals
SAG—see Secondary Analysis Grants
Sample/Sampling—A sample is a subset of the target population (e.g., schools, students or items). Sampling is the process of selecting members of the population to be included in a sample. NAEP is administered to a sample of students from across the country.
Scale Score—A value representing an estimate of an examinee’s ability on some type of reporting scale. In NAEP, the score scale ranges from 0 to 500 for the fourth- and eighth-grade mathematics, for example. Scores on this scale are estimated based on how examinees respond to questions and NAEP Background Variables.
Scale stability—the degree to which values on a score scale possess the same meaning over time or across groups.
Scaling—the process of converting raw scores into equivalent values on an established reporting scale.
Score Equity—the consistency in score meaning across various contexts. In this evaluation, a special study was conducted to evaluate the score equity of NAEP scores across several states.
Scorer Calibration—the process by which human scorers are trained to assign scores in accordance with established scoring rubrics and procedures.
Scorer Drift—when a human scorer deviates over time from the scoring procedures established during Scorer Calibration.
Scoring Rubrics—guidelines used to evaluate student responses to a constructed-response item by specifying criteria for scoring that distinguish between possible score points (e.g., a one-point response versus a two-point response)
Secondary Analysis Grants (SAG)—this research program is run by NCES (priorities set by NAGB) and provides research funds to conduct studies with NAEP data.
SEM—see Standard Error of Measurement
115

SES—Socioeconomic Status—In NAEP, this is part of the information gathered through the Background Variables.
SOW—statement of work
Standard Deviation—a statistical value that describes the variance or dispersion of data points around a group average. Higher values indicate more variance in a dataset.
Standard Error of Measurement (SEM)—the degree of error associated with observed test scores. SEM is inversely related to test score reliability.
Standard-Setting—the process used to establish cutscores for an assessment. A cutscore is chosen to distinguish between adjacent achievement levels (e.g., Basic and Proficient, Proficient and Advanced).Methods of standard setting include, but are not limited to, the Mapmark method, Bookmark method, and Angoff.
Standards—Standards for Educational and Psychological Testing (AERA, APA, and NCME, 1999)
Statistical Power Analysis—a statistical procedure used to estimate the necessary sample size to achieve measurement precision or to enable the detection of a given effect in a research study (e.g., increase in student knowledge).
SWD—students with disabilities
Test Specifications—See Content Specifications
TIMSS—Trends in International Mathematics and Science Study
TOC—task order component
TOS—table of specifications
Trend Item—assessment items that appear in sequential NAEP that are maintained for the purposes of tracking any change in performance over time.
Trend Paper—examinee responses to open-ended questions that have appeared on sequential NAEP. To maintain the trend in NAEP, these responses must be score in same manner as on previous NAEP.
TUDA—Trial Urban District Assessment
TWG—Technical Work Group
Validity—the degree to which a test is measuring what it is intended to measure. Validity evidence can be gathered through appropriate processes or through research studies, and supports the meaningfulness of the test scores for the intended purpose(s) of the test.
116

Weights/weighting—Sample weights are values assigned to the score of an examinee (based on their subgroup membership) in estimation of the overall performance of a larger group. The value is chosen in such a way to reflect the proportion of the number of group members in the overall population.
117

This page left intentionally blank
118

Appendix B: Legislation authorizing the evaluation of NAEP
B1. Current Legislative Requirements for the Evaluation of NAEP
In Section 303 of the National Assessment of Educational Progress Authorization Act, Title 20, U.S.C.9622, Congress required an independent review of NAEP: “(f) REVIEW OF NATIONAL AND STATE ASSESSMENTS—
(1) REVIEW—
IN GENERAL—The Secretary shall provide for continuing review of any assessment authorized under this section, and student achievement levels, by one or more professional assessment evaluation organizations.
(B) ISSUES ADDRESSED—Such continuing review shall address–(i) whether any authorized assessment is properly administered, produces
high quality data that are valid and reliable, is consistent with relevant widely accepted professional assessment standards, and produces data on student achievement that are not otherwise available to the State (other than data comparing participating States to each other and the Nation);
(ii) whether student achievement levels are reasonable, valid, reliable, and informative to the public;
(iii) whether any authorized assessment is being administered as a random sample and is reporting trends in academic achievement in a valid and reliable manner in the subject areas being assessed;
(iv) whether any of the test questions are biased, as described in section 412(e)(4); and whether the appropriate authorized assessments are measuring, consistent with this section, reading ability and mathematical knowledge.
"(2) REPORT—The Secretary shall report to the Committee on Education and the Workforce of the House of Representatives and the Committee on Health, Education, Labor, and Pensions of the Senate, the President, and the Nation on the findings and recommendations of such reviews.
"(3) USE OF FINDINGS AND RECOMMENDATIONS—The Commissioner and the National Assessment Governing Board shall consider the findings and recommendations of such reviews in designing the competition to select the organization, or organizations, through which the Commissioner carries out the National Assessment.”
119
B.2. Prior Legislative Requirements for the Evaluation of NAEP
The No Child Left Behind legislative language expands upon the 1994 legislative language mandating the prior evaluation:
“(f) REVIEW OF NATIONAL AND STATE ASSESSMENTS(1) IN GENERAL—
(A) The Secretary shall provide for continuing review of the National Assessments, State assessments, and student performance levels, by one or more nationally recognized evaluation organizations, such as the National Academy of Education and the National Academy of Sciences.
(B) Such continuing review shall address–(i) whether each developmental State assessment is properly
administered, produces high quality data that are valid and reliable, and produces data on student achievement that are not otherwise available to the State (other than data comparing participating States to each other and the Nation); and
(ii) whether student achievement levels are reasonable, valid, reliable, and informative to the public.
B.3. Legislative Requirements for the Review of Performance Levels
In addition, recent legislation requires the Commissioner of Education Statistics to rely upon the evaluation for his determination of whether or not the achievement levels are “reasonable, valid, and informative to the public.” Until that determination is made, the law requires the Commissioner and the Board to state the trial status of the achievement levels in all NAEP reports.
120

Appendix C
Technical Work Group (TWG) members and evaluation contractors
Technical Work Group
As a critical component of the evaluation, we convened a Technical Work Group (TWG) comprised of nationally known experts from state assessment, higher education, and research organizations. TWG members operate independently of the Department of Education and may be called upon to provide feedback for ongoing evaluation activities in addition to reviewing reports.
Members include:
Jamal Abedi Director of Technical Projects,National Center for Research on Evaluation, Standards and Student Testing (CRESST), University of California, Los Angeles; Professor of Education, University of California, Davis
Jeri Benson Professor and Associate Dean for Academic Affairs, University of Florida
John Dossey Distinguished University Professor of Mathematics, Illinois State University (Emeritus)
Stephen N. Elliott Professor of Special Education and Dunn Family Chair in Educational and Psychological Assessment, Vanderbilt University
Michael T. Kane Director of Research, National Conference of Bar Examiners
Suzanne Lane Professor, University of Pittsburgh (TWG Co-chair)
Robert L. Linn Distinguished Professor of Education, University of Colorado, Boulder (Emeritus)
Cindy Paredes-Ziker Glendale (Ariz.) Public Schools (former Arizona NAEP State Coordinator)
Michael Rodriguez Associate Professor of Measurement and Evaluation,University of Minnesota
121

Gregg Schraw Professor, University of Nevada, Las Vegas
Jean Slattery Director Benchmarking Initiative, ACHIEVE, Inc.
Veronica Thomas Professor, Howard University
Joe Willhoft Assistant Superintendent for Assessment and Research,Washington Office of Superintendent of Public Instruction
Bruno Zumbo Professor, University of British Columbia, Canada (TWG Co-chair)
These individuals represent expertise in psychometrics, sampling, statistics, educational research, evaluation, and educational policy. Representatives from the Department of Education, National Assessment Governing Board and the National Center for Education Statistics are also invited to TWG meetings as observers and to clarify questions as necessary.
Buros Institute for Assessment Consultation and Outreach
The Buros name has been associated with the evaluation of tests since 1938 when Oscar Buros published the first Mental Measurements Yearbook. That, and subsequent Yearbooks, published independent, critically candid reviews of commercially available tests. Since Buros’s death in 1978, his work has continued at the University of Nebraska, Lincoln, at the Buros Institute of Mental Measurement (BIMM). Recognizing the broader scope of testing, the Oscar and Luella Buros Center for Testing was created in 1994 to expand the focus from commercially available tests to all tests. The mission of the center is to improve the science and practice of psychometrics. Buros continues to serve as an independent monitor of the testing industry and does not engage in test development to avoid conflicts of interest. Barbara S. Plake was the director of the Buros Institute of Mental Measurements. When the center was formed she assumed the leadership role of the center and also retained her position as director of BIMM.
To better reflect the expanded role of the Center, a new institute was established called the Buros Institute for Assessment Consultation and Outreach (BIACO). BIACO focuses on proprietary tests and testing programs like NAEP and was directed by Chad W. Buckendahl at time this project.24 In addition to Plake who retired from Buros in 2006 and Buckendahl, James Impara who also retired from Buros in 2006, Susan Davis, and Brett Foley were employed as professional staff. BIACO also employs 4–5 advanced
24 After October 2007, work on the project by Buckendahl and Davis occurred as employees of Alpine Testing Solutions.
122

doctoral students in measurement and statistics that assist project leaders as needed. Combined, staff members have decades of experience in testing and evaluation. The Buros Center for Testing is housed in and affiliated with the Department of Educational Psychology at the University of Nebraska, Lincoln, and contains a quantitative, qualitative, and psychometric methods program.
Center for Educational Assessment
The Center for Educational Assessment (formerly the Laboratory of Psychometric and Evaluative Research) in the School of Education at the University of Massachusetts, Amherst, consists of four faculty members and several affiliated faculty members from the Departments of Psychology and Sociology and the School of Education. Since 1974, faculty members and graduate students have produced extensive research in the areas of criterion-referenced measurement, item response theory and applications, cross-lingual assessment, computer-based testing, large-scale assessments, detection of differentially functioning test items, item banking, standard-setting, assessment development, and advances in Bayesian statistical theory and practice. Over 500 research reports on psychometric and statistical topics have been produced by the center since 1974.
The center has conducted assessment research and training for the National Center for Education Statistics (NCES), Graduate Management Admissions Council (GMAC), Law School Admissions Council (LSAC), the U.S. Air Force and Army, National Science Foundation, National Assessment Governing Board (NAGB), International Institute for Research, Educational Testing Service (ETS), American College Testing Program (now ACT), American Institute for Certified Public Accountants (AICPA), Microsoft, Corp., Harcourt Educational Measurement, and the Departments of Education in Massachusetts, Connecticut, New York, and New Jersey. It is recognized nationally and internationally for leading edge psychometric research and evaluation. Since 1999, the center has conducted annual comprehensive evaluations of the Massachusetts Comprehensive Assessment System, including analyses of differential item functioning and equating of tests across time. Professors Ronald Hambleton and Stephen Sireci direct the center. Professor Lisa Keller is the assistant director. Professor Craig Wells and April Zenisky are also affiliated with the center.
123