Embed Size (px)
Citation preview
Evaluation of Magnesium Intake and Its Relationwith Bone Quality in Healthy Young Korean Women
Mi-Hyun Kim & Jee-Young Yeon & Mi-Kyeong Choi &Yun Jung Bae
Received: 23 January 2011 /Accepted: 17 March 2011 /Published online: 5 April 2011# Springer Science+Business Media, LLC 2011
Abstract Many studies have reported magnesium’s role in nutrition as a vital factorinvolved in bone health. However, not enough studies have evaluated magnesium (Mg)intakes in young women. In this study, we evaluated Mg intake in healthy adults and itsrelation with bone quality. A total of 484 healthy young women in their early 20s wereenrolled into the study. Anthropometric measurements, dietary intake survey using 3-daydietary records, and the bone quality of the calcaneus using quantitative ultrasounds wereobtained and analyzed. Average age, height, and weight of the subjects were respectively20.20 years, 161.37 cm, and 54.09 kg, respectively. Also, the average broadband ultrasoundattenuation, speed of sound (SOS), stiffness index (SI), and calcaneus T scores were114.32 dB/MHz, 1,568.45 m/s, 95.23, and 0.36 g/cm2, respectively. The subject’s averageintake of energy was 1,543.19 kcal, and the average Mg intake was 185.87 mg/day. Mgintake per 1,000 kcal of consumed energy in our subjects was 119.85 mg. Subjectsconsumed 63.11% of the recommended intake for Mg. Food groups consumed with highMg content in our subjects included cereals (38.62 mg), vegetables (36.97 mg), milk(16.82 mg), legumes (16.72 mg), and fish (16.50 mg). The level of Mg intake per1,000 kcal showed significant correlation to the SOS in the calcaneus (r=0.110, p<0.05)after adjustment for age, BMI, and percent body fat. In addition, the intakes of Mg frompotatoes (p<0.001), legumes (p<0.05), and fungi and mushrooms (p<0.05) positivelycorrelated with the SOS of the calcaneus. In conclusion, the magnesium intake status ofyoung Korean women aged 19–25 years is unsatisfactory. Improving dietary intake of Mgmay positively impact bone quality in this population.
Biol Trace Elem Res (2011) 144:109–117DOI 10.1007/s12011-011-9044-7
M.-H. KimDepartment of Food and Nutrition, Kangwon National University, Gangwon-do 245-711, South Korea
J.-Y. YeonDepartment of Food and Nutrition, Sookmyung Women’s University, Seoul 140-742, South Korea
M.-K. ChoiDepartment of Food and Nutrition, Kongju National University, Chungnam 340-702, South Korea
Y. J. Bae (*)Department of Food and Nutritional Sciences, Hanbuk University, Gyeonggi-do 483-120, South Koreae-mail: [email protected]
Keywords Magnesium intake . Bone quality . Young women
Introduction
Magnesium (Mg) is a major mineral that exists in the human body at a level ofapproximately 25 g. Of the total Mg stores in our bodies, 50–60% exists in the skeletalstructure, approximately 30% is contained in intracellular fluid, and approximately 1%exists in the extracellular fluid [1]. In particular, Mg that exists inside the human body takespart in the formation of the skeletal structure. Therefore, magnesium’s role with regard tobone quality and nutrition is very important.
Dietary Mg deficiency has been implicated as a risk factor for osteoporosis [2]. Toba andcolleagues reported that Mg supplementation of ovariectomized (OVX) rats promoted boneformation by activating osteoblasts and prevented bone resorption by inactivatingosteoclasts [3]. Previous research has also shown the effects of Mg supplementation onbone turnover suppression in postmenopausal women [4]. It was reported that a positiveeffect of Mg supplementation on hip bone mineral content (BMC) was evident in peri-adolescent girls [5]. However, previous studies regarding Mg supplementation and bonehealth are mostly about postmenopausal women or OVX animal models, both of whichhave high risk for osteoporosis. In addition, there are not many studies reporting the effectsof Mg on early adult stage women, which is when the bone mass stage peaks.
Magnesium, as a constituent of chlorophyll, is contained in large quantities of green leafyvegetables. Mg in nuts, legumes, and cereals are sufficiently high, while it is relatively low inmeats, fish, milk, and fat [6, 7]. Mainly centered on plant foods, the Korean traditional dietappears to have sufficient Mg content. However, it is reported that due to a westernized diet,intake of fat and animal foods have increased while the intake of plant food has decreased.Given these findings, the evaluation of current Mg intake in Koreans is important.
In the Dietary Reference Intakes (DRI) for Koreans, the recommended intake (RI) and theestimated average requirement (EAR) of Mg for females aged ≥19 years more are set as 280 and235 mg/day, respectively [8]. Dietary Mg intake evaluation studies have reported that the dailyMg intake was 259.1 mg for 139 adult females aged 30–94 years [6]. In our previous study, wealso reported that the daily Mg intake was 232.1 mg for females aged 19–29 years, 246.5 mgfor 30–49 years, and 245.7 mg for 50–64 years. [9]. As such, some studies report that dailyMg intakes are not sufficient compared to the recommended intakes. In addition, there havenot been enough studies conducted on young Korean females. Considering the importance ofMg on bone’s functionality, a study on Mg intake and its effect on bone health in early adultstage women while they are nearing their peak bone mass stage is paramount. Accordingly, thegoal of this study is to assess Mg intake in early adult stage women and examine itsrelationship on bone quality.
Materials and Methods
Subjects
After sufficiently explaining the objectives and details of the study and then obtainingagreements for participation in the survey, dietary intake surveys were conducted on 484healthy females aged 19–25 years who had not taken any medications or nutritionalsupplements.
110 Kim et al.
Anthropometric and Bone Quality Measurements
Height was measured using a height measuring instrument on which the individual subjectstood without shoes. Weight and percent body fat were measured using InBody (Biospace,Seoul, Korea) with subjects dressed in light clothing. Body mass index (BMI) wascalculated as body weight in kilograms divided by height in meters squared. Then, usingquantitative ultrasound (Lunar Achilles Insight, GE Healthcare, WI, USA), broadbandultrasound attenuation (BUA), speed of sound (SOS), stiffness index (SI), and T score incalcaneus were measured.
Dietary Intake Survey
Dietary intake survey was conducted based on using a dietary record method. Subjectswere asked to keep non-consecutive 3-day dietary records and to include one weekendday or holiday. Also, subjects were asked to provide detailed descriptions of each food,including the weights prepared and proportions consumed. Results of the dietary intakesurvey were analyzed in terms of nutrient intakes using Can-Pro 3.0 (Korean NutritionSociety). Mg intakes were calculated using Mg contents databases produced byprevious studies [6] and the food composition table of the National Rural Living ScienceInstitute, Korea [10].
Statistical Analysis
For all results obtained by this test, mean and standard deviation values were calculatedusing SAS program (version 9.1, SAS Institute, Cary, NC, USA). For correlation among thefactors, significance was verified by Spearman’s correlation coefficient. Student’s t test wasused to determine the individual group difference at α=0.05. All statistical significanceverifications were conducted at the level of p<0.05.
Results
General Characteristics
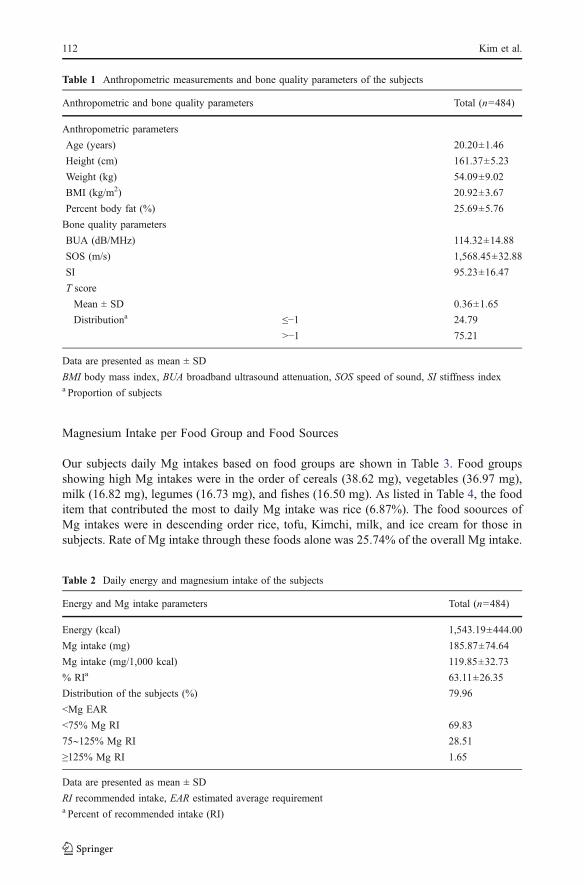
Results of anthropometric measurements and bone quality of the subjects are shown inTables 1. Average age, height, and weight of the subjects were 20.20 years, 161.37 cm, and54.09 kg, respectively. Their BMI was 20.92 kg/m2, and the percent body fat was 25.69%.BUA, SOS, and SI of the calcaneus were 114.32 dB/MHz, 1568.45 m/s, and 95.23,respectively. The T score of the calcaneus was 0.36 g/cm2. The proportion of osteopeniaand osteoporosis in subjects (T score≤−1) was 24.79%.
Energy and Magnesium Intakes
The results of average daily nutrient intake of the subjects are shown in Table 2.Energy and Mg intake per day were 1543.19 kcal and 185.87 mg/day, respectively. Mgintake per 1,000 kcal of consumed energy in subjects was 119.85 mg. Subjects consumed63.11% of the Korean RI for Mg. The percentage of subjects whose Mg intake was lessthan 75% of the RI was 69.83%. Approximately 79.96% of the subjects had Mg intakeslower than the EAR.
Magnesium Intake and Bone Quality in Young Korean Women 111
Magnesium Intake per Food Group and Food Sources
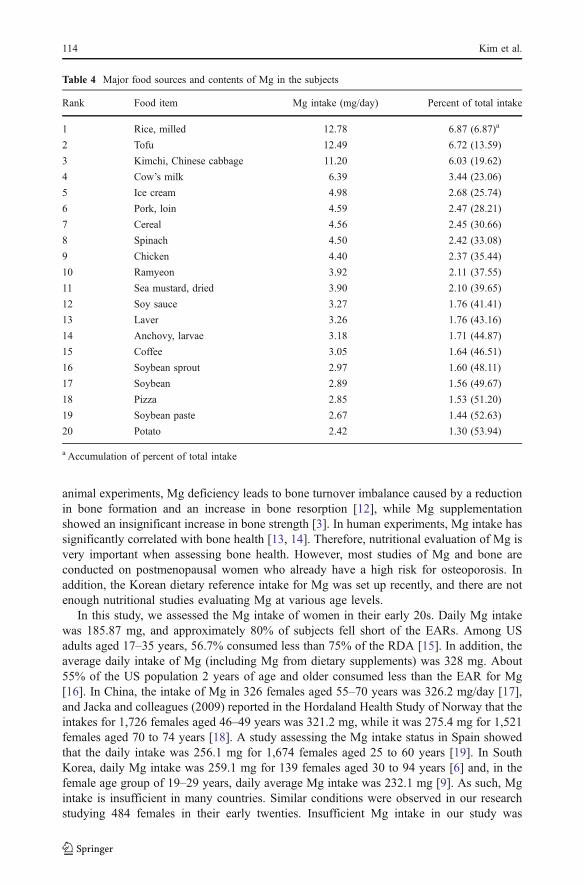
Our subjects daily Mg intakes based on food groups are shown in Table 3. Food groupsshowing high Mg intakes were in the order of cereals (38.62 mg), vegetables (36.97 mg),milk (16.82 mg), legumes (16.73 mg), and fishes (16.50 mg). As listed in Table 4, the fooditem that contributed the most to daily Mg intake was rice (6.87%). The food soources ofMg intakes were in descending order rice, tofu, Kimchi, milk, and ice cream for those insubjects. Rate of Mg intake through these foods alone was 25.74% of the overall Mg intake.
Table 2 Daily energy and magnesium intake of the subjects
Energy and Mg intake parameters Total (n=484)
Energy (kcal) 1,543.19±444.00
Mg intake (mg) 185.87±74.64
Mg intake (mg/1,000 kcal) 119.85±32.73
% RIa 63.11±26.35
Distribution of the subjects (%) 79.96
<Mg EAR
<75% Mg RI 69.83
75∼125% Mg RI 28.51
≥125% Mg RI 1.65
Data are presented as mean ± SD
RI recommended intake, EAR estimated average requirementa Percent of recommended intake (RI)
Table 1 Anthropometric measurements and bone quality parameters of the subjects
Anthropometric and bone quality parameters Total (n=484)
Anthropometric parameters
Age (years) 20.20±1.46
Height (cm) 161.37±5.23
Weight (kg) 54.09±9.02
BMI (kg/m2) 20.92±3.67
Percent body fat (%) 25.69±5.76
Bone quality parameters
BUA (dB/MHz) 114.32±14.88
SOS (m/s) 1,568.45±32.88
SI 95.23±16.47
T score
Mean ± SD 0.36±1.65
Distributiona ≤−1 24.79
>−1 75.21
Data are presented as mean ± SD
BMI body mass index, BUA broadband ultrasound attenuation, SOS speed of sound, SI stiffness indexa Proportion of subjects
112 Kim et al.
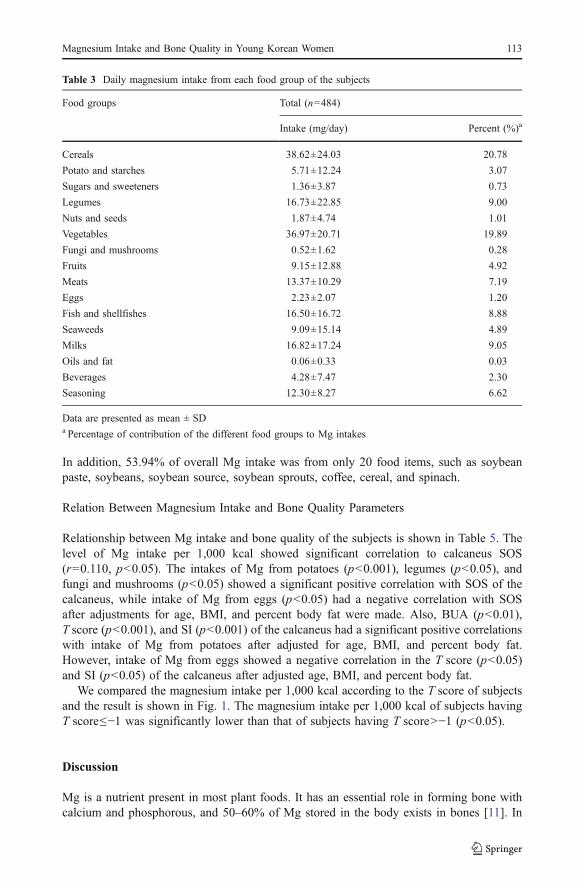
In addition, 53.94% of overall Mg intake was from only 20 food items, such as soybeanpaste, soybeans, soybean source, soybean sprouts, coffee, cereal, and spinach.
Relation Between Magnesium Intake and Bone Quality Parameters
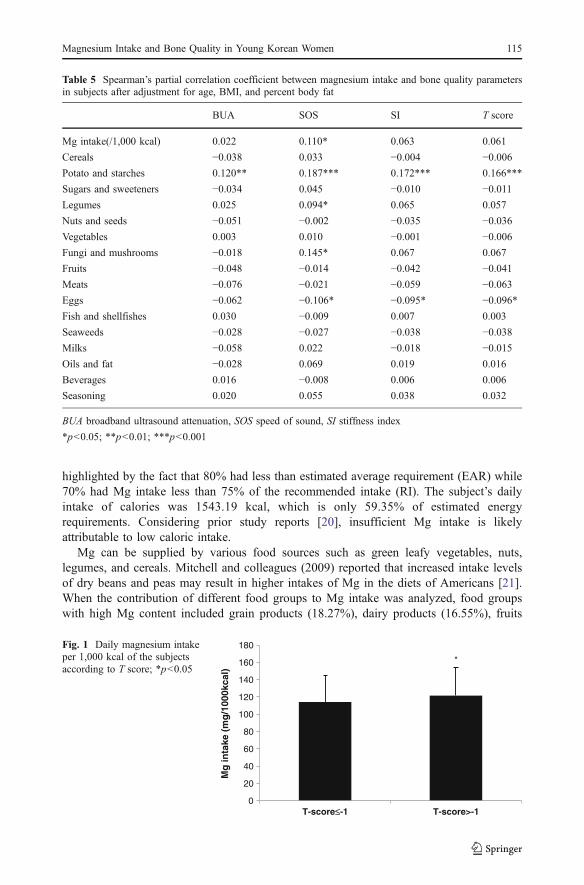
Relationship between Mg intake and bone quality of the subjects is shown in Table 5. Thelevel of Mg intake per 1,000 kcal showed significant correlation to calcaneus SOS(r=0.110, p<0.05). The intakes of Mg from potatoes (p<0.001), legumes (p<0.05), andfungi and mushrooms (p<0.05) showed a significant positive correlation with SOS of thecalcaneus, while intake of Mg from eggs (p<0.05) had a negative correlation with SOSafter adjustments for age, BMI, and percent body fat were made. Also, BUA (p<0.01),T score (p<0.001), and SI (p<0.001) of the calcaneus had a significant positive correlationswith intake of Mg from potatoes after adjusted for age, BMI, and percent body fat.However, intake of Mg from eggs showed a negative correlation in the T score (p<0.05)and SI (p<0.05) of the calcaneus after adjusted age, BMI, and percent body fat.
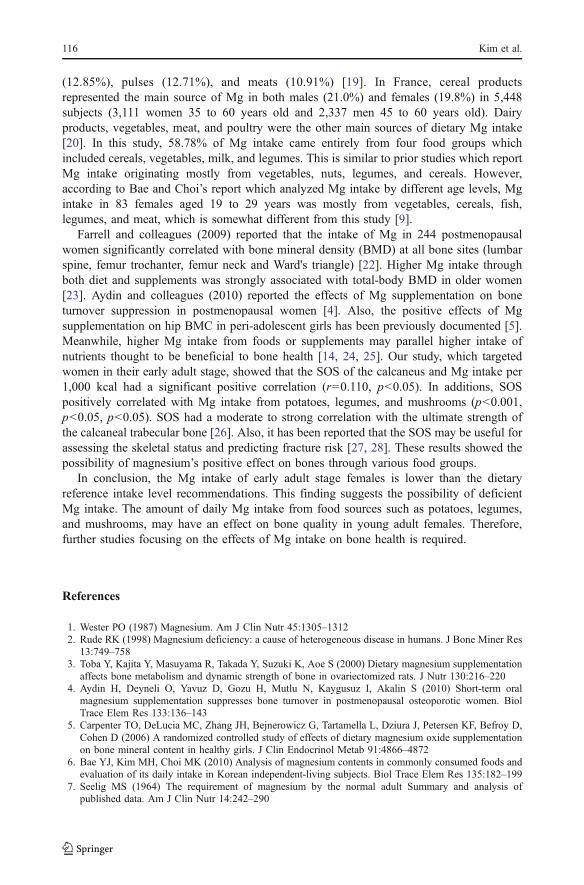
We compared the magnesium intake per 1,000 kcal according to the T score of subjectsand the result is shown in Fig. 1. The magnesium intake per 1,000 kcal of subjects havingT score≤−1 was significantly lower than that of subjects having T score>−1 (p<0.05).
Discussion
Mg is a nutrient present in most plant foods. It has an essential role in forming bone withcalcium and phosphorous, and 50–60% of Mg stored in the body exists in bones [11]. In
Table 3 Daily magnesium intake from each food group of the subjects
Food groups Total (n=484)
Intake (mg/day) Percent (%)a
Cereals 38.62±24.03 20.78
Potato and starches 5.71±12.24 3.07
Sugars and sweeteners 1.36±3.87 0.73
Legumes 16.73±22.85 9.00
Nuts and seeds 1.87±4.74 1.01
Vegetables 36.97±20.71 19.89
Fungi and mushrooms 0.52±1.62 0.28
Fruits 9.15±12.88 4.92
Meats 13.37±10.29 7.19
Eggs 2.23±2.07 1.20
Fish and shellfishes 16.50±16.72 8.88
Seaweeds 9.09±15.14 4.89
Milks 16.82±17.24 9.05
Oils and fat 0.06±0.33 0.03
Beverages 4.28±7.47 2.30
Seasoning 12.30±8.27 6.62
Data are presented as mean ± SDa Percentage of contribution of the different food groups to Mg intakes
Magnesium Intake and Bone Quality in Young Korean Women 113
animal experiments, Mg deficiency leads to bone turnover imbalance caused by a reductionin bone formation and an increase in bone resorption [12], while Mg supplementationshowed an insignificant increase in bone strength [3]. In human experiments, Mg intake hassignificantly correlated with bone health [13, 14]. Therefore, nutritional evaluation of Mg isvery important when assessing bone health. However, most studies of Mg and bone areconducted on postmenopausal women who already have a high risk for osteoporosis. Inaddition, the Korean dietary reference intake for Mg was set up recently, and there are notenough nutritional studies evaluating Mg at various age levels.
In this study, we assessed the Mg intake of women in their early 20s. Daily Mg intakewas 185.87 mg, and approximately 80% of subjects fell short of the EARs. Among USadults aged 17–35 years, 56.7% consumed less than 75% of the RDA [15]. In addition, theaverage daily intake of Mg (including Mg from dietary supplements) was 328 mg. About55% of the US population 2 years of age and older consumed less than the EAR for Mg[16]. In China, the intake of Mg in 326 females aged 55–70 years was 326.2 mg/day [17],and Jacka and colleagues (2009) reported in the Hordaland Health Study of Norway that theintakes for 1,726 females aged 46–49 years was 321.2 mg, while it was 275.4 mg for 1,521females aged 70 to 74 years [18]. A study assessing the Mg intake status in Spain showedthat the daily intake was 256.1 mg for 1,674 females aged 25 to 60 years [19]. In SouthKorea, daily Mg intake was 259.1 mg for 139 females aged 30 to 94 years [6] and, in thefemale age group of 19–29 years, daily average Mg intake was 232.1 mg [9]. As such, Mgintake is insufficient in many countries. Similar conditions were observed in our researchstudying 484 females in their early twenties. Insufficient Mg intake in our study was
Table 4 Major food sources and contents of Mg in the subjects
Rank Food item Mg intake (mg/day) Percent of total intake
1 Rice, milled 12.78 6.87 (6.87)a
2 Tofu 12.49 6.72 (13.59)
3 Kimchi, Chinese cabbage 11.20 6.03 (19.62)
4 Cow’s milk 6.39 3.44 (23.06)
5 Ice cream 4.98 2.68 (25.74)
6 Pork, loin 4.59 2.47 (28.21)
7 Cereal 4.56 2.45 (30.66)
8 Spinach 4.50 2.42 (33.08)
9 Chicken 4.40 2.37 (35.44)
10 Ramyeon 3.92 2.11 (37.55)
11 Sea mustard, dried 3.90 2.10 (39.65)
12 Soy sauce 3.27 1.76 (41.41)
13 Laver 3.26 1.76 (43.16)
14 Anchovy, larvae 3.18 1.71 (44.87)
15 Coffee 3.05 1.64 (46.51)
16 Soybean sprout 2.97 1.60 (48.11)
17 Soybean 2.89 1.56 (49.67)
18 Pizza 2.85 1.53 (51.20)
19 Soybean paste 2.67 1.44 (52.63)
20 Potato 2.42 1.30 (53.94)
a Accumulation of percent of total intake
114 Kim et al.
highlighted by the fact that 80% had less than estimated average requirement (EAR) while70% had Mg intake less than 75% of the recommended intake (RI). The subject’s dailyintake of calories was 1543.19 kcal, which is only 59.35% of estimated energyrequirements. Considering prior study reports [20], insufficient Mg intake is likelyattributable to low caloric intake.
Mg can be supplied by various food sources such as green leafy vegetables, nuts,legumes, and cereals. Mitchell and colleagues (2009) reported that increased intake levelsof dry beans and peas may result in higher intakes of Mg in the diets of Americans [21].When the contribution of different food groups to Mg intake was analyzed, food groupswith high Mg content included grain products (18.27%), dairy products (16.55%), fruits
Table 5 Spearman’s partial correlation coefficient between magnesium intake and bone quality parametersin subjects after adjustment for age, BMI, and percent body fat
BUA SOS SI T score
Mg intake(/1,000 kcal) 0.022 0.110* 0.063 0.061
Cereals −0.038 0.033 −0.004 −0.006Potato and starches 0.120** 0.187*** 0.172*** 0.166***
Sugars and sweeteners −0.034 0.045 −0.010 −0.011Legumes 0.025 0.094* 0.065 0.057
Nuts and seeds −0.051 −0.002 −0.035 −0.036Vegetables 0.003 0.010 −0.001 −0.006Fungi and mushrooms −0.018 0.145* 0.067 0.067
Fruits −0.048 −0.014 −0.042 −0.041Meats −0.076 −0.021 −0.059 −0.063Eggs −0.062 −0.106* −0.095* −0.096*Fish and shellfishes 0.030 −0.009 0.007 0.003
Seaweeds −0.028 −0.027 −0.038 −0.038Milks −0.058 0.022 −0.018 −0.015Oils and fat −0.028 0.069 0.019 0.016
Beverages 0.016 −0.008 0.006 0.006
Seasoning 0.020 0.055 0.038 0.032
BUA broadband ultrasound attenuation, SOS speed of sound, SI stiffness index
*p<0.05; **p<0.01; ***p<0.001
*
0
20
40
60
80
100
120
140
160
180
T-score≤-1 T-score>-1
Mg
inta
ke (
mg
/100
0kca
l)
Fig. 1 Daily magnesium intakeper 1,000 kcal of the subjectsaccording to T score; *p<0.05
Magnesium Intake and Bone Quality in Young Korean Women 115
(12.85%), pulses (12.71%), and meats (10.91%) [19]. In France, cereal productsrepresented the main source of Mg in both males (21.0%) and females (19.8%) in 5,448subjects (3,111 women 35 to 60 years old and 2,337 men 45 to 60 years old). Dairyproducts, vegetables, meat, and poultry were the other main sources of dietary Mg intake[20]. In this study, 58.78% of Mg intake came entirely from four food groups whichincluded cereals, vegetables, milk, and legumes. This is similar to prior studies which reportMg intake originating mostly from vegetables, nuts, legumes, and cereals. However,according to Bae and Choi’s report which analyzed Mg intake by different age levels, Mgintake in 83 females aged 19 to 29 years was mostly from vegetables, cereals, fish,legumes, and meat, which is somewhat different from this study [9].
Farrell and colleagues (2009) reported that the intake of Mg in 244 postmenopausalwomen significantly correlated with bone mineral density (BMD) at all bone sites (lumbarspine, femur trochanter, femur neck and Ward's triangle) [22]. Higher Mg intake throughboth diet and supplements was strongly associated with total-body BMD in older women[23]. Aydin and colleagues (2010) reported the effects of Mg supplementation on boneturnover suppression in postmenopausal women [4]. Also, the positive effects of Mgsupplementation on hip BMC in peri-adolescent girls has been previously documented [5].Meanwhile, higher Mg intake from foods or supplements may parallel higher intake ofnutrients thought to be beneficial to bone health [14, 24, 25]. Our study, which targetedwomen in their early adult stage, showed that the SOS of the calcaneus and Mg intake per1,000 kcal had a significant positive correlation (r=0.110, p<0.05). In additions, SOSpositively correlated with Mg intake from potatoes, legumes, and mushrooms (p<0.001,p<0.05, p<0.05). SOS had a moderate to strong correlation with the ultimate strength ofthe calcaneal trabecular bone [26]. Also, it has been reported that the SOS may be useful forassessing the skeletal status and predicting fracture risk [27, 28]. These results showed thepossibility of magnesium’s positive effect on bones through various food groups.
In conclusion, the Mg intake of early adult stage females is lower than the dietaryreference intake level recommendations. This finding suggests the possibility of deficientMg intake. The amount of daily Mg intake from food sources such as potatoes, legumes,and mushrooms, may have an effect on bone quality in young adult females. Therefore,further studies focusing on the effects of Mg intake on bone health is required.
References
1. Wester PO (1987) Magnesium. Am J Clin Nutr 45:1305–13122. Rude RK (1998) Magnesium deficiency: a cause of heterogeneous disease in humans. J Bone Miner Res
13:749–7583. Toba Y, Kajita Y, Masuyama R, Takada Y, Suzuki K, Aoe S (2000) Dietary magnesium supplementation
affects bone metabolism and dynamic strength of bone in ovariectomized rats. J Nutr 130:216–2204. Aydin H, Deyneli O, Yavuz D, Gozu H, Mutlu N, Kaygusuz I, Akalin S (2010) Short-term oral
magnesium supplementation suppresses bone turnover in postmenopausal osteoporotic women. BiolTrace Elem Res 133:136–143
5. Carpenter TO, DeLucia MC, Zhang JH, Bejnerowicz G, Tartamella L, Dziura J, Petersen KF, Befroy D,Cohen D (2006) A randomized controlled study of effects of dietary magnesium oxide supplementationon bone mineral content in healthy girls. J Clin Endocrinol Metab 91:4866–4872
6. Bae YJ, Kim MH, Choi MK (2010) Analysis of magnesium contents in commonly consumed foods andevaluation of its daily intake in Korean independent-living subjects. Biol Trace Elem Res 135:182–199
7. Seelig MS (1964) The requirement of magnesium by the normal adult Summary and analysis ofpublished data. Am J Clin Nutr 14:242–290
116 Kim et al.
8. The Korean Nutrition Society (2010) Dietary reference intake for Koreans. The Korean NutritionSociety, Seoul
9. Bae YJ, Choi MK (2010) Magnesium intake and its relevance with antioxidant capacity in Koreanadults. Biol Trace Elem Res. doi:10.1007/s12011-010-8883-y
10. Institute National Rural Resources Development, Administration RD (2006) Food composition tables,7th edn. Hyoil, Seoul
11. Wallach S (1990) Effects of magnesium on skeletal metabolism. Magnes Trace Elem 9:1–1412. Rude RK, Gruber HE, Wei LY, Frausto A, Mills BG (2003) Magnesium deficiency: effect on bone and
mineral metabolism in the mouse. Calcif Tissue Int 72:32–4113. Ilich JZ, Cvijetic S, Baric IC, Cecic I, Saric M, Crncevic-Orlic Z, Blanusa M, Korsic M (2009) Nutrition
and lifestyle in relation to bone health and body weight in Croatian postmenopausal women. Int J FoodSci Nutr 60:319–332
14. New SA, Robins SP, Campbell MK, Martin JC, Garton MJ, Bolton-Smith C, Grubb DA, Lee SJ, ReidDM (2000) Dietary influences on bone mass and bone metabolism: further evidence of a positive linkbetween fruit and vegetable consumption and bone health? Am J Clin Nutr 71:142–151
15. King DE, Mainous AG III, Geesey ME, Woolson RF (2005) Dietary magnesium and C-reactive proteinlevels. J Am Coll Nutr 24:166–171
16. Nicklas TA, O'Neil CE, Fulgoni VL III (2009) The role of dairy in meeting the recommendations forshortfall nutrients in the American diet. J Am Coll Nutr 28:73S–81S
17. Li Y, Ma A, Sun Y, Liang H, Wang Q, Yi X, Han X (2009) Magnesium status and dietary intake of mid-old people in a rural area of China. Magnes Res 22:66–71
18. Jacka FN, Overland S, Stewart R, Tell GS, Bjelland I, Mykletun A (2009) Association betweenmagnesium intake and depression and anxiety in community-dwelling adults: the Hordaland HealthStudy. Aust N Z J Psychiatry 43:45–52
19. Mataix J, Aranda P, Lopez-Jurado M, Sanchez C, Planells E, Llopis J (2006) Factors influencing the intakeand plasma levels of calcium, phosphorus and magnesium in southern Spain. Eur J Nutr 45:349–354
20. Galan P, Preziosi P, Durlach V, Valeix P, Ribas L, Bouzid D, Favier A, Hercberg S (1997) Dietarymagnesium intake in a French adult population. Magnes Res 10:321–328
21. Mitchell DC, Lawrence FR, Hartman TJ, Curran JM (2009) Consumption of dry beans, peas, and lentilscould improve diet quality in the US population. J Am Diet Assoc 109:909–913
22. Farrell VA, Harris M, Lohman TG, Going SB, Thomson CA, Weber JL, Houtkooper LB (2009)Comparison between dietary assessment methods for determining associations between nutrient intakesand bone mineral density in postmenopausal women. J Am Diet Assoc 109:899–904
23. Ryder KM, Shorr RI, Bush AJ, Kritchevsky SB, Harris T, Stone K, Cauley J, Tylavsky FA (2005)Magnesium intake from food and supplements is associated with bone mineral density in healthy olderwhite subjects. J Am Geriatr Soc 53:1875–1880
24. Macdonald HM, New SA, Golden MH, Campbell MK, Reid DM (2004) Nutritional associations withbone loss during the menopausal transition: evidence of a beneficial effect of calcium, alcohol, and fruitand vegetable nutrients and of a detrimental effect of fatty acids. Am J Clin Nutr 79:155–165
25. Tucker KL, Hannan MT, Chen H, Cupples LA, Wilson PW, Kiel DP (1999) Potassium, magnesium, andfruit and vegetable intakes are associated with greater bone mineral density in elderly men and women.Am J Clin Nutr 69:727–736
26. Bouxsein ML, Radloff SE (1997) Quantitative ultrasound of the calcaneus reflects the mechanicalproperties of calcaneal trabecular bone. J Bone Miner Res 12:839–846
27. Hans D, Dargent-Molina P, Schott AM, Sebert JL, Cormier C, Kotzki PO, Delmas PD, Pouilles JM,Breart G, Meunier PJ (1996) Ultrasonographic heel measurements to predict hip fracture in elderlywomen: the EPIDOS prospective study. Lancet 348:511–514
28. Schott AM, Weill-Engerer S, Hans D, Duboeuf F, Delmas PD, Meunier PJ (1995) Ultrasounddiscriminates patients with hip fracture equally well as dual energy X-ray absorptiometry andindependently of bone mineral density. J Bone Miner Res 10:243–249
Magnesium Intake and Bone Quality in Young Korean Women 117