Embed Size (px)
Citation preview
Paper # 070FR-0171
Topic: Fire
8th
U. S. National Combustion Meeting
Organized by the Western States Section of the Combustion Institute
and hosted by the University of Utah
May 19-22, 2013
Evaluation of Low-Gravity Smoke Particulate for Spacecraft Fire
Detection
David Urban1, Gary Ruff
1, George Mulholland
2, Marit Meyer
1, Zeng guang Yuan
4,
Thomas Cleary3, Jiann Yang
3, Paul Greenberg
1, Victoria Bryg
4
1NASA Glenn Research Center, Cleveland, OH 2University of Maryland, College Park, MD
3National Institute of Standards and Technology, Gaithersburg, MD 4National Center for Space Exploration Research, Cleveland, OH
Tests were conducted on the International Space Station (ISS) to evaluate the smoke particulate size from materials
and conditions that are typical of those expected in spacecraft fires. Five different materials representative of those
found in spacecraft (Teflon, Kapton, cotton, silicone rubber and Pyrell) were heated to temperatures below the ignition
point with conditions controlled to provide repeatable sample surface temperatures and air flow. The air flow past the
sample during the heating period ranged from quiescent to 8 cm/s. The effective transport time to the measurement
instruments was varied from 11 to 800 seconds to simulate different smoke transport conditions in spacecraft. The
resultant aerosol was evaluated by three instruments which measured different moments of the particle size distribution.
These moment diagnostics were used to determine the particle number concentration (zeroth moment), the diameter
concentration (first moment), and the mass concentration (third moment). These statistics were combined to determine
the diameter of average mass and the count mean diameter and by assuming a log-normal distribution, the geometric
mean diameter and the geometric standard deviations were also calculated. Smoke particle samples were collected on
TEM grids using a thermal precipitator for post flight analysis. The TEM grids were analyzed to determine the particle
morphology and shape parameters. The different materials produced particles with significantly different morphologies.
Overall the majority of the average smoke particle sizes were found to be in the 200 to 400 nanometer range with the
quiescent cases and the cases with increased transport time typically producing with substantially larger particles. The
results varied between materials but the smoke particles produced in low gravity were approximately the same size as
particles produced in normal gravity. These results can be used to establish design requirements for future spacecraft
smoke detectors.
1. Introduction
Owing to the absence of low-gravity test data, spacecraft smoke detector systems for the ISS and the Space Shuttle
were designed based the properties of normal gravity smoke particulate and available technology at the time. To
improve the reliability of future spacecraft smoke detectors, it is necessary to obtain knowledge of both the expected
signature of the events to be detected and the background levels of the measured parameters. Terrestrial fire detection
systems have been developed based on extensive study of terrestrial fires [Bukowski, 1978 and 2003]. There are a
number of factors that can be expected to affect the particle size distribution of the smoke from spacecraft fires. The
absence of buoyant flow in low-gravity increases the residence time in microgravity fires and increases the transit time
from the reaction zone to the detector [Brooker et al., 2007]. Microgravity fires have been found to have radically
different structure from their normal-gravity (a.k.a. 1-g) counterparts. The limited options available to respond to a
spacecraft fire increase the importance of early detection. Finally the materials used in spacecraft are different from
typical terrestrial applications where smoke properties were previously evaluated. All of these effects could be expected
to change the smoke particle size distribution. The objective of this work was to make sufficient measurements of smoke
from spacecraft fires to enable improved design of future detectors.
Smoke Background
Prior spacecraft fire detection systems have been discussed in detail in papers by Friedman and Urban [Friedman,
1992, Urban et al., 2005]. In the Mercury, Gemini and Apollo missions, the crew quarters were limited and mission
durations were short, consequently the mission design depended upon the crew to detect fires. The Skylab module,
however, included approximately 30 UV-sensing fire detectors [Friedman, 1992]. These devices were limited to line-of-
2
sight and were reported to have difficulties with false alarms. The Space Shuttle Detectors were based upon ionization
fire detector technology, the most advanced technology available at the time and used an inertial separator designed to
eliminate particles larger than 1-2 micrometers. The International Space Station (ISS) smoke detectors use near-IR
forward scattering, rendering them most sensitive to particles larger than a micrometer, outside of the range of sensitivity
of the shuttle detector. As described by Friedman [1992] there were six overheat and failed component events in the
NASA Orbiter fleet during its operational lifetime in addition to several similar incidents that have occurred on the ISS.
None of these events spread into a real fire but as mission durations increase, the likelihood of failures increases. The
experience on Mir in 1997 has shown that failure of oxygen generation systems can have significant consequences. As a
result, improved understanding of spacecraft fire detection is critically needed [Ruff, Urban and King, 2005]. Smoke is a
general term that encompasses aerosol materials produced by a number of processes. In particular it can include
unburned, recondensed, original polymer or pyrolysis products that can be either liquid or solid, hydrocarbon soot,
condensed water vapor, and ash particles. Soot particles dominate the smoke particulate in established flaming fires
while unburned pyrolysis products and recondensed polymer fragments are produced by smoldering and pyrolysis in the
early stage of fire growth. Given the constrained space on any spacecraft, the target for the fire detection system is
necessarily the early phase and not established flaming fires; consequently, the primary target for detection is the
pyrolysis products and not the soot.
Previous work on smoke particles from low-gravity sources by Urban et al. [2005] and Ku et al. [1995] found that
the soot particulate produced by low-gravity flames tend to have larger particles than in normal gravity. Preliminary
tests in the 2.2 second drop tower [Srivastava et al., 1998] suggest that particulate generated by overheated wire
insulation may be larger in low-g than in 1-g. Particles collected on Transmission Electron Microscope (TEM) grids
place downstream of the polyethylene flame [Greenberg, Sacksteder and Kashiwagi, 1995] as well as visual observation
of long string-like aggregates, further support this suggestion. Results from the CSD (Comparative Soot Diagnostics)
Experiment [Urban et al., 2005], which studied smoke properties in low-gravity from several spacecraft materials
suggested that liquid smoke particles could achieve sizes larger than 1 µm while solid particulate remained in the sub-
micrometer range. However, the CSD experiment did not produce sufficient data concerning the size of the liquid smoke
particles to guide detector design. The combined impact of these limited results and theoretical predictions is that, as
opposed to extrapolation from 1-g data, direct knowledge of low-g combustion particulate is needed for more confident
design of smoke detectors for spacecraft.
2. Methods
To address the limited data from the prior experiment concerning the likely size of spacecraft smoke particulate,
another experiment was developed: the Smoke Aerosol Measurement Experiment (SAME). The SAME experiment
sought to avoid the problems experienced by the CSD experiment by obtaining the particulate size statistics on-orbit with
a reduced dependence upon sample return to Earth. This is challenging because existing aerosol instrumentation is
typically large, incompatible with spacecraft experiment constraints, and some systems require substantial sample return
to Earth. As will be described below, an alternative approach was employed that used three discrete instruments to
measure separate moments of the size distribution. When combined, these moments provide useful aggregate statistics
of the size distribution. The measurements were made using smoke generated by overheated spacecraft materials in
much the same manner as the CSD experiment however the sample temperature, flow field, and particle aging time were
more rigorously controlled in the SAME experiment. The experiment flew twice the first time in 2007 (SAME-1) and
the second (SAME-2) in 2010. When discussion applies to both flights, this paper will refer to “SAME.” If the
discussion is specific to a particular flight, the flight number will be identified e.g. “SAME-2.”
Moment Method
The approach used by the SAME experiment is termed the „moment method‟ for convenience [Cleary, Weinert and
Mulholland, 2003]. As will be described below, the approach consists of measuring three moments of the size
distribution (zeroth, first and third) and using the properties of the log-normal distribution to estimate the geometric
mean diameter and the standard deviation.
The average particle size and an estimate of the width of the size distribution will be estimated from various moments
of the size distribution. The number distribution, fN(D), is defined as
dD
dNDfN )( (1)
where dN is the number of particles per cm3 with diameter between D and D + dD. The moments of interest consist of
the number concentration, M0, the first moment M1, and the volume or mass concentration moment, M3 and are defined
as
3
dDDfDM N
i
i )( 3,1,0i (2)
When i=0, the zeroth moment of the distribution, M0, equation (2) is simply the number of particles per unit
volume. In the SAME experiment, this was measured using a condensation nuclei counter. The first moment, i=1, can
also be thought of as the “diameter concentration” or integrated diameter per unit volume and is approximately
proportional to the ionization detector moment (signal). For particles in the Mie scattering regime, particles sizes from
0.3 to about 3 (~0.2 μm to 2.0 μm for a red laser), the light scattering signal is approximately proportional to the third
moment, i=3. From these moments, and a measurement of M0 using a condensation nuclei counter, two mean diameters
can be computed: the count (arithmetic) mean diameter D0.5 or D , which is equal to M1/M0 and the diameter of average
mass D1.5 orm
D , which is equal to (M3/M0)1/3
. These calculations do not depend on the assumption of log-normal
behavior. (The basis for the subscript naming convention for D0.5 and D1.5 will be discussed later). The log-normal size
distribution is widely used for describing the size distribution of aerosols including non-flaming smoke because for most
aerosols; the bulk of the number concentration is associated with smaller particles [Raabe, 1971, Reist, 1984]. The
number distribution fN(D) for the lognormal distribution is expressed as follows:
g
g
g
tN
DD
D
NDf
2
2
2/1 ln2
lnlnexp
ln)2()( (3)
where Nt is the total number concentration of the aerosol (=M0), and Dg and g are the geometric mean diameter
and geometric standard deviation defined by
0 0
/)(lnln dDfdDDDfD NNg (4)
(5)
For the log-normal distribution, one finds that the various diameter definitions given above are related to the
geometric mean diameter, Dg, via the equation [Raabe, 1971, Reist, 1984].
)lnexp( 2
ggp pDD (6)
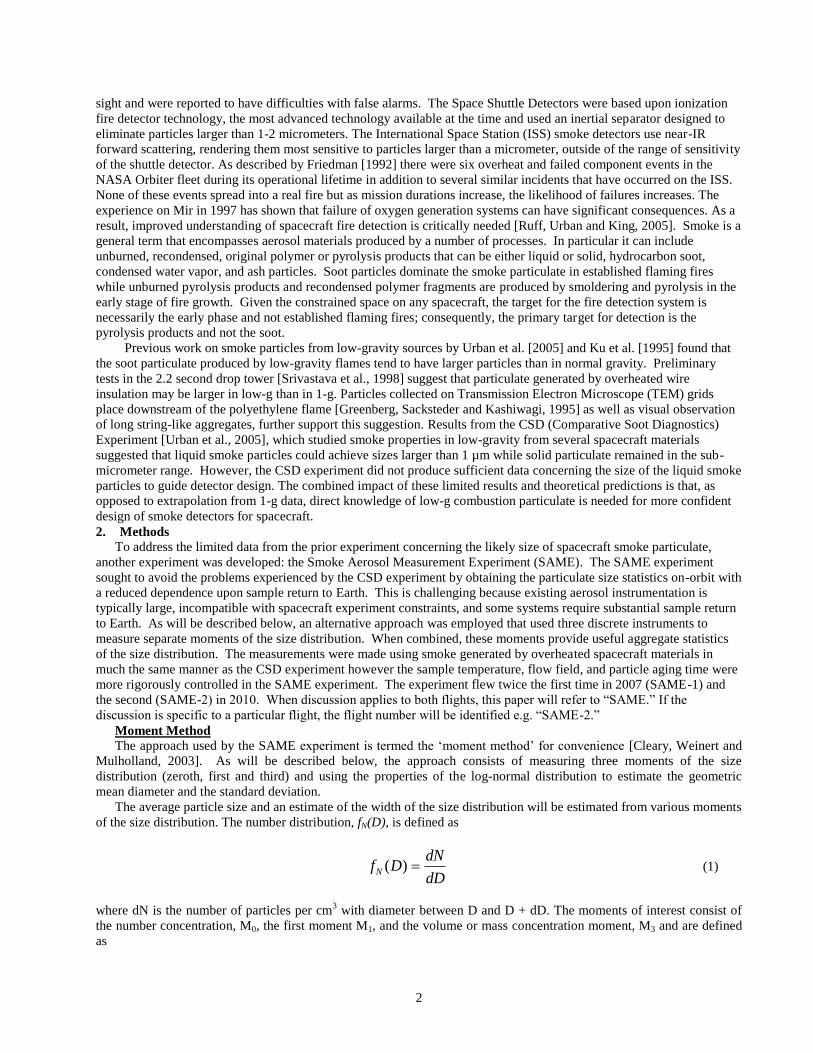
For the count mean diameter, D0.5, and the diameter of average mass, D1.5, the corresponding values of p are 0.5 and
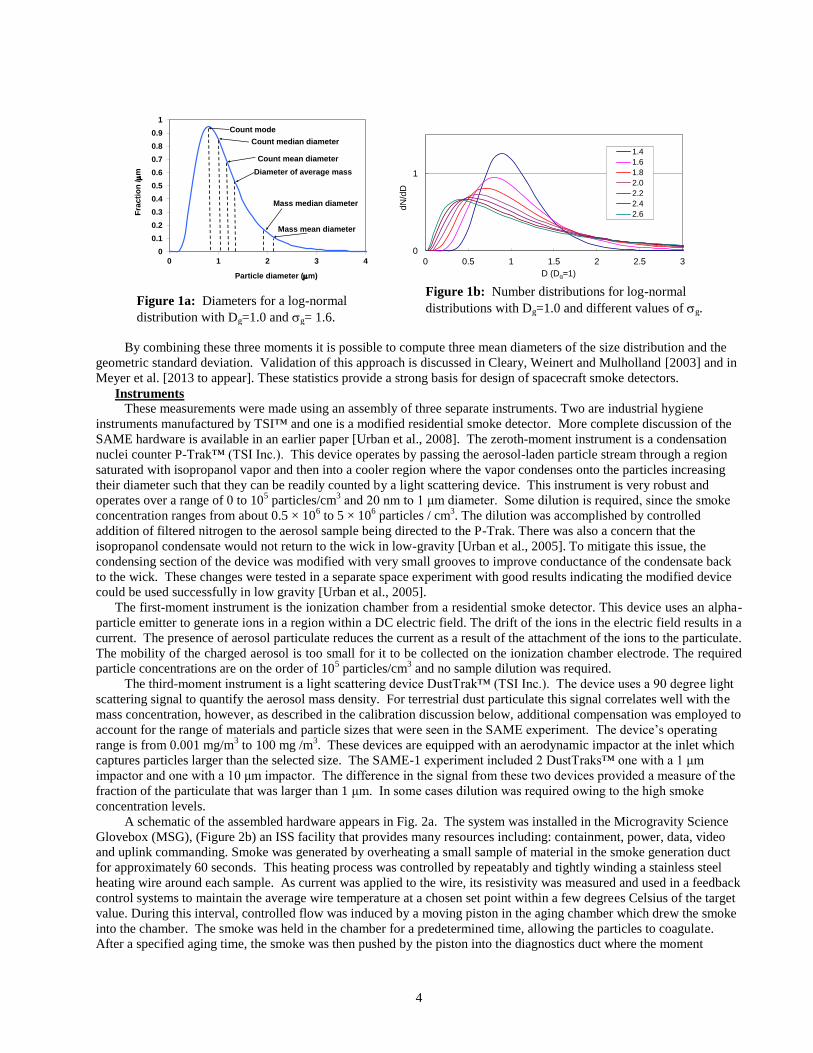
1.5. Fig. 1a. shows a typical log-normal distribution for a Dg=1.0 and g= 1.6 and Figure 1b. shows the influence of g.
For this distribution, the corresponding values of D0.5 and D1.5 are1.17 m and 1.39 m, respectively. Using equation (6),
one can relate g to the ratio of D1.5 and D0.5 via the equation:
2/1
5.05.1 )/ln(exp DDg (7)
2/1
0 0
2 )(/)()ln(lnln
dDDfdDDfDD NNgg
4
By combining these three moments it is possible to compute three mean diameters of the size distribution and the
geometric standard deviation. Validation of this approach is discussed in Cleary, Weinert and Mulholland [2003] and in
Meyer et al. [2013 to appear]. These statistics provide a strong basis for design of spacecraft smoke detectors.
Instruments
These measurements were made using an assembly of three separate instruments. Two are industrial hygiene
instruments manufactured by TSI™ and one is a modified residential smoke detector. More complete discussion of the
SAME hardware is available in an earlier paper [Urban et al., 2008]. The zeroth-moment instrument is a condensation
nuclei counter P-Trak™ (TSI Inc.). This device operates by passing the aerosol-laden particle stream through a region
saturated with isopropanol vapor and then into a cooler region where the vapor condenses onto the particles increasing
their diameter such that they can be readily counted by a light scattering device. This instrument is very robust and
operates over a range of 0 to 105 particles/cm
3 and 20 nm to 1 μm diameter. Some dilution is required, since the smoke
concentration ranges from about 0.5 × 10⁶ to 5 × 10
6 particles / cm
3. The dilution was accomplished by controlled
addition of filtered nitrogen to the aerosol sample being directed to the P-Trak. There was also a concern that the
isopropanol condensate would not return to the wick in low-gravity [Urban et al., 2005]. To mitigate this issue, the
condensing section of the device was modified with very small grooves to improve conductance of the condensate back
to the wick. These changes were tested in a separate space experiment with good results indicating the modified device
could be used successfully in low gravity [Urban et al., 2005].
The first-moment instrument is the ionization chamber from a residential smoke detector. This device uses an alpha-
particle emitter to generate ions in a region within a DC electric field. The drift of the ions in the electric field results in a
current. The presence of aerosol particulate reduces the current as a result of the attachment of the ions to the particulate.
The mobility of the charged aerosol is too small for it to be collected on the ionization chamber electrode. The required
particle concentrations are on the order of 105 particles/cm
3 and no sample dilution was required.
The third-moment instrument is a light scattering device DustTrak™ (TSI Inc.). The device uses a 90 degree light
scattering signal to quantify the aerosol mass density. For terrestrial dust particulate this signal correlates well with the
mass concentration, however, as described in the calibration discussion below, additional compensation was employed to
account for the range of materials and particle sizes that were seen in the SAME experiment. The device‟s operating
range is from 0.001 mg/m3 to 100 mg /m
3. These devices are equipped with an aerodynamic impactor at the inlet which
captures particles larger than the selected size. The SAME-1 experiment included 2 DustTraks™ one with a 1 μm
impactor and one with a 10 μm impactor. The difference in the signal from these two devices provided a measure of the
fraction of the particulate that was larger than 1 μm. In some cases dilution was required owing to the high smoke
concentration levels.
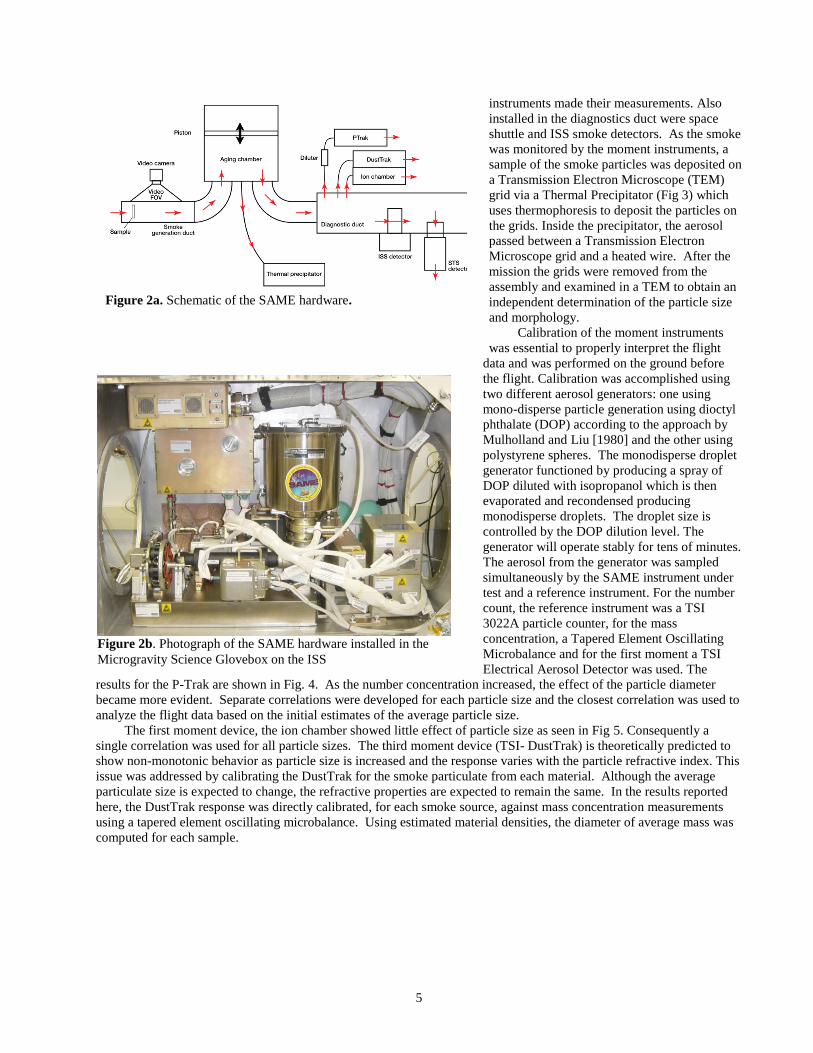
A schematic of the assembled hardware appears in Fig. 2a. The system was installed in the Microgravity Science
Glovebox (MSG), (Figure 2b) an ISS facility that provides many resources including: containment, power, data, video
and uplink commanding. Smoke was generated by overheating a small sample of material in the smoke generation duct
for approximately 60 seconds. This heating process was controlled by repeatably and tightly winding a stainless steel
heating wire around each sample. As current was applied to the wire, its resistivity was measured and used in a feedback
control systems to maintain the average wire temperature at a chosen set point within a few degrees Celsius of the target
value. During this interval, controlled flow was induced by a moving piston in the aging chamber which drew the smoke
into the chamber. The smoke was held in the chamber for a predetermined time, allowing the particles to coagulate.
After a specified aging time, the smoke was then pushed by the piston into the diagnostics duct where the moment
0
0.1
0.2
0.3
0.4
0.5
0.6
0.7
0.8
0.9
1
0 1 2 3 4
Fra
cti
on
/
m
Particle diameter (m)
Count mode
Count mean diameter
Count median diameter
Diameter of average mass
Mass mean diameter
Mass median diameter
0
1
0 0.5 1 1.5 2 2.5 3
dN
/dD
D (Dg=1)
1.4
1.6
1.8
2.0
2.2
2.4
2.6
Figure 1b: Number distributions for log-normal
distributions with Dg=1.0 and different values of g. Figure 1a: Diameters for a log-normal
distribution with Dg=1.0 and g= 1.6.
5
instruments made their measurements. Also
installed in the diagnostics duct were space
shuttle and ISS smoke detectors. As the smoke
was monitored by the moment instruments, a
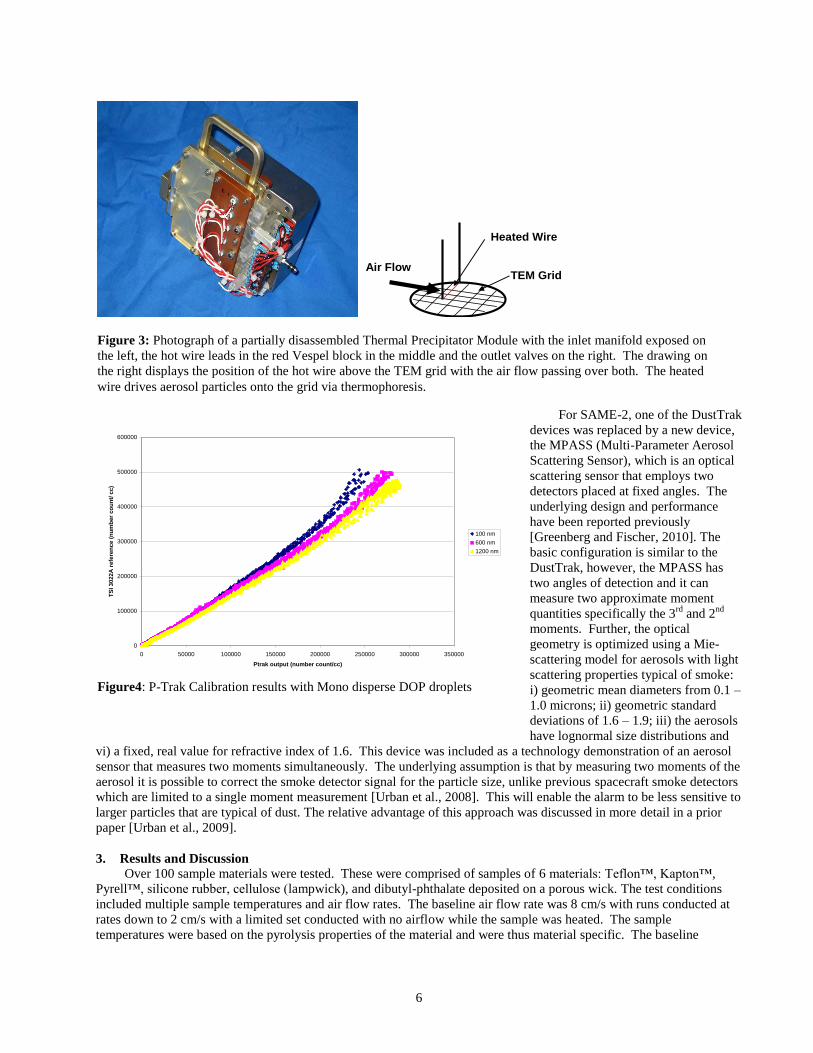
sample of the smoke particles was deposited on
a Transmission Electron Microscope (TEM)
grid via a Thermal Precipitator (Fig 3) which
uses thermophoresis to deposit the particles on
the grids. Inside the precipitator, the aerosol
passed between a Transmission Electron
Microscope grid and a heated wire. After the
mission the grids were removed from the
assembly and examined in a TEM to obtain an
independent determination of the particle size
and morphology.
Calibration of the moment instruments
was essential to properly interpret the flight
data and was performed on the ground before
the flight. Calibration was accomplished using
two different aerosol generators: one using
mono-disperse particle generation using dioctyl
phthalate (DOP) according to the approach by
Mulholland and Liu [1980] and the other using
polystyrene spheres. The monodisperse droplet
generator functioned by producing a spray of
DOP diluted with isopropanol which is then
evaporated and recondensed producing
monodisperse droplets. The droplet size is
controlled by the DOP dilution level. The
generator will operate stably for tens of minutes.
The aerosol from the generator was sampled
simultaneously by the SAME instrument under
test and a reference instrument. For the number
count, the reference instrument was a TSI
3022A particle counter, for the mass
concentration, a Tapered Element Oscillating
Microbalance and for the first moment a TSI
Electrical Aerosol Detector was used. The
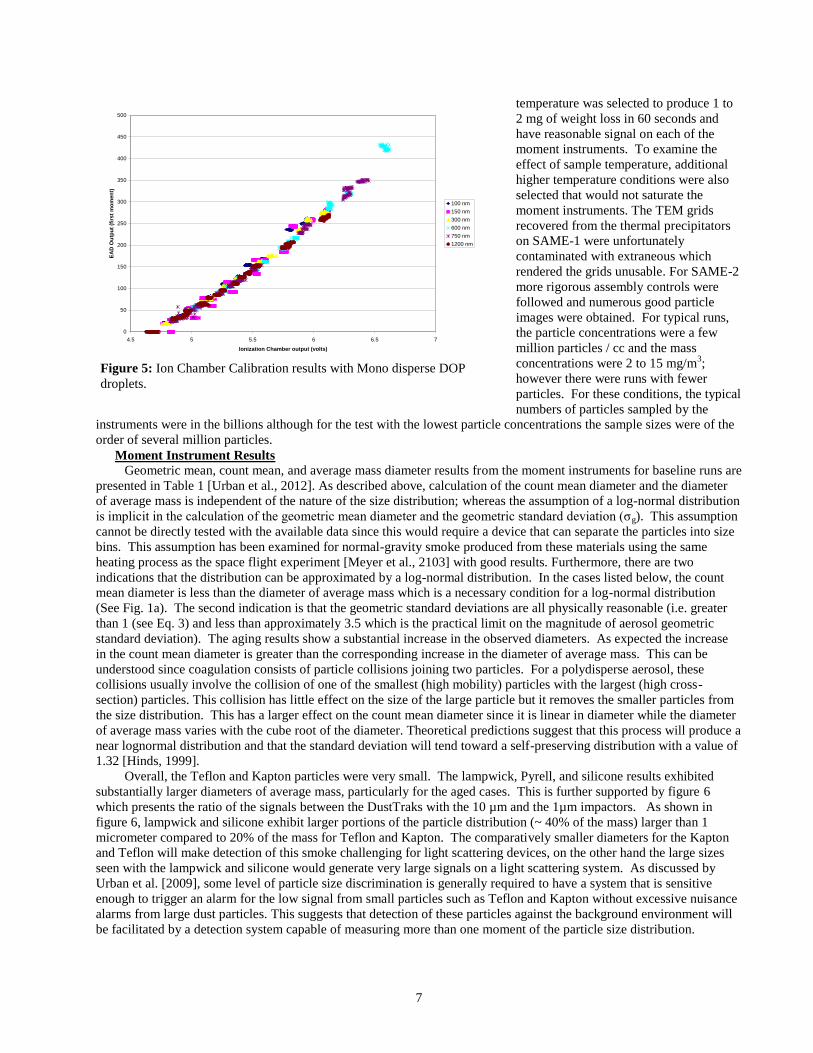
results for the P-Trak are shown in Fig. 4. As the number concentration increased, the effect of the particle diameter
became more evident. Separate correlations were developed for each particle size and the closest correlation was used to
analyze the flight data based on the initial estimates of the average particle size.
The first moment device, the ion chamber showed little effect of particle size as seen in Fig 5. Consequently a
single correlation was used for all particle sizes. The third moment device (TSI- DustTrak) is theoretically predicted to
show non-monotonic behavior as particle size is increased and the response varies with the particle refractive index. This
issue was addressed by calibrating the DustTrak for the smoke particulate from each material. Although the average
particulate size is expected to change, the refractive properties are expected to remain the same. In the results reported
here, the DustTrak response was directly calibrated, for each smoke source, against mass concentration measurements
using a tapered element oscillating microbalance. Using estimated material densities, the diameter of average mass was
computed for each sample.
Figure 2a. Schematic of the SAME hardware.
Figure 2b. Photograph of the SAME hardware installed in the
Microgravity Science Glovebox on the ISS
6
For SAME-2, one of the DustTrak
devices was replaced by a new device,
the MPASS (Multi-Parameter Aerosol
Scattering Sensor), which is an optical
scattering sensor that employs two
detectors placed at fixed angles. The
underlying design and performance
have been reported previously
[Greenberg and Fischer, 2010]. The
basic configuration is similar to the
DustTrak, however, the MPASS has
two angles of detection and it can
measure two approximate moment
quantities specifically the 3rd
and 2nd
moments. Further, the optical
geometry is optimized using a Mie-
scattering model for aerosols with light
scattering properties typical of smoke:
i) geometric mean diameters from 0.1 –
1.0 microns; ii) geometric standard
deviations of 1.6 – 1.9; iii) the aerosols
have lognormal size distributions and
vi) a fixed, real value for refractive index of 1.6. This device was included as a technology demonstration of an aerosol
sensor that measures two moments simultaneously. The underlying assumption is that by measuring two moments of the
aerosol it is possible to correct the smoke detector signal for the particle size, unlike previous spacecraft smoke detectors
which are limited to a single moment measurement [Urban et al., 2008]. This will enable the alarm to be less sensitive to
larger particles that are typical of dust. The relative advantage of this approach was discussed in more detail in a prior
paper [Urban et al., 2009].
3. Results and Discussion
Over 100 sample materials were tested. These were comprised of samples of 6 materials: Teflon™, Kapton™,
Pyrell™, silicone rubber, cellulose (lampwick), and dibutyl-phthalate deposited on a porous wick. The test conditions
included multiple sample temperatures and air flow rates. The baseline air flow rate was 8 cm/s with runs conducted at
rates down to 2 cm/s with a limited set conducted with no airflow while the sample was heated. The sample
temperatures were based on the pyrolysis properties of the material and were thus material specific. The baseline
Figure 3: Photograph of a partially disassembled Thermal Precipitator Module with the inlet manifold exposed on
the left, the hot wire leads in the red Vespel block in the middle and the outlet valves on the right. The drawing on
the right displays the position of the hot wire above the TEM grid with the air flow passing over both. The heated
wire drives aerosol particles onto the grid via thermophoresis.
Heated Wire
TEM Grid Air Flow
Figure4: P-Trak Calibration results with Mono disperse DOP droplets
0
100000
200000
300000
400000
500000
600000
0 50000 100000 150000 200000 250000 300000 350000
Ptrak output (number count/cc)
TS
I 3
02
2A
re
fere
nc
e (
nu
mb
er
co
un
t/ c
c)
100 nm
600 nm
1200 nm
7
temperature was selected to produce 1 to
2 mg of weight loss in 60 seconds and
have reasonable signal on each of the
moment instruments. To examine the
effect of sample temperature, additional
higher temperature conditions were also
selected that would not saturate the
moment instruments. The TEM grids
recovered from the thermal precipitators
on SAME-1 were unfortunately
contaminated with extraneous which
rendered the grids unusable. For SAME-2
more rigorous assembly controls were
followed and numerous good particle
images were obtained. For typical runs,
the particle concentrations were a few
million particles / cc and the mass
concentrations were 2 to 15 mg/m3;
however there were runs with fewer
particles. For these conditions, the typical
numbers of particles sampled by the
instruments were in the billions although for the test with the lowest particle concentrations the sample sizes were of the
order of several million particles.
Moment Instrument Results
Geometric mean, count mean, and average mass diameter results from the moment instruments for baseline runs are
presented in Table 1 [Urban et al., 2012]. As described above, calculation of the count mean diameter and the diameter
of average mass is independent of the nature of the size distribution; whereas the assumption of a log-normal distribution
is implicit in the calculation of the geometric mean diameter and the geometric standard deviation (σg). This assumption
cannot be directly tested with the available data since this would require a device that can separate the particles into size
bins. This assumption has been examined for normal-gravity smoke produced from these materials using the same
heating process as the space flight experiment [Meyer et al., 2103] with good results. Furthermore, there are two
indications that the distribution can be approximated by a log-normal distribution. In the cases listed below, the count
mean diameter is less than the diameter of average mass which is a necessary condition for a log-normal distribution
(See Fig. 1a). The second indication is that the geometric standard deviations are all physically reasonable (i.e. greater
than 1 (see Eq. 3) and less than approximately 3.5 which is the practical limit on the magnitude of aerosol geometric
standard deviation). The aging results show a substantial increase in the observed diameters. As expected the increase
in the count mean diameter is greater than the corresponding increase in the diameter of average mass. This can be
understood since coagulation consists of particle collisions joining two particles. For a polydisperse aerosol, these
collisions usually involve the collision of one of the smallest (high mobility) particles with the largest (high cross-
section) particles. This collision has little effect on the size of the large particle but it removes the smaller particles from
the size distribution. This has a larger effect on the count mean diameter since it is linear in diameter while the diameter
of average mass varies with the cube root of the diameter. Theoretical predictions suggest that this process will produce a
near lognormal distribution and that the standard deviation will tend toward a self-preserving distribution with a value of
1.32 [Hinds, 1999].
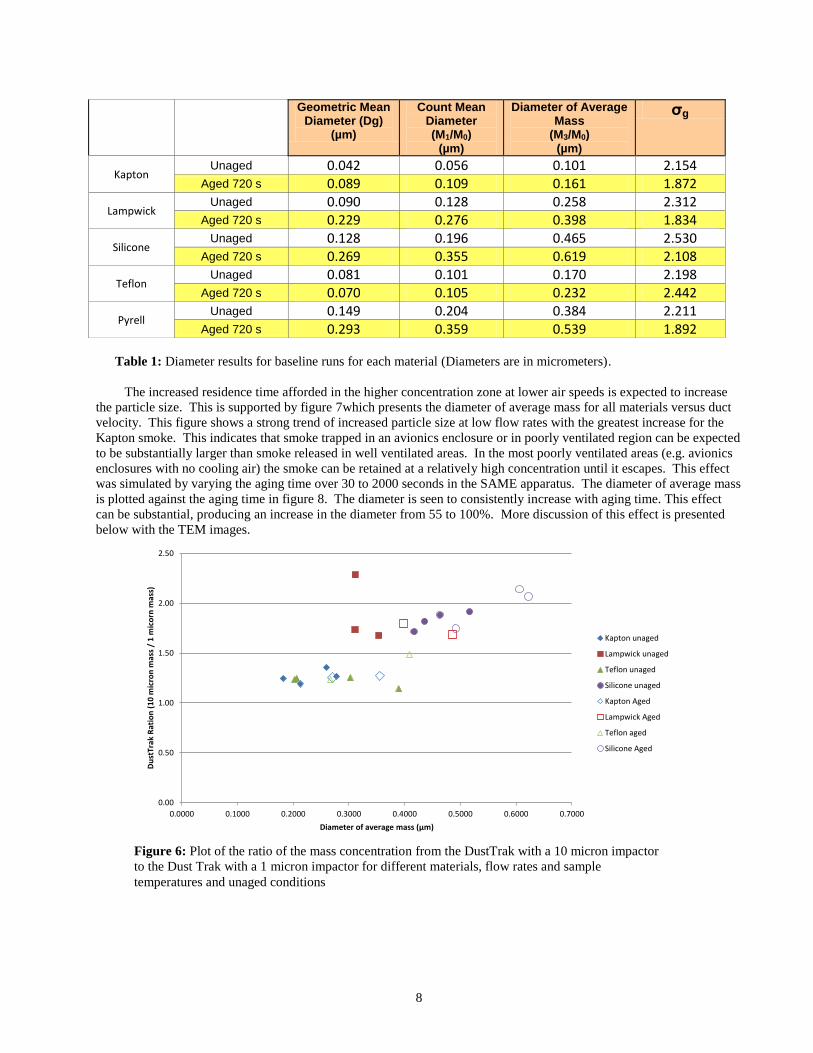
Overall, the Teflon and Kapton particles were very small. The lampwick, Pyrell, and silicone results exhibited
substantially larger diameters of average mass, particularly for the aged cases. This is further supported by figure 6
which presents the ratio of the signals between the DustTraks with the 10 µm and the 1µm impactors. As shown in
figure 6, lampwick and silicone exhibit larger portions of the particle distribution (~ 40% of the mass) larger than 1
micrometer compared to 20% of the mass for Teflon and Kapton. The comparatively smaller diameters for the Kapton
and Teflon will make detection of this smoke challenging for light scattering devices, on the other hand the large sizes
seen with the lampwick and silicone would generate very large signals on a light scattering system. As discussed by
Urban et al. [2009], some level of particle size discrimination is generally required to have a system that is sensitive
enough to trigger an alarm for the low signal from small particles such as Teflon and Kapton without excessive nuisance
alarms from large dust particles. This suggests that detection of these particles against the background environment will
be facilitated by a detection system capable of measuring more than one moment of the particle size distribution.
Figure 5: Ion Chamber Calibration results with Mono disperse DOP
droplets.
0
50
100
150
200
250
300
350
400
450
500
4.5 5 5.5 6 6.5 7
Ionization Chamber output (volts)
EA
D O
utp
ut
(fir
st
mo
me
nt)
100 nm
150 nm
300 nm
600 nm
750 nm
1200 nm
8
Table 1: Diameter results for baseline runs for each material (Diameters are in micrometers).
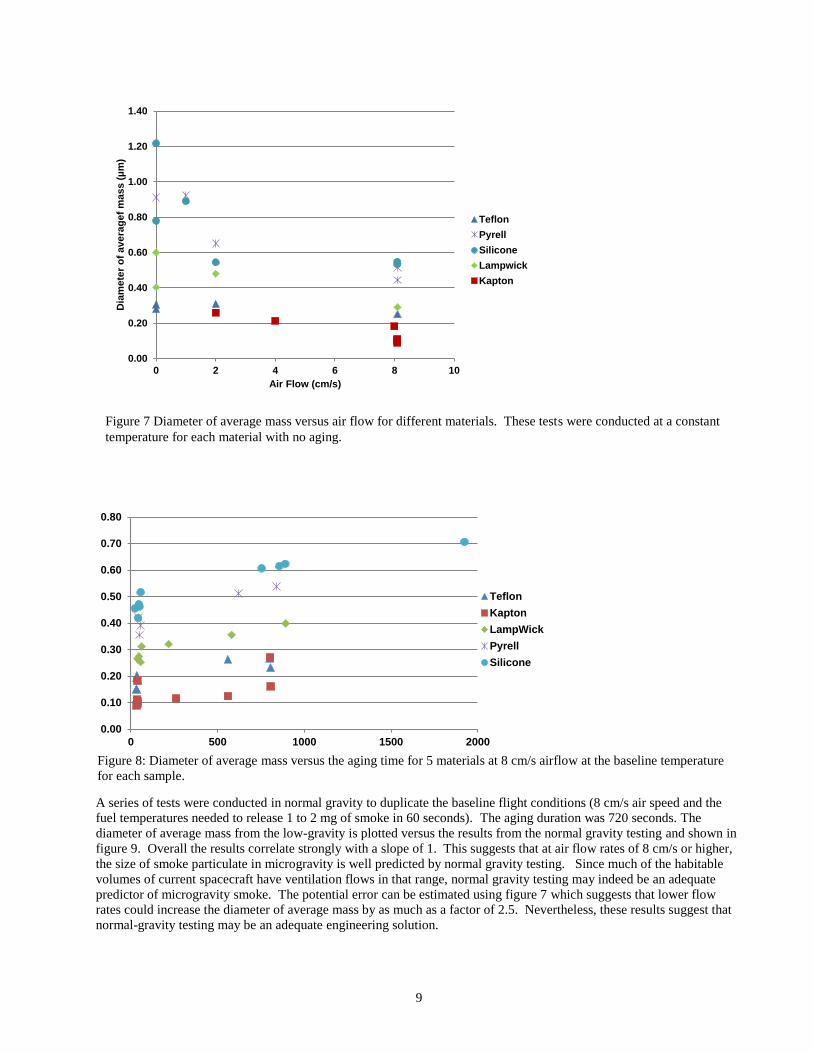
The increased residence time afforded in the higher concentration zone at lower air speeds is expected to increase
the particle size. This is supported by figure 7which presents the diameter of average mass for all materials versus duct
velocity. This figure shows a strong trend of increased particle size at low flow rates with the greatest increase for the
Kapton smoke. This indicates that smoke trapped in an avionics enclosure or in poorly ventilated region can be expected
to be substantially larger than smoke released in well ventilated areas. In the most poorly ventilated areas (e.g. avionics
enclosures with no cooling air) the smoke can be retained at a relatively high concentration until it escapes. This effect
was simulated by varying the aging time over 30 to 2000 seconds in the SAME apparatus. The diameter of average mass
is plotted against the aging time in figure 8. The diameter is seen to consistently increase with aging time. This effect
can be substantial, producing an increase in the diameter from 55 to 100%. More discussion of this effect is presented
below with the TEM images.
Geometric Mean Diameter (Dg)
(µm)
Count Mean Diameter (M1/M0)
(µm)
Diameter of Average Mass
(M3/M0) (µm)
σg
Kapton Unaged 0.042 0.056 0.101 2.154
Aged 720 s 0.089 0.109 0.161 1.872
Lampwick Unaged 0.090 0.128 0.258 2.312
Aged 720 s 0.229 0.276 0.398 1.834
Silicone Unaged 0.128 0.196 0.465 2.530
Aged 720 s 0.269 0.355 0.619 2.108
Teflon Unaged 0.081 0.101 0.170 2.198
Aged 720 s 0.070 0.105 0.232 2.442
Pyrell Unaged 0.149 0.204 0.384 2.211
Aged 720 s 0.293 0.359 0.539 1.892
Figure 6: Plot of the ratio of the mass concentration from the DustTrak with a 10 micron impactor
to the Dust Trak with a 1 micron impactor for different materials, flow rates and sample
temperatures and unaged conditions
0.00
0.50
1.00
1.50
2.00
2.50
0.0000 0.1000 0.2000 0.3000 0.4000 0.5000 0.6000 0.7000
Du
stTr
ak R
atio
n (
10
mic
ron
mas
s /
1 m
ico
rn m
ass)
Diameter of average mass (µm)
Dust Track 10 micron/ 1 micron impactor mass ratio
Kapton unaged
Lampwick unaged
Teflon unaged
Silicone unaged
Kapton Aged
Lampwick Aged
Teflon aged
Silicone Aged
9
A series of tests were conducted in normal gravity to duplicate the baseline flight conditions (8 cm/s air speed and the
fuel temperatures needed to release 1 to 2 mg of smoke in 60 seconds). The aging duration was 720 seconds. The
diameter of average mass from the low-gravity is plotted versus the results from the normal gravity testing and shown in
figure 9. Overall the results correlate strongly with a slope of 1. This suggests that at air flow rates of 8 cm/s or higher,
the size of smoke particulate in microgravity is well predicted by normal gravity testing. Since much of the habitable
volumes of current spacecraft have ventilation flows in that range, normal gravity testing may indeed be an adequate
predictor of microgravity smoke. The potential error can be estimated using figure 7 which suggests that lower flow
rates could increase the diameter of average mass by as much as a factor of 2.5. Nevertheless, these results suggest that
normal-gravity testing may be an adequate engineering solution.
Figure 7 Diameter of average mass versus air flow for different materials. These tests were conducted at a constant
temperature for each material with no aging.
0.00
0.20
0.40
0.60
0.80
1.00
1.20
1.40
0 2 4 6 8 10
Dia
mete
r o
f avera
gef
mas
s (
µm
)
Air Flow (cm/s)
Diameter of Average Mass versus Air Speed fixed temp unaged
Teflon
Pyrell
Silicone
Lampwick
Kapton
Figure 8: Diameter of average mass versus the aging time for 5 materials at 8 cm/s airflow at the baseline temperature
for each sample.
0.00
0.10
0.20
0.30
0.40
0.50
0.60
0.70
0.80
0 500 1000 1500 2000
Teflon
Kapton
LampWick
Pyrell
Silicone
10
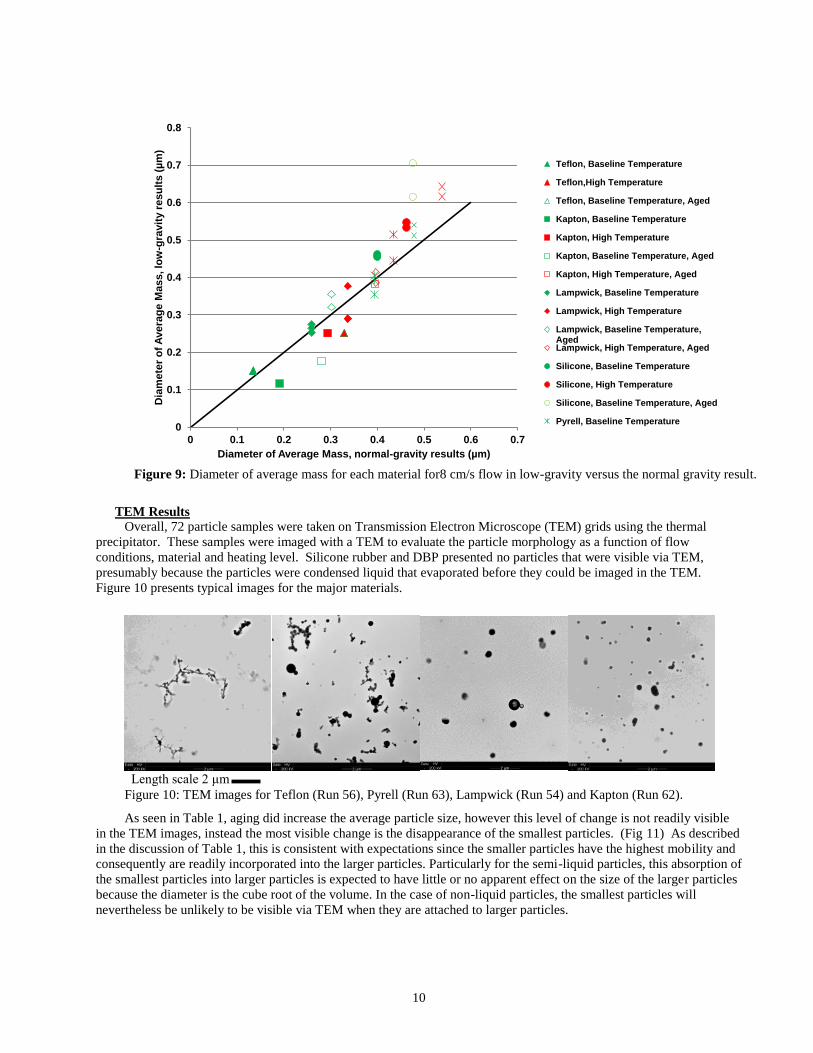
TEM Results
Overall, 72 particle samples were taken on Transmission Electron Microscope (TEM) grids using the thermal
precipitator. These samples were imaged with a TEM to evaluate the particle morphology as a function of flow
conditions, material and heating level. Silicone rubber and DBP presented no particles that were visible via TEM,
presumably because the particles were condensed liquid that evaporated before they could be imaged in the TEM.
Figure 10 presents typical images for the major materials.
As seen in Table 1, aging did increase the average particle size, however this level of change is not readily visible
in the TEM images, instead the most visible change is the disappearance of the smallest particles. (Fig 11) As described
in the discussion of Table 1, this is consistent with expectations since the smaller particles have the highest mobility and
consequently are readily incorporated into the larger particles. Particularly for the semi-liquid particles, this absorption of
the smallest particles into larger particles is expected to have little or no apparent effect on the size of the larger particles
because the diameter is the cube root of the volume. In the case of non-liquid particles, the smallest particles will
nevertheless be unlikely to be visible via TEM when they are attached to larger particles.
Length scale 2 μm
Figure 10: TEM images for Teflon (Run 56), Pyrell (Run 63), Lampwick (Run 54) and Kapton (Run 62).
Figure 9: Diameter of average mass for each material for8 cm/s flow in low-gravity versus the normal gravity result.
0
0.1
0.2
0.3
0.4
0.5
0.6
0.7
0.8
0 0.1 0.2 0.3 0.4 0.5 0.6 0.7
Dia
mete
r o
f A
vera
ge M
ass, lo
w-g
ravit
y r
esu
lts (
µm
)
Diameter of Average Mass, normal-gravity results (µm)
Diameter of Average Mass: low-gravity versus normal gravity
Teflon, Baseline Temperature
Teflon,High Temperature
Teflon, Baseline Temperature, Aged
Kapton, Baseline Temperature
Kapton, High Temperature
Kapton, Baseline Temperature, Aged
Kapton, High Temperature, Aged
Lampwick, Baseline Temperature
Lampwick, High Temperature
Lampwick, Baseline Temperature,AgedLampwick, High Temperature, Aged
Silicone, Baseline Temperature
Silicone, High Temperature
Silicone, Baseline Temperature, Aged
Pyrell, Baseline Temperature
11
Impact of flow on particle morphology
As the samples are heated by the wire, chemical bonds are broken and gaseous products are released via pyrolysis.
These products may include partially oxidized species resulting from the reaction with oxygen. As the gases move from
the wire, the temperature and species concentration will decrease as a result of conduction/diffusion and convection.
With the decrease in temperature, the super-saturation ratio of the pyrolysis gas will pass a critical stage and nucleation
of smoke particles will occur. These smoke nuclei grow rapidly from the condensation of the pyrolysis gases. The time
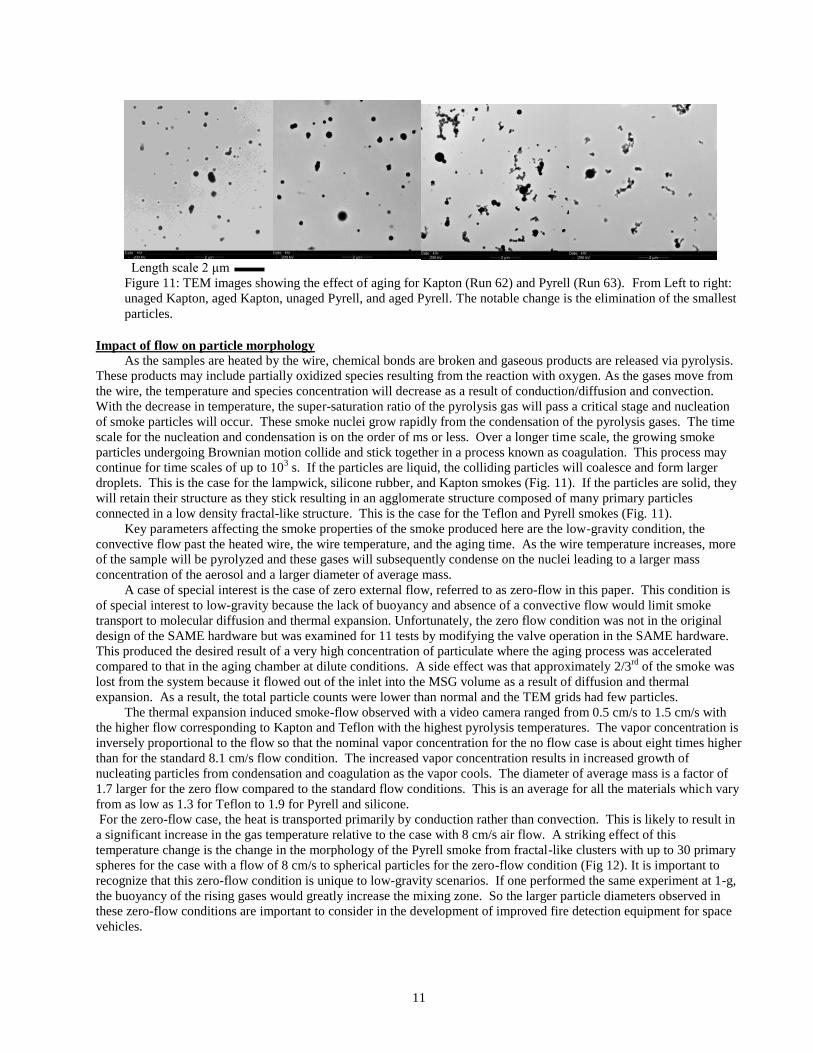
scale for the nucleation and condensation is on the order of ms or less. Over a longer time scale, the growing smoke
particles undergoing Brownian motion collide and stick together in a process known as coagulation. This process may
continue for time scales of up to 103 s. If the particles are liquid, the colliding particles will coalesce and form larger
droplets. This is the case for the lampwick, silicone rubber, and Kapton smokes (Fig. 11). If the particles are solid, they
will retain their structure as they stick resulting in an agglomerate structure composed of many primary particles
connected in a low density fractal-like structure. This is the case for the Teflon and Pyrell smokes (Fig. 11).
Key parameters affecting the smoke properties of the smoke produced here are the low-gravity condition, the
convective flow past the heated wire, the wire temperature, and the aging time. As the wire temperature increases, more
of the sample will be pyrolyzed and these gases will subsequently condense on the nuclei leading to a larger mass
concentration of the aerosol and a larger diameter of average mass.
A case of special interest is the case of zero external flow, referred to as zero-flow in this paper. This condition is
of special interest to low-gravity because the lack of buoyancy and absence of a convective flow would limit smoke
transport to molecular diffusion and thermal expansion. Unfortunately, the zero flow condition was not in the original
design of the SAME hardware but was examined for 11 tests by modifying the valve operation in the SAME hardware.
This produced the desired result of a very high concentration of particulate where the aging process was accelerated
compared to that in the aging chamber at dilute conditions. A side effect was that approximately 2/3rd
of the smoke was
lost from the system because it flowed out of the inlet into the MSG volume as a result of diffusion and thermal
expansion. As a result, the total particle counts were lower than normal and the TEM grids had few particles.
The thermal expansion induced smoke-flow observed with a video camera ranged from 0.5 cm/s to 1.5 cm/s with
the higher flow corresponding to Kapton and Teflon with the highest pyrolysis temperatures. The vapor concentration is
inversely proportional to the flow so that the nominal vapor concentration for the no flow case is about eight times higher
than for the standard 8.1 cm/s flow condition. The increased vapor concentration results in increased growth of
nucleating particles from condensation and coagulation as the vapor cools. The diameter of average mass is a factor of
1.7 larger for the zero flow compared to the standard flow conditions. This is an average for all the materials which vary
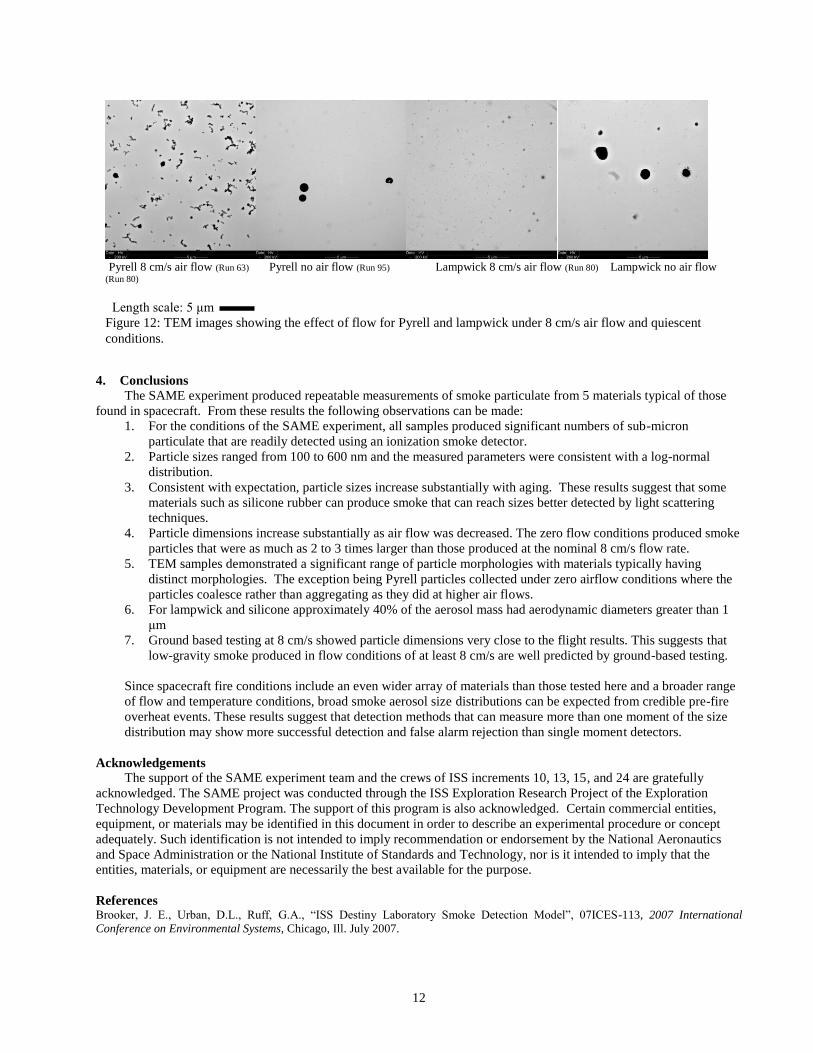
from as low as 1.3 for Teflon to 1.9 for Pyrell and silicone.
For the zero-flow case, the heat is transported primarily by conduction rather than convection. This is likely to result in
a significant increase in the gas temperature relative to the case with 8 cm/s air flow. A striking effect of this
temperature change is the change in the morphology of the Pyrell smoke from fractal-like clusters with up to 30 primary
spheres for the case with a flow of 8 cm/s to spherical particles for the zero-flow condition (Fig 12). It is important to
recognize that this zero-flow condition is unique to low-gravity scenarios. If one performed the same experiment at 1-g,
the buoyancy of the rising gases would greatly increase the mixing zone. So the larger particle diameters observed in
these zero-flow conditions are important to consider in the development of improved fire detection equipment for space
vehicles.
Length scale 2 μm
Figure 11: TEM images showing the effect of aging for Kapton (Run 62) and Pyrell (Run 63). From Left to right:
unaged Kapton, aged Kapton, unaged Pyrell, and aged Pyrell. The notable change is the elimination of the smallest
particles.
12
4. Conclusions
The SAME experiment produced repeatable measurements of smoke particulate from 5 materials typical of those
found in spacecraft. From these results the following observations can be made:
1. For the conditions of the SAME experiment, all samples produced significant numbers of sub-micron
particulate that are readily detected using an ionization smoke detector.
2. Particle sizes ranged from 100 to 600 nm and the measured parameters were consistent with a log-normal
distribution.
3. Consistent with expectation, particle sizes increase substantially with aging. These results suggest that some
materials such as silicone rubber can produce smoke that can reach sizes better detected by light scattering
techniques.
4. Particle dimensions increase substantially as air flow was decreased. The zero flow conditions produced smoke
particles that were as much as 2 to 3 times larger than those produced at the nominal 8 cm/s flow rate.
5. TEM samples demonstrated a significant range of particle morphologies with materials typically having
distinct morphologies. The exception being Pyrell particles collected under zero airflow conditions where the
particles coalesce rather than aggregating as they did at higher air flows.
6. For lampwick and silicone approximately 40% of the aerosol mass had aerodynamic diameters greater than 1
μm
7. Ground based testing at 8 cm/s showed particle dimensions very close to the flight results. This suggests that
low-gravity smoke produced in flow conditions of at least 8 cm/s are well predicted by ground-based testing.
Since spacecraft fire conditions include an even wider array of materials than those tested here and a broader range
of flow and temperature conditions, broad smoke aerosol size distributions can be expected from credible pre-fire
overheat events. These results suggest that detection methods that can measure more than one moment of the size
distribution may show more successful detection and false alarm rejection than single moment detectors.
Acknowledgements
The support of the SAME experiment team and the crews of ISS increments 10, 13, 15, and 24 are gratefully
acknowledged. The SAME project was conducted through the ISS Exploration Research Project of the Exploration
Technology Development Program. The support of this program is also acknowledged. Certain commercial entities,
equipment, or materials may be identified in this document in order to describe an experimental procedure or concept
adequately. Such identification is not intended to imply recommendation or endorsement by the National Aeronautics
and Space Administration or the National Institute of Standards and Technology, nor is it intended to imply that the
entities, materials, or equipment are necessarily the best available for the purpose.
References Brooker, J. E., Urban, D.L., Ruff, G.A., “ISS Destiny Laboratory Smoke Detection Model”, 07ICES-113, 2007 International
Conference on Environmental Systems, Chicago, Ill. July 2007.
Pyrell 8 cm/s air flow (Run 63) Pyrell no air flow (Run 95) Lampwick 8 cm/s air flow (Run 80) Lampwick no air flow (Run 80)
Length scale: 5 μm
Figure 12: TEM images showing the effect of flow for Pyrell and lampwick under 8 cm/s air flow and quiescent
conditions.
13
Bukowski, R.W. and G.W. Mulholland, “Smoke Detector Design and Smoke Properties,” NBS Technical Note 973, 1978.
Bukowski, R. W, R. D. Peacock, J. D. Averill, T. G. Cleary, N. P. Bryner, W. D. Walton, P. A. Reneke, and E. D. Kuligowski,
“Performance of Home Smoke Alarms, Analysis of the Response of Several Available Technologies in Residential Fire Settings,”
NIST Technical Note 1455, December 2003.
Cleary, T.G., D W. Weinert, and G.W. Mulholland, ”Moment Method for Obtaining Particle Size Measures of Test Smokes", Natl.
Inst. Stand. Technol., NISTIR 7050, 2003.
Friedman, R., “Fire Safety Practices and Needs in Human-Crew Spacecraft,” Journal of Applied Fire Science, Vol. 2, 1992, pp. 243-
259.
Greenberg, P. S., K. R. Sacksteder and T. Kashiwagi. 1995. Wire Insulation Flammability Experiment, NASA CP 3272 V II.
Greenberg, P.S., and Fischer, D. G., “Advanced Particulate Sensors for Early Warning Fire Detection,” 40th International Conference
on Environmental Systems, American Institute of Aeronautics and Astronautics (AIAA), Barcelona, Spain, 11-15 July, 2010.
Hinds, W. C. 1999. Aerosol Technology, Second Edition, Wiley Interscience, New York.
Mulholland, G.W. and Liu, B.Y.H., 1980. Response of Smoke Detectors to Monodisperse Aerosols, J. Research of the National
Bureau of Standards, 85:223-238.
Ku, J.C., D.W. Griffin, Greenberg, P. S., and J. Roma. 1995: Combustion and Flame, 102:216-218.
Meyer, M.E., D.L. Urban, G.A. Ruff, G.W. Mulholland, Z.G. Yuan, V. Bryg, T.G. Cleary, and J. Yang, “Smoke Aerosol
Measurement Experiment-2: Comparison of Flight Experiment Results with Ground Test Results,” to appear 43rd International
Conference on Environmental Systems (ICES), Vail, CO, July, 14-18, 2013.
Raabe, O.G., J. Aerosol Sci., Vol. 2, 1971, p. 289.
Reist, P.C., Introduction to Aerosol Science, Macmillan Pub. Co., NY, NY, 1984.
Ruff, G.A., D.L. Urban, and M.K. King, “A Research Plan for Fire Prevention Detection and Suppression,” AIAA-2005-0341, 43rd
Aerospace Sciences Meeting and Exhibit, Reno, NV, January 9-12, 2005.
Srivastava. R., J.T. McKinnon and P. Todd1998. Effect of Pigmentation in Particulate Formation from Fluoropolymer
Thermodegradation in Microgravity, AIAA 98-0814, Aerospace Sciences Meeting, Reno NV, Jan 12-15, 1998.
Urban, D.L., Griffin D., Ruff, G.A., Cleary, T., Yang, J., Mulholland, G., Yuan, Z.G., “Detection of Smoke from Microgravity
Fires”, 2005 International Conference on Environmental Systems, Rome Italy, Paper # 2005-01-2930 July 2005, SAE Transactions,
pp 375-384.
Urban, D.L. Ruff, G.A., Mulholland, G.W., Cleary, T.G., Yang, J.C., Yuan, Z.G., “Measurement of Smoke Particle Size under Low-
Gravity Conditions,” 2008 International Conference on Environmental Systems, Chicago, IL, Paper 2008-01-2089.
Urban, D.L. Ruff, G.A., Mulholland, G.W., Cleary, T.G., Yang, J.C., Yuan, Z.G., Bryg, V., “Smoke Particle Sizes in Low-Gravity
and Implications for the Design of Spacecraft Smoke Detectors,” 39th International Conference on Environmental Systems, Savannah,
GA, July 2009, SAE Paper 2009-01-2468.
10. “Particle Morphology and Size Results from the Smoke Aerosol Measurement Experiment-Reflight ,” D. Urban, G. Ruff, P.
Greenberg,; G. Mulholland, T. Cleary, J. Yang, Z. Yuan, V. Bryg, 42nd International Conference on Environmental Systems (ICES),
San Diego, CA, July 16-19, 2012.


![Dynamics of fire plumes and smoke clouds associated with ...€¦ · et al., 2008]. Smoke from these fires also contains high levels of particulate matter with diameters less than](https://img.pdfslide.us/doc/110x75/5e8f0b041b982a3dc141c9e9/dynamics-of-fire-plumes-and-smoke-clouds-associated-with-et-al-2008-smoke.jpg)