Embed Size (px)
Citation preview

Application of Satellite Data to Particulate, Smoke and Dust Monitoring
Spring 2015
ARSET - AQApplied Remote Sensing Education and Training – Air Quality
A project of NASA Applied Sciences
Week – 4 – April 22, 2015

Today’s Speakers
Pawan GuptaResearch ScientistNASA Goddard Space Flight Center/USRAEmail: [email protected]
Website Demo: Ground Based Air Quality MonitorsRonanChief ScientistEmail: [email protected]

Motivation – tiny but Potent
3

Sensitive groups should avoid all physical activity outdoors; everyone else should avoid prolonged or heavy exertion
Sensitive groups should avoid prolonged or heavy exertion; everyone else should reduce prolonged or heavy exertion
Sensitive groups should reduce prolonged or heavy exertion
Unusually sensitive people should consider reducing prolonged or heavy exertion
None
Cautionary Statements
201-300
151-200
101-150
51-100
0-50
Index
Values
PM10
(ug/m3)
PM2.5
(ug/m3)
Category
355-424
255-354
155-254
55-154
0-54
150.5-250.4
65.5-150.4
40.5-65.4
15.5-40.4
0-15.4Good
Very Unhealthy
Unhealthy
Unhealthy for Sensitive Groups
Moderate
Environmental Agencies & Public Looking for…
WHO
• Public• Decision/Policy Makers• Media• Researchers
India40 µgm-3 – Annual mean60 µgm-3 – 24 hour mean

Column – to- Surface
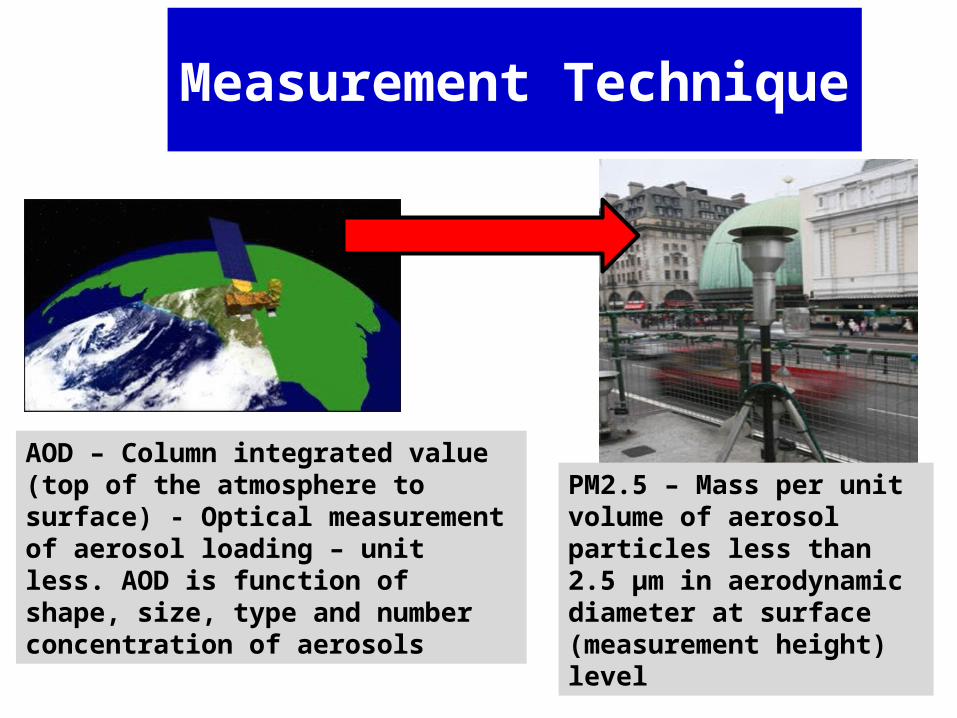
Measurement Technique
AOD – Column integrated value (top of the atmosphere to surface) - Optical measurement of aerosol loading – unit less. AOD is function of shape, size, type and number concentration of aerosols
PM2.5 – Mass per unit volume of aerosol particles less than 2.5 µm in aerodynamic diameter at surface (measurement height) level

To of the Atmosphere
10 km2 Vertical Column
Earth Surface
Surface Layer
PM2.5 mass concentration (µgm-3) -- Dry Mass
What is our interest and what we get from satellite?
Aerosol Optical Depth Particle size
Composition Water uptake
Vertical Distribution

• Point vs Area Averaged• Surface vs Column
• Mass vs Optical
Surface Particulate Measurements vs
Satellite Measurements of Aerosols
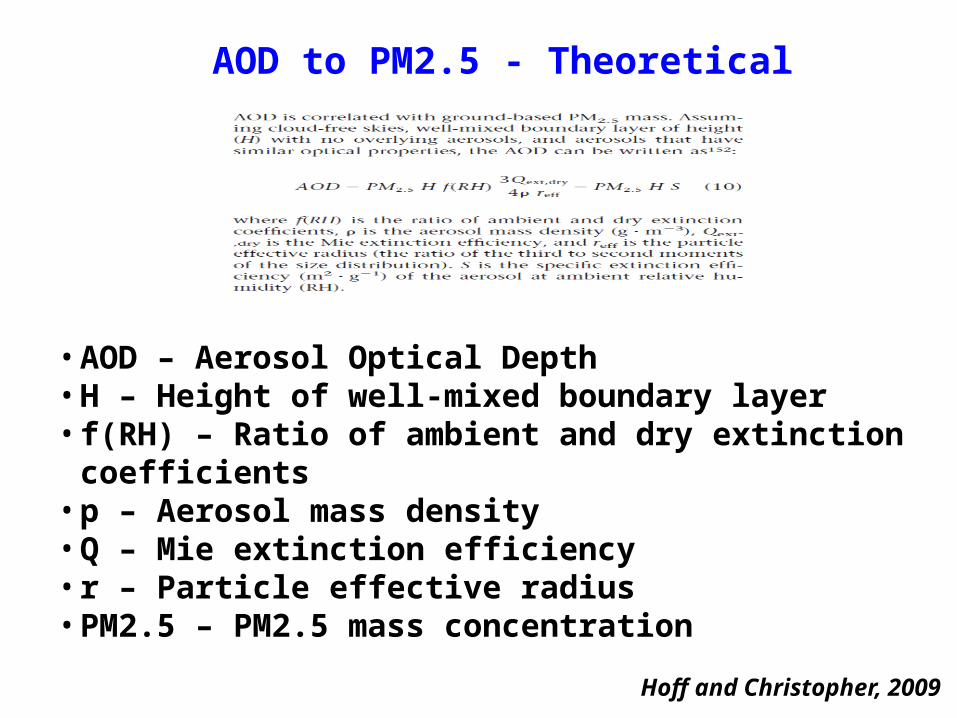
Hoff and Christopher, 2009
AOD to PM2.5 - Theoretical
• AOD – Aerosol Optical Depth• H – Height of well-mixed boundary layer• f(RH) – Ratio of ambient and dry extinction coefficients• p – Aerosol mass density• Q – Mie extinction efficiency • r – Particle effective radius• PM2.5 – PM2.5 mass concentration
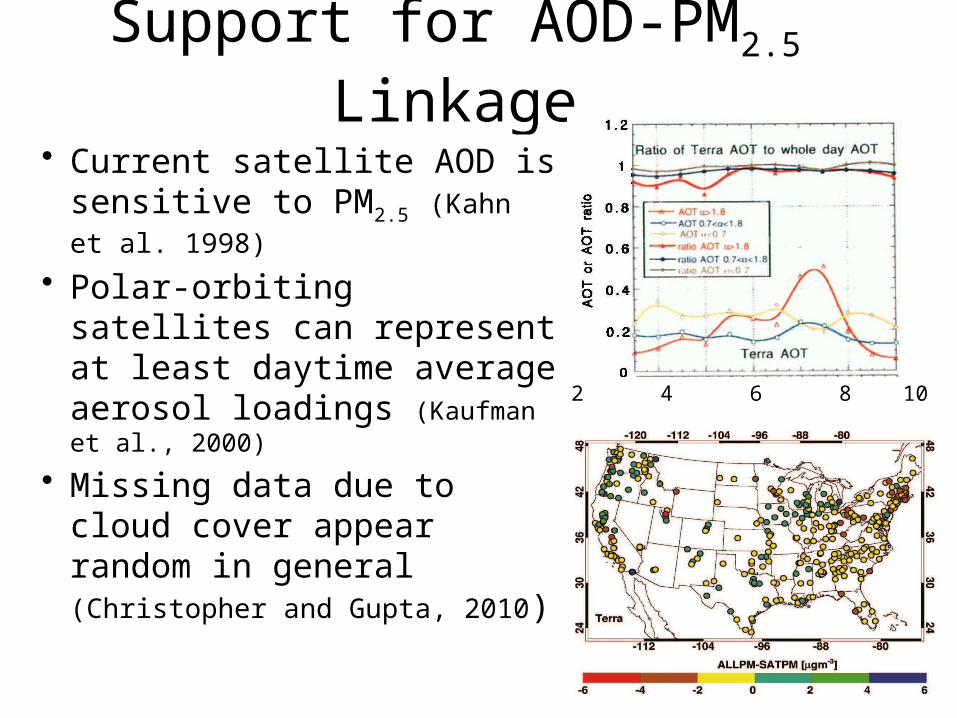
Support for AOD-PM2.5 Linkage
• Current satellite AOD is sensitive to PM2.5 (Kahn et al. 1998)
• Polar-orbiting satellites can represent at least daytime average aerosol loadings (Kaufman et al., 2000)
• Missing data due to cloud cover appear random in general (Christopher and Gupta, 2010)
2 4 6 8 10 12
10

AOD-PM Relationship
Chu et al., 2003
Wang et al., 2003
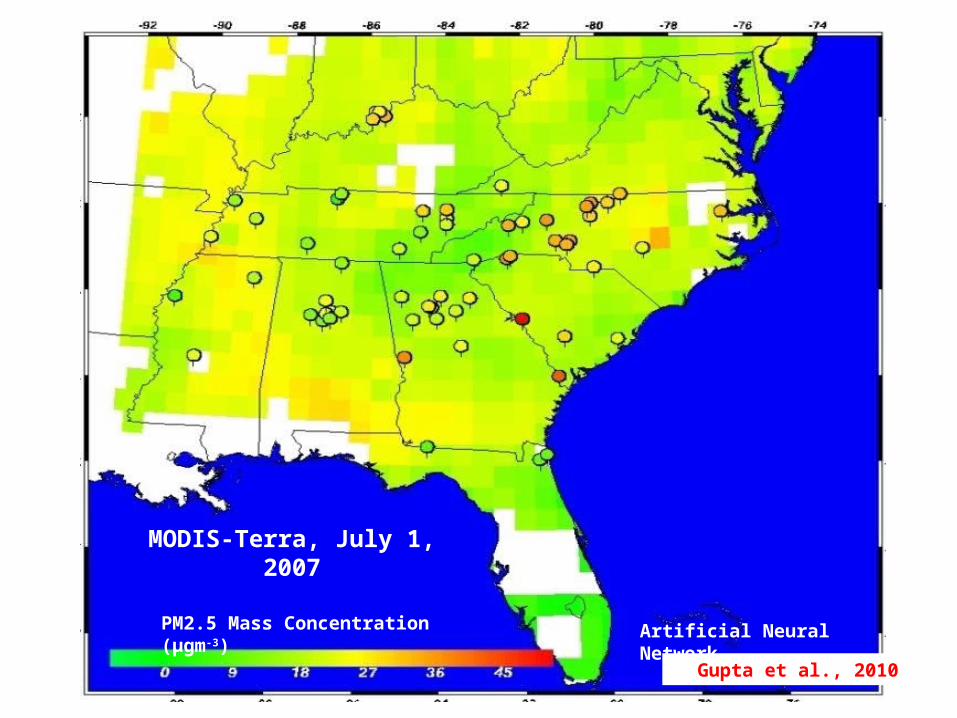
Artificial Neural Network
MODIS-Terra, July 1, 2007
Gupta et al., 2010
PM2.5 Mass Concentration (µgm-3)

Questions to Ask: Issues
How accurate are these estimations?
Is PM2.5-AOT relationship is always linear?
How does uncertainty in AOT retrieval impact estimation of air quality
Does this relationship change in space and time?
Does this relationship change with a change in aerosol type?
How does meteorology drive this relationship?
How about vertical distribution of aerosols in the atmosphere?

Assumption for Quantitative Analysis
When most particles are concentrated and well mixed in the boundary layer, satellite AOD contains a strong signal of ground-level particle concentrations.

PM2.5 Estimation: Popular Methods
Two Variable Method
Multi-
Variable Method
Artificial Neural Networ
k
•
MSC
•
AOT
PM
2.5
Y=mX + c
and Empirical Methods, Data Assimilation etc. are under utilized
Difficulty Level
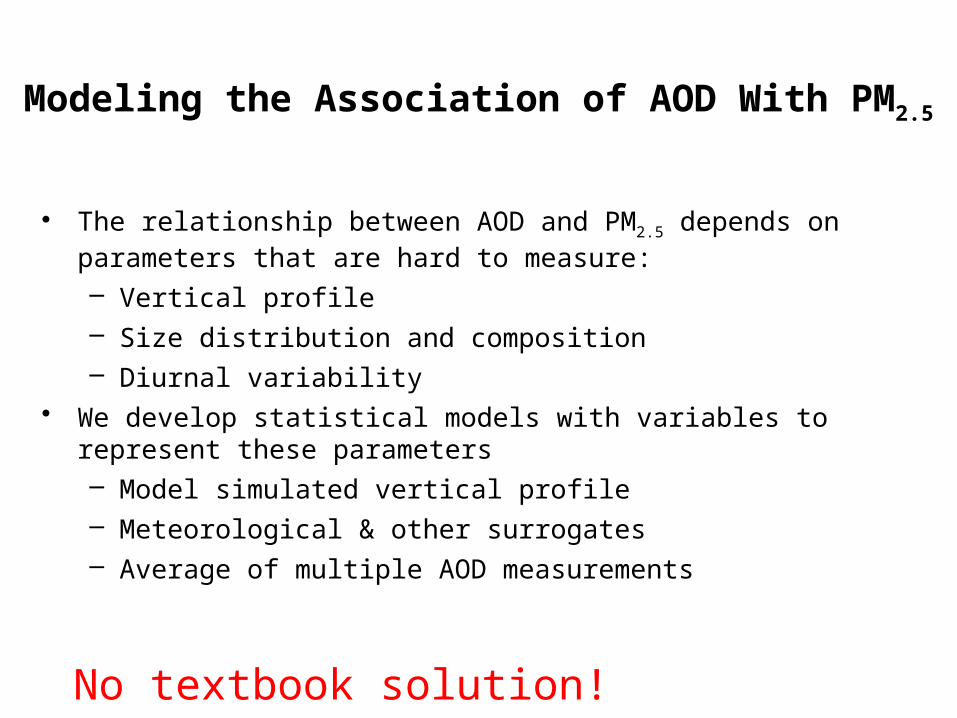
Modeling the Association of AOD With PM2.5
• The relationship between AOD and PM2.5 depends on parameters that are hard to measure:– Vertical profile– Size distribution and composition– Diurnal variability
• We develop statistical models with variables to represent these parameters– Model simulated vertical profile– Meteorological & other surrogates– Average of multiple AOD measurements
No textbook solution!
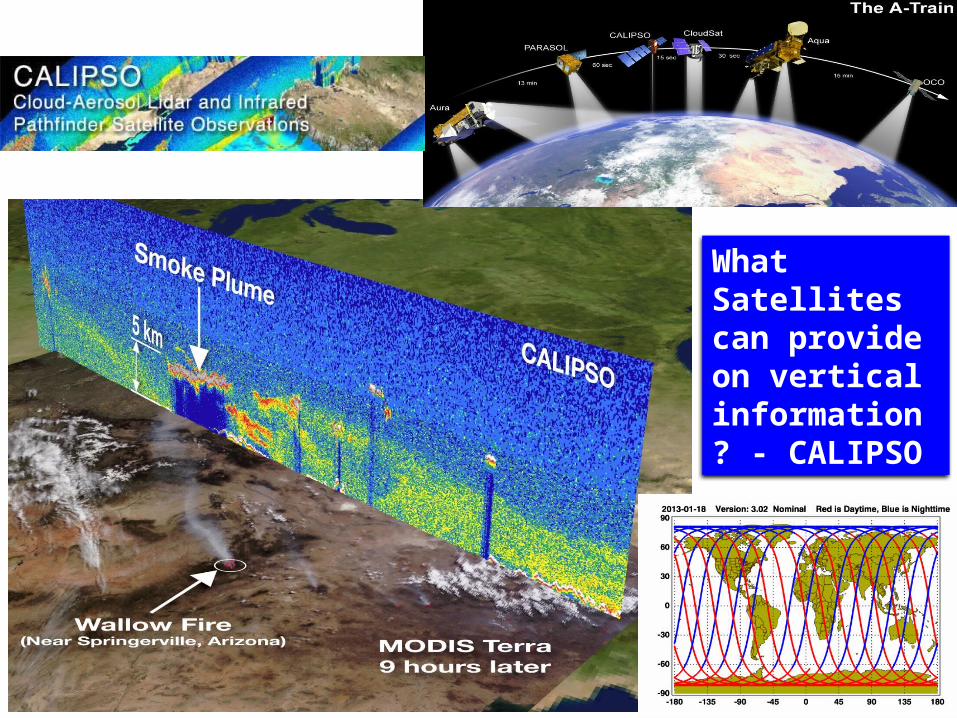
What Satellites can provide on vertical information? - CALIPSO

Suggested Reading

Dust & Smoke Monitoring Resources
• RGB Images• Aerosol Optical Depth• Aerosol Index (OMI, OMPS)• MISR coarse/fine mode AOD• AIRS Dust Score• AIRS CO• AERONET

Web Tool - Worldview
An online visualization tool for the near real time NASA data
sets
Global Air Quality Monitoring System
(www.aqicn.org)
&

Assignment – Week 4
http://goo.gl/forms/EpU6ouPLf5
![pc pc 2012 - examenbac.com · NS28 / (aq) (s) (s) (aq) 10 —2 + = ] (aq) i 4(aq) mol. L; 1 + = ' (aq) i (aq) 4(aq) 7m +Cu2+ + 4....*àA.Z = 5.1036 F = 9, 65.104 C.mol- —2](https://img.pdfslide.us/doc/110x75/5b9bedcb09d3f29b498bc24a/pc-pc-2012-ns28-aq-s-s-aq-10-2-aq-i-4aq-mol-l-1-.jpg)