Embed Size (px)
Citation preview
University Bulletin – ISSUE No.23- Vol. (3) – September- 2021.
المؤتمر العلمي الأول لكلية هندسة النفط والغازعدد خاص ب
(دور علوم الأرض والبيئة في تنمية الاقتصاد الليبي(
269
Evaluation of Hydro-geochemical properties of
produced water and their effect on Groundwater
Pollution: Case Study Nafoora oilfield NE, Libya
Manal Elwahaishi1, Khalifa M. Abdunaser
1 & Salem A. Eljawashi
2 ))
¹Libyan Petroleum Institute
²National Oil corporation
Abstract
Produced water is considered one of the common environmental
problems at present. This water is trapped in underground formations
which come to the surface during oil and gas production. The produced
water's effect lies in its disposal process, into pits that cause pollution to
the surrounding environment .At time, the pits take up a large area,
vertically and horizontally, where some pollutants may reach the
groundwater in several ways. The purposes of this study are to describe
)) Email: [email protected]

Evaluation of Hydro-geochemical properties of produced water ________________
University Bulletin – ISSUE No.23- Vol. (3) – September- 2021.
عدد خاص بالمؤتمر العلمي الأول لكلية هندسة النفط والغاز
( علوم الأرض والبيئة في تنمية الاقتصاد الليبيدور )
270
the areal distribution of the dominant water quality constituents, to
identify the major hydro-geochemical processes that affect the water
quality and to evaluate if any relations of produced water, groundwater
quality and geochemistry of water in aquifer in the surrounding areas of
Nafoora oil field in NE Sirt Basin, Libya. This was done by taking
samples from both and analyzing them through field and laboratory
analyses. Ten samples of groundwater wells used for domestic and
injection while, Twenty-six samples from produced water pit from the
selected area were analyses for major physical, chemical properties and
trace element. For interpretation, these results were used for
conventional classification techniques: (Piper and Stiff) diagrams from
RockWorks17 software, GIS software, and Surfer 10 software. The results
revealed no relationship or influence of produced water to the
groundwater quality, whether in terms of salinity or hydrocarbon
pollution.
Keywords: Produced water, Groundwater, Nafoora oil field,
Environment.
Introduction
Libya considered one of the areas that suffer a severe lack of water
resources. Most of its lands fall within the dry and hot regions belonging
to the Mediterranean's climate and the desert. Thus, groundwater is used
as the primary resource for various economic activities, particularly in the
oil industry.
Produced water is one of a variety of wastes generated from oil and
gas production wells . It can contain elevated concentrations of toxic
metals, radium and petroleum hydrocarbons compared to the receiving
water .As the produced water enters wetland environments, toxic metals
can enter the sediment column [1].

ــــــــــــــــــــــــــــــــــــــــــــــــــــــــــــــــــــــــــــــــــــــــــــــــــــــــــــــ Manal Elwahaishi & et.al.,
University Bulletin – ISSUE No.23- Vol. (3) – September- 2021.
عدد خاص بالمؤتمر العلمي الأول لكلية هندسة النفط والغاز
(دور علوم الأرض والبيئة في تنمية الاقتصاد الليبي)271
The effect of produced water pollution on the environment is a
serious geo-environmental issue that adversely hampers soil quality,
underground water, and the atmosphere [2]. This water's danger lies
because they form pits above the ground that extend a large area
horizontally and vertically. Produced water spillage on land is responsible
for the majority of hydrocarbons contamination of earth; moreover, when
spilt over the ground surface percolates through the unsaturated zone
where some part of it is retained there, while the rest of the portion
reaches the water table causing groundwater pollution.
Hence this particular study to examine or investigate the effects of
produced water on groundwater in Nafoora oil field in NE Sirt Basin is
crucial. (Fig.1).
The area involved in this study is located in the north-eastern part
of Sirt Basin, which is located in the north central part of Libya, called
(Al Wahat area) and contains a lot of oil fields in the Libya [3] The field
concerned with this study Nafoora oil field located within the boundaries
N 29`11'00.000" E 021`28'00.000 on the crest of a 100 km long to 30-60
km wide (2,500 sq km) platform called Amal-Nafoora High. Topographic
highs were slowly buried by marine sediments [4] [5] .

Evaluation of Hydro-geochemical properties of produced water ________________
University Bulletin – ISSUE No.23- Vol. (3) – September- 2021.
عدد خاص بالمؤتمر العلمي الأول لكلية هندسة النفط والغاز
( علوم الأرض والبيئة في تنمية الاقتصاد الليبيدور )
272
Fig. (1) Shows general location of study area (Nafoora oil field).
Geology of study area:
The area of study as a part of Sirt Basin, it began in the late
Precambrian by alternating periods of uplift and subsidence commencing
with the Pan-African orogeny. The Sirt Basin's main structure is the result
of rifting, which formed the configuration of the basin. Rifting originated
in the Early Cretaceous, continued through Late Cretaceous and was
completed by early Tertiary, resulting in a triple junction within the
basin[4] .The stratigraphic column of the area is starting by metamorphic
rock, the Cambro-Ordovician Hofra Formation Quartzite; the Pre-
Cretaceous Amal Formation sandstones; the Lower Cretaceous totally
Nubian Formation; the Upper Cretaceous mostly Rakab Formation
ــــــــــــــــــــــــــــــــــــــــــــــــــــــــــــــــــــــــــــــــــــــــــــــــــــــــــــــ Manal Elwahaishi & et.al.,
University Bulletin – ISSUE No.23- Vol. (3) – September- 2021.
عدد خاص بالمؤتمر العلمي الأول لكلية هندسة النفط والغاز
(دور علوم الأرض والبيئة في تنمية الاقتصاد الليبي)273
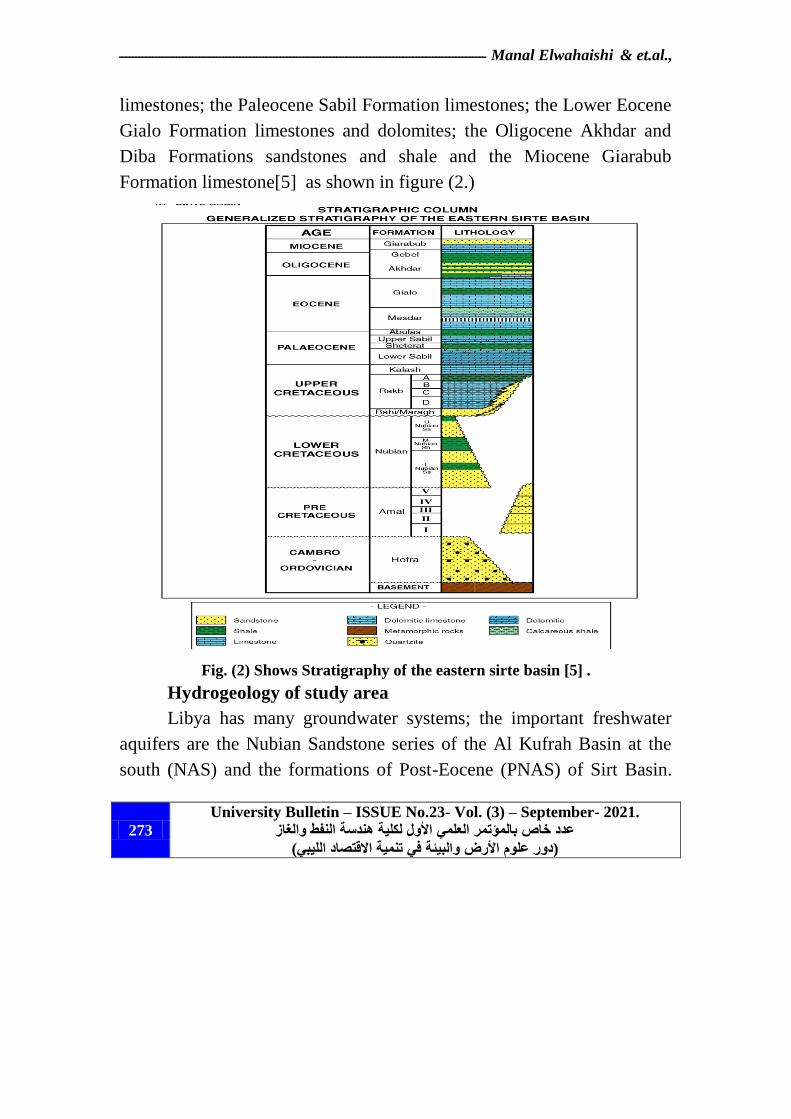
limestones; the Paleocene Sabil Formation limestones; the Lower Eocene
Gialo Formation limestones and dolomites; the Oligocene Akhdar and
Diba Formations sandstones and shale and the Miocene Giarabub
Formation limestone[5] as shown in figure (2.)
Fig. (2) Shows Stratigraphy of the eastern sirte basin [5] .
Hydrogeology of study area
Libya has many groundwater systems; the important freshwater
aquifers are the Nubian Sandstone series of the Al Kufrah Basin at the
south (NAS) and the formations of Post-Eocene (PNAS) of Sirt Basin.

Evaluation of Hydro-geochemical properties of produced water ________________
University Bulletin – ISSUE No.23- Vol. (3) – September- 2021.
عدد خاص بالمؤتمر العلمي الأول لكلية هندسة النفط والغاز
( علوم الأرض والبيئة في تنمية الاقتصاد الليبيدور )
274
Moreover, these aquifers are different types, the Nubian sandstones are
unconfined and Post-Eocene or Post- Nubian (PNAS) is a very
heterogeneous unconfined to semi-confined multi-aquifer system.
Groundwater flow in the aquifer is effectively horizontal with negligible
vertical hydraulic head differentials. Groundwater reserves extend to
great depths in the basin, but water quality generally deteriorates with
depth and distance northward and the direction of the groundwater is
from south to north [3] (Fig. 3).
It is mainly consisting of marginal fluvial and marine deposits of
Post -Middle Miocene (PMM) Calanscio Formation and Lower–Middle
Miocene (LMM) Marada Formation. [5]
Fig. (3) Shows groundwater flow including study area [3] .

ــــــــــــــــــــــــــــــــــــــــــــــــــــــــــــــــــــــــــــــــــــــــــــــــــــــــــــــ Manal Elwahaishi & et.al.,
University Bulletin – ISSUE No.23- Vol. (3) – September- 2021.
عدد خاص بالمؤتمر العلمي الأول لكلية هندسة النفط والغاز
(دور علوم الأرض والبيئة في تنمية الاقتصاد الليبي)275
Methodology
Groundwater sampling and analysis
The groundwater samples collected from the groundwater wells
and their number were 10 wells in Nafoora oil field (Fig. 4); their
locations determined using a handheld GPS [6]. The physical and
chemical properties of the water were analyzed in the laboratory
following standard procedures in 2018 by Libyan Petroleum Institute
(LPI) staff. These samples analyzed for chemical variable as follows:
Field test were measured "on site": water level (ft).Temperature (T),
pH, Electrical Conductivity (EC) using portable pH and EC meters.
Chemical parameters of groundwater were measured on
Laboratories:
1. Total dissolved solids (TDS), cations and anions (Na⁺, K⁺, Ca²⁺,
Mg²⁺, SO₄²⁻, Cl⁻, HCO₃⁻, CO₃⁻²and NO₃).
2. Heavy metals include Barium (Ba²⁺), Cadmium (Cd), Chromium
(Cr), Copper (Cu), Iron (Fe²⁺), lead (Pb), Mercury (Hg), Nickel
(Ni), Selenium (Se), Strontium (Sr²⁺), Vanadium (V), and Zinc
(Zn).
3. Total Petroleum Hydrocarbon (TPH) and Total Organic Carbon
(TOC).
Units of EC are expressed in micro-siemens per centimeter
(μS/cm), while those of the remaining chemical variables (except pH,
water level, and T) in milligrams per liter (mg/L).
Produced water Sampling and analysis
Twenty-six of produced water were collected (Fig. 5) from Nafoora
oil field ,and their locations determined using a handheld GPS [6]. The
physical and chemical properties of the water were analysed in the
laboratory following standard procedures in 2018 by Libyan Petroleum
Institute (LPI) staff. These samples analyzed for chemical variable as
follows:
Evaluation of Hydro-geochemical properties of produced water ________________
University Bulletin – ISSUE No.23- Vol. (3) – September- 2021.
عدد خاص بالمؤتمر العلمي الأول لكلية هندسة النفط والغاز
( علوم الأرض والبيئة في تنمية الاقتصاد الليبيدور )
276
Field test were measured "on site": Temperature (T), pH,
Electrical Conductivity (EC) using portable pH and EC meters.
Chemical parameters of produced water were measured on
Laboratories:
1. Total dissolved solids (TDS), Total suspended solids (TSS) Salinity
,and COD . Also, cations and anions(Na⁺, K⁺, SO₄²⁻, Cl⁻, NO2⁻ and
NO₃⁻).
2. Heavy metals include Barium (Ba²⁺), Cadmium (Cd), Chromium
(Cr), Copper (Cu), Iron (Fe²⁺), lead (Pb), Mercury (Hg), Nickel (Ni),
Selenium (Se), Strontium (Sr²⁺), Vanadium (V), and Zinc (Zn)
Studying the results and handling them from scientific and
research point of view.
The chemical analysis results were represented graphically by
(Rock Works17) software, GIS software and Surfer 10.
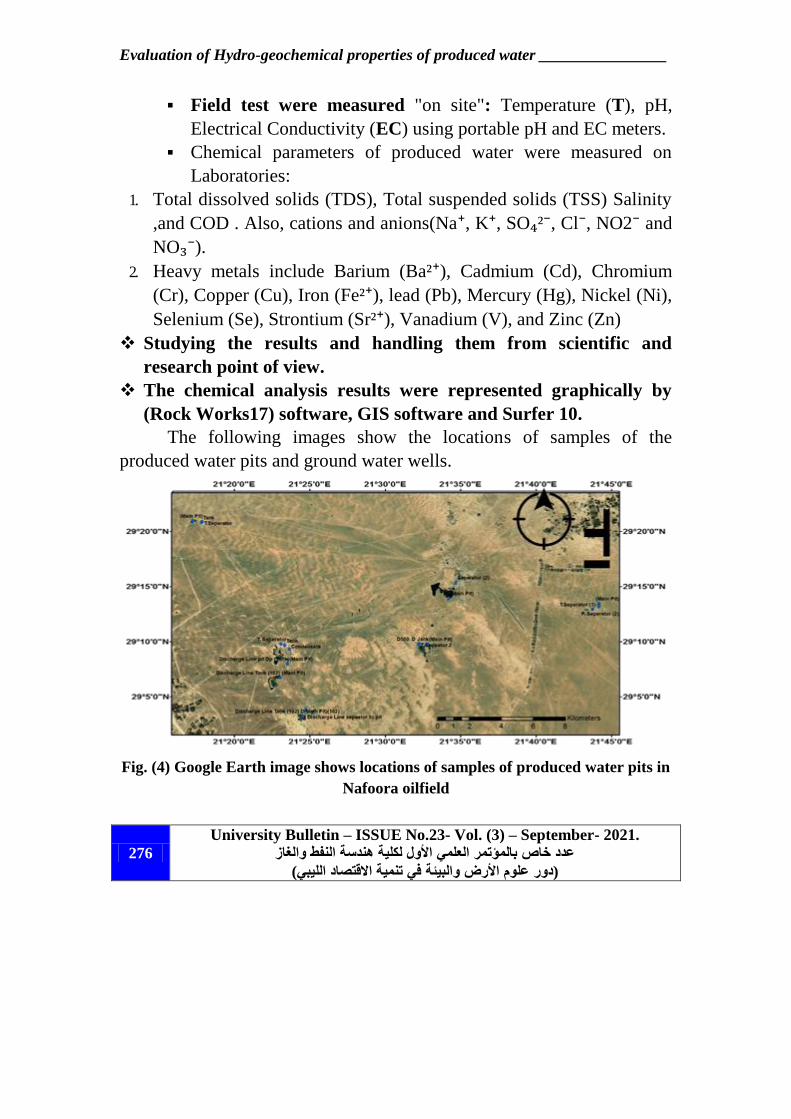
The following images show the locations of samples of the
produced water pits and ground water wells.
Fig. (4) Google Earth image shows locations of samples of produced water pits in
Nafoora oilfield

ــــــــــــــــــــــــــــــــــــــــــــــــــــــــــــــــــــــــــــــــــــــــــــــــــــــــــــــ Manal Elwahaishi & et.al.,
University Bulletin – ISSUE No.23- Vol. (3) – September- 2021.
عدد خاص بالمؤتمر العلمي الأول لكلية هندسة النفط والغاز
(دور علوم الأرض والبيئة في تنمية الاقتصاد الليبي)277
Fig. (5) Google Earth image shows locations of samples of groundwater wells in
Nafoora oilfield
Results and Discussion
Results of groundwater wells:
Table (1) shown the physical and chemical properties of
Groundwater samples collected from Nafoora Oilfield.
Physical and Chemical Properties of groundwater
pH and Temperature
At the site, pH and temperature of groundwater samples were
measured on site using a calibrated portable instrument. pH values for
existing groundwater wells samples collected from area were ranged from
(6.9 to 9.3). This range more than the rang of WHO drinking water (6.5-
8.5) .The temperature of water collected from existing groundwater wells
Evaluation of Hydro-geochemical properties of produced water ________________
University Bulletin – ISSUE No.23- Vol. (3) – September- 2021.
عدد خاص بالمؤتمر العلمي الأول لكلية هندسة النفط والغاز
( علوم الأرض والبيئة في تنمية الاقتصاد الليبيدور )
278
at Nafoora oilfield was ranged from 23.0 oC to 28.7
oC as shown in
Table (1).
Electrical Conductivity (EC)
The electrical conductivity results presented in Table (1) indicated
that there was a variation in EC between all samples and ranged from
7640 µs/cm to 11240 µs/cm, all of results higher than EC levels of the
WHO for drinking water (1500 mg/l). The following figure (6) shows the
geographical distribution of the groundwater wells and the electrical
conductivity values using a contour map by Surfer 10.
Chloride (Cl)
The chloride values for groundwater samples were found in the
range of 639 mg/l – 1716 mg/l with an average of 1130.62 mg/l. This
range higher than WHO drinking water 250 mg/l.
Total dissolved solids (TDS)
Table (1) shows the TDS levels of the water collected from
groundwater wells were ranged from 4279 mg/l to 7950 mg/l. Also, this
range higher than WHO drinking water 1000 mg/l. The following figure
(7) shows the geographical distribution of the groundwater wells in the
field and the values of TDS by using Arc GIS software.
Cations and anions concentrations in groundwater for all water
wells at the study area, Table (1), are ranged; Anions: - (HCO3): from 49
to 275 mg/l, (CO3- from (0 to 96) mg/l and Sulfate (SO4): from (0011 to
0011 mg/l). Cations are ranged; Calcium (Ca): from 52 to 376 mg/l,
Magnesium (Mg): from 51 to 224 mg/l, Sodium (Na): from 1350 to 2400
mg/l and Potassium (K) from 35 to 47 mg/l). All of cations & anions
values for all groundwater wells collected from Nafoora field, are higher

ــــــــــــــــــــــــــــــــــــــــــــــــــــــــــــــــــــــــــــــــــــــــــــــــــــــــــــــ Manal Elwahaishi & et.al.,
University Bulletin – ISSUE No.23- Vol. (3) – September- 2021.
عدد خاص بالمؤتمر العلمي الأول لكلية هندسة النفط والغاز
(دور علوم الأرض والبيئة في تنمية الاقتصاد الليبي)279
than WHO for drinking water, expect (HCO3) it is in the range 380 mg/l
as shown in Table (1).
Nitrate (NO3)
Nitrate concentrations in all the ground water samples collected
from area were ranged from 0 to 3.54 mg/l as shown in Table (1). This
range is less than the WHO for drinking water (10 mg /l), moreover, this
indicates that there is no contamination with (NO3), which increase of
this element pollutes the groundwater.
Fig. (6) Shows the geographical distribution of the (E.C) in Nafoora oilfield

Evaluation of Hydro-geochemical properties of produced water ________________
University Bulletin – ISSUE No.23- Vol. (3) – September- 2021.
عدد خاص بالمؤتمر العلمي الأول لكلية هندسة النفط والغاز
( علوم الأرض والبيئة في تنمية الاقتصاد الليبيدور )
280
Fig. (7) Shows the geographical distribution of TDS in Nafoora oilfield
Table (1) shown the physical and chemical properties of Groundwater samples
collected from Nafoora Oilfield.
Parameter Unit WSW
245
WSW
109
WSW
146
WSW
216
WSW
403
WSW
248
WSW
98
WSW
99
WSW
101
WSW
8
WHO Standard
Total
Depth ft 1050 240 212 975 1050 1399 1537 1643 1806 1117 -
Tem ℃ 24.2 23.7 25.4 24.9 23.1 27.1 26.6 28.1 28.7 24.2 -
E.C (µs/cm) 8005 7980 8410 8150 8630 11240 9340 9600 10010 7640 0011
pH - 6.93 7.73 9.14 9.22 8.28 8.63 8.38 8.2 9.3 8.78 5.0 -5.0
HCO3 (mg/l) 110 49 183 195 275 153 171 189 244 183 051
CO3 (mg/l) 0 0 30 66 12 30 6 0 96 24 -
Cl (mg/l) 949 1651 639 913 1132 1716 1479 657 1132 687 001
Ca (mg/l) 352 376 60 60 116 84 220 120 52 64 011
Mg (mg/l) 209 224 66 80 79 83 92 68 53 75 001
SO4 ² (mg/l) 3200 1100 3100 2400 2600 3200 2700 3600 3100 2300 011
Na (mg/l) 1350 1713 1750 1650 1725 2400 1850 1900 2175 1375 011
K (mg/l) 47 35 41 40 42 40 43 45 38 38 01
NO3 (mg/l) 0 0 3.1 1.33 0 0 3.54 0 0 0 01
T. D.S (mg/l) 6390 4270 6100 5630 6210 7950 6750 6800 7050 4910 0111
TPH (mg/l) 0 0 0 0 0 0 0 0 0 0 -
TOC (mg/l) 0.6 0.1 0.8 0.9 1.2 2.1 0.2 0.6 1.8 1.1 -

ــــــــــــــــــــــــــــــــــــــــــــــــــــــــــــــــــــــــــــــــــــــــــــــــــــــــــــــ Manal Elwahaishi & et.al.,
University Bulletin – ISSUE No.23- Vol. (3) – September- 2021.
عدد خاص بالمؤتمر العلمي الأول لكلية هندسة النفط والغاز
(دور علوم الأرض والبيئة في تنمية الاقتصاد الليبي)281
Total Petroleum Hydrocarbon (TPH) and Total Organic Carbon
(TOC) in produced water:
Figure (8) shows the concentrations of total petroleum
hydrocarbons (TPH) and total organic Carbons (TOC) in groundwater
well in the study area. The TPH concentrations in groundwater were not
detected for all groundwater. Moreover, there is not any oil or
Hydrocarbon in these samples .The concentration of TOC in groundwater
samples were varied and ranged from 0.1 mg/l to 2.1 mg/l.
Figure (8) Concentrations of TPH and TOC in Groundwater Wells
Trace elements in groundwater wells:
The concentration of trace elements in groundwater are relativity
low, as it is shown in Table (2). Ba concentration was ranged from 0.006
mg/l to 0.125 mg/l. The concentration of Sr was ranged between 4.71
mg/l to 14.95 mg/l. Fe concentration was ranged from 0.64 mg/l to 7.594
mg/l.
0 0 0 0 0 0 0 0
1.1
0.1
0.6
0.9
1.2
0.2
0.6
1.1
0
0.2
0.4
0.6
0.8
1
1.2
1.4
WW 8 WSW 109 WSW 245 WSW 216 WSW 403 WSW 98 WSW 99 WSW 101
Well NO
TPH (mg/l) TOC(mg/l)

Evaluation of Hydro-geochemical properties of produced water ________________
University Bulletin – ISSUE No.23- Vol. (3) – September- 2021.
عدد خاص بالمؤتمر العلمي الأول لكلية هندسة النفط والغاز
( علوم الأرض والبيئة في تنمية الاقتصاد الليبيدور )
282
The Cu concentrations were ranged from 0.097 mg/l to 0.17 mg/l
with an average of 0.13 mg/l. Cr concentration was ranged between <
0.002 mg/l to 0.072 mg/l. The Z concentrations were ranged from 0.102
mg/l to 1.475 mg/l. V concentration was ranged from < 0.005 mg/l to
0.13 mg/l.
On other hand the concentration of Cd (<0.02mg/l), Ni (< 0.01
mg/l), Pb (< 0.03 mg/l) and Se (< 0.04 mg/l) in the all samples were low
and below the instrument detection level. The analysis of trace elements
in groundwater shows that the results are below the specification limits
given by and WHO for drinking water.
Table (2) Trace elements concentrations (mg /l) of groundwater samples from
Nafoora oilfield
Well
NO
Ba
(mg) Cr Cu Cd Fe Ni Pb Se Sr V Zn
WSW
245 0.01 0.072 0.127 < 0.002 44.56 < 0.01 < 0.03 < 0.04 9.943 < 0.005 0.826
WSW
109 0.02 0.013 0.142 < 0.002 7.594 < 0.01 < 0.03 < 0.04 14.95 0.081 0.155
WSW
146 0.035 0.033 0.136 < 0.002 2.222 < 0.01 < 0.03 < 0.04 9.367 < 0.005 0.225
WSW
216 0.006 < 0.002 0.111 < 0.002 0.636 < 0.01 < 0.03 < 0.04 8.627 0.125 0.023
WSW
403 0.02 0.045 0.166 < 0.002 2.548 < 0.01 < 0.03 < 0.04 10.6 < 0.005 0.184
WSW
248 0.015 0.065 0.169 < 0.002 113.1 < 0.01 < 0.03 < 0.04 7.793 0.028 0.148
WSW 98 0.028 0.036 0.124 < 0.002 3.832 < 0.01 < 0.03 < 0.04 7.663 < 0.005 0.102
WSW 99 0.021 0.017 0.097 < 0.002 5.863 < 0.01 < 0.03 < 0.04 9.222 0.07 0.115
WSW
101 0.017 < 0.002 0.122 < 0.002 3.666 < 0.01 < 0.03 < 0.04 4.96 < 0.005 1.475
WSW 8 0.125 < 0.002 0.105 < 0.002 1.945 < 0.01 < 0.03 < 0.04 12.91 0.05 0.285

ــــــــــــــــــــــــــــــــــــــــــــــــــــــــــــــــــــــــــــــــــــــــــــــــــــــــــــــ Manal Elwahaishi & et.al.,
University Bulletin – ISSUE No.23- Vol. (3) – September- 2021.
عدد خاص بالمؤتمر العلمي الأول لكلية هندسة النفط والغاز
(دور علوم الأرض والبيئة في تنمية الاقتصاد الليبي)283
Groundwater Evolution:
Water types according to Piper diagram and stuff diagram
Classification of hydrochemical facies for groundwater according
to the Piper diagram and stuff diagram to explanation the concentration of
the Cations and Anions. In the Piper diagram shows in figure (9), all
water samples from groundwater wells are NaCl type figure (10) shown
this classification. Furthermore, in stuff diagram figure (11) shows the
concentration of the chemical elements that confirm the classification.
This classification is normal as a result of the marine lithology (Marada
Formation), and the lower part of Lower–Middle Miocene age of the
main aquifer is mainly carbonate and evaporate [7].
Figure (9) Piper diagram samples of groundwater wells

Evaluation of Hydro-geochemical properties of produced water ________________
University Bulletin – ISSUE No.23- Vol. (3) – September- 2021.
عدد خاص بالمؤتمر العلمي الأول لكلية هندسة النفط والغاز
( علوم الأرض والبيئة في تنمية الاقتصاد الليبيدور )
284
Fig. (10) Classification of Piper diagram of groundwater wells
Fig. (11) Stuff diagram samples of groundwater well

ــــــــــــــــــــــــــــــــــــــــــــــــــــــــــــــــــــــــــــــــــــــــــــــــــــــــــــــ Manal Elwahaishi & et.al.,
University Bulletin – ISSUE No.23- Vol. (3) – September- 2021.
عدد خاص بالمؤتمر العلمي الأول لكلية هندسة النفط والغاز
(دور علوم الأرض والبيئة في تنمية الاقتصاد الليبي)285
Results of Produced Water
Produced water contains a wide range of dissolved and suspended
materials include: cations, anions, as well as Heavy metals. The full
physical and chemical properties of the produced water samples collected
from the Nafoora oilfield are presented in Table (3).
pH and Temperature
At the site, pH and temperature of water samples were measured on
site using a calibrated portable instrument. The temperature of produced
water was ranged from 17.7 °C to 50.5 °C as shown in Table 3. The pH
values for produced water collected from the Nafoora oilfield indicates
that the pH are vary and ranged from 3.08 to 8.67.
Electrical Conductivity (EC)
The Electrical conductivity (EC) of the produced water were
ranged from 27800µs/cm to 420000µs/cm.
Chloride( Cl)
The data show relatively high concentrations of chloride ions
indicating the higher salinity of these produced water samples, since the
range of chloride ion concentration is 8216 mg/l–153370 mg/l.
Nitrate (NO3)
The concentrations ranged between 0.89 mg/l and 38.51 mg/l.
Total suspended solids (TSS) Measurement
Total suspended solids (TSS) are the dry-weight of suspended
particles that are not dissolved, in a sample of water that can be trapped
by a filter that is analyzed using a filtration apparatus. TSS in oil industry

Evaluation of Hydro-geochemical properties of produced water ________________
University Bulletin – ISSUE No.23- Vol. (3) – September- 2021.
عدد خاص بالمؤتمر العلمي الأول لكلية هندسة النفط والغاز
( علوم الأرض والبيئة في تنمية الاقتصاد الليبيدور )
286
consist of precipitated solids (scales), sand and silt, carbonates clays,
corrosion products and other suspended solids produced from the
formation and from well bore operations.
The measured concentrations of TSS in produced water collected
from Nafoora, which is ranged from 6 mg/l to 755 mg/l.
Total Dissolved Solid (TDS)
TDS values are varying through the process stages to the disposal
pits. The TDS values ranged from 19,600 mg/l to 294,000 mg/l. This
range is higher than Mediterranean Sea water (Da'as and Walraevens
2010) 41,393 mg/l.
This means that when produced water evaporates due to the high
temperatures and dry desert climate. Therefore, these elements are
concentrated on the soil and increase the soil salinity.
In addition, the results of produced water at the Nafoora oilfield in
Table (3) show that the SO4 concentrations range between 0 to 2400 mg/l
with, sulphate are present in high concentrations in some sampling point,
Similarly, the main cations, Na+, K, are found in high concentrations,
Na+ concentrations were ranged between 4650 to 54000 mg/l, K
concentrations were ranged from 165 to 1425 mg/l. The concentration of
the (NO2-) ranged from <0.002 mg/l to 0.335 mg/l.
Salinity Measurement
Dissolved solid concentration of produced water, which can
represent the salinity, may range from a few parts per thousand to the
saturated level, and most produced water, has greater salinity than
seawater. It is important to identify saline areas so they can be
appropriately managed; the results show the salinity concentrations
ranged from 13556 mg/l to 253061 mg/l.
ــــــــــــــــــــــــــــــــــــــــــــــــــــــــــــــــــــــــــــــــــــــــــــــــــــــــــــــ Manal Elwahaishi & et.al.,
University Bulletin – ISSUE No.23- Vol. (3) – September- 2021.
عدد خاص بالمؤتمر العلمي الأول لكلية هندسة النفط والغاز
(دور علوم الأرض والبيئة في تنمية الاقتصاد الليبي)287
Total Dissolved Solids (TDS) and Salinity Relationship
The relationship between total dissolved solids and salinity (Fig.
12) is a function of the type and nature of the dissolved cations and
anions in the water and possibly the nature of any suspended materials.
This relationship between the high salinity and higher TDS were noted as
shown in Figure and these results give an evidence of high concentrations
of cations and anions being carried by the produced water. However, if
produced water be accumulated in soil over for long time, it can be
damage the soil and change some of soil properties.
Chemical Oxygen Demand (COD)
Oil is one of the important contaminants in PW since it can
potentially cause toxic effects along the discard line. It can significantly
distribute the chemical oxygen demand (COD) and hence affect the
aquatic or marine ecosystems. COD concentration in produced water
which is ranged from 508 mg/l to 30825 mg /l.
Total Petroleum Hydrocarbon (TPH) and Total Organic Carbon in
produced water
The results of samples were determined throughout the production
process and at different points in the disposal pits. The total petroleum
hydrocarbons (TPH) concentrations of the produced water was vary and
ranged from 3 mg/l to 20 mg/l.
The concentration of total organic carbons in produced water
samples were varied and ranged from 2.40 mg/l to 171.70 mg/l. In other
words, this range means the produced water is s considered a pollutant of
petroleum products.

Evaluation of Hydro-geochemical properties of produced water ________________
University Bulletin – ISSUE No.23- Vol. (3) – September- 2021.
عدد خاص بالمؤتمر العلمي الأول لكلية هندسة النفط والغاز
( علوم الأرض والبيئة في تنمية الاقتصاد الليبيدور )
288
Fig. (12) Relationship between Salinity and TDS concentrations in PW in
Nafoora oil field

ــــــــــــــــــــــــــــــــــــــــــــــــــــــــــــــــــــــــــــــــــــــــــــــــــــــــــــــ Manal Elwahaishi & et.al.,
University Bulletin – ISSUE No.23- Vol. (3) – September- 2021.
عدد خاص بالمؤتمر العلمي الأول لكلية هندسة النفط والغاز
(دور علوم الأرض والبيئة في تنمية الاقتصاد الليبي)289
Table (3) Physical and chemical properties of the produced water samples
collected from the Nafoora oilfield
Trace elements Measurement
The trace elements concentrations of produced water samples
collected from the Nafoora oilfield show in Table (4). (Fe) concentrations
ranged between 0.66 mg/l to 982.17 mg/l (Ba) concentrations ranged
between 0.16 mg/l to 42.80 mg/l .(Sr) concentrations ranged from 26.01

Evaluation of Hydro-geochemical properties of produced water ________________
University Bulletin – ISSUE No.23- Vol. (3) – September- 2021.
عدد خاص بالمؤتمر العلمي الأول لكلية هندسة النفط والغاز
( علوم الأرض والبيئة في تنمية الاقتصاد الليبيدور )
290
mg/l to 1087.70 mg/l. The cause of these high concentrations of Ba and
Sr in produced water samples collected from station 8 of Nafoora oilfield
this was probably due to a consequence of precipitation of barium and
strontium sulfate scale. Table (4) shows the trace elements concentrations of produced water samples
the Nafoora oilfield

ــــــــــــــــــــــــــــــــــــــــــــــــــــــــــــــــــــــــــــــــــــــــــــــــــــــــــــــ Manal Elwahaishi & et.al.,
University Bulletin – ISSUE No.23- Vol. (3) – September- 2021.
عدد خاص بالمؤتمر العلمي الأول لكلية هندسة النفط والغاز
(دور علوم الأرض والبيئة في تنمية الاقتصاد الليبي)291
(Zn) concentration were found to be vary and ranged between <
0.001 mg/l to 491.08 mg/l. (Pb) concentration in produced water were
also vary and ranged from < 0.03 mg/l to 126.93 mg/l. Thus, the metals
show in Table such as (Cd), (Cr), (Cu), Selenium (Se) showed low
concentrations. Cd concentration ranged from < 0.002 mg/l to 1.95 mg/l.
Cr concentrations were ranged from < 0.002 mg/l to 0.096 mg/l .Cu
concentrations were ranged from < 0.002 mg/l to 0.18 mg/l. Se
concentrations ranged between < 0.04 mg/l to 0.958 mg/l. Some other
heavy metals such as (Ni) and (V) shows less than the instrument
detection limits, Ni < 0.01 mg/l and V < 0.005 mg/l [10].
CONCLUSION:
In Libya groundwater plays important role as a source of drinking
water both in urban and rural areas. Through this study and analysis of
samples for groundwater wells in Nafoora oilfield, it is non- suitable for
human consumption according to the WHO (1993) guidelines for
drinking water. Thus it can be suitable for urban activities.
The most important result in this study is there is no any
hydrocarbons in the groundwater wells samples. Therefore, periodic
analyses of these wells must be carried out by conducting full chemical
analyses to detect any change in groundwater quality.
Oilfield produced water contains various organic and inorganic
components; this water can pollute surface and underground water and
soil. In Nafoora oilfield the produced water is the main source of
pollution, it has many of pits overall the field. These pits have been
around this field for a long time and taken large extent, moreover, high
concentration of cations and anions in produced water caused by
accumulation of salts on the soil around the pit over long term of

Evaluation of Hydro-geochemical properties of produced water ________________
University Bulletin – ISSUE No.23- Vol. (3) – September- 2021.
عدد خاص بالمؤتمر العلمي الأول لكلية هندسة النفط والغاز
( علوم الأرض والبيئة في تنمية الاقتصاد الليبيدور )
292
disposing will change the structure of the soil and decrease its hydraulic
conductivity.
Recommendation:
Considering that the produced water is one of the most important
pollutants in the oil fields, as well as it high cost, must find suitable
solutions to get rid of this water such as:
1. Injection of produced water into the same formation from which the oil
is produced or handle to another formation.
2. Discharge: treatment of produced water to meet onshore or offshore
discharge regulations.
3. Reuse in oil and gas operation: treat the produced water to meet the
quality required to use it for usual oil and gas fields operations.
4. Consume in beneficial use: produced water treatment to meet to quality
required for beneficial uses such as irrigation, rangeland restoration,
cattle and animal consumption. This should be done within the
environmental criteria.

ــــــــــــــــــــــــــــــــــــــــــــــــــــــــــــــــــــــــــــــــــــــــــــــــــــــــــــــ Manal Elwahaishi & et.al.,
University Bulletin – ISSUE No.23- Vol. (3) – September- 2021.
عدد خاص بالمؤتمر العلمي الأول لكلية هندسة النفط والغاز
(دور علوم الأرض والبيئة في تنمية الاقتصاد الليبي)293
References:
[1] Guo T. Z., Banker B.C. , Devai. I, DeLaune .R. D, Lindau C. W,
Mulbah .C,and Gambrel . RP. (1999). Effects of produced water
dischar on bottom sediment chemistry. Wetland Biogeochemistry
Institute Louisiana State University.
[2] Noori Z., Jassim H. M., and Ahmed .F. R. (2014). Effect of crude oil
products on the geotechnical properties of soil. WIT Transactions on
Ecology and the Environment
[3] Alfarrah .N, Hweesh. A, Camp. M. V, and Walraevens. K. (2016)
Groundwater flow and chemistry of the oases of Al Wahat, NE
Libya. Environ Earth Sci (2016)
[4] Belazi .H.S .The geology of the Nafoora oilfield, Sirt basin,LIBYA.
Journal of Petroleum Geology,1989,24.
[5]EL Gushti,O. Nafoora field .EDIN, 2014 ,version 6.9.0.
[6] Rao.N.S, Vidyasagar G, Rao.P.S, Bhanumurthy.P. Chemistry and
quality of groundwater in a coastal regionof Andhra Pradesh, India.
Appl Water Sci (2017) 7:285–294.
[7] Rashrash S. M., Ben Ghawar B. M., and Hweesh A. M . Evaluating
Groundwater Pollution Using Hydrochemical Data: Case Study (Al
Wahat Area East of Libya). Journal of Water Resource and
Protection, 2015, 7, 369-377.
[8] Kabir M. A, Hossain .F, Hossain Md. K, and Omer M. (2018). Hydro-
geochemical evaluation of groundwater and aquifer characteristics-a
case study from sadar upazila of chapainawabganj district,
Bangladesh. International Journal of Advanced Research
2018. 6(4), 584-598.
Evaluation of Hydro-geochemical properties of produced water ________________
University Bulletin – ISSUE No.23- Vol. (3) – September- 2021.
عدد خاص بالمؤتمر العلمي الأول لكلية هندسة النفط والغاز
( علوم الأرض والبيئة في تنمية الاقتصاد الليبيدور )
294
[9] Edet. A., Nganje T. N, Ukpong A. J. and Ekwere A. S. (2011).
Groundwater chemistry and quality of Nigeria: A status review.
African Journal of Environmental Science and Technology Vol.
5(13), pp. 1152-1169.
[10] LPI Internal report (2019). Libyan Petroleum Institute.