Embed Size (px)
Citation preview
EVALUATION OF HIGH-PROTEIN CANOLA MEALS FED TO GROWING CHICKS AND
WEANLING PIGS
BY
CHELSIE KAY PARR
THESIS
Submitted in partial fulfillment of the requirements
for the degree of Master of Science in Animal Sciences
in the Graduate College of the
University of Illinois at Urbana-Champaign, 2014
Urbana, Illinois
Advisers:
Professor Hans H. Stein
Professor Carl M. Parsons
ii
ABSTRACT
Three experiments were conducted to determine and compare the nutritional value among 2
high-protein canola meals (CMA and CMB), conventional canola meal (CM-CV), and soybean
meal (SBM). The objective of Experiment 1 was to determine P bioavailability in the canola
meals and SBM relative to KH2PO4 when fed to growing chicks and to determine if P
bioavailability was increased by addition of microbial phytase to a P-deficient CMA diet. Results
indicated that as P level was increased by addition of KH2PO4, CMA, CMB, or SBM, weight
gain and tibia ash (mg/tibia and %) were increased linearly (P < 0.05). Based on tibia ash %,
bioavailabilities of P in CMA, CMB, conventional CM, and SBM relative to KH2PO4 were 15,
20, 13, and 42%, respectively. A linear increase (P < 0.05) in weight gain and tibia ash was
observed with addition of KH2PO4 or phytase to the P-deficient CMA diet. The addition of 250
or 500 units/kg microbial phytase to P-deficient CMA diets resulted in approximately 0.13 and
0.18% P being released, respectively, as estimated using the standard curve method. In
Experiment 2, the objective was to determine the digestibility of Ca and P in CMA and CMB fed
to growing pigs without or with the addition of microbial phytase, and to compare values
obtained in high-protein canola meal with digestibility of Ca and P in CM-CV and SBM. Results
indicated that apparent total tract digestibility (ATTD) of Ca and P and standardized total tract
digestibility (STTD) of P were not different among treatments. Apparent total tract digestibility
of Ca was 62, 66, 69, and 73% for CMA, CMB, CM-CV, and SBM, respectively. Standardized
total tract digestibility of P was 55, 60, 49, and 66% for CMA, CMB, CM-CV, and SBM,
respectively. Inclusion of phytase to the diets reduced both Ca and P outputs (P < 0.05).
Inclusion of phytase also improved (P < 0.05) ATTD of Ca and P and STTD of P, regardless of
the ingredient in the diet, and there was no interaction between diet and phytase supplementation.
iii
In Experiment 3, the objective was to evaluate effects of graded inclusion levels of CMA, CMB,
and CM-CV on growth performance, organ weights, bone ash, and blood characteristics of
weanling pigs. Results indicated that ADFI was linearly (P < 0.05) decreased if inclusion of
CMA, CMB, or CM-CV increased. Average daily gain of pigs fed CMA tended to increase
quadratically, with the maximum response observed if 10 or 20% canola meal was included in
the diet (P = 0.06). However, G:F was linearly (P < 0.05) increased by adding CMA or CM-CV
to the diets. Liver weights were also linearly (P < 0.05) increased if pigs were fed diets
containing CMB, but kidney weights were linearly (P < 0.05) decreased by adding CM-CV to
the diets. Thyroid gland weights increased linearly (P < 0.05) for pigs fed diets containing CMA.
Addition of any of the 3 canola meals linearly (P < 0.05) increased bone ash percentage in the
metacarpals. Inclusion of CMA or CM-CV linearly (P < 0.05) decreased serum triiodothyronine,
and the inclusion of CMA also linearly (P < 0.05) decreased serum thyroxine in weanling pigs.
In conclusion, CMA and CMB contained a numerically higher concentration of bioavailable P
when fed to chicks than the CM-CV, and bioavailability was numerically increased with addition
of microbial phytase. In contrast, there were no differences observed for ATTD of Ca or P or for
STTD of P when the canola meals or SBM were fed to growing pigs. Furthermore, inclusion of
any of the 3 canola meals up to 20% in diets for weanling pigs did not reduce growth
performance or negatively affect organ, bone, or blood characteristics.
iv
ACKNOWLEDGEMENTS
I would not have been able to complete this project without the unending support of my
advisers. Dr. Carl Parsons kindly took me into his lab, even though I had no poultry experience.
He graciously sent me to many conferences and conventions to allow me to increase my poultry
knowledge. Dr. Hans Stein spent 4 years trying to convince me to go to graduate school. Once I
decided he was right, he allowed to me remain part of his lab, despite the fact that he would have
to share me. He took me to Denmark to broaden my education and spent lots of hours reading
and correcting my writing. I would also like to thank Dr. George Fahey for serving on my
Masters committee.
Thank you to Chet Utterback, who provided me the opportunity to work through graduate
school and gain invaluable experience. His contributions to my future success are many. Many
thanks also to Pam Utterback, who has taught me more about poultry, research, and a good work
ethic than I ever knew there was to learn. She is the reason I want to find a career in research. I
would also like to thank the Poultry Farm and Swine Research Center staffs for their help
preparing for my experiments and moving animals around.
Thank you to all my lab mates, who helped me weigh and move animals and collect
samples. I would also like to thank my parents, who have given me guidance and support
throughout graduate school, but especially my mom, who has introduced me to many people in
the industry and allowed to me make contacts that I will have for the rest of my career. Finally,
thank you to my fiancé and friends for loving me and being there for me through all the busy
times.
v
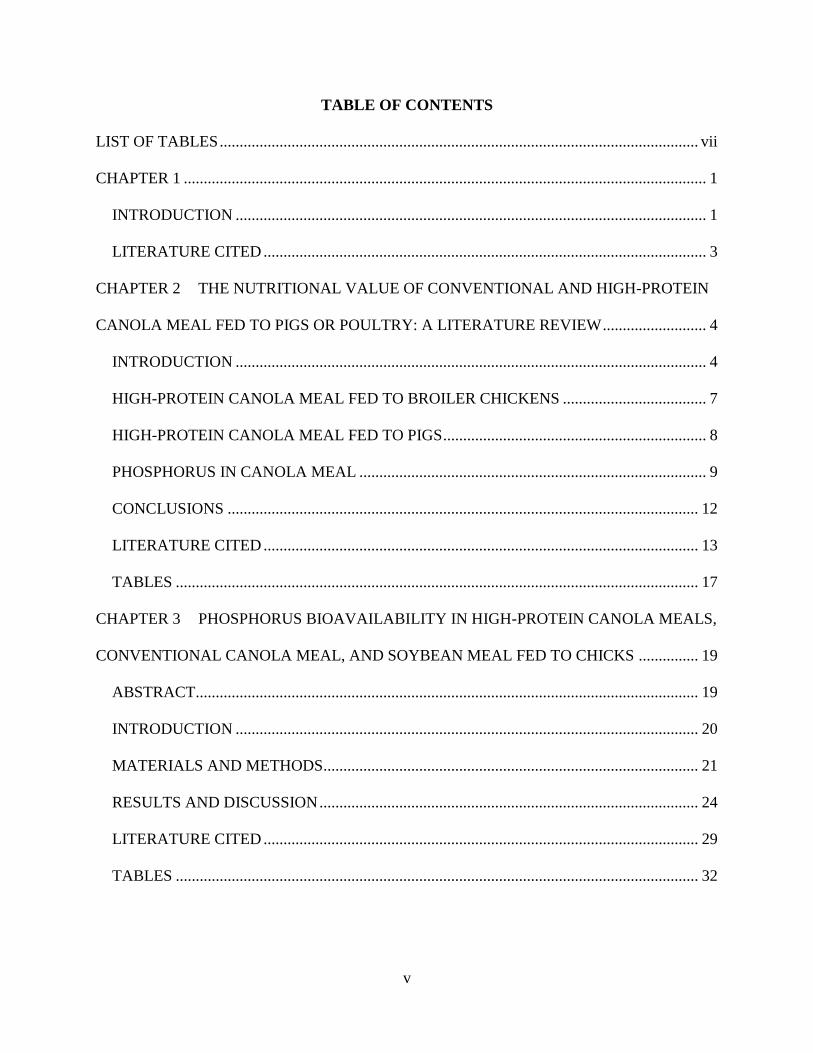
TABLE OF CONTENTS
LIST OF TABLES ........................................................................................................................ vii
CHAPTER 1 ................................................................................................................................... 1
INTRODUCTION ...................................................................................................................... 1
LITERATURE CITED ............................................................................................................... 3
CHAPTER 2 THE NUTRITIONAL VALUE OF CONVENTIONAL AND HIGH-PROTEIN
CANOLA MEAL FED TO PIGS OR POULTRY: A LITERATURE REVIEW .......................... 4
INTRODUCTION ...................................................................................................................... 4
HIGH-PROTEIN CANOLA MEAL FED TO BROILER CHICKENS .................................... 7
HIGH-PROTEIN CANOLA MEAL FED TO PIGS .................................................................. 8
PHOSPHORUS IN CANOLA MEAL ....................................................................................... 9
CONCLUSIONS ...................................................................................................................... 12
LITERATURE CITED ............................................................................................................. 13
TABLES ................................................................................................................................... 17
CHAPTER 3 PHOSPHORUS BIOAVAILABILITY IN HIGH-PROTEIN CANOLA MEALS,
CONVENTIONAL CANOLA MEAL, AND SOYBEAN MEAL FED TO CHICKS ............... 19
ABSTRACT .............................................................................................................................. 19
INTRODUCTION .................................................................................................................... 20
MATERIALS AND METHODS .............................................................................................. 21
RESULTS AND DISCUSSION ............................................................................................... 24
LITERATURE CITED ............................................................................................................. 29
TABLES ................................................................................................................................... 32
vi
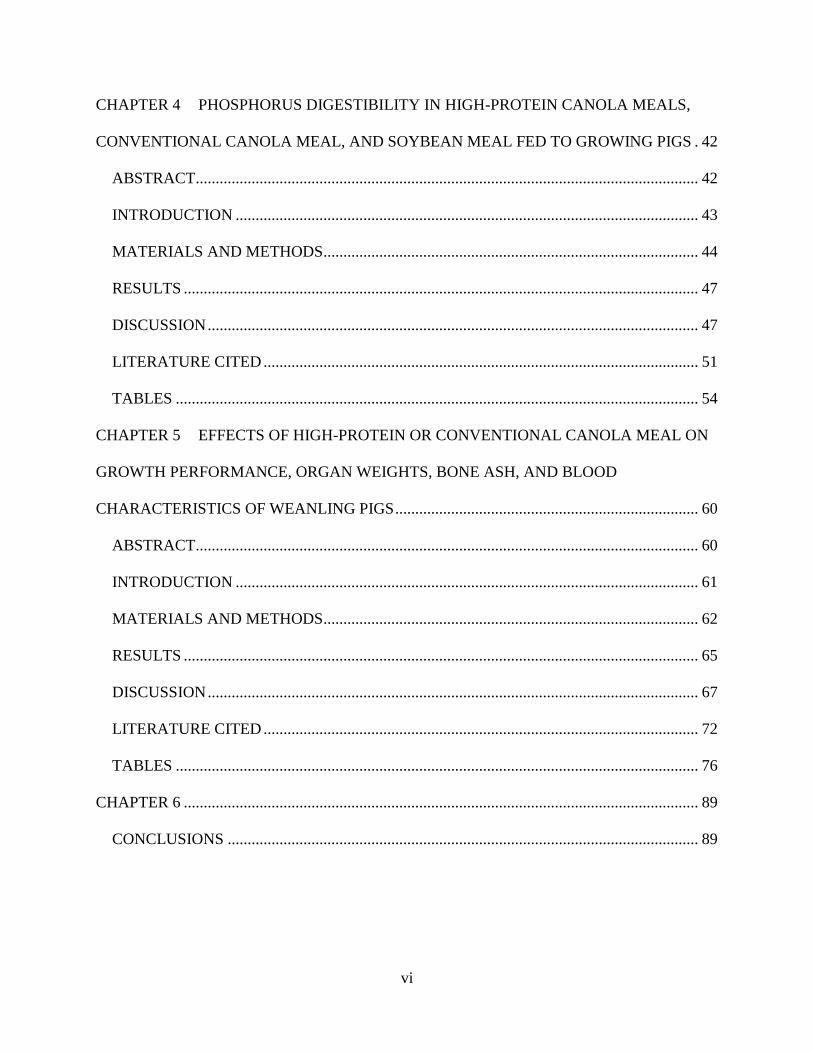
CHAPTER 4 PHOSPHORUS DIGESTIBILITY IN HIGH-PROTEIN CANOLA MEALS,
CONVENTIONAL CANOLA MEAL, AND SOYBEAN MEAL FED TO GROWING PIGS . 42
ABSTRACT .............................................................................................................................. 42
INTRODUCTION .................................................................................................................... 43
MATERIALS AND METHODS .............................................................................................. 44
RESULTS ................................................................................................................................. 47
DISCUSSION ........................................................................................................................... 47
LITERATURE CITED ............................................................................................................. 51
TABLES ................................................................................................................................... 54
CHAPTER 5 EFFECTS OF HIGH-PROTEIN OR CONVENTIONAL CANOLA MEAL ON
GROWTH PERFORMANCE, ORGAN WEIGHTS, BONE ASH, AND BLOOD
CHARACTERISTICS OF WEANLING PIGS ............................................................................ 60
ABSTRACT .............................................................................................................................. 60
INTRODUCTION .................................................................................................................... 61
MATERIALS AND METHODS .............................................................................................. 62
RESULTS ................................................................................................................................. 65
DISCUSSION ........................................................................................................................... 67
LITERATURE CITED ............................................................................................................. 72
TABLES ................................................................................................................................... 76
CHAPTER 6 ................................................................................................................................. 89
CONCLUSIONS ...................................................................................................................... 89
vii
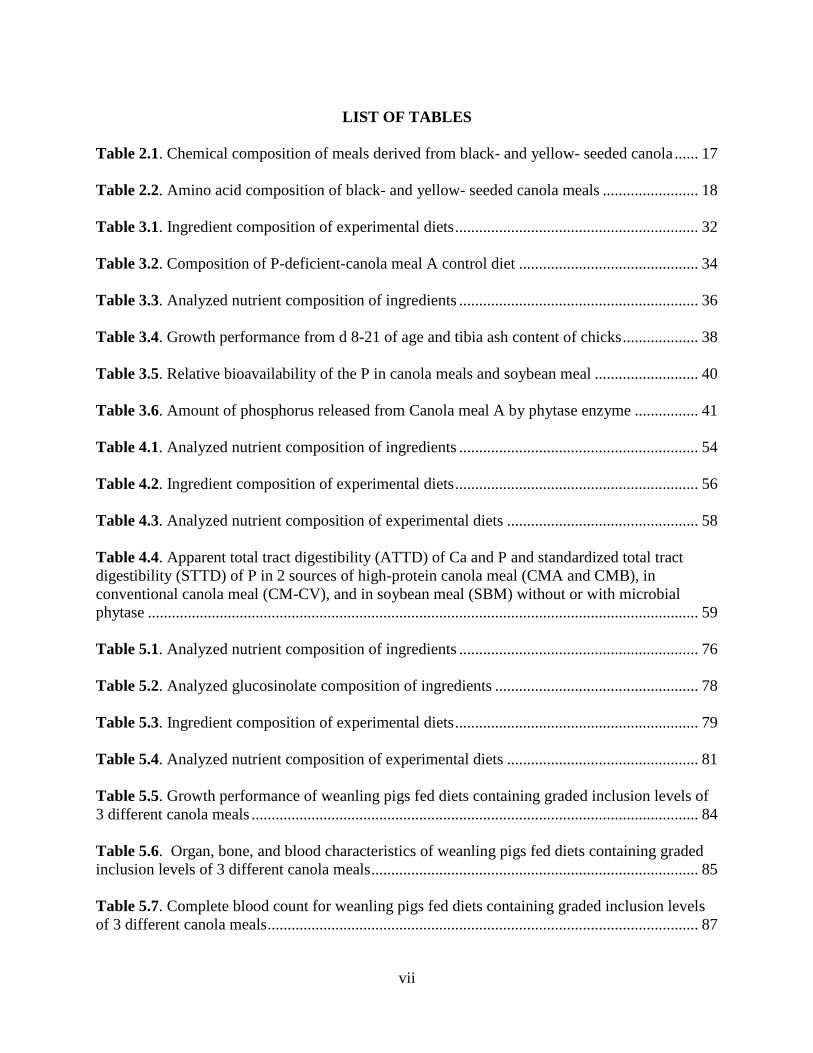
LIST OF TABLES
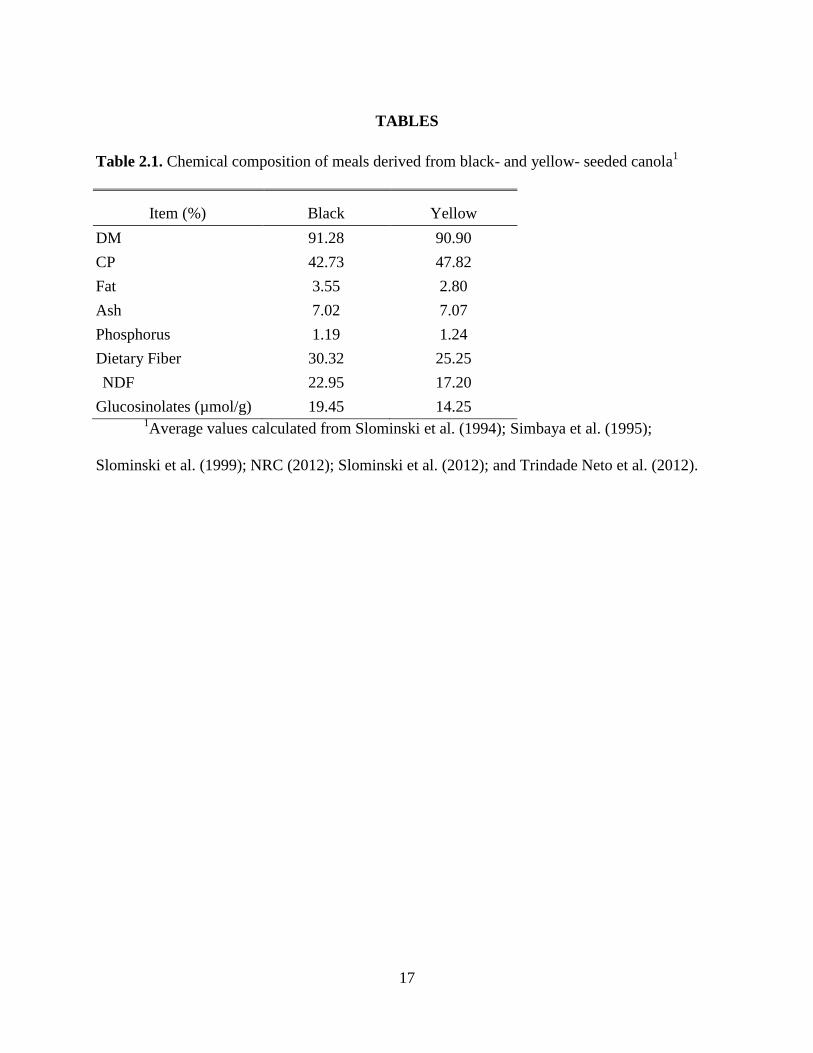
Table 2.1. Chemical composition of meals derived from black- and yellow- seeded canola ...... 17
Table 2.2. Amino acid composition of black- and yellow- seeded canola meals ........................ 18
Table 3.1. Ingredient composition of experimental diets ............................................................. 32
Table 3.2. Composition of P-deficient-canola meal A control diet ............................................. 34
Table 3.3. Analyzed nutrient composition of ingredients ............................................................ 36
Table 3.4. Growth performance from d 8-21 of age and tibia ash content of chicks ................... 38
Table 3.5. Relative bioavailability of the P in canola meals and soybean meal .......................... 40
Table 3.6. Amount of phosphorus released from Canola meal A by phytase enzyme ................ 41
Table 4.1. Analyzed nutrient composition of ingredients ............................................................ 54
Table 4.2. Ingredient composition of experimental diets ............................................................. 56
Table 4.3. Analyzed nutrient composition of experimental diets ................................................ 58
Table 4.4. Apparent total tract digestibility (ATTD) of Ca and P and standardized total tract
digestibility (STTD) of P in 2 sources of high-protein canola meal (CMA and CMB), in
conventional canola meal (CM-CV), and in soybean meal (SBM) without or with microbial
phytase .......................................................................................................................................... 59
Table 5.1. Analyzed nutrient composition of ingredients ............................................................ 76
Table 5.2. Analyzed glucosinolate composition of ingredients ................................................... 78
Table 5.3. Ingredient composition of experimental diets ............................................................. 79
Table 5.4. Analyzed nutrient composition of experimental diets ................................................ 81
Table 5.5. Growth performance of weanling pigs fed diets containing graded inclusion levels of
3 different canola meals ................................................................................................................ 84
Table 5.6. Organ, bone, and blood characteristics of weanling pigs fed diets containing graded
inclusion levels of 3 different canola meals .................................................................................. 85
Table 5.7. Complete blood count for weanling pigs fed diets containing graded inclusion levels
of 3 different canola meals ............................................................................................................ 87
1
CHAPTER 1
INTRODUCTION
The term “canola” is used to define a variety of rapeseed that is low in glucosinolates and
erucic acid (Khajali and Slominski, 2012). Canola seeds are small and round and can vary in size
and shape. They are produced by a yellow-flowering plant that grows in northern areas where
soybeans do not mature very rapidly. In terms of production, canola is the second largest oilseed
crop after soybeans (USDA, 2012), but has a greater and healthier oil content, making it more
desirable for human consumption (Daun, 2011). After extraction of the oil for the food industry,
the leftover meal is used as a feed ingredient for livestock. Canola meal has traditionally been
fed to ruminants due to the high fiber content, which is poorly digested by pigs and poultry.
Additionally, although canola meal typically contains more total P than soybean meal, a higher
proportion of the total P in canola meal is bound to phytate (NRC, 2012), resulting in decreased
availability and increased excretion. In addition to fiber and phytate, canola contains several
other anti-nutritional factors that make it less desirable than soybean meal for pigs and poultry.
These anti-nutrients include glucosinolates, erucic acid, tannins, and sinapine which may reduce
feed intake as well as digestibility of nutrients (Bell, 1993).
In response to the limitations of feeding canola meal, canola breeding programs have
aimed at reducing these anti-nutritional factors as well as increasing the protein content to better
rival that of soybean meal (SBM) (Khajali and Slominski, 2012). Canola meal is already
required to have less than 2% erucic acid and less than 30 µmol/g glucosinolates to use the name
“canola” (Bell, 1993). However, further reductions in glucosinolates as well as fiber are
beneficial for livestock, especially pigs and poultry. Supplementation of phytase to diets
2
containing canola meal has resulted in improved P digestibility as well as decreased P output
(Simons et al., 1990; Selle and Ravindran, 2007; Akinmusire and Adeola, 2009). Additionally,
an increase in the protein content of canola meal (38% CP) would make it more competitive with
dehulled SBM (48% CP) in the feeding of pigs and poultry.
New, yellow-seeded varieties of canola have a larger seed with a thinner hull when
compared to black-seeded varieties (Thacker, 1990; Slominski et al., 1994; Khajali and
Slominski, 2012). This thinner hull contributes less fiber to the total seed than the traditional
black-seeded varieties, resulting in a meal with lower fiber content. In addition, the embryo
makes up a larger proportion of the total seed, providing greater protein content. Because of
these changes in composition, it is believed that meal produced from yellow-seeded canola has a
greater nutritional value than meal produced from the black-seeded varieties. However, research
is needed to determine if yellow-seeded varieties have improved nutritional value if fed to pigs
or poultry compared with the black-seeded varieties.
3
LITERATURE CITED
Akinmusire, A. S., and O. Adeola. 2009. True digestibility of phosphorus in canola and soybean
meals for growing pigs: Influence of microbial phytase. J. Anim. Sci. 87:977-983.
Bell, J. M. 1993. Factors affecting the nutritional value of canola meal: A review. Can. J. Anim.
Sci. 73:679-697.
Daun, J. K. 2011. Origin, distribution, and production. In: J. K. Daun, N. A. M. Eskin, and D.
Hickling, editors, Canola: Chemistry, production, processing, and utilization. AOCS
Press, Urbana, IL. p. 1-27.
Khajali, F., and B. A. Slominski. 2012. Review: Factors that affect the nutritive value of canola
meal for poultry. Poult. Sci. 91:2564-2575.
NRC. 2012. Nutrient requirements of swine. 11th
rev. ed. Natl. Acad. Press, Washington, DC.
Selle, P. H. and V. Ravindran. 2007. Microbial phytase in poultry nutrition: Review. Anim. Feed
Sci. Technol. 135:1-41.
Simons, P. C. M., H. A. J. Versteegh, A. W. Jongbloed, P. A. Kemme, P. Slump, K. D. Bos, M.
G. E. Wolters, R. F. Beudeker, and G. J. Verschoor. 1990. Improvement of phosphorus
availability by microbial phytase in broilers and pigs. Br. J. Nutr. 64:525-540.
Slominski, B. A., L. D. Campbell, and W. Guenter. 1994. Carbohydrates and dietary fiber
components of yellow- and brown-seeded canola. J. Agric. Food Chem. 42:704-707.
Thacker, P. A. 1990. Canola meal. In: P. A. Thacker and R. N. Kirkwood, editors, Nontraditional
feed sources for use in swine production. Butterworth Publishers, Stoneham, MA. p. 69-
78.
United States Department of Agriculture. 2012. Soybeans and oil crops: Canola. http://www.ers.
usda.gov/topics/crops/soybeans-oil-crops/canola.aspx. (Accessed 2 March 2014.)
4
CHAPTER 2
THE NUTRITIONAL VALUE OF CONVENTIONAL AND HIGH-PROTEIN CANOLA
MEAL FED TO PIGS OR POULTRY: A LITERATURE REVIEW
INTRODUCTION
Rapeseed is an oilseed of the Brassica species that has been grown for centuries in many
different parts of the world. Through the years, plant breeders have been able to improve the
nutritional quality of rapeseed so that it is more valuable as a feed ingredient to livestock, in part
by selecting against anti-nutritional factors. Rapeseed (Brassica rapa) traditionally contained 25
to 45% erucic acid and 50 to 100 µmol/g glucosinolates (Bell, 1993). Erucic acid causes fatty
deposits on the heart and skeletal muscle as well as growth retardation (Przybylski and Eskin,
2011). Glucosinolates are not a problem themselves, but myrosinase, an enzyme present in
rapeseed, degrades the glucosinolates into toxic metabolites (Fenwick and Curtis, 1980). In pigs
and poultry, these metabolites may cause reduced feed intake, thyroid enlargement, decreased
thyroid hormone production, liver enlargement, liver hemorrhages, kidney enlargement, taint in
brown eggs, and perosis in chicks (Fenwick and Curtis, 1980; Bell, 1993). Therefore, rapeseed
meal has traditionally only been fed to ruminant animals, as they are less sensitive to
glucosinolates (Burel et al., 2000). Through plant breeding, erucic acid levels have been brought
below 2% and glucosinolate levels below 30 µmol/g, resulting in “double-low” rapeseed. These
“double-low” varieties are called “canola” in North America (Bell, 1993).
In addition to erucic acid and glucosinolates, canola contains other anti-nutritional factors
such as tannins, sinapine, phytic acid, and fiber (Bell, 1993; Khajali and Slominski, 2012).
Tannins, which are present in the hull portion of canola, decrease energy digestibility and may
5
form complexes with protein, decreasing the digestibility of protein in the diet (Thacker, 1990;
Khajali and Slominski, 2012). Making up 1.5 to 3% of canola meal (Bell, 1993), tannins give the
meal its dark color and 70 to 96% of the tannins in canola meal are insoluble (Khajali and
Slominski, 2012). Mansoori and Acamovic (2007) observed increased endogenous losses of Met,
Lys, and His following dietary addition of water-soluble tannins, or tannic acid. Because Met
and Lys are the first limiting AA for pigs and poultry, the presence of tannins in canola meal
prevents use of high inclusions of canola meal in diets for these animals. Sinapine resides in the
embryo of the canola seed and causes a bitter taste which decreases feed intake when high levels
of canola meal are fed (Thacker, 1990). Canola meal can contain 0.6 to 1.8% sinapine (Bell,
1993). Research has also shown that the presence of sinapine at high levels causes a fishy taint in
the eggs of brown egg layers. This is a result of the hens lacking the enzyme trimethylamine
oxidase, rendering them unable to handle the high amounts of choline produced from hydrolysis
of sinapine. The enzyme deficiency causes a buildup of trimethylamine, which is then transferred
to the eggs (Bell, 1993; Khajali and Slominski, 2012).
Phytic acid, or phytate, is the primary storage form of P, binding it and reducing P
absorption and utilization by pigs and poultry (Nwokolo and Bragg, 1977; Khajali and
Slominski, 2012). Phytate also binds Ca, Fe, K, Mn, Mg, and Zn and reduces the availability of
these minerals (Nwokolo and Bragg, 1977). Phytate may also bind free Lys as well as protein,
forming phytate-protein complexes that reduce protein digestion (Kies et al., 2006). Addition of
microbial phytase to diets hydrolyzes some of these complexes, resulting in more available P and
Ca for the animal (Simons et al., 1990; Selle et al., 2009; González-Vega et al., 2013). Protein
and minerals other than Ca and P that are bound by phytate may also be made more available by
the addition of exogenous phytase. Canola meal, unlike soybean meal (SBM), contains all the
6
hulls from the seeds, resulting in greater fiber content than SBM. Fiber, in addition to being
poorly digested by pigs and poultry, binds minerals such as P, Ca, Mg, Mn, Zn, and Cu and also
decreases the energy value of the meal (Nwokolo and Bragg, 1977; Bell, 1993).
Canola contains 44 to 50% oil, of which 97 to 99% is removed by prepress solvent
extraction (Barthet and Daun, 2011) to make the meal. This oil is marketed in the food industry
as the vegetable oil with the lowest saturated fatty acid content, containing only approximately
50% of the amount of saturated fatty acids in corn and soybean oil (Aukema and Campbell,
2011). Canola meal contains 36 to 44% CP (Akinmusire and Adeola, 2009; Barthet and Daun,
2011; Khajali and Slominski, 2012; Slominski et al., 2012; González-Vega et al., 2013;
Rodríguez et al., 2013). The concentration of NDF in canola meal is 22 to 26% compared with 8
to 12% in SBM (Slominski et al., 1994; Khajali and Slominski, 2012; NRC, 2012).
Canola breeding programs have produced yellow-seeded varieties of canola that are
nutritionally superior to conventional black-seeded varieties. These yellow-seeded varieties have
increased CP and decreased fiber because yellow seeds are larger and have a thinner hull than
brown seeds (Downey and Bell, 1990; Thacker, 1990; Khajali and Slominski, 2012; Table 2.1).
The larger seed contributes proportionally more embryo to the whole seed, which is where most
of the protein resides. As a consequence, canola meal derived from yellow-seeded canola
contains 46 to 50% CP (Simbaya et al., 1995; Slominski et al., 2012) and also contains greater
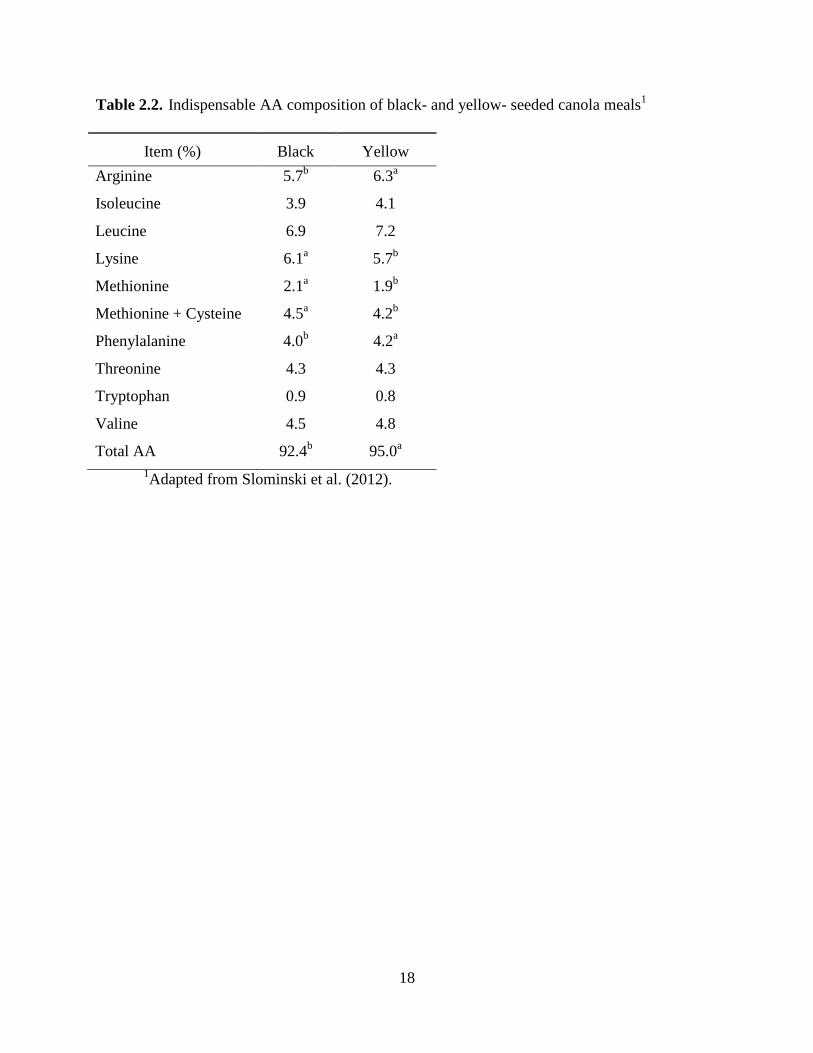
AA concentrations than black-seeded canola meal (Slominski et al., 2012; Table 2.2). The
thinner hull also contributes proportionally less of the whole seed, resulting in less dietary fiber
in the meal from yellow-seeded varieties (Khajali and Slominski, 2012). Therefore, dietary fiber
concentration of canola meal from yellow-seeded canola is 24 to 27% compared with 30 to 34%
dietary fiber in canola meal from black-seeded varieties of canola (Slominski et al., 1994;
7
Simbaya et al., 1995; Slominski et al., 1999; Slominski et al., 2012). The yellow-seeded canola
meal contains less oil than conventional canola meal (Simbaya et al., 1995; Slominski et al.,
1999; Slominski et al., 2012). Yellow-seeded canola meal also contains approximately 10
µmol/g less glucosinolates than black-seeded canola meal (Daun and DeClercq, 1988; Slominski
et al., 2012). The changed nutrient composition of canola meal from yellow-seeded canola
compared with meal from black-seeded canola makes it necessary to conduct research on the
value of yellow-seeded canola meal as a feed ingredient in diets fed to pigs or poultry.
HIGH-PROTEIN CANOLA MEAL FED TO BROILER CHICKENS
Slominski et al. (1999) compared brown- and yellow-seeded varieties of Brassica napus
in a growth trial from 4 to 18 d of age. The CP content of the yellow-seeded canola meal was
0.8% greater than in the brown-seeded meal and the yellow-seeded meal contained 5.9% less
dietary fiber and 13% less fat than the brown-seeded meal. Glucosinolate concentration in the 2
meals was not different. The brown and yellow-seeded canola meals were included in
experimental diets at 29.7 and 29.5%, respectively. Weight gain of broilers fed the 2 canola meal
varieties was not different, however, the feed to gain ratio was improved for birds fed diets
containing the yellow-seeded canola meal. Data for feed intake were not reported, but
presumably, feed intake was less for birds fed diets containing the yellow-seeded canola meal.
Slominski et al. (1999) concluded that the yellow-seeded Brassica napus was superior to the
black-seeded canola meal of the same species.
Jia et al. (2012) conducted a similar experiment to compare the effects of yellow- or
black-seeded B. napus on the growth performance of broilers from 3 to 17 d of age. The yellow-
seeded canola meal contained 6% more CP and 6% less fiber, 0.06% less P, and 10% less
8
glucosinolates than the black-seeded canola meal (Slominski et al., 2012). No differences were
observed for BW gain, feed intake, or feed:gain. The greatest digestibility values for total and
indispensable AA were for diets containing the yellow-seeded canola meal, indicating that
protein from the yellow-seeded canola meal is more digestible that protein from the black-seeded
meal. Additionally, the yellow-seeded canola meal contained the greatest amount of ME. It was
concluded that the yellow-seeded B. napus had superior quality characteristics in terms of
available energy and AA content, but it is not clear why broilers fed the yellow-seeded canola
meal did not out-perform broilers fed black-seeded canola meal.
HIGH-PROTEIN CANOLA MEAL FED TO PIGS
Montoya and Leterme (2009) conducted an experiment to compare the DE and NE in
yellow- and black-seeded canola meals fed to growing pigs. The yellow-seeded B. napus
contained 5.2% more CP and 4.9% less NDF, 6.4% less ADF, and 3.3% less lignin than black-
seeded canola meal. Pigs fed diets containing the yellow-seeded canola meal had 2-4% greater
digestibility of DM and 2-5% greater digestibility of GE and the yellow-seeded canola meal
contained more DE and NE than the black-seeded canola meal.
Trindade Neto et al. (2012) conducted an experiment to determine the apparent and
standardized ileal digestibility of protein and AA in yellow- and black-seeded canola meals fed
to pigs. The yellow-seeded B. napus contained 5% more CP and 5.5% less total dietary fiber than
the black seeded B. napus. However, there were no differences for apparent or standardized ileal
digestibility of CP or AA between the 2 meals. Sanjayan (2013) conducted a similar experiment;
however, the yellow-seeded B. napus contained 1.7% less CP, 0.6% less fat, and 3.8% less
glucosinolates, but 3.7% more fiber than black-seeded canola meal, which is contradictory to the
9
composition of meals used in the previous experiment. The author attributed these differences to
cultivar and processing condition. Therefore, growing pigs fed diets containing the yellow-
seeded canola meal had 7.9% lower apparent and 6.5% lower standardized ileal digestibility
values of protein as well as lower apparent and standardized ileal digestibility values of Lys,
Met, Thr, Val, Ala, Asp, Cys, Gly, and Ser than pigs fed diets containing the black-seeded canola
meal.
PHOSPHORUS IN CANOLA MEAL
Conventional black-seeded canola meal contains 1.00 to 1.08% P (Bell, 1993; Khajali
and Slominski, 2012; NRC, 2012; González-Vega et al., 2013; Rodríguez et al., 2013). Of this,
about two-thirds is bound to phytate (Simons et al., 1990), making it largely unavailable to pigs
and poultry, which lack sufficient endogenous phytase to completely hydrolyze the phytate-P
complexes (Selle and Ravindran, 2007; Akinmusire and Adeola, 2009). There are few published
values for the P content of high-protein canola meal from yellow-seeded varieties of canola.
Slominski et al. (2012) reported a P content of 1.30% for black-seeded canola meal, a much
greater value than reported by others, and 1.24% for yellow-seeded canola meal. Whereas the
phytate-bound P concentration was similar between the 2 canola meals, the concentration of non-
phytate-bound P was less in the yellow-seeded canola meal (Slominski et al., 2012). This
indicates that P digestibility may be less in the yellow-seeded canola meal than in the black-
seeded canola meal.
Phosphorus Digestibility by Broilers
Mutucumarana et al. (2014) conducted an experiment to determine P availability of
canola meal when fed to broiler chickens. Diets were formulated to contain graded
10
concentrations of total P, where canola meal was the only source of P in the diet. Total tract
digestibility of P and true ileal digestibility of P were calculated. The apparent ileal P
digestibility of canola meal was not different among different dietary P concentrations and the
coefficient for P retention decreased from 0.697 to 0.539 with increasing P concentrations. There
was a difference in P output between the excreta and ileal contents, indicating that there was
post-ileal absorption of P. Phytate-P hydrolysis in canola meal was 25.2%, but the authors noted
that utilization of phytate-P in chickens can vary widely and can be influenced by dietary factors
such as low Ca concentrations which were present in these diets.
There are few other articles discussing P digestibility of canola meal in broiler chickens.
However, dietary addition of phytase increases bioavailable P and reduces P excretion (Selle and
Ravindran, 2007). Simons et al. (1990) conducted an experiment to evaluate the effect of phytase
on phosphorus availability to broilers. Addition of phytase to maize-sorghum-SBM diets
increased the availability of P to over 60% and decreased the amount of P in the excreta by 50%.
Similarly, Paik (2003) conducted multiple broiler trials to determine the effect of phytase
supplementation on P excretion. By supplementing phytase to corn-SBM diets, levels of non-
phytate-P in the diets were decreased 0.2% without affecting growth performance. Phytase also
increased availability of P by up to 14.8% and availability of some other minerals by up to 30%
and decreased P excretion by up to 60%. Zyla and Koreleski (1993) also observed the positive
effects of dietary phytase addition, allowing for elimination of inorganic phosphate from
formulation of diets containing rapeseed meal with high levels of phytate P. Sebastian et al.
(1996) observed increased retention of P, Ca, Cu, and Zn (12.4, 12.2, 19.3, and 62.3%,
respectively) when phytase was added to a low-P corn-SBM diet as well as 13.2% increased BW
11
gain. More research is needed to determine the effect of microbial phytase on the P availability
of canola meal when fed to broiler chickens.
Phosphorus Digestibility by Pigs
Akinmusire and Adeola (2009) conducted an experiment with growing pigs to estimate
the true P digestibility of canola meal or SBM, where the canola meal or SBM was the only
source of dietary P. Apparent total tract digestibility (ATTD) of P from canola meal ranged from
26 to 33%, depending on the dietary inclusion level of canola meal. The ATTD of P from
soybean meal was 34 to 38%, despite the SBM having much less total P than the canola meal.
There was also greater P output from pigs fed diets containing canola meal compared with those
fed diets containing SBM. The addition of microbial phytase to diets containing phytate-bound P
usually improves P digestibility and decreases P output (Simons et al., 1990; Kies et al., 2006),
and inclusion of phytase to diets containing canola meal and fed to pigs, increases true P
digestibility and decreases total P output (Akinmusire and Adeola, 2009; González-Vega et al.,
2013; Rodríguez et al., 2013).
Addition of phytase to diets containing canola meal can increase ATTD of Ca by
hydrolyzing phytate-Ca bonds. González-Vega et al. (2013) conducted an experiment feeding 4
different levels of canola meal without or with microbial phytase to weaned barrows. Diets were
formulated to contain 0.32% standardized total tract digestible P and increasing levels of Ca.
Inclusion of microbial phytase to the diets increased ATTD of P as well as ATTD of Ca.
Likewise, Rodríguez et al. (2013) conducted an experiment feeding diets containing 1 of 7
different ingredients, including canola meal, without or with microbial phytase to growing
barrows. Inclusion of phytase to diets containing any of the ingredients except de-hulled
sunflower meal increased ATTD of P by anywhere from 15 to 22 percentage units and increased
12
standardized total tract digestibility (STTD) of P by 15 to 25 percentage units. Phytase inclusion
decreased P output from the canola meal diet by 32%. Addition of phytase to diets containing
canola seeds, canola meal, sunflower seeds, or sunflower meal increased Ca digestibility by 11 to
19 percentage units.
CONCLUSIONS
High-protein, yellow-seeded canola meal has a higher concentration of CP and decreased
concentration of fiber and glucosinolates compared with conventional canola meal. This
indicates improved feeding value for pigs and poultry. Canola meal contains more P than SBM,
but a greater proportion of the P is bound to phytate, limiting P digestibility and absorption.
Yellow-seeded canola meal also contains more phytate-bound P than the black-seeded varieties,
indicating reduced P digestibility. However, the inclusion of microbial phytase to corn-SBM
diets and diets containing canola meal for pigs and poultry results in increased hydrolysis of
phytate-P complexes and improves P absorption. Improved P digestibility and decreased P
excretion in canola meal diets supplemented with microbial phytase for pigs have been
documented. Whereas no research has been conducted to determine P availability in high-protein
canola meal for poultry, it has been documented that microbial phytase inclusion in both corn-
SBM and rapeseed meal diets for broiler chickens results in increased digestibility of P and other
minerals. More research is needed to determine the effect of microbial phytase on P availability
in canola meal when fed to broilers and to further evaluate its effect on P availability of canola
meal when fed to pigs. Research is also needed to evaluate the effect of feeding high-protein
canola meal compared with conventional canola meal on growth performance, organ, bone, and
blood characteristics of pigs.
13
LITERATURE CITED
Akinmusire, A. S., and O. Adeola. 2009. True digestibility of phosphorus in canola and soybean
meals for growing pigs: Influence of microbial phytase. J. Anim. Sci. 87:977-983.
Aukema, H., and L. Campbell. 2011. Oil nutrition and utilization. In: J. K. Daun, N. A. M.
Eskin, and D. Hickling, editors, Canola: Chemistry, production, processing, and
utilization. AOCS Press, Urbana, IL. p. 245-280.
Barthet, V. J., and J. K. Daun. 2011. Seed Morphology, composition, and quality. In: J. K. Daun,
N. A. M. Eskin, and D. Hickling, editors, Canola: Chemistry, production, processing, and
utilization. AOCS Press, Urbana, IL. p. 119-162.
Bell, J. M. 1993. Factors affecting the nutritional value of canola meal: A review. Can. J. Anim.
Sci. 73:679-697.
Burel, C., T. A. Boujard, A. M. Escaffre, S. J. Kaushik, G. Boeuf, K. A. Mol, S. Van der Geyten,
and E. R. Kuhn. 2000. Dietary low glucosinolate rapeseed meal affects thyroid status and
nutrient utilization in rainbow trout (Oncohynchus mykiss). Br. J. Nutr. 83:653-664.
Daun, J. K., and D. R. DeClercq. 1988. Quality of yellow and dark seed in Brassica campestris
canola varieties Candle and Tobin. J. Am. Oil Chem. Soc. 65:122-126.
Downey R. K., and J. M. Bell. 1990. New developments in canola research. In: F. Shahidi,
editor, Canola and rapeseed: Production, chemistry, nutrition and processing technology.
Springer US, New York. p. 37-46.
Fenwick, G. R., and R. F. Curtis. 1980. Rapeseed meal and its use in poultry diets. A review.
Anim. Feed Sci. Technol. 5:255-298.
14
González-Vega, J. C., C. L. Walk, Y. Liu, and H. H. Stein. 2013. Endogenous intestinal losses of
calcium and true total tract digestibility of calcium in canola meal fed to growing pigs. J.
Anim. Sci. 91:4807-4816.
Jia, W., D. Mikulski, A. Rogiewicz, Z. Zduńczyk, J. Jankowski, and B. A. Slominski. 2012.
Low-fiber canola. Part 2. Nutritive value of the meal. J. Agric. Food Chem. 60:12231-
12237.
Khajali, F., and B. A. Slominski. 2012. Review: Factors that affect the nutritive value of canola
meal for poultry. Poult. Sci. 91:2564-2575.
Kies, A. K., L. H. De Jonge, P. A. Kemme, and A. W. Jongbloed. 2006. Interaction between
protein, phytate, and microbial phytase. In vitro studies. J. Agric. Food Chem. 54:1753-
1758.
Mansoori, B., and T. Acamovic. 2007. The effect of tannic acid on the excretion of endogenous
methionine, histidine and lysine with broilers. Anim. Feed Sci. Technol. 134:198-210.
Montoya, C. A., and P. Leterme. 2009. Determination of the digestible energy and prediction of
the net energy content of toasted and non-toasted canola meals from Brassica juncea and
Brassica napus in growing pigs by the total faecal collection and the indigestible marker
methods. Can. J. Anim. Sci. 89:481-487.
Mutucumarana, R. K., V. Ravindran, G. Ravindran, and A. J. Cowieson. 2014. Measurement of
true ileal digestibility and total tract retention of phosphorus in corn and canola meal for
broiler chickens. Poult. Sci. 93:412-419.
NRC. 2012. Nutrient requirements of swine. 11th
rev. ed. Natl. Acad. Press, Washington, DC.
15
Nwokolo, E. N., and D. B. Bragg. 1977. Influence of phytic acid and crude fibre on the
availability of minerals from four protein supplements in growing chicks. Can. J. Anim.
Sci. 57:475-477.
Paik, I. 2003. Application of phytase, microbial or plant origin, to reduce phosphorus excretion
in poultry production. Asian-Aust. J. Anim. Sci. 16:124-135.
Przybylski, R., and N. A. M. Eskin. 2011. Oil composition and properties. In: J. K. Daun, N. A.
M. Eskin, and D. Hickling, editors, Canola: Chemistry, production, processing, and
utilization. AOCS Press, Urbana, IL. p. 189-227.
Rodriguez, D. A., R. C. Sulabo, J. C. González-Vega, and H. H. Stein. 2013. Energy
concentration and phosphorus digestibility in canola, cottonseed, and sunflower products
fed to growing pigs. Can. J. Anim. Sci. 93:493-503.
Sanjayan, N. 2013. The effect of feeding canola meal on nutrient digestibility and growth
performance in pigs. MS Thesis. Univ. of Manitoba, Winnipeg.
Sebastian, S., S. P. Touchburn, E. R. Chavez, and P. C. Lague. 1996. The effects of supplemental
microbial phytase on the performance and utilization of dietary calcium, phosphorus,
copper, and zinc in broiler chickens fed corn-soybean diets. Poult. Sci. 75:729-736.
Selle, P. H., and V. Ravindran. 2007. Microbial phytase in poultry nutrition: Review. Anim.
Feed Sci. Technol. 135:1-41.
Selle, P. H., A. J. Cowieson, and V. Ravindran. 2009. Consequences of calcium interactions with
phytate and phytase for poultry and pigs. Livest. Sci. 124:126-141.
Simbaya, J., B. A. Slominski, G. Rakow, L. D. Campbell, R. K. Downey, and J. M. Bell. 1995.
Quality characteristics of yellow-seeded Brassica seed meals: protein, carbohydrates, and
dietary fiber components. J. Agric. Food Chem. 43:2062-2066.
16
Simons, P. C. M., H. A. J. Versteegh, A. W. Jongbloed, P. A. Kemme, P. Slump, K. D. Bos, M.
G. E. Wolters, R. F. Beudeker, and G. J. Verschoor. 1990. Improvement of phosphorus
availability by microbial phytase in broilers and pigs. Br. J. Nutr. 64:525-540.
Slominski, B. A., L. D. Campbell, and W. Guenter. 1994. Carbohydrates and dietary fiber
components of yellow- and brown-seeded canola. J. Agric. Food Chem. 42:704-707.
Slominski, B. A., W. Jia, A. Rogiewicz, C. M. Nyachoti, and D. Hickling. 2012. Low-fiber
canola. Part 1. Chemical and nutritive composition of the meal. J. Agric. Food Chem.
60:12225-12230.
Slominski, B. A., J. Simbaya, L. D. Campbell, G. Rakow, and W. Guenter. 1999. Nutritive value
for broilers of meals derived from newly developed varieties of yellow-seeded canola.
Anim. Feed Sci. Technol. 78:249-262.
Thacker, P. A. 1990. Canola meal. In: P. A. Thacker and R. N. Kirkwood, editors, Nontraditional
feed sources for use in swine production. Butterworth Publishers, Stoneham, MA. p. 69-
78.
Trindade Neto, M. A., F. O. Opepaju, B. A. Slominski, and C. M. Nyachoti. 2012. Ileal amino
acid digestibility in canola meals from yellow- and black-seeded Brassica napus and
Brassica juncea fed to growing pigs. J. Anim. Sci. 90:3477-3484.
Zyla, K., and J. Koreleski. 1993. In-vitro and in-vivo dephosphorylation of rapeseed meal by
means of phytate-degrading enzymes derived from Aspergillus niger. J. Sci. Food Agric.
61:1-6.
17
TABLES
Table 2.1. Chemical composition of meals derived from black- and yellow- seeded canola1
Item (%) Black Yellow
DM 91.28 90.90
CP 42.73 47.82
Fat 3.55 2.80
Ash 7.02 7.07
Phosphorus 1.19 1.24
Dietary Fiber 30.32 25.25
NDF 22.95 17.20
Glucosinolates (µmol/g) 19.45 14.25 1Average values calculated from Slominski et al. (1994); Simbaya et al. (1995);
Slominski et al. (1999); NRC (2012); Slominski et al. (2012); and Trindade Neto et al. (2012).
18
Table 2.2. Indispensable AA composition of black- and yellow- seeded canola meals1
Item (%) Black Yellow
Arginine 5.7b
6.3a
Isoleucine 3.9
4.1
Leucine 6.9 7.2
Lysine 6.1a
5.7b
Methionine 2.1a
1.9b
Methionine + Cysteine 4.5a
4.2b
Phenylalanine 4.0b
4.2a
Threonine 4.3 4.3
Tryptophan 0.9 0.8
Valine 4.5 4.8
Total AA 92.4b
95.0a
1Adapted from Slominski et al. (2012).
19
CHAPTER 3
PHOSPHORUS BIOAVAILABILITY IN HIGH-PROTEIN CANOLA MEALS,
CONVENTIONAL CANOLA MEAL, AND SOYBEAN MEAL FED TO CHICKS
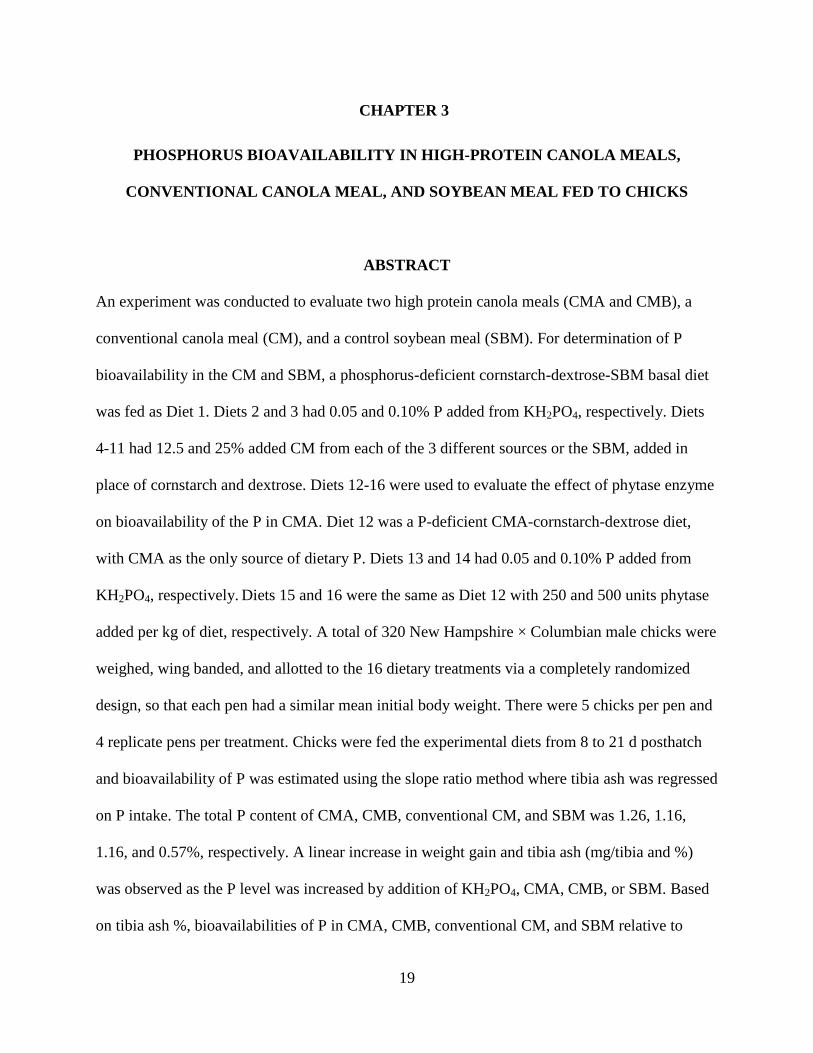
ABSTRACT
An experiment was conducted to evaluate two high protein canola meals (CMA and CMB), a
conventional canola meal (CM), and a control soybean meal (SBM). For determination of P
bioavailability in the CM and SBM, a phosphorus-deficient cornstarch-dextrose-SBM basal diet
was fed as Diet 1. Diets 2 and 3 had 0.05 and 0.10% P added from KH2PO4, respectively. Diets
4-11 had 12.5 and 25% added CM from each of the 3 different sources or the SBM, added in
place of cornstarch and dextrose. Diets 12-16 were used to evaluate the effect of phytase enzyme
on bioavailability of the P in CMA. Diet 12 was a P-deficient CMA-cornstarch-dextrose diet,
with CMA as the only source of dietary P. Diets 13 and 14 had 0.05 and 0.10% P added from
KH2PO4, respectively. Diets 15 and 16 were the same as Diet 12 with 250 and 500 units phytase
added per kg of diet, respectively. A total of 320 New Hampshire × Columbian male chicks were
weighed, wing banded, and allotted to the 16 dietary treatments via a completely randomized
design, so that each pen had a similar mean initial body weight. There were 5 chicks per pen and
4 replicate pens per treatment. Chicks were fed the experimental diets from 8 to 21 d posthatch
and bioavailability of P was estimated using the slope ratio method where tibia ash was regressed
on P intake. The total P content of CMA, CMB, conventional CM, and SBM was 1.26, 1.16,
1.16, and 0.57%, respectively. A linear increase in weight gain and tibia ash (mg/tibia and %)
was observed as the P level was increased by addition of KH2PO4, CMA, CMB, or SBM. Based
on tibia ash %, bioavailabilities of P in CMA, CMB, conventional CM, and SBM relative to
20
KH2PO4 were 15, 20, 13, and 42%, respectively. A linear increase in weight gain and tibia ash
was observed with addition of KH2PO4 or phytase to the P-deficient CMA diet (Diets 12-14).
The addition of 250 or 500 units/kg microbial phytase to P-deficient CMA diets resulted in
approximately 0.13 and 0.18% P being released, respectively, as estimated using the standard
curve method. In conclusion, the high-protein CMA and CMB contained a numerically higher
concentration of bioavailable P than the conventional CM. Furthermore, microbial phytase can
greatly increase the bioavailability of P in the new high protein CM.
Key words: bone ash, canola meal, chick, digestibility, phosphorus
INTRODUCTION
Canola meal (CM) inclusion has usually been limited in the past in diets for poultry. The
major causes for this are the high levels of anti-nutritional factors present, mainly glucosinolates
and fiber, which reduce the value of the meal for monogastric animals. The presence of
glucosinolates has been shown to result in reduced feed intake, reduced growth, thyroid
enlargement, perosis, and mortality in broilers (Fenwick and Curtis, 1980; Khajali and
Slominski, 2012). High fiber content is known to decrease the energy value of the feedstuff and
also decrease the digestibility of some minerals (Nwokolo and Bragg, 1977; Bell, 1993).
Breeding programs to reduce these factors have resulted in yellow-seeded varieties of canola
(Brassica napus). These yellow-seeded varieties contain lower levels of glucosinolates and fiber
as well as having greater protein content (Simbaya et al., 1995; Slominski et al., 1999; Slominski
et al., 2012). The larger seed of the yellow-seeded varieties has a thinner hull that is
proportionally less of the whole seed than in the traditional dark-seeded varieties (Khajali and
Slominski, 2012). Although the yellow-seeded varieties of high-protein canola have been
21
reported to contain less P than conventional varieties (Slominski et al., 2012), the reduction in
fiber content may result in improved digestibility of P for chicks.
About two-thirds of the P in plant products is bound to phytate (Simons et al., 1990),
rendering it largely unavailable to pigs and chickens. Poultry do not possess enough natural
phytase to be able to degrade the phytate-P complexes (Selle and Ravindran, 2007), so
exogenous phytase may be added to diets to increase digestibility of P as well as other minerals
(Simons et al., 1990; Selle and Ravindran, 2007). Therefore, the objective of this study was to
determine the bioavailable P content of 2 new high-protein canola meals compared to
conventional canola meal (CM-CV) and soybean meal (SBM) and to evaluate the effect of
phytase enzyme on bioavailability of P in one of the high-protein CM.
MATERIALS AND METHODS
The protocol for this study was reviewed and approved by the Institutional Animal Care
and Use Committee at the University of Illinois.
Nutrient Analysis
Ingredients were analyzed for GE using bomb calorimetry (Model 6300; Parr
Instruments, Moline, IL), CP by combustion (Method 990.03; AOAC International, 2007) using
a Rapid N Cube (Elementar Americas Inc, Mt. Laurel, NJ) with Asp as the standard, and ash
(Method 942.05; AOAC International, 2007). Ingredients were also analyzed for acid hydrolyzed
ether extract (Method 2003.06, AOAC International, 2007) on an automated analyzer (Soxtec
2050; FOSS North America, Eden Prairie, MN), ADF (Method 973.18, AOAC International,
2007), NDF (Holst, 1973), and amino acids (Method 982.30 E [a, b, and c]; AOAC International,
2007). Ingredient samples were also analyzed for DM by forced air oven drying for 2 h at 135°C
22
(Method 930.15; AOAC International, 2007), Ca and P using inductively coupled plasma
spectroscopy (Method 985.01 A, B, and C; AOAC International, 2007) after wet ashing (Method
975.03 B[b]; AOAC International, 2007) and phytate concentration (Ellis et al., 1977). The
concentration of phytate-bound P in each ingredient was calculated as 28.2% of analyzed phytate
(Tran and Sauvant, 2004). Non-phytate-bound P was calculated as the difference between total P
and phytate-bound P.
Diets and Experimental Design
Two sources of CM produced from new varieties of high-protein canola seeds (CMA and
CMB), a CM-CV, and a control SBM were evaluated (Table 3.3). For determination of P
bioavailability in the CM and SBM, a phosphorus-deficient cornstarch-dextrose-SBM basal diet
was fed as Diet 1 (Table 3.1). Diets 2 and 3 had 0.05 and 0.10% P added from KH2PO4,
respectively. Diets 4-11 had 12.5 and 25% added CM from each of the 3 different sources, or the
SBM, added in place of cornstarch and dextrose. Diets 12-16 were used to evaluate the effect of
phytase enzyme on bioavailability of the P in CMA. Diet 12 was a P-deficient CMA-cornstarch-
dextrose diet in which the only source of dietary P was CMA (Table 3.2). Diets 13 and 14 had
0.05 and 0.10% P added from KH2PO4, respectively. Diets 15 and 16 were the same as Diet 12
with 250 and 500 units phytase added per kg of diets, respectively.
A total of 320 New Hampshire × Columbian male chicks were fed a nutritionally
complete corn and SBM starter diet for 7 d. On d 7 of age, chicks were fasted overnight prior to
being placed on experiment. At the initiation of the experiment, chicks were weighed, wing
banded, and allotted to the 16 dietary treatments via a complete randomized design so that each
pen had a similar mean initial body weight. There were 5 chicks per pen and 4 replicate pens per
treatment. During the experiment, chicks were housed in thermostatically-controlled Petersime
23
starter batteries with raised-wire flooring in an environmentally controlled room with continuous
lighting. Experimental diets and water were available free-access to chicks from 8 to 21 d of age.
Feed intake per pen was recorded and final BW of each chick was recorded at the conclusion of
the experiment.
At the conclusion of the experiment, data were summarized to calculate weight gain, feed
intake, and gain:feed ratio. Chicks were euthanized via CO2 inhalation and right tibia bones were
collected and pooled within pen. Bones were autoclaved and cheesecloth was used to aid in
removal of adhering tissue. Bones were dried for 24 h at 100°C, weighed, and then dry-ashed in
a muffle furnace for 24 h at 600°C. Ash weight was expressed as a percentage of dry bone
weight (Chung and Baker, 1990) and as milligrams per tibia.
Statistical Analysis
Data for growth performance and bone ash were initially analyzed using PROC ANOVA
of SAS (SAS Institute. Inc., Cary, NC) with pen as the experimental unit. Differences among
treatment means were assessed using the least significant difference test. Data for Dietary
Treatments 1-11 were analyzed by multiple linear regression (GLM procedure of SAS) by
regressing tibia ash (mg/tibia) and tibia ash percent on supplemental P intake (mg/chick) from
the KH2PO4 or the CM or SBM samples. Bioavailability of P in CM or SBM relative to KH2PO4
was then estimated using the slope-ratio method (Finney, 1978). For dietary treatments 12-14, a
standard curve was calculated using simple linear regression to estimate the amount of P released
from CMA by phytase by regressing tibia ash (mg/tibia) and tibia ash percent on supplemental P
intake (mg/chick) from KH2PO4 . The tibia ash values (mg/tibia and percent) for the two
supplemental phytase treatments (dietary treatments 15 and 16) were then substituted into the
24
respective regression equation for Y. Solving for X gave an estimate of the amount of P released
from the CMA by the phytase enzyme.
RESULTS AND DISCUSSION
Nutrient Composition
Nutrient compositions of the CM and SBM are presented in Tables 3.3. As expected, the
CP content of CMA and CMB was higher than for the CM-CV, with a difference of over 10
percentage units (as-fed basis). The CP and AA values for the CM-CV were lower than
previously published values (NRC, 2012). The CP content of CMA and CMB was higher than
values published in NRC (2012), but in agreement with previous research using yellow-seeded
CM (Simbaya et al., 1995; Slominski et al., 2012). Due to the increase in CP, CMA and CMB
also had higher levels of all AA than the CM-CV. Concentrations of all AA were greater in
CMA and CMB than values for CM in NRC (2012). The concentration of CP in CMA and CMB
was similar to the SBM sample, which was close to published values (Khajali and Slominski,
2012; NRC, 2012). Though the SBM had higher levels of several AA than the high-protein CM,
similar levels of His, Thr, and Trp were seen among the samples, while CMA and CMB had
higher levels of Gly, Pro, Cys, and Met when compared to SBM. The gross energy content of the
high-protein CM was 230 kcal/kg greater than the conventional CM and 200 kcal/kg greater than
the SBM sample (as-fed basis). The concentrations of NDF and ADF were 18.32 and 12.66% in
CMA and 17.90 and 10.95% in CMB. These levels were substantially less than 25.04% NDF and
17.53% ADF in the CM-CV, but all CM samples had higher levels of NDF and ADF than SBM.
Values for NDF of all 3 CM were in agreement with those published by Slominski et al. (1994);
25
however, values for ADF and NDF of the CM-CV were slightly higher than those reported in
NRC (2012).
Canola meal A had a higher concentration of P than the CM-CV, but CMB and the CM-
CV had similar levels of P (Table 3.3). All three CM samples had more P than previously
reported (NRC, 2012) for brown-seeded CM and more than twice the amount present in SBM.
The P content in the CM-CV was lower than reported by Nwokolo and Bragg (1977) and
Slominski et al. (2012), but higher than reported by Khajali and Slominski (2012). In accordance
with Raboy (1997) who reported that 65 to 85% of the total P of plant origin is bound to phytate,
CMA and CMB had 80 and 78% of the total P as phytate-bound P, respectively. The CM-CV
had 66% and the SBM had 70% of the total P bound to phytate, which is in agreement with
previous research by Selle and Ravindran (2007) and Slominski et al. (2012). The lower
concentration of phytate P in the CM-CV compared to CMA and CMB suggests that P
digestibility may be higher in CM-CV. The high-protein CM were obtained from a different
source than the CM-CV so differences in soil composition as well as growing conditions could
account for the increased phytate P concentration in the high-protein meals. The CM-CV also
had a much greater Ca concentration than either CMA or CMB, with SBM having the lowest Ca
concentration overall. Values for Ca concentration for CMA and SBM were similar to published
values (Bell, 1993; Khajali and Slominski, 2012), but the Ca concentration in CMB was lower
and in CM-CV was higher than the previously published values.
Phosphorus Bioavailability in CM and SBM
Feed intake generally only increased with the upper inclusions of KH2PO4 or CM (P <
0.05) (Table 3.4). There were no consistent effects of dietary treatment on feed conversion. A
linear increase in weight gain and tibia ash (mg/tibia and %) was observed as the P level was
26
increased by addition of KH2PO4. This agrees with previous research by Kim et al. (2008). There
was also a linear increase in weight gain and tibia ash (mg/tibia and %) observed as the P level
was increased by addition of CMA, CMB, or SBM. Multiple regressions of tibia ash (mg/tibia
and %) on supplemental P intake were highly significant (R2 values were 0.80 and 0.84,
respectively; P < 0.001). Total P content and estimated P bioavailability values (relative to
KH2PO4) are shown in Table 3.5. The bioavailability values estimated were greater for CMA and
CMB than for the CM-CV, but were lower than for SBM. However, when the bioavailability
values are multiplied by the total P content, the concentration of bioavailable P in CMA and
CMB was comparable to SBM. The latter is due to the lower total P content of SBM. There was
numerically greater bioavailable P content for CMA and CMB than for the CM-CV due to the
lower P bioavailability value for the CM-CV. Although CMA and CMB had less nonphytate-
bound P than the CM-CV (Table 3.3), their higher bioavailability values led to numerically
increased bioavailable P content when compared to the CM-CV.
Dividing the non-phytate-bound P content by the total P content (analytical values
provided) resulted in expected values for bioavailability of P in each of the P sources. The
expected bioavailability of P based on these calculations in CM from the NRC (2012) is 40%.
The expected P bioavailability value calculated for CMA and CMB was about 20%, whereas for
CM-CV, the expected value was about 34%. The P bioavailability values for CMA and CMB
were close to the expected values, particularly for bone ash %, but the estimated values of 10 to
13% for the CM-CV were substantially lower than expected from the analytical values obtained
herein and the NRC (2012) values. The reason for these discrepancies is unknown. Perhaps, part
of the difference is due to errors in phytate analyses or to the higher fiber content of the CM-CV
(Slominski et al., 2012).
27
Phytase Effect
A significant increase in weight gain and tibia ash was observed with addition of KH2PO4
or phytase to the Basal 2 diet containing CMA as the only source of dietary P (Table 3.4). This is
in agreement with previous findings (Nelson et al., 1971; Mitchell and Edwards, 1996; Green,
2011). Simple linear regressions of tibia ash (mg/tibia and %) on supplemental P intake from
KH2PO4 were highly significant (R2 values were 0.94 and 0.88, respectively; P < 0.001).
Unexpectedly, weight gain and tibia ash responses to phytase addition exceeded the response to
KH2PO4 (Tables 3.4 and 3.6). Because the tibia ash responses were greater between the Basal 2
diet and the 250 U/kg phytase treatments than between the 250 and 500 U/kg treatments (not
linear), the standard curve method was used to estimate P release for each of the individual
phytase additions. The standard curve method to estimate P release by phytase yielded values of
0.13 and 0.19% P released for tibia ash (mg/tibia) and 0.12 and 0.17% P released for tibia ash
(%) for 250 and 500 U/kg of phytase, respectively (Table 3.6).
Overall, results indicated that the phytate P of CMA is highly susceptible to release by
microbial phytase. The addition of 250 units phytase/kg diet released well in excess of the
expected 0.1% P from CMA, and addition of 500 units phytase/kg diet released almost 0.2% P.
The actual release values may not be completely accurate since the tibia ash responses exceeded
the range of the standard curve for the added levels of KH2PO4. This occurred because it was
expected that the phytase would only be able to liberate approximately 0.1% P from CMA,
whereas the actual estimated release was well in excess of that. The estimated P release value of
approximately 0.12% for the 250 units/kg phytase is likely accurate, since Augspurger et al.
(2003) showed that, when using the same type of chicks and similar P-deficient diets used
herein, tibia ash responses were linear up to 0.15% added P. The P release value for the 500
28
units/kg phytase may be slightly underestimated because tibia ash response may have been in
excess of the linear response range.
In conclusion, even though the total P content of the high-protein CM did not differ
consistently from the CM-CV, the bioavailability of the P was higher in the high-protein CM.
Thus, the bioavailable P concentration was higher in the high-protein CM. Furthermore, the
research with CMA indicates that microbial phytase can greatly increase the bioavailability of
the P in the high-protein CM.
29
LITERATURE CITED
AOAC International. 2007. Official methods of analysis. 18th
ed. Rev. 2. AOAC Int.,
Gaithersburg, MD.
Augspurger, N. R., D. M. Webel, X. G. Lei, and D. H. Baker. 2003. Efficacy of an E. coli
phytase expressed in yeast for releasing phytate-bound phosphorus in young chicks and
pigs. J. Anim. Sci. 81:474-483.
Bell, J. M. 1993. Factors affecting the nutritional value of canola meal: A review. Can. J. Anim.
Sci. 73:679-697.
Chung, T. K., and D. H. Baker. 1990. Phosphorus utilization in chicks fed hydrated sodium
calcium aluminosilicate. J. Anim. Sci. 68:1992–1998.
Ellis, R., E. R. Morris, and C. Philpot. 1977. Quantitative determination of phytate in the
presence of high inorganic phosphate. Anal. Biochem. 77:536-539.
Fenwick, G. R., and R. F. Curtis. 1980. Rapeseed meal and its use in poultry diets. A review.
Anim. Feed Sci. Technol. 5:255-298.
Finney, D. J. 1978. Statistical Method in Biological Assay. 3rd. ed. Charles Griffin and
Company, Ltd., High Wycombe, Buckinghamshire, UK.
Green, J. 2011. The effect of feeding high concentrations of cholecalciferol, phytase, or the
combination on broiler chicks and laying hens fed various concentrations of nonphytate
phosphorus. M. Sc. Thesis. Iowa State University, Ames.
Holst, D. O. 1973. Holst filtration apparatus for Van Soest detergent fiber analysis. J. AOAC Int.
56:1352-1356.
Khajali, F., and B. A. Slominski. 2012. Review: Factors that affect the nutritive value of canola
meal for poultry. Poult. Sci. 91:2564-2575.
30
Kim, E. J., C. M. Amexcua, P. L. Utterback, and C. M. Parsons. 2008. Phosphorus
bioavailability, true metabolizable energy, and amino acid digestibilities of high protein
corn distillers dried grains and dehydrated corn germ. Poult. Sci. 87:700-705.
Mitchell, R. D., and H. M. Edwards, Jr. 1996. Additive effects of 1, 25-Dihydroxycholecalciferol
and phytase on phytate phosphorus utilization and related parameters in broiler chickens.
Poult. Sci. 75:111-119.
Nelson, T. S., T. R. Shieh, R. J. Wodzinski, and J. H. Ware. 1971. Effect of supplemental
phytase on the utilization of phytate phosphorus by chicks. J. Nutr. 101:1289-1293.
NRC. 2012. Nutrient requirements of swine. 11th
rev. ed. Natl. Acad. Press, Washington, DC.
Nwokolo, E. N., and D. B. Bragg. 1977. Influence of phytic acid and crude fibre on the
availability of minerals from four protein supplements in growing chicks. Can. J. Anim.
Sci. 57:475-477.
Raboy, V. 1997. Accumulation and storage of phosphate and minerals. Pages 441-477 in
Cellular and Molecular Biology of Plant Seed Development. B. A. Larkins and I. L.
Vasil, ed. Kluwer Academic Publishers, Dordrecht, the Netherlands.
Selle, P. H., and V. Ravindran. 2007. Microbial phytase in poultry nutrition: Review. Anim.
Feed Sci. Technol. 135:1-41.
Simbaya, J., B. A. Slominski, G. Rakow, L. D. Campbell, R. K. Downey, and J. M. Bell. 1995.
Quality characteristics of yellow-seeded Brassica seed meals: protein, carbohydrates, and
dietary fiber components. J. Agric. Food Chem. 43:2062-2066.
Simons, P. C. M., H. A. J. Versteegh, A. W. Jongbloed, P. A. Kemme, P. Slump, K. D. Bos, M.
G. E. Wolters, R. F. Beudeker, and G. J. Verschoor. 1990. Improvement of phosphorus
availability by microbial phytase in broilers and pigs. Br. J. Nutr. 64:525-540.
31
Slominski, B. A., L. D. Campbell, and W. Guenter. 1994. Carbohydrates and dietary fiber
components of yellow- and brown-seeded canola. J. Agric. Food Chem. 42:704-707.
Slominski, B. A., J. Simbaya, L. D. Campbell, G. Rakow, and W. Guenter. 1999. Nutritive value
for broilers of meals dervde from newly developed varieties of yellow-seeded canola.
Anim. Feed Sci. Technol. 78:249-262.
Slominski, B. A., W. Jia, A. Rogiewicz, C. M. Nyachoti, and D. Hickling. 2012. Low-fiber
canola. Part 1. Chemical and nutritive composition of the meal. J. Agric. Food Chem.
60:12225-12230.
Tran, G., and D. Sauvant. 2004. Chemical data and nutritional value. In: Tables of composition
and nutritional value of feed materials. 2nd ed. Wageningen Academic Publishers,
Wageningen, The Netherlands. p. 17-24.
32
TABLES
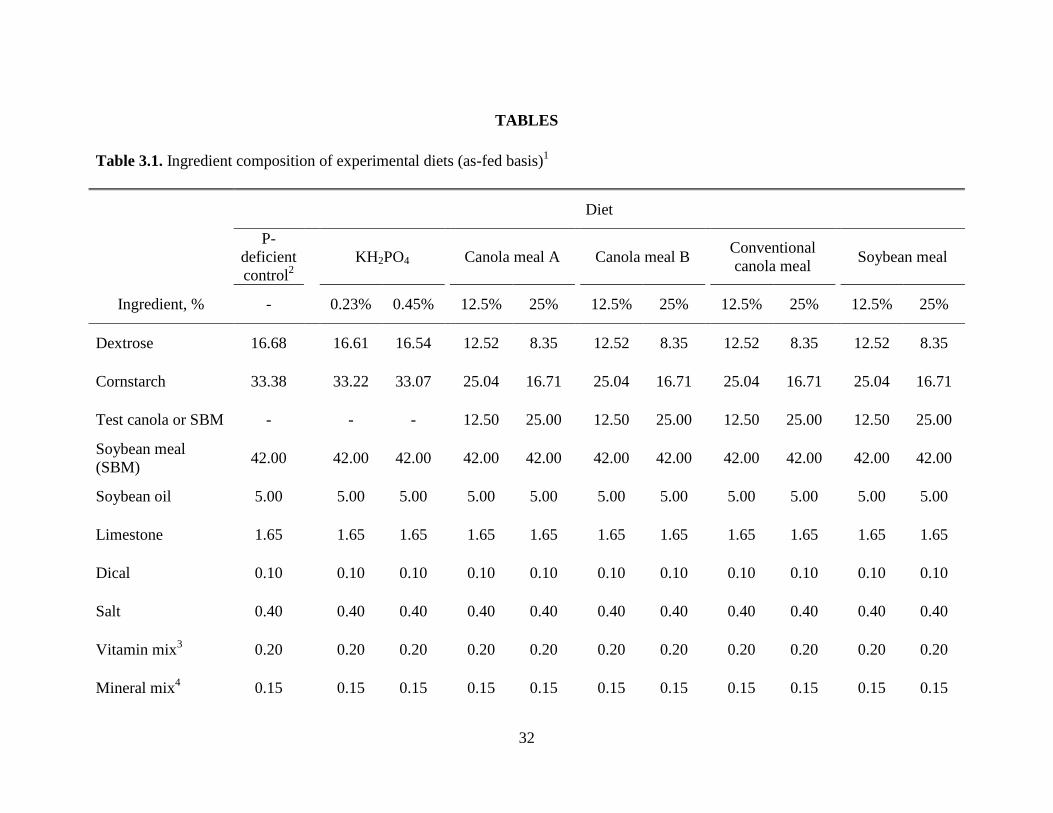
Table 3.1. Ingredient composition of experimental diets (as-fed basis)1
Diet
P-
deficient
control2
KH2PO4 Canola meal A Canola meal B Conventional
canola meal Soybean meal
Ingredient, % - 0.23% 0.45% 12.5% 25% 12.5% 25% 12.5% 25% 12.5% 25%
Dextrose 16.68 16.61 16.54 12.52 8.35 12.52 8.35 12.52 8.35 12.52 8.35
Cornstarch 33.38 33.22 33.07 25.04 16.71 25.04 16.71 25.04 16.71 25.04 16.71
Test canola or SBM - - - 12.50 25.00 12.50 25.00 12.50 25.00 12.50 25.00
Soybean meal
(SBM) 42.00 42.00 42.00 42.00 42.00 42.00 42.00 42.00 42.00 42.00 42.00
Soybean oil 5.00 5.00 5.00 5.00 5.00 5.00 5.00 5.00 5.00 5.00 5.00
Limestone 1.65 1.65 1.65 1.65 1.65 1.65 1.65 1.65 1.65 1.65 1.65
Dical 0.10 0.10 0.10 0.10 0.10 0.10 0.10 0.10 0.10 0.10 0.10
Salt 0.40 0.40 0.40 0.40 0.40 0.40 0.40 0.40 0.40 0.40 0.40
Vitamin mix3
0.20 0.20 0.20 0.20 0.20 0.20 0.20 0.20 0.20 0.20 0.20
Mineral mix4
0.15 0.15 0.15 0.15 0.15 0.15 0.15 0.15 0.15 0.15 0.15
33
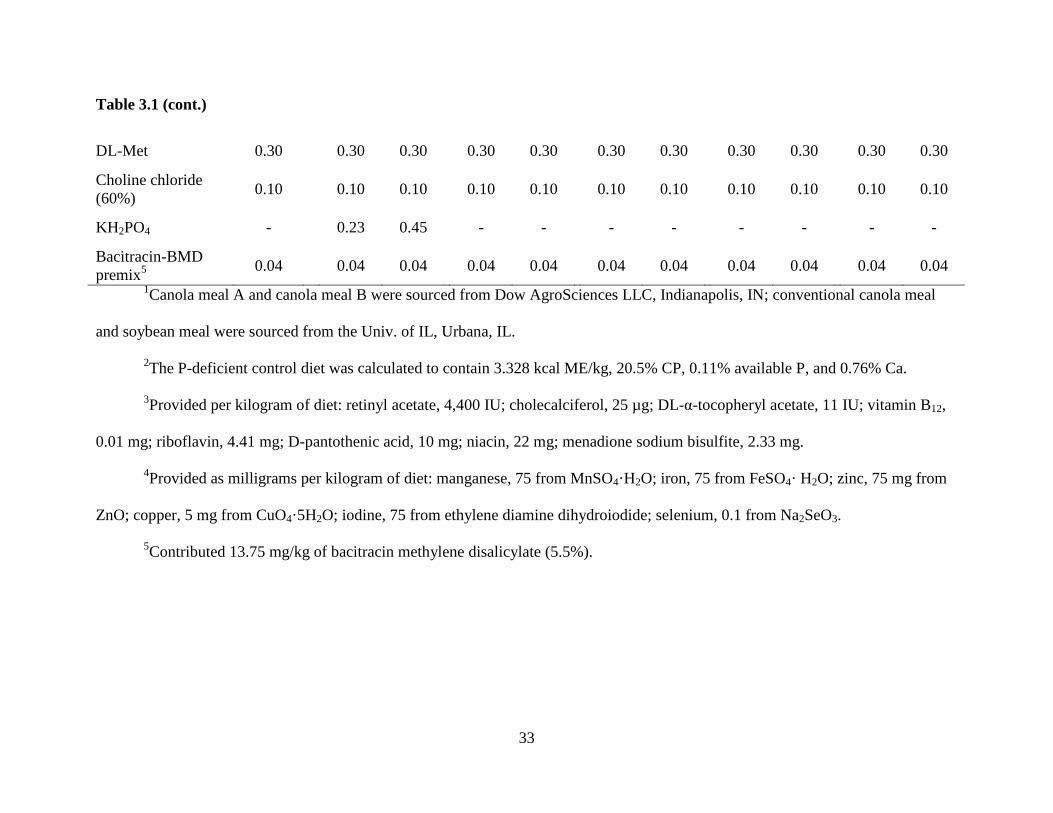
Table 3.1 (cont.)
DL-Met 0.30 0.30 0.30 0.30 0.30 0.30 0.30 0.30 0.30 0.30 0.30
Choline chloride
(60%) 0.10 0.10 0.10 0.10 0.10 0.10 0.10 0.10 0.10 0.10 0.10
KH2PO4 - 0.23 0.45 - - - - - - - -
Bacitracin-BMD
premix5 0.04 0.04 0.04 0.04 0.04 0.04 0.04 0.04 0.04 0.04 0.04
1Canola meal A and canola meal B were sourced from Dow AgroSciences LLC, Indianapolis, IN; conventional canola meal
and soybean meal were sourced from the Univ. of IL, Urbana, IL.
2The P-deficient control diet was calculated to contain 3.328 kcal ME/kg, 20.5% CP, 0.11% available P, and 0.76% Ca.
3Provided per kilogram of diet: retinyl acetate, 4,400 IU; cholecalciferol, 25 µg; DL-α-tocopheryl acetate, 11 IU; vitamin B12,
0.01 mg; riboflavin, 4.41 mg; D-pantothenic acid, 10 mg; niacin, 22 mg; menadione sodium bisulfite, 2.33 mg.
4Provided as milligrams per kilogram of diet: manganese, 75 from MnSO4·H2O; iron, 75 from FeSO4· H2O; zinc, 75 mg from
ZnO; copper, 5 mg from CuO4·5H2O; iodine, 75 from ethylene diamine dihydroiodide; selenium, 0.1 from Na2SeO3.
5Contributed 13.75 mg/kg of bacitracin methylene disalicylate (5.5%).
34
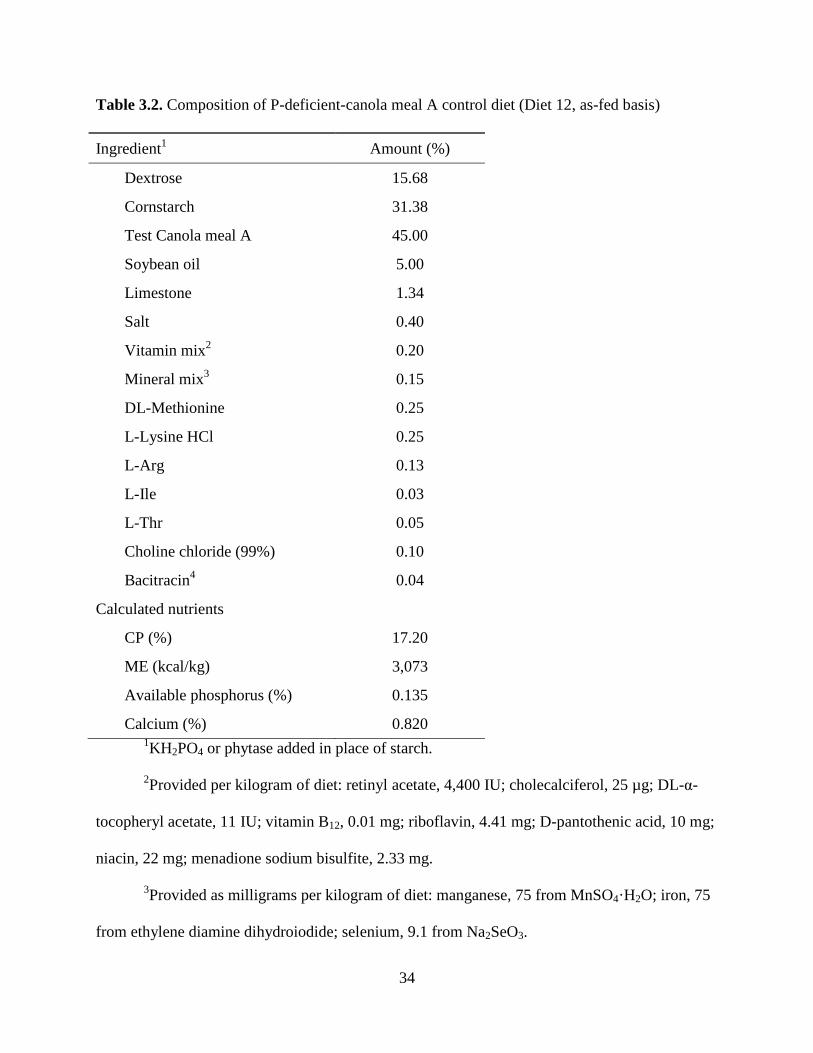
Table 3.2. Composition of P-deficient-canola meal A control diet (Diet 12, as-fed basis)
Ingredient1
Amount (%)
Dextrose 15.68
Cornstarch 31.38
Test Canola meal A 45.00
Soybean oil 5.00
Limestone 1.34
Salt 0.40
Vitamin mix2
0.20
Mineral mix3
0.15
DL-Methionine 0.25
L-Lysine HCl 0.25
L-Arg 0.13
L-Ile 0.03
L-Thr 0.05
Choline chloride (99%) 0.10
Bacitracin4
0.04
Calculated nutrients
CP (%) 17.20
ME (kcal/kg) 3,073
Available phosphorus (%) 0.135
Calcium (%) 0.820 1KH2PO4 or phytase added in place of starch.
2Provided per kilogram of diet: retinyl acetate, 4,400 IU; cholecalciferol, 25 µg; DL-α-
tocopheryl acetate, 11 IU; vitamin B12, 0.01 mg; riboflavin, 4.41 mg; D-pantothenic acid, 10 mg;
niacin, 22 mg; menadione sodium bisulfite, 2.33 mg.
3Provided as milligrams per kilogram of diet: manganese, 75 from MnSO4·H2O; iron, 75
from ethylene diamine dihydroiodide; selenium, 9.1 from Na2SeO3.

35
4Contributed 13.75 mg/kg of bacitracin methylene disalicylate (5.5%).
36
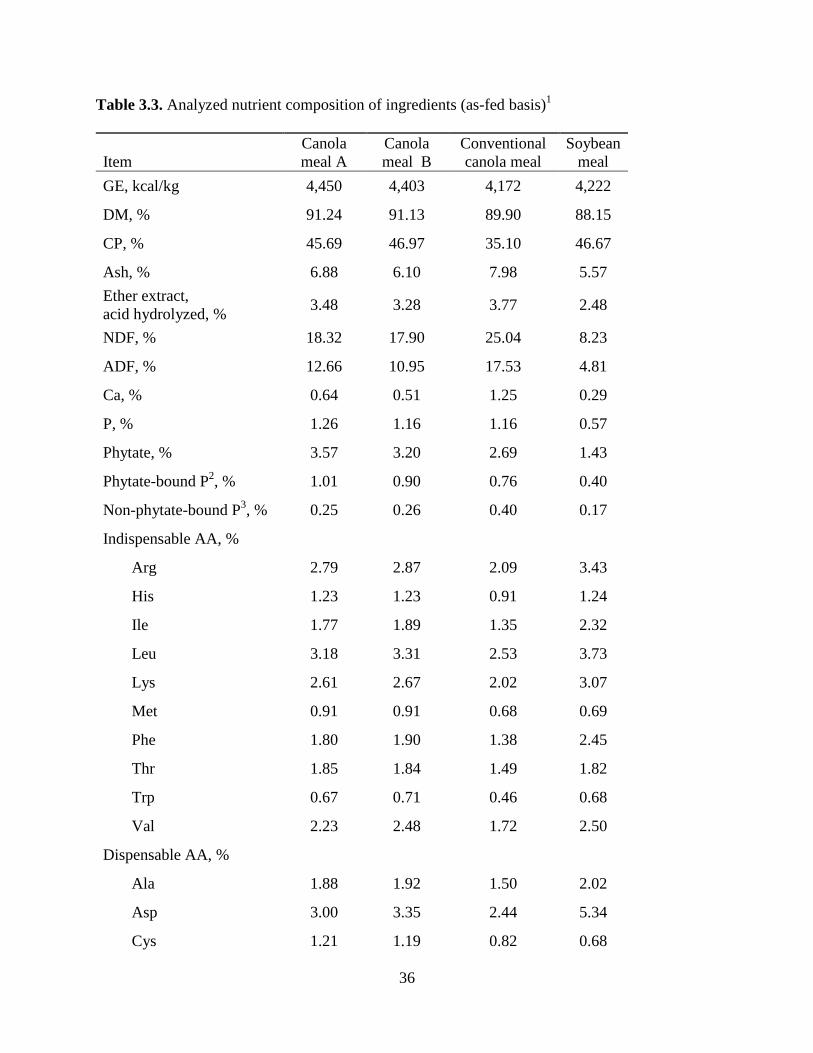
Table 3.3. Analyzed nutrient composition of ingredients (as-fed basis)1
Item
Canola
meal A
Canola
meal B
Conventional
canola meal
Soybean
meal
GE, kcal/kg 4,450 4,403 4,172 4,222
DM, % 91.24 91.13 89.90 88.15
CP, % 45.69 46.97 35.10 46.67
Ash, % 6.88 6.10 7.98 5.57
Ether extract,
acid hydrolyzed, % 3.48 3.28 3.77 2.48
NDF, % 18.32 17.90 25.04 8.23
ADF, % 12.66 10.95 17.53 4.81
Ca, % 0.64 0.51 1.25 0.29
P, % 1.26 1.16 1.16 0.57
Phytate, % 3.57 3.20 2.69 1.43
Phytate-bound P2, % 1.01 0.90 0.76 0.40
Non-phytate-bound P3, % 0.25 0.26 0.40 0.17
Indispensable AA, %
Arg 2.79 2.87 2.09 3.43
His 1.23 1.23 0.91 1.24
Ile 1.77 1.89 1.35 2.32
Leu 3.18 3.31 2.53 3.73
Lys 2.61 2.67 2.02 3.07
Met 0.91 0.91 0.68 0.69
Phe 1.80 1.90 1.38 2.45
Thr 1.85 1.84 1.49 1.82
Trp 0.67 0.71 0.46 0.68
Val 2.23 2.48 1.72 2.50
Dispensable AA, %
Ala 1.88 1.92 1.50 2.02
Asp 3.00 3.35 2.44 5.34
Cys 1.21 1.19 0.82 0.68
37
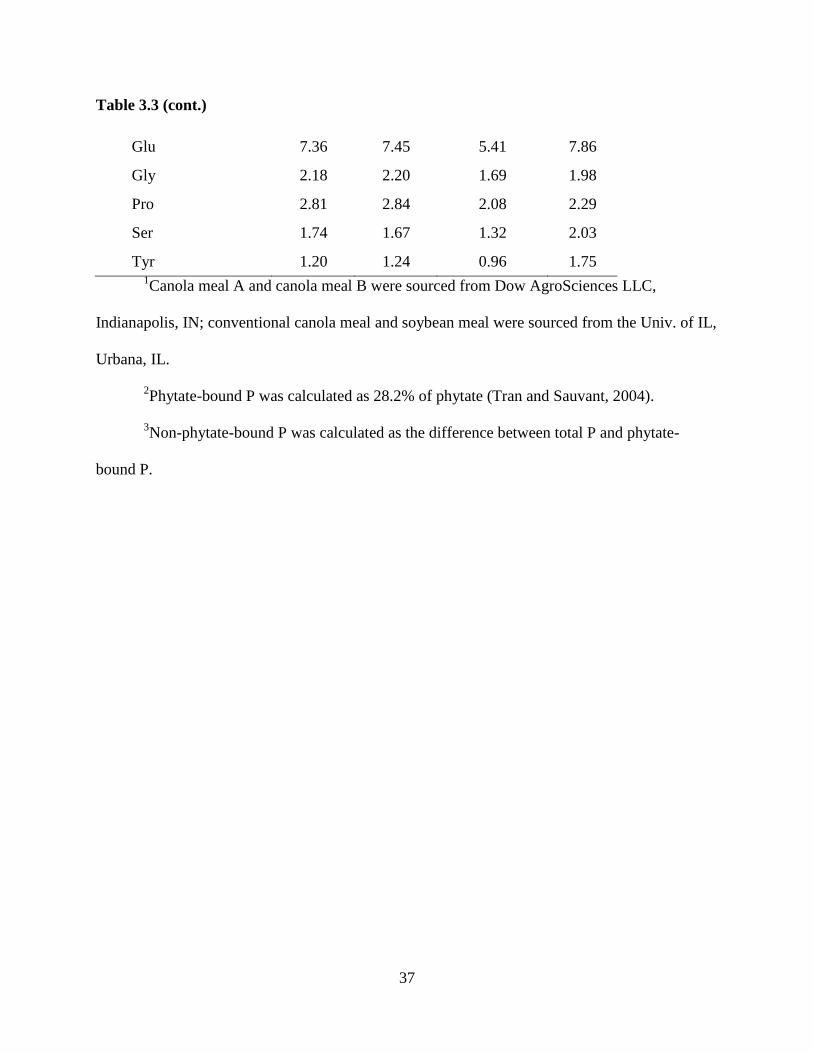
Table 3.3 (cont.)
Glu 7.36 7.45 5.41 7.86
Gly 2.18 2.20 1.69 1.98
Pro 2.81 2.84 2.08 2.29
Ser 1.74 1.67 1.32 2.03
Tyr 1.20 1.24 0.96 1.75 1Canola meal A and canola meal B were sourced from Dow AgroSciences LLC,
Indianapolis, IN; conventional canola meal and soybean meal were sourced from the Univ. of IL,
Urbana, IL.
2Phytate-bound P was calculated as 28.2% of phytate (Tran and Sauvant, 2004).
3Non-phytate-bound P was calculated as the difference between total P and phytate-
bound P.
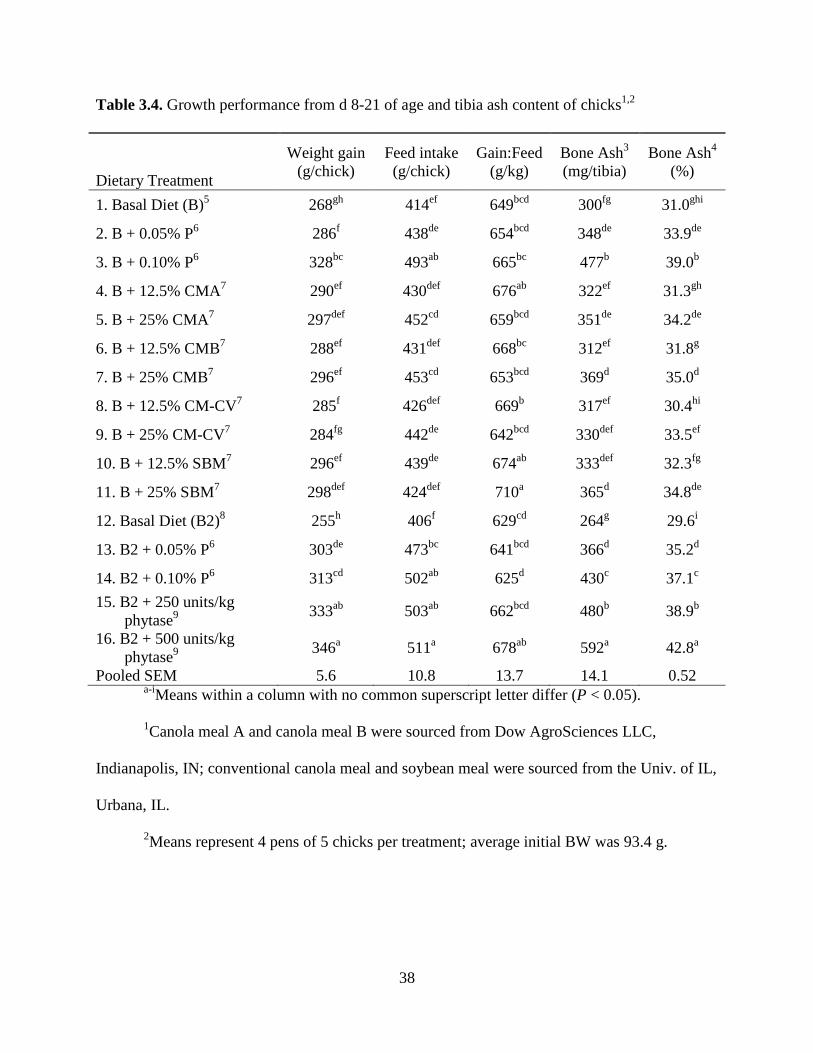
38
Table 3.4. Growth performance from d 8-21 of age and tibia ash content of chicks1,2
Dietary Treatment
Weight gain
(g/chick)
Feed intake
(g/chick)
Gain:Feed
(g/kg)
Bone Ash3
(mg/tibia)
Bone Ash4
(%)
1. Basal Diet (B)5
268gh
414ef
649bcd
300fg
31.0ghi
2. B + 0.05% P6
286f
438de
654bcd
348de
33.9de
3. B + 0.10% P6
328bc
493ab
665bc
477b
39.0b
4. B + 12.5% CMA7
290ef
430def
676ab
322ef
31.3gh
5. B + 25% CMA7
297def
452cd
659bcd
351de
34.2de
6. B + 12.5% CMB7
288ef
431def
668bc
312ef
31.8g
7. B + 25% CMB7
296ef
453cd
653bcd
369d
35.0d
8. B + 12.5% CM-CV7
285f
426def
669b
317ef
30.4hi
9. B + 25% CM-CV7
284fg
442de
642bcd
330def
33.5ef
10. B + 12.5% SBM7
296ef
439de
674ab
333def
32.3fg
11. B + 25% SBM7
298def
424def
710a
365d
34.8de
12. Basal Diet (B2)8
255h
406f
629cd
264g
29.6i
13. B2 + 0.05% P6
303de
473bc
641bcd
366d
35.2d
14. B2 + 0.10% P6
313cd
502ab
625d
430c
37.1c
15. B2 + 250 units/kg
phytase9 333
ab 503
ab 662
bcd 480
b 38.9
b
16. B2 + 500 units/kg
phytase9 346
a 511
a 678
ab 592
a 42.8
a
Pooled SEM 5.6 10.8 13.7 14.1 0.52 a-i
Means within a column with no common superscript letter differ (P < 0.05).
1Canola meal A and canola meal B were sourced from Dow AgroSciences LLC,
Indianapolis, IN; conventional canola meal and soybean meal were sourced from the Univ. of IL,
Urbana, IL.
2Means represent 4 pens of 5 chicks per treatment; average initial BW was 93.4 g.
39
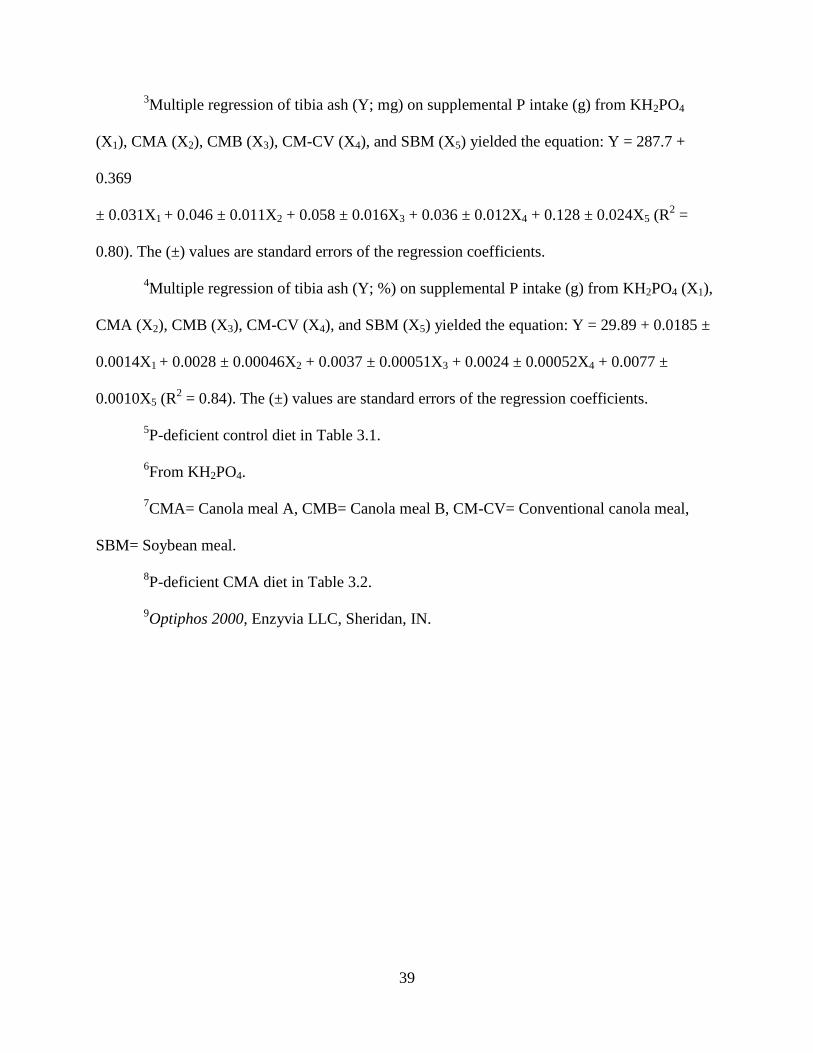
3Multiple regression of tibia ash (Y; mg) on supplemental P intake (g) from KH2PO4
(X1), CMA (X2), CMB (X3), CM-CV (X4), and SBM (X5) yielded the equation: Y = 287.7 +
0.369
± 0.031X1 + 0.046 ± 0.011X2 + 0.058 ± 0.016X3 + 0.036 ± 0.012X4 + 0.128 ± 0.024X5 (R2 =
0.80). The (±) values are standard errors of the regression coefficients.
4Multiple regression of tibia ash (Y; %) on supplemental P intake (g) from KH2PO4 (X1),
CMA (X2), CMB (X3), CM-CV (X4), and SBM (X5) yielded the equation: Y = 29.89 + 0.0185 ±
0.0014X1 + 0.0028 ± 0.00046X2 + 0.0037 ± 0.00051X3 + 0.0024 ± 0.00052X4 + 0.0077 ±
0.0010X5 (R2 = 0.84). The (±) values are standard errors of the regression coefficients.
5P-deficient control diet in Table 3.1.
6From KH2PO4.
7CMA= Canola meal A, CMB= Canola meal B, CM-CV= Conventional canola meal,
SBM= Soybean meal.
8P-deficient CMA diet in Table 3.2.
9Optiphos 2000, Enzyvia LLC, Sheridan, IN.
40
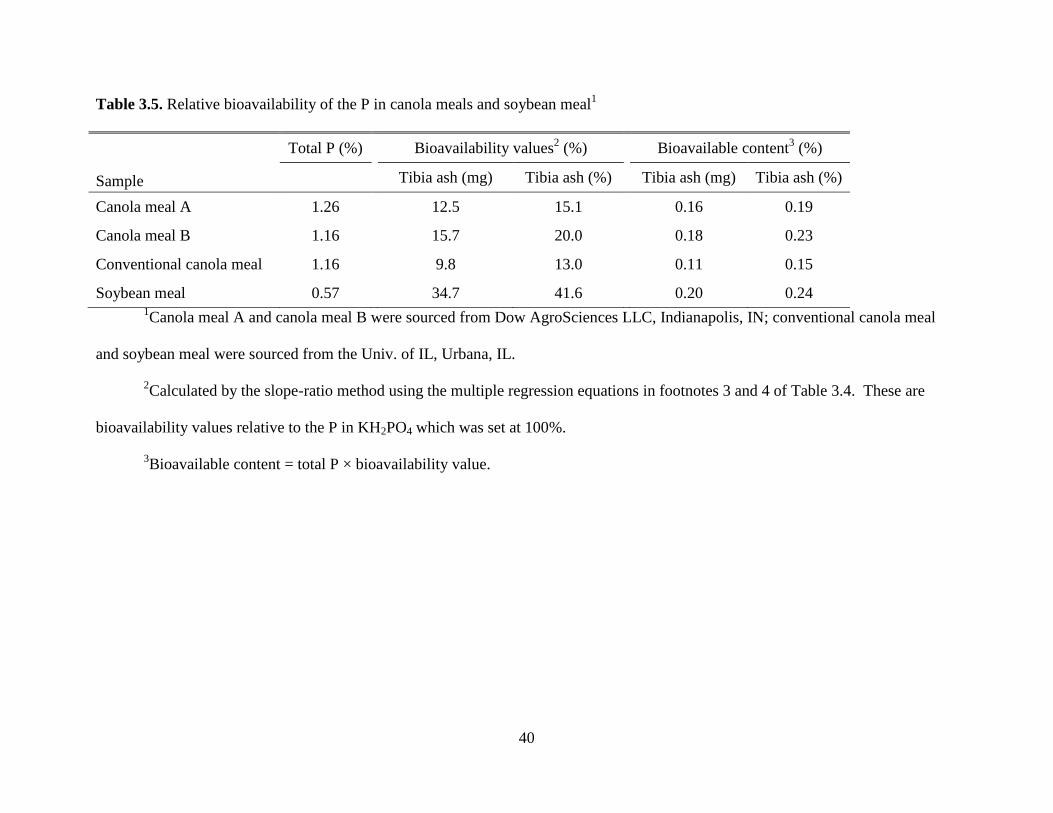
Table 3.5. Relative bioavailability of the P in canola meals and soybean meal1
Sample
Total P (%) Bioavailability values2 (%)
Bioavailable content3 (%)
Tibia ash (mg) Tibia ash (%) Tibia ash (mg) Tibia ash (%)
Canola meal A 1.26 12.5 15.1 0.16 0.19
Canola meal B 1.16 15.7 20.0 0.18 0.23
Conventional canola meal 1.16 9.8 13.0 0.11 0.15
Soybean meal 0.57 34.7 41.6 0.20 0.24 1Canola meal A and canola meal B were sourced from Dow AgroSciences LLC, Indianapolis, IN; conventional canola meal
and soybean meal were sourced from the Univ. of IL, Urbana, IL.
2Calculated by the slope-ratio method using the multiple regression equations in footnotes 3 and 4 of Table 3.4. These are
bioavailability values relative to the P in KH2PO4 which was set at 100%.
3Bioavailable content = total P × bioavailability value.
41
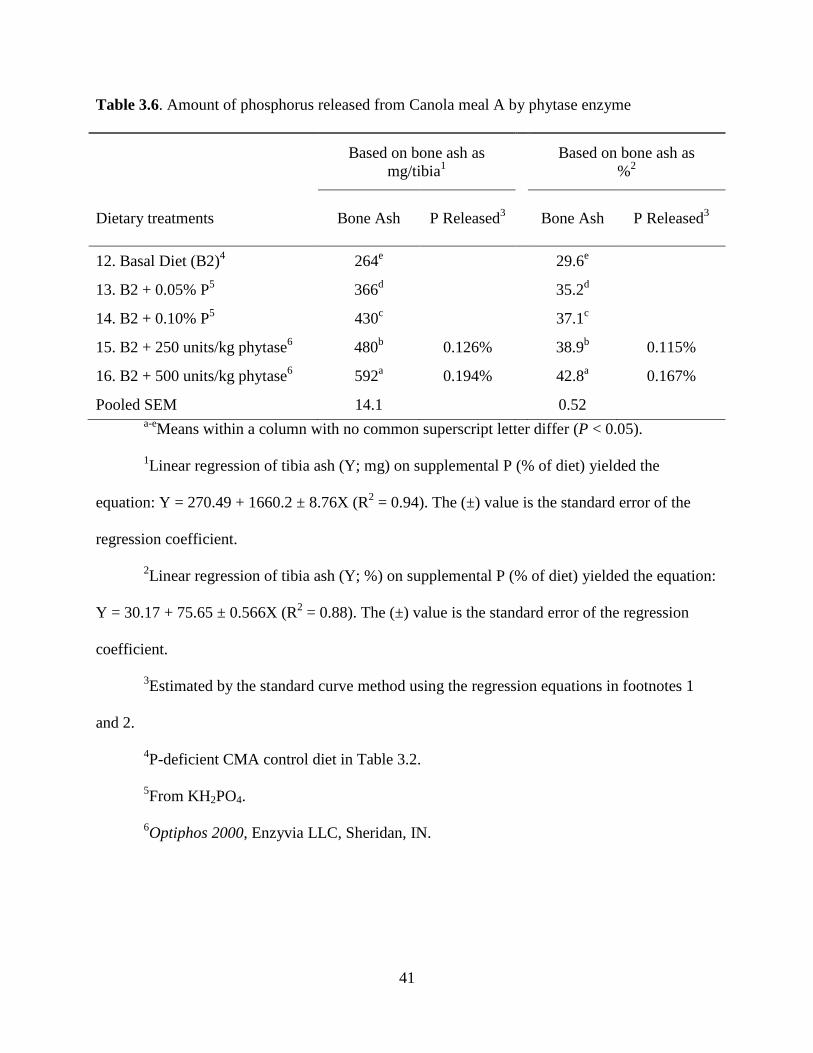
Table 3.6. Amount of phosphorus released from Canola meal A by phytase enzyme
Based on bone ash as
mg/tibia1
Based on bone ash as
%2
Dietary treatments Bone Ash
P Released3
Bone Ash
P Released3
12. Basal Diet (B2)4
264e
29.6e
13. B2 + 0.05% P5
366d
35.2d
14. B2 + 0.10% P5
430c
37.1c
15. B2 + 250 units/kg phytase6
480b
0.126% 38.9b
0.115%
16. B2 + 500 units/kg phytase6
592a
0.194% 42.8a
0.167%
Pooled SEM
14.1
0.52
a-e
Means within a column with no common superscript letter differ (P < 0.05).
1Linear regression of tibia ash (Y; mg) on supplemental P (% of diet) yielded the
equation: Y = 270.49 + 1660.2 ± 8.76X (R2 = 0.94). The (±) value is the standard error of the
regression coefficient.
2Linear regression of tibia ash (Y; %) on supplemental P (% of diet) yielded the equation:
Y = 30.17 + 75.65 ± 0.566X (R2 = 0.88). The (±) value is the standard error of the regression
coefficient.
3Estimated by the standard curve method using the regression equations in footnotes 1
and 2.
4P-deficient CMA control diet in Table 3.2.
5From KH2PO4.
6Optiphos 2000, Enzyvia LLC, Sheridan, IN.
42
CHAPTER 4
PHOSPHORUS DIGESTIBILITY IN HIGH-PROTEIN CANOLA MEALS,
CONVENTIONAL CANOLA MEAL, AND SOYBEAN MEAL FED TO GROWING
PIGS
ABSTRACT
An experiment was conducted to determine the digestibility of Ca and P in 2 high-protein canola
meals (CMA; 45.7% CP, and CMB; 47.0% CP) fed to growing pigs, and to compare values
obtained in high-protein canola meal with digestibility of Ca and P in conventional canola meal
(CM-CV; 35.1% CP) and soybean meal (SBM). The Ca and P contents of CMA, CMB, and CM-
CV were 0.64 and 1.26%, 0.51 and 1.16%, and 1.25 and 1.16%, respectively. Four cornstarch-
based diets were formulated using each source of canola meal or SBM as the sole source of P in
the diet. Four additional diets, similar to the initial 4 diets with the exception that 500 FTU/kg of
microbial phytase were added to each diet, were also formulated. Therefore, a total of 8 diets
were formulated. Forty-eight barrows were divided into 2 periods and randomly allotted via a
randomized complete block design using a 2 × 4 factorial arrangement to the 8 dietary treatments
based on initial BW. There were 6 replicate pigs per dietary treatment. Experimental diets were
provided for 12 d with the initial 5 d being the adaptation period. Indigo carmine was added as
an indigestible marker to the morning meals on d 6 and 11, respectively. Fecal collections started
when the first marker appeared in the feces and ceased when the second marker appeared. The
endogenous loss of P was assumed to be 190 mg kg-1
DMI. At the conclusion of the experiment,
feed intake, Ca and P intake, apparent total tract digestibility (ATTD) of Ca and P, and
standardized total tract digestibility (STTD) of P were calculated. Results indicated that ATTD
43
of Ca and P and STTD of P were not different among treatments. Apparent total tract
digestibility of Ca was 62, 66, 69, and 73% for CMA, CMB, CM-CV, and SBM, respectively.
Standardized total tract digestibility of P was 55, 60, 49, and 66% for CMA, CMB, CM-CV, and
SBM, respectively. Inclusion of phytase to the diets reduced both Ca and P outputs (P < 0.05).
Inclusion of phytase also improved (P < 0.05) ATTD of Ca and P (by 8 and 16%, respectively)
and STTD of P (by 17%), regardless of the ingredient in the diet, and there was no interaction
between diet and phytase supplementation.
Key words: apparent digestibility, canola meal, phosphorus, pig, standardized digestibility
INTRODUCTION
One limitation to using canola meal (CM) in swine diets is the high fiber content, which,
in addition to high levels of phytic acid, reduces availability of P and results in poor apparent
total tract digestibility (ATTD) of P and greater P excretion (Nwokolo and Bragg, 1977).
Yellow-seeded canola (Brassica napus) has a larger seed size and contains more protein (46 to
49%) and less dietary fiber (24 to 27%) than black-seeded B. napus (Slominski et al., 1994;
Simbaya et al., 1995; Slominski et al., 2012), making it more desirable for use in swine diets.
Though this high-protein canola has similar P content as the conventional black-seeded varieties
(Sanjayan, 2013), the reduction in fiber may result in greater ATTD of P and less P excretion.
About two-thirds of the P in plant products is bound to phytate (Simons et al., 1990). Pigs
do not produce sufficient intestinal phytase to break the phytate-P bond, but addition of
microbial phytase to the diet may result in increased ATTD of P and decreased P excretion
(Simons et al., 1990; Akinmusire and Adeola, 2009; Rodriguez et al., 2013). However, ATTD
does not account for endogenous P losses and is, therefore, not a correct value to use in diet
44
formulation. Values based on standardized total tract digestibility (STTD) of P are corrected for
basal endogenous losses of P and are additive among feed ingredients (NRC, 2012). Therefore,
diets are more accurately formulated using STTD values than ATTD values (NRC, 2012).
Concentration of Ca in the diet may also have a negative effect on ATTD of P (González-
Vega et al., 2013). Stein et al. (2011) hypothesized that increased Ca in the diet may form Ca-P
complexes in the intestinal tract and inhibit P from being absorbed. Therefore, the objectives of
this experiment were to determine the digestibility of Ca and P in high-protein CM fed to
growing pigs, and to compare values obtained in high-protein CM with digestibility of Ca and P
in conventional canola meal (CM-CV) and soybean meal (SBM).
MATERIALS AND METHODS
The protocol for this experiment was reviewed and approved by the Institutional Animal Care
and Use Committee at the University of Illinois. Pigs used in the experiment were offspring of
G-performer boars × Fertilium 25 females (Genetiporc, Alexandria, MN).
Diets, Animals, and Experimental Design
Two sources of CM that were produced from new varieties of high-protein canola seeds
(CMA and CMB) and a CM-CV were used (Table 4.1). Four cornstarch-based diets were
formulated using each source of CM or SBM as the sole source of P in the diet. Four additional
diets, similar to the initial 4 diets with the exception that 500 FTU/kg of microbial phytase
(Optiphos; Enzyvia, Sheridan, IN) were added to each diet, were also formulated. Therefore, a
total of 8 diets were formulated (Tables 4.2 and 4.3).
Forty-eight barrows (initial BW: 16.60 ± 3.96 kg) were divided into 2 periods and placed
in metabolism cages equipped with a feeder and a nipple drinker. Pigs were randomly allotted
45
via a randomized complete block design using a 2 × 4 factorial arrangement to the 8 dietary
treatments based on initial BW. There were 6 replicate pigs per dietary treatment.
Individual pig BW was recorded at the initiation and at the conclusion of the experiment.
Feed was supplied at 2.5 times the daily maintenance energy requirement for the smallest pig in
each replicate and divided into 2 equal meals per day. The amount of feed supplied each day was
recorded and water was available at all times.
Sample Collection and Analysis
Experimental diets were provided for 12 d with the initial 5 d being the adaptation period.
Indigo carmine was added as an indigestible marker to the morning meals on d 6 and 11,
respectively. Fecal collections started when the first marker appeared in feces and ceased when
the second marker appeared. Feces were collected twice daily and stored immediately after
collection at -20°C. At the conclusion of the experiment, fecal samples were thawed and pooled
within animal and dried in a forced-air drying oven. Samples were finely ground and a
subsample was collected for analysis.
Diets and ingredients were analyzed for GE using bomb calorimetry (Model 6300; Parr
Instruments, Moline, IL), CP by combustion (Method 990.03; AOAC International, 2007) using
a Rapid N Cube (Elementar Americas Inc, Mt. Laurel, NJ) with Asp as the standard, and ash
(Method 942.05; AOAC International, 2007). Ingredients were also analyzed for acid hydrolyzed
ether extract (Method 2003.06, AOAC International, 2007) using an automated analyzer (Soxtec
2050; FOSS North America, Eden Prairie, MN), ADF (Method 973.18, AOAC International,
2007), NDF (Holst, 1973), AA (Method 982.30 E [a, b, and c]; AOAC International, 2007), and
phytate concentration (Ellis et al., 1977). Diet, ingredient, and fecal samples were also analyzed
for DM by forced air oven drying for 2 h at 135°C (Method 930.15; AOAC International, 2007),
46
and for Ca and P using inductively coupled plasma spectroscopy (Method 985.01 A, B, and C;
AOAC International, 2007) after wet ashing (Method 975.03 B[b]; AOAC International, 2007).
Calculations and Statistical Analysis
The concentration of phytate-bound P in each ingredient was calculated as 28.2% of
analyzed phytate (Tran and Sauvant, 2004). Non-phytate-bound P in each ingredient was
calculated as the difference between total P and phytate-bound P. Feed consumption was
summarized for each pig to calculate ADFI. The Ca and P intake for each treatment were
calculated by multiplying ADFI by the analyzed Ca or P concentration in the diet. The Ca and P
output for each treatment were calculated by multiplying the fecal output (DM) by the analyzed
Ca or P concentration in feces. Values for ATTD of Ca and P were calculated as described
previously (NRC, 2012). Standardized total tract digestibility of P was calculated by correcting
ATTD values for the endogenous loss of P, which was assumed to be 190 mg kg-1
DMI (NRC,
2012). Normality was confirmed and outliers were tested using the UNIVARIATE procedure of
SAS (SAS Institute Inc., Cary, NC). Outliers were identified as values that deviated from the
treatment mean by more than 3 times the interquartile range. Data for ATTD of Ca and P, STTD
of P, Ca and P intake, and fecal Ca and P output were analyzed by ANOVA using the MIXED
procedure of SAS with pig as the experimental unit. The model included dietary treatment,
microbial phytase, and the interaction between dietary treatment and phytase as fixed effects and
period as random effect. Least squares means were calculated for each independent variable. If
diet was a significant source of variation, means were separated using the PDIFF option of SAS.
Significance was assessed at P ≤ 0.05 and tendencies were determined at 0.05 < P ≤ 0.10.
47
RESULTS
There were no differences in feed intake among dietary treatments (Table 4.4). Pigs fed
CM-CV had greater Ca intake compared with pigs on the other treatments (P < 0.05). Pigs fed
CMA had the greatest (P < 0.05) P intake, whereas pigs fed SBM had the least P intake (P <
0.05). Pigs fed SBM also had the least fecal output, whereas pigs fed CM-CV and CMA had the
greatest (P < 0.05) fecal output. The greatest (P < 0.05) Ca output was observed for pigs fed the
CM-CV and the greatest P output was for pigs fed CMA (P < 0.05). However, pigs fed SBM had
the least (P < 0.05) Ca and P outputs (P < 0.05). Inclusion of phytase in the diets reduced both
Ca and P outputs (P < 0.05). There was no difference among the 3 CM for ATTD of Ca or P or
for STTD of P. Likewise, no differences in ATTD of Ca or P or STTD of P were observed
between the CM and the SBM. Inclusion of phytase improved (P < 0.05) ATTD of Ca and P and
STTD of P regardless of the ingredient in the diet and there was no interaction between diet and
phytase supplementation.
DISCUSSION
The analyzed nutrient composition of the CM and SBM used in this experiment are
presented in Table 4.1. The CP of the high-protein CM was 45.7% for CMA and 47.0% for
CMB. The SBM had a CP value of 46.7%. The CM-CV had the least CP value at 35.1%. The
content of most AA was greatest in SBM, but the high-protein CM had the greatest levels of
Met, Cys, Gly, and Pro. Levels of His, Thr, Trp, and Val were similar among the high-protein
CM and SBM. The CM-CV had the least amounts of all AA. The CP and AA values for the
high-protein CM were less than the values reported by Slominski et al. (2012) for yellow-seeded
CM. However, CP in these meals was greater than values reported in NRC (2012) for CM-CV
48
and greater than those reported by Simbaya et al. (1995) and Trindade Neto et al. (2012) for
yellow-seeded CM. Values of several AA for the high-protein CM were close to those reported
by Trindade Neto et al. (2012) for yellow-seeded CM, but levels of Lys, Met, Cys, Trp, Val, and
Pro were greater in the meals used in the current study. Values for all AA in the high-protein CM
were higher than those published in NRC (2012), and CP content and most AA values for CM-
CV were less than the published values (NRC, 2012). Crude protein and AA values of the SBM
were close to published values (Baidoo et al., 1987; NRC, 2012; Rojas and Stein, 2012).
Values for ADF and NDF of the high-protein CM were less than those reported by NRC
(2012) and Rodríguez et al. (2013). Values for NDF of the high-protein CM and CM-CV agreed
with values published by Slominski et al. (1994). Values for NDF and ADF of the CM-CV were
slightly greater than published values (NRC, 2012). The NDF value for SBM agrees with NRC
(2012), but the value for ADF was slightly lower than the NRC value, and both NDF and ADF
values for SBM were less than values reported by Rodríguez et al. (2013). The greater CP
content and lower fiber content of the high-protein CM compared with the CM-CV are likely a
result of the increased seed size of the canola. Therefore, the hull makes up a reduced proportion
of the seed, resulting in less fiber, and the embryo makes up a greater proportion, resulting in
greater CP content.
Values for DM and ash of the high-protein CM agree with published values (Simbaya et
al., 1995; NRC, 2012) and values for DM and ash of the CM-CV and SBM were close to values
previously reported (NRC, 2012; Rodríguez et al., 2013). The GE content of the high-protein
CM was greater than values for CM-CV (NRC, 2012; Rodríguez et al., 2013) but the GE in CM-
CV was less than previous values. Values for GE of SBM were in agreement with published
values (Akinmusire and Adeola, 2009; NRC, 2012; Rodríguez et al., 2013). All 3 CM had
49
greater P content than published in NRC (2012), but also contained more phytate P. The P
content of the CM-CV was less than values previously reported (Nwokolo and Bragg, 1977;
Slominski et al., 2012), but was in agreement with values reported by Akinmusire and Adeola
(2009). The P content of CMA was close to values published by Nwokolo and Bragg (1977) and
Slominski et al. (2012), but values for CMB were less. The concentration of P in CMB and the
CM-CV was not different and both contained less P than CMA. The phytate P content of the
CM-CV was in agreement with values previously reported (Slominski et al. 2012; Rodríguez et
al., 2013); however, there was more phytate P in the high-protein CM. Phosphorus and phytate P
content of the SBM are close to published values (Akinmusire and Adeola, 2009; NRC 2012;
Rojas and Stein, 2012). The most likely reason for the increased phytate P concentration in the
high-protein CM is that phytate is located in the embryo portion of the seed. With the increased
seed size and thinner hull, the embryo makes up a greater proportion of the seed and, therefore,
there are greater amounts of all constituents in the embryo, including phytate. Variations in soil
composition where the canola was grown may also be partly responsible for differing levels of
phytate P between the high-protein CM and the CM-CV, which were obtained from different
sources.
The STTD of P calculated for all 3 CM is in agreement with published values (Rodríguez
et al., 2013; Maison, 2013). The increased STTD of P for all treatments with the addition of
phytase is in agreement with published results (Akinmusire and Adeola, 2009; Maison, 2013;
Rodríguez et al., 2013). This observation is a result of the phytase dephosphorylating the phytate
to release P from the phytate-P complexes for absorption in the gastrointestinal tract (Selle et al.,
2009).
50
All CM diets were formulated to have 0.70% limestone, so that any variability in ATTD
of Ca among these 3 diets would have been due to differences in Ca digestibility in the canola
meals. Furthermore, the increase in ATTD of Ca with addition of phytase supports previous data
(González-Vega et al., 2013; Maison, 2013; Rodríguez et al., 2013) and was expected because
phytate may bind Ca and form Ca-phytate complexes in the gastrointestinal tract (Selle et al.,
2009).
In conclusion, a large proportion of the P in CM is phytate bound, resulting in high P
excretion and poor P digestibility. Phytate also binds Ca to some extent, resulting in increased
excretion and decreased digestibility. The addition of microbial phytase to diets containing CM
significantly improves STTD of P and ATTD of Ca and reduces P and Ca output.
51
LITERATURE CITED
Akinmusire, A. S., and O. Adeola. 2009. True digestibility of phosphorus in canola and soybean
meals for growing pigs: Influence of microbial phytase. J. Anim. Sci. 87:977-983.
AOAC International. 2007. Official methods of analysis. 18th
ed. Rev. 2. AOAC Int.,
Gaithersburg, MD.
Baidoo, S.K., B. N. Mitaru, F. X. Aherne, and R. Blair. 1987. The nutritive value of canola meal
for early-weaned pigs. Anim. Feed Sci. Technol. 18:45-53.
Ellis, R., E. R. Morris, and C. Philpot. 1977. Quantitative determination of phytate in the
presence of high inorganic phosphate. Anal. Biochem. 77:536-539.
González-Vega, J. C., C. L. Walk, Y. Liu, and H. H. Stein. 2013. Endogenous intestinal losses of
calcium and true total tract digestibility of calcium in canola meal fed to growing pigs. J.
Anim. Sci. 91:4807-4816.
Holst, D. O. 1973. Holst filtration apparatus for Van Soest detergent fiber analysis. J. AOAC
56:1352-1356.
Maison, T. 2013. Evaluation of the nutritional value of canola meal, 00-rapeseed meal, and 00-
rapeseed expellers fed to pigs. PhD Diss. Univ. of Illinois, Urbana.
NRC. 2012. Nutrient requirements of swine. 11th
rev. ed. Natl. Acad. Press, Washington, DC.
Nwokolo, E. N., and D. B. Bragg. 1977. Influence of phytic acid and crude fibre on the
availability of minerals from four protein supplements in growing chicks. Can. J. Anim.
Sci. 57:475-477.
Rodriguez, D. A., R. C. Sulabo, J. C. González-Vega, and H. H. Stein. 2013. Energy
concentration and phosphorus digestibility in canola, cottonseed, and sunflower products
fed to growing pigs. Can. J. Anim. Sci. 93:493-503.
52
Rojas, O. J., and H. H. Stein. 2012. Digestibility of phosphorus by growing pigs of fermented
and conventional soybean meal without and with microbial phytase. J. Anim. Sci.
90:1506-1512.
Sanjayan, N. 2013. The effect of feeding canola meal on nutrient digestibility and growth
performance in pigs. MS Thesis. Univ. of Manitoba, Winnipeg.
Selle, P. H., A. J. Cowieson, and V. Ravindran. 2009. Consequences of calcium interactions with
phytate and phytase for poultry and pigs. Livest. Sci. 124:126-141.
Simbaya, J., B. A. Slominski, G. Rakow, L. D. Campbell, R. K. Downey, and J. M. Bell. 1995.
Quality characteristics of yellow-seeded Brassica seed meals: protein, carbohydrates, and
dietary fiber components. J. Agric. Food Chem. 43:2062-2066.
Simons, P. C. M., H. A. J. Versteegh, A. W. Jongbloed, P. A. Kemme, P. Slump, K. D. Bos, M.
G. E. Wolters, R. F. Beudeker, and G. J. Verschoor. 1990. Improvement of phosphorus
availability by microbial phytase in broilers and pigs. Br. J. Nutr. 64:525-540.
Slominski, B. A., L. D. Campbell, and W. Guenter. 1994. Carbohydrates and dietary fiber
components of yellow- and brown-seeded canola. J. Agric. Food Chem. 42:704-707.
Slominski, B. A., W. Jia, A. Rogiewicz, C. M. Nyachoti, and D. Hickling. 2012. Low-fiber
canola. Part 1. Chemical and nutritive composition of the meal. J. Agric. Food Chem.
60:12225-12230.
Stein, H. H., O. Adeola, G. L Cromwell, S. W. Kim, D. C. Mahan, and P. S. Miller. 2011.
Concentration of dietary calcium supplied by calcium carbonate does not affect the
apparent total tract digestibility of calcium, but decreased digestibility of phosphorus by
growing pigs. J. Anim. Sci. 89:2139-2144.
53
Tran, G., and D. Sauvant. 2004. Chemical data and nutritional value. In: Tables of composition
and nutritional value of feed materials. 2nd ed. Wageningen Academic Publishers,
Wageningen, The Netherlands. p. 17-24.
Trindade Neto, M. A., F. O. Opepaju, B. A. Slominski, and C. M. Nyachoti. 2012. Ileal amino
acid digestibility in canola meals from yellow- and black-seeded Brassica napus and
Brassica juncea fed to growing pigs. J. Anim. Sci. 90:3477-3484.
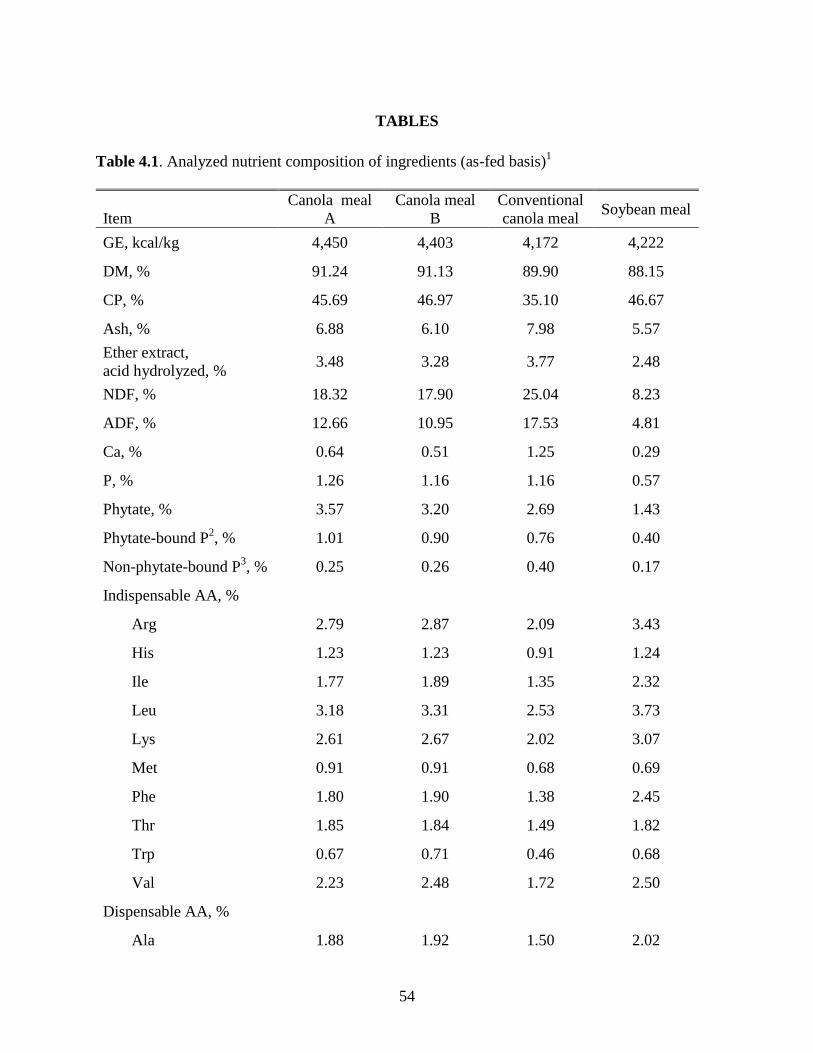
54
TABLES
Table 4.1. Analyzed nutrient composition of ingredients (as-fed basis)1
Item
Canola meal
A
Canola meal
B
Conventional
canola meal Soybean meal
GE, kcal/kg 4,450 4,403 4,172 4,222
DM, % 91.24 91.13 89.90 88.15
CP, % 45.69 46.97 35.10 46.67
Ash, % 6.88 6.10 7.98 5.57
Ether extract,
acid hydrolyzed, % 3.48 3.28 3.77 2.48
NDF, % 18.32 17.90 25.04 8.23
ADF, % 12.66 10.95 17.53 4.81
Ca, % 0.64 0.51 1.25 0.29
P, % 1.26 1.16 1.16 0.57
Phytate, % 3.57 3.20 2.69 1.43
Phytate-bound P2, % 1.01 0.90 0.76 0.40
Non-phytate-bound P3, % 0.25 0.26 0.40 0.17
Indispensable AA, %
Arg 2.79 2.87 2.09 3.43
His 1.23 1.23 0.91 1.24
Ile 1.77 1.89 1.35 2.32
Leu 3.18 3.31 2.53 3.73
Lys 2.61 2.67 2.02 3.07
Met 0.91 0.91 0.68 0.69
Phe 1.80 1.90 1.38 2.45
Thr 1.85 1.84 1.49 1.82
Trp 0.67 0.71 0.46 0.68
Val 2.23 2.48 1.72 2.50
Dispensable AA, %
Ala 1.88 1.92 1.50 2.02
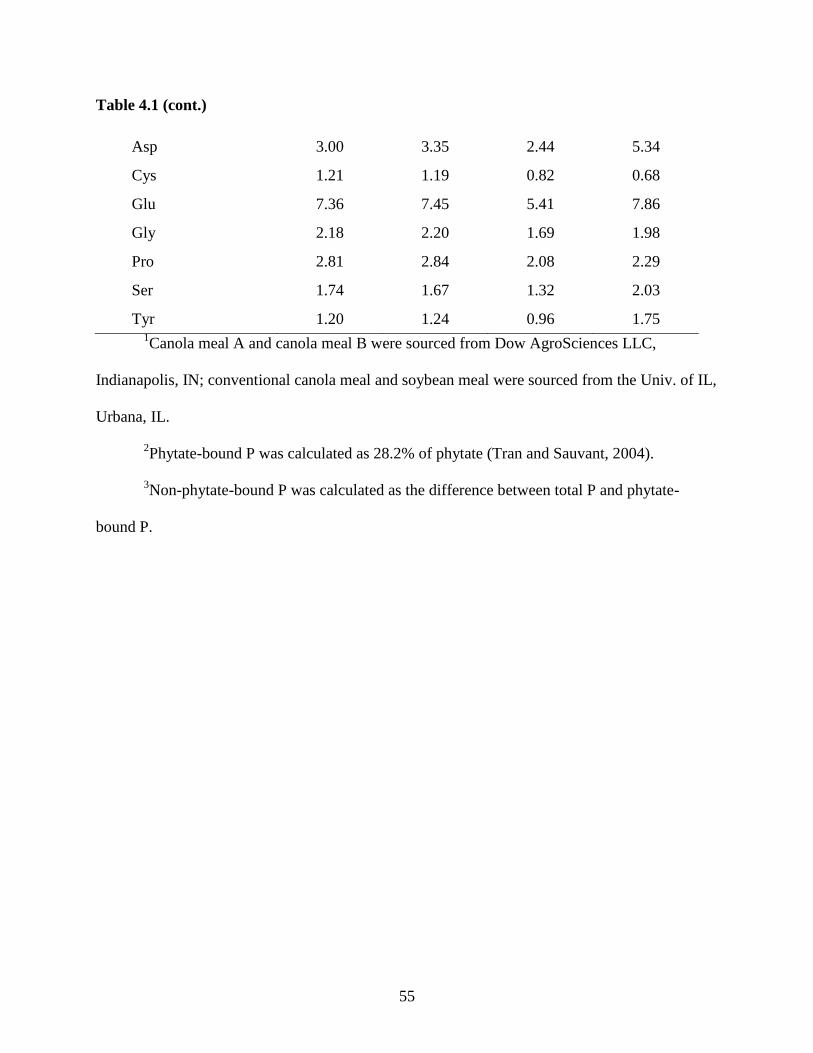
55
Table 4.1 (cont.)
Asp 3.00 3.35 2.44 5.34
Cys 1.21 1.19 0.82 0.68
Glu 7.36 7.45 5.41 7.86
Gly 2.18 2.20 1.69 1.98
Pro 2.81 2.84 2.08 2.29
Ser 1.74 1.67 1.32 2.03
Tyr 1.20 1.24 0.96 1.75 1Canola meal A and canola meal B were sourced from Dow AgroSciences LLC,
Indianapolis, IN; conventional canola meal and soybean meal were sourced from the Univ. of IL,
Urbana, IL.
2Phytate-bound P was calculated as 28.2% of phytate (Tran and Sauvant, 2004).
3Non-phytate-bound P was calculated as the difference between total P and phytate-
bound P.
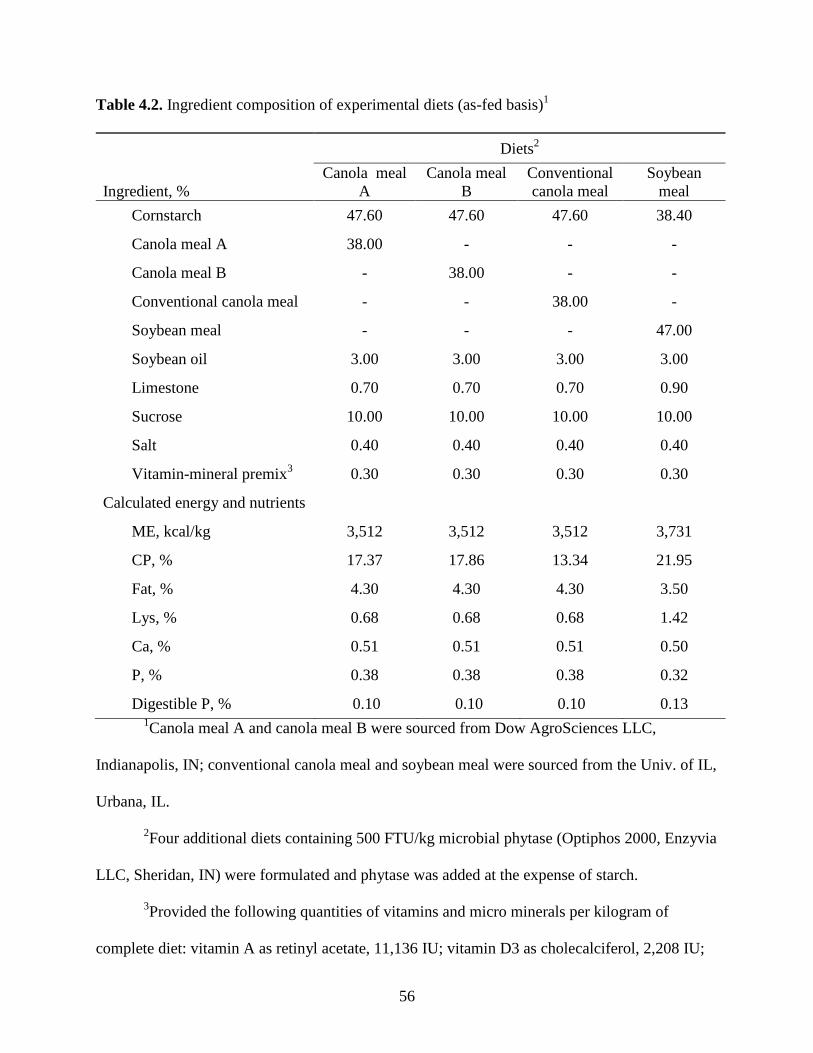
56
Table 4.2. Ingredient composition of experimental diets (as-fed basis)1
Diets2
Ingredient, %
Canola meal
A
Canola meal
B
Conventional
canola meal
Soybean
meal
Cornstarch 47.60 47.60 47.60 38.40
Canola meal A 38.00 - - -
Canola meal B - 38.00 - -
Conventional canola meal - - 38.00 -
Soybean meal - - - 47.00
Soybean oil 3.00 3.00 3.00 3.00
Limestone 0.70 0.70 0.70 0.90
Sucrose 10.00 10.00 10.00 10.00
Salt 0.40 0.40 0.40 0.40
Vitamin-mineral premix3
0.30 0.30 0.30 0.30
Calculated energy and nutrients
ME, kcal/kg 3,512 3,512 3,512 3,731
CP, % 17.37 17.86 13.34 21.95
Fat, % 4.30 4.30 4.30 3.50
Lys, % 0.68 0.68 0.68 1.42
Ca, % 0.51 0.51 0.51 0.50
P, % 0.38 0.38 0.38 0.32
Digestible P, % 0.10 0.10 0.10 0.13 1Canola meal A and canola meal B were sourced from Dow AgroSciences LLC,
Indianapolis, IN; conventional canola meal and soybean meal were sourced from the Univ. of IL,
Urbana, IL.
2Four additional diets containing 500 FTU/kg microbial phytase (Optiphos 2000, Enzyvia
LLC, Sheridan, IN) were formulated and phytase was added at the expense of starch.
3Provided the following quantities of vitamins and micro minerals per kilogram of
complete diet: vitamin A as retinyl acetate, 11,136 IU; vitamin D3 as cholecalciferol, 2,208 IU;
57
vitamin E as DL-alpha tocopheryl acetate, 66 IU; vitamin K as menadione dimethylprimidinol
bisulfite, 1.42 mg; thiamin as thiamine mononitrate, 0.24 mg; riboflavin, 6.59 mg; pyridoxine as
pyridoxine hydrochloride, 0.24 mg; vitamin B12, 0.03 mg; D-pantothenic acid as D-calcium
pantothenate, 23.5 mg; niacin, 44.1 mg; folic acid, 1.59 mg; biotin, 0.44 mg; Cu, 20 mg as
copper sulfate and copper chloride; Fe, 126 mg as ferrous sulfate; I, 1.26 mg as ethylenediamine
dihydriodide; Mn, 60.2 mg as manganese sulfate; Se, 0.3 mg as sodium selenite and selenium
yeast; and Zn, 125.1 mg as zinc sulfate.
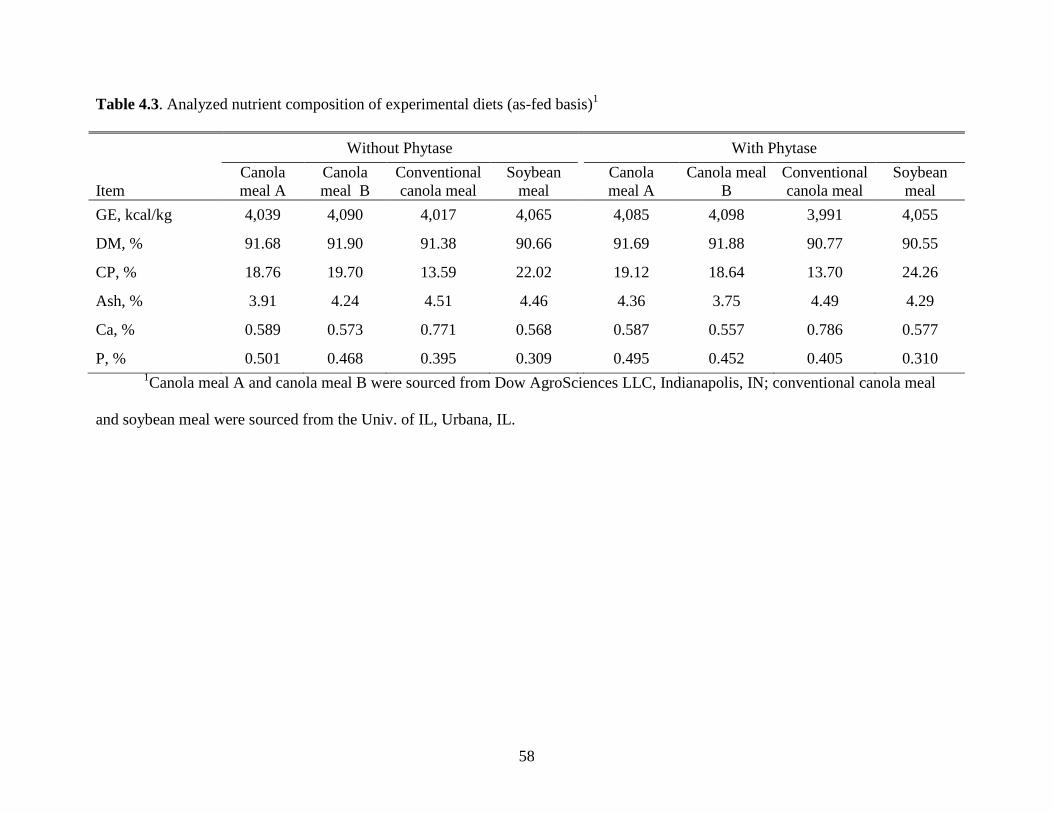
58
Table 4.3. Analyzed nutrient composition of experimental diets (as-fed basis)1
Without Phytase With Phytase
Item
Canola
meal A
Canola
meal B
Conventional
canola meal
Soybean
meal
Canola
meal A
Canola meal
B
Conventional
canola meal
Soybean
meal
GE, kcal/kg 4,039 4,090 4,017 4,065 4,085 4,098 3,991 4,055
DM, % 91.68 91.90 91.38 90.66 91.69 91.88 90.77 90.55
CP, % 18.76 19.70 13.59 22.02 19.12 18.64 13.70 24.26
Ash, % 3.91 4.24 4.51 4.46 4.36 3.75 4.49 4.29
Ca, % 0.589 0.573 0.771 0.568 0.587 0.557 0.786 0.577
P, % 0.501 0.468 0.395 0.309 0.495 0.452 0.405 0.310 1Canola meal A and canola meal B were sourced from Dow AgroSciences LLC, Indianapolis, IN; conventional canola meal
and soybean meal were sourced from the Univ. of IL, Urbana, IL.
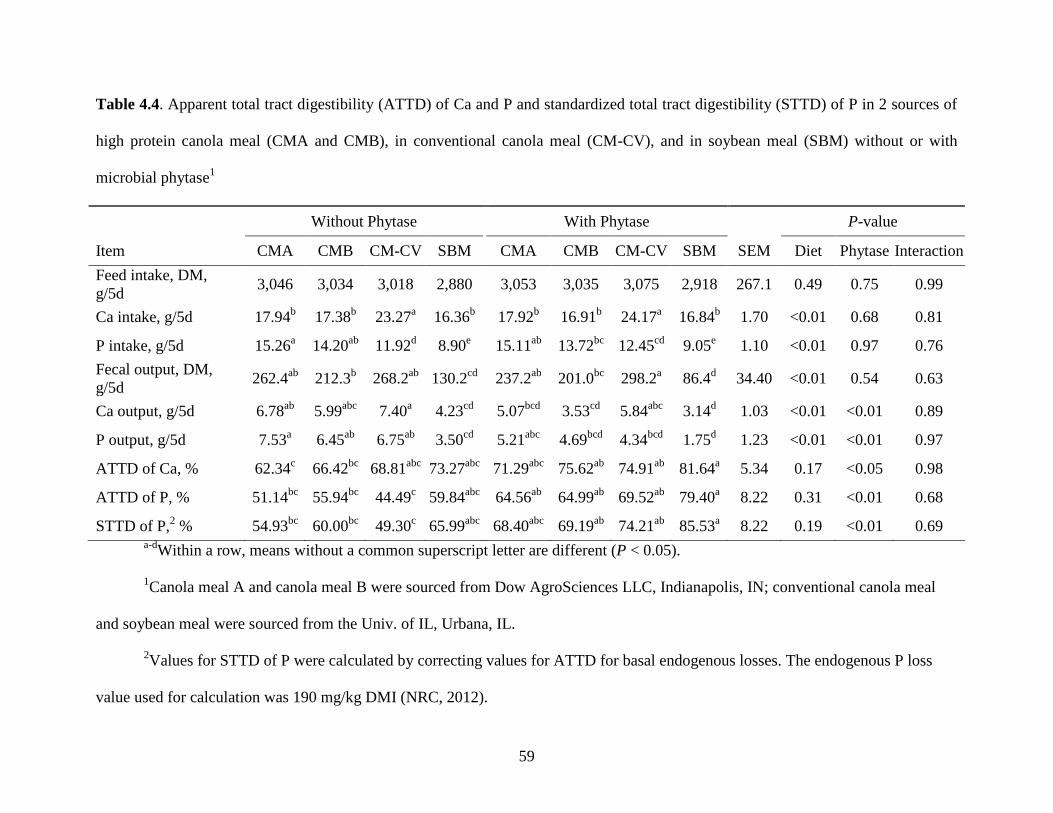
59
Table 4.4. Apparent total tract digestibility (ATTD) of Ca and P and standardized total tract digestibility (STTD) of P in 2 sources of
high protein canola meal (CMA and CMB), in conventional canola meal (CM-CV), and in soybean meal (SBM) without or with
microbial phytase1
Without Phytase
With Phytase P-value
Item CMA CMB CM-CV SBM CMA CMB CM-CV SBM SEM Diet
Phytase Interaction
Feed intake, DM,
g/5d 3,046 3,034 3,018 2,880 3,053 3,035 3,075 2,918 267.1 0.49 0.75 0.99
Ca intake, g/5d 17.94b
17.38b
23.27a
16.36b
17.92b
16.91b
24.17a
16.84b
1.70 <0.01 0.68 0.81
P intake, g/5d 15.26a
14.20ab
11.92d
8.90e
15.11ab
13.72bc
12.45cd
9.05e
1.10 <0.01 0.97 0.76
Fecal output, DM,
g/5d 262.4
ab 212.3
b 268.2
ab 130.2
cd 237.2
ab 201.0
bc 298.2
a 86.4
d 34.40 <0.01 0.54 0.63
Ca output, g/5d 6.78ab
5.99abc
7.40a
4.23cd
5.07bcd
3.53cd
5.84abc
3.14d
1.03 <0.01 <0.01 0.89
P output, g/5d 7.53a
6.45ab
6.75ab
3.50cd
5.21abc
4.69bcd
4.34bcd
1.75d
1.23 <0.01 <0.01 0.97
ATTD of Ca, % 62.34c
66.42bc
68.81abc
73.27abc
71.29abc
75.62ab
74.91ab
81.64a
5.34 0.17 <0.05 0.98
ATTD of P, % 51.14bc
55.94bc
44.49c
59.84abc
64.56ab
64.99ab
69.52ab
79.40a
8.22 0.31 <0.01 0.68
STTD of P,2 % 54.93
bc 60.00
bc 49.30
c 65.99
abc 68.40
abc 69.19
ab 74.21
ab 85.53
a 8.22 0.19 <0.01 0.69
a-dWithin a row, means without a common superscript letter are different (P < 0.05).
1Canola meal A and canola meal B were sourced from Dow AgroSciences LLC, Indianapolis, IN; conventional canola meal
and soybean meal were sourced from the Univ. of IL, Urbana, IL.
2Values for STTD of P were calculated by correcting values for ATTD for basal endogenous losses. The endogenous P loss
value used for calculation was 190 mg/kg DMI (NRC, 2012).
60
CHAPTER 5
EFFECTS OF HIGH-PROTEIN OR CONVENTIONAL CANOLA MEAL ON GROWTH
PERFORMANCE, ORGAN WEIGHTS, BONE ASH, AND BLOOD
CHARACTERISTICS OF WEANLING PIGS
ABSTRACT
An experiment was conducted to evaluate effects of 2 high-protein canola meals (CMA; 45.7%
CP and CMB; 47.0% CP, respectively) and a conventional canola meal (CM-CV; 35.1% CP) on
growth performance, organ weights, bone ash, and blood characteristics of weanling pigs.
Inclusion rates of canola meal in the diets were 10, 20, 30, or 40% from CMA and CM-CV,
whereas inclusions were 10, 20, or 30% from CMB. No 40% inclusion of CMB was used due to
lack of ingredient. A control diet containing no canola meal was also used. Therefore, a total of
12 diets were tested in this experiment. A total of 420 pigs (initial BW: 9.8 ± 1.1 kg) were
divided into 3 blocks and randomly allotted to 1 of the 12 diets with 8 replicate pens per
treatment and 4 or 5 pigs per pen. The ADG, ADFI, and G:F were calculated and, at the
conclusion of the experiment, one pig in each pen was sacrificed to measure organ weights and
blood characteristics and to collect the 3rd
and 4th
metacarpals from the left foot. Results indicate
that ADFI was linearly (P < 0.05) decreased if inclusion of CMA, CMB, or CM-CV increased.
Average daily gain for pigs fed CMA tended to increase quadratically, with the maximum
response observed if 10 or 20% canola meal was included in the diet (P = 0.06). However, G:F
was linearly (P < 0.05) increased by adding CMA or CM-CV to the diets. Liver weights were
also linearly (P < 0.05) increased if pigs were fed diets containing CMB, but kidney weights
were linearly (P < 0.05) decreased by adding CM-CV to the diets. Thyroid gland weights
61
increased linearly (P < 0.05) for pigs fed diets containing CMA. No differences were observed
on heart and bone weights if canola meal was added to the diets. Addition of any of the 3 canola
meals linearly (P < 0.05) increased bone ash percentage in the metacarpals. Inclusion of CMA or
CM-CV linearly (P < 0.05) decreased serum triiodothyronine, and the inclusion of CMA also
linearly (P < 0.05) decreased serum thyroxine in weanling pigs. No differences were observed
for complete blood counts or blood urea nitrogen if canola meal was added to the diets. In
conclusion, high-protein or conventional canola meals can be included in diets for weanling pigs
from 2 wk post-weaning at 20% minimum without reducing growth performance or negatively
affecting organ, bone, or blood characteristics, but greater inclusion levels may result in reduced
performance due to reduced feed intake.
Key words: bone ash, canola meal, growth performance, high-protein canola meal, organs,
weanling pigs
INTRODUCTION
Canola and rapeseed meal are the second most commonly used protein sources in the
world in animal diets (Arntfield and Hickling, 2011). Rapeseed meal has been fed to livestock
for decades, though inclusion in swine diets has been limited in the past due to anti-nutritional
factors such as glucosinolates, erucic acid, and fiber. In response, Canadian plant breeders
developed a low-glucosinolate and low erucic acid variety of rapeseed, known as canola. Past
studies have not shown consistency in the percentage of protein from soybean meal (SBM) that
can be replaced by canola meal (CM) in diets fed to weanling pigs, varying from <10%
(Rundgren, 1983) to complete replacement (Bowland, 1975). Results of more recent studies
62
indicate that 15 to 20 percentage units of SBM in diets can be replaced with CM with no effect
on growth performance (Seneviratne et al., 2011; Landero et al., 2011).
Yellow-seeded Brassica napus has a larger, thinner seed size than the conventional
black-seeded B. napus (Rahman et al., 2001) and contains more CP and less dietary fiber
(Slominski et al., 2012). The seed coat of yellow-seeded canola contains less fiber as a
percentage of the seed and also has increased energy digestibility. Results of research in which
yellow-seeded CM was fed to growing pigs indicate that inclusion levels of 25% can be used
without negative effects on growth performance (Sanjayan, 2013). Trindade Neto et al. (2012)
included 35% CM in diets for growing pigs and reported no effects on ileal digestibility of AA.
There is, however, limited information about feeding high-protein CM to weanling pigs.
Therefore, the objectives of this experiment were to compare growth performance, organ
weights, bone ash, and blood characteristics between weaned pigs fed diets containing either
high-protein CM or conventional canola meal (CM-CV) at increasing inclusion levels and to
determine the maximum inclusion level of high-protein CM in diets for weanling pigs.
MATERIALS AND METHODS
The protocol concerning this experiment was reviewed and approved by the Institutional Animal
Care and Use Committee at the University of Illinois. Pigs used in the experiment were offspring
of G-performer boars × Fertilium 25 females (Genetiporc, Alexandria, MN).
Diets, Animals, and Experimental Design
Two sources of CM produced from new varieties of high-protein canola seeds (CMA and
CMB) and a CM-CV were used (Table 5.1). Canola meal A and the CM-CV were used at
inclusion rates of 10, 20, 30, or 40% of diets fed to weanling pigs, whereas CMB was used only
63
at 10, 20, or 30% inclusion. A control diet containing no CM was also included in the experiment
so a total of 12 diets were formulated (Tables 5.3 and 5.4). Canola meal primarily replaced SBM
in the diets, and all diets were formulated based on the digestibility values for energy, AA, and P
that were previously determined in the same batches of the 3 CM and the SBM that were used in
this experiment.
A total of 420 pigs that had been weaned for 2 wk (initial BW: 9.8 ± 1.1 kg) were divided
into 3 blocks based on date of birth and blocks were started 2 weeks apart. Within each block,
pigs were randomly allotted via a randomized complete block design to the 12 dietary treatments
based on initial BW. There were 3, 3, and 2 replicate pens in each block for a total of 8 replicates
per dietary treatment. There were 5 replicates with 4 pigs per pen, and 3 replicates with 5 pigs
per pen with an equal number of barrows and gilts on each treatment. Pens were 1.2 × 1.4 m with
either slatted or mesh floors and each pen was equipped with a feeder and a nipple drinker.
Individual pig BW was recorded at the initiation of the experiment and final BW was
recorded at the conclusion. Feed was added as needed to assure free access at all times
throughout the 3 wk experiment. Feed intake per pen was recorded. Water was available at all
times.
Sample Collection and Analysis
At the conclusion of the experiment, one pig of average BW in each pen was sacrificed,
organ weights were recorded, and tissue and blood samples were collected. An equal number of
barrows and gilts were sacrificed. Three tubes of blood were collected from each pig that was
designated to be sacrificed via jugular venipuncture in EDTA tubes. Tubes were stored on ice
immediately after collection. One blood sample from each pig was analyzed for complete blood
count (CBC). The other 2 samples were centrifuged (3,000 rpm at 4°C for 10 min). Plasma was
64
collected from the centrifuged tubes and plasma from 1 tube was analyzed for triiodothyronine
(T3) and thyroxine (T4) and plasma from the other tube was analyzed for blood urea nitrogen
(BUN). Thyroid hormones were analyzed using an ELISA kit (Abnova, Taipei, Taiwan) and
BUN was analyzed on an Olympus AU680 Chemistry Analyzer (Olympus Life Science
Research Europa GmbH, Sauerbruchstr., Munich, Germany).
Following blood collection, pigs were killed via captive bolt penetration and
exsanguination. The liver, heart, kidneys, and thyroid gland were removed, and the weight of
each organ was recorded.
The third and fourth metacarpals were collected from the front left foot of each sacrificed
pig. Bones were autoclaved for 40 min and cheesecloth was used to aid in the removal of soft
tissue. Bones were defatted in ether for 3 d and then ashed in a muffle furnace at 600°C for 16 h
for determination of total bone ash.
Diets and ingredients were analyzed for GE using bomb calorimetry (Model 6300; Parr
Instruments, Moline, IL), DM by forced air oven drying for 2 h at 135°C (Method 930.15;
AOAC International, 2007), and CP by combustion (Method 990.03; AOAC International, 2007)
using a Rapid N Cube (Elementar Americas Inc, Mt. Laurel, NJ) with Asp as the standard. Diets
and ingredients were also analyzed for acid hydrolyzed ether extract (Method 2003.06, AOAC
International, 2007) on an automated analyzer (Soxtec 2050; FOSS North America, Eden Prairie,
MN), ADF (Method 973.18, AOAC International, 2007), NDF (Holst, 1973), and AA (Method
982.30 E [a, b, and c]; AOAC International, 2007). Diet and ingredient samples were also
analyzed for Ca and P using inductively coupled plasma spectroscopy (Method 985.01 A, B, and
C; AOAC International, 2007) after wet ashing (Method 975.03 B[b]; AOAC International,
2007). Diets, ingredients, and bones were analyzed for ash (Method 942.05; AOAC
65
International, 2007). Ingredients were also analyzed for phytate concentration (Ellis et al., 1977)
and glucosinolates (method MGLUC-01, SunWest Food Laboratory Ltd, Saskatoon, SK).
Calculations and Statistical Analysis
At the conclusion of the experiment, pigs were weighed and data were summarized to
calculate ADG, ADFI, and G:F. Percent bone ash was calculated by dividing ashed bone weight
by defatted bone weight. The concentrations of non-phytate- and phytate-bound P in CM and
SBM were calculated at previously described (Rojas and Stein, 2012). Glucosinolate content in
the diets was calculated by multiplying the total analyzed glucosinolate concentration of the CM
used by the inclusion level of that CM in the diet. Data for ADG, ADFI, G:F, organ weights,
bone ash, CBC, T3 and T4 levels, and BUN were analyzed using the PROC MIXED procedure
of SAS (SAS inst. Inc., Cary, NC) with pen as the experimental unit. The model included
treatment as the fixed effect and block as the random effect. Least squares means were calculated
for each independent variable. Linear and quadratic effects of inclusion level of canola meal
were determined using orthogonal contrasts. Significance was assessed at P ≤ 0.05 and
tendencies were determined at 0.05 < P ≤ 0.10.
RESULTS
Growth Performance
All pigs readily consumed their assigned diets; however, a total of 10 pigs were removed
from the experiment because they became sick or lame. One pig was on the control diet, 2 pigs
were from 20% diets, 3 from 30% diets, and 4 from 40% diets. None of the pig removals
appeared to be treatment related. There were no significant differences in initial BW among pigs
assigned to the 12 dietary treatments (Table 5.5). Feed intake decreased linearly (P < 0.05) with
66
increased inclusion of CM, regardless of variety. Average daily gain of pigs fed CMA tended to
increase if 10 or 20% CM was used (quadratic, P = 0.06), but for CMB and the CM-CV, no
differences among treatments were observed for ADG. The G:F improved (linear, P < 0.05) with
increasing inclusion of CMA or CM-CV in the diets, but inclusion of CMB in the diets had no
impact on G:F. Final BW was not affected by dietary treatments.
Organ, Bone, and Blood Characteristics
Liver weight tended to increase (linear, P = 0.06) for pigs fed diets containing CMA, and
increased (linear, P < 0.05) for pigs fed CMB, but inclusion of the CM-CV in the diets did not
influence liver weight (Table 5.6). Thyroid gland weight increased (linear, P < 0.05) for pigs fed
diets containing CMA, but inclusion of CMB or the CM-CV did not influence thyroid gland
weight. There were no effects of feeding CM on heart weight, bone weight, CBC, or BUN or on
kidney weight for CMA or CMB. However, kidney weights from pigs fed diets containing the
CM-CV decreased (linear, P < 0.05) with increasing inclusion of CM in the diets. Ashed bone
weight tended to increase (linear, P = 0.10) for pigs fed diets containing CMA, but no effects on
ashed bone weight were observed for pigs fed diets containing CMB or the CM-CV. Bone ash
percent increased (linear, P < 0.05) for pigs fed diets containing CM, regardless of the variety.
Levels of both T3 and T4 decreased (linear, P < 0.05) for pigs fed diets containing CMA. Levels
of T3 also decreased (linear, P < 0.05) for pigs fed diets containing CM-CV. Levels of T4 tended
to decrease (linear, P = 0.07) for pigs fed diets containing CMB, but no effects on T4 levels were
observed for pigs fed diets containing the CM-CV.
67
DISCUSSION
Composition of Ingredients
The CM-CV had lower concentrations of DM, CP, GE, and most AA compared with
published values for solvent-extracted CM. Likewise, concentrations of NDF and ADF were less
than values in the literature (NRC, 2012).
Canola meals A and B were produced from high-protein varieties of canola and,
therefore, had greater CP and AA concentrations than CM-CV. These high-protein varieties are
yellow-seeded Brassica napus. Compared with black-seeded B. napus, the yellow seeds are
larger and have a thinner hull. Simbaya et al. (1995) reported that the protein content of the
yellow seeds was 3.8 percentage units greater than in the black seeds, but Slominski et al. (2012)
reported a 6 percentage unit difference between black-seeded and yellow-seeded canola. The
reason the difference observed in this study was more than 10 percentage units may be that the
CP in CM-CV was less than in the CM-CV used by others. Values analyzed for the high-protein
CM were in agreement with or slightly less than previously published values (Simbaya et al.,
1995; Slominski et al., 2012; Sanjayan, 2013).
In addition to greater protein content, yellow-seeded canola varieties contain less fiber.
This is partly due to the thinner hull, which, in addition to the larger seed, results in the hull
fraction accounting for less of the total seed mass. Analyzed values for NDF were in agreement
with those of Slominski et al. (1994) and were approximately 7 percentage units less than those
of CM-CV. This is in accordance with work by Simbaya et al. (1995), who reported that dietary
fiber content in yellow-seeded CM was 6 percentage units less than in black-seeded CM.
One of the main reasons for limited use of CM in swine diets is the high level of
glucosinolates. Although canola refers to varieties of rapeseed that are already “low” in
68
glucosinolates (<30 µmol/g), high inclusion rates can cause deleterious effects on growth
performance. The high-protein CM used in this study contained almost twice the levels of
glucosinolates compared with the CM-CV.
Growth Performance
The lack of a difference in ADG between low levels of CM and the control diet is not
consistent with data by Castell (1977) who concluded that pigs fed rapeseed meal had poorer
ADG compared with pigs fed SBM, but the present observations are in agreement with more
recent reports in which it was indicated that feeding up to 25% CM does not affect growth
performance (King et al., 2001). The decrease in ADFI observed in this experiment is consistent
with Baidoo et al. (1987), who conducted 4 experiments feeding graded inclusion levels of CM
to pigs and reported decreased ADFI with increased CM inclusion. The observation that feed
efficiency was improved for all pigs fed CM compared with pigs fed the control diet is in
agreement with results of previous research (Castell, 1977). The reason G:F increased with
increasing inclusion of CM is that ADG values were not different regardless of inclusion levels,
but ADFI decreased as CM concentration increased. A potential explanation for this observation
is that while the pigs gained the same, body composition may have been changed. It is unlikely
that ME in the CM was underestimated because values that had been determined in the same
batches of CM and SBM were used in diet formulations. The decrease in ADFI for pigs fed diets
containing CM may be explained by the increase in glucosinolates in the diets, which cause a
bitter taste. Schöne et al. (1997) recommended that diets not exceed 2 µmol/g glucosinolates.
Only the diets with 10% inclusion of high-protein CM contained glucosinolate levels below that
recommendation, whereas the CM-CV is within that limitation up to 20% inclusion.
69
Organs
The increase in liver weight observed for pigs fed diets containing CMA may be due to a
reduction in protein quality in the diets containing high-protein CM. In addition, the diets were
not balanced nitrogenously, so increasing inclusion of CM increased the CP concentration in the
diet. This indicates that there may have been an increase in the frequency of the urea cycle,
causing the liver to work harder and build muscle, resulting in increased liver weights. These
observations are in contrast to reports from previous studies indicating no change in liver weight
of pigs fed diets containing CM (Slinger, 1977; Busato et al., 1991; Thomke et al., 1983).
The increased weight of the thyroid gland with increasing inclusion of CM is in
agreement with studies published by Mullan et al. (2000) and Thomke et al. (1983) for
conventional type CM. On the contrary, Busato et al. (1991) and King et al. (2001) reported that
CM had no effect on thyroid gland weight. All CM diets except the 10% CMA diet produced
greater thyroid gland weights than the control diet, which is in agreement with Slinger (1977),
who showed an increase in thyroid gland weights of pigs fed CM over those fed a corn-SBM
diet. The increase for pigs fed CMA may be due to the higher level of glucosinolates compared
to the CM-CV. The lack of difference seen for pigs fed CMB is likely because there was no 40%
inclusion level of this meal. However, there was a numerical increase within the levels included,
indicating significance would have been observed with the additional inclusion level (P = 0.11).
Increased thyroid gland weight may be due to a lack of iodine to the thyroid gland, which
can be impaired by goitrogens in CM (Underwood, 1977). Sihombing et al. (1974) conducted 4
studies to investigate the effect of iodine supplementation on thyroid gland weight in pigs with
induced hypothyroidism. Results of all 4 studies indicated that thyroid gland weights were
reduced with increasing iodine supplementation. However, iodine was included in the vitamin-
70
micromineral premix that was used in this experiment, which may have ameliorated the effects
of glucosinolates on weight of the thyroid glands.
The lack of difference observed in the kidneys of pigs fed CM diets supports previous
research by Thomke et al. (1983) using conventional type CM. Additionally, the lack of effect of
treatment on heart weight agrees with research conducted by Slinger (1977).
Bones
Though the thyroid gland data indicate a potential shortage of iodine, the lack of a
difference in bone weights indicates that there was not enough of an iodine deficiency to affect
bone synthesis. The increase of bone ash percent with increasing inclusion of all 3 CM is likely a
result of the increasing dietary P concentration. It may also indicate that the Ca in the CM is
better digested than inorganic Ca. However, this is unlikely because the ATTD of Ca in CM is
less than the ATTD of Ca in calcium carbonate (Stein et al., 2011; González-Vega et al., 2013).
Bragg and Seier (1974) observed greater Se content and availability in CM compared to SBM.
Only CMA had greater Se content than SBM in this experiment, which may have accounted for
the increase in bone ash percent seen for pigs fed that diet. Research where CM completely
replaced SBM indicated no effect on bone magnesium content (Leeson et al., 1987), but it is
possible that ATTD of another mineral is better in CM than SBM, which may contribute to the
increase in bone ash percent seen for pigs fed diets containing the other 2 CM.
Blood
The reduced serum concentrations of T3 and T4 in pigs fed CM compared with pigs fed
the control diet are in agreement with results of previous research (Bowland, 1975; Aherne and
Lewis, 1978; Busato et al., 1991). Reduced thyroid hormone levels in combination with
increased thyroid gland weight are indicative of impairment of thyroid function due to
71
glucosinolates in the diets. The reason there was less of a difference in serum levels of T3 and T4
between diets containing CM-CV and the control diet, is that the CM-CV had a reduced
concentration of glucosinolates compared with the high-protein CM. The thyroid hormones are
responsible for normal muscle function, including growth and development, and a deficiency
may result in growth depression (Hocquette et al., 1998). The decreased thyroid hormone
concentrations from the CM diets that were observed in this experiment, however, were not low
enough to reduce growth performance of pigs fed those diets.
There was no difference in CBC among treatments (Table 5.7). There was also no
difference in BUN among treatments, indicating that all diets were balanced for AA to the same
degree. Synthetic AA were used in diet formulation to obtain this balance.
In conclusion, high-protein or conventional CM can be included in diets for weanling
pigs from 2 wk post-weaning at a minimum of 20% without reducing growth performance or
negatively affecting organ, bone, or blood characteristics. However, greater inclusion levels may
reduce performance due to reduced feed intake.
72
LITERATURE CITED
AOAC International. 2007. Official methods of analysis. 18th
ed. W. Hortwitz and G. W. Latimer
Jr., editors. AOAC Int., Gaithersburg, MD.
Arntfield, S. and D. Hickling. 2011. Meal nutrition and utilization. In: J. K. Daun, N. A. M.
Eskin, and D. Hickling, editors, Canola: Chemistry, production, processing, and
utilization. AOCS Press, Urbana, IL. p. 281-312.
Baidoo, S. K., B. N. Mitaru, F. X. Aherne, and R. Blair. 1987. The nutritive value of canola meal
for early-weaned pigs. Anim. Feed Sci. Technol. 18:45-53.
Bowland, J. P. 1975. Evaluation of low glucosinolate - low erucic acid rapeseed meals as protein
supplements for young growing pigs, including effects on blood serum constituents. Can.
J. Anim. Sci. 55: 409-419.
Bragg, D. B., and L. Seier. 1974. Mineral content and biological activity of selenium in rapeseed
meal. Poult. Sci. 53:22-26.
Busato, A., G. E. Bestetti, G. L. Rossi, H. Gerber, H. J. Peter, and J. W. Blum. 1991. Effects of
feeding rapeseed-meal on liver and thyroid gland function and histomorphology in
growing pigs. J. Anim. Physiol. Anim. Nutr. 66:12-27.
Castell, A. G. 1977. Effects of virginiamycin on the performance of pigs fed barley diets
supplemented with soybean meal or low-glucosinolate rapeseed meal. Can. J. Anim. Sci.
57:313-320.
Ellis, R., E. R. Morris, and C. Philpot. 1977. Quantitative determination of phytate in the
presence of high inorganic phosphate. Anal. Biochem. 77:536-539.
73
González-Vega, J. C., C. L. Walk, Y. Liu, and H. H. Stein. 2013. Determination of endogenous
intestinal losses of calcium and true total tract digestibility of calcium in canola meal fed
to growing pigs. J. Anim. Sci. 91:4807-4816.
Hocquette, J. F., I. Ortigues-Marty, D. Pethick, P. Herpin, and X. Fernandez. 1998. Nutritional
and hormonal regulation of energy metabolism in skeletal muscles of meat-producing
animals. Livest. Prod. Sci. 56:115-143.
Holst, D. O. 1973. Holst filtration apparatus for Van Soest detergent fiber analysis. J. AOAC
56:1352-1356.
King, R. H., P. E. Eason, D. K. Kerton, and F. R. Dunshea. 2001. Evaluation of solvent-extracted
canola meal for growing pigs and lactating sows. Aust. J. Agric. Res. 52:1033-1041.
Landero, J. L., E. Beltranena, M. Cervantes, A. Morales, and R. T. Zijlstra. 2011. The effect of
feeding solvent-extracted canola meal on growth performance and diet nutrient
digestibility in weaned pigs. Anim. Feed Sci. Technol. 170:136-140.
Leeson, S., J. O. Atteh, and J. D. Summers. 1987. The replacement value of canola meal for
soybean meal in poultry diets. Can. J. Anim. Sci. 67:151-158.
Mullan, B. P., J. R. Pluske, J. Allen, and D. J. Harris. 2000. Evaluation of Western Australian
canola meal for growing pigs. Aust. J. Agric. Res. 51:547-553.
NRC. 2012. Nutrient requirements of swine. 11th
rev. ed. Natl. Acad. Press, Washington, DC.
Rahman, M. H., M Joersbo, and M. H. Poulsen. 2001. Development of yellow-seeded Brassica
napus of double low quality. Plant Breeding. 120:473-478.
Rundgren, M. 1983. Low-glucosinolate rapeseed products for pigs – a review. Anim. Feed Sci.
Technol. 9:239-262.
74
Sanjayan, N. 2013. The effect of feeding canola meal on nutrient digestibility and growth
performance in pigs. MS Thesis. Univ. of Manitoba, Winnipeg.
Schöne, F., B. Rudolph, U. Kirchheim, and G. Knapp. 1997. Counteracting the negative effects
of rapeseed and rapeseed press cake in pig diets. Br. J. Nutr. 78:947-962.
Seneviratne, R. W., E. Beltranena, L. A. Goonewardene, and R. T. Zijlstra. 2011. Effect of crude
glycerol combined with solvent-extracted or expeller-pressed canola meal on growth
performance and diet nutrient digestibility of weaned pigs. Anim. Feed Sci. Technol.
170:105-110.
Sihombing, D. T. H., G. L. Cromwell, and V. W. Hays. 1974. Effects of protein source,
goitrogens and iodine level on performance and thyroid status of pigs. J. Anim. Sci.
39:1106-1112.
Simbaya, J., B. A. Slominski, G. Rakow, L. D. Campbell, R. K. Downey, and J. M. Bell. 1995.
Quality characteristics of yellow-seeded Brassica seed meals: protein, carbohydrates, and
dietary fiber components. J. Agric. Food Chem. 43:2062-2066.
Slinger, S. J. 1977. Improving the nutritional properties of rapeseed. J. Am. Oil Chemists’ Soc.
54:94A-99A.
Slominski, B. A., L. D. Campbell, and W. Guenter. 1994. Carbohydrates and dietary fiber
components of yellow- and brown-seeded canola. J. Agric. Food Chem. 42:704-707.
Slominski, B. A., W. Jia, A. Rogiewicz, C. M. Nyachoti, and D. Hickling. 2012. Low-fiber
canola. Part 1. Chemical and nutritive composition of the meal. J. Agric. Food Chem.
60:12225-12230.
Stein, H. H., O. Adeola, G. L. Cromwell, S. W. Kim, D. C. Mahan, and P. S. Miller. 2011.
Concentration of dietary calcium supplied by calcium carbonate does not affect the
75
apparent total tract digestibility of calcium, but decreases digestibility of phosphorus by
growing pigs. J. Anim. Sci. 89:2139-2144.
Thomke, S., K. Elwinger, M. Rundgren, and B. Ahlström. 1983. Rapeseed meal of Swedish low-
glucosinolate type fed to broiler chickens, laying hens and growing-finishing pigs. Acta
Agric. Scand. 33:75-96.
Trindade Neto, M. A., F. O. Opepaju, B. A. Slominski, and C. M. Nyachoti. 2012. Ileal amino
acid digestibility in canola meals from yellow- and black-seeded Brassica napus and
Brassica juncea fed to growing pigs. J. Anim. Sci. 90:3477-3484.
Underwood, E. J. 1977. Iodine. In: Trace elements in human and animal nutrition. 4th
Ed.
Academic Press, New York. p 271-301.
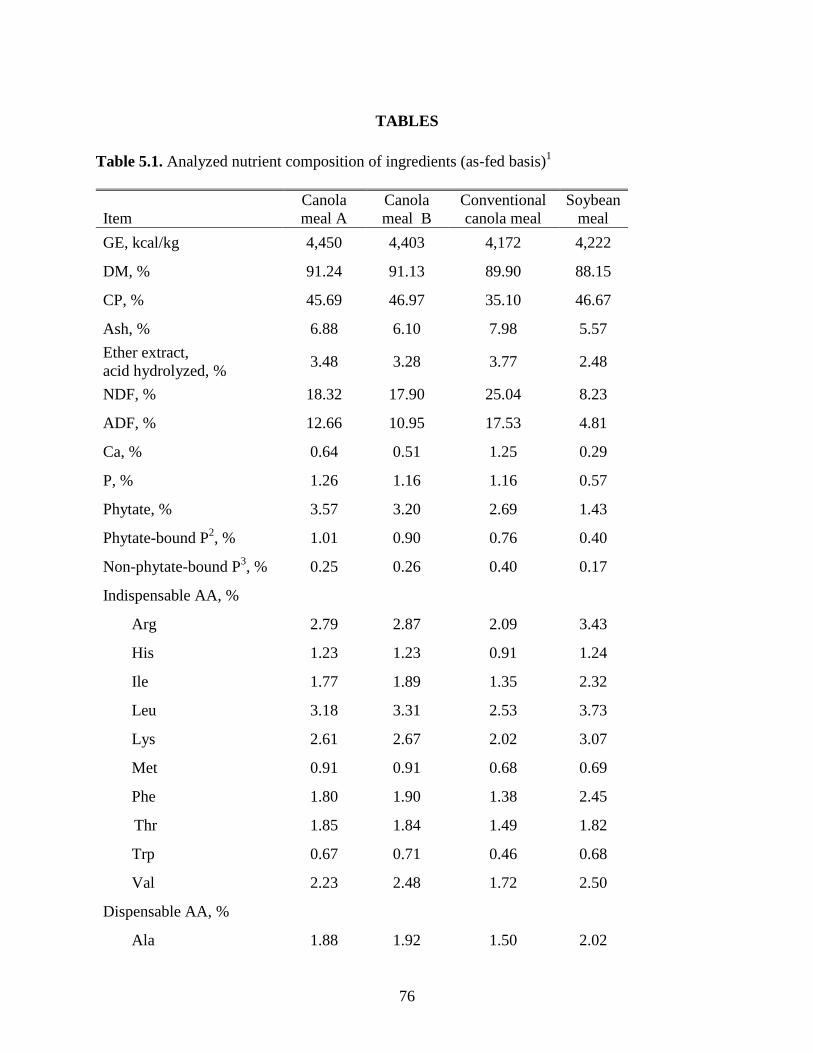
76
TABLES
Table 5.1. Analyzed nutrient composition of ingredients (as-fed basis)1
Item
Canola
meal A
Canola
meal B
Conventional
canola meal
Soybean
meal
GE, kcal/kg 4,450 4,403 4,172 4,222
DM, % 91.24 91.13 89.90 88.15
CP, % 45.69 46.97 35.10 46.67
Ash, % 6.88 6.10 7.98 5.57
Ether extract,
acid hydrolyzed, % 3.48 3.28 3.77 2.48
NDF, % 18.32 17.90 25.04 8.23
ADF, % 12.66 10.95 17.53 4.81
Ca, % 0.64 0.51 1.25 0.29
P, % 1.26 1.16 1.16 0.57
Phytate, % 3.57 3.20 2.69 1.43
Phytate-bound P2, % 1.01 0.90 0.76 0.40
Non-phytate-bound P3, % 0.25 0.26 0.40 0.17
Indispensable AA, %
Arg 2.79 2.87 2.09 3.43
His 1.23 1.23 0.91 1.24
Ile 1.77 1.89 1.35 2.32
Leu 3.18 3.31 2.53 3.73
Lys 2.61 2.67 2.02 3.07
Met 0.91 0.91 0.68 0.69
Phe 1.80 1.90 1.38 2.45
Thr 1.85 1.84 1.49 1.82
Trp 0.67 0.71 0.46 0.68
Val 2.23 2.48 1.72 2.50
Dispensable AA, %
Ala 1.88 1.92 1.50 2.02
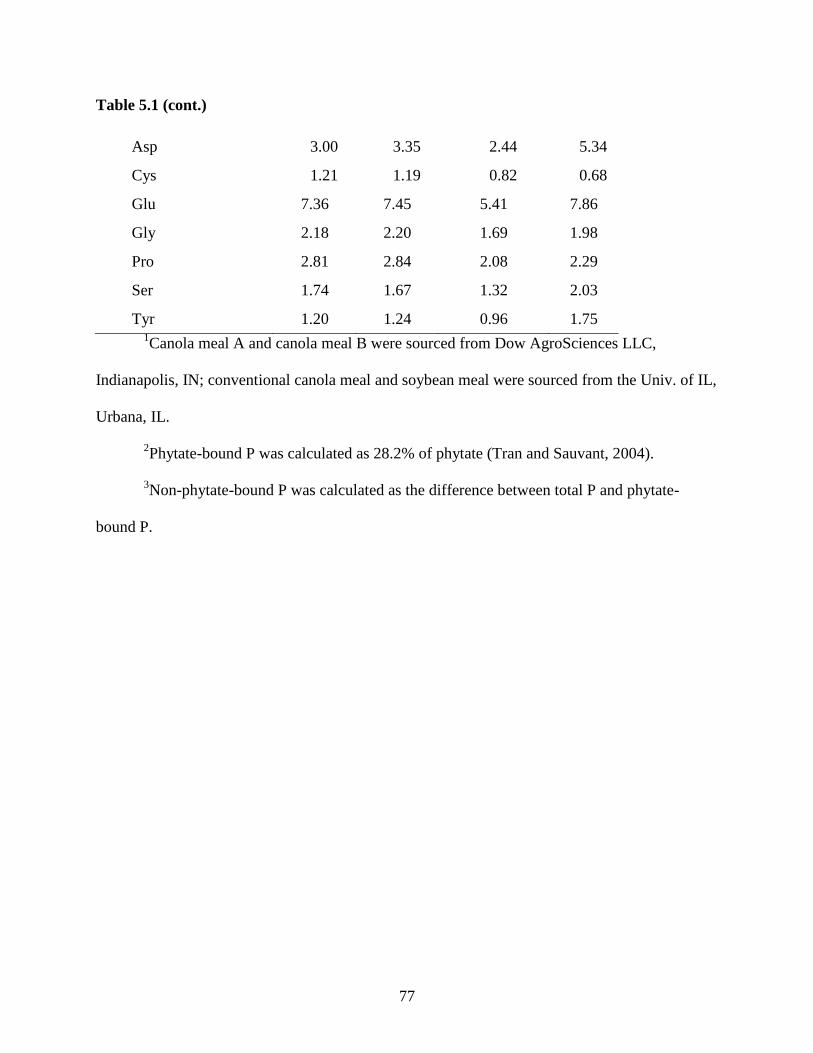
77
Table 5.1 (cont.)
Asp 3.00 3.35 2.44 5.34
Cys 1.21 1.19 0.82 0.68
Glu 7.36 7.45 5.41 7.86
Gly 2.18 2.20 1.69 1.98
Pro 2.81 2.84 2.08 2.29
Ser 1.74 1.67 1.32 2.03
Tyr 1.20 1.24 0.96 1.75
1Canola meal A and canola meal B were sourced from Dow AgroSciences LLC,
Indianapolis, IN; conventional canola meal and soybean meal were sourced from the Univ. of IL,
Urbana, IL.
2Phytate-bound P was calculated as 28.2% of phytate (Tran and Sauvant, 2004).
3Non-phytate-bound P was calculated as the difference between total P and phytate-
bound P.
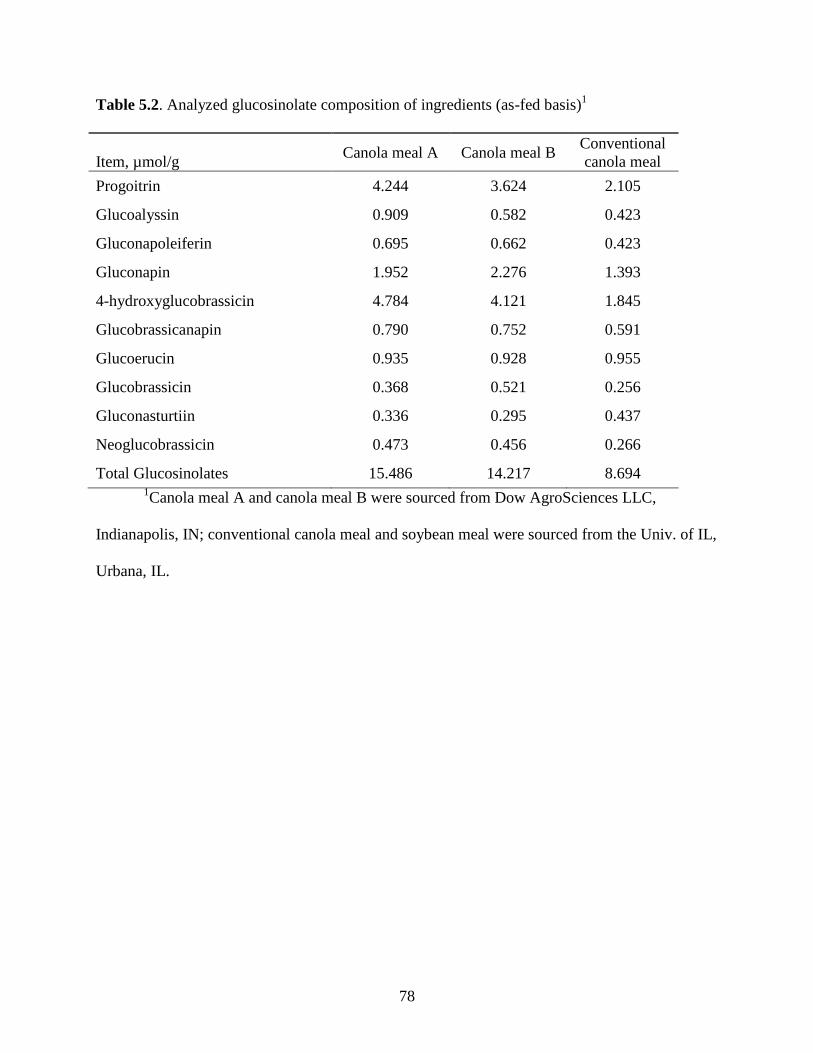
78
Table 5.2. Analyzed glucosinolate composition of ingredients (as-fed basis)1
Item, µmol/g Canola meal A Canola meal B
Conventional
canola meal
Progoitrin 4.244 3.624 2.105
Glucoalyssin 0.909 0.582 0.423
Gluconapoleiferin 0.695 0.662 0.423
Gluconapin 1.952 2.276 1.393
4-hydroxyglucobrassicin 4.784 4.121 1.845
Glucobrassicanapin 0.790 0.752 0.591
Glucoerucin 0.935 0.928 0.955
Glucobrassicin 0.368 0.521 0.256
Gluconasturtiin 0.336 0.295 0.437
Neoglucobrassicin 0.473 0.456 0.266
Total Glucosinolates 15.486 14.217 8.694 1Canola meal A and canola meal B were sourced from Dow AgroSciences LLC,
Indianapolis, IN; conventional canola meal and soybean meal were sourced from the Univ. of IL,
Urbana, IL.
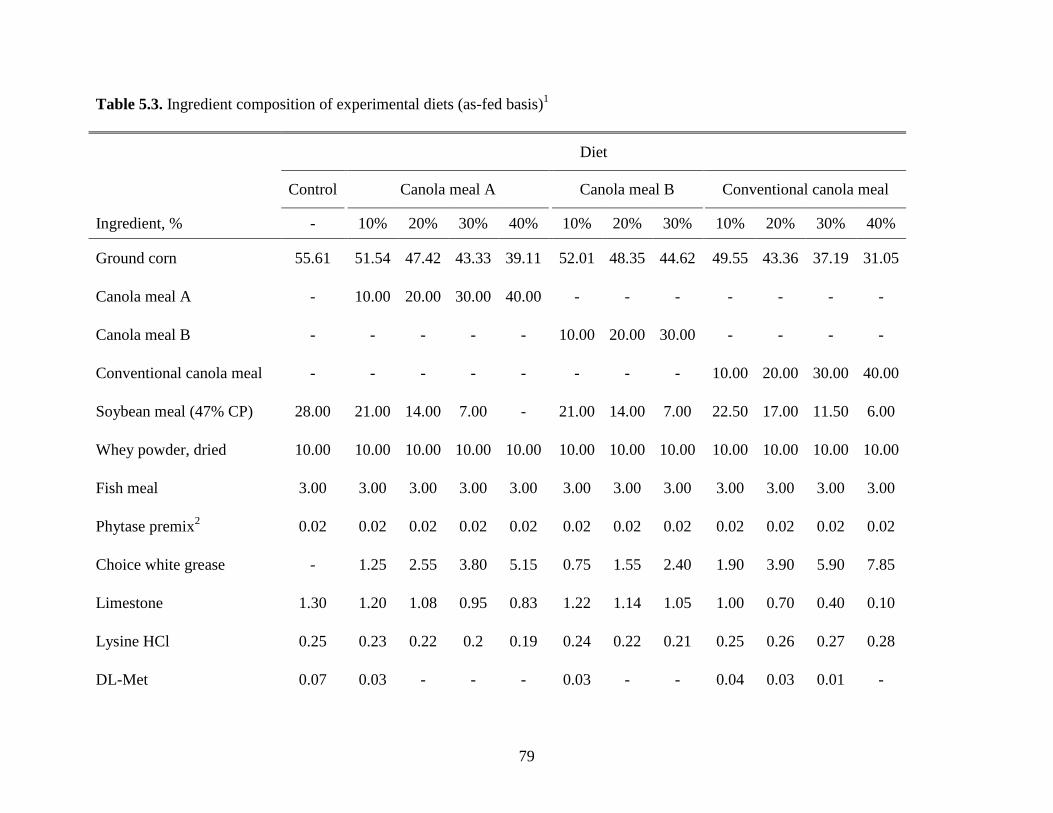
79
Table 5.3. Ingredient composition of experimental diets (as-fed basis)1
Diet
Control
Canola meal A
Canola meal B
Conventional canola meal
Ingredient, % - 10% 20% 30% 40% 10% 20% 30% 10% 20% 30% 40%
Ground corn 55.61
51.54 47.42 43.33 39.11
52.01 48.35 44.62
49.55 43.36 37.19 31.05
Canola meal A -
10.00 20.00 30.00 40.00
- - -
- - - -
Canola meal B -
- - - -
10.00 20.00 30.00
- - - -
Conventional canola meal -
- - - -
- - -
10.00 20.00 30.00 40.00
Soybean meal (47% CP) 28.00
21.00 14.00 7.00 -
21.00 14.00 7.00
22.50 17.00 11.50 6.00
Whey powder, dried 10.00
10.00 10.00 10.00 10.00
10.00 10.00 10.00
10.00 10.00 10.00 10.00
Fish meal 3.00
3.00 3.00 3.00 3.00
3.00 3.00 3.00
3.00 3.00 3.00 3.00
Phytase premix2
0.02
0.02 0.02 0.02 0.02
0.02 0.02 0.02
0.02 0.02 0.02 0.02
Choice white grease
-
1.25 2.55 3.80 5.15
0.75 1.55 2.40
1.90 3.90 5.90 7.85
Limestone 1.30
1.20 1.08 0.95 0.83
1.22 1.14 1.05
1.00 0.70 0.40 0.10
Lysine HCl 0.25
0.23 0.22 0.2 0.19
0.24 0.22 0.21
0.25 0.26 0.27 0.28
DL-Met 0.07
0.03 - - -
0.03 - -
0.04 0.03 0.01 -
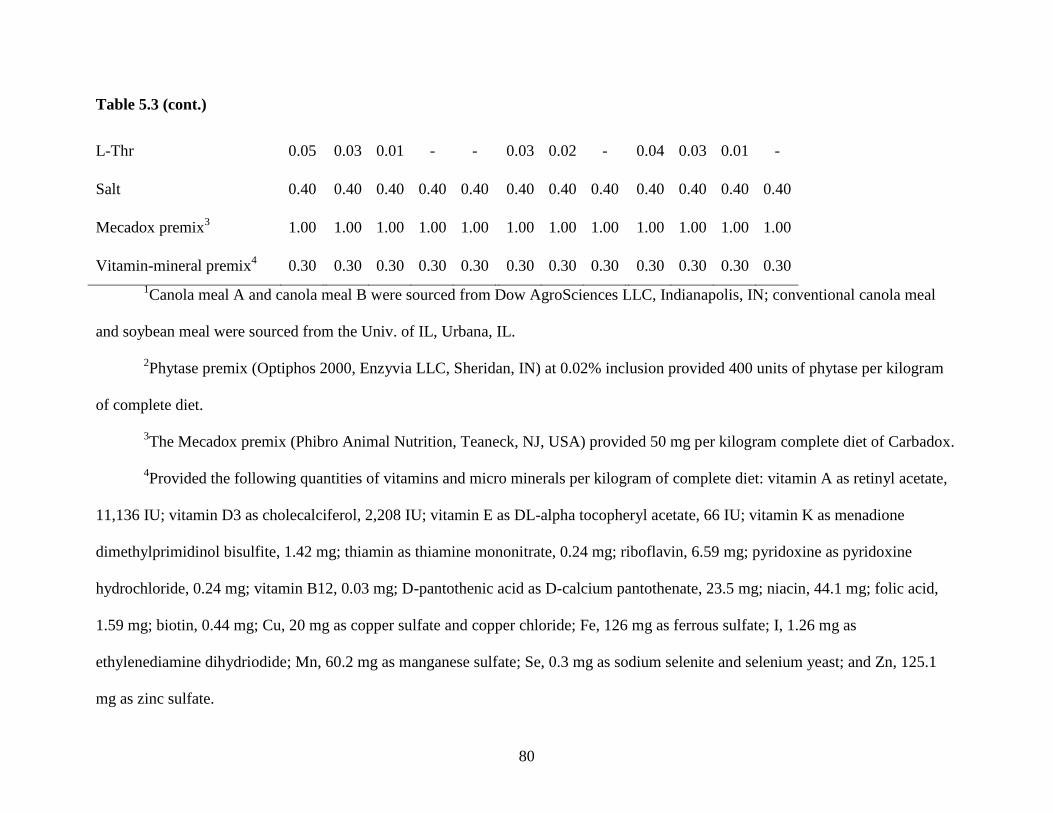
80
Table 5.3 (cont.)
L-Thr 0.05
0.03 0.01 - -
0.03 0.02 -
0.04 0.03 0.01 -
Salt 0.40
0.40 0.40 0.40 0.40
0.40 0.40 0.40
0.40 0.40 0.40 0.40
Mecadox premix3
1.00
1.00 1.00 1.00 1.00
1.00 1.00 1.00
1.00 1.00 1.00 1.00
Vitamin-mineral premix4
0.30
0.30 0.30 0.30 0.30
0.30 0.30 0.30
0.30 0.30 0.30 0.30
1Canola meal A and canola meal B were sourced from Dow AgroSciences LLC, Indianapolis, IN; conventional canola meal
and soybean meal were sourced from the Univ. of IL, Urbana, IL.
2Phytase premix (Optiphos 2000, Enzyvia LLC, Sheridan, IN) at 0.02% inclusion provided 400 units of phytase per kilogram
of complete diet.
3The Mecadox premix (Phibro Animal Nutrition, Teaneck, NJ, USA) provided 50 mg per kilogram complete diet of Carbadox.
4Provided the following quantities of vitamins and micro minerals per kilogram of complete diet: vitamin A as retinyl acetate,
11,136 IU; vitamin D3 as cholecalciferol, 2,208 IU; vitamin E as DL-alpha tocopheryl acetate, 66 IU; vitamin K as menadione
dimethylprimidinol bisulfite, 1.42 mg; thiamin as thiamine mononitrate, 0.24 mg; riboflavin, 6.59 mg; pyridoxine as pyridoxine
hydrochloride, 0.24 mg; vitamin B12, 0.03 mg; D-pantothenic acid as D-calcium pantothenate, 23.5 mg; niacin, 44.1 mg; folic acid,
1.59 mg; biotin, 0.44 mg; Cu, 20 mg as copper sulfate and copper chloride; Fe, 126 mg as ferrous sulfate; I, 1.26 mg as
ethylenediamine dihydriodide; Mn, 60.2 mg as manganese sulfate; Se, 0.3 mg as sodium selenite and selenium yeast; and Zn, 125.1
mg as zinc sulfate.
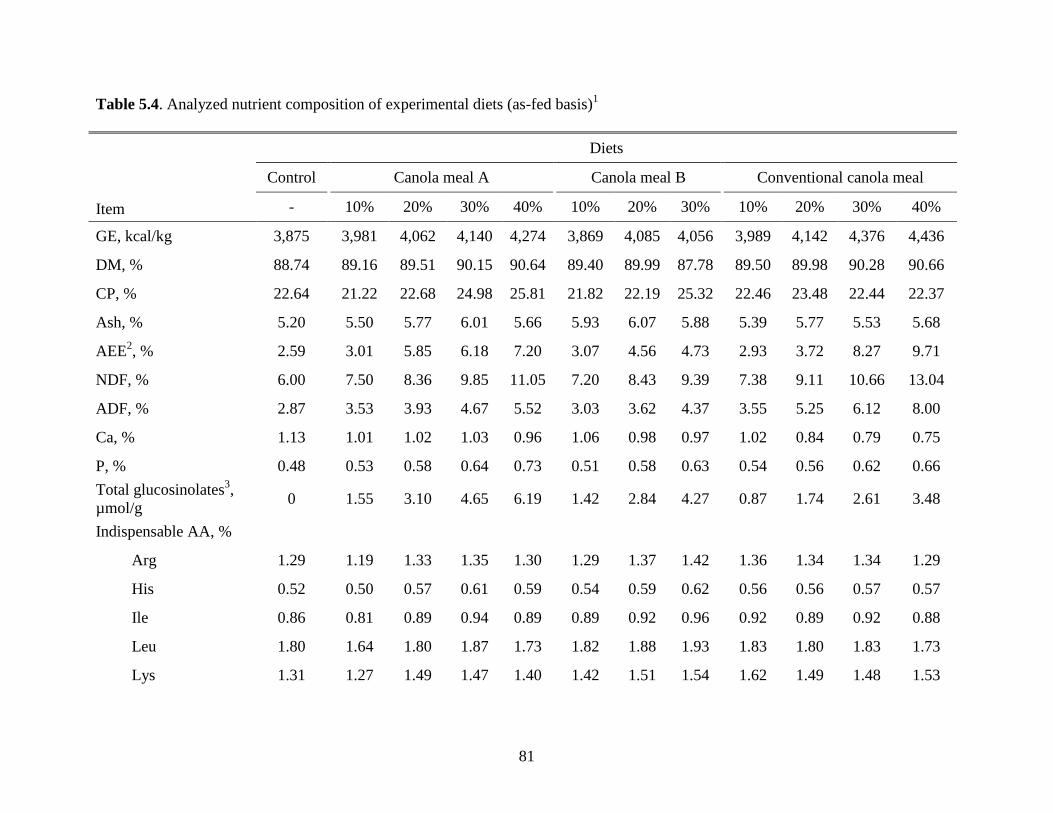
81
Table 5.4. Analyzed nutrient composition of experimental diets (as-fed basis)1
Diets
Item
Control Canola meal A Canola meal B Conventional canola meal
- 10% 20% 30% 40% 10% 20% 30% 10% 20% 30% 40%
GE, kcal/kg 3,875 3,981 4,062 4,140 4,274 3,869 4,085 4,056 3,989 4,142 4,376 4,436
DM, % 88.74 89.16 89.51 90.15 90.64 89.40 89.99 87.78 89.50 89.98 90.28 90.66
CP, % 22.64 21.22 22.68 24.98 25.81 21.82 22.19 25.32 22.46 23.48 22.44 22.37
Ash, % 5.20 5.50 5.77 6.01 5.66 5.93 6.07 5.88 5.39 5.77 5.53 5.68
AEE2, % 2.59 3.01 5.85 6.18 7.20 3.07 4.56 4.73 2.93 3.72 8.27 9.71
NDF, % 6.00 7.50 8.36 9.85 11.05 7.20 8.43 9.39 7.38 9.11 10.66 13.04
ADF, % 2.87 3.53 3.93 4.67 5.52 3.03 3.62 4.37 3.55 5.25 6.12 8.00
Ca, % 1.13 1.01 1.02 1.03 0.96 1.06 0.98 0.97 1.02 0.84 0.79 0.75
P, % 0.48 0.53 0.58 0.64 0.73 0.51 0.58 0.63 0.54 0.56 0.62 0.66
Total glucosinolates3,
µmol/g 0 1.55 3.10 4.65 6.19 1.42 2.84 4.27 0.87 1.74 2.61 3.48
Indispensable AA, %
Arg 1.29 1.19 1.33 1.35 1.30 1.29 1.37 1.42 1.36 1.34 1.34 1.29
His 0.52 0.50 0.57 0.61 0.59 0.54 0.59 0.62 0.56 0.56 0.57 0.57
Ile 0.86 0.81 0.89 0.94 0.89 0.89 0.92 0.96 0.92 0.89 0.92 0.88
Leu 1.80 1.64 1.80 1.87 1.73 1.82 1.88 1.93 1.83 1.80 1.83 1.73
Lys 1.31 1.27 1.49 1.47 1.40 1.42 1.51 1.54 1.62 1.49 1.48 1.53
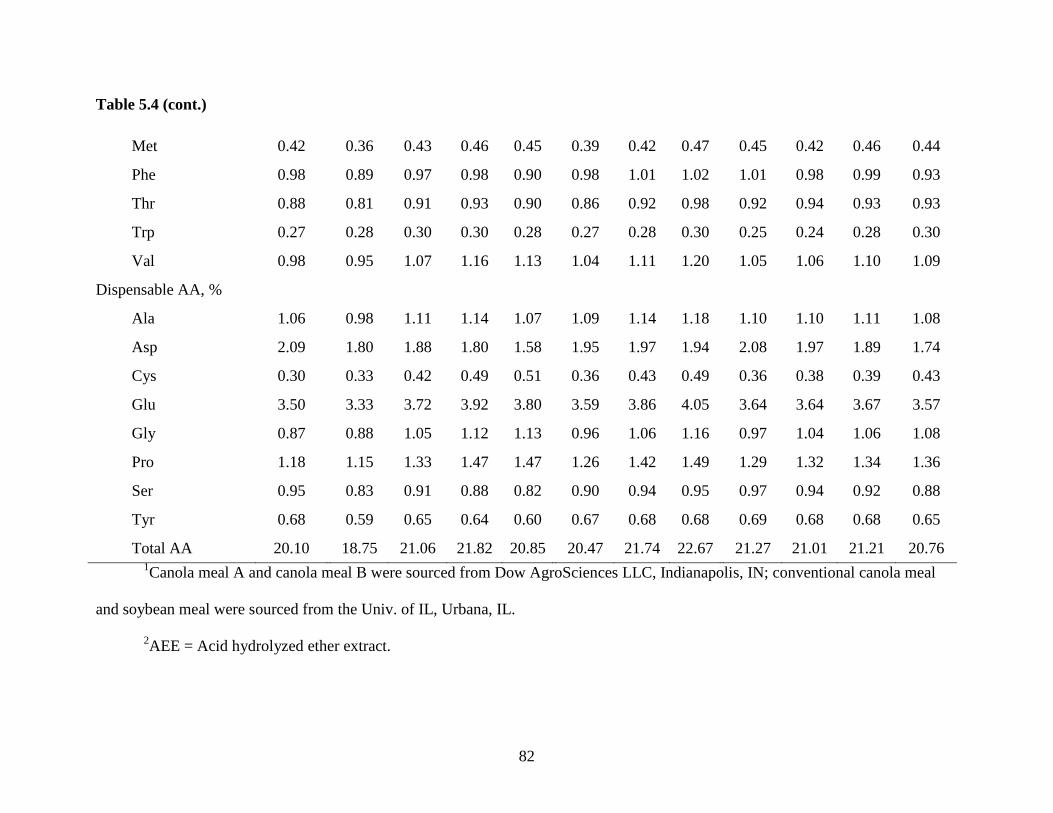
82
Table 5.4 (cont.)
Met 0.42 0.36 0.43 0.46 0.45 0.39 0.42 0.47 0.45 0.42 0.46 0.44
Phe 0.98 0.89 0.97 0.98 0.90 0.98 1.01 1.02 1.01 0.98 0.99 0.93
Thr 0.88 0.81 0.91 0.93 0.90 0.86 0.92 0.98 0.92 0.94 0.93 0.93
Trp 0.27 0.28 0.30 0.30 0.28 0.27 0.28 0.30 0.25 0.24 0.28 0.30
Val 0.98 0.95 1.07 1.16 1.13 1.04 1.11 1.20 1.05 1.06 1.10 1.09
Dispensable AA, %
Ala 1.06 0.98 1.11 1.14 1.07 1.09 1.14 1.18 1.10 1.10 1.11 1.08
Asp 2.09 1.80 1.88 1.80 1.58 1.95 1.97 1.94 2.08 1.97 1.89 1.74
Cys 0.30 0.33 0.42 0.49 0.51 0.36 0.43 0.49 0.36 0.38 0.39 0.43
Glu 3.50 3.33 3.72 3.92 3.80 3.59 3.86 4.05 3.64 3.64 3.67 3.57
Gly 0.87 0.88 1.05 1.12 1.13 0.96 1.06 1.16 0.97 1.04 1.06 1.08
Pro 1.18 1.15 1.33 1.47 1.47 1.26 1.42 1.49 1.29 1.32 1.34 1.36
Ser 0.95 0.83 0.91 0.88 0.82 0.90 0.94 0.95 0.97 0.94 0.92 0.88
Tyr 0.68 0.59 0.65 0.64 0.60 0.67 0.68 0.68 0.69 0.68 0.68 0.65
Total AA 20.10 18.75 21.06 21.82 20.85 20.47 21.74 22.67 21.27 21.01 21.21 20.76 1Canola meal A and canola meal B were sourced from Dow AgroSciences LLC, Indianapolis, IN; conventional canola meal
and soybean meal were sourced from the Univ. of IL, Urbana, IL.
2AEE = Acid hydrolyzed ether extract.
83
3Values for total glucosinolates were calculated rather than analyzed by multiplying the analyzed value in each source of
canola meal by the inclusion of that canola meal in the diet. It was assumed corn and soybean meal contained no glucosinolates.
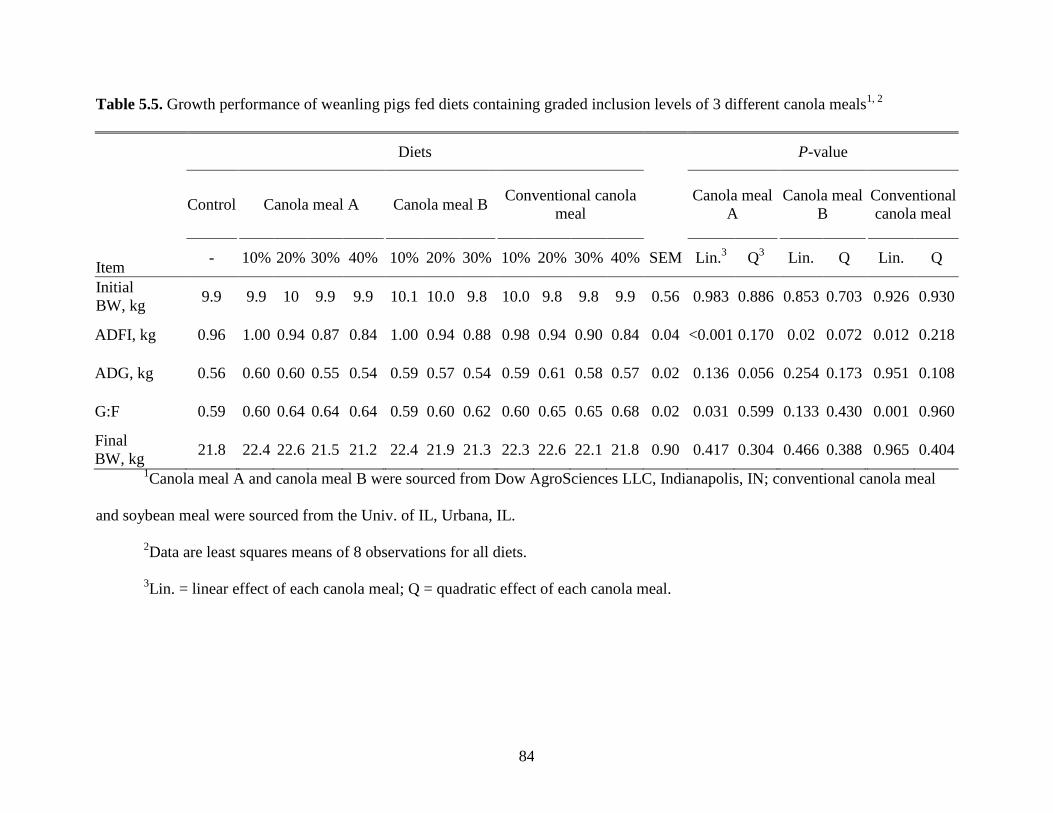
84
Table 5.5. Growth performance of weanling pigs fed diets containing graded inclusion levels of 3 different canola meals1, 2
Diets P-value
Control
Canola meal A
Canola meal B
Conventional canola
meal
Canola meal
A
Canola meal
B
Conventional
canola meal
Item -
10% 20% 30% 40%
10% 20% 30%
10% 20% 30% 40% SEM Lin.
3 Q
3 Lin. Q
Lin. Q
Initial
BW, kg 9.9
9.9 10 9.9 9.9
10.1 10.0 9.8 10.0 9.8 9.8 9.9 0.56 0.983 0.886
0.853 0.703
0.926 0.930
ADFI, kg 0.96 1.00 0.94 0.87 0.84
1.00 0.94 0.88 0.98 0.94 0.90 0.84 0.04 <0.001 0.170
0.02 0.072
0.012 0.218
ADG, kg 0.56 0.60 0.60 0.55 0.54
0.59 0.57 0.54 0.59 0.61 0.58 0.57 0.02 0.136 0.056
0.254 0.173
0.951 0.108
G:F 0.59 0.60 0.64 0.64 0.64
0.59 0.60 0.62 0.60 0.65 0.65 0.68 0.02 0.031 0.599
0.133 0.430
0.001 0.960
Final
BW, kg 21.8
22.4 22.6 21.5 21.2
22.4 21.9 21.3 22.3 22.6 22.1 21.8 0.90 0.417 0.304
0.466 0.388
0.965 0.404
1Canola meal A and canola meal B were sourced from Dow AgroSciences LLC, Indianapolis, IN; conventional canola meal
and soybean meal were sourced from the Univ. of IL, Urbana, IL.
2Data are least squares means of 8 observations for all diets.
3Lin. = linear effect of each canola meal; Q = quadratic effect of each canola meal.
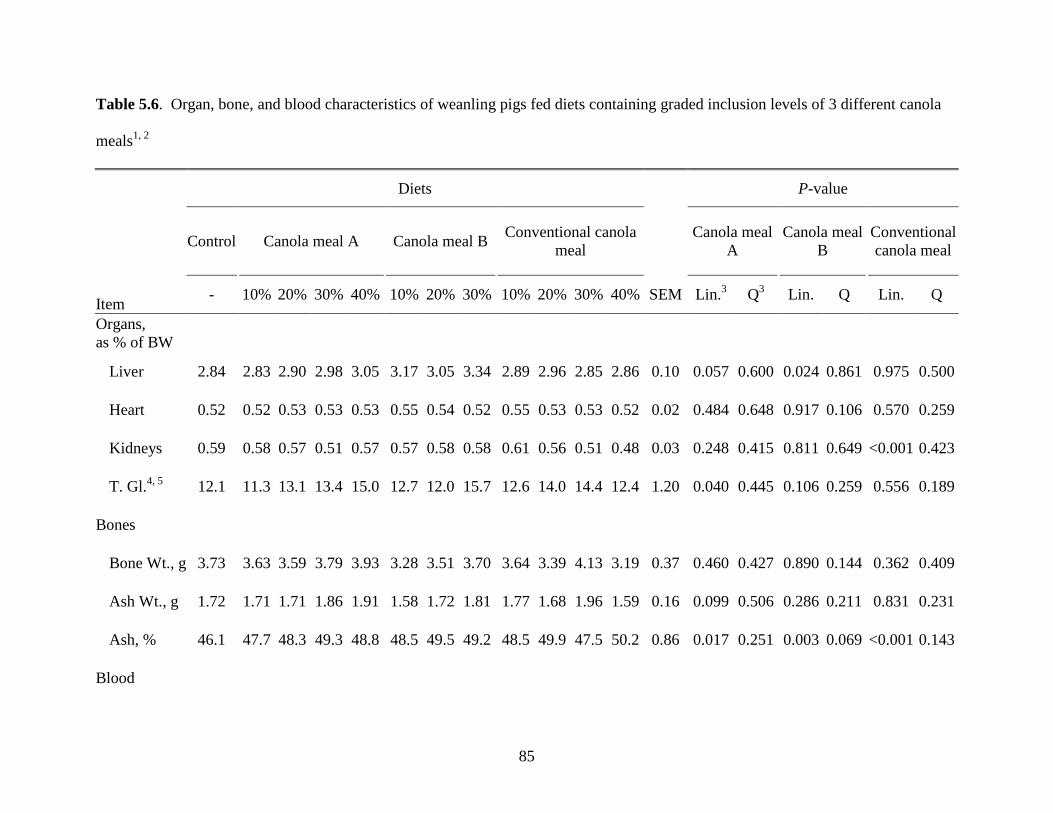
85
Table 5.6. Organ, bone, and blood characteristics of weanling pigs fed diets containing graded inclusion levels of 3 different canola
meals1, 2
Diets P-value
Control
Canola meal A
Canola meal B
Conventional canola
meal
Canola meal
A
Canola meal
B
Conventional
canola meal
Item -
10% 20% 30% 40%
10% 20% 30%
10% 20% 30% 40% SEM Lin.
3 Q
3 Lin. Q
Lin. Q
Organs,
as % of BW
Liver 2.84 2.83 2.90 2.98 3.05
3.17 3.05 3.34
2.89 2.96 2.85 2.86 0.10 0.057 0.600
0.024 0.861
0.975 0.500
Heart 0.52 0.52 0.53 0.53 0.53
0.55 0.54 0.52
0.55 0.53 0.53 0.52 0.02 0.484 0.648
0.917 0.106
0.570 0.259
Kidneys
0.59 0.58 0.57 0.51 0.57
0.57 0.58 0.58
0.61 0.56 0.51 0.48 0.03 0.248 0.415
0.811 0.649
<0.001 0.423
T. Gl.4, 5
12.1 11.3 13.1 13.4 15.0
12.7 12.0 15.7
12.6 14.0 14.4 12.4 1.20 0.040 0.445
0.106 0.259
0.556 0.189
Bones
Bone Wt., g 3.73 3.63 3.59 3.79 3.93
3.28 3.51 3.70
3.64 3.39 4.13 3.19 0.37 0.460 0.427
0.890 0.144
0.362 0.409
Ash Wt., g 1.72 1.71 1.71 1.86 1.91
1.58 1.72 1.81
1.77 1.68 1.96 1.59 0.16 0.099 0.506
0.286 0.211
0.831 0.231
Ash, % 46.1 47.7 48.3 49.3 48.8
48.5 49.5 49.2
48.5 49.9 47.5 50.2 0.86 0.017 0.251
0.003 0.069
<0.001 0.143
Blood
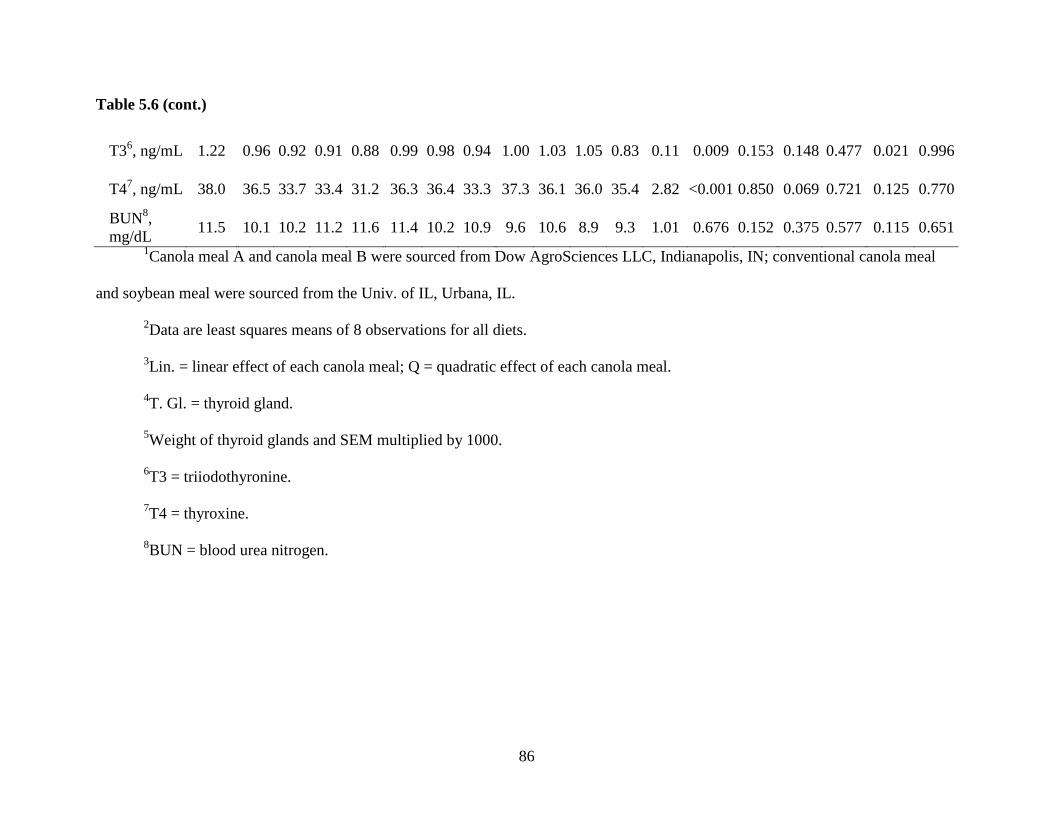
86
Table 5.6 (cont.)
T36, ng/mL 1.22
0.96 0.92 0.91 0.88
0.99 0.98 0.94
1.00 1.03 1.05 0.83 0.11 0.009 0.153
0.148 0.477
0.021 0.996
T47, ng/mL 38.0
36.5 33.7 33.4 31.2
36.3 36.4 33.3
37.3 36.1 36.0 35.4 2.82 <0.001 0.850
0.069 0.721
0.125 0.770
BUN8,
mg/dL 11.5
10.1 10.2 11.2 11.6
11.4 10.2 10.9
9.6 10.6 8.9 9.3 1.01 0.676 0.152
0.375 0.577
0.115 0.651
1Canola meal A and canola meal B were sourced from Dow AgroSciences LLC, Indianapolis, IN; conventional canola meal
and soybean meal were sourced from the Univ. of IL, Urbana, IL.
2Data are least squares means of 8 observations for all diets.
3Lin. = linear effect of each canola meal; Q = quadratic effect of each canola meal.
4T. Gl. = thyroid gland.
5Weight of thyroid glands and SEM multiplied by 1000.
6T3 = triiodothyronine.
7T4 = thyroxine.
8BUN = blood urea nitrogen.
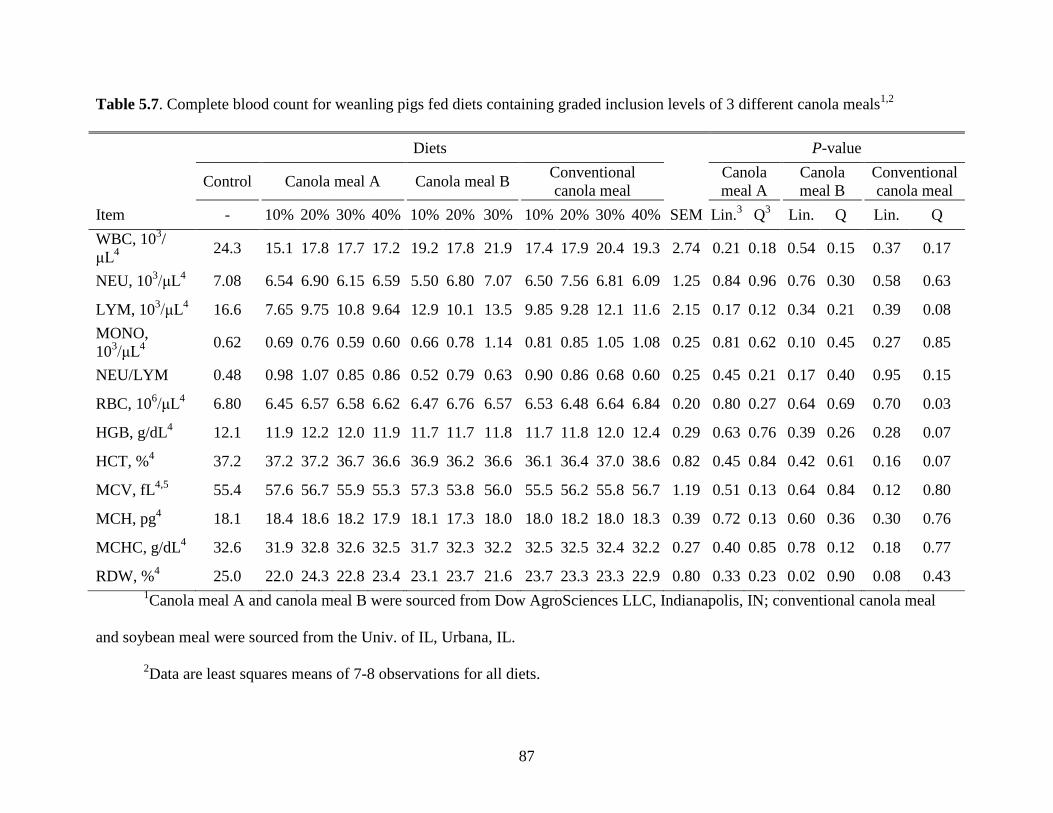
87
Table 5.7. Complete blood count for weanling pigs fed diets containing graded inclusion levels of 3 different canola meals1,2
Diets P-value
Control Canola meal A Canola meal B Conventional
canola meal
Canola
meal A
Canola
meal B
Conventional
canola meal
Item - 10% 20% 30% 40% 10% 20% 30% 10% 20% 30% 40% SEM Lin.3
Q3 Lin. Q Lin. Q
WBC, 103/
μL4
24.3 15.1 17.8 17.7 17.2 19.2 17.8 21.9 17.4 17.9 20.4 19.3 2.74 0.21 0.18 0.54 0.15 0.37 0.17
NEU, 103/μL
4 7.08 6.54 6.90 6.15 6.59 5.50 6.80 7.07 6.50 7.56 6.81 6.09 1.25 0.84 0.96 0.76 0.30 0.58 0.63
LYM, 103/μL
4 16.6 7.65 9.75 10.8 9.64 12.9 10.1 13.5 9.85 9.28 12.1 11.6 2.15 0.17 0.12 0.34 0.21 0.39 0.08
MONO,
103/μL
4
0.62 0.69 0.76 0.59 0.60 0.66 0.78 1.14 0.81 0.85 1.05 1.08 0.25 0.81 0.62 0.10 0.45 0.27 0.85
NEU/LYM 0.48 0.98 1.07 0.85 0.86 0.52 0.79 0.63 0.90 0.86 0.68 0.60 0.25 0.45 0.21 0.17 0.40 0.95 0.15
RBC, 106/μL
4 6.80 6.45 6.57 6.58 6.62 6.47 6.76 6.57 6.53 6.48 6.64 6.84 0.20 0.80 0.27 0.64 0.69 0.70 0.03
HGB, g/dL4 12.1 11.9 12.2 12.0 11.9 11.7 11.7 11.8 11.7 11.8 12.0 12.4 0.29 0.63 0.76 0.39 0.26 0.28 0.07
HCT, %4 37.2 37.2 37.2 36.7 36.6 36.9 36.2 36.6 36.1 36.4 37.0 38.6 0.82 0.45 0.84 0.42 0.61 0.16 0.07
MCV, fL4,5
55.4 57.6 56.7 55.9 55.3 57.3 53.8 56.0 55.5 56.2 55.8 56.7 1.19 0.51 0.13 0.64 0.84 0.12 0.80
MCH, pg4 18.1 18.4 18.6 18.2 17.9 18.1 17.3 18.0 18.0 18.2 18.0 18.3 0.39 0.72 0.13 0.60 0.36 0.30 0.76
MCHC, g/dL4 32.6 31.9 32.8 32.6 32.5 31.7 32.3 32.2 32.5 32.5 32.4 32.2 0.27 0.40 0.85 0.78 0.12 0.18 0.77
RDW, %4 25.0 22.0 24.3 22.8 23.4 23.1 23.7 21.6 23.7 23.3 23.3 22.9 0.80 0.33 0.23 0.02 0.90 0.08 0.43
1Canola meal A and canola meal B were sourced from Dow AgroSciences LLC, Indianapolis, IN; conventional canola meal
and soybean meal were sourced from the Univ. of IL, Urbana, IL.
2Data are least squares means of 7-8 observations for all diets.
88
3Lin. = linear effect of each canola meal; Q = quadratic effect of each canola meal.
4WBC = white blood cell; NEU = neutrophil; LYM = lymphocyte; MONO = monocyte; RBC = red blood cell; HGB =
hemoglobin; HCT = packed cell volume; MCV = mean corpuscular volume; MCH = mean corpuscular hemoglobin; MCHC = mean
corpuscular hemoglobin concentration; RDW = red cell distribution width.
5fL= femtolitre (10
-15 L).
89
CHAPTER 6
CONCLUSIONS
This research focused on the effects of feeding either of 2 high-protein CM to chicks and
pigs compared to conventional CM and SBM. High-protein CM contains more CP and less fiber
than conventional CM, indicating improved feeding value for swine and poultry. The intent of
the experiments included in this thesis was to test that hypothesis by determining the P
bioavailability and P digestibility of the high-protein CM, determining the effect of phytase on
those measures, and determining the maximum inclusion levels in diets for pigs without reducing
performance.
From the first experiment, conducted with chicks, it was concluded that P bioavailability
was numerically greater in the high-protein canola meals and, thus, bioavailable P concentration
was numerically greater in those meals as well. It was also concluded that inclusion of microbial
phytase in diets can further increase the P bioavailability in high-protein canola meal. These
results indicate better utilization of P in high-protein canola meals, allowing for less dietary P
inclusion and reduced P excretion.
From the second experiment, conducted with pigs, it was concluded that there was no
difference in apparent total tract digestibility (ATTD) of Ca or P or standardized total tract
digestibility (STTD) of P between high-protein canola meals and conventional canola meal.
However, it was also concluded that addition of microbial phytase to diets containing high-
protein or conventional canola meal increased ATTD of Ca and P and STTD of P.
From the third experiment, utilizing weanling pigs, it was concluded that high-protein or
conventional canola meals can be included in diets for weanling pigs at a minimum of 20%
without reducing growth performance or negatively affecting organ, bone, or blood
90
characteristics. However, greater inclusions may result in reduced growth performance due to
reduced feed intake.
Results of these experiments suggest that further breeding and selection for high-protein
canola meals with reduced fiber and other anti-nutritional factors may result in improved
performance and increased dietary inclusion levels compared with conventional canola meal.