Embed Size (px)
Citation preview
Final Report Prepared for Missouri Department of Transportation May 2018 Project TR201722 Report cmr18-007
Evaluation of Green Lights on TMAs
Prepared by:
Henry Brown, P. E. Carlos Sun, Ph. D., P. E., J. D. Praveen Edara, Ph. D., P.E., P.T.O.E. Siyang Zhang Zhu Qing University of Missouri-Columbia
Technical Report Documentation Page
1. Report No. 2. Government Accession No. 3. Recipient’s Catalog No.
cmr 18-007
4. Title and Subtitle 5. Report Date
Evaluation of Green Lights on TMAs May 2018
Published: May 2018
6. Performing Organization Code
7. Author(s)
Brown, H., Sun, C. https://orcid.org/0000-0002-8857-9648, Edara, P.
https://orcid.org/0000-0003-2707-642X, Zhang, S., and Qing, Z.
8. Performing Organization Report No.
9. Performing Organization Name and Address 10. Work Unit No. (TRAIS)
University of Missouri
Civil and Environmental Engineering
E2509 Lafferre Hall
Columbia, Missouri 65211
11. Contract or Grant No.
MoDOT project #TR201722
12. Sponsoring Organization Name and Address 13. Type of Report and Period Covered
Missouri Department of Transportation (SPR)
Construction and Materials Division
P.O. Box 270
Jefferson City, Missouri 65102
Final Report (April 2017-June 2018)
14. Sponsoring Agency Code
15. Supplementary Notes
Conducted in cooperation with the U.S. Department of Transportation, Federal Highway Administration. MoDOT research
reports are available in the Innovation Library at http://www.modot.org/services/or/byDate.htm.
16. Abstract
The use of green versus traditional amber lights on Truck Mounted Attenuators (TMAs) was investigated to see if their use could
help to improve safety in mobile work zones. Four light color configurations were evaluated via a combination of simulator and
field study: amber/white, green only, green/white, and green/amber. The TMAs were used as shadow vehicles representing
mobile work zones and were equipped with flashing light bars, an arrow board, and a checkerboard sign with steady light bulbs.
Driver behavior measures, including first blinker distance and speed, merge distance and speed, work zone and arrow direction
recognition distance, and disability glare were captured in simulator tests. Vehicle speeds as they passed TMAs were recorded in
both the simulator and field studies. The simulator study results indicated that the amber/white combination had the highest
visibility of work zone but created the highest level of concern with disability glare. The green only configuration yielded the
least disability glare but also low overall visibility. The study findings implied an inverse relationship between visibility
(awareness of work zone) and arrow board recognition (easy on eyes). The green/amber TMA light configuration performed
roughly between the two aforementioned configurations and was the configuration preferred by the participants in a post
simulator survey. The field study found that the green only TMA slowed drivers down when they passed the mobile work zone,
and lower TMA speeds led to lower vehicle speeds. The results did not point in a single direction for both the simulator and field
tests, and all four configurations appear to be viable.
17. Key Words 18. Distribution Statement
Color; Driver performance; Drivers; Green; Lighting; Truck mounted
attenuators; Work zone safety; Work zone traffic control; Mobile work zone;
Green lights
No restrictions. This document is available
through the National Technical Information
Service, Springfield, VA 22161.
19. Security Classification (of this
report)
20. Security Classification (of this
page)
21. No. of Pages 22. Price
Unclassified. Unclassified. 65
Form DOT F 1700.7 (8-72) Reproduction of completed page authorize

Evaluation of Green Lights on TMAs
_______________________________________
A Final Report
presented to
Missouri Department of Transportation
by the University of Missouri-Columbia
_______________________________________________________
by
Henry Brown, P. E.
Carlos Sun, Ph. D., P. E., J. D.
Praveen Edara, Ph. D., P.E., P.T.O.E.
Siyang Zhang
Zhu Qing
May 2018

1
TABLE OF CONTENTS
TABLE OF CONTENTS .................................................................................................................1 LIST OF FIGURES .........................................................................................................................2 LIST OF TABLES ...........................................................................................................................3
ACKNOWLEDGEMENTS .............................................................................................................5 EXECUTIVE SUMMARY .............................................................................................................6 CHAPTER 1: INTRODUCTION ..................................................................................................15
1.1 TMA Incidents .............................................................................................................15 1.2 Literature review ..........................................................................................................16
1.3 DOT practices ..............................................................................................................17 CHAPTER 2: SIMULATOR TESTS ............................................................................................21
2.1 Introduction of ZouSim driving simulator ...................................................................21
2.2 Simulator Setup ............................................................................................................21 2.3 Simulator trials and MOEs...........................................................................................25
2.3.1 Regular trials .................................................................................................26
2.3.2 Disability glare test .......................................................................................28 2.3.3 Visibility test .................................................................................................29
2.4 Simulator results ..........................................................................................................29 2.4.1 Daytime results .............................................................................................30 2.4.2 Nighttime results ...........................................................................................34
CHAPTER 3: POST-SIMULATOR SURVEY .............................................................................40 3.1 Post-simulator survey methodology ............................................................................40
3.2 Post-simulator survey results .......................................................................................40 3.2.1 Part 1: Daytime evaluation............................................................................40 3.2.2 Part 2: Nighttime evaluation .........................................................................42
3.2.3 Part 3: Simulator fidelity ...............................................................................44
3.2.4 Simulator sickness questionnaire (SSQ) results ...........................................45 3.2.5 Summary of post-simulator survey results ...................................................46
CHAPTER 4: FIELD TEST ..........................................................................................................47
4.1 Field test set up ............................................................................................................47 4.2 Video image processing methodology .........................................................................49
4.3 Field results ..................................................................................................................51 4.4 Luminance measurement .............................................................................................54
4.5 Summary and discussion of field study results ............................................................54 CHAPTER 5: CONCLUSIONS ....................................................................................................56 REFERENCES ..............................................................................................................................57 APPENDICES ...............................................................................................................................58
Appendix A: Post-simulator survey ...................................................................................58
Appendix B: Additional comments from post-simulator survey .......................................62

2
LIST OF FIGURES
Figure ES.1 Example of green only TMA .......................................................................................6 Figure ES.2 TMA configurations in the simulator testing ...............................................................7 Figure 1.3.1 ODOT green light snow-removal truck (ODOT 2013) .............................................20
Figure 2.1.1 TMA experiment using ZouSim (a) Daytime example: green only TMA (b)
Nighttime example: green/amber TMA .............................................................................21 Figure 2.2.1 Mobile work zone layout in simulator tests ..............................................................22 Figure 2.2.2 amber/white scenarios (a) daytime (b) nighttime ......................................................23 Figure 2.2.3 Green only scenarios (a) daytime (b) nighttime ........................................................24
Figure 2.2.4 Green/amber scenarios (a) daytime (b) nighttime .....................................................24 Figure 2.2.5 Green/white scenarios (a) daytime (b) nighttime ......................................................25 Figure 2.3.1 MOE 1 example: first blinker distance (ft.) ...............................................................26
Figure 2.3.2 MOE 2 example: first blinker speed (mph) ...............................................................27 Figure 2.3.3 MOE 3 example: merge distance (ft.) .......................................................................27 Figure 2.3.4 MOE 4 example: merge speed (mph) ........................................................................27
Figure 2.3.5 MOE 5 example: speed when passing shoulder TMA (mph) ...................................28 Figure 2.3.6 MOE 6 example: speed when passing rear advance TMA (mph) .............................28
Figure 2.3.7 MOE 7 example: water bottle recognition ................................................................29 Figure 4.1.1 Route travelled for data collection on US 50 (Google maps 2017) ..........................47 Figure 4.1.2 MoDOT custom-mounted TMA................................................................................48
Figure 4.1.3 Example of LiDAR capturing distance from vehicle to rear advance TMA .............48 Figure 4.2.1 Time stamp one: vehicle entering begin dash line ....................................................50
Figure 4.2.2 Time stamp two: vehicle entering end dash line .......................................................50
3
LIST OF TABLES
Table ES.1 Brief summary of simulator results ...............................................................................8 Table ES.2 Daytime simulator results .............................................................................................9 Table ES.3 Nighttime simulator results .........................................................................................10
Table ES.4 Water bottle recognition ..............................................................................................10 Table ES.5 Summary of post-simulator survey results ..................................................................11 Table ES.6 Preference ranking and light intensity.........................................................................11 Table ES.7 Ratings of features.......................................................................................................12 Table ES.8 Impact of TMA speeds on vehicle passing speeds ......................................................13
Table ES.9 Field study results: green only vs. amber/white ..........................................................13 Table ES.10 Field study results: Day vs. night ..............................................................................13 Table 1.1.1 Reasons for TMA crashes in Missouri .......................................................................16
Table 1.1.2 Mobile work activity when TMAs were struck in Missouri .......................................16 Table 1.3.1 Color usage on emergency and warning vehicles by state .........................................19 Table 2.4.1 Daytime MOE 1: First blinker distance (ft.) ...............................................................31
Table 2.4.2 Daytime MOE 2: First blinker speed (mph) ...............................................................31 Table 2.4.3 Daytime MOE 3: Merge distance (ft.) ........................................................................32
Table 2.4.4 Daytime MOE 4: Merge speed (mph) ........................................................................32 Table 2.4.5 Daytime MOE 5: Speed when passing shoulder TMA (mph) ....................................33 Table 2.4.6 Daytime MOE 6: Speed when passing rear advance TMA (mph) .............................33
Table 2.4.7 Daytime MOE 8: Work zone recognition distance (ft.) ..............................................34 Table 2.4.8 Daytime MOE 9: Arrow direction recognition distance (ft.) ......................................34
Table 2.4.9 Nighttime MOE 1: First blinker distance (ft.) ............................................................35 Table 2.4.10 Nighttime MOE 2: First blinker speed (mph) ...........................................................35 Table 2.4.11 Nighttime MOE 3: Merge distance (ft.) ....................................................................36
Table 2.4.12 Nighttime MOE 4: Merge speed (mph) ....................................................................36
Table 2.4.13 Nighttime MOE 5: Speed when passing shoulder TMA (mph) ...............................37 Table 2.4.14 Nighttime MOE 6: Speed when passing rear advance TMA (mph) .........................37 Table 2.4.15 MOE 7: Water bottle recognition (binary) ...............................................................38
Table 2.4.16 Nighttime MOE 8: Work zone recognition distance (ft.) .........................................38 Table 2.4.17 Nighttime MOE 9: Arrow direction recognition distance (ft.) .................................38
Table 3.1.1 Demographics information for simulator participants ................................................40 Table 3.2.1 Daytime TMA configurations preference ...................................................................41
Table 3.2.2 Friedman test: Rank vs. TMA configurations blocked by participants ......................41 Table 3.2.3 Ratings for daytime TMA configurations ...................................................................42 Table 3.2.4 Nighttime TMA configurations preference ranking ...................................................43 Table 3.2.5 Friedman test: Rank vs. TMA configurations by participants ....................................43 Table 3.2.6 Light intensity .............................................................................................................43
Table 3.2.7 Ratings for nighttime TMA configurations ................................................................44 Table 3.2.8 Simulator fidelity ........................................................................................................45
Table 3.2.9 Summary of SSQ Results ...........................................................................................45 Table 4.2.1 General information ....................................................................................................49 Table 4.3.1 Daytime speeds for amber/white (mph) ......................................................................51 Table 4.3.2 Mean daytime speed (mph) .........................................................................................52 Table 4.3.3 Mean speed: green only daytime vs. amber/white morning (mph) ............................52 Table 4.3.4 Mean nighttime speed (mph) ......................................................................................53

4
Table 4.3.5 Green only speed: daytime vs. nighttime (mph) .........................................................53
Table 4.3.6 Amber/white speed: daytime vs. nighttime (mph) ......................................................54 Table 4.4.1 Luminance measurement of TMA light bars (cd/m
2) .................................................54
Table B.1 Daytime comments........................................................................................................62
Table B.2 Nighttime comments .....................................................................................................62
5
ACKNOWLEDGEMENTS
The authors would like to thank the Missouri Department of Transportation (MoDOT) for
sponsoring this research. The authors express their gratitude to Jen Harper, Dan Smith, Chris
Redline, Chris Zurn, Doug Parson, Ben Sudheimer, Will Brewster, Ryan Davis, Frank
Hernandez, Chris Osbern, Darrel Suiter, Charles Jones, Ashley Buechter and others at MoDOT
for their assistance with the field work and guidance throughout the project. The authors would
also like to thank Doug Burke from the Ohio Department of Transportation (ODOT) and Scott
Ratterree from the Michigan Department of Transportation (MDOT) for discussing their states’
experiences with using green lights on snow removal vehicles. The authors appreciate Jacob
Kaltenbronn, Colby Wedwick, Eunice Wang, Elizabeth Farr, Brooke Dean, Joe Reneker, Chad
Maxey, and Jacob Coberly for their assistance in participant recruitment, simulator trial hosting
and field data processing. The authors are also grateful for the assistance from Huang Feng in
reviewing Missouri TMA crashes and providing TMA crash statistics. Finally, the team would
like to thank everyone who participated in the driving simulation study and surveys.
6
EXECUTIVE SUMMARY
Truck-mounted attenuators (TMAs) are designed to improve mobile work zone safety by
shadowing the working truck, enhancing visibility of a work zone, and catching drivers’
attention early to slow them down when driving through a mobile work zone. Despite the use of
the TMAs and other precautions such as shadow vehicles, arrow boards, and signs to warn
drivers that they are approaching a mobile work zone, some drivers do not respond to warnings
and collide with the TMA. The goal of this research project was to help improve safety in mobile
work zones. The objective of this project was to evaluate the effectiveness of green lights on
TMAs and determine the best TMA light bar configuration. The scope of the project included
two phases: a simulator test with four configurations and a field test with two configurations. The
simulator testing phase examined amber/white ("MoDOT typical"), green only ("MoDOT
preferred"), green/amber ("MoDOT alternative"), and green/white (Design alternative)
configurations. In the field test, only amber/white and green only configurations were evaluated.
The simulator testing phase was composed of three elements: the regular simulator scenario
followed by a post-simulator survey, a disability glare test utilizing an eye tracker, and a
visibility test. Detailed quantitative measures were used for the first time in this study to evaluate
green lights on TMAs in the United States.
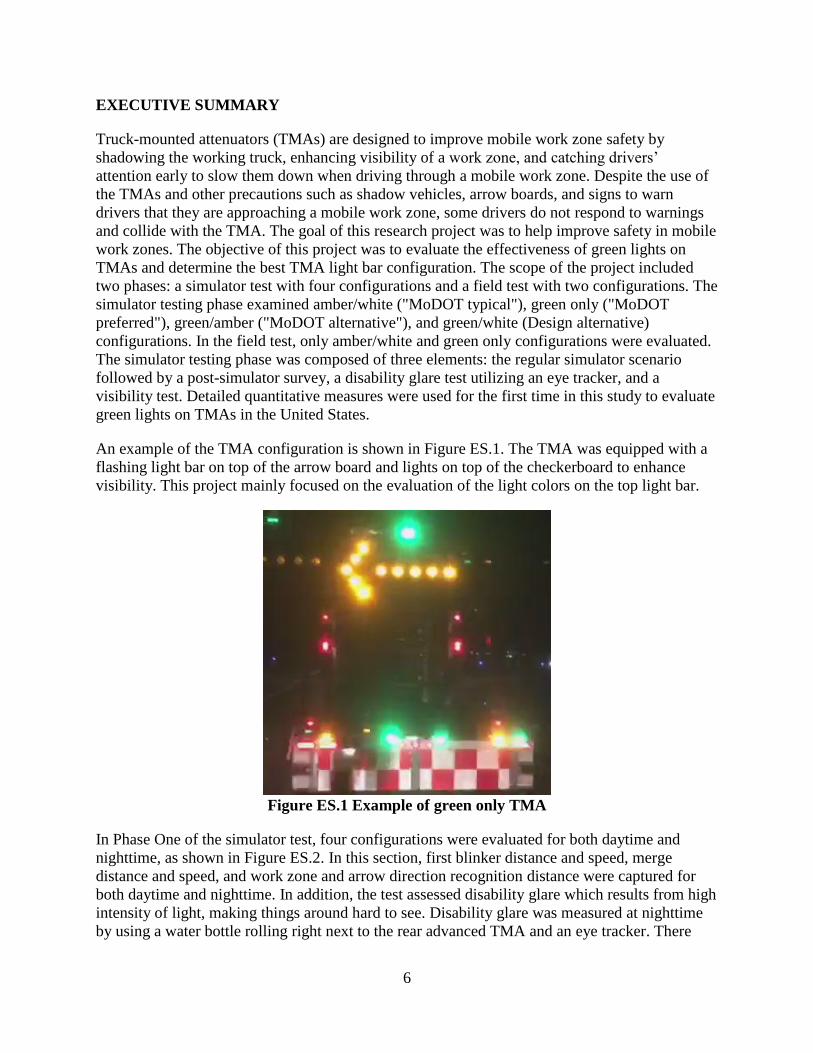
An example of the TMA configuration is shown in Figure ES.1. The TMA was equipped with a
flashing light bar on top of the arrow board and lights on top of the checkerboard to enhance
visibility. This project mainly focused on the evaluation of the light colors on the top light bar.
Figure ES.1 Example of green only TMA
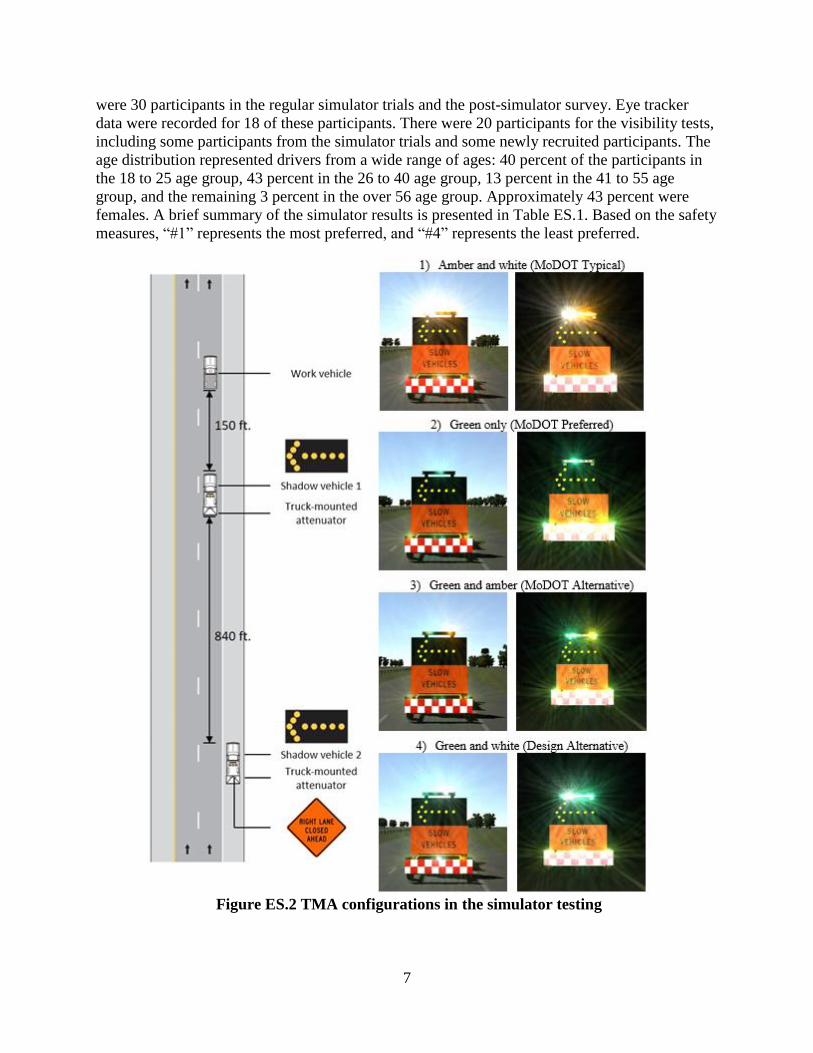
In Phase One of the simulator test, four configurations were evaluated for both daytime and
nighttime, as shown in Figure ES.2. In this section, first blinker distance and speed, merge
distance and speed, and work zone and arrow direction recognition distance were captured for
both daytime and nighttime. In addition, the test assessed disability glare which results from high
intensity of light, making things around hard to see. Disability glare was measured at nighttime
by using a water bottle rolling right next to the rear advanced TMA and an eye tracker. There
7
were 30 participants in the regular simulator trials and the post-simulator survey. Eye tracker
data were recorded for 18 of these participants. There were 20 participants for the visibility tests,
including some participants from the simulator trials and some newly recruited participants. The
age distribution represented drivers from a wide range of ages: 40 percent of the participants in
the 18 to 25 age group, 43 percent in the 26 to 40 age group, 13 percent in the 41 to 55 age
group, and the remaining 3 percent in the over 56 age group. Approximately 43 percent were
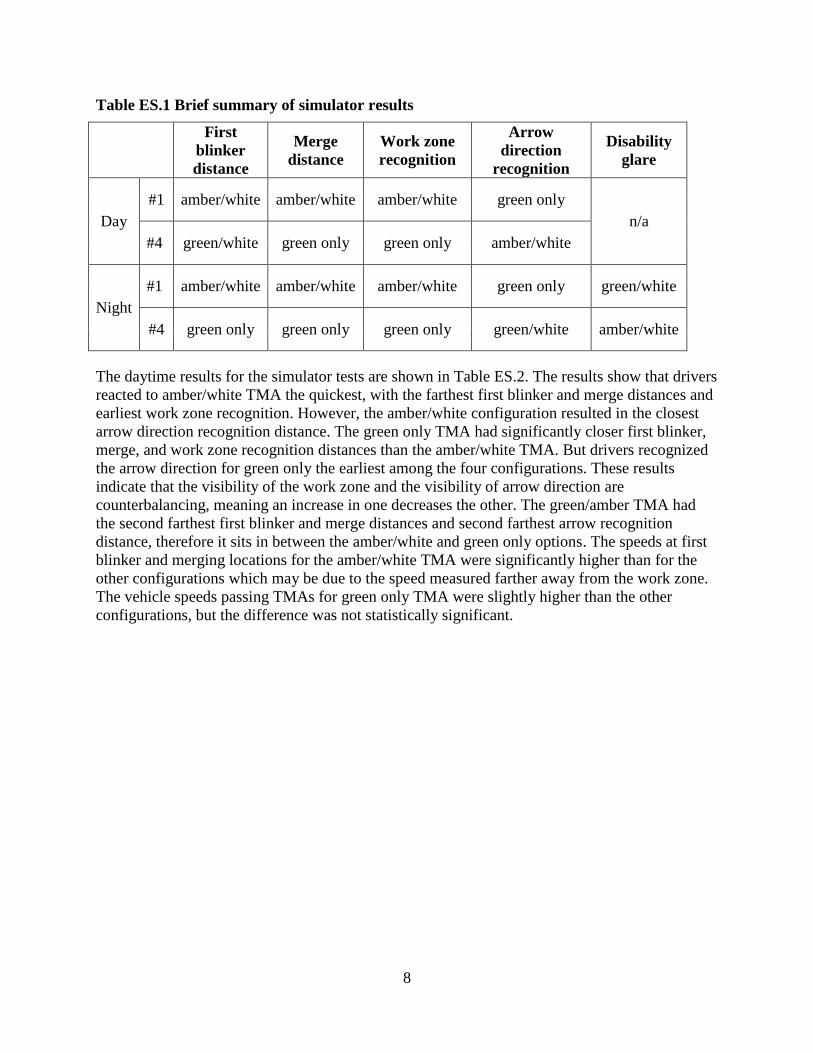
females. A brief summary of the simulator results is presented in Table ES.1. Based on the safety
measures, “#1” represents the most preferred, and “#4” represents the least preferred.
Figure ES.2 TMA configurations in the simulator testing
8
Table ES.1 Brief summary of simulator results
First
blinker
distance
Merge
distance
Work zone
recognition
Arrow
direction
recognition
Disability
glare
Day
#1 amber/white amber/white amber/white green only
n/a
#4 green/white green only green only amber/white
Night
#1 amber/white amber/white amber/white green only green/white
#4 green only green only green only green/white amber/white
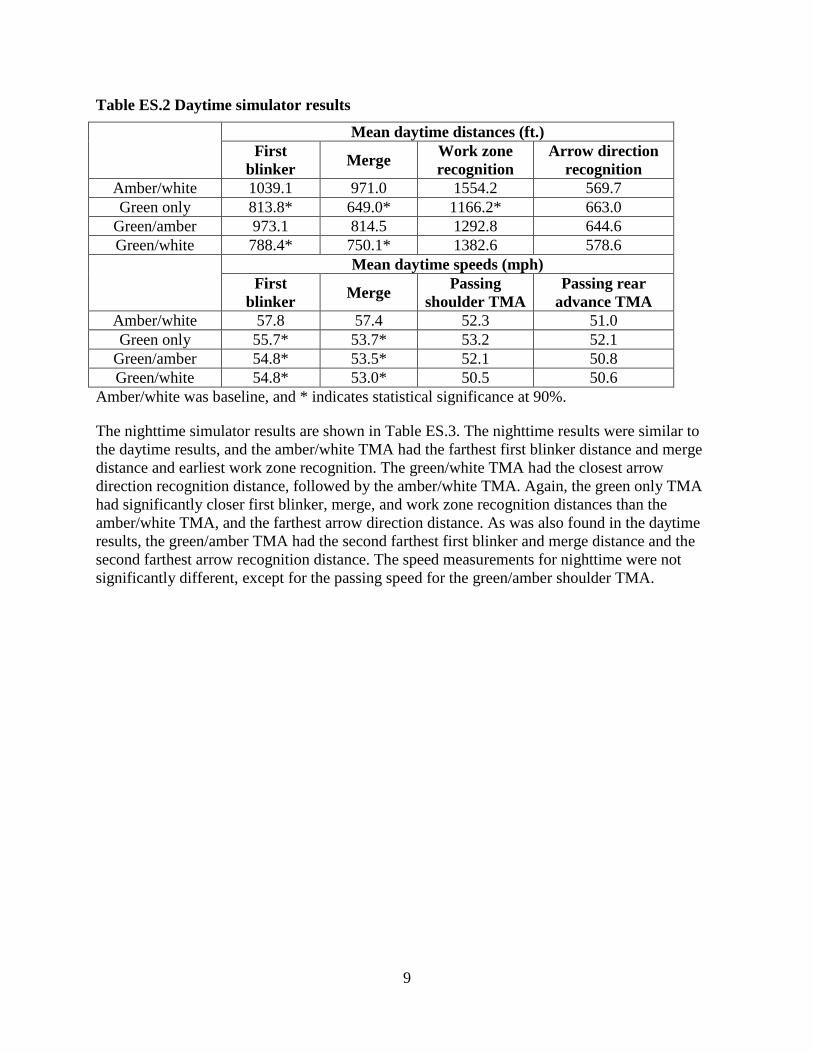
The daytime results for the simulator tests are shown in Table ES.2. The results show that drivers
reacted to amber/white TMA the quickest, with the farthest first blinker and merge distances and
earliest work zone recognition. However, the amber/white configuration resulted in the closest
arrow direction recognition distance. The green only TMA had significantly closer first blinker,
merge, and work zone recognition distances than the amber/white TMA. But drivers recognized
the arrow direction for green only the earliest among the four configurations. These results
indicate that the visibility of the work zone and the visibility of arrow direction are
counterbalancing, meaning an increase in one decreases the other. The green/amber TMA had
the second farthest first blinker and merge distances and second farthest arrow recognition
distance, therefore it sits in between the amber/white and green only options. The speeds at first
blinker and merging locations for the amber/white TMA were significantly higher than for the
other configurations which may be due to the speed measured farther away from the work zone.
The vehicle speeds passing TMAs for green only TMA were slightly higher than the other
configurations, but the difference was not statistically significant.
9
Table ES.2 Daytime simulator results
Mean daytime distances (ft.)
First
blinker Merge
Work zone
recognition
Arrow direction
recognition
Amber/white 1039.1 971.0 1554.2 569.7
Green only 813.8* 649.0* 1166.2* 663.0
Green/amber 973.1 814.5 1292.8 644.6
Green/white 788.4* 750.1* 1382.6 578.6
Mean daytime speeds (mph)
First
blinker Merge
Passing
shoulder TMA
Passing rear
advance TMA
Amber/white 57.8 57.4 52.3 51.0
Green only 55.7* 53.7* 53.2 52.1
Green/amber 54.8* 53.5* 52.1 50.8
Green/white 54.8* 53.0* 50.5 50.6
Amber/white was baseline, and * indicates statistical significance at 90%.
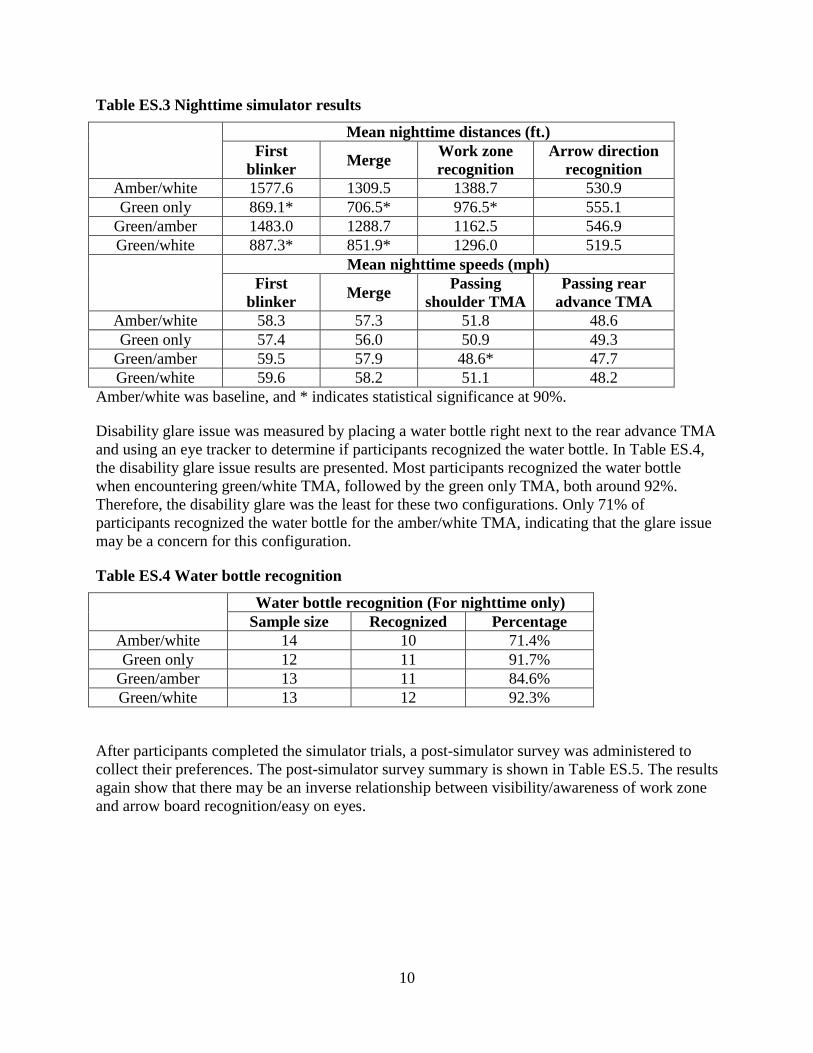
The nighttime simulator results are shown in Table ES.3. The nighttime results were similar to
the daytime results, and the amber/white TMA had the farthest first blinker distance and merge
distance and earliest work zone recognition. The green/white TMA had the closest arrow
direction recognition distance, followed by the amber/white TMA. Again, the green only TMA
had significantly closer first blinker, merge, and work zone recognition distances than the
amber/white TMA, and the farthest arrow direction distance. As was also found in the daytime
results, the green/amber TMA had the second farthest first blinker and merge distance and the
second farthest arrow recognition distance. The speed measurements for nighttime were not
significantly different, except for the passing speed for the green/amber shoulder TMA.
10
Table ES.3 Nighttime simulator results
Mean nighttime distances (ft.)
First
blinker Merge
Work zone
recognition
Arrow direction
recognition
Amber/white 1577.6 1309.5 1388.7 530.9
Green only 869.1* 706.5* 976.5* 555.1
Green/amber 1483.0 1288.7 1162.5 546.9
Green/white 887.3* 851.9* 1296.0 519.5
Mean nighttime speeds (mph)
First
blinker Merge
Passing
shoulder TMA
Passing rear
advance TMA
Amber/white 58.3 57.3 51.8 48.6
Green only 57.4 56.0 50.9 49.3
Green/amber 59.5 57.9 48.6* 47.7
Green/white 59.6 58.2 51.1 48.2
Amber/white was baseline, and * indicates statistical significance at 90%.
Disability glare issue was measured by placing a water bottle right next to the rear advance TMA
and using an eye tracker to determine if participants recognized the water bottle. In Table ES.4,
the disability glare issue results are presented. Most participants recognized the water bottle
when encountering green/white TMA, followed by the green only TMA, both around 92%.
Therefore, the disability glare was the least for these two configurations. Only 71% of
participants recognized the water bottle for the amber/white TMA, indicating that the glare issue
may be a concern for this configuration.
Table ES.4 Water bottle recognition
Water bottle recognition (For nighttime only)
Sample size Recognized Percentage
Amber/white 14 10 71.4%
Green only 12 11 91.7%
Green/amber 13 11 84.6%
Green/white 13 12 92.3%
After participants completed the simulator trials, a post-simulator survey was administered to
collect their preferences. The post-simulator survey summary is shown in Table ES.5. The results
again show that there may be an inverse relationship between visibility/awareness of work zone
and arrow board recognition/easy on eyes.

11
Table ES.5 Summary of post-simulator survey results
Ranking Visibility of
work zone
Awareness
of work
zone
Clear arrow
direction
Easy on
eyes
Day
#1 green/amber amber/white amber/white green only green only
#4 green only green only green only
amber/white,
green/white,
tied
amber/white
Night
#1 green/amber amber/white amber/white green only green only
#4 amber/white green only green only amber/white amber/white
The post-simulator survey results show that green/amber TMA was the most preferred option, as
it was ranked as the number one preference in both daytime and nighttime. As shown in Table
ES.6, drivers preferred green/amber the most and green only the least for daytime, and drivers
preferred green/amber the most and amber/white the least for nighttime, with 66 percent agreeing
that the lights were too bright.
Table ES.6 Preference ranking and light intensity
Rank Lights too bright at night?
Day Night Agree Neutral Disagree
Amber/white 2 4 19 (66%) 5 (17%) 5 (17%)
Green only 4 3 5 (17%) 3 (10%) 21 (72%)
Green/amber 1 1 8 (28%) 11 (38%) 10 (34%)
Green/white 3 2 10 (34%) 14 (48%) 5 (17%)
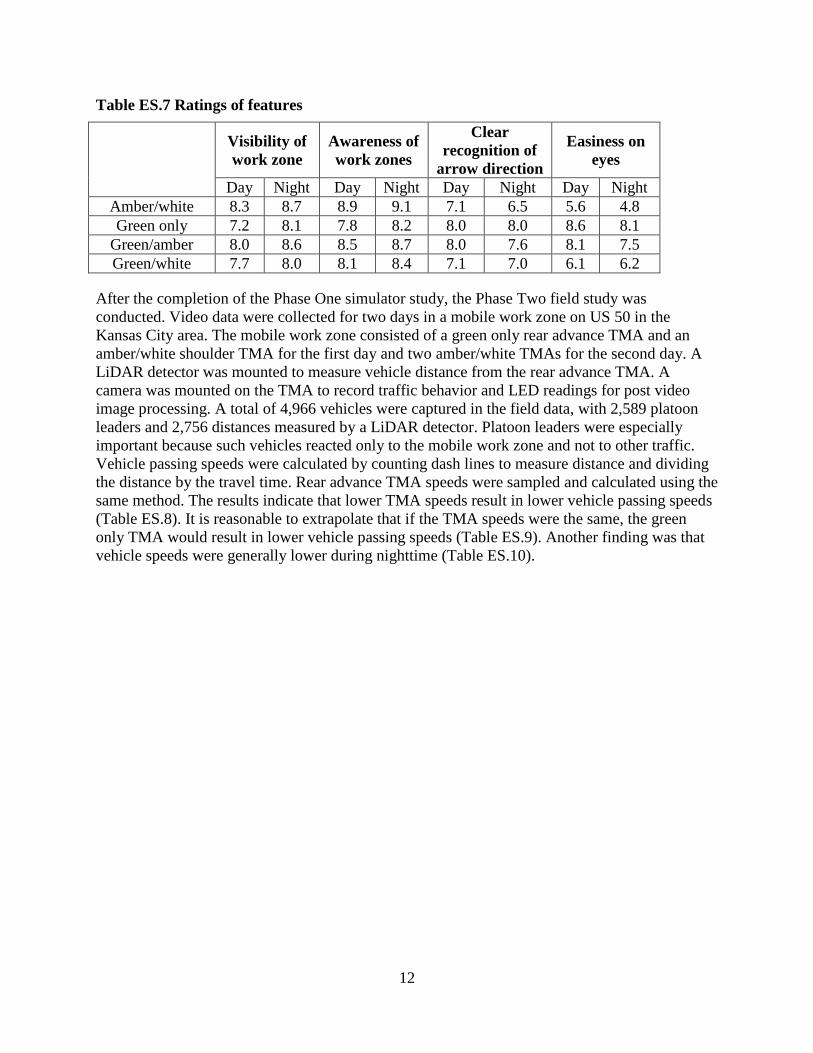
Participants also rated the attributes of visibility of work zone, awareness of work zone, clear
recognition of arrow direction, and easiness on the eyes on a scale of 1 to 10. These results are
shown in Table ES.7. The amber/white TMA scored the highest in visibility and awareness of
work zone but lowest in arrow recognition and ease of eyes. The scores of the green/amber TMA
was the second for all four attributes.
12
Table ES.7 Ratings of features
Visibility of
work zone
Awareness of
work zones
Clear
recognition of
arrow direction
Easiness on
eyes
Day Night Day Night Day Night Day Night
Amber/white 8.3 8.7 8.9 9.1 7.1 6.5 5.6 4.8
Green only 7.2 8.1 7.8 8.2 8.0 8.0 8.6 8.1
Green/amber 8.0 8.6 8.5 8.7 8.0 7.6 8.1 7.5
Green/white 7.7 8.0 8.1 8.4 7.1 7.0 6.1 6.2
After the completion of the Phase One simulator study, the Phase Two field study was
conducted. Video data were collected for two days in a mobile work zone on US 50 in the
Kansas City area. The mobile work zone consisted of a green only rear advance TMA and an
amber/white shoulder TMA for the first day and two amber/white TMAs for the second day. A
LiDAR detector was mounted to measure vehicle distance from the rear advance TMA. A
camera was mounted on the TMA to record traffic behavior and LED readings for post video
image processing. A total of 4,966 vehicles were captured in the field data, with 2,589 platoon
leaders and 2,756 distances measured by a LiDAR detector. Platoon leaders were especially
important because such vehicles reacted only to the mobile work zone and not to other traffic.
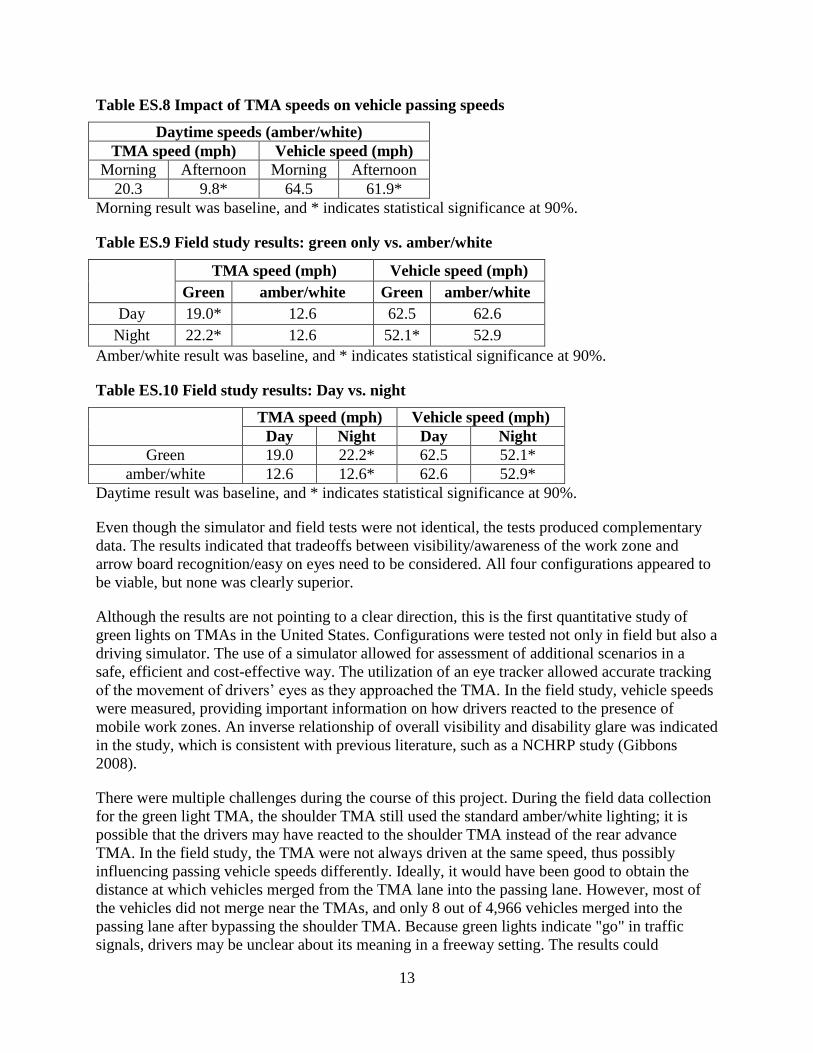
Vehicle passing speeds were calculated by counting dash lines to measure distance and dividing
the distance by the travel time. Rear advance TMA speeds were sampled and calculated using the
same method. The results indicate that lower TMA speeds result in lower vehicle passing speeds
(Table ES.8). It is reasonable to extrapolate that if the TMA speeds were the same, the green
only TMA would result in lower vehicle passing speeds (Table ES.9). Another finding was that
vehicle speeds were generally lower during nighttime (Table ES.10).
13
Table ES.8 Impact of TMA speeds on vehicle passing speeds
Daytime speeds (amber/white)
TMA speed (mph) Vehicle speed (mph)
Morning Afternoon Morning Afternoon
20.3 9.8* 64.5 61.9*
Morning result was baseline, and * indicates statistical significance at 90%.
Table ES.9 Field study results: green only vs. amber/white
TMA speed (mph) Vehicle speed (mph)
Green amber/white Green amber/white
Day 19.0* 12.6 62.5 62.6
Night 22.2* 12.6 52.1* 52.9
Amber/white result was baseline, and * indicates statistical significance at 90%.
Table ES.10 Field study results: Day vs. night
TMA speed (mph) Vehicle speed (mph)
Day Night Day Night
Green 19.0 22.2* 62.5 52.1*
amber/white 12.6 12.6* 62.6 52.9*
Daytime result was baseline, and * indicates statistical significance at 90%.
Even though the simulator and field tests were not identical, the tests produced complementary
data. The results indicated that tradeoffs between visibility/awareness of the work zone and
arrow board recognition/easy on eyes need to be considered. All four configurations appeared to
be viable, but none was clearly superior.
Although the results are not pointing to a clear direction, this is the first quantitative study of
green lights on TMAs in the United States. Configurations were tested not only in field but also a
driving simulator. The use of a simulator allowed for assessment of additional scenarios in a
safe, efficient and cost-effective way. The utilization of an eye tracker allowed accurate tracking
of the movement of drivers’ eyes as they approached the TMA. In the field study, vehicle speeds
were measured, providing important information on how drivers reacted to the presence of
mobile work zones. An inverse relationship of overall visibility and disability glare was indicated
in the study, which is consistent with previous literature, such as a NCHRP study (Gibbons
2008).
There were multiple challenges during the course of this project. During the field data collection
for the green light TMA, the shoulder TMA still used the standard amber/white lighting; it is
possible that the drivers may have reacted to the shoulder TMA instead of the rear advance
TMA. In the field study, the TMA were not always driven at the same speed, thus possibly
influencing passing vehicle speeds differently. Ideally, it would have been good to obtain the
distance at which vehicles merged from the TMA lane into the passing lane. However, most of
the vehicles did not merge near the TMAs, and only 8 out of 4,966 vehicles merged into the
passing lane after bypassing the shoulder TMA. Because green lights indicate "go" in traffic
signals, drivers may be unclear about its meaning in a freeway setting. The results could
14
potentially be influenced by the novelty effect of green light TMAs. All MOEs were obtained
from drivers in Missouri, and green light TMAs were new to them. The novelty effect of green
lights could be examined in a study of longer duration.
15
CHAPTER 1: INTRODUCTION
1.1 TMA Incidents
Mobile work zones for various types of moving operations such as striping, sweeping, and
pothole filling are an important component of maintaining highways. The Manual on Uniform
Traffic Control Devices (MUTCD) (FHWA 2009) provides guidance for the layout for mobile
work zones, using shadow vehicles, arrow boards, and signs to warn drivers that they are
approaching a mobile work zone. In addition, a Truck-Mounted Attenuator (TMA) attached to a
construction vehicle helps to mitigate the impact of a collision from a highway vehicle that fails
to recognize the mobile work zone. Amber/white lights are typically used on the TMA to help
draw motorists’ attention to the moving work zone. Despite these precautions, some drivers do
not respond to warnings and collide with the TMA. Distracted driving may be a contributing
factor in these collisions.
Research was conducted by the Virginia Transportation Research Council (VTRC) on TMA
crashes in work zones in Virginia (Cottrell Jr 2015). The goals of the VTRC research were to
find trends in TMA crashes over a period of three to five years and find out the biggest causes of
TMA crashes in work zones. From 2011-2014, the number of TMA crashes had increased in
contractor work zones, and the Virginia DOT work zones experienced approximately the same
level of TMA crashes per year. The study found that some of the leading contributing factors to
TMA crashes in work zones were distracted driving, sight distance issues, and improper
placement of the TMA in work zones.
There were 139 TMA crashes reported in Missouri from 2012 to 2017. Thus, there was a TMA
hit approximately every 15 days. The major reason for drivers to hit a TMA was distracted
driving (44 percent), as shown in Table 1.1.1. Among all TMA crashes, 97 were related to
mobile work zones (70 percent), 20 were stationary work zones, and the others unknown. Some
TMA operations had a higher risk of crash, such as pothole patching, striping, and sweeping, as
shown in Table 1.1.2. This result could be due to higher exposure, or because these specific
operations were more risky.

16
Table 1.1.1 Reasons for TMA crashes in Missouri
Table 1.1.2 Mobile work activity when TMAs were struck in Missouri
Operation Count Percentage
Pothole patching 31 22.3%
Striping 20 14.4%
Sweeping 18 12.9%
Maintenance
(not specified) 13 9.4%
Bridge 9 6.5%
Mowing 8 5.8%
Cleaning dirt 8 5.8%
Signage 7 5.0%
Spraying weeds 3 2.2%
Rolling 2 1.4%
Other 9 6.5%
Unknown 11 7.9%
The aforementioned data in Tables 1.1.1 and 1.1.2 show that vehicles crashing into a TMA at a
mobile work zone is a real concern. By testing different combinations of light colors, the
objective of this project was to improve mobile work zone safety and evaluate the performance
of green lights on TMAs. This project consisted of two phases: Phase One involved simulator
testing, with four different configurations followed by post-simulator surveys; Phase Two
involved a field study to compare the performance of green only and amber/white color lights on
TMAs.
1.2 Literature review
This review of the existing literature on the use of green lights on construction vehicles includes
aspects of light colors, light positions, and other light factors which are described in the
following sections. Light color is one important factor in TMA light bar configuration, as the
sensitivity of human vision varies across colors. Several research studies on service vehicle
warning lights have been conducted. One such study was performed by the American
Association of State and Highway Transportation Officials (AASHTO 2009). AASHTO
investigated and defined the best practices for selecting warning lights on roadway operations
equipment. They considered safety and lighting issues, along with defining lighting selection.
The study found that an asynchronous flashing pattern was the most effective. Amber/white
colored lights were also proven to be more effective than blue and red lights. There was no
observed difference between different types of light sources, such as LED or strobe. The study
also recommended that lights be placed with a portion of the vehicle behind them. Finally, lights
with a higher effective intensity obtained better drivers’ attention. However, safety and time of
Distracted
driving
Late
merging Speeding Others
Not
reported
Count 61 21 7 7 43
Percentage 43.9% 15.1% 5.0% 5.0% 30.9%
17
day should also be considered. The glare of high-intensity lights may affect driver vision. This
effect can be mitigated by adjusting the level of lighting and by establishing a difference between
daytime and nighttime lighting configurations.
A National Cooperative Highway Research Program (NCHRP) study was conducted to evaluate
the effectiveness of warning lights on roadway maintenance vehicles and their impacts on
motorist awareness (Gibbons 2008). Photometric characterization, static screening, and
performance experiments were used in order to review current practices and further investigate
different warning light systems. The study determined that drivers noticed flashing lights more
quickly than steady lights. Furthermore, flashing lights with an asynchronous pattern were
proven to be more effective than flashing lights with a synchronous pattern. An asynchronous
flashing pattern using amber and white lights was found to be the most effective, as it was better
recognized by drivers than red and blue ones. In addition to color, the type of light made an
impact on obtaining the attention of the driver. The study found that, for halogen and strobe
lights, increasing the intensity helped drivers on the road to recognize them much more readily.
In addition, lane change distances for LED warning lights were much farther than lane change
distances for warning beacons mounted high or low on highway maintenance vehicles. The
report recommended that the warning light system should also have a higher effective intensity
in the daytime, compared to nighttime, and the light should be laid out on a controlled
background. It was additionally determined that lights with a higher effective intensity are
necessary in adverse weather conditions but result in increased glare. Overall, lighting
characteristics and layout along with environmental conditions are all factors to consider while
designing a lighting system. Furthermore, it is important to evaluate the measurement techniques
used for lighting systems and to standardize them across different manufacturers. This report
pointed out that during daytime, green light had the shortest detection time, but it did not perform
well with respect to disability glare and discomfort glare. The balance between conspicuity and
distraction of warning beacons needed to be maintained, as well as the balance between high
effective light intensity and disability glare issues. The report recommended placing light bars at
a higher position to reduce the glare issue, and recommended the amber/white combination for
maintenance vehicles to avoid confusion.
Internationally, a research study was performed in the United Kingdom regarding warning
beacons (Cook et al. 2000). Researchers investigated the conspicuity of warning beacons with
lights consisting of different flash types, flash rates, and flash intensities. Through laboratory and
field trials, the study found that strobe lights yielded a greater sense of urgency for drivers. Also,
flash rates of 4 Hz were found to be ideal in getting driver’s attention. Finally, high flash
intensities were determined to minimize detection time of the warning beacon.
1.3 DOT practices
The Texas Department of Transportation (TxDOT) (Ullman and Lewis 1998) performed
research evaluating the vehicle fleet warning lights in order to determine if using different
colored warning lights on fleet vehicles, other than the standard flashing yellow lights, provided
greater safety in highway work zones. This study found out that 12 states used colors other than
yellow-only on some equipment. The combinations of colored lights tested were yellow/blue and
yellow/blue/red. The results showed that drivers perceived flashing yellow lights to convey a less
18
hazardous situation, which may not be the correct hazardous level, compared with flashing
yellow/blue or yellow/blue/red combinations.
The Kentucky Transportation Center (KTC) surveyed state DOTs on warning light color options
for work vehicles and their effectiveness (Howell et al. 2015) and received 16 responses. The
survey indicated that four states used blue lights on their maintenance vehicles and five different
states used red lights on their work vehicles. The study reviewed warning light practices at other
state DOTs nationwide as well as other relevant factors, such as light source, light color, and
layout of lights. This review served to gather information on the current state of affairs on work
vehicle warning lights and allow for Kentucky Transportation Cabinet (KYTC) to improve their
work vehicle lighting systems. All state DOTs surveyed had policies and regulations covering
their work vehicle lighting programs. They all reported using amber colored lights and LED
lights on their work vehicles. Other commonly used light colors were white, and red and blue for
emergency vehicles. The DOTs also reported using different lighting intensities at day and night,
along with varying light colors by highway vehicle type. A strong preference for roof-top
mounted lighting was also indicated. The summary of light usage for selected states is shown in
Table 1.3.1. This research found that most of the agencies that participated in the survey strongly
preferred putting warning lights on top of the roof of highway maintenance vehicles. The study
also found that when drivers encountered red and blue warning lights on highway work vehicles,
they linked the red and blue lights with other emergency vehicles. The KYTC plans to use this
knowledge to place appropriate lighting on their emergency and public safety vehicles. KYTC
attempted to use amber and green combination, however they were not available from
manufacturers.

19
Table 1.3.1 Color usage on emergency and warning vehicles by state
State Maintenance Emergency
vehicles Note
Alaska amber, blue n/a use different colors for maintenance vs.
emergency
Illinois n/a amber prevent glare
Indiana amber n/a tested range of weather and lighting
conditions
Iowa amber n/a can use white, blue, red to complement
amber
Maine amber n/a amber for maintenance
Massachusetts amber, white red use different colors for maintenance vs.
emergency
Michigan amber n/a amber for maintenance
Minnesota amber, blue n/a to promote safety
Missouri amber, white red, blue use different colors for maintenance vs.
emergency
New
Hampshire amber n/a amber for maintenance
Ohio green, white,
amber n/a to improve truck visibility
Oklahoma amber, blue, red,
white n/a 4 colors used for maintenance
South Dakota amber n/a amber for maintenance
Texas Amber/yellow red use different colors for maintenance vs.
emergency
Washington amber, red blue use different colors for maintenance vs.
emergency
There are existing laws in place in each state that restrict the color and type of light that can be
used on emergency, road maintenance, and other vehicles. In general, red and blue warning
lights are always allowed for emergency vehicles, and a limited number of red/blue lights can
sometimes be used for other service vehicles like highway maintenance vehicles or snow trucks.
All states allow amber colored lights on maintenance vehicles.
The Ohio Department of Transportation (ODOT) is the first state to implement green lights on
work vehicles. The ODOT use of green lights is limited by statute to snow removal trucks
(ODOT 2013), as shown in Figure 1.3.1. The color combination that the ODOT implemented
was amber, green, and white. Under the configuration, three ambers are always lit and alternate
with three whites or three greens. In a phone interview with the researchers, ODOT personnel
indicated that this configuration was determined partly through a survey of trucks set up with
different colors at the state fair. ODOT found that a high flash rate was necessary to prevent
colors from blending together and sickness from looking at the lights. The deployment found
green lights to be more effective in catching the driver’s attention. ODOT predicted that the
green lights would help make roads safer because drivers would be able to easily spot work

20
vehicles in snowy weather. ODOT is still in the processing of evaluating the safety impacts of
using the green lights but believes that they help to reduce crashes.
Figure 1.3.1 ODOT green light snow-removal truck (ODOT 2013)
Personnel from the Michigan Department of Transportation (MDOT) indicated in a phone
interview with the researchers that MDOT is in the process of implementing amber and green
lights on its snow removal vehicles. Details regarding the light configuration are still being
finalized. It is expected that this implementation will be completed in fall 2018. The Michigan
statute passed allows for MDOT to use green lights on both winter maintenance vehicles and
regular maintenance vehicles, but MDOT is currently limiting its use to snow removal vehicles.

21
CHAPTER 2: SIMULATOR TESTS
2.1 Introduction of ZouSim driving simulator
Phase One of the project consisted of the simulator study. The University of Missouri’s driving
simulator, ZouSim, was used to examine four different TMA lighting configurations in a cost-
effective way. The simulator provided safe experiment conditions for the testing of alternatives
in a highly controlled environment that limited extraneous causal factors.
ZouSim is built around the half-cab of a sedan with medium-fidelity. ZouSim has a wide range
of graphical display capabilities, including virtual reality, augmented reality, and stereoscopic
3D. In this experiment, the triple 120-inch screen was chosen as the most appropriate display for
the TMA study. This display setup provided a 180-degree field-of-view which offered an
excellent view of the approaching work zone and the relevant peripheral clues for regulating
driving speed. Figure 2.1.1 shows the ZouSim setup for the green light experiment. The primary
virtual camera was the forward windshield and side windows views. Three additional virtual
cameras presented the left, right and rear view mirrors perspectives. The active instrumentation
in the vehicle includes a force-feedback steering wheel, brake and acceleration pedals, turn
signals, and an engine vibration generator.
(a) (b)
Figure 2.1.1 TMA experiment using ZouSim (a) Daytime example: green only TMA (b)
Nighttime example: green/amber TMA
2.2 Simulator Setup
The study simulated work zones on a divided, four-lane freeway in Missouri with a speed limit
of 60 mph. The entire highway segment was designed without vertical or horizontal curves, in
order to eliminate the influence of terrain. The pavement was created based on AASHTO Green
Book standards (AASHTO 2013). Surfaces were textured and/or painted with the appropriate
striping and markings that conform to the MUTCD (FHWA 2009). The work zone layout is
shown in Figure 2.2.1. In the right lane closed work zone, all work zone vehicles were moving at
10 mph. The work zone configuration followed the requirements of MoDOT Engineering Policy
Guide (MoDOT 2018).

22
Figure 2.2.1 Mobile work zone layout in simulator tests
Four TMA light bar configurations were tested in the simulator tests: (1) amber/white (MoDOT
typical), (2) green only (MoDOT preferred), (3) green/amber (MoDOT alternative), and (4)
green/white (design alternative). There was no other traffic, except the work zone vehicles in the
direction of travel, so the participant was free to accelerate/decelerate or change lanes. Therefore,
all the measurements derived from drivers were responding to TMAs only. Each configuration
was tested for both daytime and nighttime scenarios. The nighttime scenarios used the same
settings as the daytime scenarios, except that lights were dimmed by half. An eye tracker was
utilized to capture the movement of participants’ pupils for nighttime scenarios, as high intensity
of lights could cause disability glare issues. Disability glare refers to a situation where the light

23
bar could be so dominant that drivers might be unable to see the flashing arrow and other items
near the light bar. A water bottle rolled next to the rear advance TMA, and the eye tracker
indicated if participants saw the water bottle, so as to determine disability glare of each
configuration. The water bottle was chosen as the least obtrusive and yet measurable option after
considering several other options.
The amber and white configuration was the baseline for the experiment. The amber and white
TMA was equipped with amber and white light bars on top of arrow board, an arrow board with
the arrow flashing, and amber and white light bulbs on the checkerboard, as shown in Figure
2.2.2.
(a) (b)
Figure 2.2.2 amber/white scenarios (a) daytime (b) nighttime
The green only TMA was implemented by MoDOT based on field testing that was performed at
Lee’s Summit airport. The feedback from the pilot project crew was positive. The crew thought
that the green only TMA worked well to attract driver attention, and the visibility was high.
TMA operators felt safer with green lights. However, concerns about confusion with traffic
signal and arrow board were expressed. The green only TMA was equipped with green light bars
on top of arrow board, an arrow board with arrow flashing, and green and amber light bulbs on
the checkerboard, as shown in Figure 2.2.3.

24
(a) (b)
Figure 2.2.3 Green only scenarios (a) daytime (b) nighttime
The green and amber was an alternative configuration tested by MoDOT at Lee’s Summit
airport. The simulated configuration was the same as the one tested by MoDOT, with
green/amber light bars on top of the arrow board and green/amber light bulbs on the
checkerboard, as shown in Figure 2.2.4.
(a) (b)
Figure 2.2.4 Green/amber scenarios (a) daytime (b) nighttime
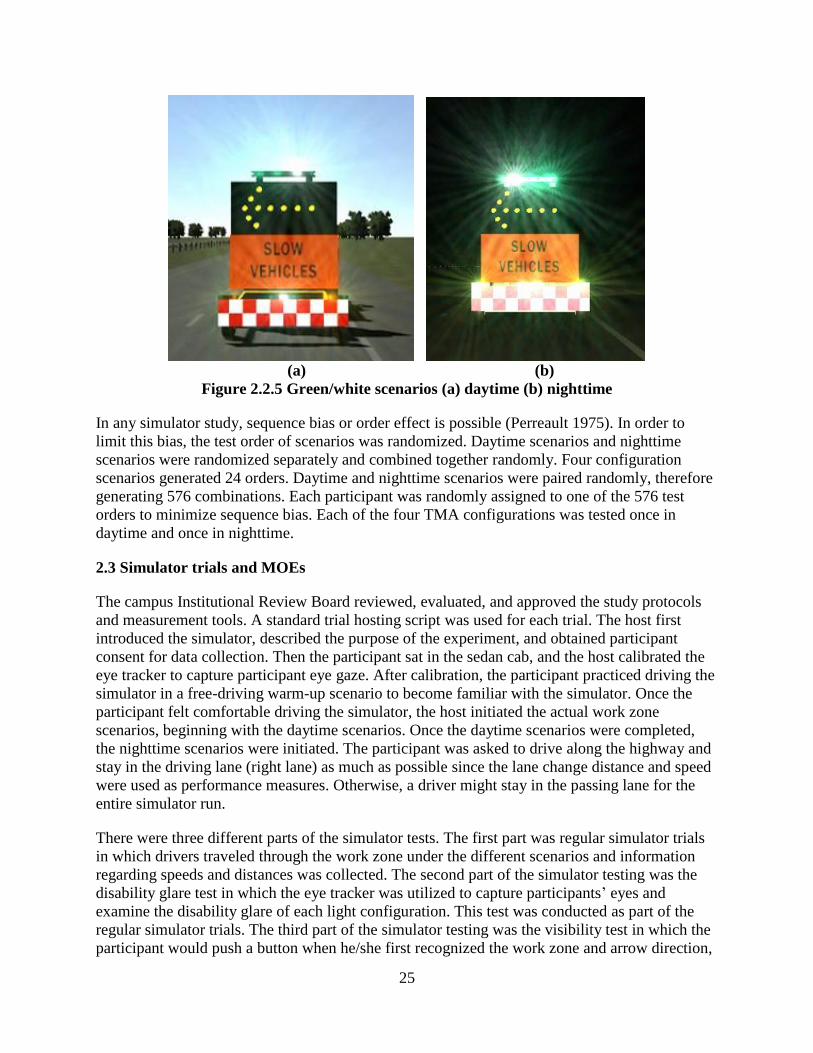
The research team designed an alternative green/white TMA, with green/white light bars on top
of arrow board and amber/green light bulbs on the checkerboard, as shown in Figure 2.2.5.
25
(a) (b)
Figure 2.2.5 Green/white scenarios (a) daytime (b) nighttime
In any simulator study, sequence bias or order effect is possible (Perreault 1975). In order to
limit this bias, the test order of scenarios was randomized. Daytime scenarios and nighttime
scenarios were randomized separately and combined together randomly. Four configuration
scenarios generated 24 orders. Daytime and nighttime scenarios were paired randomly, therefore
generating 576 combinations. Each participant was randomly assigned to one of the 576 test
orders to minimize sequence bias. Each of the four TMA configurations was tested once in
daytime and once in nighttime.
2.3 Simulator trials and MOEs
The campus Institutional Review Board reviewed, evaluated, and approved the study protocols
and measurement tools. A standard trial hosting script was used for each trial. The host first
introduced the simulator, described the purpose of the experiment, and obtained participant
consent for data collection. Then the participant sat in the sedan cab, and the host calibrated the
eye tracker to capture participant eye gaze. After calibration, the participant practiced driving the
simulator in a free-driving warm-up scenario to become familiar with the simulator. Once the
participant felt comfortable driving the simulator, the host initiated the actual work zone
scenarios, beginning with the daytime scenarios. Once the daytime scenarios were completed,
the nighttime scenarios were initiated. The participant was asked to drive along the highway and
stay in the driving lane (right lane) as much as possible since the lane change distance and speed
were used as performance measures. Otherwise, a driver might stay in the passing lane for the
entire simulator run.
There were three different parts of the simulator tests. The first part was regular simulator trials
in which drivers traveled through the work zone under the different scenarios and information
regarding speeds and distances was collected. The second part of the simulator testing was the
disability glare test in which the eye tracker was utilized to capture participants’ eyes and
examine the disability glare of each light configuration. This test was conducted as part of the
regular simulator trials. The third part of the simulator testing was the visibility test in which the
participant would push a button when he/she first recognized the work zone and arrow direction,
26
separately. The visibility test was conducted apart from the regular simulator trials to avoid
distracting participants when they were driving.
The simulator trials, including eye tracking, were all recorded. After simulator experiments were
completed, the research team reviewed the videos and extracted data. Nine measures of
effectiveness (MOEs) were defined for data reduction.
2.3.1 Regular trials
In this part of the simulator testing, six MOEs were captured. These MOEs were measured for
both daytime and nighttime scenarios.
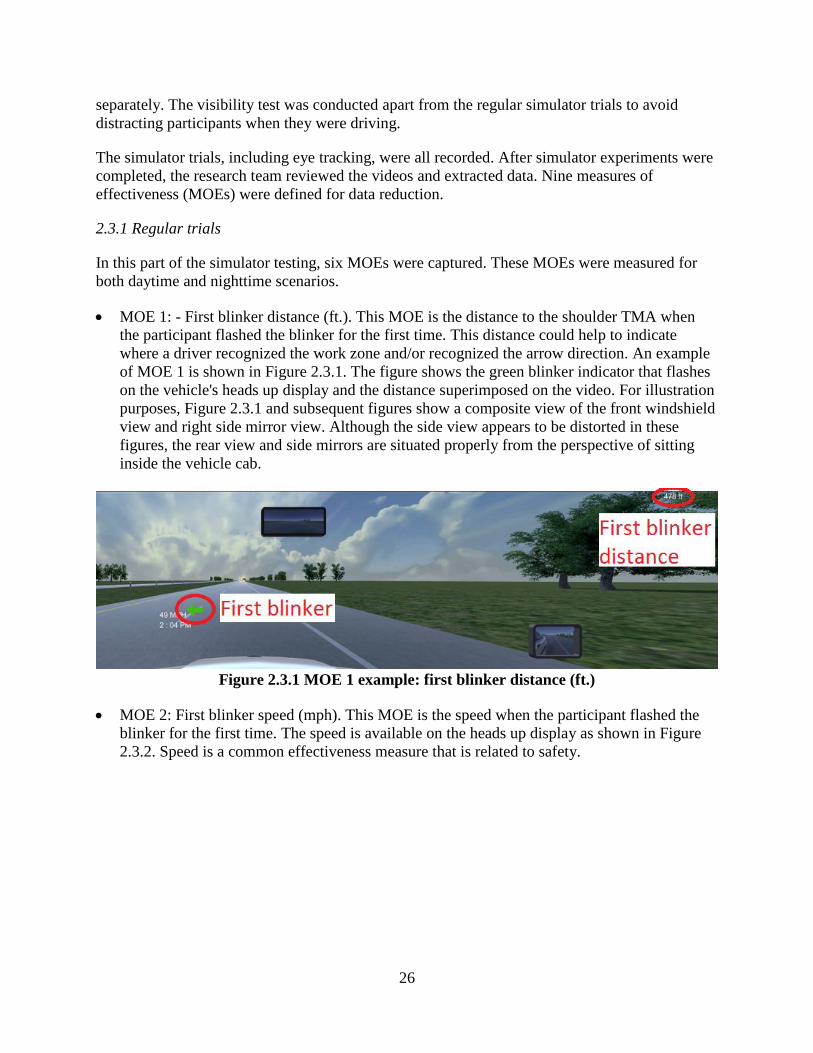
MOE 1: - First blinker distance (ft.). This MOE is the distance to the shoulder TMA when
the participant flashed the blinker for the first time. This distance could help to indicate
where a driver recognized the work zone and/or recognized the arrow direction. An example
of MOE 1 is shown in Figure 2.3.1. The figure shows the green blinker indicator that flashes
on the vehicle's heads up display and the distance superimposed on the video. For illustration
purposes, Figure 2.3.1 and subsequent figures show a composite view of the front windshield
view and right side mirror view. Although the side view appears to be distorted in these
figures, the rear view and side mirrors are situated properly from the perspective of sitting
inside the vehicle cab.
Figure 2.3.1 MOE 1 example: first blinker distance (ft.)
MOE 2: First blinker speed (mph). This MOE is the speed when the participant flashed the
blinker for the first time. The speed is available on the heads up display as shown in Figure
2.3.2. Speed is a common effectiveness measure that is related to safety.
27
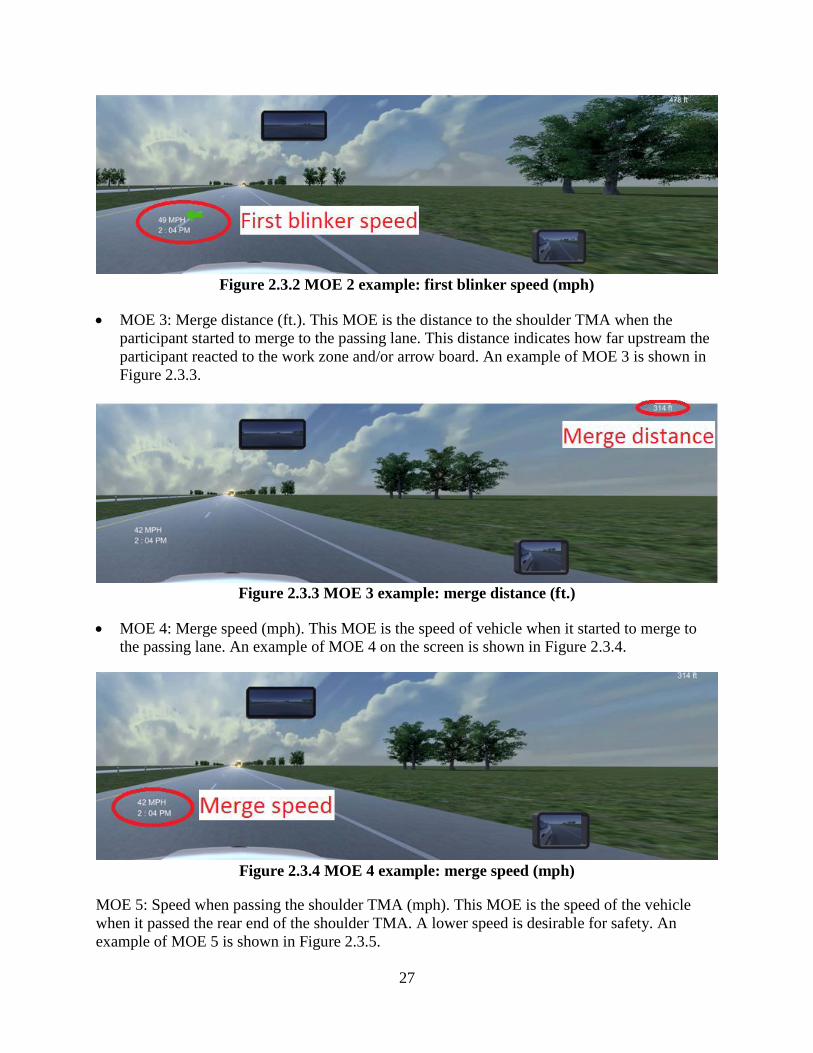
Figure 2.3.2 MOE 2 example: first blinker speed (mph)
MOE 3: Merge distance (ft.). This MOE is the distance to the shoulder TMA when the
participant started to merge to the passing lane. This distance indicates how far upstream the
participant reacted to the work zone and/or arrow board. An example of MOE 3 is shown in
Figure 2.3.3.
Figure 2.3.3 MOE 3 example: merge distance (ft.)
MOE 4: Merge speed (mph). This MOE is the speed of vehicle when it started to merge to
the passing lane. An example of MOE 4 on the screen is shown in Figure 2.3.4.
Figure 2.3.4 MOE 4 example: merge speed (mph)
MOE 5: Speed when passing the shoulder TMA (mph). This MOE is the speed of the vehicle
when it passed the rear end of the shoulder TMA. A lower speed is desirable for safety. An
example of MOE 5 is shown in Figure 2.3.5.

28
Figure 2.3.5 MOE 5 example: speed when passing shoulder TMA (mph)
MOE 6: Speed when passing the rear advance TMA (mph). This MOE is the speed of vehicle
when it passed the rear end of rear advance TMA. A lower speed is more desired for safety
consideration. An example of MOE 6 is shown in Figure 2.3.6.
Figure 2.3.6 MOE 6 example: speed when passing rear advance TMA (mph)
2.3.2 Disability glare test
The light bars above the arrow board could potentially impact arrow visibility due to light
intensity and may cause disability glare, especially during nighttime. The simulator study was
used to assess possible disability glare and discomfort effects. A water bottle was rolling right
next to the rear advanced TMA. The eye tracker was utilized to track a participant's eyes and to
determine if the participant saw the water bottle. The eye tracker was shown as a bubble on the
monitoring screen of the host, but not shown on the driver’s display monitor to avoid distraction.
The following MOE was used to assess disability glare:
MOE 7: Water bottle recognition is a binary measurement, indicating if the participant saw
the water bottle or not. This MOE is for nighttime only. Figure 2.3.7 shows an example of
the eye tracker indicating that water bottle was recognized.

29
Figure 2.3.7 MOE 7 example: water bottle recognition
2.3.3 Visibility test
In order to measure the visibility of mobile work zones with different light configurations
without distracting the participants, a separate visibility test was conducted. Although visibility
of the work zone and arrow board could be implied from first blinker and merge distance, a
separate test was performed to capture the recognition distance directly. During this test,
participants were asked to press two buttons. The first button was pressed when the participants
realized that there was a moving work zone ahead, based on the visibility of light bar. The
second button was pressed when they could tell what direction the arrow is pointing, to test the
visibility of the arrow aboard. The simulator logged the distance measurements automatically
when participants pressed the buttons. For the visibility testing, twenty participants were invited
to drive through the four light bar configurations twice (daytime/nighttime). Two MOEs were
generated from this test as described below.
MOE 8: Work zone recognition distance (ft.). This MOE is the distance from the rear end of
the shoulder TMA when the participant first recognized the work zone. A farther distance
indicated that the work zone was more visible and could be safer because of longer reaction
times.
MOE 9: Arrow direction recognition distance (ft.). This MOE is the distance from the rear
end of the shoulder TMA when the participant first recognized the arrow direction. This
could be an indication of disability glare as well. A farther distance is desirable.
Both MOE 8 and MOE 9 were automatically recorded onto a data log when the buttons were
pushed.
2.4 Simulator results
Videos of regular trials and the disability glare test were recorded, and MOEs 1 through 7 were
extracted. Video was useful to visually confirm data accuracy and identify potential data issues.
The data for MOE 8 and MOE 9 of the visibility test were extracted from automated data files

30
because they were very straight forward and did not require visual confirmation and
interpretation.
To compare MOEs among the TMA light bar configurations, the differences between them were
calculated. Statistical analysis was performed to calculate significance, confidence level, and
effect size. A confidence level higher than 90 percent was regarded as significant in this study.
Effect size was presented as Cohen’s d value, and difference is defined to be small (effect size <
0.5), medium (effect size between 0.5 and 0.8), and large (effect size > 0.8) (Cohen 1977).
Thirty participants participated in the first part of the simulator tests and completed the trials.
However, distance data for one of the participants was lost due to a data issue. MOE 1 and MOE
2 data were not obtained for some participants because they did not flash their blinker before
they merged.
The eye tracker was utilized for 18 participants because it became available during the middle of
the simulator testing. Due to contact lens issues, some eye tracking calibrations were not
successful and eye tracking data was not collected.
The visibility test was conducted separately after the simulator trials because it would be
distracting if participants were asked to push a button when they first recognized the work zone
and arrow direction while they were driving in a normal manner. The objective for the visibility
test was to distinguish the configuration with the earliest recognition of the work zone and arrow
board. Twenty participants participated in the visibility test. Some of them were participants
from the previous simulator tests, and the others were newly recruited.
2.4.1 Daytime results
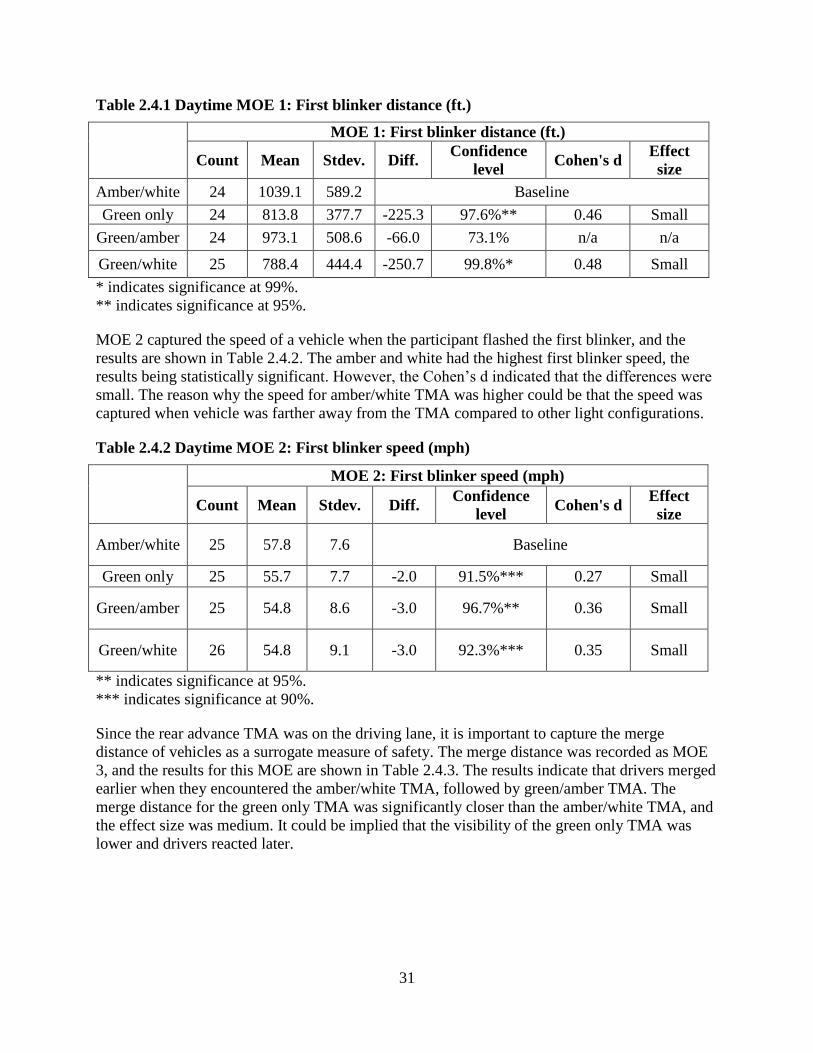
MOE 1 measured the distance of a vehicle from the rear end of the shoulder TMA when the
participant flashed the blinker for the first time. As shown in Table 2.4.1, participants reacted to
amber/white TMA the quickest among all four configurations and flashed the blinker at an
average distance of 1039.1 ft. Both the green only and green/white TMA had significantly closer
first blinker distances than the amber/white TMA, but Cohen’s d showed that the effect sizes
were small.
31
Table 2.4.1 Daytime MOE 1: First blinker distance (ft.)
MOE 1: First blinker distance (ft.)
Count Mean Stdev. Diff. Confidence
level Cohen's d
Effect
size
Amber/white 24 1039.1 589.2 Baseline
Green only 24 813.8 377.7 -225.3 97.6%** 0.46 Small
Green/amber 24 973.1 508.6 -66.0 73.1% n/a n/a
Green/white 25 788.4 444.4 -250.7 99.8%* 0.48 Small
* indicates significance at 99%.
** indicates significance at 95%.
MOE 2 captured the speed of a vehicle when the participant flashed the first blinker, and the
results are shown in Table 2.4.2. The amber and white had the highest first blinker speed, the
results being statistically significant. However, the Cohen’s d indicated that the differences were
small. The reason why the speed for amber/white TMA was higher could be that the speed was
captured when vehicle was farther away from the TMA compared to other light configurations.
Table 2.4.2 Daytime MOE 2: First blinker speed (mph)
MOE 2: First blinker speed (mph)
Count Mean Stdev. Diff. Confidence
level Cohen's d
Effect
size
Amber/white 25 57.8 7.6 Baseline
Green only 25 55.7 7.7 -2.0 91.5%*** 0.27 Small
Green/amber 25 54.8 8.6 -3.0 96.7%** 0.36 Small
Green/white 26 54.8 9.1 -3.0 92.3%*** 0.35 Small
** indicates significance at 95%.
*** indicates significance at 90%.
Since the rear advance TMA was on the driving lane, it is important to capture the merge
distance of vehicles as a surrogate measure of safety. The merge distance was recorded as MOE
3, and the results for this MOE are shown in Table 2.4.3. The results indicate that drivers merged
earlier when they encountered the amber/white TMA, followed by green/amber TMA. The
merge distance for the green only TMA was significantly closer than the amber/white TMA, and
the effect size was medium. It could be implied that the visibility of the green only TMA was
lower and drivers reacted later.

32
Table 2.4.3 Daytime MOE 3: Merge distance (ft.)
MOE 3: Merge distance (ft.)
Count Mean Stdev. Diff. Confidence
level Cohen's d
Effect
size
Amber/white 29 971.0 599.5 Baseline
Green only 29 649.0 336.6 -322.0 99.7%* 0.66 Medium
Green/amber 28 814.5 468.2 -156.5 83.2% n/a n/a
Green/white 29 750.1 643.4 -220.9 98.0%** 0.36 Small
* indicates significance at 99%.
** indicates significance at 95%.
Merge speed was recorded as well as MOE 4. Table 2.4.4 shows that the merge speed for the
amber/white TMA was higher than the other light configurations. This may be due to the farther
merge distance, while drivers had not slowed down yet.
Table 2.4.4 Daytime MOE 4: Merge speed (mph)
MOE 4: Merge speed (mph)
Count Mean Stdev. Diff. Confidence
level Cohen's d Effect size
Amber/white 30 57.4 6.5 Baseline
Green only 30 53.7 11.4 -3.7 95.1%** 0.40 Small
Green/amber 30 53.5 10.4 -3.9 96.2%** 0.45 Small
Green/white 30 53.0 8.5 -4.4 98.3%** 0.57 Medium
** indicates significance at 95%.
MOE 5 measured the speed of the vehicle when it passed the shoulder TMA. The results for this
MOE are shown in Table 2.4.5. The results show that the green only TMA had the highest
passing speed, and the green/white TMA had the lowest passing speed which is desirable.
However, the differences among all four configurations were not statistically significant.

33
Table 2.4.5 Daytime MOE 5: Speed when passing shoulder TMA (mph)
MOE 5: Speed when passing shoulder TMA (mph)
Count Mean Stdev. Diff. Confidence
level Cohen's d
Effect
size
Amber/white 30 52.3 9.4 Baseline
Green only 30 53.2 9.3 0.9 81.5% n/a n/a
Green/amber 30 52.1 9.4 -0.2 55.0% n/a n/a
Green/white 30 50.5 8.9 -1.8 87.7% n/a n/a
MOE 6 is similar to MOE 5, and it measured the vehicle speed when it passed the rear advance
TMA. The results for this MOE are shown in Table 2.4.6. The green only TMA had the highest
passing speed, and green/amber TMA had the lowest. However, the speeds for all four
configurations were close to each other, and they were not statistically significantly different
from each other.
Table 2.4.6 Daytime MOE 6: Speed when passing rear advance TMA (mph)
MOE 6: Speed when passing rear advance TMA (mph)
Count Mean Stdev. Diff. Confidence
level Cohen's d
Effect
size
Amber/white 30 51.0 8.3 Baseline
Green only 30 52.1 9.6 1.2 89.1% n/a n/a
Green/amber 30 50.6 9.6 -0.4 63.0% n/a n/a
Green/white 30 50.8 8.5 -0.2 57.3% n/a n/a
The second part of the simulator tests was the disability glare test. The eye tracker was utilized,
and results were presented as binary data to indicate whether or not the participant recognized
the water bottle. MOE 7, water bottle recognition, was the only measurement in the disability
glare test. This MOE was assessed for nighttime only because the disability glare issue was not
considered as a critical factor during daytime. Therefore, the daytime results did not contain
MOE 7. The nighttime results for this MOE are presented following the daytime results.
Table 2.4.7 shows the results of work zone recognition distance (MOE 8) in the daytime. Since
the sample size of the visibility testing was smaller than the regular simulator trials, the statistical
tests conducted were different. A Mann-Whitney test was conducted to assess the statistical
significance of the data. The Mann-Whitney test is used to assess data that is not normally
distributed by calculating average score differences and determining if difference between the
data sets is significant (De Winter and Dodou 2010). The results show that the amber/white
configuration, as the baseline in this study, had the farthest distance with a mean of 1554 ft. and
median of 1604 ft. Meanwhile, the visibility of the green only TMA was the lowest (1166 ft.)
among all configurations. However, based on the results of the Mann-Whitney test, there was no
significant difference between these four configurations.
34
Table 2.4.7 Daytime MOE 8: Work zone recognition distance (ft.)
MOE 8: Work zone recognition distance (ft.)
Count Mean Median Stdev. Diff. Confidence
Level
Amber/white 20 1554.2 1604.0 746.2 Baseline
Green only 20 1166.2 1154.5 469.6 388.0 90.9%
Green/amber 20 1292.8 1311.5 546.0 261.4 69.0%
Green/white 20 1382.6 1231.0 722.6 171.6 59.1%
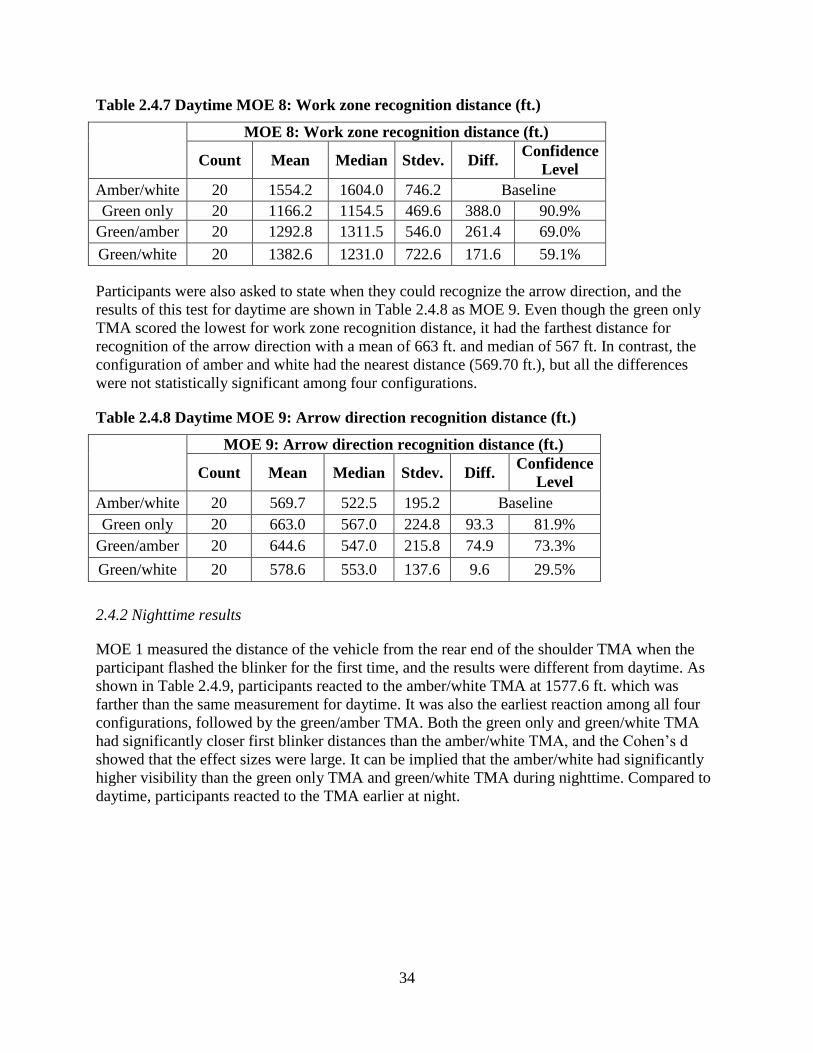
Participants were also asked to state when they could recognize the arrow direction, and the
results of this test for daytime are shown in Table 2.4.8 as MOE 9. Even though the green only
TMA scored the lowest for work zone recognition distance, it had the farthest distance for
recognition of the arrow direction with a mean of 663 ft. and median of 567 ft. In contrast, the
configuration of amber and white had the nearest distance (569.70 ft.), but all the differences
were not statistically significant among four configurations.
Table 2.4.8 Daytime MOE 9: Arrow direction recognition distance (ft.)
MOE 9: Arrow direction recognition distance (ft.)
Count Mean Median Stdev. Diff. Confidence
Level
Amber/white 20 569.7 522.5 195.2 Baseline
Green only 20 663.0 567.0 224.8 93.3 81.9%
Green/amber 20 644.6 547.0 215.8 74.9 73.3%
Green/white 20 578.6 553.0 137.6 9.6 29.5%
2.4.2 Nighttime results
MOE 1 measured the distance of the vehicle from the rear end of the shoulder TMA when the
participant flashed the blinker for the first time, and the results were different from daytime. As
shown in Table 2.4.9, participants reacted to the amber/white TMA at 1577.6 ft. which was
farther than the same measurement for daytime. It was also the earliest reaction among all four
configurations, followed by the green/amber TMA. Both the green only and green/white TMA
had significantly closer first blinker distances than the amber/white TMA, and the Cohen’s d
showed that the effect sizes were large. It can be implied that the amber/white had significantly
higher visibility than the green only TMA and green/white TMA during nighttime. Compared to
daytime, participants reacted to the TMA earlier at night.

35
Table 2.4.9 Nighttime MOE 1: First blinker distance (ft.)
MOE 1: First blinker distance (ft.)
Count Mean Stdev. Diff. Confidence
level Cohen's d
Effect
size
Amber/white 24 1577.6 748.1 Baseline
Green only 23 869.1 389.7 -708.5 100.0%* 1.19 Large
Green/amber 23 1483.0 1218.3 -94.6 66.0% n/a n/a
Green/white 23 887.3 462.8 -690.3 100.0%* 1.11 Large
* indicates significance at 99%.
MOE 2 captured the speed of the vehicle when the participant flashed the first blinker, and the
results are shown in Table 2.4.10. The overall speed at first blinker at nighttime was higher than
daytime. This higher speed may have occurred because the vehicle was located farther away
from the work zone. However, although the first blinker distance of the amber/white TMA was
the farthest, the speed was not the highest. This result may indicate that amber/white caught
drivers’ attention and alerted them. The green only TMA had a slightly lower first blinker speed,
but the difference was not significant.
Table 2.4.10 Nighttime MOE 2: First blinker speed (mph)
MOE 2: First blinker speed (mph)
Count Mean Stdev. Diff. Confidence
level Cohen's d
Effect
size
Amber/white 25 58.3 5.9 Baseline
Green only 24 57.4 5.6 -0.9 82.7% n/a n/a
Green/amber 24 59.5 5.5 1.2 77.8% n/a n/a
Green/white 24 59.6 4.2 1.3 85.0% n/a n/a
The merge distances at nighttime are shown in Table 2.4.11. The results indicate that drivers
merged earlier when they encountered the amber/white TMA and green/amber TMA. Both the
green only TMA and green/white TMA had significantly closer merge distances, and the effect
sizes were large and medium correspondingly. Similar to the first blinker distance, drivers
reacted to TMAs earlier during nighttime and merged earlier.

36
Table 2.4.11 Nighttime MOE 3: Merge distance (ft.)
MOE 3: Merge distance (ft.)
Count Mean Stdev. Diff. Confidence
level Cohen's d
Effect
size
Amber/white 29 1309.4 762.3 Baseline
Green only 29 706.5 398.1 -602.9 100.0%* 0.99 Large
Green/amber 29 1288.7 1134.5 -20.8 56.1% n/a n/a
Green/white 29 851.9 603.6 -457.5 99.8%* 0.67 Medium
* indicates significance at 99%.
Merge speed at nighttime was slightly higher than at daytime, a result which may be due to
farther merge distance at nighttime. As shown in Table 2.4.12, the green only TMA and
amber/white TMA had slower merge speeds than the other two configurations. However, the
differences were not significant. With regard to the merge distance and speed, the green/white
TMA did not perform as well as the other three configurations, and this was consistent with the
results from first blinker distance and speed.
Table 2.4.12 Nighttime MOE 4: Merge speed (mph)
MOE 4: Merge speed (mph)
Count Mean Stdev. Diff. Confidence
level Cohen's d
Effect
size
Amber/white 30 57.3 6.6 Baseline
Green only 30 56.0 6.2 -1.2 82.3% n/a n/a
Green/amber 30 57.9 5.7 0.6 66.0% n/a n/a
Green/white 30 58.2 4.5 0.9 77.2% n/a n/a
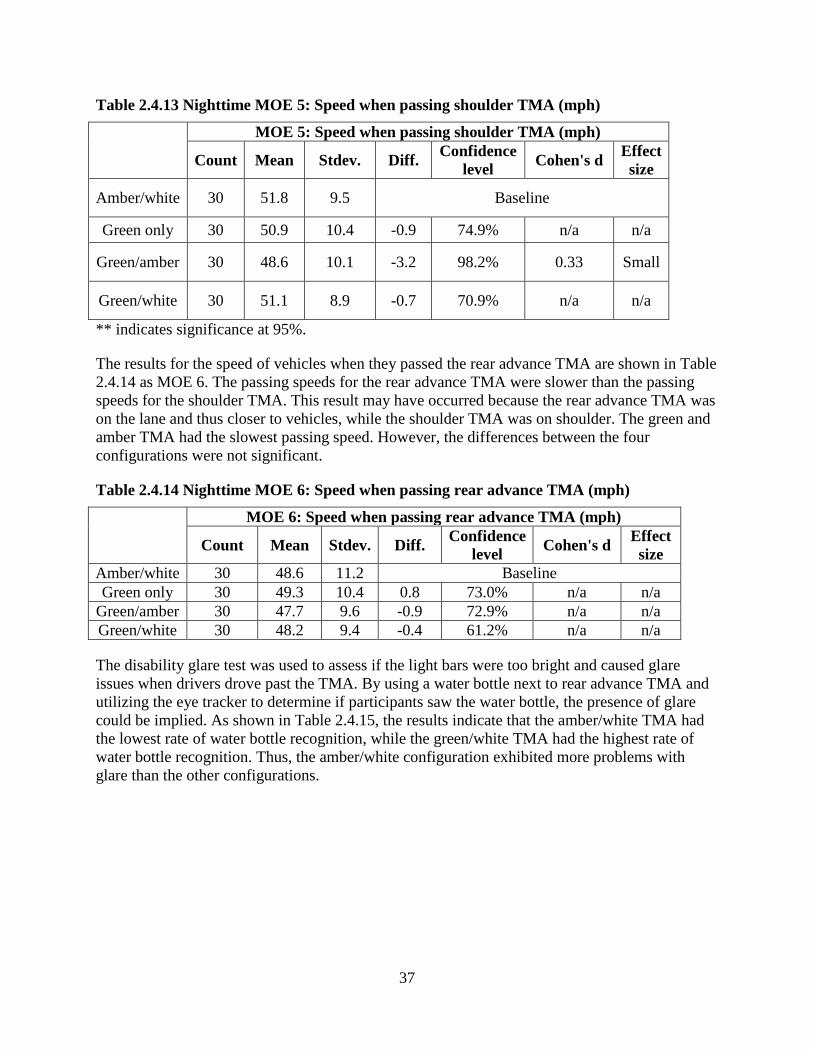
MOE 5 was the measurement of speed when the vehicle drove past the shoulder TMA. The
results of MOE 5 are shown in Table 2.4.13. It shows that the green/amber TMA may have
caught drivers’ attention the most, as it had the lowest speed, and the speed was statistically
significantly slower than the speed under the baseline configuration. The speed for the
amber/white TMA was the highest. This result may be due to the discomfort brought by the
brightness of the amber and white light bars.
37
Table 2.4.13 Nighttime MOE 5: Speed when passing shoulder TMA (mph)
MOE 5: Speed when passing shoulder TMA (mph)
Count Mean Stdev. Diff. Confidence
level Cohen's d
Effect
size
Amber/white 30 51.8 9.5 Baseline
Green only 30 50.9 10.4 -0.9 74.9% n/a n/a
Green/amber 30 48.6 10.1 -3.2 98.2% 0.33 Small
Green/white 30 51.1 8.9 -0.7 70.9% n/a n/a
** indicates significance at 95%.
The results for the speed of vehicles when they passed the rear advance TMA are shown in Table
2.4.14 as MOE 6. The passing speeds for the rear advance TMA were slower than the passing
speeds for the shoulder TMA. This result may have occurred because the rear advance TMA was
on the lane and thus closer to vehicles, while the shoulder TMA was on shoulder. The green and
amber TMA had the slowest passing speed. However, the differences between the four
configurations were not significant.
Table 2.4.14 Nighttime MOE 6: Speed when passing rear advance TMA (mph)
MOE 6: Speed when passing rear advance TMA (mph)
Count Mean Stdev. Diff. Confidence
level Cohen's d
Effect
size
Amber/white 30 48.6 11.2 Baseline
Green only 30 49.3 10.4 0.8 73.0% n/a n/a
Green/amber 30 47.7 9.6 -0.9 72.9% n/a n/a
Green/white 30 48.2 9.4 -0.4 61.2% n/a n/a
The disability glare test was used to assess if the light bars were too bright and caused glare
issues when drivers drove past the TMA. By using a water bottle next to rear advance TMA and
utilizing the eye tracker to determine if participants saw the water bottle, the presence of glare
could be implied. As shown in Table 2.4.15, the results indicate that the amber/white TMA had
the lowest rate of water bottle recognition, while the green/white TMA had the highest rate of
water bottle recognition. Thus, the amber/white configuration exhibited more problems with
glare than the other configurations.
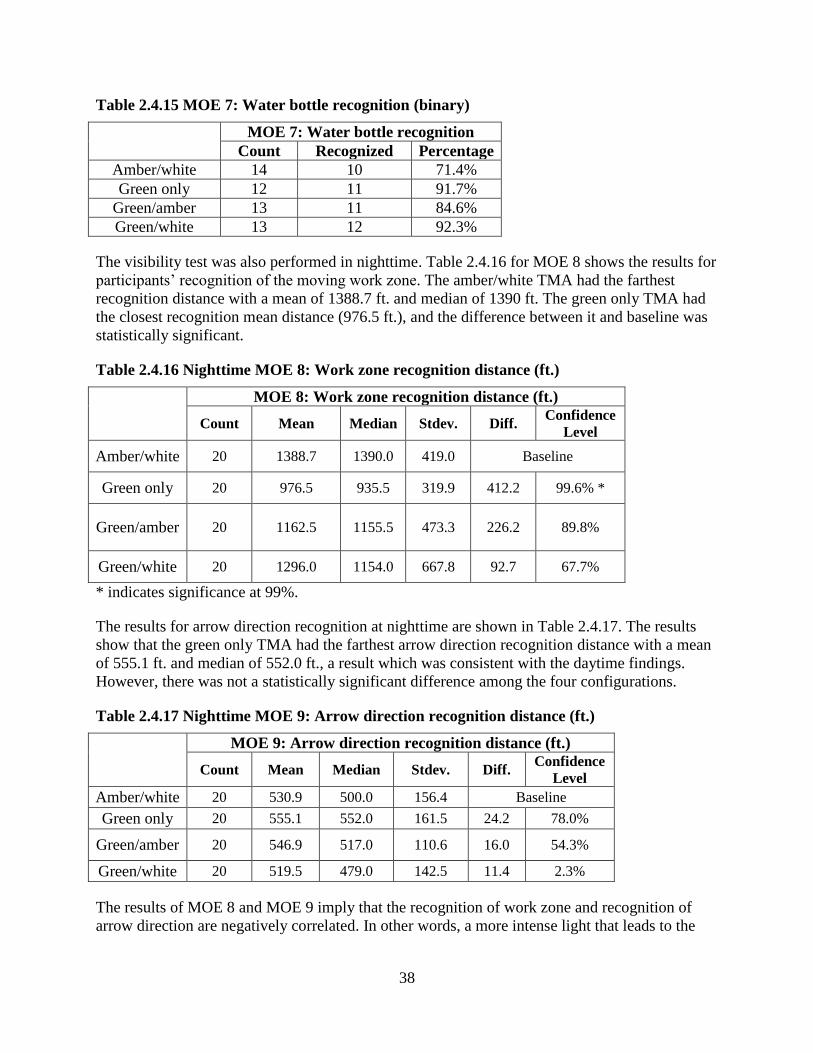
38
Table 2.4.15 MOE 7: Water bottle recognition (binary)
MOE 7: Water bottle recognition
Count Recognized Percentage
Amber/white 14 10 71.4%
Green only 12 11 91.7%
Green/amber 13 11 84.6%
Green/white 13 12 92.3%
The visibility test was also performed in nighttime. Table 2.4.16 for MOE 8 shows the results for
participants’ recognition of the moving work zone. The amber/white TMA had the farthest
recognition distance with a mean of 1388.7 ft. and median of 1390 ft. The green only TMA had
the closest recognition mean distance (976.5 ft.), and the difference between it and baseline was
statistically significant.
Table 2.4.16 Nighttime MOE 8: Work zone recognition distance (ft.)
MOE 8: Work zone recognition distance (ft.)
Count Mean Median Stdev. Diff. Confidence
Level
Amber/white 20 1388.7 1390.0 419.0 Baseline
Green only 20 976.5 935.5 319.9 412.2 99.6% *
Green/amber 20 1162.5 1155.5 473.3 226.2 89.8%
Green/white 20 1296.0 1154.0 667.8 92.7 67.7%
* indicates significance at 99%.
The results for arrow direction recognition at nighttime are shown in Table 2.4.17. The results
show that the green only TMA had the farthest arrow direction recognition distance with a mean
of 555.1 ft. and median of 552.0 ft., a result which was consistent with the daytime findings.
However, there was not a statistically significant difference among the four configurations.
Table 2.4.17 Nighttime MOE 9: Arrow direction recognition distance (ft.)
MOE 9: Arrow direction recognition distance (ft.)
Count Mean Median Stdev. Diff. Confidence
Level
Amber/white 20 530.9 500.0 156.4 Baseline
Green only 20 555.1 552.0 161.5 24.2 78.0%
Green/amber 20 546.9 517.0 110.6 16.0 54.3%
Green/white 20 519.5 479.0 142.5 11.4 2.3%
The results of MOE 8 and MOE 9 imply that the recognition of work zone and recognition of
arrow direction are negatively correlated. In other words, a more intense light that leads to the

39
earlier recognition of the mobile work zone also means that there is greater disability glare and a
later recognition of the arrow direction.
The overall simulator test results indicate that amber/white TMA had the highest visibility of
work zone, but the lowest visibility of arrow board. The green only TMA had the lowest
visibility of work zone, but the highest visibility of arrow board. The tradeoff between work zone
visibility and arrow board visibility is an important consideration.
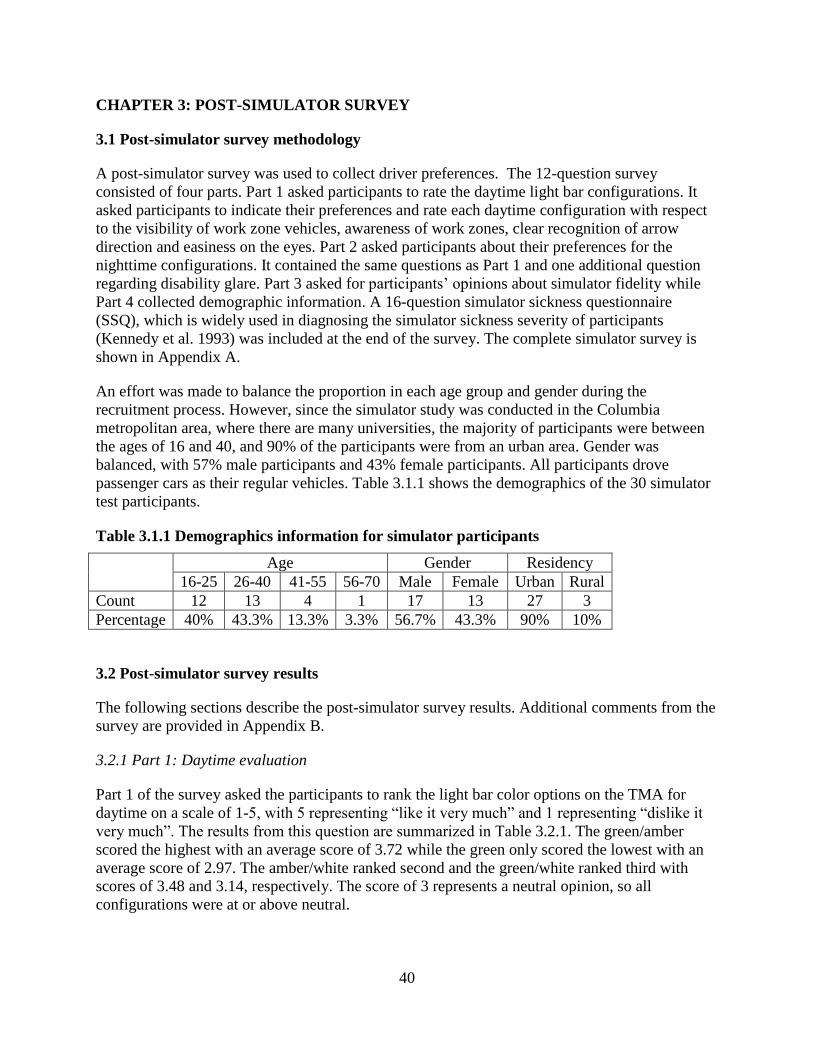
40
CHAPTER 3: POST-SIMULATOR SURVEY
3.1 Post-simulator survey methodology
A post-simulator survey was used to collect driver preferences. The 12-question survey
consisted of four parts. Part 1 asked participants to rate the daytime light bar configurations. It
asked participants to indicate their preferences and rate each daytime configuration with respect
to the visibility of work zone vehicles, awareness of work zones, clear recognition of arrow
direction and easiness on the eyes. Part 2 asked participants about their preferences for the
nighttime configurations. It contained the same questions as Part 1 and one additional question
regarding disability glare. Part 3 asked for participants’ opinions about simulator fidelity while
Part 4 collected demographic information. A 16-question simulator sickness questionnaire
(SSQ), which is widely used in diagnosing the simulator sickness severity of participants
(Kennedy et al. 1993) was included at the end of the survey. The complete simulator survey is
shown in Appendix A.
An effort was made to balance the proportion in each age group and gender during the
recruitment process. However, since the simulator study was conducted in the Columbia
metropolitan area, where there are many universities, the majority of participants were between
the ages of 16 and 40, and 90% of the participants were from an urban area. Gender was
balanced, with 57% male participants and 43% female participants. All participants drove
passenger cars as their regular vehicles. Table 3.1.1 shows the demographics of the 30 simulator
test participants.
Table 3.1.1 Demographics information for simulator participants
Age Gender Residency
16-25 26-40 41-55 56-70 Male Female Urban Rural
Count 12 13 4 1 17 13 27 3
Percentage 40% 43.3% 13.3% 3.3% 56.7% 43.3% 90% 10%
3.2 Post-simulator survey results
The following sections describe the post-simulator survey results. Additional comments from the
survey are provided in Appendix B.
3.2.1 Part 1: Daytime evaluation
Part 1 of the survey asked the participants to rank the light bar color options on the TMA for
daytime on a scale of 1-5, with 5 representing “like it very much” and 1 representing “dislike it
very much”. The results from this question are summarized in Table 3.2.1. The green/amber
scored the highest with an average score of 3.72 while the green only scored the lowest with an
average score of 2.97. The amber/white ranked second and the green/white ranked third with
scores of 3.48 and 3.14, respectively. The score of 3 represents a neutral opinion, so all
configurations were at or above neutral.

41
Table 3.2.1 Daytime TMA configurations preference
Average score Rank
Amber/white 3.48/5 2
Green only 2.97/5 4
Green/amber 3.72/5 1
Green/white 3.14/5 3
Based on the preference results, a Friedman rank test was carried out to see if there were
differences in preference based on TMA configurations. As shown in Table 3.2.2, although the
average scores were different in each configuration, the non-parametric test shows that rank
differences among TMA configurations were not statistically significant.
Table 3.2.2 Friedman test: Rank vs. TMA configurations blocked by participants
S = 6.03 DF = 3 P = 0.110 (adjusted for ties)
TMA Configurations N Est. Median Sum of Ranks
Amber/white 29 2.1 69.5
Green only 29 3.1 82.5
Green/amber 29 1.9 61
Green/white 29 2.9 77
After the preference question, the participants were asked to score different attributes of the
various TMA configurations during the daytime on a scale of 1-10, with 1 representing the
“lowest” and 10 representing the “highest”. These attributes included visibility of work zone
vehicles, awareness of work zones, clear recognition of arrow direction, and easiness on the eyes.
Table 3.2.3 shows the results of ratings. The amber/white, as the baseline, scored the highest for
visibility and awareness of work zones. However, the amber/white TMA scored the lowest in the
clear recognition of the arrow direction and easy on the eyes attributes. The green only TMA
scored lowest in the visibility and awareness of work zones and scored the highest in the clear
recognition of the arrow direction and easy on the eyes attributes. The green/amber and the
green/white TMAs scored second and third in all categories respectively. The confidence level
for the range of differences was set to be 95 percent in this study based on the Mann-Whitney
test. The results show that the amber/white TMA only had a significantly lower score in one
category, easy on the eyes, with scoring on average being 5.55, while the green only and
green/amber TMAs scored on average 8.62 and 8.07, respectively.
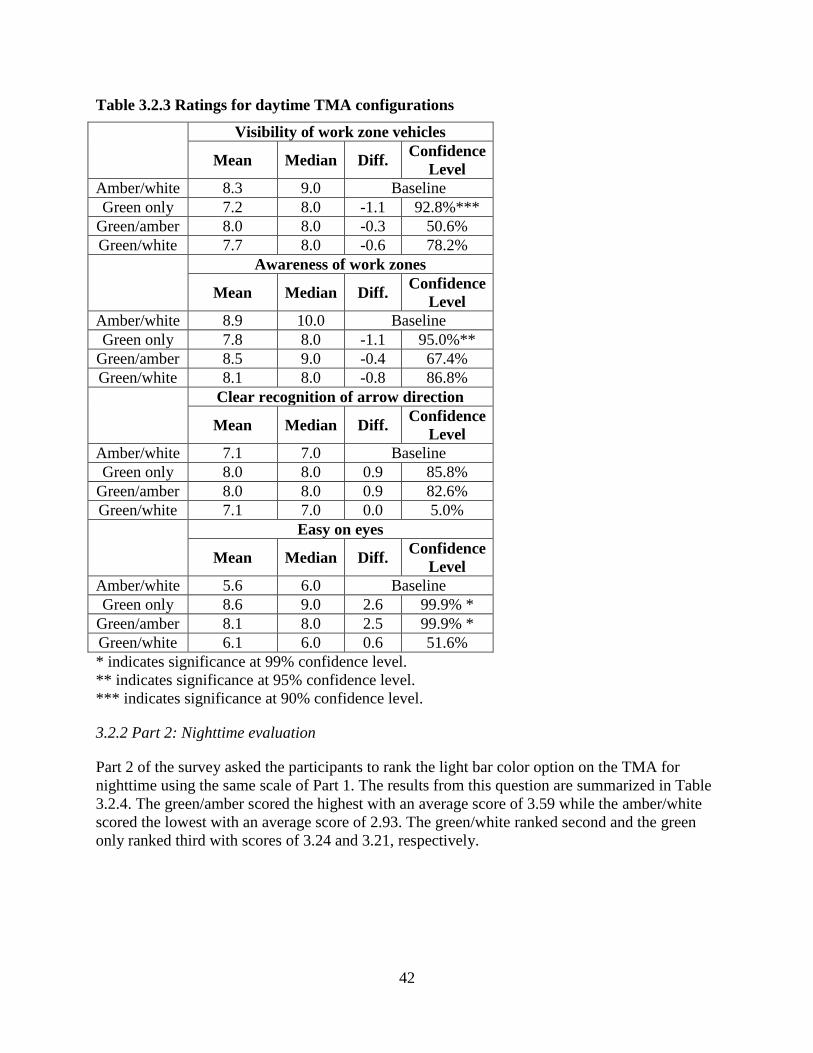
42
Table 3.2.3 Ratings for daytime TMA configurations
Visibility of work zone vehicles
Mean Median Diff. Confidence
Level
Amber/white 8.3 9.0 Baseline
Green only 7.2 8.0 -1.1 92.8%***
Green/amber 8.0 8.0 -0.3 50.6%
Green/white 7.7 8.0 -0.6 78.2%
Awareness of work zones
Mean Median Diff. Confidence
Level
Amber/white 8.9 10.0 Baseline
Green only 7.8 8.0 -1.1 95.0%**
Green/amber 8.5 9.0 -0.4 67.4%
Green/white 8.1 8.0 -0.8 86.8%
Clear recognition of arrow direction
Mean Median Diff. Confidence
Level
Amber/white 7.1 7.0 Baseline
Green only 8.0 8.0 0.9 85.8%
Green/amber 8.0 8.0 0.9 82.6%
Green/white 7.1 7.0 0.0 5.0%
Easy on eyes
Mean Median Diff. Confidence
Level
Amber/white 5.6 6.0 Baseline
Green only 8.6 9.0 2.6 99.9% *
Green/amber 8.1 8.0 2.5 99.9% *
Green/white 6.1 6.0 0.6 51.6%
* indicates significance at 99% confidence level.
** indicates significance at 95% confidence level.
*** indicates significance at 90% confidence level.
3.2.2 Part 2: Nighttime evaluation
Part 2 of the survey asked the participants to rank the light bar color option on the TMA for
nighttime using the same scale of Part 1. The results from this question are summarized in Table
3.2.4. The green/amber scored the highest with an average score of 3.59 while the amber/white
scored the lowest with an average score of 2.93. The green/white ranked second and the green
only ranked third with scores of 3.24 and 3.21, respectively.
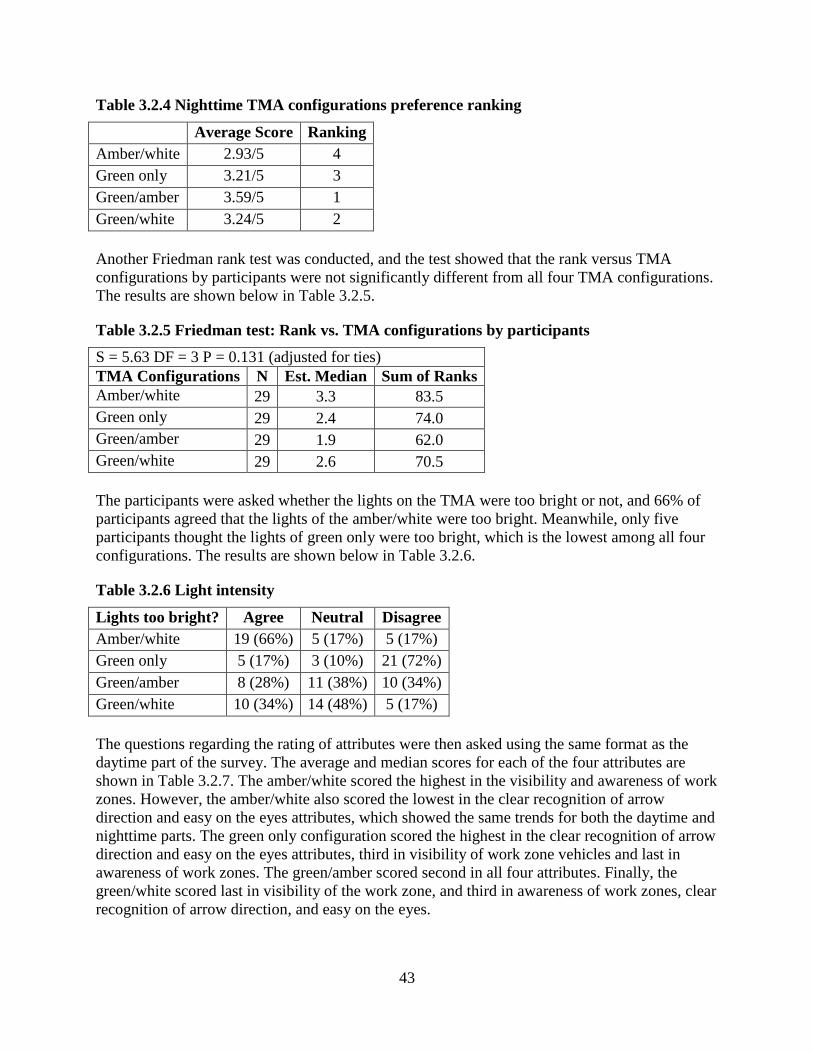
43
Table 3.2.4 Nighttime TMA configurations preference ranking
Average Score Ranking
Amber/white 2.93/5 4
Green only 3.21/5 3
Green/amber 3.59/5 1
Green/white 3.24/5 2
Another Friedman rank test was conducted, and the test showed that the rank versus TMA
configurations by participants were not significantly different from all four TMA configurations.
The results are shown below in Table 3.2.5.
Table 3.2.5 Friedman test: Rank vs. TMA configurations by participants
S = 5.63 DF = 3 P = 0.131 (adjusted for ties)
TMA Configurations N Est. Median Sum of Ranks
Amber/white 29 3.3 83.5
Green only 29 2.4 74.0
Green/amber 29 1.9 62.0
Green/white 29 2.6 70.5
The participants were asked whether the lights on the TMA were too bright or not, and 66% of
participants agreed that the lights of the amber/white were too bright. Meanwhile, only five
participants thought the lights of green only were too bright, which is the lowest among all four
configurations. The results are shown below in Table 3.2.6.
Table 3.2.6 Light intensity
Lights too bright? Agree Neutral Disagree
Amber/white 19 (66%) 5 (17%) 5 (17%)
Green only 5 (17%) 3 (10%) 21 (72%)
Green/amber 8 (28%) 11 (38%) 10 (34%)
Green/white 10 (34%) 14 (48%) 5 (17%)
The questions regarding the rating of attributes were then asked using the same format as the
daytime part of the survey. The average and median scores for each of the four attributes are
shown in Table 3.2.7. The amber/white scored the highest in the visibility and awareness of work
zones. However, the amber/white also scored the lowest in the clear recognition of arrow
direction and easy on the eyes attributes, which showed the same trends for both the daytime and
nighttime parts. The green only configuration scored the highest in the clear recognition of arrow
direction and easy on the eyes attributes, third in visibility of work zone vehicles and last in
awareness of work zones. The green/amber scored second in all four attributes. Finally, the
green/white scored last in visibility of the work zone, and third in awareness of work zones, clear
recognition of arrow direction, and easy on the eyes.
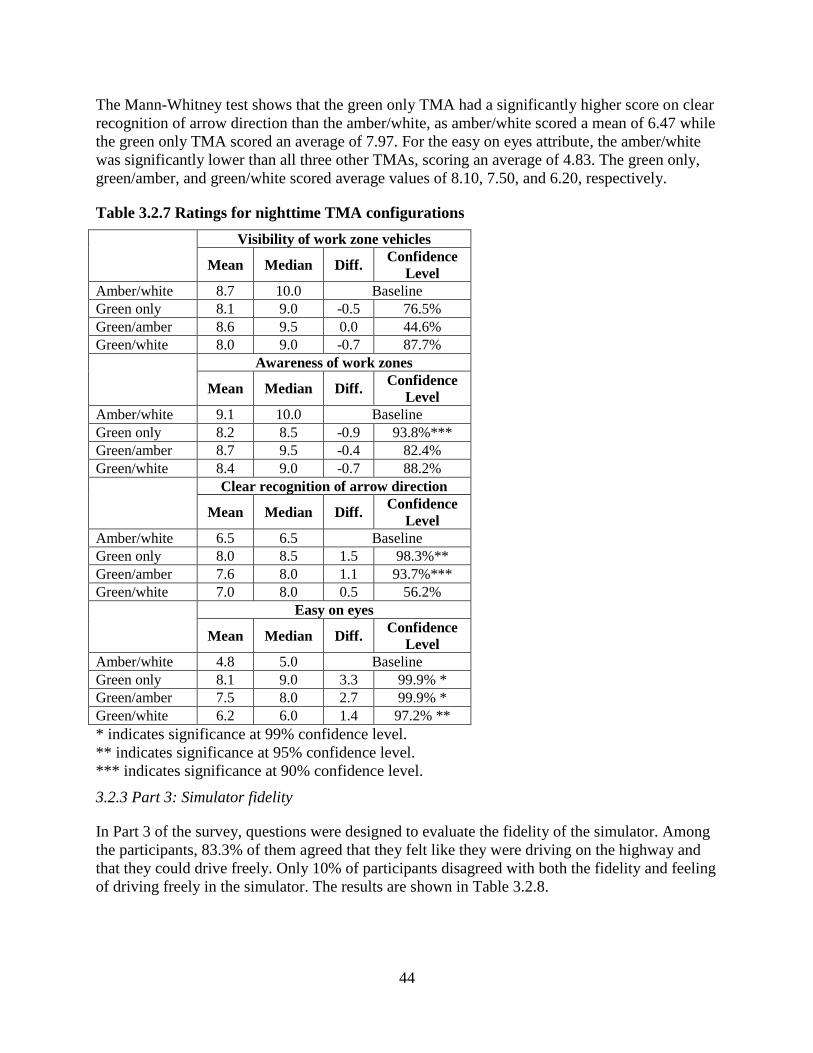
44
The Mann-Whitney test shows that the green only TMA had a significantly higher score on clear
recognition of arrow direction than the amber/white, as amber/white scored a mean of 6.47 while
the green only TMA scored an average of 7.97. For the easy on eyes attribute, the amber/white
was significantly lower than all three other TMAs, scoring an average of 4.83. The green only,
green/amber, and green/white scored average values of 8.10, 7.50, and 6.20, respectively.
Table 3.2.7 Ratings for nighttime TMA configurations
* indicates significance at 99% confidence level.
** indicates significance at 95% confidence level.
*** indicates significance at 90% confidence level.
3.2.3 Part 3: Simulator fidelity
In Part 3 of the survey, questions were designed to evaluate the fidelity of the simulator. Among
the participants, 83.3% of them agreed that they felt like they were driving on the highway and
that they could drive freely. Only 10% of participants disagreed with both the fidelity and feeling
of driving freely in the simulator. The results are shown in Table 3.2.8.
Visibility of work zone vehicles
Mean Median Diff. Confidence
Level
Amber/white 8.7 10.0 Baseline
Green only 8.1 9.0 -0.5 76.5%
Green/amber 8.6 9.5 0.0 44.6%
Green/white 8.0 9.0 -0.7 87.7%
Awareness of work zones
Mean Median Diff. Confidence
Level
Amber/white 9.1 10.0 Baseline
Green only 8.2 8.5 -0.9 93.8%***
Green/amber 8.7 9.5 -0.4 82.4%
Green/white 8.4 9.0 -0.7 88.2%
Clear recognition of arrow direction
Mean Median Diff. Confidence
Level
Amber/white 6.5 6.5 Baseline
Green only 8.0 8.5 1.5 98.3%**
Green/amber 7.6 8.0 1.1 93.7%***
Green/white 7.0 8.0 0.5 56.2%
Easy on eyes
Mean Median Diff. Confidence
Level
Amber/white 4.8 5.0 Baseline
Green only 8.1 9.0 3.3 99.9% *
Green/amber 7.5 8.0 2.7 99.9% *
Green/white 6.2 6.0 1.4 97.2% **

45
Table 3.2.8 Simulator fidelity
Fidelity of highway Drive freely
Count Percentage Count Percentage
Strongly Agree 9 30% 83.3%
9 30% 83.3%
Agree 16 53.3% 16 53.3%
Neutral 2 6.7% 6.7% 2 6.7% 6.7%
Disagree 2 6.7% 10%
3 10% 10%
Strongly Disagree 1 3.3% 0 0%
3.2.4 Simulator sickness questionnaire (SSQ) results
The post-simulator survey was followed by a 16-question SSQ, to assess motion sickness of
participants after the simulator experiment. The results are shown in Table 3.2.9. Most
participants felt no or slight discomfort, and only five out of 30 participants had moderate or
severe symptoms.
Table 3.2.9 Summary of SSQ Results
General discomfort Fatigue Headache Eye strain
count pct. count pct. count pct. count pct.
None 24 80% 27 90% 24 80% 16 53.3%
Slight 6 20% 1 3.3% 6 20% 11 36.7%
Moderate 0 0% 2 6.7% 0 0% 3 10%
Severe 0 0% 0 0% 0 0% 0 0%
Difficulty focusing
Salivation
increasing Sweating Nausea
count pct. count pct. count pct. count pct.
None 26 86.7% 29 96.7% 28 93.3% 25 83.3%
Slight 4 13.3% 1 3.3% 2 6.7% 4 13.3%
Moderate 0 0% 0 0% 0 0% 0 0%
Severe 0 0% 0 0% 0 0% 1 3.3%
Difficulty
concentrating
Fullness of the
Head Blurred vision
Dizziness with eyes
open
count pct. count pct. count pct. count pct.
None 29 96.7% 22 73.3% 28 93.3% 26 86.7%
Slight 1 3.3% 8 26.7% 2 6.7% 3 10%
Moderate 0 0% 0 0% 0 0% 1 3.3%
Severe 0 0% 0 0% 0 0% 0 0%
Dizziness with eye
closed Vertigo
Stomach
awareness Burping
count pct. count pct. count pct. count pct.
None 28 93.3% 29 96.7% 29 96.7% 30 100%
Slight 2 6.7% 1 3.3% 1 3.3% 0 0%
Moderate 0 0% 0 0% 1 3.3% 0 0%
Severe 0 0% 0 0% 0 0% 0 0%

46
3.2.5 Summary of post-simulator survey results
The overall post-simulator survey results indicate that amber/white TMA was too bright and not
easy on eyes, and the visibility of the green only TMA was too low. On the other hand, the
results indicate that the green only TMA allowed clear recognition of the arrow direction and
was easy on eyes. Green/amber scored in between amber/white and green only and was preferred
in both daytime and nighttime scenarios.
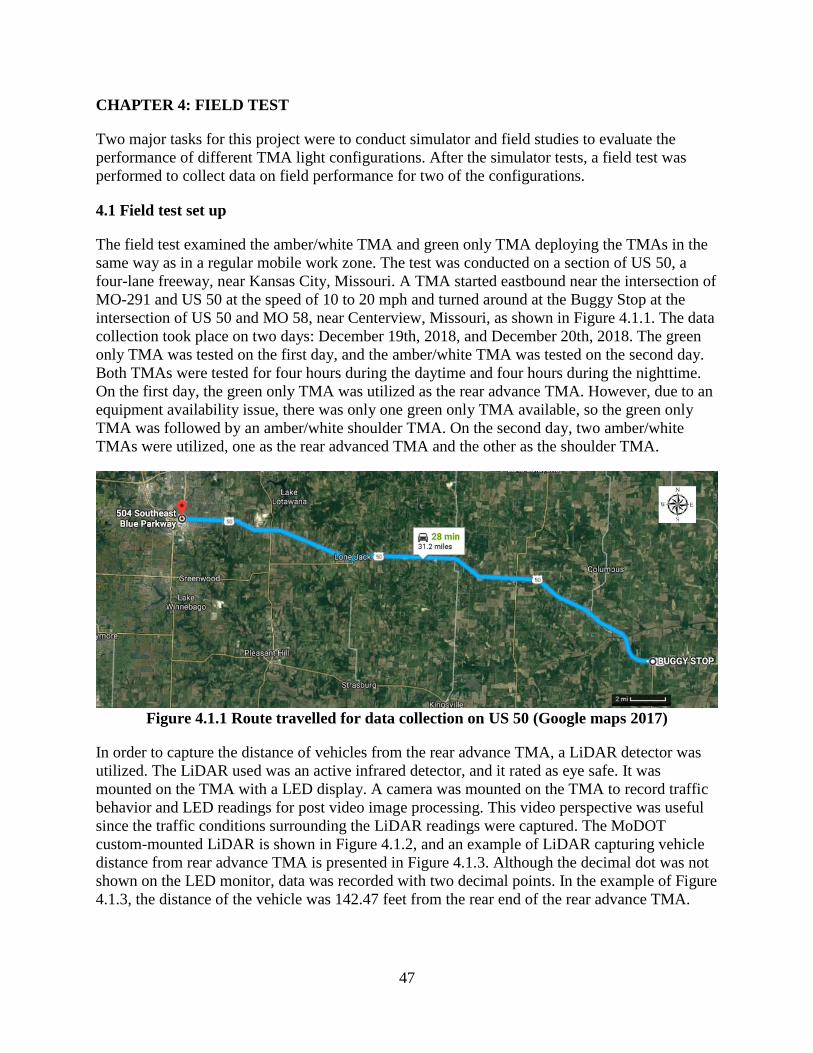
47
CHAPTER 4: FIELD TEST
Two major tasks for this project were to conduct simulator and field studies to evaluate the
performance of different TMA light configurations. After the simulator tests, a field test was
performed to collect data on field performance for two of the configurations.
4.1 Field test set up
The field test examined the amber/white TMA and green only TMA deploying the TMAs in the
same way as in a regular mobile work zone. The test was conducted on a section of US 50, a
four-lane freeway, near Kansas City, Missouri. A TMA started eastbound near the intersection of
MO-291 and US 50 at the speed of 10 to 20 mph and turned around at the Buggy Stop at the
intersection of US 50 and MO 58, near Centerview, Missouri, as shown in Figure 4.1.1. The data
collection took place on two days: December 19th, 2018, and December 20th, 2018. The green
only TMA was tested on the first day, and the amber/white TMA was tested on the second day.
Both TMAs were tested for four hours during the daytime and four hours during the nighttime.
On the first day, the green only TMA was utilized as the rear advance TMA. However, due to an
equipment availability issue, there was only one green only TMA available, so the green only
TMA was followed by an amber/white shoulder TMA. On the second day, two amber/white
TMAs were utilized, one as the rear advanced TMA and the other as the shoulder TMA.
Figure 4.1.1 Route travelled for data collection on US 50 (Google maps 2017)
In order to capture the distance of vehicles from the rear advance TMA, a LiDAR detector was
utilized. The LiDAR used was an active infrared detector, and it rated as eye safe. It was
mounted on the TMA with a LED display. A camera was mounted on the TMA to record traffic
behavior and LED readings for post video image processing. This video perspective was useful
since the traffic conditions surrounding the LiDAR readings were captured. The MoDOT
custom-mounted LiDAR is shown in Figure 4.1.2, and an example of LiDAR capturing vehicle
distance from rear advance TMA is presented in Figure 4.1.3. Although the decimal dot was not
shown on the LED monitor, data was recorded with two decimal points. In the example of Figure
4.1.3, the distance of the vehicle was 142.47 feet from the rear end of the rear advance TMA.
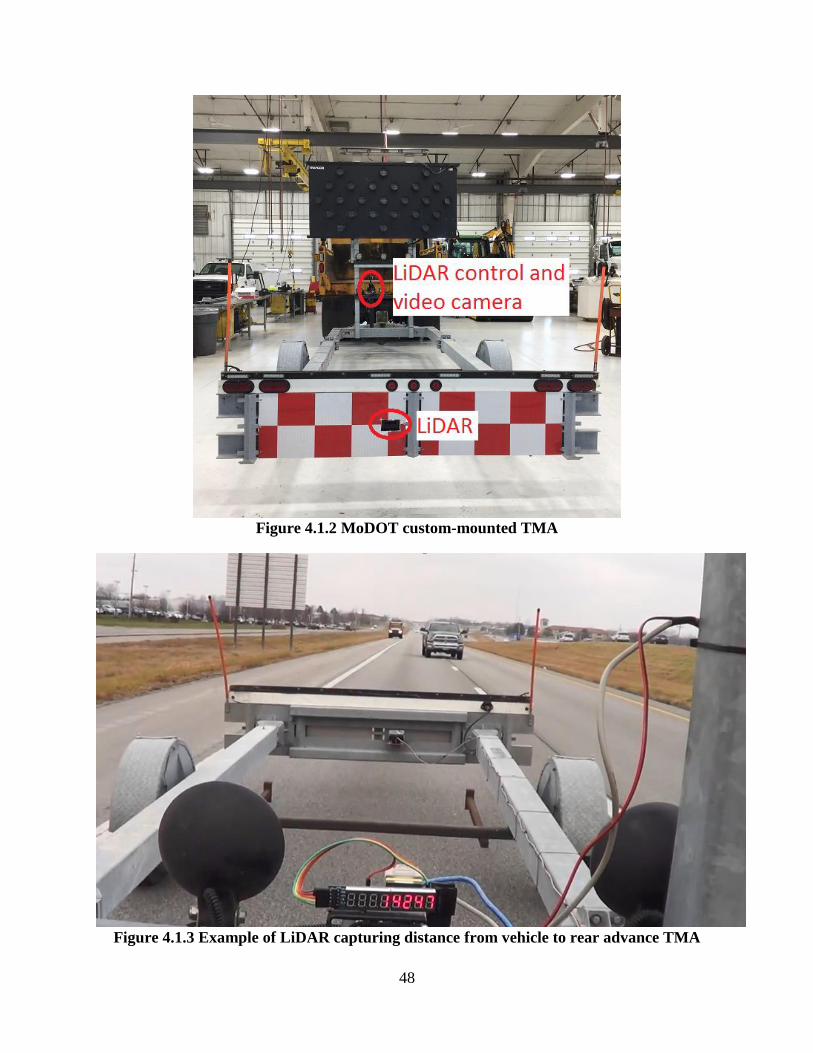
48
Figure 4.1.2 MoDOT custom-mounted TMA
Figure 4.1.3 Example of LiDAR capturing distance from vehicle to rear advance TMA

49
4.2 Video image processing methodology
After the field study was completed, videos recorded from the field were reviewed by the team to
extract data. Video recording started when the TMAs departed the garage, but the data was not
valid until TMAs started to operate as a mobile work zone. Within the valid data collecting time
period, 4,966 vehicles passed through the mobile work zone, and 2,589 of them were platoon
leaders. There were 2,756 instances in which the LiDAR captured distance measurements to
various objects behind it, such as vehicles in the travel lanes, roadside barriers, or the shoulder
TMA. The general information from the data collection is shown in Table 4.2.1.
Table 4.2.1 General information
19th daytime
(green only)
19th nighttime
(green only)
20th daytime
(amber/white)
20th nighttime
(amber/white)
Total vehicles
counted 1079 787 1918 1182
Total vehicles
shown on right
lane within field
of view
58 4 78 12
Vehicles merged
after passing
shoulder TMA
2 2 1 3
The speed of vehicles when they passed the rear advance TMA was the only measurement of
effectiveness processed in the field study. Vehicle speeds were derived from videos using
photogrammetry. This technique allows the derivation of speeds of any vehicles when driving
past a TMA, in contrast to speed radars which typically track vehicles only within a limited
distance or angle. When a vehicle approached the rear advance TMA and passed a beginning
dash line selected by the analyst, the time stamp was recorded as T1, as shown in Figure 4.2.1.
Then the analyst selected an end dash line (say the fifth dash), and when the vehicle passed the
end dash line, the time stamp was recorded, as T2, as shown in Figure 4.2.2. The number of dash
lines used varied from two to five, depending on visibility due to geometry and nighttime
lighting conditions. The distance travelled was 40 feet multiplied by the number of dashes
traveled, and the travel time was T2 minus T1. From the travel distance and travel time, the
vehicle speed was calculated. This technique was validated by computing the speed several times
using different number of dash lines; the results were consistently the same regardless of the
number of dashes used.
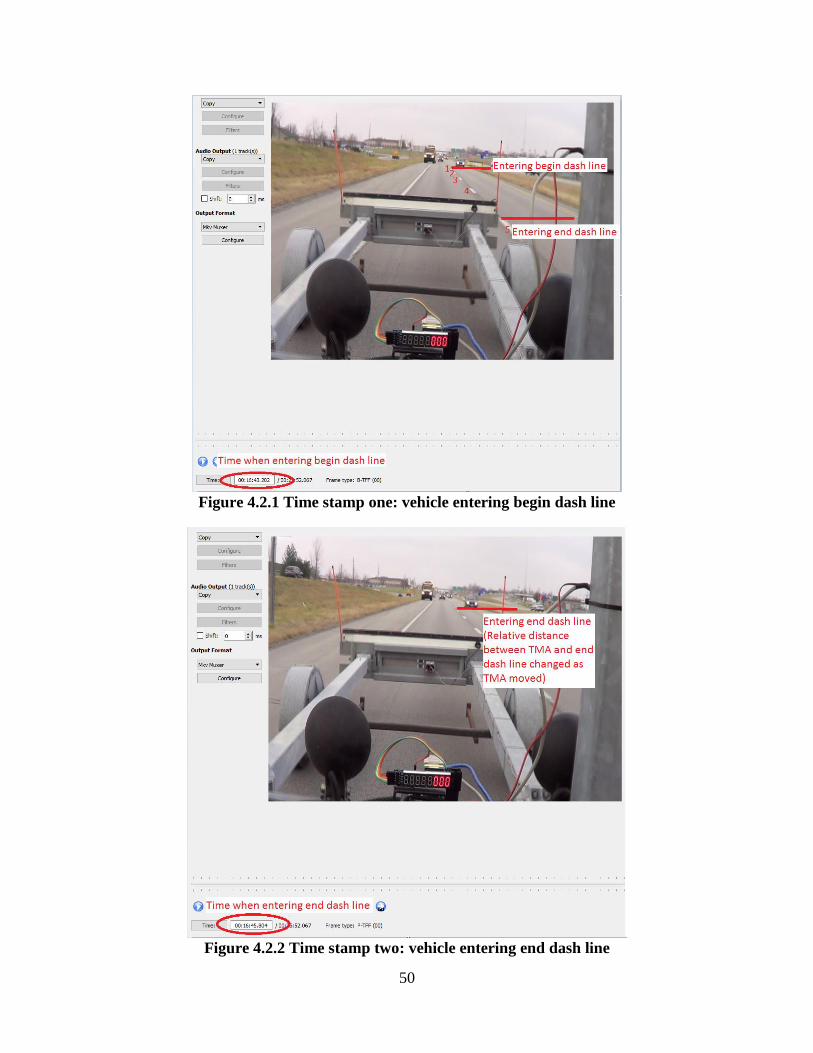
50
Figure 4.2.1 Time stamp one: vehicle entering begin dash line
Figure 4.2.2 Time stamp two: vehicle entering end dash line
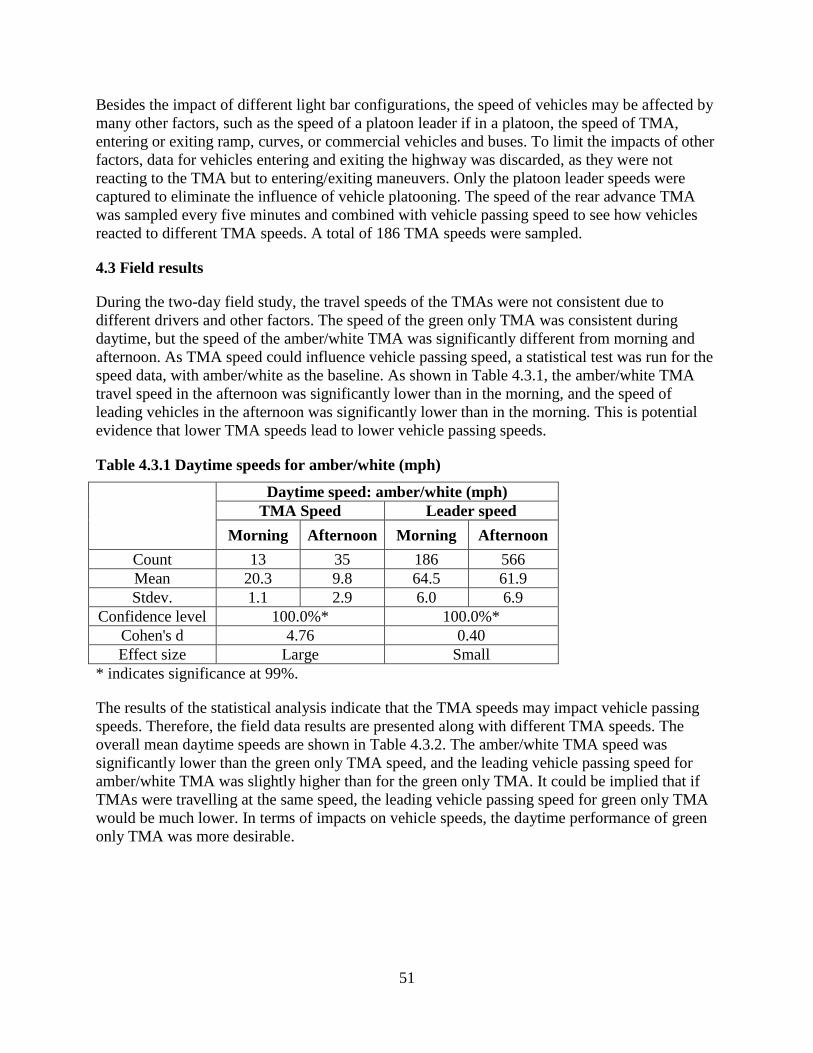
51
Besides the impact of different light bar configurations, the speed of vehicles may be affected by
many other factors, such as the speed of a platoon leader if in a platoon, the speed of TMA,
entering or exiting ramp, curves, or commercial vehicles and buses. To limit the impacts of other
factors, data for vehicles entering and exiting the highway was discarded, as they were not
reacting to the TMA but to entering/exiting maneuvers. Only the platoon leader speeds were
captured to eliminate the influence of vehicle platooning. The speed of the rear advance TMA
was sampled every five minutes and combined with vehicle passing speed to see how vehicles
reacted to different TMA speeds. A total of 186 TMA speeds were sampled.
4.3 Field results
During the two-day field study, the travel speeds of the TMAs were not consistent due to
different drivers and other factors. The speed of the green only TMA was consistent during
daytime, but the speed of the amber/white TMA was significantly different from morning and
afternoon. As TMA speed could influence vehicle passing speed, a statistical test was run for the
speed data, with amber/white as the baseline. As shown in Table 4.3.1, the amber/white TMA
travel speed in the afternoon was significantly lower than in the morning, and the speed of
leading vehicles in the afternoon was significantly lower than in the morning. This is potential
evidence that lower TMA speeds lead to lower vehicle passing speeds.
Table 4.3.1 Daytime speeds for amber/white (mph)
Daytime speed: amber/white (mph)
TMA Speed Leader speed
Morning Afternoon Morning Afternoon
Count 13 35 186 566
Mean 20.3 9.8 64.5 61.9
Stdev. 1.1 2.9 6.0 6.9
Confidence level 100.0%* 100.0%*
Cohen's d 4.76 0.40
Effect size Large Small
* indicates significance at 99%.
The results of the statistical analysis indicate that the TMA speeds may impact vehicle passing
speeds. Therefore, the field data results are presented along with different TMA speeds. The
overall mean daytime speeds are shown in Table 4.3.2. The amber/white TMA speed was
significantly lower than the green only TMA speed, and the leading vehicle passing speed for
amber/white TMA was slightly higher than for the green only TMA. It could be implied that if
TMAs were travelling at the same speed, the leading vehicle passing speed for green only TMA
would be much lower. In terms of impacts on vehicle speeds, the daytime performance of green
only TMA was more desirable.

52
Table 4.3.2 Mean daytime speed (mph)
Mean daytime speed (mph)
TMA Speed Leader speed
green
only amber/white
green
only amber/white
Count 45 48 702 752
Mean 19.0 12.6 62.5 62.6
Stdev. 1.6 5.4 6.1 6.7
Confidence level 100.0%* 52.0%
Cohen's d 1.67 n/a
Effect size Large n/a
* indicates significance at 99%.
In order to test if drivers behaved similarly under comparable TMA speeds, another statistical
test was performed to compare the green only daytime data and amber/white morning data. The
average morning amber/white TMA speed was 20.3 mph which was close to the green only
TMA speed of 19 mph. The results are shown in Table 4.3.3. Although the speed of leading
vehicles for green only TMA was slower, the speed of green only TMA was slightly slower than
amber/white as well.
Table 4.3.3 Mean speed: green only daytime vs. amber/white morning (mph)
Mean speed: green only daytime vs. amber/white morning (mph)
TMA Speed (mph) Leader speed
green only
daytime
amber/white
morning
green only
daytime
amber/white
morning
Count 45 13 702 186
Mean 19.0 20.3 62.5 64.5
Stdev. 1.6 1.1 6.1 6.0
Confidence level 99.8%* 100.0%*
Cohen's d 0.90 0.32
Effect size Large Small
* indicates significance at 99%.
During nighttime, even though the green only TMA travelled at a significantly higher speed than
amber/white TMA, the vehicle passing speed for green only TMA was slightly lower, as shown
in Table 4.3.4. The results show that green only TMA performed better than amber/white TMA
during nighttime.

53
Table 4.3.4 Mean nighttime speed (mph)
Mean nighttime speed (mph)
TMA speed Leader speed
green only amber/white green only amber/white
Count 45 48 504 631
Mean 22.2 12.6 52.1 52.9
Stdev. 2.7 1.2 8.4 7.9
Confidence level 100.0%* 94.6%***
Cohen's d 4.60 0.10
Effect size Large Small
* indicates significance at 99%.
*** indicates significance at 90%.
For the same TMA configuration, driver behavior in daytime and nighttime was different. As
shown in Table 4.3.5, even though the green only TMA travelled faster during nighttime, the
vehicle passing speed was significantly slower during nighttime.
Table 4.3.5 Green only speed: daytime vs. nighttime (mph)
Mean speed for green only (mph)
TMA Speed Leader speed
Daytime Nighttime Daytime Nighttime
Count 45 45 752 504
Mean 19.0 22.2 62.6 52.1
Stdev. 1.6 2.7 6.7 8.4
Confidence level 100.0%* 100.0%*
Cohen's d 1.43 1.36
Effect size Large Large
* indicates significance at 99%.
The mean speeds of amber/white were similar for daytime and nighttime. As shown in Table
4.3.6, under the same TMA speeds, drivers tended to slow down during nighttime, and the
passing speed at nighttime was significantly slower than daytime by almost 10 mph.
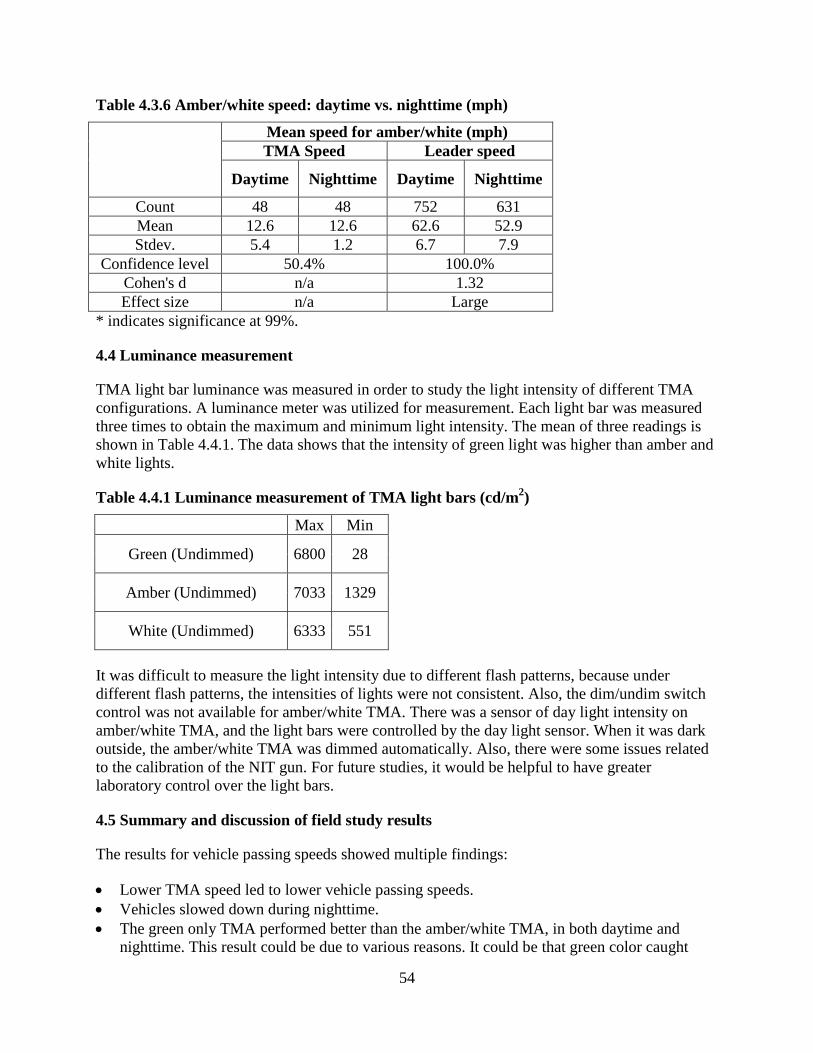
54
Table 4.3.6 Amber/white speed: daytime vs. nighttime (mph)
Mean speed for amber/white (mph)
TMA Speed Leader speed
Daytime Nighttime Daytime Nighttime
Count 48 48 752 631
Mean 12.6 12.6 62.6 52.9
Stdev. 5.4 1.2 6.7 7.9
Confidence level 50.4% 100.0%
Cohen's d n/a 1.32
Effect size n/a Large
* indicates significance at 99%.
4.4 Luminance measurement
TMA light bar luminance was measured in order to study the light intensity of different TMA
configurations. A luminance meter was utilized for measurement. Each light bar was measured
three times to obtain the maximum and minimum light intensity. The mean of three readings is
shown in Table 4.4.1. The data shows that the intensity of green light was higher than amber and
white lights.
Table 4.4.1 Luminance measurement of TMA light bars (cd/m2)
Max Min
Green (Undimmed) 6800 28
Amber (Undimmed) 7033 1329
White (Undimmed) 6333 551
It was difficult to measure the light intensity due to different flash patterns, because under
different flash patterns, the intensities of lights were not consistent. Also, the dim/undim switch
control was not available for amber/white TMA. There was a sensor of day light intensity on
amber/white TMA, and the light bars were controlled by the day light sensor. When it was dark
outside, the amber/white TMA was dimmed automatically. Also, there were some issues related
to the calibration of the NIT gun. For future studies, it would be helpful to have greater
laboratory control over the light bars.
4.5 Summary and discussion of field study results
The results for vehicle passing speeds showed multiple findings:
Lower TMA speed led to lower vehicle passing speeds.
Vehicles slowed down during nighttime.
The green only TMA performed better than the amber/white TMA, in both daytime and
nighttime. This result could be due to various reasons. It could be that green color caught
55
people’s eyes better, or it could be the novelty effect of the green only TMA.
The field study results should be viewed with some considerations in mind. As the green color
was deployed for the first time on work vehicles in Missouri, the novelty effect of green light
TMAs may have impacted the results. Once drivers become familiar with green light TMAs, the
performance of the configuration may be different. The results may vary in a different state, and
the novelty effect of green lights should be examined in a study of longer duration. The field test
was conducted during winter, and the green color stood out from the background of road. It is
unclear if the effect of green light will be the same during spring and summer because of the lack
of contrast due to green foliage.
Due to the limited availability of green only TMAs, the shoulder TMA was amber/white instead
of green during the green only data collection. Since drivers passed the shoulder TMA first, they
may have reacted to the amber/white shoulder TMA instead of the green only rear advance
TMA. Because the TMA speeds were not consistent between the baseline and green only TMA,
it was challenging to determine the magnitude of the effects caused by TMA speeds and light
color configurations.
The field study attempted to record merge distance as one critical measurement from the
perspective of collision prevention. However, most of the vehicles did not merge near TMAs,
and only 8 out of 4,966 vehicles merged to the passing lane after bypassing the shoulder TMA;
most merged upstream of the shoulder TMA.

56
CHAPTER 5: CONCLUSIONS
The simulator tests and post-simulator survey indicated that the amber/white TMA had the
highest work zone visibility but lowest arrow recognition, and the green only TMA had the
reverse effect. An inverse relationship between visibility/awareness of work zone and arrow
board recognition/easy on eyes was derived from the results. This is consistent with literature,
such as the NCHRP study on warning lights on roadway maintenance vehicles (Gibbons 2008).
The green/amber TMA light configuration performed roughly between the two aforementioned
configurations.
The field test results showed that lower TMA speeds led to lower vehicle passing speeds. In
addition, the green light TMA performed better than the amber/white TMA, as the overall
passing speed for the green only TMA was significantly lower. It was also found that drivers
slowed down significantly during nighttime. The results from simulator study and field tests
were complementary to each other, and all four configurations appear to be viable although none
is clearly superior.
The study made several original and significant contributions to the body of existing knowledge
regarding the use of green lights on work vehicles. This was the first study to quantitatively
assess the use of green lights on work vehicles in the United States. In addition, the Missouri
testing was the first on TMAs; DOT implementations have currently been limited to snow
removal vehicles. The study included both simulator and field testing. The driving simulator
allowed for multiple configurations to be tested efficiently in a controlled environment.
Implementation of an eye tracker in the disability glare test provided for the tracking of human
eye movement to determine if a specific object was recognized. The field study yielded data
regarding vehicle speeds in a real-world implementation of green lights on TMAs.
The results of this project could be enhanced in many ways. Deploying a green only shoulder
TMA to accompany the green only rear advance TMA would help to ensure that only the green
light configuration was seen. Other configurations, such as green/amber could be tested in the
field. The TMAs should be driven at the same speed to control for the effects of TMA speed on
traffic speed. An additional study of longer duration could be undertaken to assess any possible
novelty effects. A field evaluation during spring or summer could help to determine if there are
any seasonal effects due to foliage color.
The study represented an effort to try and improve work zone visibility. Enhancing mobile work
zone visibility with low cost countermeasures can help provide warning to drivers of the work
zone and improve safety for both drivers and the work crew. Mobile work zone safety can be
improved by other complementary measures, such as 1) better public education on texting and
driving, especially near work zones; 2) exploration of other warning systems such as audio alerts
in addition to visual cues; 3) working with connected autonomous vehicle industry to develop
new technologies that could automatically recognize mobile work zones in the future.

57
REFERENCES
AASHTO (2009). "Guidelines for the Selection and Application of Warning Lights on Roadway
Operations Equipment."Washington, D.C.
AASHTO (2013). "A Policy on Geometric Design of Highways and Streets."
Cohen, J. (1977). "Statistical power analysis for the behavioural sciences (Revised edition)."
New York, 7.
Cook, S., Quigley, C., and Clift, L. (2000). "Motor vehicle and pedal cycle conspicuity: part 3-
vehicle mounted warning beacons. Summary report."
Cottrell Jr, B. H. (2015). "Investigation of Truck Mounted Attenuator (TMA) Crashes in Work
Zones in Virginia."
FHWA (2009). "Manual on Uniform Traffic Control Devices for Streets and Highways." F. H.
Administration, ed.Washington, D.C.
Gibbons, R. B. (2008). Selection and Application of Warning Lights on Roadway Operations
Equipment, Transportation Research Board.
Howell, B. K., Pigman, J. G., and Agent, K. R. (2015). "Work Vehicle Warning Lights: Color
Options and Effectiveness."
Kennedy, R. S., Lane, N. E., Berbaum, K. S., and Lilienthal, M. G. (1993). "Simulator sickness
questionnaire: An enhanced method for quantifying simulator sickness." The
international journal of aviation psychology, 3(3), 203-220.
MoDOT (2018). "Centerline and/or Laneline Striping on Multi-lane, Undivided Highways -
MT." 616.8.35a (TA-35a), MoDOT, ed.
ODOT (2013). "ODOT's New Colored Light Combinations on Snow Removal Equipment."
<http://www.dot.state.oh.us/Services/Pages/New-Colored-Light-Combinations-on-Snow-
Removal-Equipment.aspx>.
Perreault, W. D. (1975). "Controlling order-effect bias." The Public Opinion Quarterly, 39(4),
544-551.
Ullman, G. L., and Lewis, D. (1998). "Texas DOT vehicle fleet warning light policy research."
The 12th Equipment Management Workshop, 22.
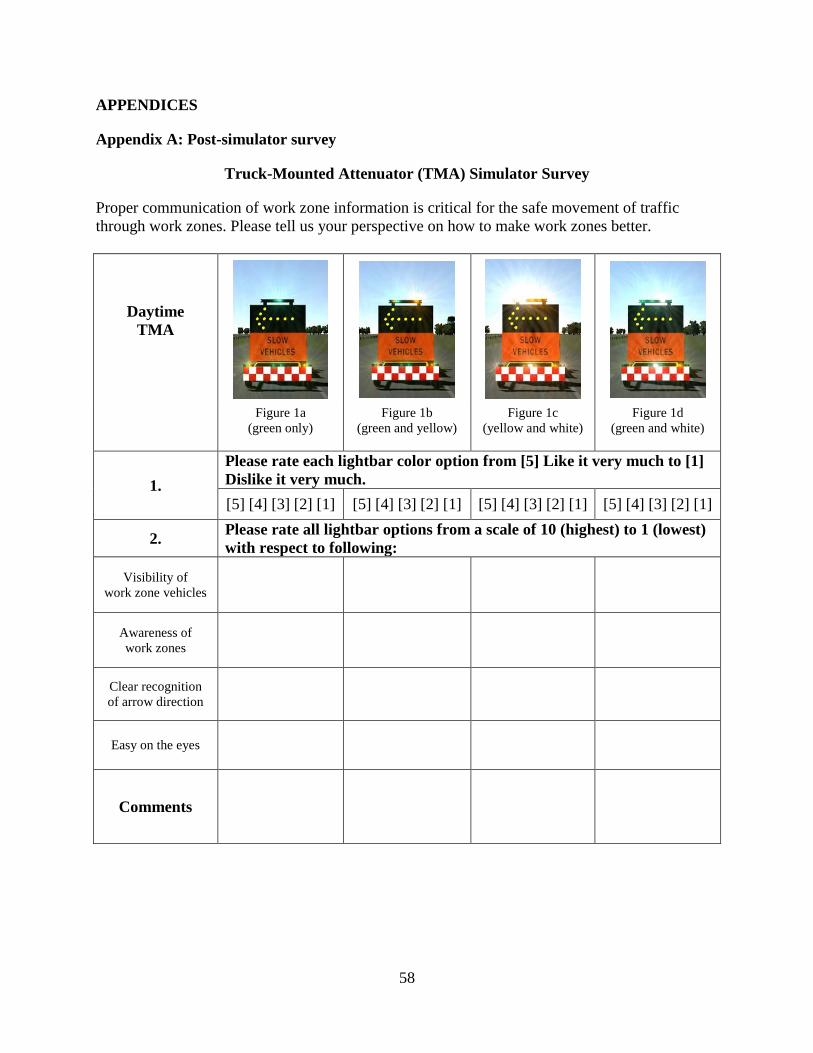
58
APPENDICES
Appendix A: Post-simulator survey
Truck-Mounted Attenuator (TMA) Simulator Survey
Proper communication of work zone information is critical for the safe movement of traffic
through work zones. Please tell us your perspective on how to make work zones better.
Daytime
TMA
Figure 1a
(green only)
Figure 1b
(green and yellow)
Figure 1c
(yellow and white)
Figure 1d
(green and white)
1.
Please rate each lightbar color option from [5] Like it very much to [1]
Dislike it very much.
[5] [4] [3] [2] [1] [5] [4] [3] [2] [1] [5] [4] [3] [2] [1] [5] [4] [3] [2] [1]
2. Please rate all lightbar options from a scale of 10 (highest) to 1 (lowest)
with respect to following:
Visibility of
work zone vehicles
Awareness of
work zones
Clear recognition
of arrow direction
Easy on the eyes
Comments
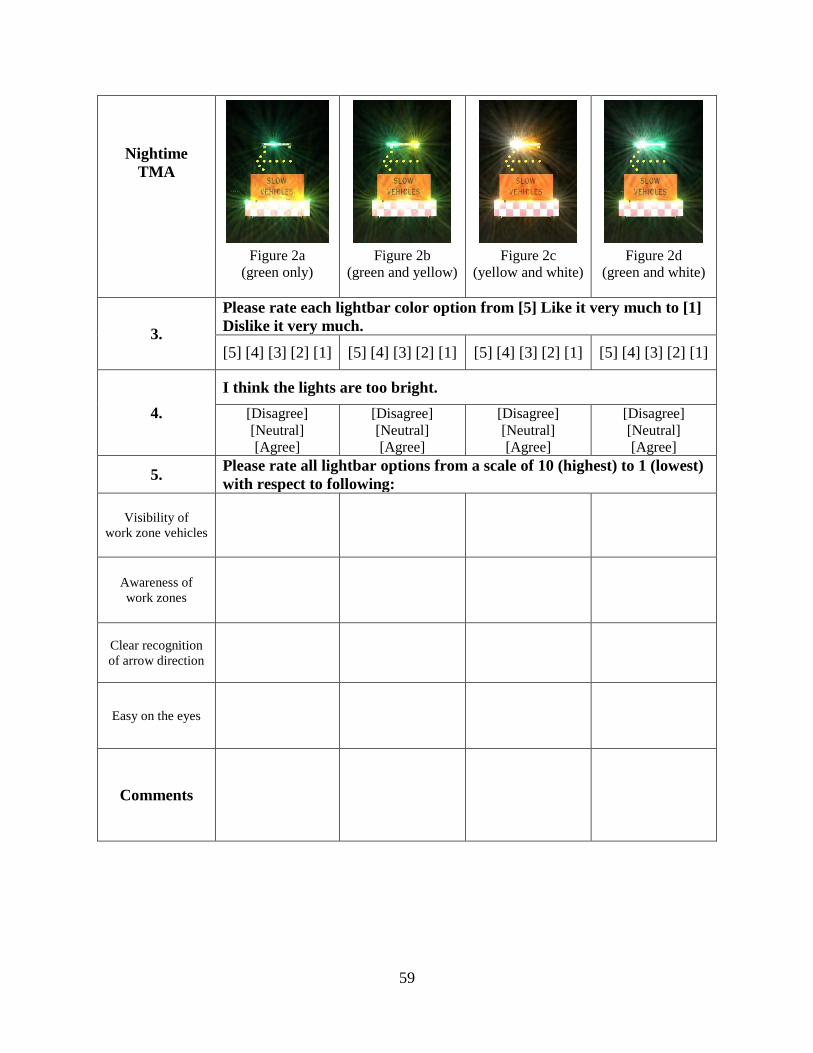
59
Nightime
TMA
Figure 2a
(green only)
Figure 2b
(green and yellow)
Figure 2c
(yellow and white)
Figure 2d
(green and white)
3.
Please rate each lightbar color option from [5] Like it very much to [1]
Dislike it very much.
[5] [4] [3] [2] [1] [5] [4] [3] [2] [1] [5] [4] [3] [2] [1] [5] [4] [3] [2] [1]
4.
I think the lights are too bright.
[Disagree]
[Neutral]
[Agree]
[Disagree]
[Neutral]
[Agree]
[Disagree]
[Neutral]
[Agree]
[Disagree]
[Neutral]
[Agree]
5. Please rate all lightbar options from a scale of 10 (highest) to 1 (lowest)
with respect to following:
Visibility of
work zone vehicles
Awareness of
work zones
Clear recognition
of arrow direction
Easy on the eyes
Comments
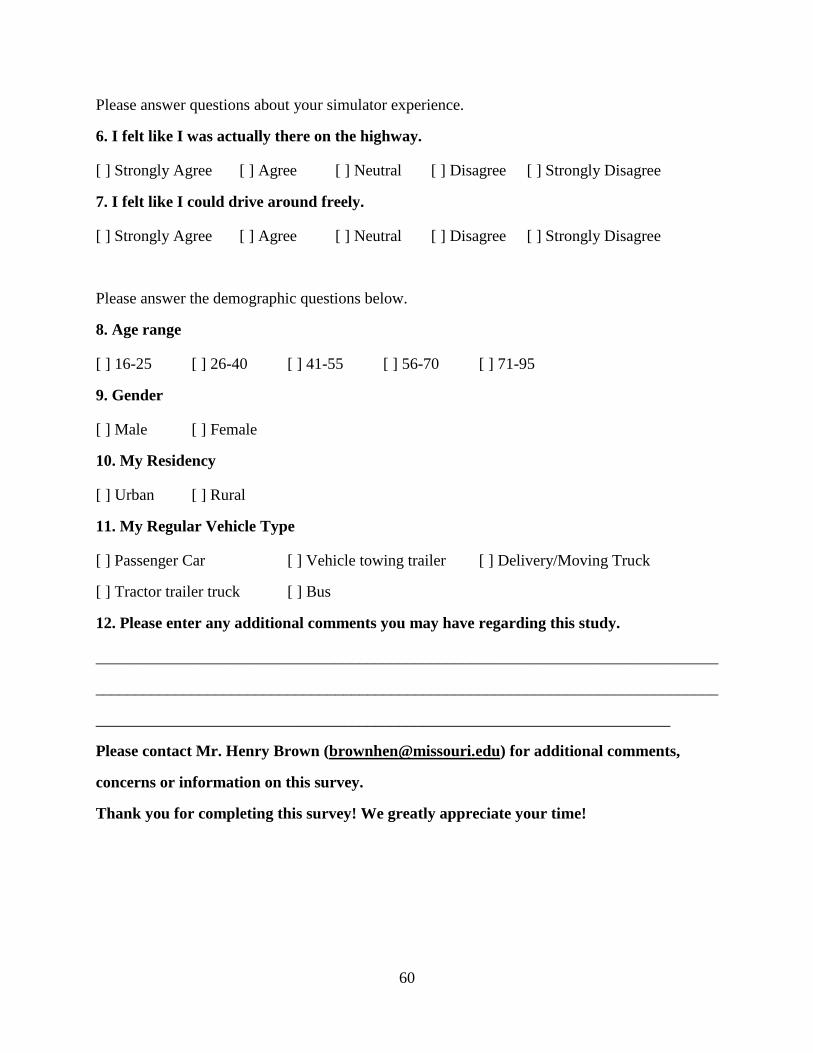
60
Please answer questions about your simulator experience.
6. I felt like I was actually there on the highway.
[ ] Strongly Agree [ ] Agree [ ] Neutral [ ] Disagree [ ] Strongly Disagree
7. I felt like I could drive around freely.
[ ] Strongly Agree [ ] Agree [ ] Neutral [ ] Disagree [ ] Strongly Disagree
Please answer the demographic questions below.
8. Age range
[ ] 16-25 [ ] 26-40 [ ] 41-55 [ ] 56-70 [ ] 71-95
9. Gender
[ ] Male [ ] Female
10. My Residency
[ ] Urban [ ] Rural
11. My Regular Vehicle Type
[ ] Passenger Car [ ] Vehicle towing trailer [ ] Delivery/Moving Truck
[ ] Tractor trailer truck [ ] Bus
12. Please enter any additional comments you may have regarding this study.
______________________________________________________________________________
______________________________________________________________________________
________________________________________________________________________
Please contact Mr. Henry Brown ([email protected]) for additional comments,
concerns or information on this survey.
Thank you for completing this survey! We greatly appreciate your time!

61
Simulator Sickness Questionnaire
Instructions: Circle how much each symptom below is affecting you right now.
1. General discomfort None Slight Moderate Severe
2. Fatigue None Slight Moderate Severe
3. Headache None Slight Moderate Severe
4. Eye strain None Slight Moderate Severe
5. Difficult focusing None Slight Moderate Severe
6. Salivation increasing None Slight Moderate Severe
7. Sweating None Slight Moderate Severe
8. Nausea None Slight Moderate Severe
9. Difficulty concentrating None Slight Moderate Severe
10. Fullness of the Head None Slight Moderate Severe
11. Blurred vision None Slight Moderate Severe
12. Dizziness with eyes open None Slight Moderate Severe
13. Dizziness with eyes closed None Slight Moderate Severe
14. *Vertigo None Slight Moderate Severe
15. **Stomach awareness None Slight Moderate Severe
16. Burping None Slight Moderate Severe
* Vertigo is experienced as loss of orientation with respect to vertical upright.
** Stomach awareness is usually used to indicate a feeling of discomfort which is just short of
nausea.
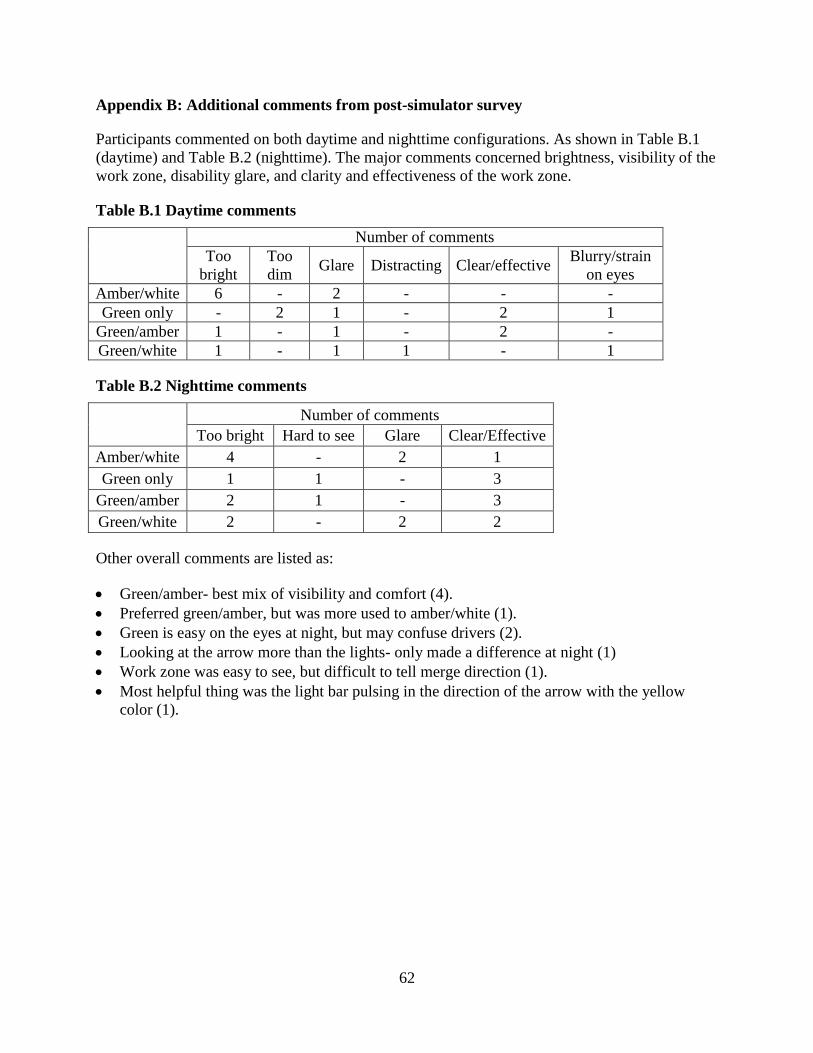
62
Appendix B: Additional comments from post-simulator survey
Participants commented on both daytime and nighttime configurations. As shown in Table B.1
(daytime) and Table B.2 (nighttime). The major comments concerned brightness, visibility of the
work zone, disability glare, and clarity and effectiveness of the work zone.
Table B.1 Daytime comments
Number of comments
Too
bright
Too
dim Glare Distracting Clear/effective
Blurry/strain
on eyes
Amber/white 6 - 2 - - -
Green only - 2 1 - 2 1
Green/amber 1 - 1 - 2 -
Green/white 1 - 1 1 - 1
Table B.2 Nighttime comments
Number of comments
Too bright Hard to see Glare Clear/Effective
Amber/white 4 - 2 1
Green only 1 1 - 3
Green/amber 2 1 - 3
Green/white 2 - 2 2
Other overall comments are listed as:
Green/amber- best mix of visibility and comfort (4).
Preferred green/amber, but was more used to amber/white (1).
Green is easy on the eyes at night, but may confuse drivers (2).
Looking at the arrow more than the lights- only made a difference at night (1)
Work zone was easy to see, but difficult to tell merge direction (1).
Most helpful thing was the light bar pulsing in the direction of the arrow with the yellow
color (1).