Embed Size (px)
Citation preview
EVALUATION OF
EMERGENCY PLANT PATHOGEN SURVEILLANCE
AND SURVEILLANCE METHODS
FOR DEMONSTRATING PEST FREEDOM
IN WESTERN AUSTRALIA
Presented by
Nichole Elana Burges Hammond
Bachelor of Science (Biotechnology),
Bachelor of Science Honours (Biological Sciences)
This thesis is presented for the degree of
Doctor of Philosophy
2010
School of Veterinary and Biomedical Sciences
Division of Health Sciences
Murdoch University


iii
I declare that this thesis is my own account of my research and contains as its main
content work which has not previously been submitted for a degree at any tertiary
education institution.
Nichole Elana Burges Hammond

iv
v
ABSTRACT
The focus of this study was to explore current methodology for evaluating plant
health surveillance systems for their ability to provide confidence towards
demonstrating pest freedom using surveillance for Tilletia indica, an exotic fungal
pathogen of wheat, in Western Australia as a model. Tilletia indica causes a disease
commonly known as Karnal bunt and is an important pathogen in international
trade, with many countries having phytosanitary restrictions. If T. indica were to
become established in Australia it would cause considerable damage to the
country’s economy through loss of domestic and international markets. Maintaining
pest free status for T. indica is important to maintain Australia’s grain export
markets.
Integral to effective surveillance for T. indica are methods involved in the collection
of grain samples and the sensitivity of the laboratory tests used in the surveillance
systems. These surveillance ‘tools’ have been investigated and the current
techniques have been shown to be effective. Grain sampling occurring at delivery
during harvest provides an efficient way to collect samples representative of export
quality grain. Stochastic modelling of the sampling process shows that test samples
obtained using the current protocol will contain teliospores at detectable levels. In
samples from delivery parcels there is a high probability (> 95%) that test samples
will contain 5 or more teliospores where the prevalence is at least 1 infected grain in
100 kg. For test samples collected from general siding samples there is a greater
than 75% probability that teliospores will be present in the samples where the
prevalence is at least 0.5% of delivery parcels and 10 infected grains per kg within
parcels. Investigations also indicated that clustering of teliospores within infected
grains did not influence the probability of test samples being infected.
vi
Evaluation of the diagnostic protocols currently used in the surveillance programs
for T. indica using traditional ‘gold-standard’ methods and a Bayesian statistical
framework indicates that the sieve-wash protocol with microscopic observation has
a high diagnostic sensitivity (> 84.8%) and specificity (> 96.0%) for detection of
teliospores of T. indica, and similar results were obtained for related Tilletia species.
The molecular protocol, proposed as the new ‘enhanced’ surveillance tool for
detection of T. indica in grain samples, did not perform as well, with a sensitivity and
specificity of 48.0% and 48.4% respectively. The estimates were comparable
between the two evaluation methods, suggesting that the current protocol, sieve-
wash test with microscopic examination, is still the most suitable protocol for grain
surveillance for Tilletia species.
The expectation, under the SPS Agreement, that claims of pest freedom be
supported by scientific evidence means that there is an increasing need for methods
to evaluate the information collected during surveillance activities to provide a
quantitative level of confidence upon which claims of freedom can be based. Ten
years of historical grain surveillance, utilising samples collected at delivery and the
sieve-wash test with microscopic examination, were evaluated using scenario tree
methodology and have been shown to provide a high probability of freedom (>95%)
from T. indica for Western Australia. The active surveillance systems were
evaluated at a range of prevalence levels and were shown to provide a high
probability of freedom for design prevalences above one in five regions infected,
with 0.25% delivery parcels infected at a rate of 1 infected grain in 100 kg after
evaluation of the ten years of surveillance.
Passive surveillance systems can also provide evidence to support claims of pest
freedom. The reporting mechanisms in Western Australia for grains pests were
investigated, along with attitudes and behaviours relating to the likelihood that
members of the grains industry would report a suspect pest or disease. The

vii
information gathered was used to inform an evaluation of two passive surveillance
system components operating in Western Australia, grower reporting and routine
seed testing. Grower reporting was found to provide a high probability of freedom
(> 95%) at a design prevalence level of one in five regions infected with 0.25%
delivery parcels infected at a rate of 10 infected grains in 1 kg. The Seed Testing
surveillance system component was found to provide little contribution to confidence
in freedom, due to the low number of wheat samples tested annually. This study
demonstrates that passive surveillance provides significant confidence in freedom
for T. indica, but that the active surveillance programs provide additional confidence
that Western Australia is free from T. indica at lower prevalence levels. Finally,
recommendations are provided for future surveillance activities to maintain Western
Australia’s confidence in from T. indica.

viii
ix
TABLE OF CONTENTS
Abstract .......................................... ......................................................................... v
Table of Contents ................................. ................................................................. ix
List of Tables .................................... .................................................................. xvii
List of Figures ................................... ................................................................... xxi
List of Abbreviations ............................. ........................................................... xxvii
Literature review ................................. .................................................................... 1
Chapter 1: Surveillance in Plant Health .......... ...................................................... 3
1.1 Surveillance ................................................................................................ 3
1.2 Types of Surveillance .................................................................................. 4
1.2.1 Specific surveys ..................................................................................... 5
1.2.1.1 Detection surveys ........................................................................... 5
1.2.1.2 Delimiting surveys .......................................................................... 6
1.2.1.3 Monitoring surveys ......................................................................... 6
1.2.2 Targeted surveillance ............................................................................. 7
1.2.3 Surveillance for Pest Free Areas ............................................................ 7
1.2.4 General surveillance .............................................................................. 9
1.3 Evaluation of Surveillance Systems ............................................................ 9
1.3.1 Methods for evaluating surveillance systems ....................................... 11
1.3.1.1 Qualitative methods ...................................................................... 11
1.3.1.2 Quantitative methods ................................................................... 14
1.3.2 Evaluating surveillance for demonstrating pest freedom ...................... 24
Chapter 2: Tilletia indica ..................................................................................... 27
2.1 Taxonomy ................................................................................................. 27
2.2 Hosts......................................................................................................... 27
2.2.1 Bread wheat ........................................................................................ 28
2.2.2 Durum wheat ....................................................................................... 29
2.2.3 Triticale ................................................................................................ 29
2.2.4 Cereal rye ............................................................................................ 30
2.3 Geographic Distribution ............................................................................. 30
2.4 Biology ...................................................................................................... 31
2.4.1 Disease cycle ....................................................................................... 31
2.4.1.1 Teliospore germination ................................................................. 31
2.4.1.2 Infection process .......................................................................... 32
2.4.1.3 Dispersal of inoculum ................................................................... 33
2.4.2 Climatic modelling ................................................................................ 33
x
2.5 Diagnosis ................................................................................................. 36
2.5.1 Teliospore morphology ........................................................................ 36
2.5.2 Detection and diagnostic methods ...................................................... 37
2.5.2.1 Sieve-wash method ..................................................................... 37
2.5.2.2 Molecular methods ...................................................................... 38
2.5.2.3 Automated visual inspection methods .......................................... 39
2.5.2.4 Immunochemical methods ........................................................... 40
2.5.2.5 Soil extraction methods ............................................................... 41
2.5.3 International diagnostic protocols ........................................................ 41
2.5.3.1 International Plant Protection Convention .................................... 41
2.5.3.2 Australia – National Diagnostic Protocol ...................................... 42
2.5.3.3 European and Mediterranean Plant Protection Organisation ....... 42
2.5.3.4 North American Plant Protection Organization ............................. 44
2.6 Control ..................................................................................................... 46
2.7 Impact ...................................................................................................... 46
2.7.1 Yield loss ............................................................................................ 46
2.7.2 Trade implications ............................................................................... 47
2.8 Potential Introduction Pathways ............................................................... 47
2.8.1 Current regulations .............................................................................. 48
Chapter 3: Sampling of Post-Harvest Grain ........ .............................................. 49
3.1 Grain Sampling ........................................................................................ 49
3.2 Definition of a Lot ..................................................................................... 49
3.2.1 Weed seed/Purity issues ..................................................................... 50
3.2.2 Genetically modified seed ................................................................... 51
3.2.3 Mycotoxins .......................................................................................... 52
3.2.4 Pathogens ........................................................................................... 52
3.2.4.1 Infection process and effect on distribution of teliospores in grain lots ............................................................................................... 54
3.3 Sampling Protocols in Western Australia .................................................. 57
3.3.1 Grain handling and storage companies ............................................... 57
3.3.1.1 Sampling of delivery parcels ........................................................ 58
3.3.1.2 General siding samples ............................................................... 61
3.3.2 Seed laboratory samples ..................................................................... 61
3.3.2.1 Sampling of seed lots .................................................................. 62
3.3.2.2 Laboratory sub-sampling ............................................................. 62
Chapter 4: Validation of Diagnostic Tests ........ ................................................. 65
4.1 Diagnostic Sensitivity and Specificity ........................................................ 67
4.2 Diagnostic Test Accuracy in Plant Pathology ............................................ 68
xi
4.3 Calculating Diagnostic Sensitivity and Specificity ...................................... 69
4.3.1 Comparison to a ‘gold standard’ or reference test ................................ 69
4.3.2 Estimating sensitivity and specificity in the absence of a ‘gold standard’ test ..................................................................................................... 70
4.3.2.1 Maximum likelihood method ......................................................... 71
4.3.2.2 Bayesian approach ....................................................................... 71
4.3.2.3 Assumptions ................................................................................. 73
4.3.2.4 Dealing with conditionally dependent tests ................................... 75
4.3.2.5 Other issues with designing studies of diagnostic tests ................ 76
4.4 Calculation of Sensitivity and Specificity in Plant Pathology ...................... 77
4.4.1 Conditionally dependent or independent tests? .................................... 77
Chapter 5: Detecting and Reporting High Priority P ests in the Grains Industry ...................... ........................................................................ 79
5.1 Introduction ............................................................................................... 79
5.1.1 Passive surveillance ............................................................................ 79
5.1.2 Understanding reporting structures and behaviour ............................... 80
5.1.3 Eliciting expert opinion ......................................................................... 82
5.2 Objectives ................................................................................................. 84
5.3 Methods .................................................................................................... 85
5.3.1 Plant Pest Detection and Reporting Survey ......................................... 85
5.3.1.1 Target population ......................................................................... 85
5.3.1.2 Research questions ...................................................................... 85
5.3.1.3 High priority grain pests considered ............................................. 85
5.3.1.4 Questionnaire ............................................................................... 86
5.3.1.5 Data management and analysis ................................................... 91
5.4 Results ...................................................................................................... 92
5.4.1 Response rates .................................................................................... 92
5.4.2 Eligibility of responses ......................................................................... 93
5.4.3 Demographic and categorical questions .............................................. 93
5.4.4 Knowledge of advisory services ........................................................... 96
5.4.4.1 PestFax ........................................................................................ 96
5.4.4.2 AGWEST Plant Laboratories ........................................................ 98
5.4.4.3 Pest and Disease Information Service (PaDIS) ............................ 98
5.4.4.4 GrainGuard Identification Services, AgLine Phone Hotline and National Exotic Plant Pest Hotline ................................................ 98
5.4.5 Past reporting habits ............................................................................ 99
5.4.6 Factors impacting on decision to report.............................................. 104
5.4.7 Probability of detection of high priority plant pests ............................. 105
xii
5.4.8 Reporting high priority grains pests and diseases ............................. 111
5.4.9 Knowledge of specific high priority grains pests ................................ 112
5.4.10 Training received in recognising high priority pests ......................... 118
5.5 Discussion .............................................................................................. 118
Chapter 6: Distribution of Teliospores in Grain sa mples ............................... 131
6.1 Introduction ............................................................................................ 131
6.2 Objectives .............................................................................................. 132
6.3 Methods ................................................................................................. 133
6.3.1 Fitting distributions to published data ................................................ 133
6.3.2 Stochastic sampling models .............................................................. 133
6.3.2.1 Design prevalences ................................................................... 134
6.4 Models ................................................................................................... 136
6.4.1 Sampling model for Seed Testing samples ....................................... 136
6.4.2 Sampling models for grain delivered to Co-operative Bulk Handling.. 139
6.4.2.1 Parameters ................................................................................ 139
6.4.2.2 Sampling model for delivery parcel samples .............................. 142
6.4.2.3 Sampling model for general siding samples ............................... 145
6.4.2.4 Sensitivity analysis .................................................................... 148
6.5 Results ................................................................................................... 149
6.5.1 Fitting distributions to reported sampling data ................................... 149
6.5.2 Sampling model for seed testing samples ......................................... 154
6.5.3 Sampling model for delivery parcel samples ..................................... 158
6.5.3.1 Infected grains per test sample .................................................. 158
6.5.3.2 Spores per test sample .............................................................. 159
6.5.3.3 Parameters for the general siding sample model ....................... 161
6.5.4 Sampling model for general siding samples ...................................... 163
6.5.4.1 GS sample ................................................................................. 163
6.5.4.2 Test sample ............................................................................... 164
6.5.5 Sensitivity analysis ............................................................................ 168
6.5.5.1 Sampling model for delivery parcel samples .............................. 168
6.5.5.2 Sampling model for General Siding Samples ............................. 172
6.6 Discussion .............................................................................................. 175
Chapter 7: Sensitivity and specificity of Diagnost ic Protocols to Detect Tilletia indica................................................................................... 185
7.1 Introduction ............................................................................................ 185
7.2 Objectives .............................................................................................. 187
7.3 Methods ................................................................................................. 187
7.3.1 Diagnostic protocols .......................................................................... 187
xiii
7.3.2 Target population ............................................................................... 188
7.3.3 Study 1 .............................................................................................. 188
7.3.3.1 Population and sample sizes ...................................................... 188
7.3.3.2 Statistical methods ..................................................................... 189
7.3.4 Study 2 .............................................................................................. 191
7.3.4.1 Population and sample sizes ...................................................... 191
7.3.4.2 Statistical models ....................................................................... 192
7.4 Results .................................................................................................... 195
7.4.1 Study 1 .............................................................................................. 195
7.4.1.1 Sample sizes .............................................................................. 195
7.4.1.2 Test results and estimates of sensitivity and specificity .............. 195
7.4.1.3 Predictive values ........................................................................ 196
7.4.1.4 Correlation of results with number of teliospores ........................ 200
7.4.1.5 Recovery rate ............................................................................. 201
7.4.2 Study 2 .............................................................................................. 202
7.4.2.1 Test results ................................................................................. 202
7.4.2.2 Estimates ................................................................................... 204
7.4.2.3 Sensitivity analysis ..................................................................... 206
7.5 Discussion ................................................................................................... 222
Chapter 8: Evaluation of Post-harvest Grain Survei llance for Tilletia indica in Western Australia using Scenari o Trees ....................................... 233
8.1 Introduction ............................................................................................. 233
8.2 Objectives ............................................................................................... 234
8.3 Methods .................................................................................................. 235
8.3.1 Design prevalences ........................................................................... 236
8.4 Models .................................................................................................... 237
8.4.1 Post harvest grain surveillance for Tilletia indica in Western Australia237
8.4.1.1 Delivery parcel samples 1997/98 ................................................ 238
8.4.1.2 General siding samples 1997/98 to 2005/06 ............................... 239
8.4.2 Nodes ................................................................................................ 242
8.4.2.1 Category nodes .......................................................................... 244
8.4.2.2 Region status ............................................................................. 250
8.4.2.3 Lot status ................................................................................... 250
8.4.2.4 Test sample status ..................................................................... 251
8.4.2.5 Level of spores ........................................................................... 251
8.4.2.6 Diagnostic test ............................................................................ 252
8.4.3 Evaluation of surveillance system components .................................. 252
8.4.3.1 Component unit sensitivity (CSeU) ............................................. 253
xiv
8.4.3.2 Surveillance system component sensitivity (CSe) ...................... 254
8.4.3.3 Representative surveillance and the sensitivity ratio .................. 257
8.4.4 Exported grain ................................................................................... 259
8.4.5 Sensitivity analysis ............................................................................ 261
8.5 Results ................................................................................................... 266
8.5.1 Design prevalences ........................................................................... 266
8.5.2 Nodes ............................................................................................... 267
8.5.2.1 Production by region .................................................................. 267
8.5.2.2 Host ........................................................................................... 270
8.5.3 Evaluation of SSCs for State production ........................................... 270
8.5.3.1 Delivery Parcel SSC .................................................................. 270
8.5.3.2 General Siding sample SSC ...................................................... 273
8.5.4 Evaluation SSCs for Exported grain .................................................. 275
8.5.4.1 Delivery Parcel SSC .................................................................. 275
8.5.4.2 General Siding sample SSC ...................................................... 276
8.5.5 Sensitivity analysis ............................................................................ 277
8.5.5.1 Region relative risk .................................................................... 277
8.5.5.2 Host relative risk ........................................................................ 278
8.5.5.3 Diagnostic test sensitivity ........................................................... 279
8.5.5.4 Number of samples ................................................................... 282
8.6 Discussion .............................................................................................. 284
Chapter 9: Evaluation of Passive surveillance for Tilletia indica in Western Australia ...................... ..................................................................... 293
9.1 Introduction ............................................................................................ 293
9.2 Objectives .............................................................................................. 295
9.3 Methods ................................................................................................. 295
9.3.1 Design prevalences ........................................................................... 296
9.4 Models ................................................................................................... 297
9.4.1 Reporting of plant pests and diseases (Reporting SSC) .................... 297
9.4.1.1 Nodes ........................................................................................ 300
9.4.2 Routine seed testing of cereal grains (Seed Testing SSC) ................ 309
9.4.2.1 Nodes ........................................................................................ 313
9.4.3 Evaluation of surveillance system components ................................. 317
9.4.3.1 Component unit sensitivity (CSeU) ............................................ 318
9.4.3.2 Surveillance system component sensitivity (CSe) ...................... 320
9.4.3.3 Sensitivity analysis .................................................................... 323
9.5 Results ................................................................................................... 326
9.5.1 Reporting of plant pests and diseases ............................................... 326
xv
9.5.1.1 Component unit sensitivity (CSeU) ............................................. 326
9.5.1.2 Surveillance system component sensitivity (CSe) ....................... 327
9.5.1.3 Sensitivity analysis ..................................................................... 329
9.5.2 Routine seed testing of cereal grains ................................................. 331
9.5.2.1 Component unit sensitivity (CSeU) ............................................. 331
9.5.2.2 Surveillance system component sensitivity (CSe) ....................... 332
9.5.2.3 Sensitivity analysis ..................................................................... 334
9.6 Discussion .............................................................................................. 337
Chapter 10: Estimating the Probability of Freedom from Tilletia indica for Western Australia ............ ............................................................... 345
10.1 Introduction ............................................................................................. 345
10.2 Objectives ............................................................................................... 346
10.3 Methods .................................................................................................. 347
10.3.1 Combining multiple surveillance system components ...................... 347
10.3.2 Probability of freedom ...................................................................... 348
10.3.3 Sensitivity analysis ........................................................................... 349
10.3.4 Equilibrium of probability of freedom ................................................ 350
10.3.4.1 Passive surveillance ................................................................. 350
10.3.4.2 Active surveillance sensitivity required to maintain freedom ..... 350
10.4 Results .................................................................................................... 351
10.4.1 Surveillance system sensitivity (SSe) ............................................... 351
10.4.2 Probability of freedom ...................................................................... 351
10.4.3 Sensitivity analysis ........................................................................... 355
10.4.4 Probability of freedom equilibrium .................................................... 357
10.4.4.1 Passive surveillance ................................................................. 357
10.4.4.2 Active surveillance requirements .............................................. 359
10.5 Discussion .............................................................................................. 363
Chapter 11: General Discussion ................... .................................................... 369
Chapter 12: Appendices ........................... ......................................................... 375
Chapter 13: Bibliography ......................... ......................................................... 449

xvi
xvii
LIST OF TABLES
Table 3.1. Comparison of sampling guidelines for grain deliveries to Cooperative Bulk Handling Ltd and seed samples submitted to AGWEST Plant Laboratories for seed testing (adapted from pers. comm. Fitzpatrick 2007; ISTA 2008; Wright et al. 2006) ............................................................... 59
Table 4.1. Layout of conventional 2x2 contingency table for calculating sensitivity and specificity ......................................................................................... 70
Table 5.1. Symptoms and signs associated or non-associated with each of the four high priority pests used in the questionnaire ........................................... 90
Table 5.2. Demographic classification of responses by employment category (excluding the seed cleaner/handler and one respondent that did not fit any category) ......................................................................................... 95
Table 5.3. Percentage (number) of respondents that had detected pest and disease issues within grain crops over the last five years by employment category and percentage (number) who reported a problem detected ................ 100
Table 5.4. Classification of last problem detected by employment category .......... 101
Table 5.5. Proportion of respondents that contacted different pest and disease services in Western Australia when reporting the last problem they detected ............................................................................................... 102
Table 5.6. Percentage (number) of plant pest and disease problems reported ..... 103
Table 5.7. Percent of respondents that would report each of the four grains high priority pests considered by employment category ............................... 113
Table 5.8. Proportion of respondents that would contact different pest and disease services in Western Australia when reporting suspected Karnal bunt ... 114
Table 6.1. Design prevalences used in the sampling models; P*Grain is adapted from the data presented in Peterson et al. (2000) ................................. 135
Table 6.2. Estimated parameters and goodness of fit values for negative binomial and Poisson distributions fitted to the data presented in Peterson et al. (2000) .................................................................................................. 150
Table 6.3: Estimated parameters and goodness of fit values for negative binomial and Poisson distributions fitted to the data presented in Whitaker et al. (2001) .................................................................................................. 151
Table 6.4. Probability that the test sample contained one or more infected seeds for bulk and bagged seed lots from the stochastic model........................... 155
Table 6.5: Probability of test samples from bread wheat delivery parcel samples containing infected grains and teliospores, and the probability that the number of spores was in the range of 1, 2 to 4, or 5 or more spores at different P*Grain ................................................................................... 160
Table 6.6. Probability of test samples from durum wheat delivery parcel samples being infected and of infected test samples containing 1, 2 to 4, or 5 or more spores at different P*Grain .......................................................... 160
Table 6.7. Probability that GS and test samples were infected, and of infected test samples containing 1, 2 to 4 or 5 or more spores for all combinations of P*Grain and P*DeliveryParcel for bread wheat ..................................... 165
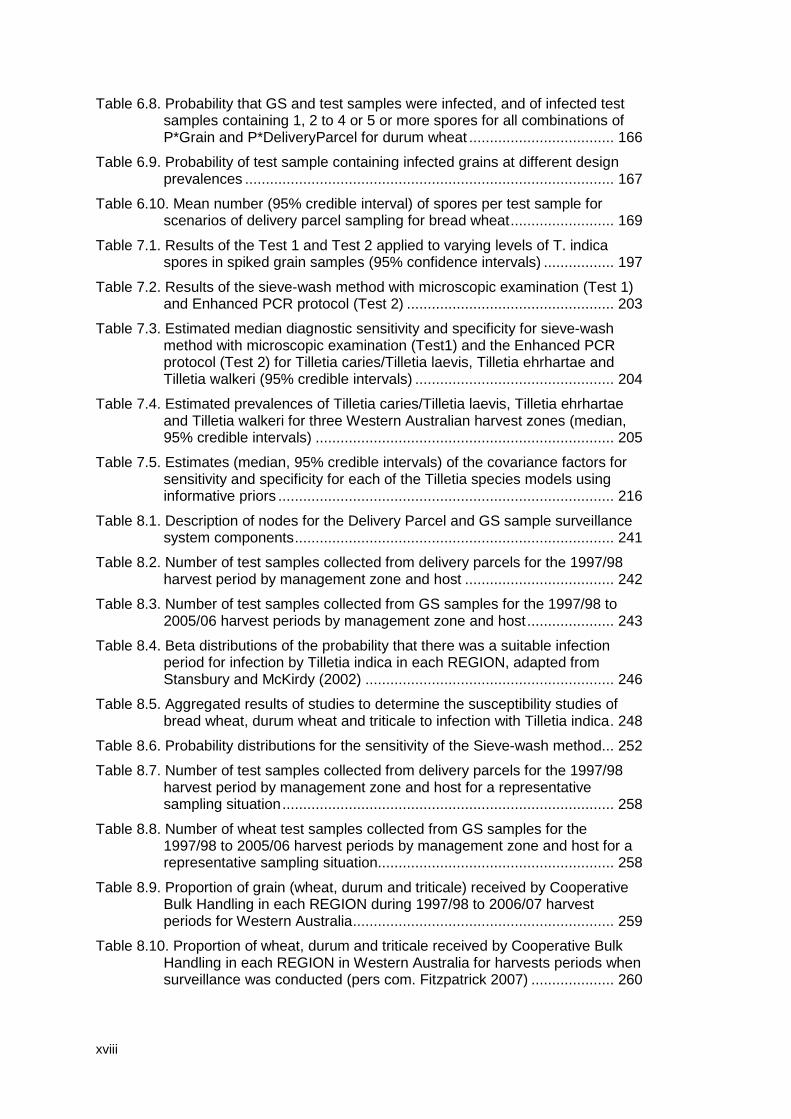
xviii
Table 6.8. Probability that GS and test samples were infected, and of infected test samples containing 1, 2 to 4 or 5 or more spores for all combinations of P*Grain and P*DeliveryParcel for durum wheat ................................... 166
Table 6.9. Probability of test sample containing infected grains at different design prevalences ......................................................................................... 167
Table 6.10. Mean number (95% credible interval) of spores per test sample for scenarios of delivery parcel sampling for bread wheat ......................... 169
Table 7.1. Results of the Test 1 and Test 2 applied to varying levels of T. indica spores in spiked grain samples (95% confidence intervals) ................. 197
Table 7.2. Results of the sieve-wash method with microscopic examination (Test 1) and Enhanced PCR protocol (Test 2) .................................................. 203
Table 7.3. Estimated median diagnostic sensitivity and specificity for sieve-wash method with microscopic examination (Test1) and the Enhanced PCR protocol (Test 2) for Tilletia caries/Tilletia laevis, Tilletia ehrhartae and Tilletia walkeri (95% credible intervals) ................................................ 204
Table 7.4. Estimated prevalences of Tilletia caries/Tilletia laevis, Tilletia ehrhartae and Tilletia walkeri for three Western Australian harvest zones (median, 95% credible intervals) ........................................................................ 205
Table 7.5. Estimates (median, 95% credible intervals) of the covariance factors for sensitivity and specificity for each of the Tilletia species models using informative priors ................................................................................. 216
Table 8.1. Description of nodes for the Delivery Parcel and GS sample surveillance system components ............................................................................. 241
Table 8.2. Number of test samples collected from delivery parcels for the 1997/98 harvest period by management zone and host .................................... 242
Table 8.3. Number of test samples collected from GS samples for the 1997/98 to 2005/06 harvest periods by management zone and host ..................... 243
Table 8.4. Beta distributions of the probability that there was a suitable infection period for infection by Tilletia indica in each REGION, adapted from Stansbury and McKirdy (2002) ............................................................ 246
Table 8.5. Aggregated results of studies to determine the susceptibility studies of bread wheat, durum wheat and triticale to infection with Tilletia indica . 248
Table 8.6. Probability distributions for the sensitivity of the Sieve-wash method... 252
Table 8.7. Number of test samples collected from delivery parcels for the 1997/98 harvest period by management zone and host for a representative sampling situation ................................................................................ 258
Table 8.8. Number of wheat test samples collected from GS samples for the 1997/98 to 2005/06 harvest periods by management zone and host for a representative sampling situation ......................................................... 258
Table 8.9. Proportion of grain (wheat, durum and triticale) received by Cooperative Bulk Handling in each REGION during 1997/98 to 2006/07 harvest periods for Western Australia ............................................................... 259
Table 8.10. Proportion of wheat, durum and triticale received by Cooperative Bulk Handling in each REGION in Western Australia for harvests periods when surveillance was conducted (pers com. Fitzpatrick 2007) .................... 260
xix
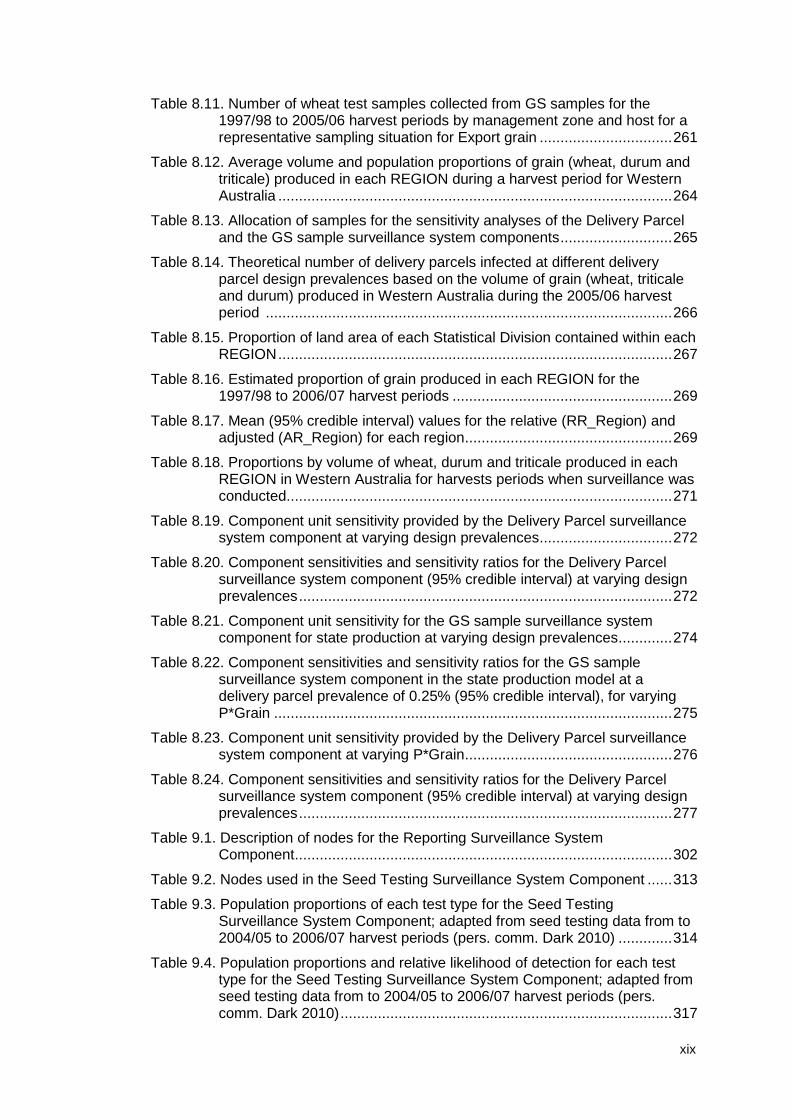
Table 8.11. Number of wheat test samples collected from GS samples for the 1997/98 to 2005/06 harvest periods by management zone and host for a representative sampling situation for Export grain ................................ 261
Table 8.12. Average volume and population proportions of grain (wheat, durum and triticale) produced in each REGION during a harvest period for Western Australia ............................................................................................... 264
Table 8.13. Allocation of samples for the sensitivity analyses of the Delivery Parcel and the GS sample surveillance system components ........................... 265
Table 8.14. Theoretical number of delivery parcels infected at different delivery parcel design prevalences based on the volume of grain (wheat, triticale and durum) produced in Western Australia during the 2005/06 harvest period .................................................................................................. 266
Table 8.15. Proportion of land area of each Statistical Division contained within each REGION ............................................................................................... 267
Table 8.16. Estimated proportion of grain produced in each REGION for the 1997/98 to 2006/07 harvest periods ..................................................... 269
Table 8.17. Mean (95% credible interval) values for the relative (RR_Region) and adjusted (AR_Region) for each region .................................................. 269
Table 8.18. Proportions by volume of wheat, durum and triticale produced in each REGION in Western Australia for harvests periods when surveillance was conducted ............................................................................................. 271
Table 8.19. Component unit sensitivity provided by the Delivery Parcel surveillance system component at varying design prevalences ................................ 272
Table 8.20. Component sensitivities and sensitivity ratios for the Delivery Parcel surveillance system component (95% credible interval) at varying design prevalences .......................................................................................... 272
Table 8.21. Component unit sensitivity for the GS sample surveillance system component for state production at varying design prevalences ............. 274
Table 8.22. Component sensitivities and sensitivity ratios for the GS sample surveillance system component in the state production model at a delivery parcel prevalence of 0.25% (95% credible interval), for varying P*Grain ................................................................................................ 275
Table 8.23. Component unit sensitivity provided by the Delivery Parcel surveillance system component at varying P*Grain .................................................. 276
Table 8.24. Component sensitivities and sensitivity ratios for the Delivery Parcel surveillance system component (95% credible interval) at varying design prevalences .......................................................................................... 277
Table 9.1. Description of nodes for the Reporting Surveillance System Component ........................................................................................... 302
Table 9.2. Nodes used in the Seed Testing Surveillance System Component ...... 313
Table 9.3. Population proportions of each test type for the Seed Testing Surveillance System Component; adapted from seed testing data from to 2004/05 to 2006/07 harvest periods (pers. comm. Dark 2010) ............. 314
Table 9.4. Population proportions and relative likelihood of detection for each test type for the Seed Testing Surveillance System Component; adapted from seed testing data from to 2004/05 to 2006/07 harvest periods (pers. comm. Dark 2010) ................................................................................ 317
xx
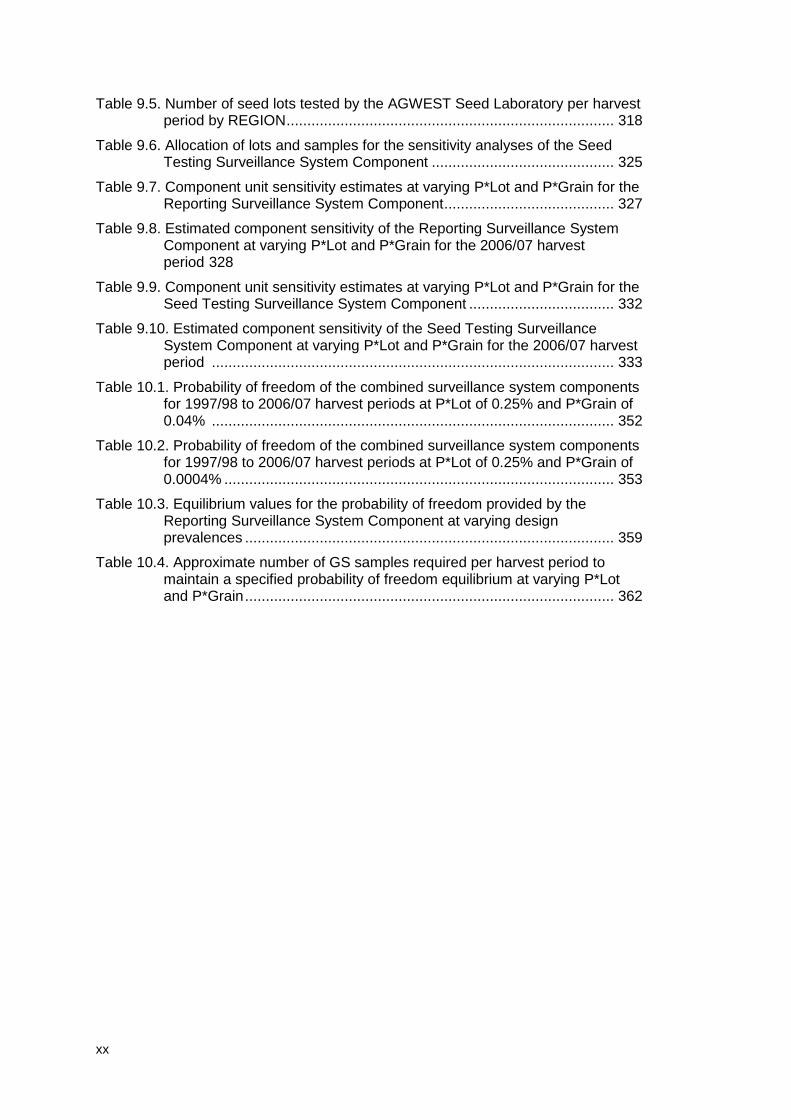
Table 9.5. Number of seed lots tested by the AGWEST Seed Laboratory per harvest period by REGION ............................................................................... 318
Table 9.6. Allocation of lots and samples for the sensitivity analyses of the Seed Testing Surveillance System Component ............................................ 325
Table 9.7. Component unit sensitivity estimates at varying P*Lot and P*Grain for the Reporting Surveillance System Component ......................................... 327
Table 9.8. Estimated component sensitivity of the Reporting Surveillance System Component at varying P*Lot and P*Grain for the 2006/07 harvest period 328
Table 9.9. Component unit sensitivity estimates at varying P*Lot and P*Grain for the Seed Testing Surveillance System Component ................................... 332
Table 9.10. Estimated component sensitivity of the Seed Testing Surveillance System Component at varying P*Lot and P*Grain for the 2006/07 harvest period ................................................................................................. 333
Table 10.1. Probability of freedom of the combined surveillance system components for 1997/98 to 2006/07 harvest periods at P*Lot of 0.25% and P*Grain of 0.04% ................................................................................................. 352
Table 10.2. Probability of freedom of the combined surveillance system components for 1997/98 to 2006/07 harvest periods at P*Lot of 0.25% and P*Grain of 0.0004% .............................................................................................. 353
Table 10.3. Equilibrium values for the probability of freedom provided by the Reporting Surveillance System Component at varying design prevalences ......................................................................................... 359
Table 10.4. Approximate number of GS samples required per harvest period to maintain a specified probability of freedom equilibrium at varying P*Lot and P*Grain ......................................................................................... 362
xxi
LIST OF FIGURES
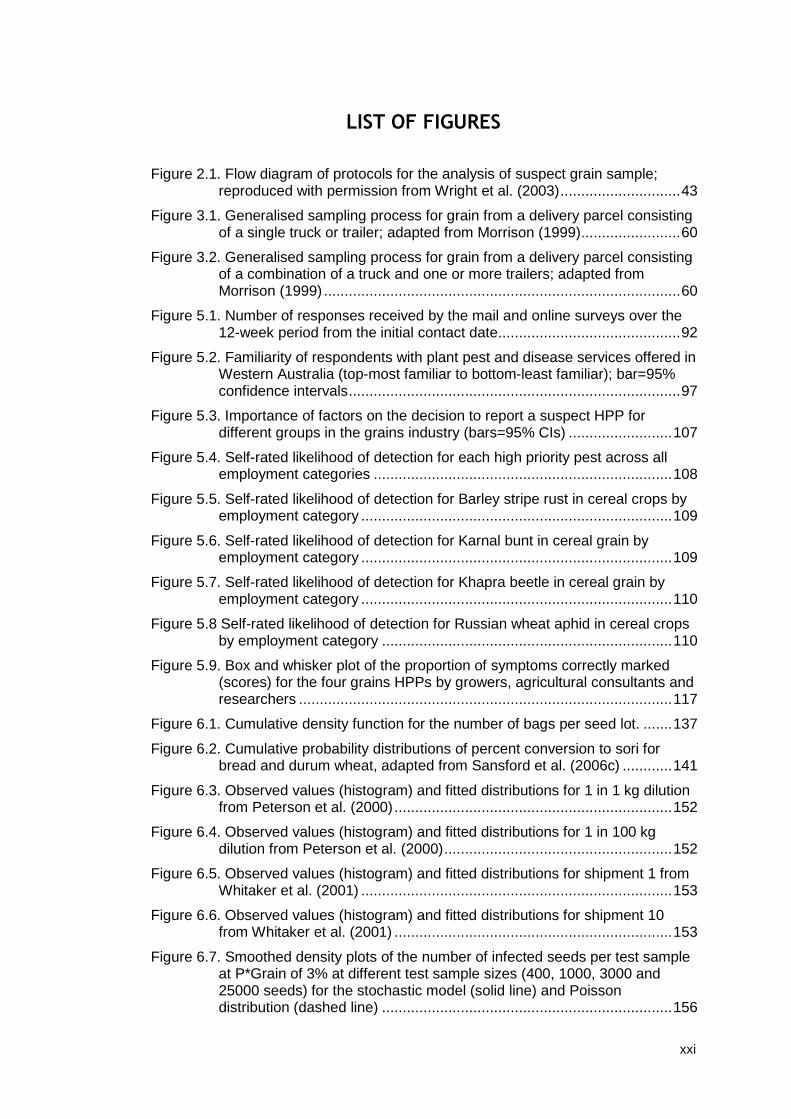
Figure 2.1. Flow diagram of protocols for the analysis of suspect grain sample; reproduced with permission from Wright et al. (2003) ............................. 43
Figure 3.1. Generalised sampling process for grain from a delivery parcel consisting of a single truck or trailer; adapted from Morrison (1999) ........................ 60
Figure 3.2. Generalised sampling process for grain from a delivery parcel consisting of a combination of a truck and one or more trailers; adapted from Morrison (1999) ...................................................................................... 60
Figure 5.1. Number of responses received by the mail and online surveys over the 12-week period from the initial contact date ............................................ 92
Figure 5.2. Familiarity of respondents with plant pest and disease services offered in Western Australia (top-most familiar to bottom-least familiar); bar=95% confidence intervals ................................................................................ 97
Figure 5.3. Importance of factors on the decision to report a suspect HPP for different groups in the grains industry (bars=95% CIs) ......................... 107
Figure 5.4. Self-rated likelihood of detection for each high priority pest across all employment categories ........................................................................ 108
Figure 5.5. Self-rated likelihood of detection for Barley stripe rust in cereal crops by employment category ........................................................................... 109
Figure 5.6. Self-rated likelihood of detection for Karnal bunt in cereal grain by employment category ........................................................................... 109
Figure 5.7. Self-rated likelihood of detection for Khapra beetle in cereal grain by employment category ........................................................................... 110
Figure 5.8 Self-rated likelihood of detection for Russian wheat aphid in cereal crops by employment category ...................................................................... 110
Figure 5.9. Box and whisker plot of the proportion of symptoms correctly marked (scores) for the four grains HPPs by growers, agricultural consultants and researchers .......................................................................................... 117
Figure 6.1. Cumulative density function for the number of bags per seed lot. ....... 137
Figure 6.2. Cumulative probability distributions of percent conversion to sori for bread and durum wheat, adapted from Sansford et al. (2006c) ............ 141
Figure 6.3. Observed values (histogram) and fitted distributions for 1 in 1 kg dilution from Peterson et al. (2000) ................................................................... 152
Figure 6.4. Observed values (histogram) and fitted distributions for 1 in 100 kg dilution from Peterson et al. (2000) ....................................................... 152
Figure 6.5. Observed values (histogram) and fitted distributions for shipment 1 from Whitaker et al. (2001) ........................................................................... 153
Figure 6.6. Observed values (histogram) and fitted distributions for shipment 10 from Whitaker et al. (2001) ................................................................... 153
Figure 6.7. Smoothed density plots of the number of infected seeds per test sample at P*Grain of 3% at different test sample sizes (400, 1000, 3000 and 25000 seeds) for the stochastic model (solid line) and Poisson distribution (dashed line) ...................................................................... 156
xxii
Figure 6.8. Smoothed density plots of the number of infected seeds per test sample at P*Grain of 0.04% at different test sample sizes (400, 1000, 3000 and 25000 seeds) for the stochastic model (solid line) and Poisson distribution (dashed line) ...................................................................... 157
Figure 6.9. Number of infected grains in test samples from the stochastic model (black bars) compared to Poisson estimate (grey density plot) at P*Grain of 1% and 3% ...................................................................................... 159
Figure 6.10. Cumulative density function of the mean number of infected grains per 50 g sub-sample collected from the delivery parcel samples for P*Grain of 3% and 1% .......................................................................................... 161
Figure 6.11. Cumulative density functions for the mean number of spores per 50 g test sample collected from the delivery parcel sample for varying P*Grain for bread wheat (solid line) and durum wheat (dashed line) ................. 162
Figure 6.12. Probability that the GS sample is infected for each combination of P*DeliveryParcel and P*Grain for bread wheat .................................... 163
Figure 6.13. Probability that the test sample is infected for each combination of P*DeliveryParcel and P*Grain ............................................................. 164
Figure 6.14. The effect of clustering, represented by negative binomial distributions, on the number of spores per test sample for P*Grain of 0.04%, range truncated to 0 to 250 000 spores ......................................................... 170
Figure 6.15. Number of spores per test sample for clustering scenarios for P*Grain of 0.000004%, over a truncated range of 0 to 25 spores per test sample ................................................................................................. 171
Figure 6.16. Probability that the GS sample was infected at different P*DeliveryParcel incorporating clustering of teliospores at P*Grain of 0.0004% for bread wheat ..................................................................... 172
Figure 6.17. Probability that the test sample was infected at different P*Grain incorporating clustering of teliospores at P*DeliveryParcel of 0.25% for bread wheat ......................................................................................... 173
Figure 6.18. Number of spores per test sample for P*Grain of 0.0004% under different models incorporating clustering of teliospores within delivery parcels at P*DeliveryParcel of 1% ....................................................... 174
Figure 7.1. Positive (PPV) and negative (NPV) predictive values for Test 1 and Test 2 for test samples from delivery parcels where prevalence is the P(Test sample infected) estimated from the delivery parcel sampling model ... 198
Figure 7.2. Positive (PPV) and negative (NPV) predictive values for Test 1 and Test 2 for test samples from general siding samples where prevalence is the P(Test sample infected) estimated from the general siding sampling model ................................................................................................. 199
Figure 7.3. Estimated sensitivity of two tests for T. indica at 1 to 10 teliospores per 50 g wheat grain with fitted linear regression lines ............................... 200
Figure 7.4. Recovery rate of teliospores in grain samples in Test 1 (horizontal scatter plot) with the fitted linear regression line. ................................. 201
Figure 7.5. Probability of the presence of one or more teliospores, P(X>0), in the portion (half) of the wash sample tested by PCR ................................. 202
Figure 7.6. Posterior estimates of the diagnostic sensitivity (Se) and specificity (Sp) of the sieve-wash method with microscopic examination (Test 1) and the
xxiii
Enhanced PCR protocol (PCR) for detection of Tilletia caries/Tilletia laevis, Tilletia ehrhartae and Tilletia walkeri .......................................... 207
Figure 7.7. Probability distributions for estimates of the population prevalences for Tilletia ehrhartae model ........................................................................ 208
Figure 7.8. Estimates of diagnostic sensitivity and specificity for the sieve-wash method with microscopic examination (Test 1) and Enhanced PCR protocol (Test 2) with informed and un-informed priors for the Tilletia ehrhartae model ................................................................................... 209
Figure 7.9. Test parameters estimates from the Tilletia caries/ Tilletia laevis model with uninformed priors and larger samples sizes .................................. 211
Figure 7.10. Probability distributions of diagnostic sensitivity and specificity of the two tests for Tilletia ehrhartae using uninformed priors and larger sample sizes 212
Figure 7.11. Estimates of test parameters for the sieve-wash method and the Enhanced PCR protocol for uninformed priors and larger sample size for Tilletia walkeri ....................................................................................... 213
Figure 7.12. Estimates of the population prevalences for Tilletia walkeri using larger sample sizes and uninformed priors ..................................................... 214
Figure 7.13. Probability distributions of estimates for population prevalences for Tilletia caries/Tilletia laevis, Tilletia ehrhartae, Tilletia walkeri for Geraldton before and after allowing for case influence ......................... 215
Figure 7.14. Test parameter estimates with fixed values for test covariances for Tilletia ehrhartae ................................................................................... 217
Figure 7.15. Population prevalence estimates for Tilletia ehrhartae with testing for constancy across populations ............................................................... 218
Figure 7.16. Test sensitivity and specificity estimates for Tilletia ehrhartae with testing for constancy across populations .............................................. 219
Figure 7.17. Population prevalence estimates for Tilletia walkeri with testing for constancy across populations ............................................................... 220
Figure 7.18. Test sensitivity and specificity estimates for Tilletia walkeri with testing for constancy across populations ......................................................... 221
Figure 8.1. A simplified scenario tree for the surveillance system components for test samples collected from delivery parcels and general siding samples ................................................................................................ 240
Figure 8.2. Probability of infection for bread wheat, durum wheat and triticale lines in four studies of host susceptibility to Tilletia indica ................................. 249
Figure 8.3. Comparison of probability of infection for bread wheat, durum wheat and triticale lines for susceptibility to T. indica based on combined data from studies by Dhaliwal and Singh (1998), Fuentes-Davila et al. (1996), Sansford et al. (2006b) and Warham (1988) ......................................... 250
Figure 8.4. Western Australian Statistical Divisions overlayed by Cooperative Bulk Handling management zones which correspond to the REGION category node; G = Geraldton, KW = Kwinana West, KE = Kwinana East, A = Albany, E = Esperance ......................................................................... 268
Figure 8.5. Component sensitivity estimates (bars=95% credible interval) with changes in the relative risk of the REGIONs for the Delivery Parcel surveillance system component for different RR_Region scenarios ...... 278
xxiv
Figure 8.6. Component sensitivity estimates (bars=95% credible interval) with changes in the relative risk of the REGIONs for the GS sample surveillance system component for different RR_Region scenarios ..... 279
Figure 8.7. Change in component sensitivity (mean, bars=95% credible interval) for the GS sample surveillance system component with variation in the value of the test sensitivity with design prevalences of P*DeliveryParcel=0.25% and P*Grain=0.04% ............................................................................. 280
Figure 8.8. Change in component sensitivity (mean, bars=95% credible interval) for the GS sample surveillance system component with variation in the value of the test sensitivity with design prevalences of P*DeliveryParcel=0.25% and P*Grain=0.00004% ....................................................................... 281
Figure 8.9. Change in component sensitivity with number of samples processed for the Delivery Parcel surveillance system component at varying delivery parcel prevalences and a with-in parcel prevalence of 0.04% .............. 282
Figure 8.10. Change in component sensitivity with number of samples processed for the GS sample surveillance system component at varying delivery parcel prevalences and a with-in parcel prevalence of 0.04% ........................ 283
Figure 9.1. Scenario tree for Reporting Surveillance System Component – Infection and grower detection and reporting stages .......................................... 298
Figure 9.2. Scenario tree for Reporting Surveillance System Component – Reporting stage for Agricultural consultants ......................................... 299
Figure 9.3. Scenario tree for Reporting Surveillance System Component – Reporting stage for DAFWA staff members ......................................... 299
Figure 9.4. Scenario tree for Reporting Surveillance System Component – Reporting stage for Phone Hotlines ..................................................... 300
Figure 9.5. Scenario tree for Reporting Surveillance System Component – Detection stage for reports and samples submitted to AGWEST Plant Laboratories or DAFWA head office ......................................................................... 300
Figure 9.6. Cumulative probability distribution of growers’ self-rated likelihood of detecting Karnal bunt (Tilletia indica) ................................................... 305
Figure 9.7. Scenario tree for the Seed Testing Surveillance System Component . 312
Figure 9.8. Cumulative probability distribution of seed analysts self-rated likelihood of detecting Karnal bunt (Tilletia indica) ............................................... 316
Figure 9.9. Spider plot of the change in component sensitivity of the Reporting Surveillance System Component caused by variation in the input parameters .......................................................................................... 329
Figure 9.10. Estimates (bars representing 95% credible interval) of the component sensitivity under different scenarios of relative risks for Region (upper panel) and weighting of Beta distributions in the parameterisation of the probability that each group would report (lower panel) ......................... 330
Figure 9.11. Estimates of component sensitivity of the Reporting surveillance system component with increasing number of lots processed at varying P*Lot and P*Grain of 0.04% using the scenario tree ............................ 331
Figure 9.12. Spider plot of the change in component sensitivity of the Seed Testing Surveillance System Component with variation in the input parameters334
Figure 9.13. Estimates (bars representing 95% credible interval) of the component sensitivity under different scenarios of relative risks for REGION,
xxv
weighting of Beta distributions in the parameterisation of the probability that a sample is forwarded to the lab and the relative likelihood of detection for the different Test Types ................................................... 335
Figure 9.14. Estimates of component sensitivity of the Seed Testing Surveillance System Component with increasing number of lots processed at varying P*Lot and P*Grain of 0.04% ................................................................. 336
Figure 10.1. Probability of freedom (black line, bars 95% credible interval) and mean surveillance system sensitivity (grey squares) at P*Lot of 0.25% and P*Grain of 0.04% .................................................................................. 354
Figure 10.2. Mean probability of freedom over 10 harvest periods until 2006/07 at varying P*Grain and P*Lot of 0.25% ..................................................... 355
Figure 10.3. Spider plot of the change in posterior probability of freedom after the 2006/07 harvest period, PostPFree2006/07, with variation in the input parameters in the combined surveillance system components ............. 356
Figure 10.4. Mean posterior probability of freedom after the 2006/07 harvest period, PostPFree2006/07, at varying prior probability of infections, PriorPInf, (bars = 95% credible interval) ........................................................................ 357
Figure 10.5. Mean estimates and 95% credible interval for the posterior probability of freedom after the 2006/07 harvest period, PostPFree2006/07, under different scenarios of relative risks for REGION .................................... 358
Figure 10.6. Component sensitivity estimates for increasing number of GS samples processed and the number of samples required to maintain probability of freedom equilibrium value of 90%, 95% and 99% at varying P*Grain and P*Lot of 0.25% ..................................................................................... 360
Figure 10.7. Component sensitivity estimates for increasing number of GS samples processed and the number of samples required to maintain probability of freedom equilibrium value of 90%, 95% and 99% at varying P*Grain and P*Lot of 0.1% ....................................................................................... 361

xxvi

xxvii
ACKNOWLEDGEMENTS
It is a pleasure to thank those who helped make this thesis possible, firstly my panel
of supervisors, Dr Simon Reid and Dr Ian Robertson (Murdoch University), Dr Cindy
Hauser (ACERA, Melbourne University), Mr Tony Martin and Dr Darryl Hardie
(Department of Agriculture and Food, Western Australia) and Dr Grant Hamilton
(Queensland University of Technology). Your diverse backgrounds have made the
process a very interesting and enlightening one. A special thanks to Dr Simon Reid
and Mr Tony Martin for providing encouragement and support in applying ideas from
their field of veterinary science to a new area and for wrapping their minds around
some of the principles of plant pathology. I would also like to thank Dr Ian Robertson
for stepping in, in Simon’s absence as my principle supervisor at Murdoch
University.
I am grateful to Ms Dominie Wright (Department of Agriculture and Food, Western
Australia) who has been a mentor and a friend throughout my career in plant
pathology. Thank you for assisting with the design and laboratory techniques
involved in the diagnostic test accuracy study, and for providing access to some of
the data used in the Bayesian study.
I would like to thank the members of the ACERA project team who were involved in
project 0703 - Combining disparate data sources to demonstrate pest/disease
status, the discussions at project meetings were extremely helpful in clarifying my
understanding of the scenario tree methodology.
I would like to acknowledge the contribution of data used in the historical analyses;
Co-operative Bulk Handling Ltd for providing data on the amount and types of grain
received for storage and export and for providing information on the sampling
protocols used, and the Department of Agriculture and Food, Western Australia for

xxviii
supplying the surveillance data used in the case studies and providing information
on the sampling protocols used in by the seed testing laboratory.
This project was made financially possible with support from the Cooperative
Research Centre for National Plant Biosecurity and Department of Agriculture and
Food, Western Australia.
Finally, but by no means least, I would like to express my deepest gratitude to my
family and friends. A special thanks to my parents for always believing in me, I
couldn’t have made this far without your support. To my extended family, who have
always shown an interest my research and been understanding when I’ve not been
available for get-togethers. Thanks also to my friends, whose company has
provided much needed sanity breaks from my work. And I would especially like to
thank my husband who, I’m sure, will be glad that this journey is finally coming to an
end. Thank you for helping keep things in perspective.
xxix
LIST OF ABBREVIATIONS
ABS Australian Bureau of Statistics
AICc Akaike information criterion
ALPP Area of low pest prevalence
APL AGWEST Plant Laboratories
AQIS Australian Quarantine and Inspection Service
AR Adjusted risk
CBH Co-operative Bulk Handling Ltd
CDC Centres for Disease Control and Prevention
CSe Component sensitivity
CSeU Component unit sensitivity
DAFWA Department of Agriculture and Food, Western Australia
DNA Deoxyribonucleic acid
EPP Emergency Plant Pest
EPPO European and Mediterranean Plant Protection Organisation
FAO Food and Agriculture Organization of the United Nations
GM Genetically modified
GS samples General siding samples
HPP High priority pest
HTI Humid thermal index
IPPC International Plant Protection Convention
ISPM International Standards for Phytosanitary Measures
ISTA International Seed Testing Association
ITS Internal transcribed spacer regions
NAPPO North American Plant Protection Organisation
NPPO National Plant Protection Organisation
NPV Negative predictive value
OIE Office International des Epizooties
P*DeliveryParcel Among-delivery parcel design prevalence
xxx
P*Grain Within-delivery parcel design prevalence
P*Lot Among-lot design prevalence
P*Region Among-region parcel design prevalence
PaDIS Pest and Disease Information Service
PCR Polymerase chain reaction
PFA Pest free area
PFreeEquil Equilibrium of probability of freedom
PIntro Probability of introduction
PostPFree Posterior probability of freedom
PPV Positive predictive value
PriorPInf Prior probability of infection
PrP Population proportion
PrSSC Surveillance system component proportion
rDNA Ribosomal DNA
RPPO Regional Plant Protection Organisation
RR Relative risk
Se Diagnostic sensitivity
Seed Lab AGWEST Seed Laboratory
sp. Species (singular)
spp. Species (plural)
Sp Diagnostic specificity
SR Sensitivity ratio
SSC Surveillance system component
SSe Surveillance system sensitivity
USDA United States Department of Agriculture
WA Western Australia
WTO World Trade Organisation