Embed Size (px)
Citation preview

ORIGINAL RESEARCH Open Access
Evaluation of data-driven respiratory gatingwaveforms for clinical PET imagingMatthew D. Walker1* , Andrew J. Morgan1, Kevin M. Bradley2 and Daniel R. McGowan1,3
Abstract
Background: We aimed to evaluate the clinical robustness of a commercially developed data-driven respiratorygating algorithm based on principal component analysis, for use in routine PET imaging.
Methods: One hundred fifty-seven adult FDG PET examinations comprising a total of 1149 acquired bed positionswere used for the assessment. These data are representative of FDG scans currently performed at our institution. Datawere acquired for 4 min/bed position (3 min/bed for legs). The data-driven gating (DDG) algorithm was applied toeach bed position, including those where minimal respiratory motion was expected. The algorithm provided a signal-to-noise measure of respiratory-like frequencies within the data, denoted as R. Qualitative evaluation was performed byvisual examination of the waveforms, with each waveform scored on a 3-point scale by two readers and then averaged(score S of 0 = no respiratory signal, 1 = some respiratory-like signal but indeterminate, 2 = acceptable signalconsidered to be respiratory). Images were reconstructed using quiescent period gating and compared with non-gated images reconstructed with a matched number of coincidences. If present, the SUVmax of a well-defined lesion inthe thorax or abdomen was measured and compared between the two reconstructions.
Results: There was a strong (r = 0.86) and significant correlation between R and scores S. Eighty-six percent ofwaveforms with R≥ 15 were scored as acceptable for respiratory gating. On average, there were 1.2 bed positions perpatient examination with R≥ 15. Waveforms with high R and S were found to originate from bed positionscorresponding to the thorax and abdomen: 90% of waveforms with R≥ 15 had bed centres in the range 5.6 cmsuperior to 27 cm inferior from the dome of the liver. For regions where respiratory motion was expected to beminimal, R tended to be < 6 and S tended to be 0. The use of DDG significantly increased the SUVmax of focal lesions,by an average of 11% when considering lesions in bed positions with R≥ 15.
Conclusions: The majority of waveforms with high R corresponded to the part of the patient where respiratory motionwas expected. The waveforms were deemed suitable for respiratory gating when assessed visually, and when usedwere found to increase SUVmax in focal lesions.
Keywords: PET/CT, Motion, Respiratory gating, Data-driven gating, Imaging
BackgroundRespiratory motion during PET data acquisition is un-avoidable and often degrades clinical image quality. Fea-tures within the abdomen and thorax are generallyblurred in the cranio-caudal direction when respiratorymotion is left unaccounted for in the PET image recon-struction. A range of image artefacts can also occur.These are mostly due to a mismatch between the CT at-tenuation correction image, which is typically a snapshot
at a single phase of respiration, and the PET imagewhich typically represents an average over the whole re-spiratory cycle [1–3].Many approaches have been demonstrated to mitigate
the degrading effects of respiratory motion in PET-CT.For both the PET and CT modalities, methods fall intoone of two categories. The first of these is instructedbreathing, such as breath hold or repeated breath holdtechniques. The second category is tracking of the re-spiratory phase, sometimes with gated exposure (forCT), and with compensated image processing (e.g. re-spiratory gated image reconstruction). The short
* Correspondence: [email protected] Physics and Protection, Churchill Hospital, Oxford UniversityHospitals NHS Foundation Trust, Oxford OX3 7LE, UKFull list of author information is available at the end of the article
© The Author(s). 2019 Open Access This article is distributed under the terms of the Creative Commons Attribution 4.0International License (http://creativecommons.org/licenses/by/4.0/), which permits unrestricted use, distribution, andreproduction in any medium, provided you give appropriate credit to the original author(s) and the source, provide a link tothe Creative Commons license, and indicate if changes were made.
Walker et al. EJNMMI Research (2019) 9:1 https://doi.org/10.1186/s13550-018-0470-9

exposure time (seconds) required in CT makes breathhold techniques compatible with this modality, and theyare frequently used clinically. Repeated breath-hold PEThas been performed [4, 5] but is not common, due tothe much longer duration (minutes) required for PETdata acquisition. Tracking the respiratory cycle by meansof an external system, such as a pressure belt or a cam-era, is commonly performed for both CT and PET.Commercial products that interface with the PET-CTscanner include the respiratory gating system AZ-733VI(Anzai Medical; Tokyo, Japan) and the Real-time Pos-ition Management™ (RPM) Respiratory Gating system(Varian Medical Systems; CA, USA). While these exter-nal systems do provide respiratory gating solutions, theyalso require time to set up on the patient and occasion-ally do not yield a useful gating waveform [6]. Ratherthan using an external system to track the respiratorycycle, it is also possible to extract a respiratory signalfrom the PET data itself in what is known as data-drivengating (DDG). The periodic motion of the radioactivitywithin the patient, attributable to respiration, can be ex-tracted from either the PET raw data (e.g. from a timeseries of short-duration sinograms [7]) or from PET im-ages (e.g. from a time series of short-duration PET im-ages [8]). In both cases, the duration must be a smallfraction of the respiratory period, e.g. 0.5 s. Data-drivengating has several potential advantages as compared totracking the respiratory cycle using an external system.DDG is based on the motion of the radioactivity withinthe patient and hence directly linked to the respiratorymotion of organs and tumours. External devices generallytrack the position of the chest wall and assume that or-gans of interest move synchronous to this. In fact, organsand lesions within the body can exhibit respiratory mo-tions that are phase-shifted compared to the chest wallmotion [9]. There is no set-up time involved for DDG, asno external system or tool is attached to the patient. TheDDG waveforms are inherently time-synchronised to thescanner without the possibility of a time offset, whichcould otherwise prevent robust gating. The clinical impactand feasibility of using DDG have been investigated byKesner et al. [10]. Until now, however, commercialdata-driven respiratory gating solutions have not beenwidely available.In this study, we evaluated respiratory waveforms gen-
erated by a DDG algorithm which has been commer-cially developed by GE Healthcare (Waukesha, WI,USA), marketed with the name MotionFree, and whichhas the 510(k) approval for use in the USA. The algo-rithm applies principal component analysis to a timeseries of down-sampled sinograms, with one of thesecomponents then selected and assumed to capture theperiod of the respiratory motion. The variation of theweighting factor for this component over time provides
a respiratory waveform similar to that provided by theexternal respiratory gating equipment. The method hasbeen recently validated in phantom studies, and severalpatient examples have been presented [11, 12]. Thecommercial implementation is built on the work ofThielmans et al. [7, 13, 14]. A preliminary version of thiswork has been presented previously [15].
MethodsStudy designThis evaluation of the prototype DDG algorithm focusedon several technical aspects of the respiratory gating toallow practical implementation in routine clinical use.The first part of the evaluation concerned the quality ofthe respiratory waveforms generated by the algorithm, asassessed on 157 FDG PET-CT scans and in an experi-ment using a moving phantom. The algorithm generatesits own metric of waveform quality (based on asignal-to-noise ratio and denoted as R). We first con-firmed, using the phantom data, how R increases whenthe amplitude of the respiratory motion applied to thephantom increases. Following this, the DDG waveformfrom each bed position of the 157 patient examinationswas visually examined and scored. These scores werecompared to the algorithm’s own metric. The variationof these scores with the location of the PET bed pos-ition, i.e. the patient’s body part, was investigated.The next step in the evaluation was an assessment of
the magnitude of changes in SUVmax values forwell-defined lesions in the thorax or abdomen. Recon-struction was performed using quiescent period gating(retaining 50% of coincidences) [16] and compared to re-construction without respiratory gating.Finally, we examined the dependence of acquisition dur-
ation on the algorithm’s metric of waveform quality. Partway through a patient acquisition, the algorithm makes anassessment of the magnitude of respiratory motion basedon this metric, from which it may trigger (above somethreshold) an extension to the acquisition duration for thecurrent bed position. This automatic extension of thescanning duration for bed positions where respiratory mo-tion is detected is expected to be useful, as it allows theapplication of quiescent period gating for these bed posi-tions while maintaining an adequate number of counts inthe retained dataset. When the magnitude of the respira-tory motion, as inferred from the quality metric, is belowthe threshold, it is assumed that there is little benefit andhence no need for respiratory gating. The scan duration isthen not extended, and a non-gated image will be gener-ated making use of all the acquired coincidences; patientthroughput is hence improved while image quality isretained. In combination, our evaluation aimed to enablea threshold value of R to be selected based on the ex-pected veracity of the waveform.
Walker et al. EJNMMI Research (2019) 9:1 Page 2 of 10

Phantom dataData were acquired from a moving phantom and proc-essed using the DDG algorithm. The phantom setupconsisted of a foam phantom containing five small 68Gespheres (the VQC-068 phantom; Eckert & Ziegler; Val-encia, CA, USA), each with an activity of 13 kBq. Thisphantom was placed on the QUASAR™ respiratory mo-tion platform (Modus QA; London, ON, Canada) thatperformed periodic motions in the Z direction, using adriving waveform that was typical for normal respiration(named Typical1, supplied by the manufacturer). A cy-lindrical, uniform 68Ge phantom (20 cm diameter, 19 cmheight, activity concentration of 0.2 kBq/mL) was placedon the scanner couch, adjacent to the platform to pro-vide a source of activity outside the scanner’s coinci-dence field-of-view. This setup was chosen to representthe case of imaging lesions within the lung. Data wereacquired with the platform driving the phantom with arange of amplitudes (0–15 mm, corresponding to max-imum displacements of 0–30 mm). There were three re-peated acquisitions at each amplitude. Each acquisitionwas at the same bed position and was 180 s in duration.Each acquisition was processed with the full 180-s dur-ation, and also after being split into two frames of 90 sand four frames of 45 s. This provided between 3 and 12R values at each amplitude for the given frame duration,from which the mean and standard deviations werefound. The standard error on the mean was calculatedas the standard deviation divided by √n, where nequalled 3 for 180 s, 6 for 90 s and 12 for 45 s.
Patient dataOne hundred fifty-seven sets of adult [18F]FDG PET ex-aminations comprising a total of 1149 acquired bed po-sitions were used to evaluate the performance of thedata-driven gating algorithm. These scans were acquiredon 20 different days in December 2017 and January2018, randomly chosen and are representative of[18F]FDG scans currently performed at our institution.Patients fasted for more than 6 h prior to i.v. administra-tion of 4MBq/kg [18F]FDG. The uptake period was 90min. The PET-CT examination commenced with afree-breathing helical CT, followed by free-breathingPET with 4 min/bed position (3 min/bed for legs). ThePET-CT scanner used was a Discovery 710 (GE Health-care; Waukesha, WI, USA). This is a fully 3D PET-CTscanner incorporating a time-of-flight technology withLYSO-based scintillation detectors [17].
DDG waveform generation and assessmentThe data-driven gating algorithm [13] was applied toeach bed position, including those where minimal re-spiratory motion was expected. The algorithm performsprincipal component analysis on a time series of
sinograms to identify the particular sinogram elementsthat change during the scan. The weighting factor foreach principal component describes how that compo-nent changes with time and may capture the phase andperiod of respiratory motion. The algorithm first binslistmode data into a set of down-sampled sinograms.Each sinogram in this set is 0.5 s in duration and down-sampled in its radial and angular components. No down-sampling is applied in the axial components to retainmaximum spatial resolution in the direction most com-monly associated with changes caused by respiratorymotion. Time-of-flight information is discarded in thisimplementation. There is then a correction forlow-frequency shifts in the total counts, to account forchanges that are not due to respiration (e.g. those fromradiotracer redistribution). The sinograms are thenmasked using a threshold to remove those parts of thesinogram that are considered to be outside the patient.PCA is then applied, and the first three principal com-ponents assessed for the strength of the respiratory sig-nal that they contain. This assessment is performedusing a signal-to-noise measure of respiratory-like fre-quencies within the data, denoted as R, derived from thepower spectrum of the transformed dataset. The max-imum value of the Fourier transform of the eigenvector’sweight function within the frequency range for respir-ation (0.1–0.4 Hz) is divided by its mean value for fre-quencies above this range (0.4–1.0 Hz). From these threeratios (respiratory maximum/mean noise), the largestone is chosen and defined as R. The corresponding prin-cipal component becomes the respiratory principal com-ponent, with the respiratory waveform extracted usingits eigenvector. The respiratory waveform is thus createdfrom this weighting factor, up-sampled to 0.25-s inter-vals using linear interpolation.For each waveform, a qualitative evaluation was also
performed. Each auto-scaled waveform was reviewed bytwo clinical scientists (medical physicists) blinded to theR value and scored on a 3-point scale assessing its suit-ability for clinical use (score S of 0 = no respiratory sig-nal, 1 = some respiratory-like signal but indeterminate, 2= acceptable signal considered to be respiratory). Thescores from the two readers were averaged. The axial lo-cation of the centre of each bed position, and hence eachcorresponding R and S values, was determined relativeto the reference location at the most superior point ofthe liver as determined from the CT image.We expected R to have some dependence on the ac-
quisition duration, and any threshold applied based on Rmay hence need to be scan duration-dependent. Assuch, all the patient data from bed positions with a4-min acquisition time were re-processed and the Rvalues re-calculated for a range of acquisition durations(10–240 s), keeping an initial portion of the data only.
Walker et al. EJNMMI Research (2019) 9:1 Page 3 of 10

The data were analysed by linear regression of the re-duced duration R values with those from the referencetime of 4 min (240 s). The slope of the linear fit (inter-cept fixed at 0) was used as a measure of the systematicchange in R with duration. The mean values of R werealso calculated, considering only bed positions with R ≥15 as found with the full 240-s bed duration.
Assessment of DDG-reconstructed imagesPET images were reconstructed using DDG-triggeredquiescent period gating (QPG), retaining 50% of coinci-dences [16]. Images were also reconstructed without gat-ing, using data from the first 2 min of each bed position,such that the number of coincidences used for image re-construction was matched to that used for the gatedimage. A non-gated image was also reconstructed usingthe full 4 min of data at each bed position. The recon-struction algorithm was the manufacturer’s Bayesianpenalised likelihood reconstruction (Q.Clear) with a betavalue of 400 [18].The three [18F]FDG PET-CT images for each patient
were reviewed by a clinical scientist (medical physicist)and screened for the presence of a focal, avid lesion inthe upper abdomen or thorax (including the rib cage).When multiple lesions were present, the most focal waschosen for analysis. The SUVmax from the lesion wasmeasured on each PET image. The axial location of thelesion was also recorded to allow the R value for this
lesion to be identified from its bed position. In the caseof a lesion being identified in the overlap region of twobed positions, the assigned values of R were calculatedas the sensitivity-weighted average of the two values.This allowed exploration of the relationships betweenthe lesion locations, R values and changes in SUVmax
due to the application of DDG.
ResultsThe phantom experiment confirmed that increasing theamplitude of respiratory-like motion led to an increasein R. The data also demonstrated a reduction in R forshorter acquisition durations. These results are pre-sented in Fig. 1.From the patient data with 1149 bed positions, there
was a strong (r = 0.86) and statistically significant (Waldtest, p < 0.001) positive correlation between the naturallogarithm of the algorithm’s figure of merit for the wave-form, log(R) and the score S assigned from visual inspec-tion. The distribution of R values for different scores S isshown in Fig. 2, where the good agreement between thetwo measures can be observed. There were 2 cases (outof 1149; 0.2%) where S equalled 0 while R was greaterthan 15. There were 35 bed positions (3%) where wave-forms were scored as 2 while R was less than 15. Exam-ples of waveforms for a range of scores S and R valuesare provided in Fig. 3.
Fig. 1 Relationship between R and motion amplitude found for a phantom performing respiratory-like motions. The maximum displacement was30mm, corresponding to a 15-mm amplitude. Lines of best fit are shown (using third-order polynomials). Results are presented for scan durationsequal to 180 s, 90 s and 45 s. Error bars represent standard errors on the mean
Walker et al. EJNMMI Research (2019) 9:1 Page 4 of 10

For a practical clinical implementation, one could set athreshold on the R value, above which respiratory gatingis applied. As the chosen threshold is increased, thenumber of bed positions with R exceeding the thresholdreduces. This is demonstrated in Fig. 4a, which alsoshows that there was an average of 1.2 bed positions perpatient examination that had an R value exceeding thedefault threshold of 15. Figure 4b shows that as the Rvalue threshold increases, a higher proportion of wave-forms is scored as visually acceptable. Of the 191 bedpositions with R greater than the threshold of 15, 164 ofthem (86%) were scored as acceptable for respiratorygating (S ≥ 1.5).
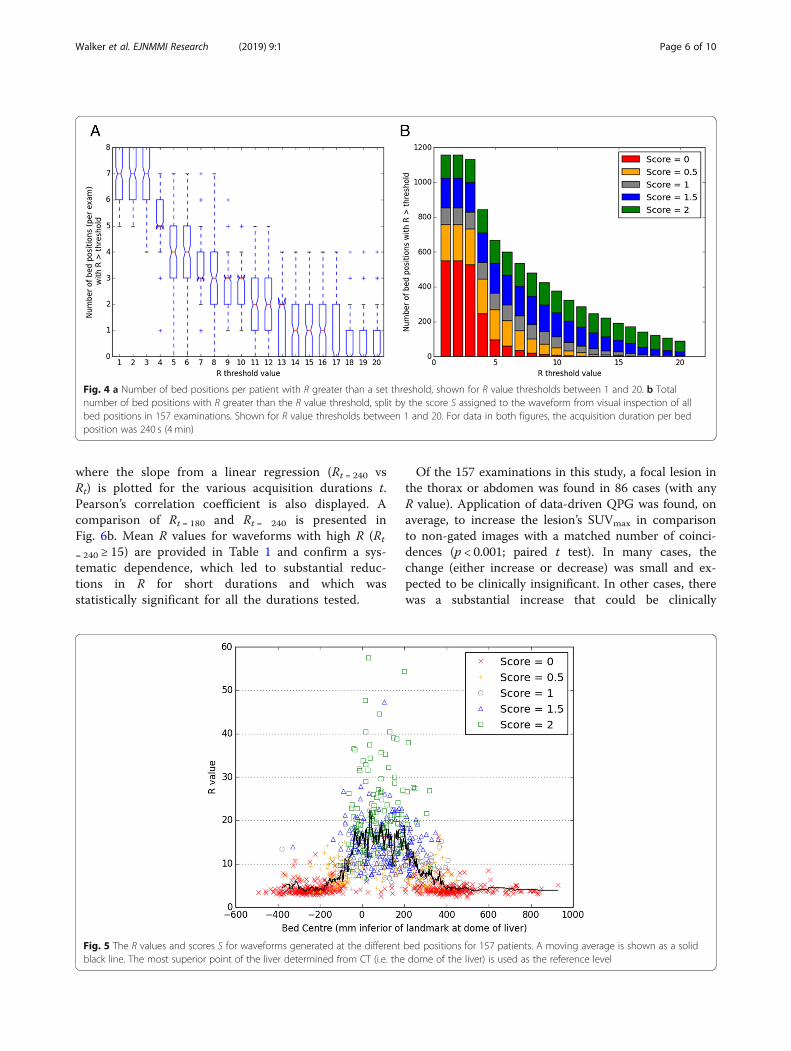
Waveforms with high R and S were found to originatefrom bed positions corresponding to the thorax and abdo-men: 90% of waveforms with R ≥ 15 had bed centres in therange 5.6 cm superior to 27 cm inferior from the dome ofthe liver. Using the eyes as an alternative reference point,this corresponded to 26–57 cm inferior of eye level. Thisis presented in Fig. 5. For regions where respiratory mo-tion was expected to be minimal such as the head andlegs, R tended to be < 6 and S tended to be 0.Analysis of the waveforms generated using reduced
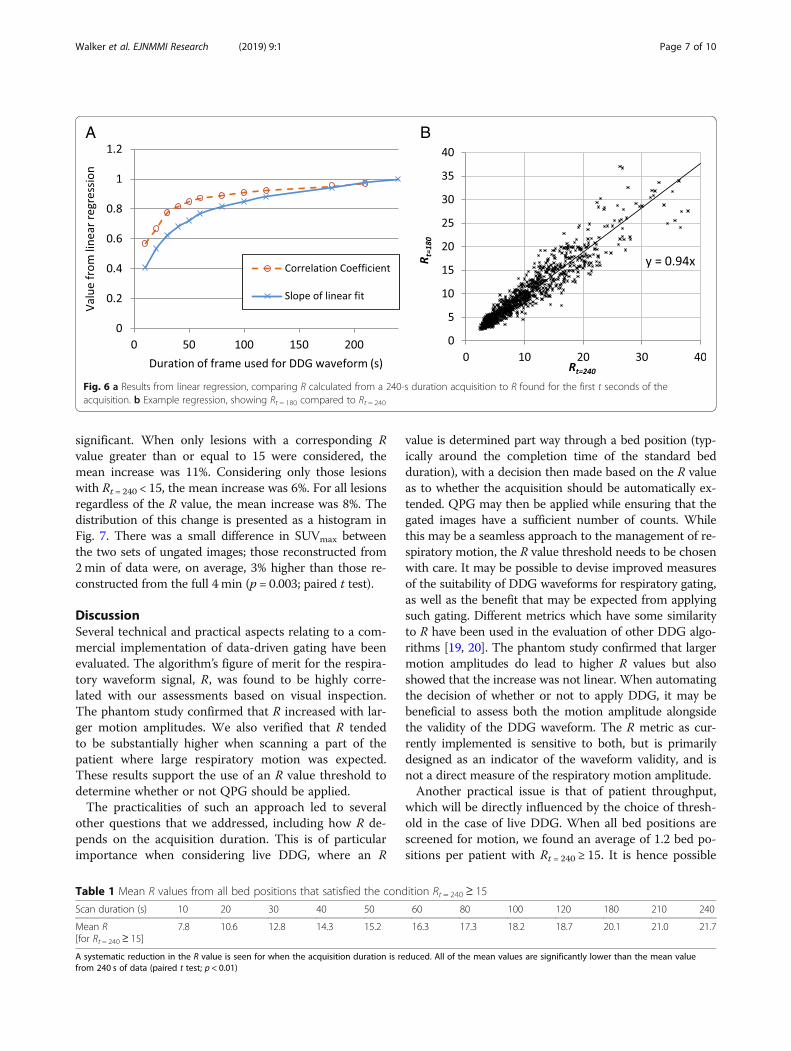
acquisition durations demonstrated that R is systemat-ically lower for shorter acquisitions. This dependenceof R on the acquisition duration is shown in Fig. 6a,
Fig. 2 Relationship between the algorithm’s figure of merit for the waveform (the R value) and the waveform score S as determined by tworeaders from visual inspection of the waveform. The horizontal dashed line shows a threshold, R = 15
Fig. 3 Example waveforms showing the first 120 s (out of 240 s) of data for five different bed positions. The R values and mean scores S areshown for each waveform
Walker et al. EJNMMI Research (2019) 9:1 Page 5 of 10
where the slope from a linear regression (Rt = 240 vsRt) is plotted for the various acquisition durations t.Pearson’s correlation coefficient is also displayed. Acomparison of Rt = 180 and Rt = 240 is presented inFig. 6b. Mean R values for waveforms with high R (Rt
= 240 ≥ 15) are provided in Table 1 and confirm a sys-tematic dependence, which led to substantial reduc-tions in R for short durations and which wasstatistically significant for all the durations tested.
Of the 157 examinations in this study, a focal lesion inthe thorax or abdomen was found in 86 cases (with anyR value). Application of data-driven QPG was found, onaverage, to increase the lesion’s SUVmax in comparisonto non-gated images with a matched number of coinci-dences (p < 0.001; paired t test). In many cases, thechange (either increase or decrease) was small and ex-pected to be clinically insignificant. In other cases, therewas a substantial increase that could be clinically
Fig. 4 a Number of bed positions per patient with R greater than a set threshold, shown for R value thresholds between 1 and 20. b Totalnumber of bed positions with R greater than the R value threshold, split by the score S assigned to the waveform from visual inspection of allbed positions in 157 examinations. Shown for R value thresholds between 1 and 20. For data in both figures, the acquisition duration per bedposition was 240 s (4 min)
Fig. 5 The R values and scores S for waveforms generated at the different bed positions for 157 patients. A moving average is shown as a solidblack line. The most superior point of the liver determined from CT (i.e. the dome of the liver) is used as the reference level
Walker et al. EJNMMI Research (2019) 9:1 Page 6 of 10
significant. When only lesions with a corresponding Rvalue greater than or equal to 15 were considered, themean increase was 11%. Considering only those lesionswith Rt = 240 < 15, the mean increase was 6%. For all lesionsregardless of the R value, the mean increase was 8%. Thedistribution of this change is presented as a histogram inFig. 7. There was a small difference in SUVmax betweenthe two sets of ungated images; those reconstructed from2min of data were, on average, 3% higher than those re-constructed from the full 4 min (p = 0.003; paired t test).
DiscussionSeveral technical and practical aspects relating to a com-mercial implementation of data-driven gating have beenevaluated. The algorithm’s figure of merit for the respira-tory waveform signal, R, was found to be highly corre-lated with our assessments based on visual inspection.The phantom study confirmed that R increased with lar-ger motion amplitudes. We also verified that R tendedto be substantially higher when scanning a part of thepatient where large respiratory motion was expected.These results support the use of an R value threshold todetermine whether or not QPG should be applied.The practicalities of such an approach led to several
other questions that we addressed, including how R de-pends on the acquisition duration. This is of particularimportance when considering live DDG, where an R
value is determined part way through a bed position (typ-ically around the completion time of the standard bedduration), with a decision then made based on the R valueas to whether the acquisition should be automatically ex-tended. QPG may then be applied while ensuring that thegated images have a sufficient number of counts. Whilethis may be a seamless approach to the management of re-spiratory motion, the R value threshold needs to be chosenwith care. It may be possible to devise improved measuresof the suitability of DDG waveforms for respiratory gating,as well as the benefit that may be expected from applyingsuch gating. Different metrics which have some similarityto R have been used in the evaluation of other DDG algo-rithms [19, 20]. The phantom study confirmed that largermotion amplitudes do lead to higher R values but alsoshowed that the increase was not linear. When automatingthe decision of whether or not to apply DDG, it may bebeneficial to assess both the motion amplitude alongsidethe validity of the DDG waveform. The R metric as cur-rently implemented is sensitive to both, but is primarilydesigned as an indicator of the waveform validity, and isnot a direct measure of the respiratory motion amplitude.Another practical issue is that of patient throughput,
which will be directly influenced by the choice of thresh-old in the case of live DDG. When all bed positions arescreened for motion, we found an average of 1.2 bed po-sitions per patient with Rt = 240 ≥ 15. It is hence possible
A B
Fig. 6 a Results from linear regression, comparing R calculated from a 240-s duration acquisition to R found for the first t seconds of theacquisition. b Example regression, showing Rt = 180 compared to Rt = 240
Table 1 Mean R values from all bed positions that satisfied the condition Rt = 240 ≥ 15
Scan duration (s) 10 20 30 40 50 60 80 100 120 180 210 240
Mean R[for Rt = 240 ≥ 15]
7.8 10.6 12.8 14.3 15.2 16.3 17.3 18.2 18.7 20.1 21.0 21.7
A systematic reduction in the R value is seen for when the acquisition duration is reduced. All of the mean values are significantly lower than the mean valuefrom 240 s of data (paired t test; p < 0.01)
Walker et al. EJNMMI Research (2019) 9:1 Page 7 of 10

to calculate the expected additional scanning timeneeded when moving from a workflow without respira-tory gating to one where live DDG is applied. On theother hand, if the current workflow made use of an ex-ternal gating system and extended acquisition durationsfor 2 fixed bed positions, changing to live DDG may re-sult in increased throughput.The commercial release of a data-driven gating solu-
tion for respiratory motion represents an important stepforward for the field. The development builds on manyimportant contributions from various groups. The corecomponent of all DDG algorithms is the method used toidentify and thus extract a respiratory signal from thedata. The intuitive image-based method tested byBundschuh et al. [8] was to position a volume of interest(VOI) over the lesion and to then calculate the z-coord-inate of the VOI’s centre of mass for each short timeframe. The method was found to yield usable data forDDG, but it relies on a manual VOI definition and alsorequires the often time-consuming reconstruction ofmany image frames. An automated image-based methodwas developed by Kesner et al. [20], whose algorithm se-lectively incorporates image voxels to build ahigh-quality respiratory signal from their combinedtime-activity curves. Approaches based on the raw coin-cidence (sinogram) data, with no requirement for a dy-namic image reconstruction, include the geometricsensitivity method [21] that utilises the fact that 3D PETscanners exhibit large variations in sensitivity with axialposition. Periodic fluctuations in the coincidence count-ing rates may then be attributed to respiratory motion.
This method was later developed further and compared tothe waveform provided by the change in the axial centreof mass of the true coincidences [22]. The inclusion oftime-of-flight information, as well as consideration of mo-tion in other directions (e.g. anterior-posterior), was usedin the centroid of the distribution algorithm recently eval-uated by Ren et al. [23]. Kesner and Kuntner [24] devel-oped a more complex, automated DDG algorithm thatextracts data from selected pixels within the filtered pro-jection data. Their algorithm combines several aspects ofthe aforementioned image-based works, incorporatingonly those sinogram pixels (projection bins) whose inclu-sion increases the standard deviation of the waveform as itis generated. On the other hand, the algorithm of Schleyeret al. uses spectral analysis to ascertain which sinogrampixels should be considered useful in the generation of therespiratory waveform [25]. Like the algorithm of Kesnerand Kuntner [24], the automatic PCA-based DDG algo-rithm tested in this work involves extraction of a wave-form from raw sinogram data with high temporalresolution but reduced spatial resolution [13]. Selection ofappropriate pixels is however performed via principalcomponent analysis. The temporal variations of the princi-pal component weighting factors are then examined, andthe component with the strongest respiratory frequency isretained. The variation of this component’s weighting fac-tor with time is used as the DDG waveform.Our evaluation has some limitations. The phantom ex-
periment considered changes in R with motion magni-tude but did so for an otherwise fixed radioactivitydistribution and with relatively little activity in the
Fig. 7 Histogram of change in SUVmax. The data are split into two groups based on the corresponding R values, below and above an R valuethreshold of 15. Where data are overlaid, a darker colour bar is shown
Walker et al. EJNMMI Research (2019) 9:1 Page 8 of 10
scanner’s FOV. It is expected that R, and also the most ap-propriate R value threshold, depends to some degree on avariety of other factors in addition to the magnitude of therespiratory motion. These include the radioactivity distri-bution within the patient as well as the part of the patientcurrently being imaged. We do not recommend choosingan R value threshold based solely on the results of thephantom experiment shown in Fig. 1. Calculated R valuescould potentially be modulated by a number of factors in-cluding those that change the statistical quality of the data.R is hence expected to change not just with the region be-ing imaged and scan duration but also the injected activ-ity, uptake period, patient habitus, and especially if adifferent radiotracer is used. The appropriate thresholdmay hence be scanner and protocol dependent.The current evaluation did not include a comprehen-
sive clinical evaluation of the gated images nor was acomparison attempted against waveforms from an exter-nal device. Our data did however confirm that applica-tion of DDG led to an increased SUVmax, on average.The observed increase due to respiratory gating wasboth expected and similar to that reported by others[26]. A comparison against the RPM device was madepreviously using anthropomorphic phantom data, forwhich the true driving waveform was known [12]. Al-though the similarities between waveforms from thePCA-DDG algorithm and the RPM system have beenpresented for several patients [7, 13], the benefit fromsuch a comparison is limited by the lack of a gold stand-ard. The reasonable agreement observed is reassuring,but it is difficult to ascertain the superiority of eithermethod. There is a similar limitation in the currentwork, where neither the R value nor the score S fromvisual inspection can be considered as a gold standardfor determining the validity of the waveform and its cor-respondence to the respiratory motion of internal or-gans. We anticipate that these important questions willbe addressed by the results of a large, ongoing clinicalstudy including detailed clinical evaluations.
ConclusionsFor the PCA-based DDG algorithm, the majority ofwaveforms with high R corresponded to the part of thepatient where respiratory motion was expected, and thewaveforms were deemed suitable for respiratory gatingwhen assessed visually. Application of DDG was foundto significantly increase the SUVmax of focal lesions bymitigating the blurring effects of respiratory motion.
AbbreviationsDDG: Data-driven gating; PCA: Principal component analysis; QPG: Quiescentperiod gating; RPM: Real-time Position Management™ system; SUV: Standarduptake value
AcknowledgementsThe authors thank Rob Johnsen and Scott Wollenweber for their assistancewith DDG processing and for discussion on the implementation andperformance of the MotionFree data-driven gating algorithm.
FundingDM is funded by a National Institute for Health Research (NIHR) / HealthEducation England (HEE) Clinical Lectureship (ICA-CL-2016-02-009). Thispaper presents independent research funded by the NIHR and HEE. Theviews expressed are those of the authors and not necessarily those of theNHS, the NIHR, HEE or the Department of Health.
Availability of data and materialsThe analysed data may be available from the corresponding author onreasonable request and with the permission Oxford University Hospitals NHSFoundation Trust.
Authors’ contributionsMW contributed to the study design and data acquisition; performed thedata processing, analysis and interpretation; and drafted the manuscript. AMcontributed to the data processing and manuscript revision. KB contributedto the data interpretation and manuscript revision. DM contributed to thestudy design, data interpretation and manuscript revision. All authors readand approved the final manuscript.
Ethics approval and consent to participateEthics approval was not required by our institution for the anonymous,retrospective use of patient data for optimisation of imaging procedures.
Consent for publicationNot applicable.
Competing interestsOxford University Hospitals NHS Foundation Trust has a research contractwith GE Healthcare covering loan of equipment.
Publisher’s NoteSpringer Nature remains neutral with regard to jurisdictional claims inpublished maps and institutional affiliations.
Author details1Radiation Physics and Protection, Churchill Hospital, Oxford UniversityHospitals NHS Foundation Trust, Oxford OX3 7LE, UK. 2Department ofRadiology, Churchill Hospital, Oxford University Hospitals NHS FoundationTrust, Oxford, UK. 3Department of Oncology, Old Road Campus ResearchBuilding, University of Oxford, Oxford, UK.
Received: 17 October 2018 Accepted: 18 December 2018
References1. Nehmeh SA, Erdi YE. Respiratory motion in positron emission
tomography/computed tomography: a review. Semin Nucl Med. 2008;38:167–76.
2. Pépin A, Daouk J, Bailly P, Hapdey S, Meyer M-E. Management of respiratorymotion in PET/computed tomography: the state of the art. Nucl MedCommun. 2014;35:113–22.
3. Osman MM, Cohade C, Nakamoto Y, Wahl RL. Respiratory motion artifactson PET emission images obtained using CT attenuation correction on PET-CT. Eur J Nucl Med Mol Imaging. 2003;30:603–6.
4. Meirelles GSP, Erdi YE, Nehmeh SA, Squire OD, Larson SM, Humm JL, et al.Deep-inspiration breath-hold PET/CT: clinical findings with a new techniquefor detection and characterization of thoracic lesions. J Nucl Med Off PublSoc Nucl Med. 2007;48:712–9.
5. Nehmeh SA, Erdi YE, Meirelles GSP, Squire O, Larson SM, Humm JL, et al.Deep-inspiration breath-hold PET/CT of the thorax. J Nucl Med Off Publ SocNucl Med. 2007;48:22–6.
6. Wells RG, Ruddy TD, DeKemp RA, DaSilva JN, Beanlands RS. Single-phase CTaligned to gated PET for respiratory motion correction in cardiac PET/CT. JNucl Med. 2010;51:1182–90.
Walker et al. EJNMMI Research (2019) 9:1 Page 9 of 10
7. Thielemans K, Schleyer P, Marsden PK, Manjeshwar RM, Wollenweber SD,Ganin A. Comparison of different methods for data-driven respiratory gatingof PET data. 2013 IEEE Nuclear Science Symposium and Medical ImagingConference (2013 NSS/MIC). Seoul: IEEE; 2013. p. 1–4. https://doi.org/10.1109/NSSMIC.2013.6829055.
8. Bundschuh RA, Martínez-Moeller A, Essler M, Martínez M-J, Nekolla SG,Ziegler SI, et al. Postacquisition detection of tumor motion in the lung andupper abdomen using list-mode PET data: a feasibility study. J Nucl Med.2007;48:758–63.
9. Rietzel E, Chen GTY, Choi NC, Willet CG. Four-dimensional image-basedtreatment planning: target volume segmentation and dose calculation in thepresence of respiratory motion. Int J Radiat Oncol Biol Phys. 2005;61:1535–50.
10. Kesner AL, Chung JH, Lind KE, Kwak JJ, Lynch D, Burckhardt D, et al.Validation of software gating: a practical technology for respiratory motioncorrection in PET. Radiology. 2016;281:239–48.
11. Morley NCD, McGowan DR, Gleeson FV, Bradley KM. Software respiratorygating of positron emission tomography-computed tomography improvespulmonary nodule detection. Am J Respir Crit Care Med. 2017;195:261–2.
12. Walker MD, Bradley KM, McGowan DR. Evaluation of principal componentanalysis-based data-driven respiratory gating for positron emissiontomography. Br J Radiol. 2018;91:20170793.
13. Thielemans K, Rathore S, Engbrant F, Razifar P. Device-less gating for PET/CTusing PCA. 2011 IEEE Nuclear Science Symposium Conference Record.Valencia: IEEE; 2011. p. 3904–10. https://doi.org/10.1109/NSSMIC.2011.6153742.
14. Bertolli O, Arridge S, Wollenweber SD, Stearns CW, Hutton BF, Thielemans K.Sign determination methods for the respiratory signal in data-driven PETgating. Phys Med Biol. 2017;62:3204–20.
15. Walker MD, Morgan AJ, McGowan DR. Evaluation of novel data drivenrespiratory gating waveforms. Eur J Nucl Med Mol Imaging. 2018;45(1):S716.
16. Liu C, Alessio A, Pierce L, Thielemans K, Wollenweber S, Ganin A, et al.Quiescent period respiratory gating for PET/CT. Med Phys. 2010;37:5037–43.
17. Bettinardi V, Presotto L, Rapisarda E, Picchio M, Gianolli L, Gilardi MC.Physical performance of the new hybrid PET∕CT Discovery-690. Med Phys.2011;38:5394–411.
18. Teoh EJ, McGowan DR, Macpherson RE, Bradley KM, Phantom GFV. Clinicalevaluation of the Bayesian penalized likelihood reconstruction algorithm Q.Clear on an LYSO PET/CT system. J Nucl Med. 2015;56:1447–52.
19. Büther F, Ernst I, Frohwein LJ, Pouw J, Schäfers KP, Stegger L. Data-drivengating in PET: influence of respiratory signal noise on motion resolution.Med Phys. 2018;45:3205–13.
20. Kesner AL, Bundschuh RA, Detorie NC, Dahlbom M, Ziegler SI, Czernin J, etal. Respiratory gated PET derived in a fully automated manner from raw PETdata. IEEE Trans Nucl Sci. 2009;56:677–86.
21. He J, O’Keefe GJ, Gong SJ, Jones G, Saunder T, Scott AM, et al. A novelmethod for respiratory motion gated with geometric sensitivity of thescanner in 3D PET. IEEE Trans Nucl Sci. 2008;55:2557–65.
22. Büther F, Dawood M, Stegger L, Wübbeling F, Schäfers M, Schober O, et al.List mode-driven cardiac and respiratory gating in PET. J Nucl Med. 2009;50:674–81.
23. Ren S, Jin X, Chan C, Jian Y, Mulnix T, Liu C, et al. Data-driven event-by-event respiratory motion correction using TOF PET list-mode centroid ofdistribution. Phys Med Biol. 2017;62:4741–55.
24. Kesner AL, Kuntner C. A new fast and fully automated software basedalgorithm for extracting respiratory signal from raw PET data and itscomparison to other methods. Med Phys. 2010;37:5550–9.
25. Schleyer PJ, O’Doherty MJ, Marsden PK. Extension of a data-driven gatingtechnique to 3D whole body PET studies. Phys Med Biol. 2011;56:3953–65.
26. Büther F, Vehren T, Schäfers KP, Schäfers M. Impact of data-drivenrespiratory gating in clinical PET. Radiology. 2016;281:229–38.
Walker et al. EJNMMI Research (2019) 9:1 Page 10 of 10