Embed Size (px)
Citation preview
DOCUMENT RESUME
ED 075 065 PS 005 781
AUTHOR DeVries, RhetaTITLE Evaluation of Cognitive Development with Piaaet-Type
Tests: Study of Young Bright, Average, and RetardedChildren. Final Report.
INSTITUTION Illinois Univ., Chicago. Coll. of Education.SPONS AGENCY Illinois State Office of the Superintendent of Public
Instruction, Springfield. Dept. of ProgramDevelopment for Gifted Children.; Office of Education(DHEW), Washington, D.C. Research and DevelopmentCenters Branch.
PUB'EATE [71]NOTE 222p.
EDRS PRICE MF-$0.65 HC-$9.87DESCRIPTORS *Cognitive Development; Cognitive Processes;
*Cognitive Tests; Compensation (Concept) CondeptFormation; *Conservation (Concept); Primary Grades;Sequential Learning; Tables (Data); TechnicalReports
IDENTIFIERS Holtzman Inkblot Test; *Piaget ;Jean) ; Stanford BinetIntelligence Test
ABSTRACTA study was conducted to clarify a number of issues
related to Piaget's theory of invariant sequantiality in childcognitive development. Ss were 143 middle-class white children ofbright, average and retarded psychometric abilities (measured by,performance on the Stanford-Binet Intellivnce Test). Bright andaverage Ss were chronologically aged 5-7 years; retarded Ss werementally aged 5-7 years and chronologically aged 6-12 years. Testswere individually administered in four sessions totalling about threehours as follows: guessing game, conservation of mass, familyegocentrism, egocentrism in left-right perspective, constancy ofgeneric identity, class inclusion, conservation of number, constancyof sex role, conservation of substance in the ring segment illusion,realism and internal-external differentiation in development of thedream concepts, conservation of length, transitivity of length,conservation of liquid continuous quantity, magic interview, objectsorting, and the Holtzman Inkblot Test. Procedures, scoring, andresults are given for each test. (KM)
U. S. DEPARTMENT OF HEALTH, EDUCAlION WELFAREOf Ha Of IDXATION
TIHS DCK:UW.ENT HAS PErNPiTPci.IPED D;AC,TLY AS RECEIVED FROM THEPEFISON OR 0:,!
cr, Vny,../ OR OPINIONSST_TE.12 00 NOT tiLi;E:SRILr. NijliE.Si ;41 OriiCIAL 01HCE EMJCATIONftOSITICIPI OR POLICY.
, EVALUATION OF COGNITIVE DEVELOPMENT WITH PlAGET-TYPE TESTS:STUDY OF YOUNG BRIGHT, AVERAGE, AND RETARDED CHILDREN
Rheta DeVries
College of Education
University of Illioois at Chicago Circle
Final Report to the Department of Program Development forGifted Children, Illinois Office of Public Instruction
FILMED FROM BEST AVAILABLE COPY
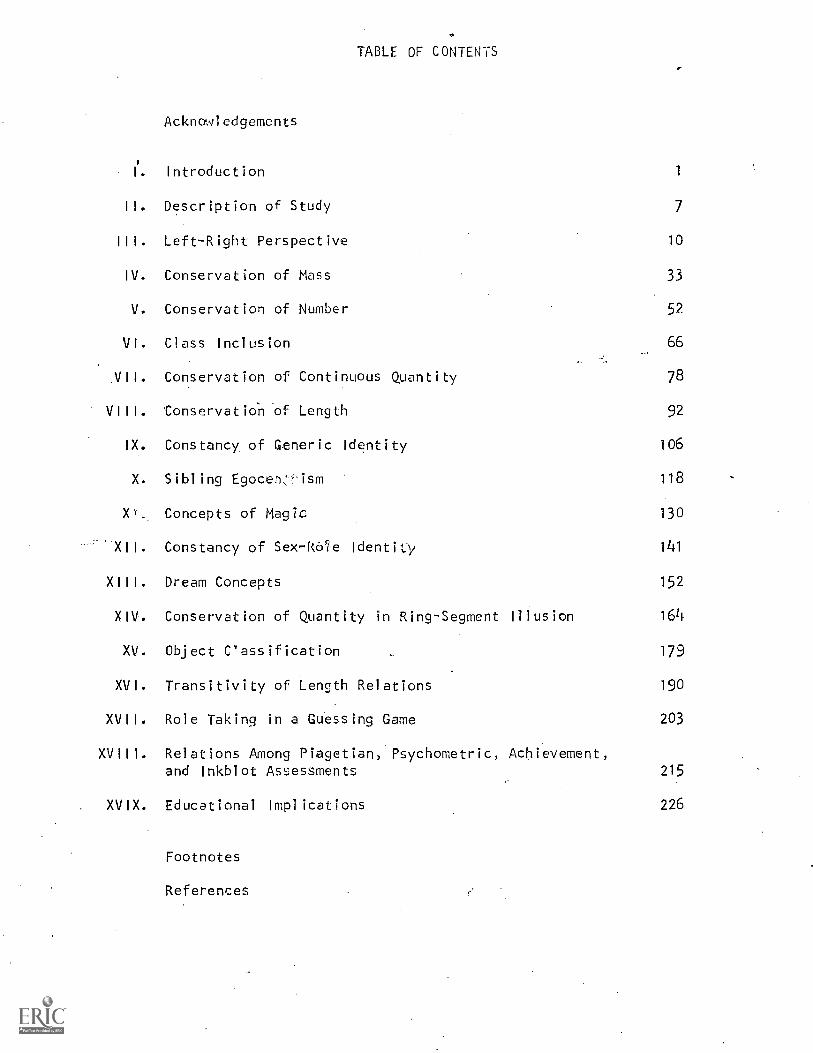
TABLE OF CONTENTS
Acknowledgements
I. Introduction 1
II. Description of Study 7
III. Left-Right Perspective 10
IV. Conservation of Mass 33
V. Conservation of Number 52
VI. Class Inclusion 66
VII. Conservation of Continuous Quantity 78
VIII. Conservation of Length 92
IX. Constancy. of Generic Identity 106
X. Sibling Egocen;ism 118
X. Concepts of Magic 130
XII. Constancy of Sex-Ro?e Identity 141
XIII. Dream Concepts 152
XIV. Conservation of Quantity in Ring-Segment Illusion 164
XV. Object Cassification 179
XVI. Transitivity of Length Relations 190
XVII. Role Taking in a Guessing Game 203
XVIII. Relations Among Piagetian, Psychometric, Achievement,and Inkblot As:::essments 215
. XVIX. Educational Implications 226
Footnotes
References
ACKNOWLEDGEMENTS
This study was supported by the Department of Program Development
for Gifted Children, Illinois Office of Public Instruction during 1966-69.
Supplementary support during 1968-69 was provided by the Office of Elucation,
U. S. Department of Health, . Education, and Welfare through the Chicago
Early Education Research Center, a component of the National Laboratory
on Early Childhood Education. Additional support during 1968-71 came
from the Urban Education Research Program and the Research Board of the
University of Illinois at Chicago Circle. The author is grateful to these
agencies for their support and confidence in the worthiness of this
research,
Appreciation must also be expressed to the school personnel of the
public schools in Champaign, Urbana, and St. Joseph, Illinois. Unit 4
Schools in Champaign particularly deserve recognition for their encourage-
ment of the study and for the provision of many supportive services which
facilitated the conduct of the study. I would especially like to thank
Dr. Arthur Turner, the cooperating teachers, principals, and the children
who participated in the study.
INTRODUCTION
Recent research with children (Kohlberg and DeVries, 1969), showingthat psychometric measures of cognitive development tap a differentaspect of intellect than do tasks developed by Piaget, led to a needto examine further the qualitative cognitive changes reflected by Piaget-type tasks, their unique utility in evaluating individual cognitivedevelopment, and their implications for .Rducational practice.
The study reported here is concerned with clarifying a number ufissues related to Piaget's theory of invariant sequentiality in childcognitive development. The focus is upon the period (from about five toseven years of age) in which Piaget finds an important qualitative changeoccurring in the structure and function of thought. The study ,oals are:
1. To refine ?iaget's description of stquential change for fifteentasks;
2. To investigate the relationship between cognitive developmentreflected by the Piaget*tasks and that reflected by standardizedtests of intelligence and achievement;
To explore the relative effects of chronological age, mentalage, IQ, and sex upon progress toward concrete operationalthought;
4. To examine the possible role of cognitive conflict as a factorin instigating progressive change in qualitative aspects ofthought;
5. To pursue the question of 'decal age in development within astage;
6. To investigate the relationship between cognitive developmentreflected by Piaget-type tasks and maturity level of responsesto a projective (inkblot) test;
7 To consider the efficacy of some artifactual explanationsaccounting for immature performance in Piaget-type tasks;
8. To investigate several issues pertaining to details of Piaget'stheory.
Pertinent Background Information
Jean Piaget's (Piaget, 1954; 1969; reviewed by Flavell, 1963, andAlmy, 1966) extensive research led him to postulate that children progressthrough an invariant succession of four stages in their cognitive develop-ment, each stage being a new and different level of integration whichincorporates the preceding stage; each of these stages, with the exceptionof the final stage of formal reasoning, possesses certain structural,characteristics which lead to deficiencies in reasoning ability. In the
study described here, the concern is' with the period of transition fromthe second stage of preoperational thought to the beginning of the third
stage of concrete operational thought. This transition involves a lesseningof the egocentric orientation which is expressed by the preoperationalchild's Inability to overcome his subjective view and take other perspectivesbesides his own; his failure to make the subjective objective differen-tiation results in a belief in the subjective as objective.' The transitionalso involves an increasing mobility in thought; the peroperational childis capable only of thinking in terms of static states whereas the concreteoperational child is capable of thinking in terms of dynamic transformationswhich are reversible. Thefe deficits of the preoperational child result'in the following failures which are overcome when the stage of concreteoperations is achieved:
1. He cannot conserve, i.e., mentally maintain the invariance of anobject or idea when transformations in irrelevant attributes occur. Forexample, the preoperational child believes the quantity of liquid to ehangewith change in level when it is poured into a container with differentdimensions.
2. He is unable to make a transitive inference. Piaget hypothesizedthis logical operation to be organized in a synchronized fashion withconservation. Transitivity is expressed in the statement that if .A is
greate-r than 13, and i3 is greater than C, then A is greater than C.
3. He is unable to think in terms of a hierarchical classificationsystem; if he is aL'ked to compare one of two subclasses, for example,with the whole of which it is a part, he compares, instead, the two sub-classes. For example, when presented with four M&M's and a mint, and toldhe should choose whichever has more to eat, either all the chocolate orall the candy, he selects the M&M's "because the mint is only one," eventhough he succeeds in giving the experimenter all five pieces when askedto "put all the candy in my hand." The preoperational child may use theverbal labels which suggest the possession of hierarchically organizedthought, e.g., boy, girl, man, woman, but object sorting activities wherehe makes groupings on the basis of relations of liking, identical similarity,family membership, etc., suggest that no hierarchically arranged cognitivesystem is guiding his grouping.
4. He is unable to understand the relitional meaning of left andright or the reciprocal nature of family relationships. Left and rightare always thought of in relation to himself so that he believes thatwhat is to his left is also to everyone else's left. Similarly, whilehe may say he has a brother, the fact that his brother has him for a brotheris not grasped.
5. He does not believQ that dreams are internal events caused byhimself, but believes that they originate and occur externally.
6. Just as he accepts the possibility of change in quantity withchange in appearance, he also accepts as real a "magical" transformation.For example, a toy cat transformed into a bird by means of a magician'schange bag is believed to have disappeared. Even belief in magic is someprogress from static acceptance of the change as a natural event.
7. As a result of his inability to take any perspective other thanhis own, he is unable to be deceptive and competitive, e.g., in a social
guessing game.
8. As a result of the static nature of his thought, he projectsstatic rather than active percepts in response to the ambiguous stimuliof inkblots.
Piaget's view of intellectual development provides the focus forassessment of the intellect which is quite different from the psychometricmethod currently in use. The psychometric method is based on the notionthat intelligence is unchanging. While it certainly is useful to knowhow a particular child compares with other children his age on a psycho-metric test (this information being expressed in terms of mental age andintelligence quotient), this knowledge does not tell anything about thestructural nature of the child's intellect which, according to Piaget'stheory, does change. Kohlberg (1963) discusses the distinctions betweenpsychometric intelligence and developmental level, pointingout thattests of developmental level attempt to assess global thought processor structure, whereas psychometric tests are designed to assess thought42"Lathsa.. The increasing amount of_evidence (Hunt, 1961) indicating thatIQ is not fixed and that intellectual competence can be greatly enhancedby experience or retarded by experiential deprivation has resulted in anincrease in need for assessment techniques to supplement psychometricmethods in the analysis of the cognitive capacities and needs of theindividual. Hunt discusses the advantages which assessment of intelligenceby Piagetian methods can have over the conventional methods, also pointingout that Piaget's description of the successive stages of intellectualdevelopment removes the necessity for some of the trial-and-error indetermining an appropriate match between environmental circumstances (suchas school experiences) and the nature of the central processes alreadydeveloped in order to promote further growth of these processes thatunderlie intelligence.
In order to explore the possibility that Plaget-type tasks andpsychometric tasks might actually be measuring the same aspects of intel-lect, a factor-analytic study (Kohlberg and DeVries, 1969) was undertakenin which a battery of tests of primary mental abilities and a battery ofPiaget-type tasks were administered to 67 bright and average children fiveand six years of age. Since a first factor included all the tests ofprimary mental ability, and second and third factors included the Piagettasks, it appears that the two assessment techniques do measure differentaspects of cognitive function. Therefore, it seems to be important tofocus upon the goals mentioned in the foregoing section of this proposal,further elaborated below:
1. Since Piaget's description of acquisition sequence is rathergross, a more detailed description of developmental changes occurring issought which would provide a basis for operationalizing educational objec-tives.
2. In order to further explore the relationship between cognitivedevelopment reflected by Piaget tasks and that reflected by standardizedtests already in widespread use, assessment of cognitive growth asmeasured by standardized achievement tests is compared with Piagetianmeasurement to find whether they, too, may measure different aspects ofcognitive function.
4.
3. General psychometric ability is controlled (bright, average,and retarded subjects are selected on the basis of IQ on the StanfordBinet Intelligence Test) in order to assess the effect of mental ageapart from IQ ( retarded subjects are of mental age 5, 6, and 7 yearsand can be compared with the average subjects with the same mental ageand with younger bright subjects with the same mental age). The effectof experience as indexed by chronological age is assessed by consideringperformance of subjects at different age levels within bright, average,and retarded groups. The possible effect of general ability (IQ) uponsequentiality in acquisition of prerequisites to Piaget's concreteoperational cognitive skills is explored by assessing the order ofacquisition separately for bright, average, and retarded subjects.The effect of sex upon cognitive development is considered because anumber of studies (reviewed in Flavell, 1963) have shown differences withPiaget-type measures, usually in the direction favoring boys. Sincepsychometric test items are selected which do not differentiate on thebasis of sex, thiF possibility particularly needs exploration.
4. Piaget (1962) discussed the relationship between affect andcognition, arguing that a specific affective reaction results from adiscrimination, which is a cognitive act. Smedslund's (1961, 1964)study of conservation and transitivity has shown that it is importantthat children experience contradictions in order to develop an equilibratedcognitive system and has demonstrated that change is initiated by dissonantexperiences. Relevant to .phis is the work of Charlesworth (1964) who
. showed that surprise and other involuntary emotional responses can be usedas indicators of cognitive level in conservation of substance. He alsopresents convincing evidence that some deviation from what is expectedimproves the capacity for retaining information. The author's (1969)research on constancy of generic identity also provides evidence for theutility of affective assessment in the evaluation of the col,itive.state;in that study rated discomfort, fear, and surprise were related to beliefor disbelief in the transformation of a live cat into a ferocious-lookingdog or benign-looking rabbit by means of realistic masks.
Conflict, rated from videotape and validated by comparison withtimed response latencies, will be considered in relation to developmentallevel in order to investigate further the notion that the experienceof dissonance may be important in transition from one stage to the next.
5. Piaget (1969) has noted time lags in development within stages-where the child is able to solve problems in one situation or with onematerial but not in another situation or with other material. While hefeels that the exact details of such a decalage are unpredictable and willvary inconsistently, it seems important to explore the extent to whichthere may be some consistency for these tasks and subjects. Though Piagethas found that conservation of mass, for example, precedes that of weightwhich, in turn, precedes conservation of volume, it would be useful if wecould ascertain where other tasks generally fall, at least, in the sequenceof development. To that end, the fifteen tasks employed in this studywill be subjected to Bender's (1969) monotonicity analysis.
6. Rorschach (1942) related the production of inkblot associationswhich involved movement to intelligence as well as to emotional processes.Beck's (1960) research resulted in the finding that children below the age
of seven rarely give movement responses, and this is substantiated bynormative work by Ames (1952) and her colleagues, by Ford (1946) , LedwFth(1959), Meyer and Thompson (1952), and Stein (1956). Gair (1947) found ahigher frequency of movement responses in a group of very superior seven-year-olds.
The ability to produce a movement response to an inkblot seems toimply a kind of mental activity similar to what Pi6,-;et speaks about whenhe talks about reversibility. Both require a mental flexibility whichmakes possible the imagination of some displacement. However, it seemsthat movement percepts could arise from a cognitive structure capableonly of renversibility (one-way reversing, rather than totally reciprocalreversing); therefore, movement percepts probably occur prior to conserva-tion.
In addition to some possibly important implications for bridging thegap between psychoanalytic and cognitive views of child development, it
seems that some advantage might obtain if the inkblot test can be shownto have some specific place in the diagnosis of cognitive developmentthat of indicating development past the stage of static structure.
Recent work by Joe Thorpe (196 ), one of Holtzman's students, hasyielded developmental indices which are derived from patterns of scoreson the standard Holtzman scores. These are to be used in comparison withthe developmental Piaget task scores.
7. The efficacy-of some artifactual explanations for immatureperformance on Piaget tasks . investigated:
a. Memory of previous states or relationships is assessed todetermine whether forgetting is a factor in preoperational functioningon concrete operational tasks in order to meet the frequent coltentionthat nonconservers, for example, have simply forgotten the previous stateof things.
b. The possibility that some children may respond with a settoward or against the object manipulated by the experimenter is controlledby sometimes manipulating the correct object and sometimes the incorrectone. This also controls for false-positives as a result of perseveration.
c. Some critics of Piaget's method have contended that immatureresponses are the result of requisite verbal facility. To counter thisobjection, tasks are designed, wherever possible, so that the child isasked to respond by pointing.
d. Other skeptics have argued that Piaget's subjects who appearso immature are simply not motivated to be correct or that they are simplyresponding as they think the experimenter wants them to. To deal with thisobjection, tasks were designed, wherever possible, in such a way as tocapitalize on children's desire for such appealing edibles as colored gumsticks, candy, cookies, and Coco-Cola. Perceptual contradictions werearranged so that the smaller quantity appeared to be greater; thus, animmature child actually was taking the smaller quantity, though he stronglyvowed he had gotten the bigger one.
5.
6.
e. Some have argued that what appear to be immature responsesto conservation tasks are the result of semantic confusion; they feel, thatfailure to understand the terms "same," "less," and "more" cause artifactualnonconservation. In an effort to explore this possibility, unequalstimuli have been used throughout the conservation tasks. Verbal instruc-tions have been simplified so that only an understanding of "more," theeasiest of the comparatives previously mentioned according to a study byGriffiths, Shantz, and Sigel (1967), is required. in addition, thechild was required to demonstrate his ini.,tial understanding of whichobject has "more to eat" before the change in ,configuration.
f. Bruner (1966) has contended that many young children possessthe capacity to conserve but are misled by the perceptual contradictioninto giving nonconservation responses. Since it appears to this investi-gator that the ability to respond in a conserving fashion when the perceptualcontradiction is not present is better interpreted as an expectancy ofconstancy, and since conservation is not really tested without the apparentcontradiction, prediction questions werk included in the conservation taskswhich provide a basis for further exploration of this issue.
8. Several issues pertaining to theoretical details are investigated:
a. Piaget has postulated that the logical operations of multipli-cation of relations and compensation are necessary to conservation ofcontinuous quantity. This is explored by asking subjects to predict thelevel to which liquid will rise when poured into an opaque container fromanother differing in size.
b. Elkind (1967) has opened a controversy concerning theexistence of two kinds of conservation -- conservation of the identity ofa single quantity, and conservation of the equivalence relationship betweenthe two quantities when one is altered and one is not. Elkind contends.th6t conservation problems are equivalence situations but that interpreta-tions are made in terms of identity; he suggests that identity conservationprobably occurs prior to equivalence conservation. The use of unequalstimuli, use of equivalence conservation. The use of unequal stimuli,use of probes concerning whether the quantity "really gets to be more toeat/drink," and use of two identity tasks (generic identity and sex-roleidentity) will be explored at length in terms of this issue.
c. Questions of invariance in sequentiality and decalage havealready been discussed as primary goals of the study.
7.
DESCRIPTION OF STUDY
Subjects
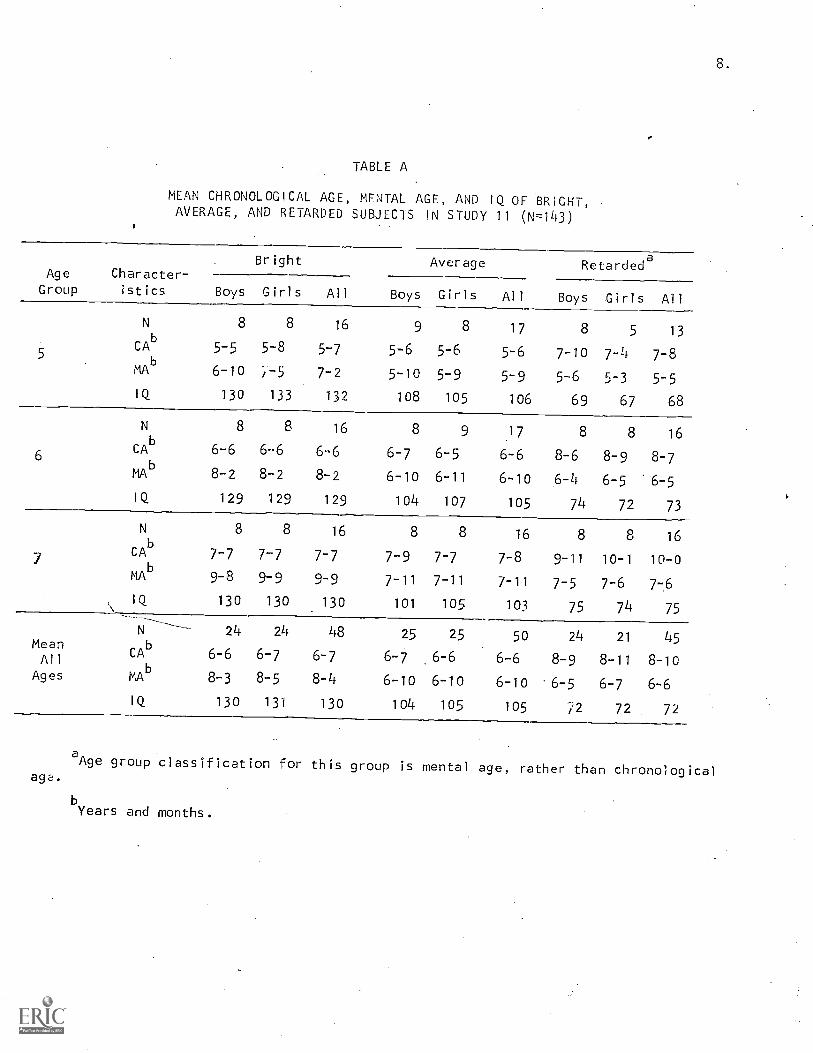
Ss were 143 middle-class white children, of bright, average, and
retarded psychometric abilities (measured by performance on the Stanford-
Binet Intelligence Test) enrolled in the public schools of Champaign,
Illinois. Bright and average children were chronologically aged 5-7
years; retarded Ss (including some pupils in Urbana and Saint Joseph,
Illinois) were mentally aged 5-7 years and chronologically aged 6-12
years. Table A shows the distribution and characteristics of the sample.
Procedure
The battery of tests were individually administered in four sessions
totalling about three hours, as follows:
Session 1: Guessing GameConservation of MassFamily EgocentrismEgocentrism in Left-Right PerspectiveConstancy of Generic IdentityClass Inclusion
Session 2: Conservation of NumberConstancy of Sex RoleConservation of Substance in the Ring Segment IllusionRealism and Internal-External Differentiation in Development
of the Dream ConceptsConservation of Length
Session 3: Transitivity of LengthConservation of Liquid Continuous QuantityMagic InterviewObject So7ting
Session 4: Holtzman Inkblot Test
Videotapes were made of the magic interview and the five conservation
tasks, and painstaking, time-consuming rating of conflict in choice situations
and timing of all response latencies were made.
Testing was done in a 16-foot trailer especially built for this study
which the experimenter moved to 16 schools in Champaign, Illinois (and to
8.
TABLE A
MEAN CHR0N0L0G1CAL AGE, MENTAL AGE, AND IQ OF BRIGHT,AVERAGE, AND RETARDED SUBJECTS IN STUDY 11 (N=143)
Bright Average Retardeda
Age Character-Group istics Boys Girls All Boys Girls All Boys Girls All
N
CAb
MAb
IQ
8
5-5
6-10
130
8
5-8
"/-5
133
16
5-7
7-2
132
9
5-6
5-10
108
8
5-6
5-9
105
17
5-6
5-9
106
8
7-10
5-6
69
5
7-4
5-3
67
13
7-8
5-5
68
N 8 8 16 8 9 17 8 8 16
6CA
b6-6 6-6 6-6 6-7 6-5 6-6 8-6 8-9 8-7
MAb 8-2 8-2 8-2 6-10 6-11 6-10 6-4 6-5 6-5IQ 129 129 129 104 107 105 74 72 73
N 8 8 16 8 8 16 8 8 16
CAb
7-7 7-7 7-7 7-9 7-7 7-8 9-11 10-1 10 -0
MAb
9-8 9-9 9-9 7-11 7-11 7-11 7-5 7-6 7-6
IQ 130 130 130 101 105 103 75 74 75
MeanAll
Ages
N ----
CAb
MAbMA
24
6-6
8-3
24
6-7
8-5
48
6-7
8-4
25
6-7
6-10
25
6 -6
6-10
50
6-6
6-10
24
8-9
.6-5
21
8-11
6-7
45
8-10
6-6IQ 130 131 130 104 105 105 ;2 72 72
aAge group classification for this group is mental age, rather than chronological
bYears and months.

9.
Few schools in Urbana, and Saint Joseph, Illinois).
In addition to these measures, achievement test performance for bright
an'! average Ss was obtained from the school system, and scores were
interpolated for the time of Piaget testing.
10.
LEFTRIGHT PERSPECTIVE
METHOD
Procedure
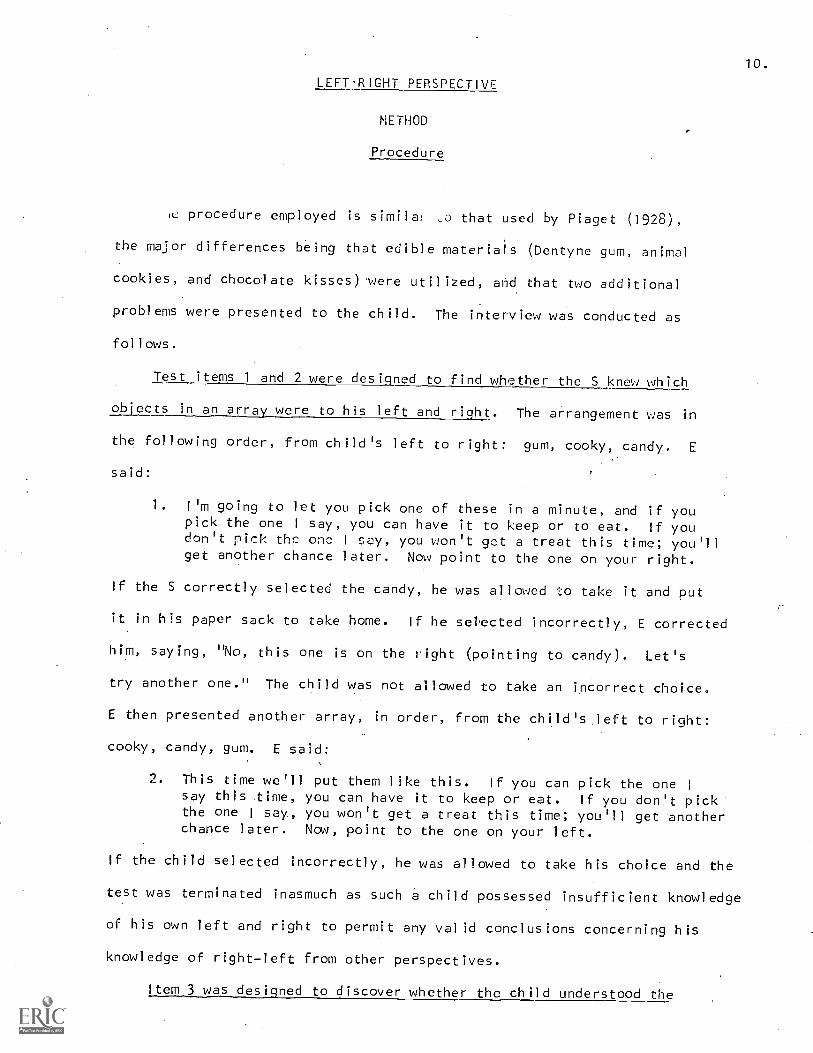
(t.2 procedure employed is similar ,0 that used by Piaget (1928),
the major differences being that edible materials (Dentyne gum, animal
cookies, and chocolate kisses) were utilized, and that two additional
problems were presented to the child. The interview was conducted as
follows.
Test items 1 and 2 were designed to find whether the S knew which
objects in an array were to his left and right. The arrangement 'vas in
the following order, from child's left to right: gum, cooky, candy. E
said:
1. I'm going to let you pick one of these in a minute, and if youpick the one I say, you can have it to keep or to eat. If youdon't rick the one I say, you won't get a treat this time; you'llget another chance later. Now point to the one on your right.
If the S correctly selected the candy, he was allowed to take it and put
it in his paper sack to take home. If he selected incorrectly, E corrected
him, saying, "No, this one is on the right (pointing to candy). Let's
try another one." The child was not allowed to take an incorrect choice.
E then presented another array, in order, from the child's left to right:
cooky, candy, gum. E said:
2. This time we'll put them like this. If you can pick the one I
say this time, you can have it to keep or eat. If you don't pickthe one I say, you won't get a treat this time; you'll get anotherchance later. Now, point to the one on your left.
If the child selected incorrectly, he was allowed to take his choice and the
test was terminated inasmuch as such a child possessed insufficient knowledge
of his own left and right to permit any valid conclusions concerning his
knowledge of rightleft from other perspectives.
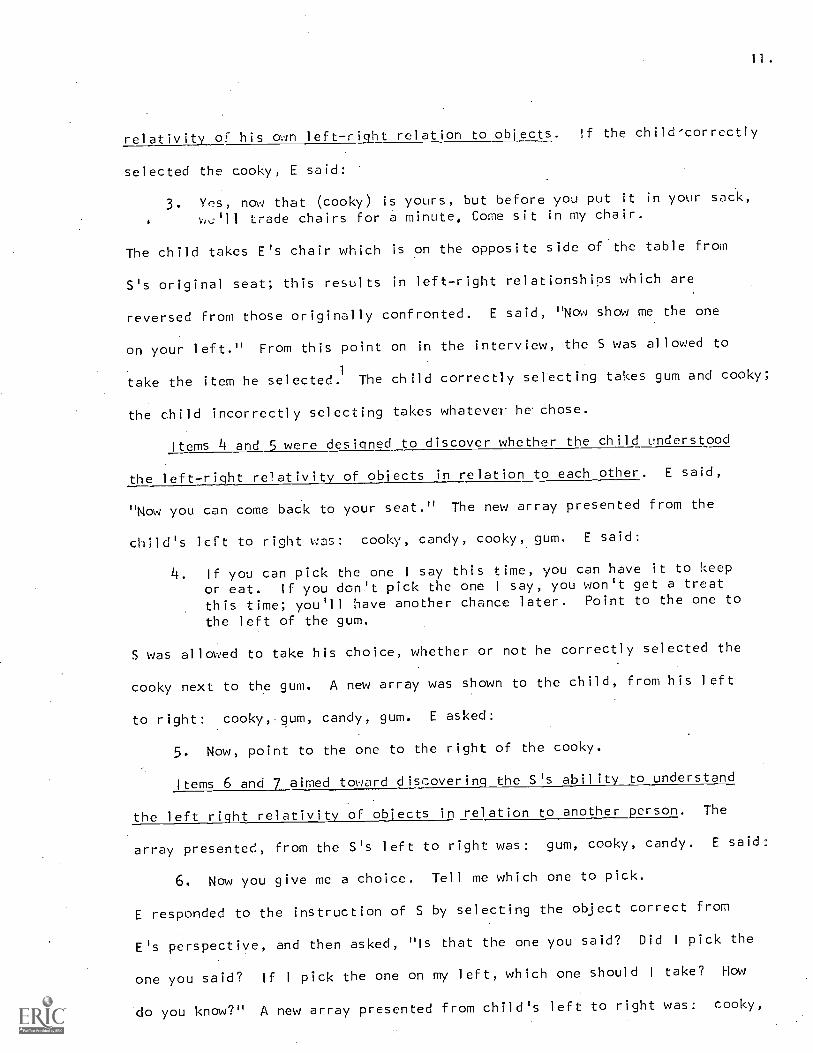
Item 3 was designed to discover whether the child understood the
11.
relativity of his own left-right relation to objects. If the child-correctly
selected the cooky, E said:
3. Yes, now that (cooky) is yours, but before you put it in your sack,
we'll trade chairs for a minute. Come sit in my chair.
The child takes E's chair which is on the opposite side of the table from
S's original seat; this results in left-right relationships which are
reversed from those originally confronted. E said, "Now show me the one
on your left." From this point on in the interview, the S was allowed to
take the item he selected.1 The child correctly selecting takes gum and cooky;
the child incorrectly selecting takes whatever he chose.
Items 4 and 5 were designed to discover whether the child understood
the left-right relativity of objects in relation to each other. E said,
"Now you can come back to your seat." The new array presented from the
child's left to right was: cooky, candy, cooky, gum. E said:
4. If you can pick the one I say this time, you can have it to keep
or eat. If you don't pick the one I say, you won't get a treat
this time; you'll have another chance later. Point to the one to
the left of the gum.
S was allowed to take his choice, whether or not he correctly selected the
cooky next to the gum. A new array was shown to the child, from his left
to right: cooky,.gum, candy, gum. E asked:
5. Now, point to the one to the right of the cooky.
Items 6 and] aimed toward discovering the S's ability to understand
the left right relativity of objects in relation to another person. The
array presented, from the S's left to right was: gum, cooky, candy. E said:
6. Now you give me a choice. Tell me which one to pick.
E responded to the instruction of S by selecting the object correct from
E's perspective, and then asked, "Is that the one you said? Did I pick the
one you said? If Ipick the one on my left, which one should I take? How
do you know?" A new array presented from child's left to right was: cooky,
12.
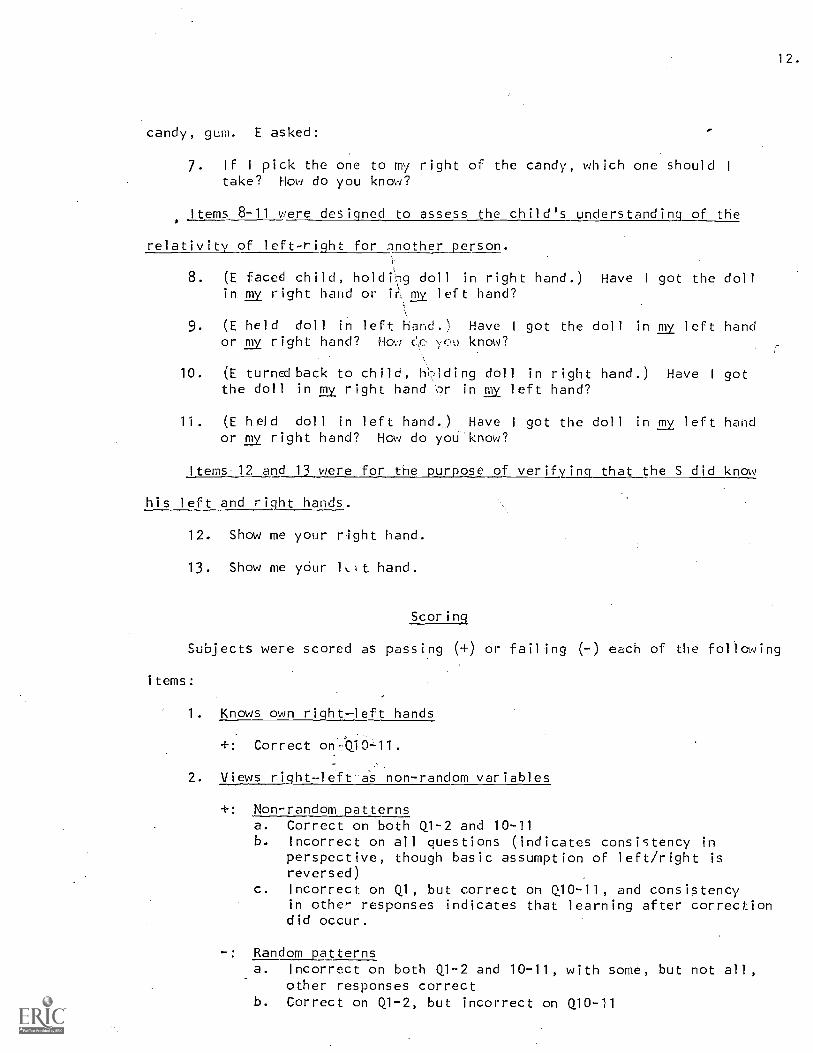
candy, gum. E asked:
7. If I pick the one to my right of the candy, which one should I
take? How do you know?
Items 8-11 were designed to assess the child's understanding of the
relativity of left-right for ;mother person.
8. (E faced child, holdiflg doll in right hand.) Have I got the dollin Ey right hand or i t Ey left hand?
9. (E held doll in left hand.1 Have I got the doll in Ey left handor my right hand? How ese \eq.) know?
10. (E turned back to child, Wniding doll in right hand.) Have I gotthe doll in my right hand or in Ey left hand?
11. (E held doll in left hand.) Have I got the doll in my left handor Ey right hand? Hew do you know?
Items 12 and 13 were for the purpose of verifying that the S did know
his left and right hands.
12. Show me your right hand.
13. Show me your lit. hand.
Scoring
Subjects were scored as passing (+) or failing (-) each of the following
items:
1. Knows own right-left hands
+: Correct on-Q1011.
2. Views right-left.a-s non-random variables
+: Non-random patternsa. Correct on both Q1-2 and 10-11b. Incorrect on all questions (indicates consistency in
perspective, though basic assumption of left/right is
reversed)c. Incorrect on Ql, but correct on Q10-11, and consistency
in other responses indicates that learning after correctiondid occur.
: Random patternsa. Incorrect on both Q1-2 and 10-11, with some, but not all,
other responses correctb. Correct on Q1-2, but incorrect on Q10-11
13.
c. Incorrect on Q1-2, correct on Q10-11, with inconsistencyin other responses such that learning after correction issuspect
3. Not always egocentric in views of left-right
+: a. If non-random view prevails, correct on Q6-7, or Q8-9,or Q4-5
h. Consistent in naming other's hands, i.e., one is identifiedas left whether E has back toward or faces S, and other is
identified as right in both positions
Note: Subjects with random patterns are scored "-'1
4. Views left -right in non-absolute fashion, i.e., knows that left-right change relative to his own perspective
+: If non-random, correct on Q3
Note: Subjects with random patterns are scored "-"
5. Applies other-opposite rule
+: Knows left right of other are opposite to own left-right whenother faces hima. If non-random and correct on Q1-2 and 10-11, correct on
Q8-9b. If non-random and incorrect on Q1-2 and 10-11, incorrect
on Q8-9
6. Takes relative view of other's right-left hands
+:. a. If non-random and correct on Q10-11, correct on Q8-9 and 12-13b. If non-random and incorrect on Q10-11, incorrect on Q8-9
and 12-13
7. Takes relative view.of object
+: If non-random, correct on both Q4-5 and Q6-7
In addition, invididual patterns of responses to questions concerning
left and right were analyzed in terms of 1) consistency in identifying own
left and right, 2) understanding of the non-random nature of left and
right, and 3) degree of relativity ascribed to the -left -right concept.
Table .1 shows patterns of responses given by Ss to test questions. (Not
all possible combinations of responses occurred.) The left (L) and right
(R) notations refer to what was designated left and right on all questions
from the point of view of the reader as if he faced E on Q1-2. Whether the
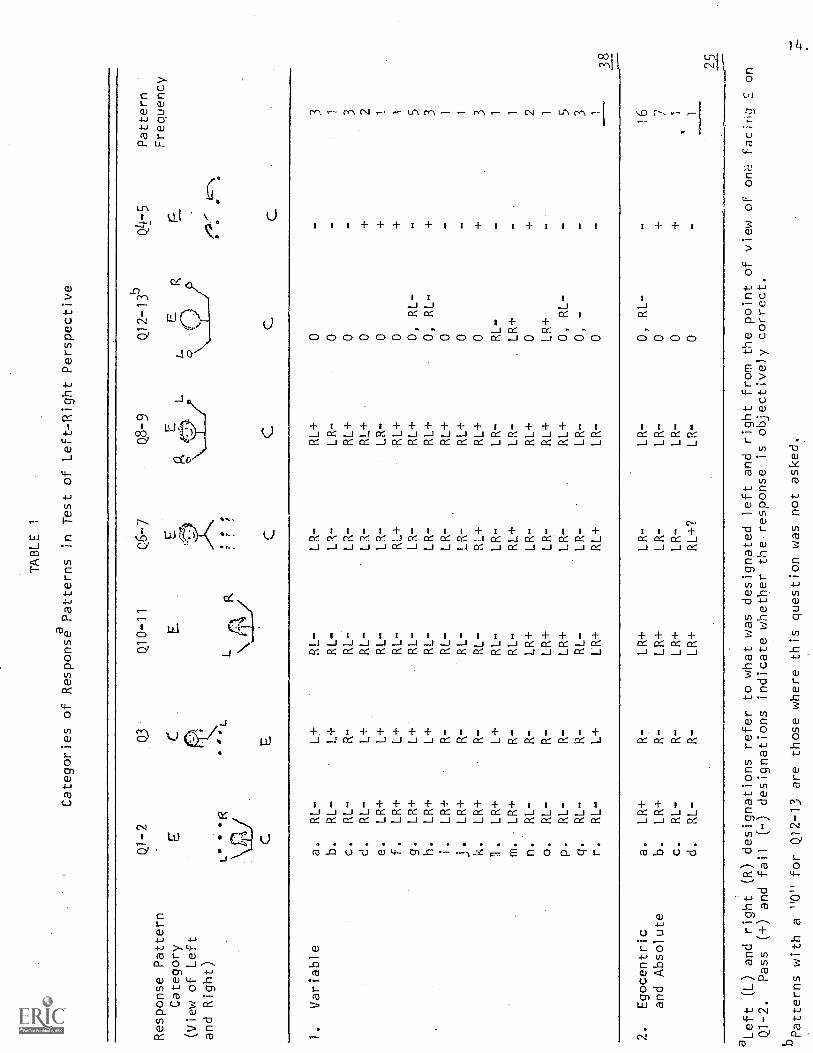
TABLE 1
Categories of Response Patterns in Test of Left-Right Perspective
Response Pattern
Category
(View of Left
and Right)
1.
Variable
2.
Egocentric
and Absolute
Q1-2
Q3
Q10-11
Q6-7
EC
E.
L°I2
LR
??
?
Q8- 9
L
Q12-13b
Q4-5
(2:
Pattern
Frequency
C.
EC
CC
a.
RL-
L+
RL-
LR-
RL+
03
b.
RL-
L+
RL-
LR-
LR-
01
RL-
R-
RL-
LR-
RL+
0-
3
e.
RL-
L+
RL-
LR-
RL+
0+
2
e.
LR+
L+
RL-
LR-
LR-
0+
1
f.
LR+
L+
RL-
RL+
RL+
0+
1
g.
LR+
L+
RL-
LR-
RL+
0,
RL-
5
h.
LR+
L+
RL-
LR-
RL+
0,
RL-
+3
i.
LR+
R-
RL-
LR-
RL+
01
j.
LR+
RL-
la-
RL+
01
LR+
R-
RL-
RL -+
RL+
0+
3
1.
LR+
L+
RL-
LR-
LR-
RL-
1
m.
LR+
R-
RL-
RL+
LR-
.LR+
1
n.
RL-
R-
LR+
LR-
RL+
0+
2
o.
RL-
R-
LR+
LR-
RL+
LR+
1
p.
RL-
R-
LR+
LR-
RL+
0,
RL-
-5
q.
RL-
R-
RL-
LR-
LR-
0,
--
3
r.
RL-
LR+
RL+
LR-
01
38
a.
LR+
R-
LR+
LR-
LR-
0,
RL-
16
b.
LR+
R-
LR+
LR-
LR-
0
c.
RL-
R-
LR+
LR-
LR-
0
d.
RL-
R-
LR+
RL+?
LR-
0
_25
aLeft (L) and right (R) designations refer to what was designated left and right from the point of view of
on-?:., faciny E on
Q1-2.
Pass (+) and fail
(-) designations indicate whether the response is objectively correct.
bPatterns with a "0" for Q12-13 are those where this question was not asked.
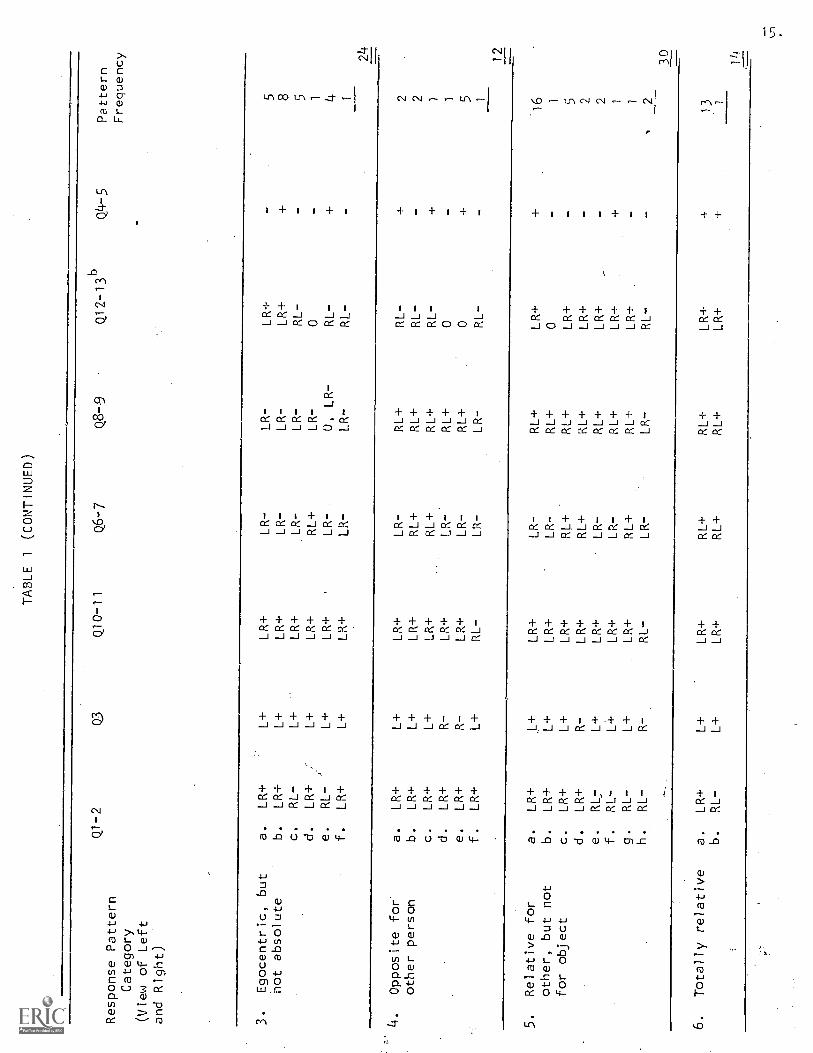
TABLE 1
(CONTINUED)
Response Pattern
Category
(View of Left
and Right)
b13
2-
Q1-2
Q3
Q10-11
Q6-7
Q8-9
Q12-13b
Pattern
Frequency
3.
Egocentric, but
a.
LR+
L+
LR+
LR-
LR-
LR+
-5
not absolute
b.
LR+
L+
LR+
LR-
LR-
LR+
+8
c.
RL-
L+
LR+
LR-
LR-
RL-
5d.
LR+
L+
LR+
RL+
LR-
01
e.
RL-
L+
LR+
LR-
0, LR-
RL-
+4
f.
LR+
L+
LR+
LR-
LR-
RL-
1
.Opposite for
a.
LR+
L+
LR+
LR-
RL+
RL-
+2
other person
b.
LR+
L+
LR+
RL+
RL+
RL-
2c.
LR+
L+
LR+
RL+
RL+
RL-
+I
d.
LR+
R-
LR+
LR-
RL+
0-
1
e.
LR+
R-
LR+
LR-
RL+
0+
5f.
LR+
L+
RL-
LR-
LR-
RL-
1
12
5.Relative for
a.
LR+
,L+
LR+
LR-
RL+
LR+
+'16
other, but not
b.
LR+
L+
LR+
LR-
RL+
01
for object
c.
LR+
L+
LR+
RL+
RL+
LR+
-5
d.
LR+
R-
LR+
RL+
RL+
LR+
2e.
RL-
L+
LR+
LR-
RL+
LR+
-2
f.
RL-
L+
LR+
LR-
RL+
LR+
+1
g.
RL-
L+
LR+
RL+
RL+
LR+
-1
h.
RL-
R-
RL-
LR-
LR-
RL-
-.
2
30
6.
Totally relative
a.
LR+
L+
LR+
RL+
RL+
LR -4-
-
13
b.
RL-
L+
LR+
RL+
RL+
LR+
14
16.
designation is objectively correct is indicated by (correct) or '
(incorrect). The entire pattern of test responses is then studied to
ascertain an individuals's view of left and right. Patterns are classified
into. six categories:
1. Variable: Patterns indicating that lef and right arc. viewed
random variables are of lin,. .n Patterns a-d the S incorrectly
identifies his own right and lift hands (Q10-11) as well as objects to his
left and right (Q1-2), but he does not consistently give the objectively
incorrect responses to other questions; thus, his left--right peralpective
cannot be accounted for in terms of a simple reversal. In Pattern a, for
example, the S gives the objectively correct responses when asked to take
E's seat and show the object on his left (Q3) and when asked to identify
E's hands (Q8 -9); however, these "correct" responses in the context of
incorrect identification of the S's own left and right (Q1-2 and Q10-11) are
abrogated. One might suggest that since the object correctly designated
"left" on Q3 was the one incorrectly designated "left" on Q2, the S may
possess the absolutist view that once an object is given a name, the name
remains. However, this interpretation is contradicted by the inconsistency
in left-right desi?hations on Q6-7.and Q8-9.
Therefore, it appears that the S showing this pattern of responses
does not think of left and right as an orderly concept, but, rathei-, has
only a vague and variable notion of left and right as names or positions.
The remaining Variable patterns were similarly analyzed,. The second
type (Patterns e-m) are those where Ss correctly identified objects to
their own left and right hands (Q10-11), with other responses showing
inconsistency in the view of left and right. The third type (Patterns n-r)
include those where Ss failed to correctly identify objects to their left
and right (Q1-2), did correctly identify their left and right hands by the
17.
end of the test .(10-11) but shcmed inconsistency in their view of left
and right on other questions.
2. Egocentric and absolute: The egocentricity or the patterns in this
category is eXpreScer! by the co, 5istA2nt desi9fi I 1 0 left ..md right
in terms of the S's own left and right. The absolute character of these
patterns is reflected by the belief that once an object is 177J 2d "left"
(Q3), it retains the name, even when the S's relationship tc he object is
reversed. Pattern b is included in this category, in spite of objectively.
"correct" responses to 0-5, since it is possible to obtain co .ect
responses by interpreting "...to the left/right of the gum /cooky" as
"beside the gum/cooky." Pattern c is parallel to Pattern b .ix.c.ept for
initial reversal of left and right; correction resulted in sldEil equent
consistency in perspective. Pattern d (one case) also show: 75rofit from
correction with such questionable success on Q6-7 that over I performance
appeared to justify classification in this category.
3. Egocentric, but not absolute: Ss in this category are those
showiing the egocentric pattern described in Category 2 but who do show a
grasp of the relativity of their own left-right perspective 5y succeeding
on Q3. It.should be noted that success on Q12-13 can reflel an active
egocentrism since E's back is to S and both thus share the left-right
perspective; success on Q12-13 is a positive sign of correct left/right
perspective only in the context of success on Q10-11. Typv, e and f
(exhibited by only one S) are somewhat ambiguous inasmuch as labels for
E's hands are retained when E turns her back to S (Q12-13). This may
reflect that some vestige of the absolute view remains, or it could suggest
a variable view. This pattern is especially difficult to interpret in
light of he fact that the object to S's right was incorrectly ft:beled (Q1).
18.
It appeared that correction resulted in S's "learning" the correct labelsbecause of the consistency in egocentric responsesthereafter, and it wasconcluded that Category 3 was the most
reasonableplacement since S possiblyreverted to his original incorrect labeling of his own left and right.4. Opposite for other person: Patterns in this category are charac-terized by the fact that they show some
relativity but exhibit the applica-tion of an "other-opposite"rule with regard to the designation of E'shands. While S understands that the hand of a person facing him is giventhe label
corresponding to his own hand on the opposite side, he alsobelieves that the opposite label is applied when the other person turns hisback and faces the same direction as the child.Type d exhibits
aninstance Where S.believes that his left is right and vice versa', but thepattern of responses shows the same belief in theother-opposite rule.5. Relative for other, but not for object: Failure on at least onequestion pertaining to object
perspective (Q6-7 and 4-5)characterizespatterns classified here, Types a-c are the clearest
examples. Type d(exhi,bited by two Ss ) seems to be most compatiblewith this category,despite the failure on Q3. Types e-g appear to have
profited from theircorrected failure on Qi and show correctconsistency in'responses thereafter,except for the questions
pertaining to objects. Type h is another instanceof a pattern corresponding to the type of thinkingcharacteristic of thecategory, but where responses are all based
on inaccuratelabeling of leftand right.
6. Totally relative: Patterns in this category include those wherethe objectivelycorrect responses were given to all
questions, and thosewhere only the first question was missed and Sssubsequently gave allcorrect responses.
19.
RESULTS
Developmental Sequence
Several lines of evidence suggest that the set of items presented
above can, be accepted as a description of an invariant developmental
sequence of acquisition:
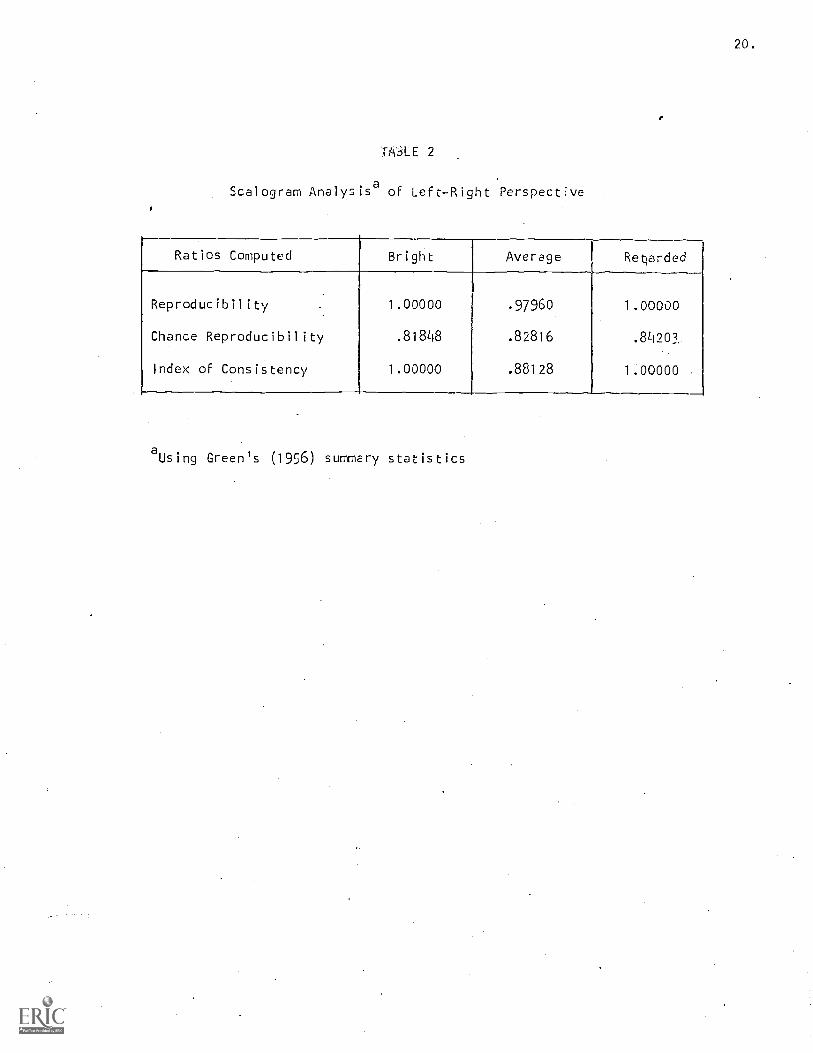
1. The items are ordered in terms of increasing difficulty. A
scalogram analysis2
using Green's (1956) summary statistics was performed
which indicates that the seven dichotomous items form a Guttman scale
(See Table 2 for reproducibilities and indices of consistency). Table 3
shows the eight perfect scale patterns possible and indicates the number
of Ss in each ability group found for each scale type. Only four of the
Ss scaled showed patterns which did not conform to one of the perfect
types.3
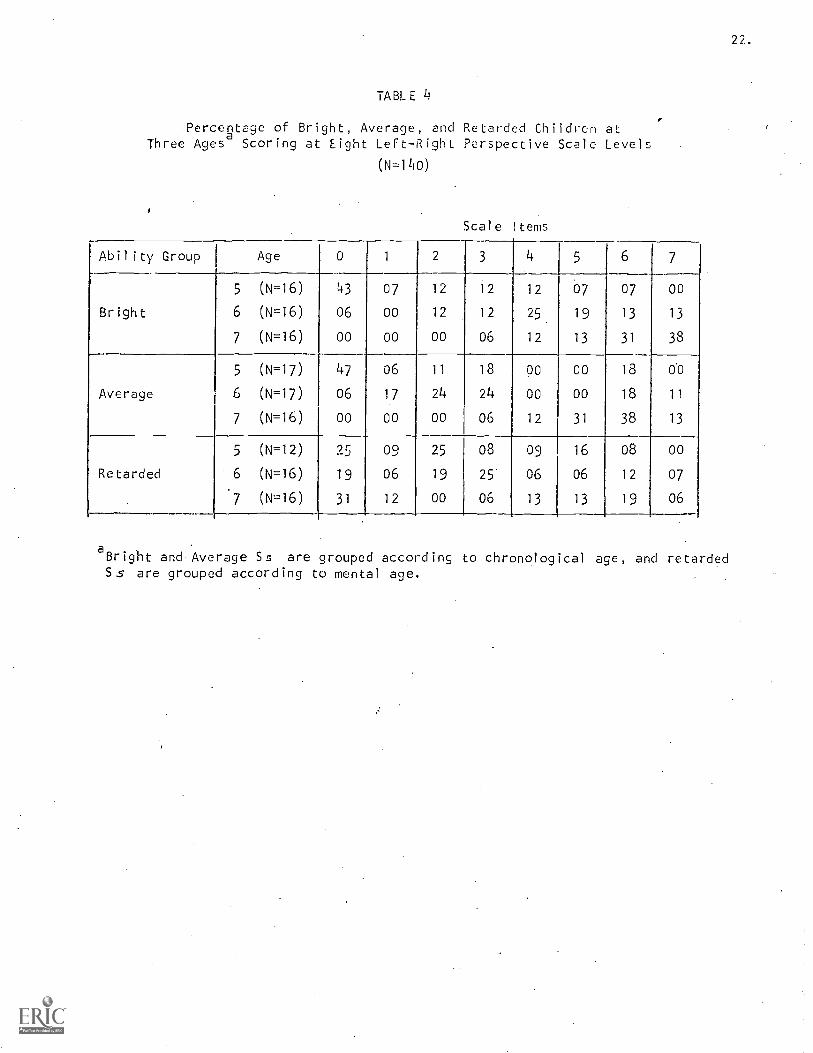
2. Increasing success on scale items occurs with increasing age
and reflects the order of difficulty. Table 4 indicates that younger
children do not tend to score at the higher scale levels and that older
children do not score at the lower levels. This is reflected in an
increase in mean scale scores with increasing age for bright and average
Ss , as shown in Table 5. Also, the median age of each scale type, even
with the reduced number of subjects included in the scaling, generally
increases as one proceeds from scale level 0 to 7 for average and bright
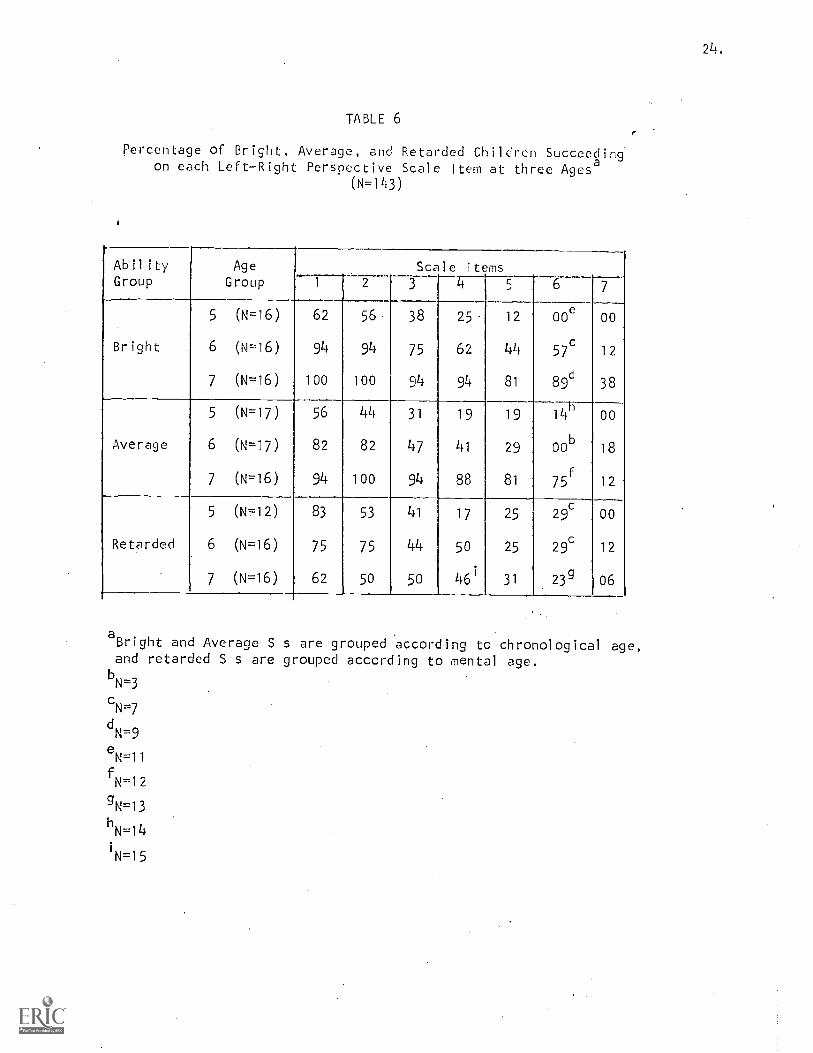
groups (See Table 3). In addition, Table 6 provides even more definitive
positive evidence, showing that the proportion of Ss passing each scale
item increases with age.
3. Retesting of a small number of Ss. after one year shows a general
progression along the scale. Table 7 indicates that of 19 Ss retested
after one year, 16 either performed at the same or higher levels, with only
20.
P
TAAE 2
Scalogram Analysisa of LeftRight Perspective
Ratios Computed Bright Average Retarded
Reproducibility 1.00000 .97960 1.00000
Chance Reproducibility .81848 .82816 .84903.
Index of Consistency 1.00000 .88128 1.00000
aUsing Green's (1956) summary statistics
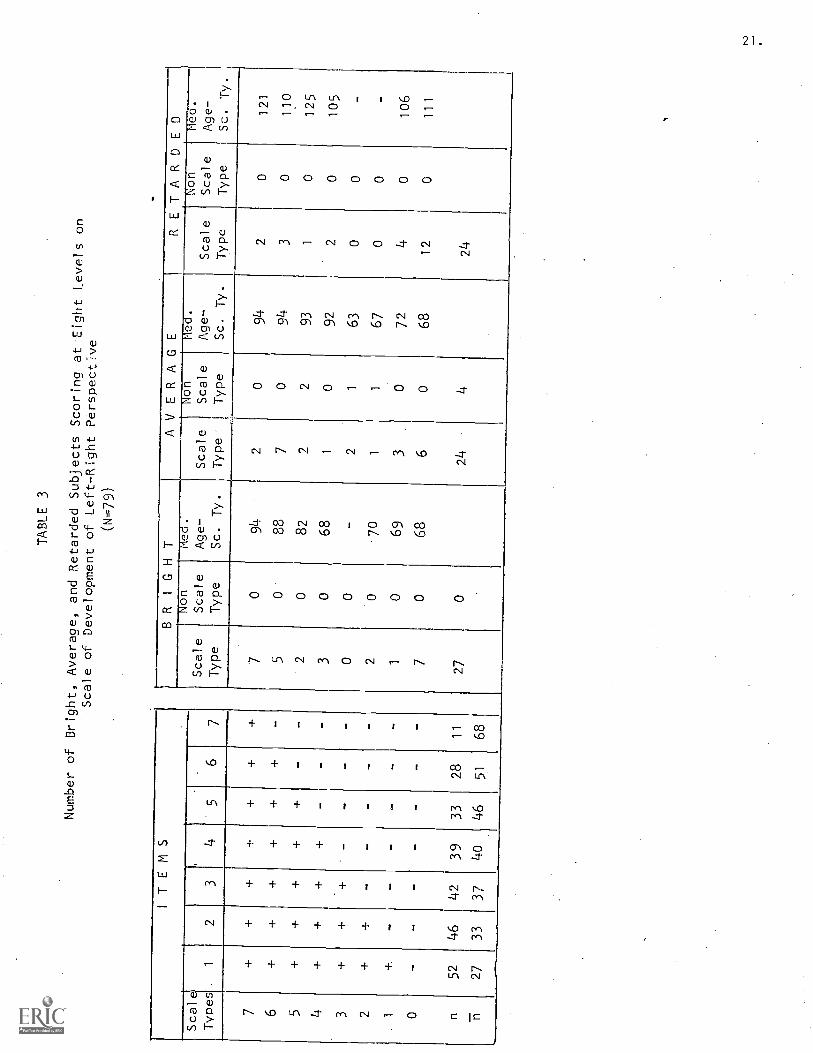
TABLE 3
Number of Bright,
Average, and Retarded Subjects Scoring
at Eight Levels on
Scale of Development of
Left-Right Perspective
(N=79)
ITEMS
BRIGHT
AVERAGE
RETARDED
Scale
Type
Non
Scale
Type
Med
Age-
Sc. Ty.
Scale
Type.
Non
Scale
Type
Med.
Age-
Sc. Ty.
Scale
Type
,Non
Scale
Type
ea.
Age-
Sc. Ty.
Scale
Types
12
37
77
094
20
94
20
121
65
088
70
94
30
110
52
082
22
93
10
125
43
068
10
92
20
105
30
02
163
00
22
070
11
67
00
11
069
30
72
40
106
07
068
60
68
12
0111
n52
46
42
39
33
28
1127
024
424
27
33
37
1+0
1+6
5168
22.
TABLE 4
Percentage of Bright, Average, and Retarded Children atThree Ages Scoring at Eight Left-Right Perspective Scale Levels
(11,--140)
Scale Items
Ability Group Age 0 1 2 3 4 5 6 7
5 (N=16) 43 07 12 12 12 07 07 00
Bright 6 (N=16) 06 00 12 12 25. 19 13 13
7 (N=16) 00 00 00 06 12 13 31 38
5 (N=17) 47 06 11 18 go 00 18 00
Average 6 (N=17) 06 17 24 24 00 00 18 11
7 (N=16) 00 00 00 06 12 31 38 13
5 (N=12) 25 09 25 08 09 16 08 00
Retarded 6 (N=16) 19 06 19 25 06 06 12 07
7 (N=16) 31 12 00 06 13 13 19 06
aBright and Average Ss are grouped according to chronological age, and retardedSs are grouped according to mental age.
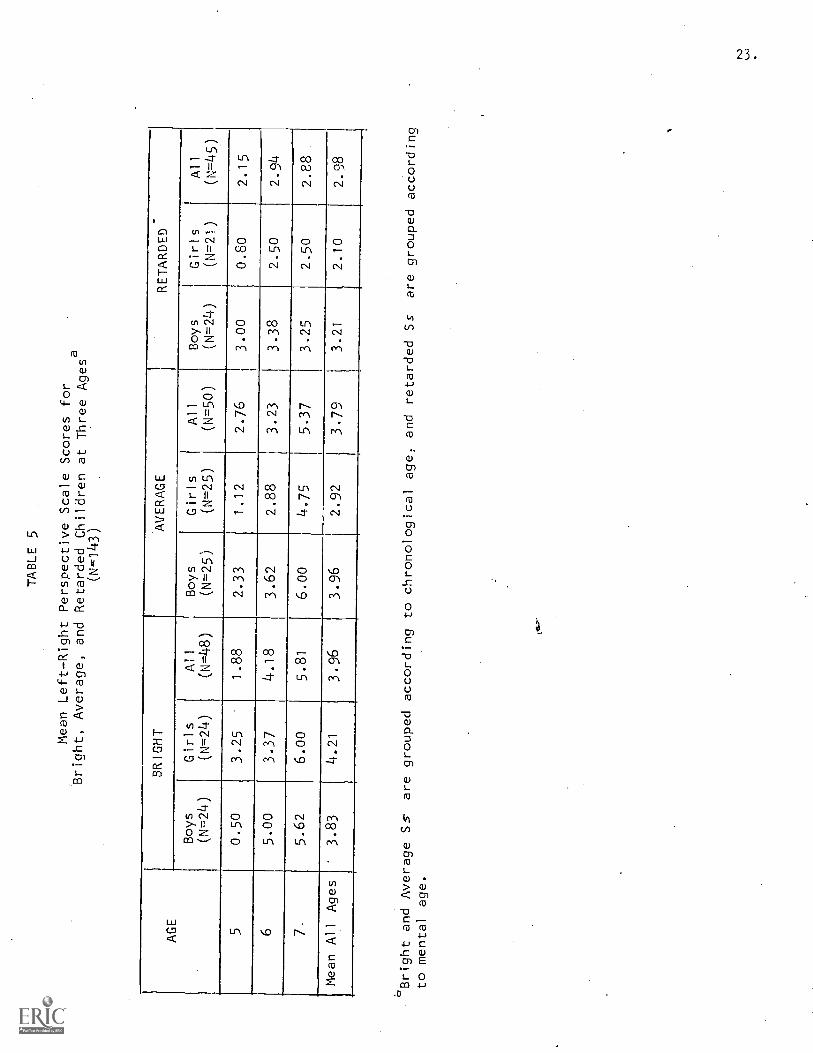
TABLE 5
Mean Left-Right Perspective Scale Scores for
Bright, Average, and Retarded Children at Three
Ages
(N-143)
AGE
BRIGHT
AVERAGE
RETARDED
Boys
(N=24)
Girls
(N=24)
All
(N=48)
Boys
(N=25)
Girls
(N=25)
All
(N=50)
Boys
(N=24)
Girls
(N=21)
All
(N=45)
50.50
3.25
1.88
2.33
I
1.12
2.76
3.00
0.60
2.15
65.00
3.37
4.18
3.62
2.88
3.23
3.38
2.50
2.94
75.62
6.00
5.81
6.00
4.75
5.37
3.25
2.50
2.88
Mean All
Ages
3.83
4.21
3.96
3.96
2.92
3.79
3.21
2.10
2.98
°Bright and Average Sc
are grouped according to chronological age, and retarded Ss
are grouped according
to mental age.
24.
TABLE 6
Percentage of Bright, Average, and Retarded Children Succeedingon each Left-Right Perspective Scale Item at three Ages
(N=143)
r
AbilityGroup
AgeGroup
Scale Items
5 6 71 2 3 4
5 (N=16) 62 56. 38 25. 12 00e 00
Bright 6 (N=16) 94 94 75 62 44 57c 12
7 (N=16) 100 100 94 94 81 89d 38
5 (N=17) 56 44 31 19 19 14h 00
Average 6 (N=17) 82 82 47 41 29 00b 18
7 (N=16) 94 100 94 88 81 75f 12
5 (N=12) 83 53 41 17 25 29c 00
Retarded 6 (N=16) 75 75 44 50 25 29c 12
7 (N=16) 62 50 50 46' 31 23g 06
aBr ght and Average S s are grouped according to chronological age,and retarded S s are grouped according to mental age.
bN=3
cN=7
dN=9
eN=11
fN=12
gN=13
hN=14
i
N=15
25.
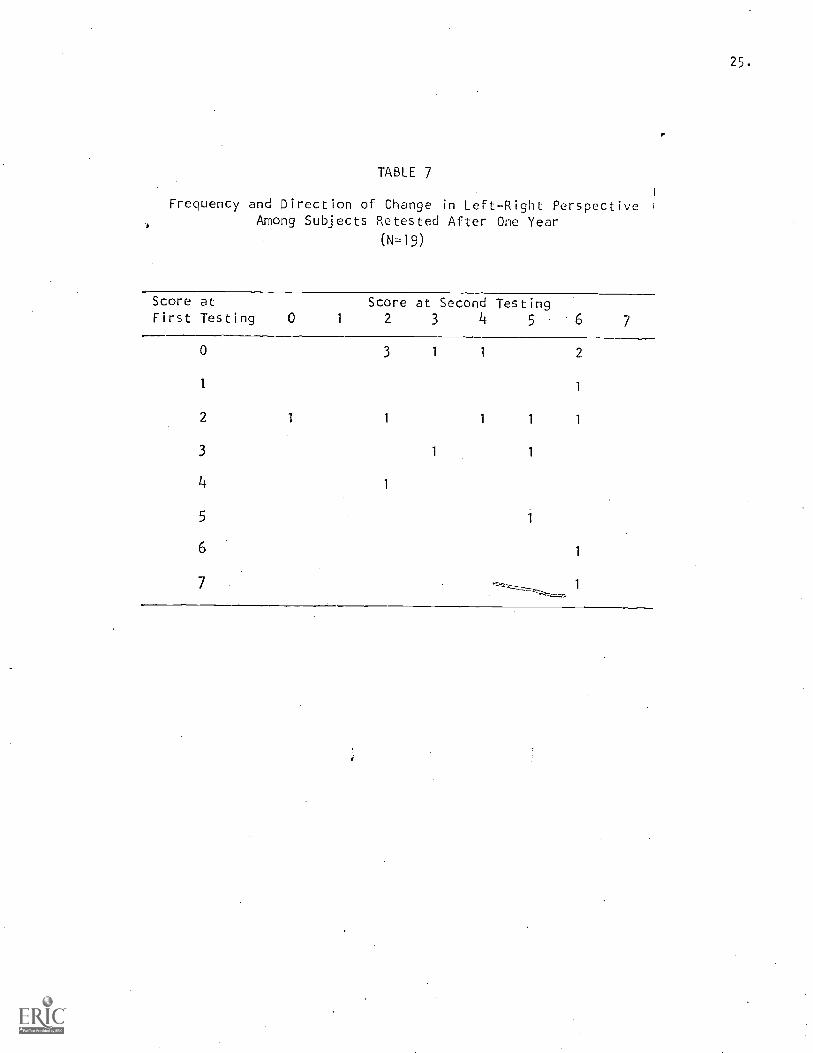
TABLE 7
Frequency and Direction of ChangeAmong Subjects Retested
(N =19)
in Left-Right PerspectiveAfter One Year
Score at
First Testing 0 1
Score at Second Testing2 3 4 5 6 7
o 3 1 1 2
i1
2 1 1 1 1 1
3 1 1
4 1
5
61
7 ,--- ----___ 1
26.
3 Ss scoring at a lower level the second year.
The foregoing findings combine to show that the sequence from easiest
to most difficult on the scale is an age-wise progrc cion which appears
to Occur in a regular, invariant order. Howeve the _uestion of whether
1y steps in the sequence might be skipped cannot he E,71swered until
individual children ara followed longitudinally.
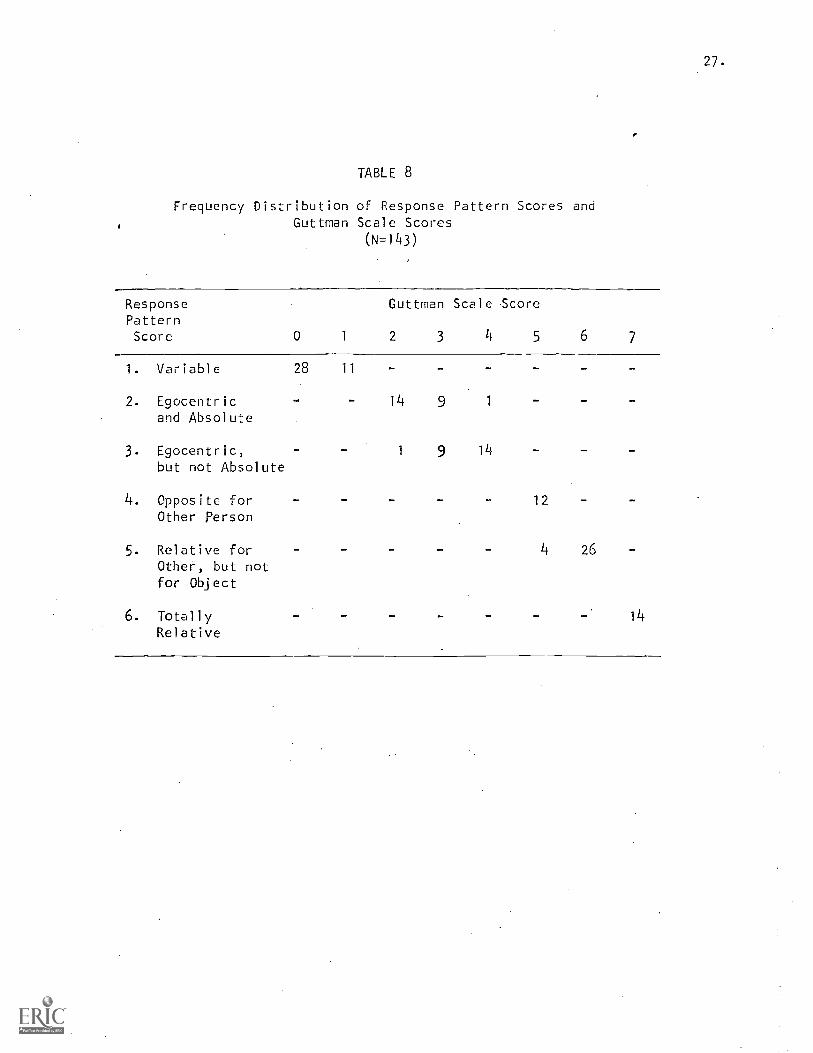
Comparison of Response Pattern Scores and Guttman Scale Scores
The Guttman scale and the set of Response Patterns both describe the
developmental sequence of acquisition of leftright perspective, but the
Response Patterns represent a slight condensation. Scale Items 2 and 4-7
correspond to Response Patterns 2-6. Failure on all scale items results
in a Variable Response Pattern 1. The scale included two items (1 and 3)
which are not reflected directly in discrete Response Patterns. In addition
to this source of discrepancy between scores, scale errors result in some
lack of correspondence. Therefore, a Pattern Score of.3 does not necessarily
predict a scale score of 4, as one might expect. The frequency distribu-
tion of Scale and Pattern Scores shown in Table 8 indicates that the
correspondence is reassuringly close. While the Scale Score provides a
somewhat more differentiated measure for the purpose of overall group
comparisons, the Response Pattern Score seems to be a better descriptor
of the qualitative level of thinking. Table 9 presents the percentage of
Ss classified in the six Response Pattern categories, by age, sex, and
ability. Table 10 summarizes these by age and ability group.
Effect of Intelligence on Performance
Sequential Order of Acquisition
The scalogram analysis was r:arformed separately for each ability
group to ascertain whether the order of difficulty varies for different
27.
TABLE 8
Frequency Distribution of Response Pattern Scores andGuttman Scale Scores
(N=143)
ResponsePatternScore
Guttman Scale Score
0 1 2 3 4 5 6 7
1. Variable 28 11
2. Egocentricand Absolute
3. Egocentric,but not Absolute
4. Opposite forOther Person
5. Relative forOther, but notfor Object
14 9 1
1 9 1k
12
4 26
6. Totally 14
Relative
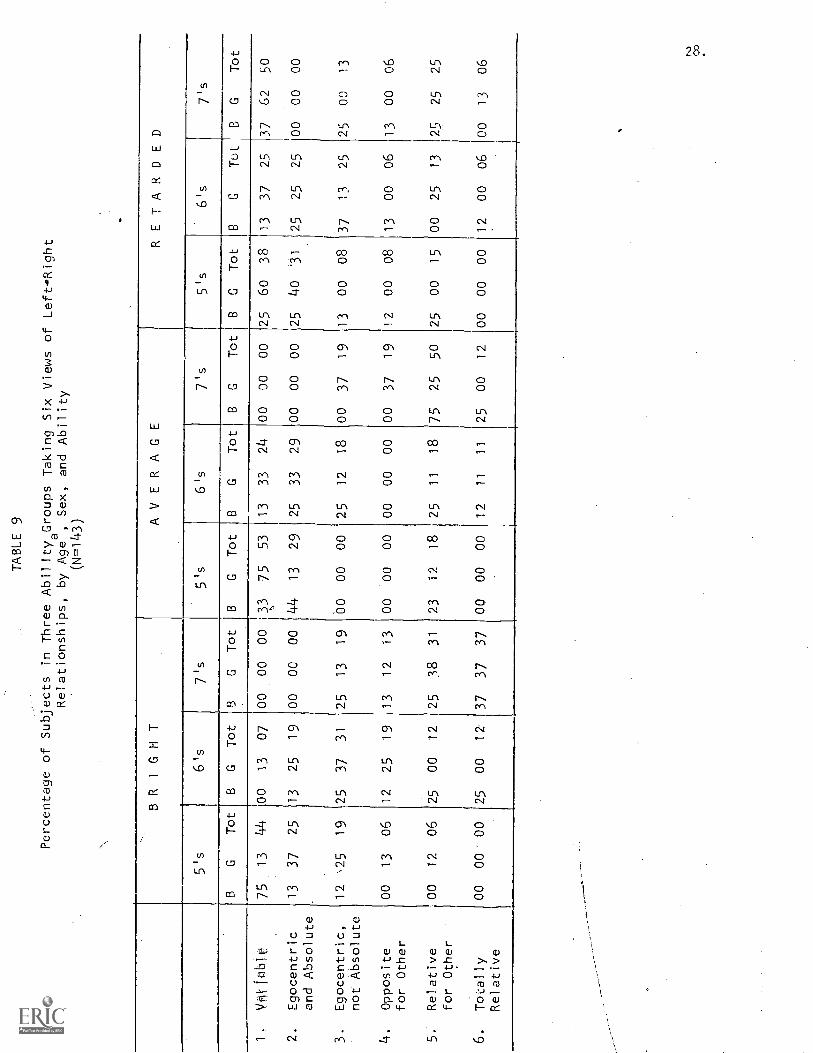
TABLE 9
Percentage of Subjects in Three AbilityaGroups Taking Six Views of LeftRight
Relationships, by Age
,Sex, and Ability
(N=143)
BRIGHT
AVERAGE
RETARDED
5's
6's
7's
6's
7's
5's
6's
7's
BG
Tot
BG
Tot
5G
Tot
BG
Tot
BG
Tot
BG
Tot
BG
Tot
BG
Tut
BG
Tot
VArlObie
75
13
44
00
13
07
00
00
00
33
75
53
13
33
24
00
00
00
25
60
38
13
37
25
37
62
50
2.
Egocentric
13
37
25
13
25
19
00
00
00
44
13
29
25
33
29
00
00
00
25
40
'31
25
25
25
00
00
00
and Absolute
.
3.
Egocentric,
not Absolute
12
'25
19
25
37
31
25
13
19
bo
00
00
25
12
18
00
37
19
13
00
08
37
13
25
25
00
13
4.
Opposite
for Other
00
13
06
12
25
19
13
12
13
00
00
00
00
00
00
00
37
19
12
00
08
13
00
06
13
00
06
Relative
for Other
00
12
06
25
00
12
25
38
31
23
12
18
25
11
18
75
25
50
25
00
15
00
25
13
25
25
25
6.
Totally
00
00'
00
25
00
12
37
37
37
00
00
00
12
11
11
25
00
12
00
00
00
12
00
06
00
13
06
Relative
NJ
OD
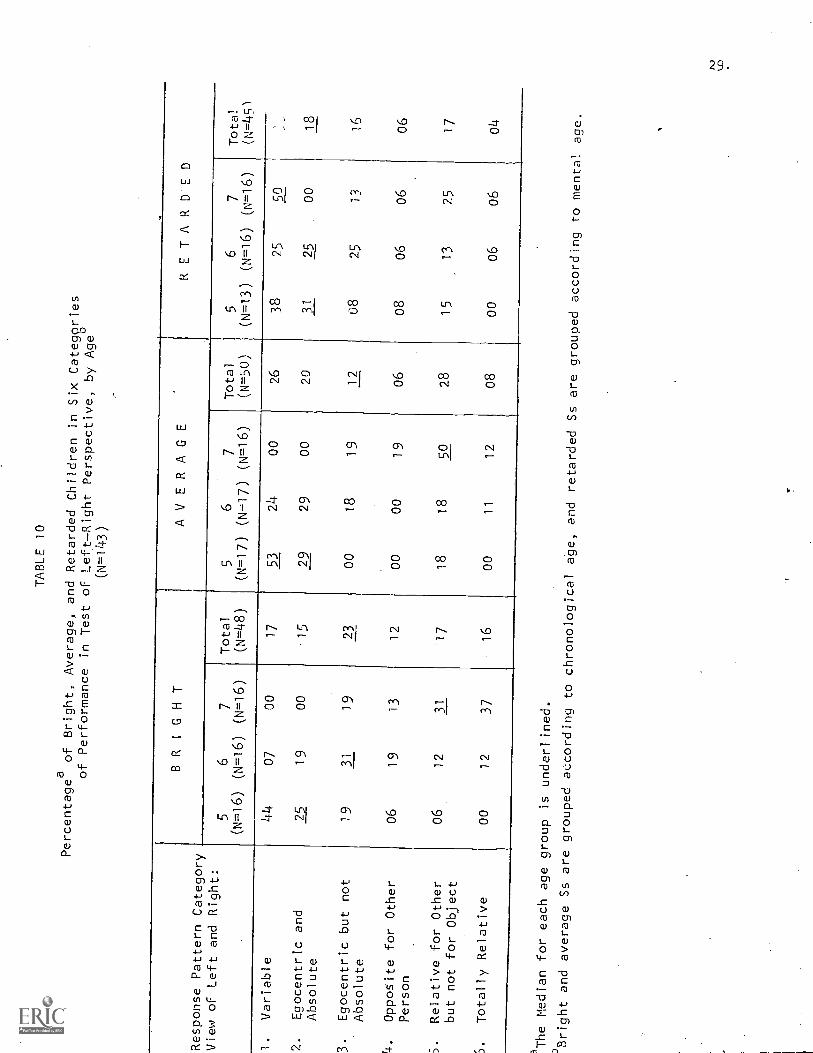
TABLE 10
Percentageaof Bright, Average, and Retarded
Children in Six
Categsries
of Performance in Test of
LeftRight Perspective, by Age
(N=143)
Response Pattern Category
View of Left and Right:
BRIGHT
AVERAGE
RETARDED
5
(N=16)
6
(N=16)
7
(N=16)
Total
(N=48)
5
(N=17)
6
(N=17)
7
(N=16)
Total
(N=50)
5
(N=13)
6
(N=16)
7
(N=16)
Total
(N=45)
1.
Variable
44
07
00
17
53
24
00
26
38
25
50
2.
Egocentric and
19 19
00
15
29
29
00
20
31
25
00
18
Absolute
Egocentric but not
19
31
19
23
00
18
19
12
08
25
13
16
Absolute
4.
Opposite for Other
06
19
13
12
00
00
19
06
08
06
06
06
Person
5.
Relative for Other
but not for Object
06
12
31
17
i8
18
50
28
15
13
25
17
S.
Totally Relative
00
12
37
16
00
11
12
08
00
06
06
04
3The Median for
each age
group is underlined.
Bright and average Ss are grouped
according to chronological age, and retarded
Ss are grouped according to mental
age.
30.
levels of intelligence and whether the same developmental s,quence applies.
The order of item difficulty is identical for bright, average, and retarded
groups, and Table 2 indicates that the set of items is scalable for all three
groups. The chronological progression along the scale of development is
clear for bright and average groups, as indicated by mean scores in Table
5 and performance on individual scale items in Table 6. This progres-sion
does not apply to mental age, as the retarded group (which is not grouped
by chronological age, but by mental age) does not generally show increases
with increased mental age.
Level of Performance
While there are some interactions with sex which complicate the
comparison of ability groups, bright Ss , particularly girls, show some
tendon-y to p^rform t E' soy:what higher level than average Ss (See Table
5). However, the analysis of variance comparing bright and average groups
indicated that this difference is not statistically significant (F=1.81,
df=5). The performance of average and retarded SS at mental ages five
and six years is comparable, but average Ss outdistance retarded Ss
at mental age seven (F=3.23, df=1, 86, p<.08).
Consideration of performance reflected by Response Pattern Categories
in Table 10 reveals essentially the same picture. About half the five-year-
old Ss even those who are bright, view left and right as variable, and
approximately one quarter are egocentric and absolute in their view. At
age five little difference between bright and average children appears;
while somewhat fewer bright children (44 percent of bright and 53 percent
of average) show the variable view, more average children (18 percent)
view the left and right of another person as relative than do bright children
(6 percent). Table 10 suggests, however, that bright children abandon the
31.
variable view somewhat sooner than average children. Only 7 p_rcen,t
bright but 2 percent of average Ss were classified as variable in C eir
view at age six. Somewhat earlier development of left-right F-2.rspLcti%:
among brighter children is also suggested by the finding that at aye seven
37 percent of bright, but only 12 percent of average Ss showed a totally
relative view. By age six, fewer bright than average Ss are catego
aF.- variable in their view, and both groups show more children in mon
advanced categories. At age seven no bright or average child is fou in
the two most immature categories; all have given up the variable and
absolute views. However, three times as many bright as average Ss have
advanced to the totally relative view of Category 6. The slight advantage
of bright over average children is also reflected by median categories at
each age level. The median for bright Ss is one category higher at :ages
five and six. Retardates at mental age six are lhttle different from
average children of the same mental age, but by age seven many more average
Ss are found in the advanced categories, and only two retarded Ss showed
totally relative views.
Sex Differences
Tables 5 and 9 indicate that girls in general do more poorly with
regard to left-right perspective than do boys. Exceptions are bright Five-
year-olds and bright seven-year-olds; at five, girls perform at a much
higher level, and at seven, girls perform at a slightly higher or comparable
level. At age five, 75 percent of the bright boys in this study showed a
variable view of left and right (no boy in this group knew which object was
on his right at the beginning of the task), while only 13 percent of the
girls did so; girls in this group were even found showing Category )4 and 5
patterns, while no boy took a view higher than Category 3. At age six,
32.
however, bright boys were found in Categories 5 and 6, while no girl-s
showed these patterns. By age seven, all bright children were beyond
Categories 1 and 2, and the two groups were quite comparable.
Average girls do more poorly at every age than do boys. At age five,
only 33 percent of the boys, but 75 percent of the girls show a variable
view. At age six, only 13 percent of the boys but 33 percent of the girls
respond with this pattern. Average-boys at seven are only found in Categories
5 and 6, whereas girls are concentrated in Categories 3-5.
Among the retarded Ss at every mental age level, girls are found at
least twice as frequently as boys in the lowest category. At mental age
five, 50 percent of the boys are found in Categories 3-5, while all the
girls are concentrated in Categories 1 and 2. At age six, over 50 percent
of the girls are still found in these categories, while over 60 percent
of Lh boys alts in higher categories.
33.CONSERVATION 07 flASS
METHOD
The method of assessing ability to conserve mass parallels Piaaet's
study of this phenomenon, except that Piaget used clay, and the material
used in this study is a pink fondant candy. 5
Procedure
The S was seated at a child-sized desk on which a sheet of waxed
paper was laid. The first task Stem was included in order to measure
response latency in a situation likely to induce conflict over which of
two bails has more to eat. E (wearing plastic gloves) placed two balls
of fondant, each 2" in diameter, on a piece of waxed paper on a desk
in front of the child. E kept balls covered with her hands while she
said:
I have two balls of candy here. If you can show me the one withmore candy to eat, you can have it to keep or to eat. If you don'tpick the one with more candy, you won't get any this time, but you'llget another chance later. Now, (removing hands) which one has moreto eat?
When S pointed to the ball he judged correct, E placed a piece of plastic
film directly in front of the child and between, but a bit below, the two
balls, saying, "Take the one with more candy to eat. You can wrap it in
this paper and put it in your sack to take home with you."
1. The first test item assessed conservation when a small ball was
elongated. E placed two balls of candy, one about 3" in diameter, the other
about 2" in diameter on the waxed paper, with the larger ball to S's left,
saying:
Look, here are two more balls of candy. Can you see that one hasmore to eat than the other? Which one has more? Yes, that has moreto eat. I'm going to let you pick one in just a minute. But, first,watch. I make this one like this. If you can show me the one withmore candy to eat, you can have it to keep or to eat. If you don'tpick the one with more candy, you won't get any this time, but you'llget another chance later. (E talks as she rolls the candy into a
sausage-shape about 4" long.) Now, look at both of them. Whichhas more to eat? How do you know that's more to eat? Which isbigger?
if a conservation choice (the larger ball) was made, the following limits-
34.
testing procedure was followed:
Now watch. I'm rolling the candy longer and longer (E rolls it outto about 6" in length.) Which has more to eat?
Which had more to eat before I rolled this (pointing to smaller,quantity) out? Did it really change? Did this really get to bemore candy to eat?
If no: Why not?If yes: How did that happen?
In order to provide one last opportunity for a child to select the greater
quantity (in case a nonconservation choice was made for some reason other
than actual belief in change), E placed a piece of plastic film in front
of the child and said, "O.K., take the one with more to eat and put it in
your sack." The child was allowed to take the candy he chose, whether he
was objectively correct or incorrect.
2. The second test item assessed conservation when the small ball
was flattened into a circular shape. E placed two balls of candy, one about
3" in diameter, the other about 2" in diameter, on the waxed paper, with
the larger ball to. S's right, saying:
Here's some more candy. Which one has more to. eat? Yes, that hasmore. Now watch. I make this candy like this. In just a minute,if you can show me the one with more candy to eat, you can have itto keep or eat. If you don't pick the one with more candy, you won'tget candy this time. (E talks as she flattens the smaller ball intoa circular shape about 4" in diameter, and the candy is partiallyhidden as she presses it.) Which has more to eat? How do you knowthat's more to e,it? Which is bigger?
Which had more to eat before I flattened. this (pointing to pancakeshape). Did this really get to be more candy tc eat?
If no: Why not?If yes: How does that happen?
3. The third test item was designed as a further limits-testing
for conservers and also as a means of eliciting verbalized principles.
E asked (only conservers):
What could I do to make this (pointing to pancake) have more candyto eat than that one (pointing to larger ball)? Why or why not?
35.
4. The final. test item urovided a last opportunity for an S to
express his belief about the quantity. E placed a piece of plastic film
in front of the child and said, "Now you take the one with more candy to
eat., Why did you take that one?
Scoring
Ss were scored pass (+) or fail (-) on each of the following items:
1. Recognizes initially which ball has more to eat
+: Points to larger ball of candy when asked to show which has moreto eat
Note: Subjects who cannot do this are not testable. If an error ismade, E allows S to take his choice and provides another discriminationtrial, pinching some off the smaller ball so the size discrepancy isgreater. If S succeeds in selecting the larger, this item is scored"+" and testing proceeds; if S again selects the smaller, testing isterminated.
2. Remembers which ball had more before shape change
+: Points to larger ball when asked to point to the one that had morebefore
3. Reoogniilas that the ball has greater quantity or is greater in somedimension after shape change
+: a. Says ball has more to eatb. Says ball is bigger, fatter, rounder, higher
4. Maintains constancy at some point
+: At some time during the test, says ball has more to eat whensmaller ball has been deformed.
5. Believes quantity didn't really change
+: Says smaller ball did not really get to be more to eat; did notreally change on all postulations of the question (asked twiceonly, except in special circumstances where response was unclear)
Note: - is scored if S spontaneously verbalizes that the ball had morebefore, but the HD/PC has more after deformation.
6. Consistently conserves
+: Takes larger ball on both Q2 and Q2, and also on Qla if asked
7. Confidently conserves
t: Never even considers the possibility that the smaller may havdmoreto eat when shape is changed; always says the ball has more
In addition, verbalized reasons for choices were scored as follows:
Vonconservation
1. No reason or irrelevant reason, e.g., "It's more/bigger," "You
rolled/smashed it."
2. Quantity changed because E rolled/flattened the ball.
3. Magic
4. It looks bigger/longer/wider.
Conservation
5. No reason or irrelevant reason; description of what E did.
6. Shape/length irrelevant to quantity, e.g., "It just looks like
36.
it's bigger." "It doesn't change in size, just in shape."
7. Identity, e.g., "It was bigger before," "It's still little."
"Because that was the little/big one at first."
8. Empirical reversibility, e.g., "If you put it back in a ball it
would still be the same size." "If you rolled that ball (larger)
out, too, it would be longer than that (sausage) one."
9. Compensation of relations, e.g., "It's flatter, but wider." It's
longer but skinnier."
10. Addition-subtraction principle, e.g., "You can't make it bigger unless
you add some more candy!" "It can't change unless you break some off."
11. Generalization, e.g., "It stays the same, no matter what you do."
"It wouldn't change; it's still smaller/bigger. It would still
be the same."
Verbalizations were scored separately for test items 1 and 2, and S's
giving multiple reasons were given multiple scores.
Results
A scalogram analysis using Green's (1956) summary statistics was
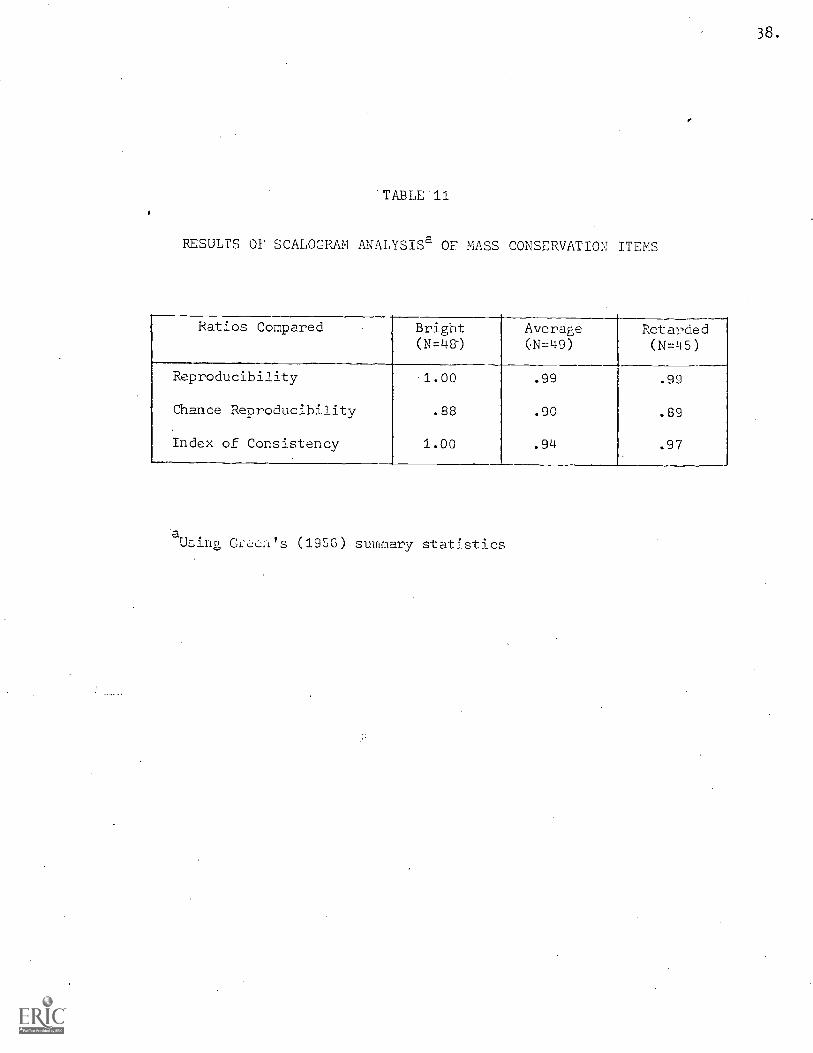
37.
performed which indicated that the set of seven items presented above'
aims a Guttman scale. Table 11 shows the reproducibilities and indices
of consistency for bright, average, and retarded groups, and indicates
that the scale's order of difficulty is applicable to all IQ groups.
Developmental Sequentiality of Acquisition
Although the evidence is not as strong for this scale as for most
others in this study, it does suggest that the Guttman Scale describes
a developmental sequence of acquisition. Several lines of evidence converge
to this tentative conclusion:
1. Age-wise progression along the scale: A general age increase appears
from five to six years, but seven-year-olds perform at.about the same level
as six-year-olds. Since this is the case, and since no Ss are found at the
two lowest scale levels, it appears that a broader age range of performance
is necessary for a more definitive statement. Nevertheless, a general increase
in median age as one proceeds up the scale levels can be seen in Table 12,
especially for bright Ss. Mean scores in Table 13 show the increase in
performance from fivn to six years, but no increase from six to seven
years, and the age differences in performance are not significant (for
bright and average Ss, F=2.145 ,dir--2,86,p<.09; for average and retarded
Ss, F=1.80,df=2,83,p < .17). Table 14 indicates that younger Ss tend to
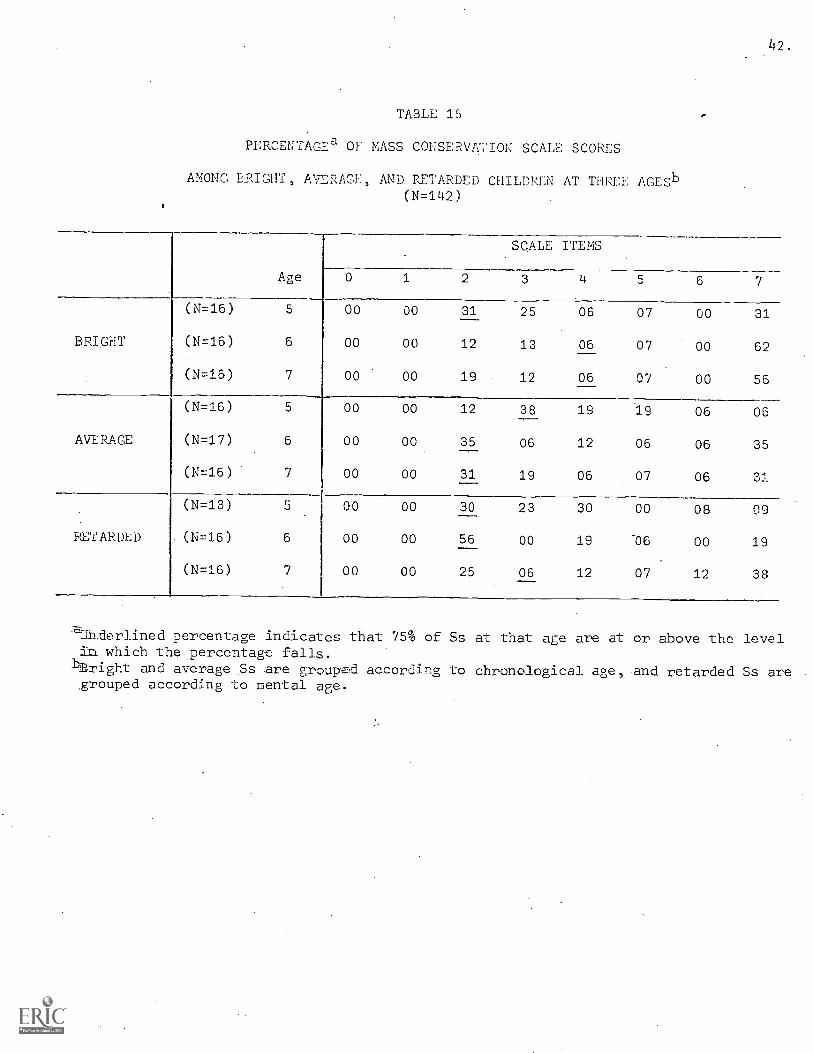
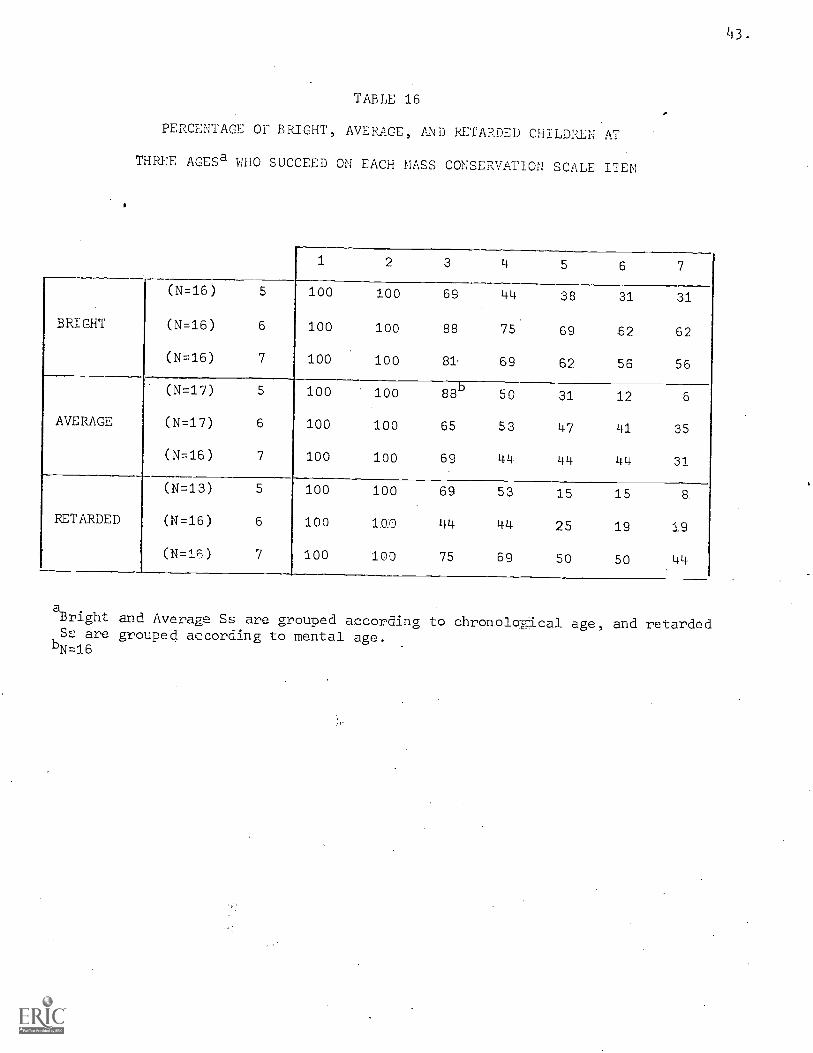
be found at somewhat lower scale levels than do older Ss, Tables 15 and
16 also show a clear age change from five to six years, but no progression
from six to seven years with regard to the percentage of scale scores and
percentage succeeding on each scale item in each age and IQ group. Thus,
during the age range studied, change is occurring very slowly, particularly
after age six.
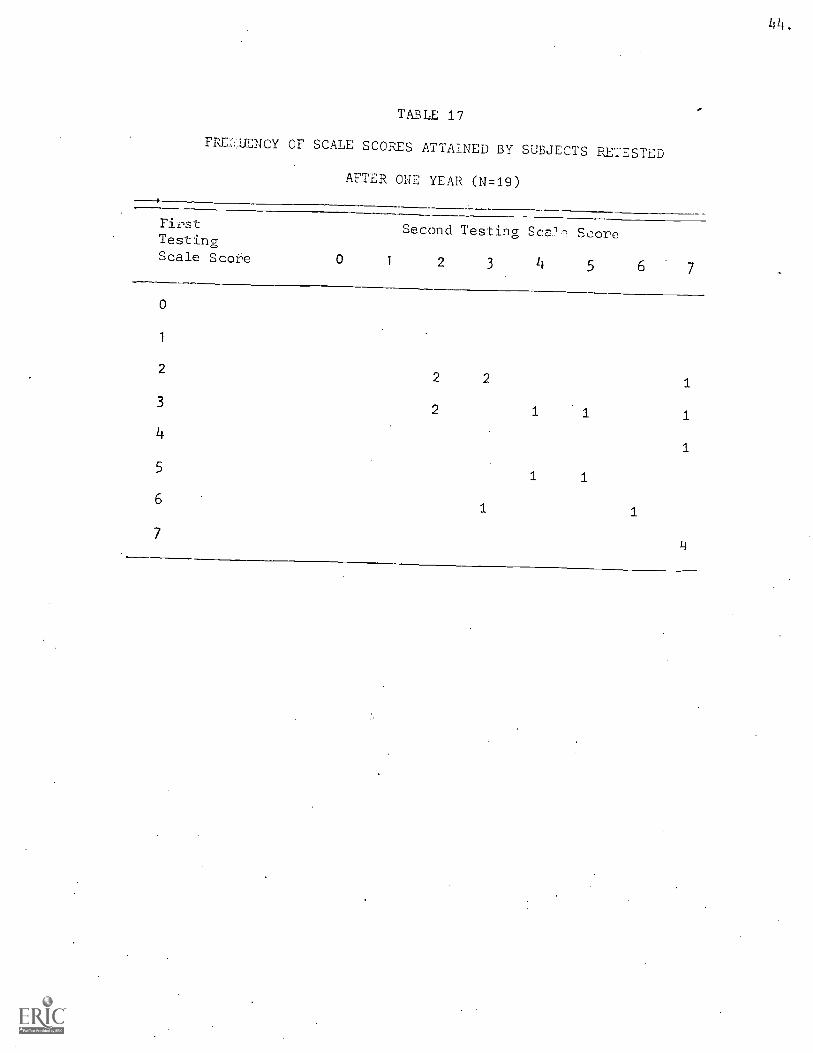
2. Longitudinal progression: Table 17 presents the frequency distribution
of scale scores at first testing and again one year later. Eight of the nineteen
38.
TABLE 11
RESULTS OF SCALOGRAM ANALYSISa OF MASS CONSERVATION ITEMS
Ratios Compared Bright(N=48-)
Average(N=49)
Retarded(N=45)
Reproducibility 1.00 .99 .99
Chance Reproducibility .88 .90 .89
Index of Consistency 1.00 .94 .97
ctUE;ing (1950) summary statistics
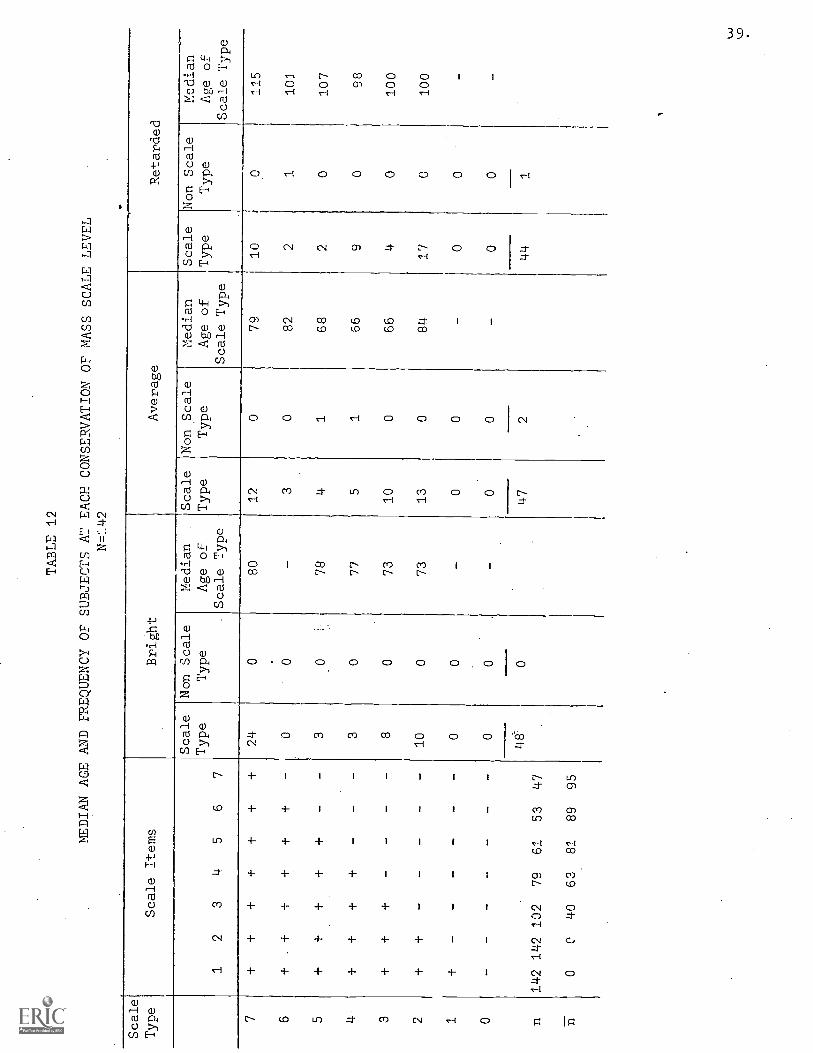
TABLE 12
MEDIAN AGE AND 1REQUENCY OF SUBJECTS AT EACH CONSERVATION OF MASS SCALE LEVEL
N ='. 42
Scale
Type
Scale Items
Bright
Average
Retarded
Scale
Non Scale
Median
Scale
Non Scale
Median
Scale
Non Scale
Median
Type
Type
Age of
Type
Type
Age of
Type
Type
Age of
12
34
56
7Scale Type
Scale Type
Scale Type
7+
++
+t
++
24
080
12
079
10
0115
6+
.+
++
++
-0
0-
30
82
21
101
5+
++
++
--
30
78
41
68
20
107
4+
++
+-
--
30
77
51
66
90
98
3+
++
--
--
80
73
10
066
40
100
2+
+-
--
--
10
073
13
084
17
0100
1+
--
--
--
00
-0
0-
00 v
-
00
-0
0-
00
-- 4
8''
047
244
_ /
n142 142
102
79
61
53
47
ri0
040
63.
81
89
95
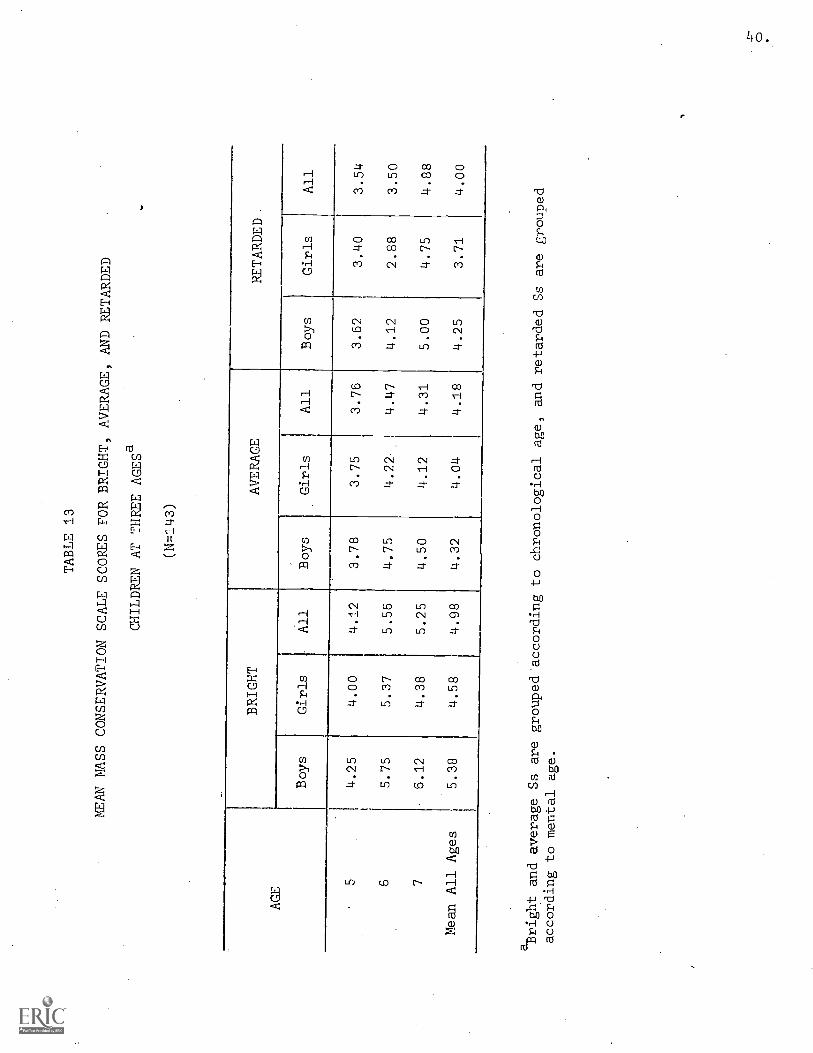
TABLE 13
MEAN MASS CONSERVATION SCALE SCORES FOR
BRIGHT, AVERAGE, AND RETARDED
CHILDREN AT THREE AGESa
BRIGHT
AVERAGE
RETARDED.
AGE
Boys
Girls
All
Boys
Girls
All
Boys
Girls
All
54.25
4.00
4.12
3.78
3.75
3.76
3.62
3.40
3.54
65.75
5.37
5.56
4.75
4.22
4.47
4.12
2.88
3.50
76.12
4.38
5.25
4.50
4.12
4.31
5.00
4.75
4.88
Mean All Ages
5.38
4.58
4.98
4.32
4.04
4.18
4.25
3.71
4.00
aBright andaverage Ss are grouped according to chronological
age, and retarded Ss are grouped
according to mental age.
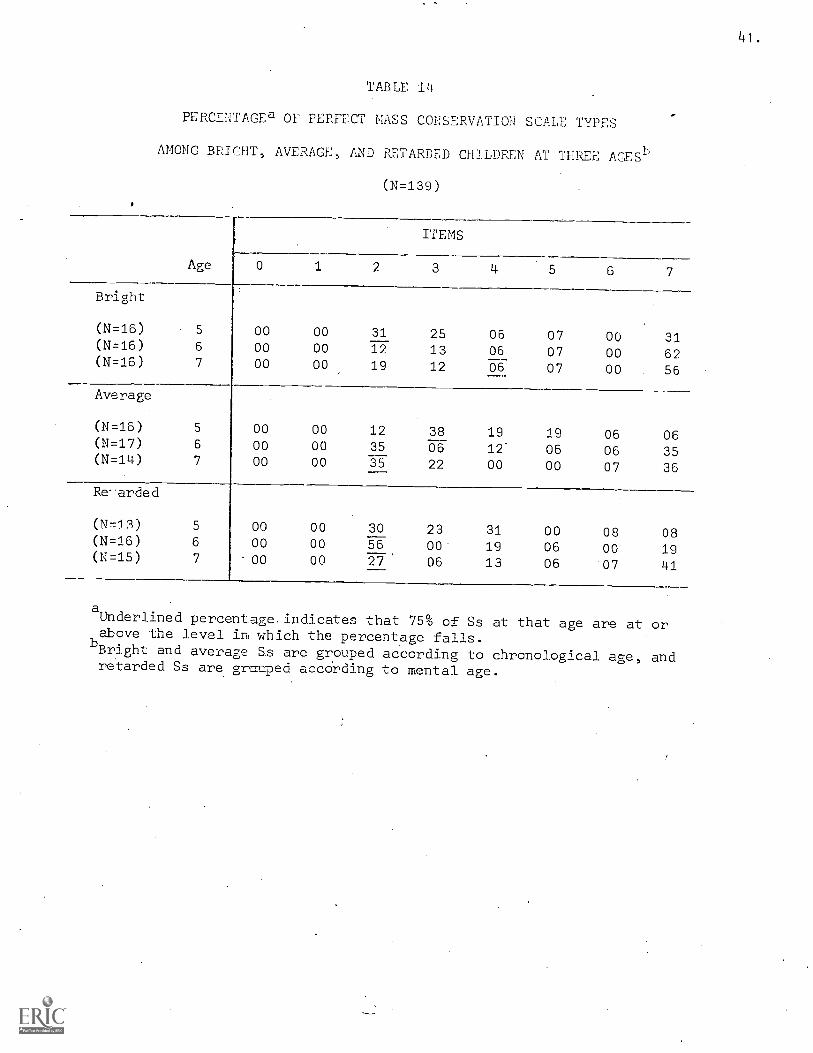
TABLE 14
PERCENTAGEa OF PERFECT MASS CONSERVATION SCALE TYPES
AMONG BRIGHT, AVERAGE, AND RETARDED CHILDREN AT THREE AGESh
Age
Bright
(N=16) . 5
(N=16) 6
(N=16) 7
Average
(N=16) 5
(N=17) 6
(N=14) 7
Re -arded
(N713) 5
(N=16) 6
(N=15) 7
0
00
00
00
00
00
00
00
00
00
(N=139)
ITEMS
1 2 3 4 5 6 7
00 31 25 06 07 00 3100 12 13 06 07 00 6200 19 12 06 07 00 56
00 12 38 19 19 06 0600 35 06 12 06 06 3500 35 22 00 00 07 36
00 30 23 31 00 08 0800 56 00 19 06 00 1900 27 06 13 06 07 41
aUnderlined percentage. indicates that 75% of Ss at that age are at orabove the level in which the percentage falls.
bBright and average Ss are grouped according to chronological age, andretarded Ss are g _2:aped according to mental age.
42.
TABLE 15
PERCENTAGEa OF MASS CONSERVATION SCALE SCORES
AMONG BRIGHT, AVERAGE, AND RETARDED CHILDREN AT THREE AGESb(N=142)
Age
BRIGHT
(N=16) 5 00
(N=16) 6 00
(N=16) 7 00
(N=16) 5 00
AVERAGE (N=17) 6 00
(N=16) 7 00
(N=13) 5 00
RETARDED . (N=16) 6 00
(N=16) 7 00
`a nderlined percentage indicates thati which the percentage falls.
SCALE ITEMS
2 3 4 5 6 7
00 31 25 06 07 00 31
00 12 13 06 07 00 62
00 19 12 06 07 00 56
00 12 38 19 19 06 06
00 35 06 12 06 06 35
00 31 19 06 07 06 3
00 30 23 30 00 08. 09
00 56 00 19 '06 00 19
00 25 06 12 07 12 38
75% of Ss at that age are at or above the level
bright and average .Ss are grouped according to chronological age, and retarded Ss aregrouped according to mental age.
L13
TABLE 16
PERCENTAGE OF BRIGHT, AVERAGE, AND RETARDED CHILDREN AT
THREE AGESa WHO SUCCEED ON EACH MASS CONSERVATION SCALE ITEM
(N=16)
BRIGHT (N=16)
(N=16)
(N=17)
AVERAGE (N=17)
(N=16)
(N=13)
RETARDED (N=16)
(N=16)
1 2 3 4 5 6 7
5 100 100 69 44 38 31 31
6 100 100 88 75 69 -62 62
7 100 100 81 69 62 56 56
5 100 100 88b88 50 31 12 6
6 100 100 65 53 47 41 35
7 100 100 69 44 44 44 31.
5 100 100 69 53 15 15 8
6 100 lap 44 44 25 19 19
7 100 100 75 69 50 50 44
aBright and Average Ss are grouped accor5ing to chronolocal age, and retardedSs are grouped according to mental age.
hN=16
4 4 .
TABLE 17
FRE.(..1E'NCY OF SCALE SCORES ATTAINED BY SUBJECTS RETESTED
AFTER ONE YEAR (N=19)
FirstTestingScale Score 0
Second Testing Sca.:7,-
1 2 3 If
Score
5 6 7
0
1
22 2 1
3 2 1
41
51 1
61 1
7
115.
Ss remained at the same level the second year as the first year. Sevep
Ss performed at a higher level the second year, and fcur Ss appear to
have regressed. More longitudinal data is needed to ascertain whether
this sequence can be viewed as one which individuals must pass through in
an invariant fashion. However, for most of the Ss retested, the scaTe
can account for their developmental progression.
Effect of IQ on Performance
Although Table 12 suggests that bright children may be superior to
average IQ children with regard to their ability to :conserve mass, the
diffeyrnce is not statistically significant (F = 3.57,df=1,83, p<
Neither are average IQ children shown to be superior to retarded child=
of tl-e same mental age (F = .32,df=1,86,T)<, .57). Therefore, during
ages 5-7 years both bright and average children appear to be at about
the sane level of development, both with quite a lon way yet to develc
The same finding applies to the comparison of average and retarded Ss.
When mental age is controlled, a higher IQ is rio advantage in this develop
mental task, at the age levels studied.
Effect of Sex on Performance
No sex differences were found on this task, although mean perforTmnee
of girls is below that of boys for all ages in all IQ groups. The diffHrlences
are insignificant between girls and boys in the retarded and average groups.
(F = .92, df=1,83,p< .34), as well as in the average and bright groups
(F = 1.59, df= 1 , 86 ,p <.21). No interactions with sex appeared.
Test Item Difficulty and Decalage
Comparison of.individual performance on the three conservation questions
asked suggests that Ss tend to be consistently conservers or nonconservers, but
that Piaget (1941) appears to be correct in noting that a transitional
period exists where conservation is possible in one situation but not in
46.
another where the apparent transformation is intensified in its effect.
Table 18 compares responses to the transformation of the small ball into
the 7Sausage" (Q1) 6ti .11 the limits-testing transformation of the sansac;e
into the longer "snake." Of 139 Ss clarly scorable on both, 125 Ss were
cent in their- respanse. ; they either passed both or failed both.
11 Ss who correctly selected the ball when the "sausage" was
formed could not maintain their conservation when the sausage was elongated
into a "snake." The 3 Sr 'who failed the "sausage" but passed the "snake"
were extremely uncertain and vacillating in their correct choice of the ball
in comparison to the
Comparison of res,,,,puse to the 'Sausage" (Q1) and to the "pancake" (Q2)
trait :formations (See Table 19) shows that the "pancake", transformation is
somewhat easier. Of-the 1.9 SS- inconsistent in their responses to those
questions, 16 Ss succeeded in conserving on the "pancake" transformation,
but failed on either the "sausage" or "snake" transformation. In light of
the fact that the order of presentation did not seem to make the "snake"
transformation easier than the "sausage," an explanation in terms of an
artifactual order effect seems unwarranted. The most parsimonious explana-
tion seems to involve the fact that the "pancake" is virtually one-dimensional
while the "sausage" and'isnake" are more two-dimensional. If the child is
trying to coordinate two dimensions; the fact that only one exists for the
"pancake" will make it much easier for him.
Decent ration
One puzzling occurrence was that many Ss seemed to believe that both
the transformed and the untransformed candy were greater in some way. For
example, this was expressed by choice of the transformed candy as having
more to eat but choice of the untransformed candy as "bigger." Since such
inconsistency might occur as a result of semantic confusion of the part. of
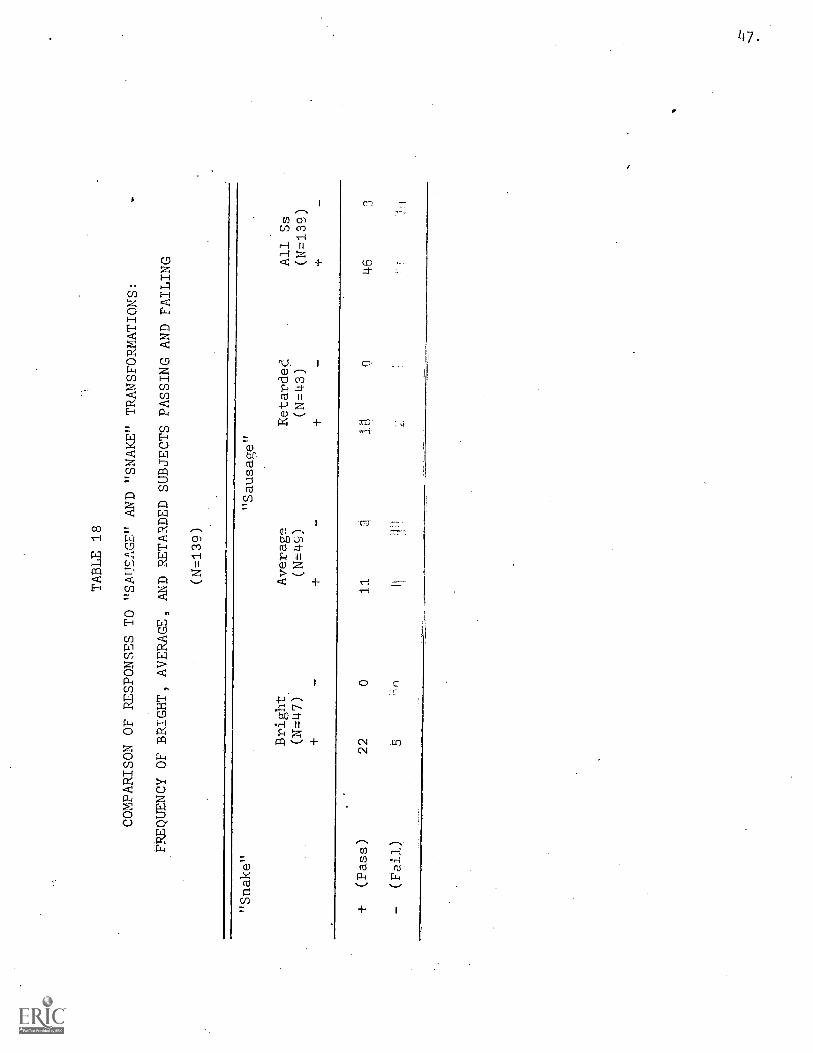
TABLE 18
COMPARISON OF RESPONSES TO "SAUSAGE" AND "SNAKE" TRANSFORMATIONS:
FREQUENCY OF BRIGHT, AVERAGE, AND RETARDED SUBJECTS PASSING AND FAILING
(N=13.9)
"Snake"
"Sausage"
Bright
Average
Retarded
All Ss
(N=47)
(N=49)
(N=43)
(N=139)
+-
+-'r
(Pass)
22
011
n0
46
-(Fail)
5
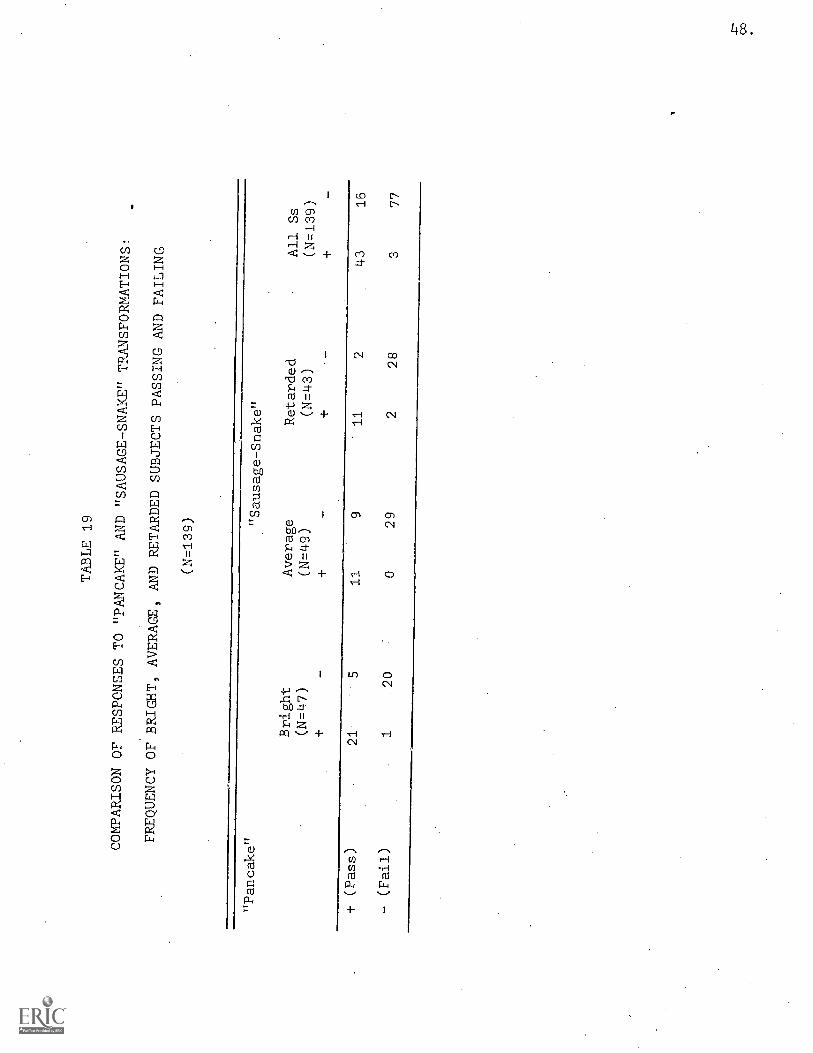
TABLE 19
COMPARISON OF RESPONSES TO "PANCAKE"
AND "SAUSAGE-SNAKE" TRANSFORMATIONS:
FREQUENCY OF BRIGHT, AVERAGE, AND RETARDED
SUBJECTS PASSING AND FAILING
(N=139)
"Pancake"
"Sausage-Snake"
Bright
Average
Retarded
All Ss
(N=47)
(N=49)
(N=43)
(N=139)
+_
+-
+-
+-
+ (Pass)
21
511
911
243
16
- (Fail)
120
029
228
377
149.
the child, the tendency to say that both dP" rw 0 t,-1 II,
terms of whether it is accompanied by inconsistency in choice of which
has "more to eat." Tables 20 and 21 show the frequency of conservers and
nonconservers in each IQ group who answer in synonymous and non-synonymous
fashion to the questions "more to eat" and "bigger" on the "sausage-snake"
and "pancake" transformation. While a predominant number of both conservers
and nonconservers tend to think of "more to eat" and "bigger" synonymously,
a larger proportion of nonconservers (32% and 24%, respectively, on "sausage-
snake" and "pancake") responded differently to these questions than did
conservers (4% and 13%, respectively).While this view of "more to eat"
and "bigger" as non-synonymous may reflect a verbal confusion, this seems
unlikely, as the language used is not difficult. Also, if this were the
proper explanation, one would expect a greater proportion of retarded Ss
to show the confusion, and they do not. It seems that an explanation in
terms of a S's focussing on one dimension and then on another without
recognizing the contradiction in his judgments may be in order.
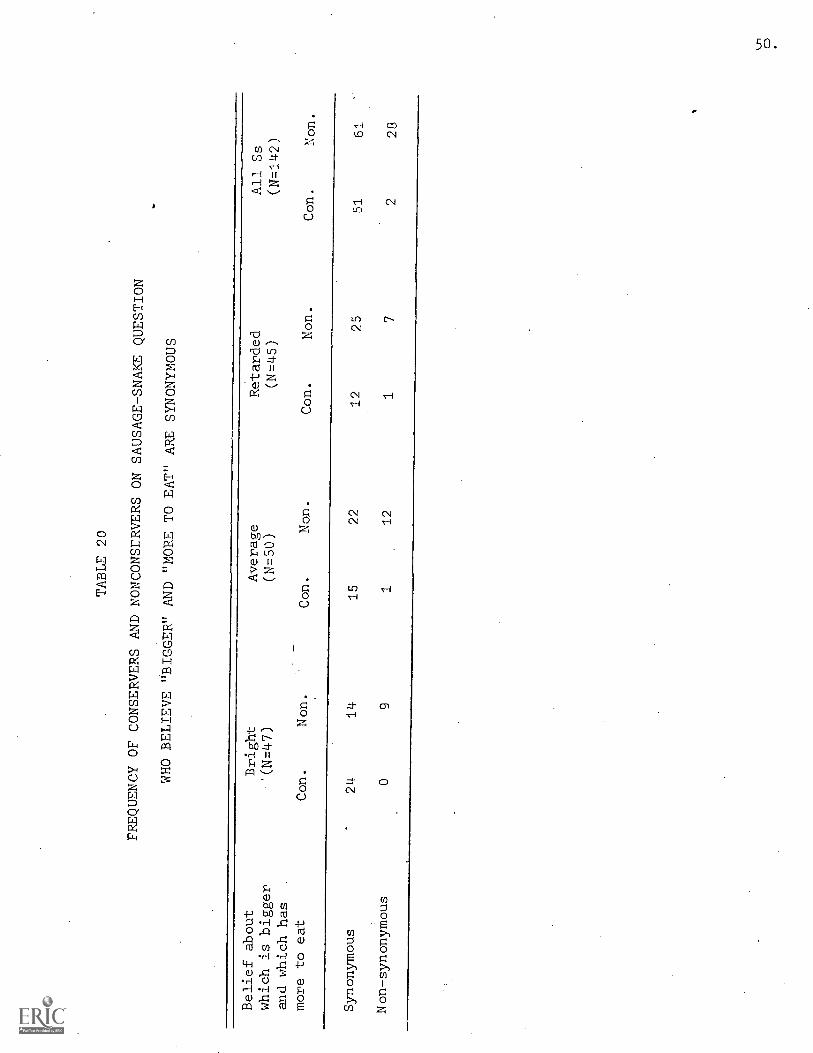
TABLE 20
FREQUENCY OF CONSERVERS AND NONCONSERVERS ONSAUSAGE-SNAKE QUESTION
WHO BELIEVE "BIGGER" AND "MORE TO EAT" ARE
SYNONYMOUS
Belief about
Bright
Average
Retarded
All Ss
which is bigger
'(N=47)
(N=50)
(N=45)
(N=142)
and which has
more to eat
Con.
Non.
Con.
Non.
Con.
Non.
Con.
Non.
Synonymous
Non-synonymous
24
14
15
22
12
25
51
61
09
112
17
228

TABLE 21
FREQUENCY OF CONSERVERS AND NCNCONSERVERS ON PANCAKE
QUESTION
WHO BELIEVE "BIGGER" AND "M.ORE TO EAT"
ARE SYNONYMOUS
Belief about
Bright
Average
Retarded
All Ss
which is Nigger
(N=48)
(N=5C)
(N=45)
(N=143)
and whfth has
more to t.,dt
Con.
Non.
Con.
Non.
Con.
Non.
Con.
Non.
Synonymous
20
1713
24
13
26
4667
Non-synonymous
47
310
0b
723
52.
CONSERVATION OF NUMBER
METHOD
The number conservation problem posed here is based on similar
situations utilized by Piaget (1952) in his studies of children's number
concepts. However, the test materials differ from those used by Piaget
in that they were M&M chocolate candies which provided an added motive-
tiohal dimension.
Procedure
Six circular cardboard pizza plates 14-inches in diameter were
prepared with M&M's perpendicular to the child's line of sight and covered
with napkins. The S was seated at the desk in front of the first pair
of plates.
The pre-test discrimination item was designed to obtain a basal
level of response latency in a situation likely to elicit no conflict.
Eight equally-spaced brown M&M's on the plate to the child's left were in
a row 14 inches long, and seven brown M&M's on the plate to the child's
right were placed from top to bottom in one-to-one correspondence to the
M&M's on the other plate. E said:
I have some candy on these plates. One plate has more than theother plaLc. In a minute I'm going to ask you to pick the platethat has more candy to cat. If you can show me the plate that hasmore to eat, you can have it to keep or to eat. Out if ynu don'tpick the plates that has more candy to eat, you won't get anycandy this time, but you'll get another chance later. Now, lookat both of them and show me the plate that has more candy to eatnapkins are simultaneously removed).
The S was allowed to put the eight M&M's in his sack, and the plates were
removed.
Test item 1 was designed to find whether the S could conserve the
quantity six when a constriction of length transformed six M&M's into
a shorter line than five M&M's. Two napkin-covered plates were presented
on the desk in front of S. Six equally-spaced red M&M's on the plate to
the child's left were in a line 12 inches long, and five M&M's on the plate
53.
to the child's right were in a line 8 inches long (both lines centered
on their plates). E said:
I have some more candy on these plates. Which has more to eat(napkins simultaneously removed)? That's right. Nor', in a minutewhen I say so, you may pick the plate with the most cFndy--the onethat has more to eat--to keep or to eat. If you don't pick the onethat has more candy to eat, you won't get any candy this time, butyou'll get another chance to Pick some later. Before you pick, I
put them like this (the six M &M's are constricted into a line 4-12-inches long). Now look at both plates (E touches both plates) andif you can show me the plate that has more candy to eat, you mayhave it.
How did you know that was more?Which plate had more before?
S was allowed to take the candy from the plate he selected.
Test item 2 elicited countlaglt12eshild's comparative
use of counting as an aid to conservation. Two napkin-covered plates were
presented. Six equally-spaced yellow M&M's on the plate to the child's
right were centered on the plate in a line four inches long, and five
yellow M&M's on the plate to the child's left were in a line eight inches
long. E said:
I have some candy on these plates. One plate has more than theother plate. When I say so, You may p7ek the plate with the mostcandy--the one that has more to eat--to keep or to eat. If you don'tpick the one with the most candy, you won't get any candy this time.You'll get another chance later. Now, if you can show me the onethat has more candy to eat, yoL, may have it (napkins simultaneouslyremoved).
How could you tell whi had more candy to eat?
If S did not count, E said, "If I thought this one (plate not selected by
S) had more to eat, how could ycu show me it doesn't?" If S still did not
count, E asked, "Could you count them?" If S counted only one plate, he
was asked to count the other. If he counted incorrectly, he was asked to
count again so that his result was orrect. After counting to six on one
plate and to five on the'other, E asked, "So which has more candy to eat?"
Test item 3 was used with Ss who failed either item 1 or 2, in order
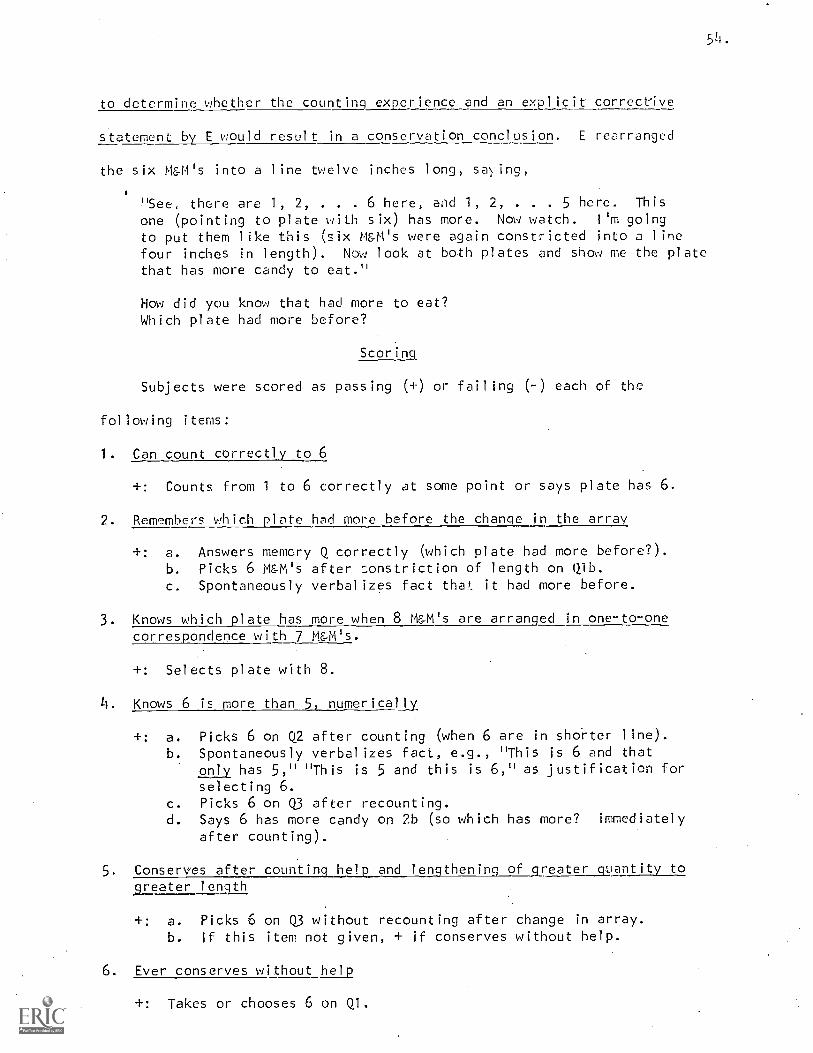
511.
to determine whether the counting experience and an explicit corrective
statement by E would result in a conservation conclusion. E rearranged
the six M&M's into a line twelve inches long, saing,
"See, there are 1, 2, . . . 6 here, and 1, 2, . . . 5 here. This
one (pointing to plate with six) has more. Now watch. I'm going
to put them like this (six M&M's were again constricted into a linefour inches in length). Now look at both plates and show me the platethat has more candy to eat."
How did you know that had more to eat?Which plate had more before?
Scoring
Subjects were scored as passing (+) or failing (-) each of the
following items:
1. Can count correctly to 6
+: Counts from 1 to 6 correctly at some point or says plate has 6.
2. Remembers which plate had more before the change in the array
+: a. Answers memory Q correctly (which plate had more before?).
b. Picks 6 M&M's after constriction of length on Qib.c. Spontaneously verbalizes fact that it had more before.
3. Knows which plate has more when 8 M&M's are arranged in one-to-onecorrespondence with 7 M&M's.
+: Selects plate with 8.
4. Knows 6 is more than 5, numerically
+: a. Picks 6 on Q2 after counting (when 6 are in shorter line).
b. Spontaneously verbalizes fact, e.g., "This is 6 and thatonly has 5," "This is 5 and this is 6," as justification forselecting 6.
c. Picks 6 on Q3 after recounting.d. Says 6 has more candy on 2b (so which has more? immediately
after counting).
5. Conserves after counting help and lengthening of greater quantity togreater length
+: a. Picks 6 on Q3 without recounting after change in array.
b. If this item not given, + if conserves without help.
6. Ever conserves without help
+: Takes or chooses 6 on Ql.
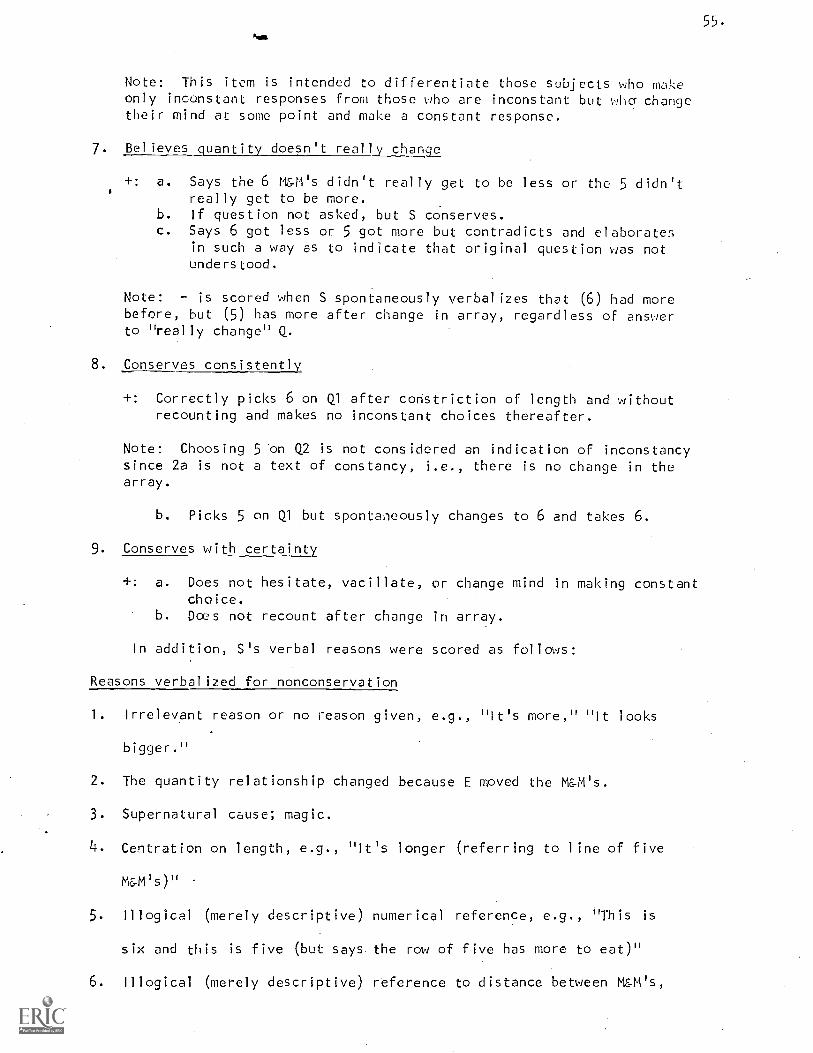
55.
Note: This item is intended to differentiate those subjects who makeonly inconstant responses from those who are inconstant but wha changetheir mind at some point and make a constant response.
7. Believes quantity doesn't really change
+: a. Says the 6 M&M's didn't really get to be less or the 5 didn'treally get to be more.
b. If question not asked, but S conserves.c. Says 6 got less or 5 got more but contradicts and elaborate,'
in such a way as to indicate that original question was notunderstood.
Note: - is scored when S spontaneously verbalizes that (6) had morebefore, but (5) has more after change in array, regardless of answerto "really change" Q.
8. Conserves consistently
+: Correctly picks 6 on Q1 after constriction of length and withoutrecounting and makes no inconstant choices thereafter.
Note: Choosing 5 on Q2 is not considered an indication of inconstancysince 2a is not a text of constancy, i.e., there is no change in thearray.
b. Picks 5 on Ql but spontaneously changes to 6 and takes 6.
9. Conserves with certainty,
+: a. Does not hesitate, vacillate, or change mind in making constantchoice.
b. Does not recount after change in array.
In addition, S's verbal reasons were scored as follows:
Reasons verbalized for nonconservation
1. Irrelevant reason or no reason given, e.g., "It's more," "It looks
bigger."
2. The quantity relationship changed because E moved the M&M's.
3. Supernatural cause; magic.
4. Centration on length, e.g., "It's longer (referring to line of five
M&M's)"
5. Illogical (merely descriptive) numerical reference, e.g., "This is
six and this is five (but says the row of five has more to eat)"
6. Illogical (merely descriptive) reference to distance between M &M's,
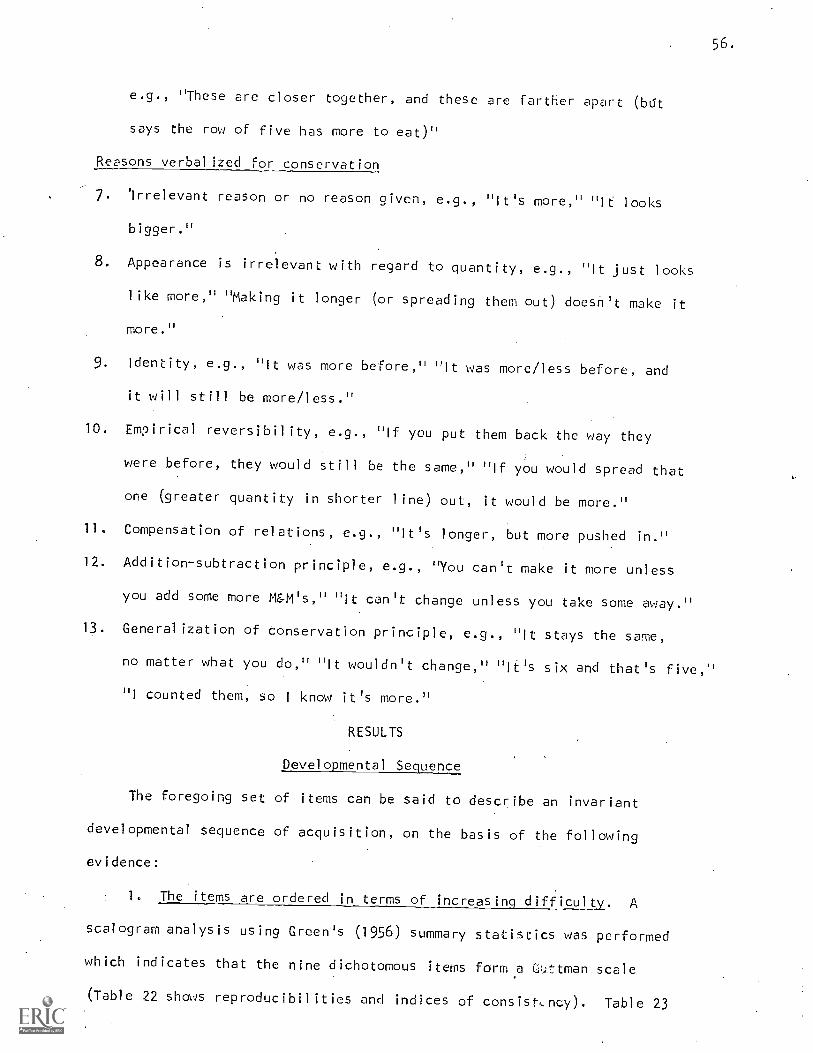
56.
e.g., "These are closer together, and these are farther apart (bat
says the row of five has more to eat)"
Reasons verbalized for conservation
7. 'Irrelevant reason or no reason given, e.g., "It's more," "It looks
bigger."
8. Appearance is irrelevant with regard to quantity, e.g., "It just looks
like more," "Making it longer (or spreading them out) doesn't make it
more."
9. Identity, e.g., "It was more before," "It was more/less before, and
it will still be more/less."
10. Empirical reversibility, e.g., "If you put them back the way they
were before, they would still be the same," "If you would spread that
one (greater quantity in shorter line) out, it would be more."
11. Compensation of relations, e.g., "It's longer, but more pushed in."
12. Addition-subtraction principle, e.g., "You can't make it more unless
you add some more M&M's," "it can't change unless you take some away."
13 Generalization of conservation principle, e.g., "It stays the same,
no matter what you do," "It wouldn't change," "It's six and that's five,"
"I counted them, so I know it's more."
RESULTS
Developmental Sequence
The foregoing set of items can be said to describe an invariant
developmental sequence of acquisition, on the basis of the following
evidence:
1. The items are ordered in terms of increasing difficulty. A
scalogram analysis using Green's (1956) summary statistics was performed
which indicates that the nine dichotomous items form a C%t-tman scale
(Table 22 shows reproducibilities and indices of consistency). Table 23
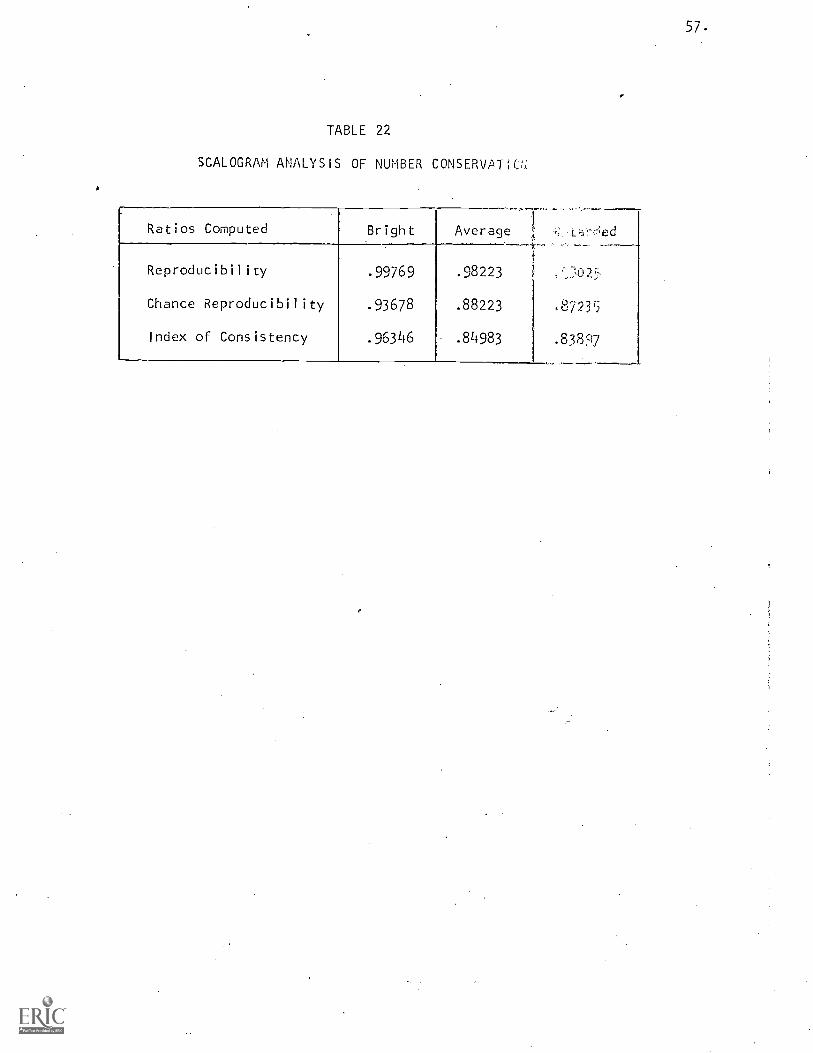
TABLE 22
SCALOGRAM ANALYSIS OF NUMBER CONSERVAll(
Ratios Computed Bright Average
Reproducibility .99769 .98223 r_7;02'5
Chance Reproducibility .93678 .88223 ,8723
Index of Consistency .96346 .84983 .83897
57.
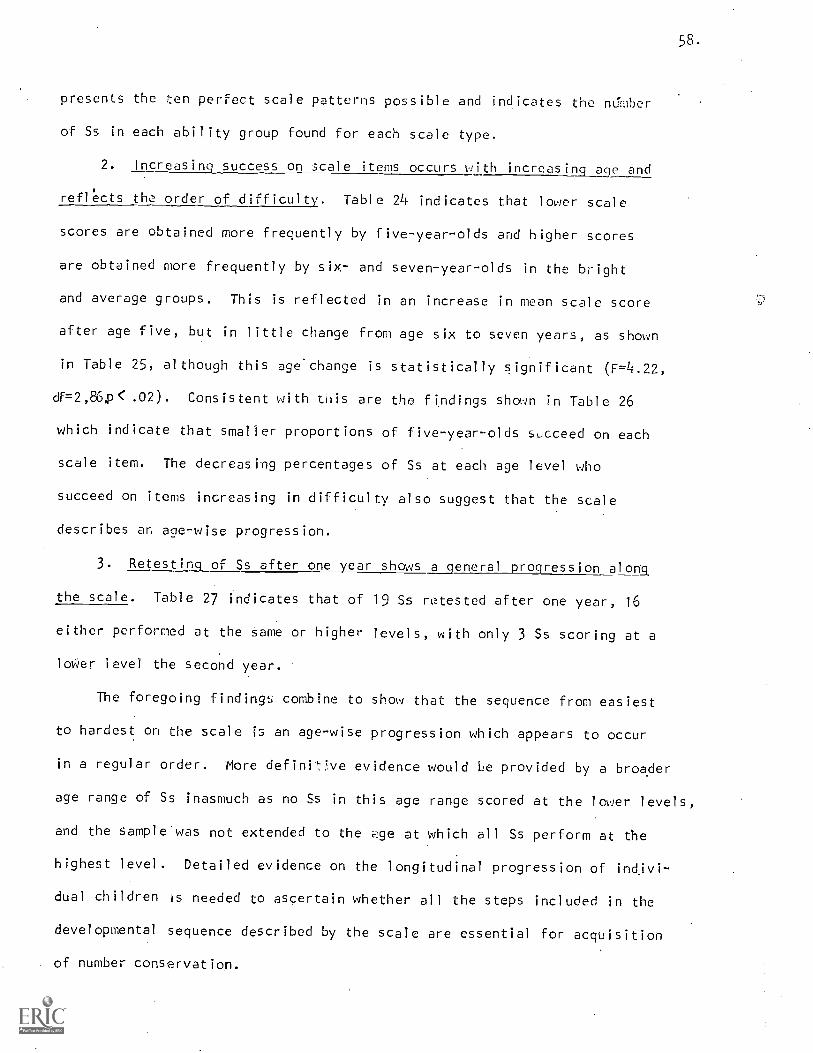
58.
presents the ten perfect scale patterns possible and indicates the number
of Ss in each ability group found for each scale type.
2. Increasing_success on scale items occurs 1.,:ith increasing age and
reflects the order of difficulty. Table 24 indicates that lower scale
scores are obtained more frequently by five-year-olds and higher scores
are obtained more frequently by six- and seven-year-olds in the bright
and average groups. This is reflected in an increase in mean scale score
after age five, but in little change from age six to seven years, as shown
in Table 25, although this age-change is statistically significant (F=4.22,
df=2,86,p< .02). Consistent with this are the findings shown in Table 26
which indicate that smaller proportions of five-year-olds succeed on each
scale item. The decreasing percentages of Ss at each age level who
succeed on items increasing in difficulty also suggest that the scale
describes an age-wise progression.
3. Retestiraof Ss after one year shows a general progression along
the scale. Table 27 indicates that of 19 Ss retested after one year, 16
either performed at the same or higher levels, with only 3 Ss scoring at a
lower level the second year.
The foregoing findings combine to show that the sequence from easiest
to hardest on the scale is an age-wise progression which appears to occur
in a regular order. More definive evidence would Le provided by a broader
age range of Ss inasmuch as no Ss in this age range scored at the lower levels,
and the sample was not extended to the Pge at which all Ss perform at the
highest level. Detailed evidence on the longitudinal progression of inOvi-
dual children is needed to ascertain whether all the steps included in the
developmental sequence described by the scale are essential for acquisition
of number conservation.
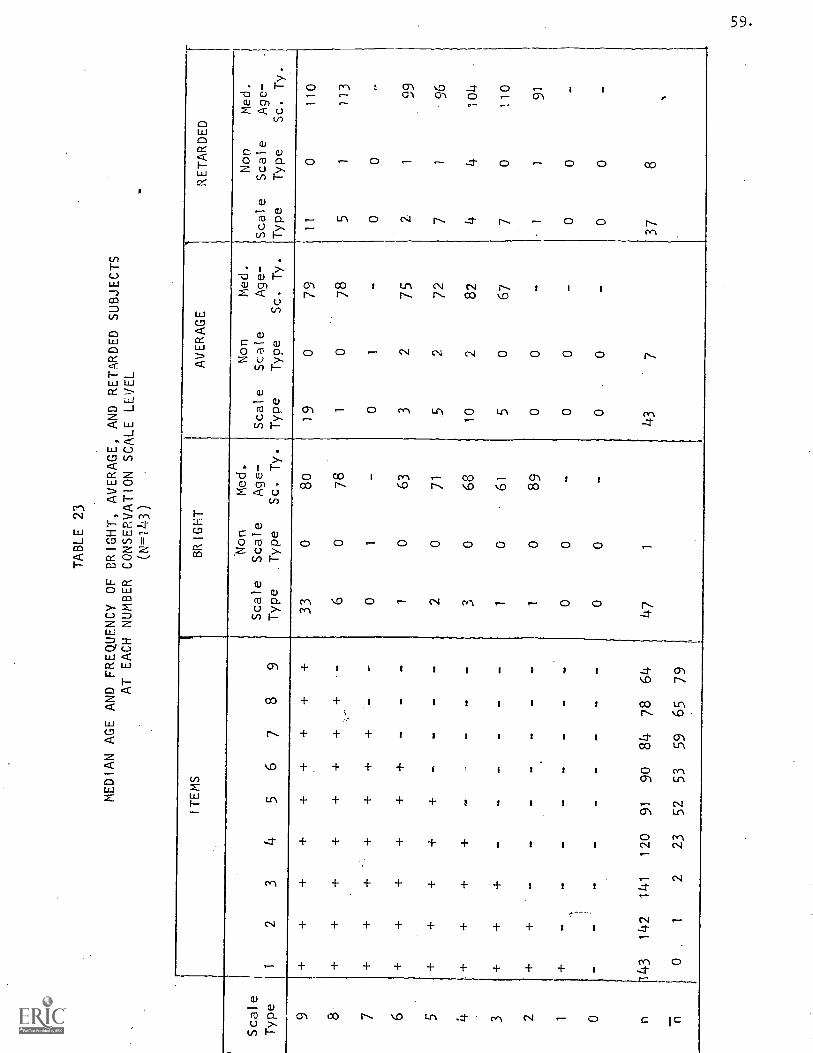
Scale
Type
9 8 7 6 5 3 2 1 0 n n
TABLE 23
MEDIAN AGE AND FREQUENCY OF BRIGHT, AVERAGE, AND
RETARDED SUBJECTS
AT EACH NUMBER CONSERVATION SCALE LEVEL
(N=143)
ITEMS
BRIGHT
AVERAGE
RETARDED
'Non
Med.
Non
Med.
Non
Med.
Scale
Scale
Age-
Scale
Scale
Age-
Scale
Scale
Age-
12
34
56
78
9Type
.Type
Sc. Ty.
Type
Type
Sc. Ty.
Type
Type
Sc. Ty.
++
++
++
++
33
080
19
079
11
0ii0
++
++
++
++
-6
078
10
78
51
113
++
++
+-
01
-0
1-
00
-
++
++
++
--
-1
063
32
75
21
99
++
++
+-
--
-2
071
.5
272
71
96
++
++
--
--
30
68
I
10
282
44
104
++
+-
--
--
-1
061
50
67
70
110
10
89
00
-1
191
+-
--
--
--
-0
0-
00
-0
0-
--
--
--
--
-0
0-
00
-0
0-
143
142
141
120
91
90
84
78
64
47
143
737
8,
0.
12
23
52
53
59
65
79
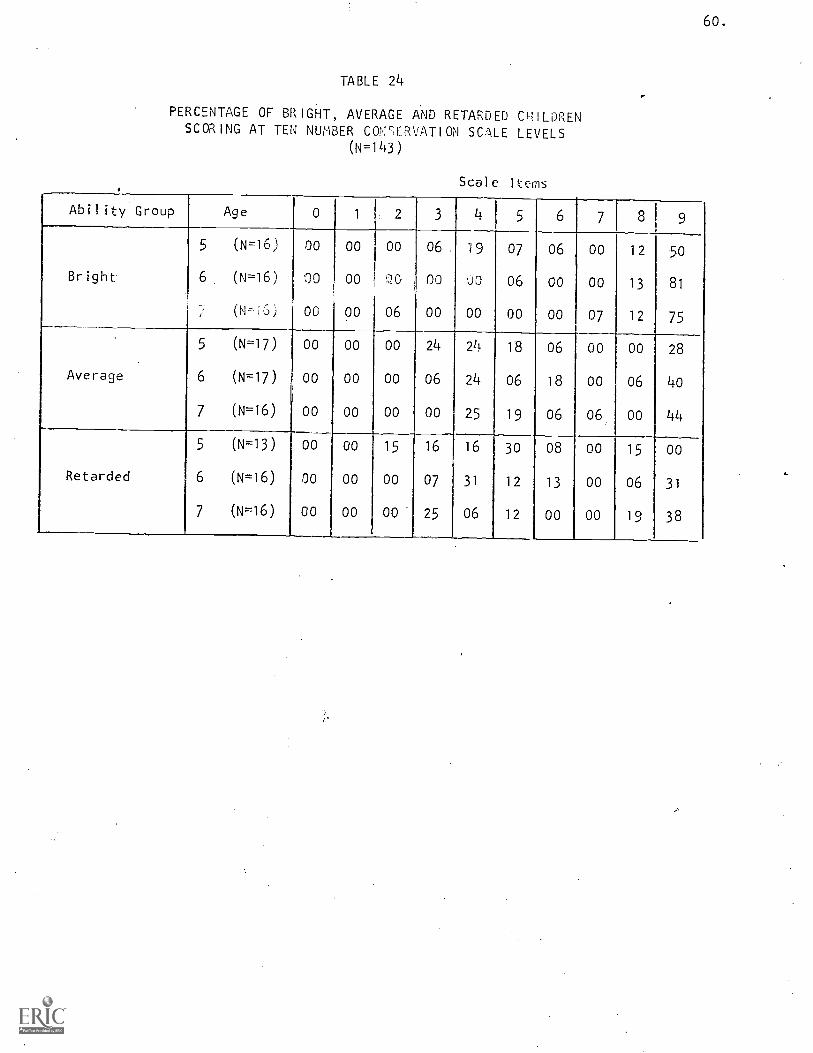
TABLE 24
60.
PERCENTAGE OF BRIGHT, AVERAGE AND RETARDED CHILDRENSCORING AT TEN NUMBER COW;ERVATION SCALE LEVELS
(N=143)
Scale Items
Ability Group Age 0 1 2 3 Li 5 6 7 8 9
5 (N=16) 00 00 00 06 . 19 07 06 00 12 50
Bright 6, (N=16) O0 00 QG 00 00 06 00 00 13 81
(N= G) 00 00 06 00 00 00 00 07 12 75
5 (N =17) oo 00 00 24 24 18 06 00 00 28
Average 6 (N=17) 00 00 00 06 24 06 18 00 06 40
7 (N=16) 00 00 00 00 25 19 06 06 00 44
5 (N=13) 00 00 15 16 16 30 08 00 15 00
Retarded 6 (N=16) oo 00 00 07 31 12 13 00 06 31
7 (N=16) 00 00 oo- 25 06 12 00 00 19 38
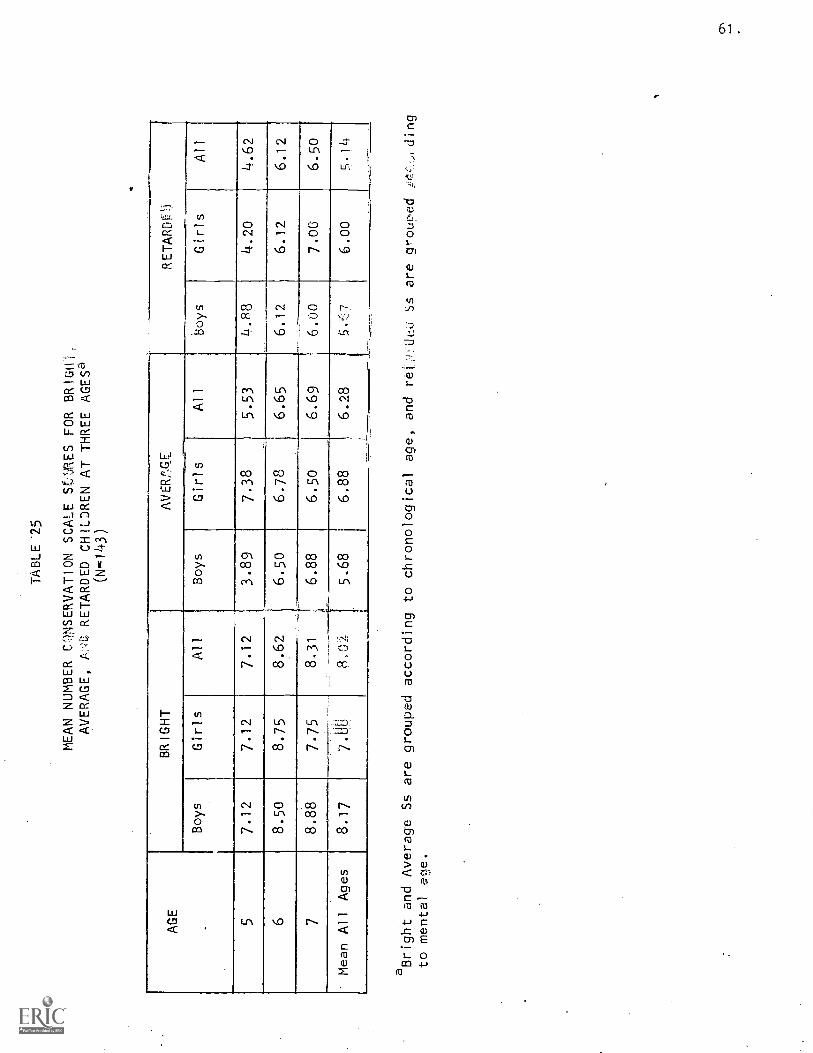
TABLE .25
MEAN NUMBER CQNSERVATION SCALE St;!ARES FOR BRIGOI,
AVERAGE, ANa RETARDED CHILDREN AT THREE AGESa
(N..143)
AGE
BRIGHT
AVERPAE
Boys
Girls
All
Boys
Girls
All
57.12
7.12
7.12
3.89
7.38
5.53
68.50
8.75
8.62
6.50
6.78
6.65
78.88
7.75
8.31
6.88
6.50
6.69
Mean All Ages
8.17
7.0
8.0z
5.68
6.88
6.28
RETARDO)
Boys
Girls
All
4.88
4.20
4.62
6.12
6.12
6.12
6.00
7.00
6.50
6.00
5.14
aBright and Average. Ss are grouped
according to chronological age, and rei,Uco Ss are ciroued
iding
to mental
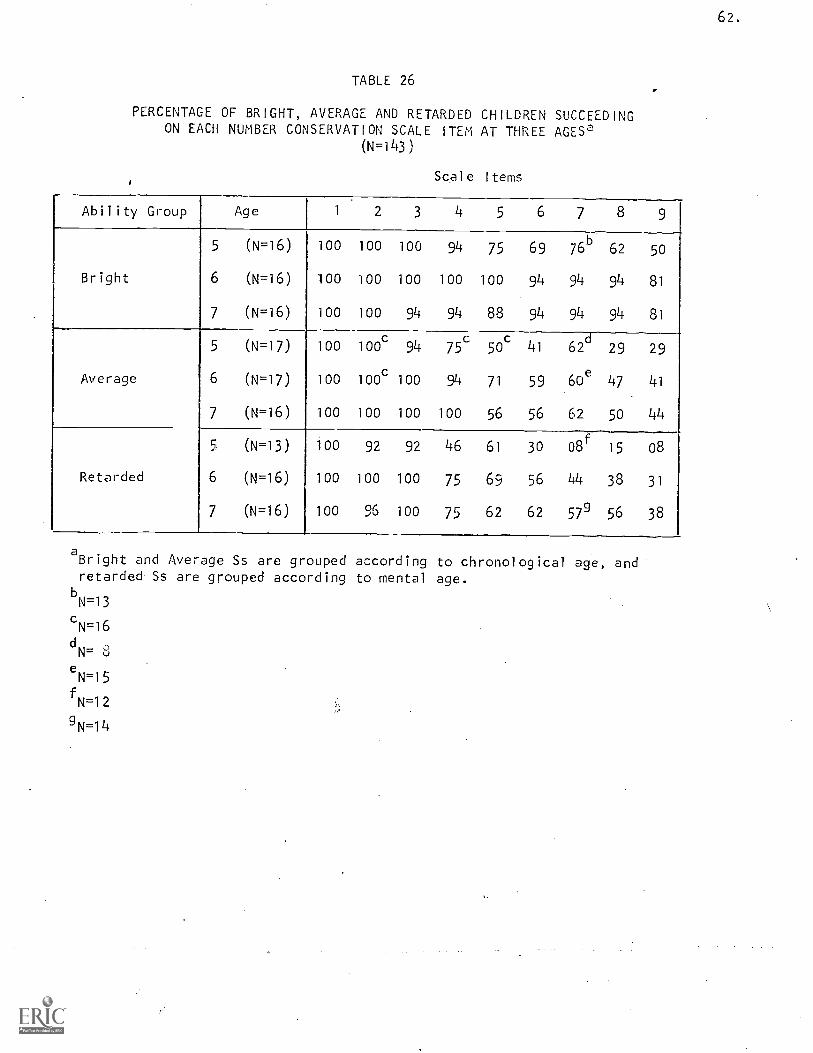
62.
TABLE 26
PERCENTAGE OF BRIGHT, AVERAGE AND RETARDED CHILDREN SUCCEEDINGON EACH NUMBER CONSERVATION SCALE ITEM AT THREE AGES°
(N=143)
Scale Items
Ability Group Age 1 2 3 4 5 6 7 8
5 (N=16) 100 100 100 94 75 69 76b 62 50
Bright 6 (N-16) 100 100 100 100 100 94 94 94 81
7 (N=16) 100 100 94 94 88 94 94 94 81
5 (N=17) 100 100c 94 75` 50c 41 62. 29 29
Average 6 (N=17) 100 100c 100 94 71 59 60e 47 41
7 (N=16) 100 loo 100 100 56 56 62 5o 44
5 (N=13) 100 92 92 46 61 3o o8f 15 o8
Retarded 6 (N=16) 100 100 100 75 69 56 44 38 31
7 (N=16) 100 96 100 75 62 62 579 56 38
aBright and Average Ss are grouped according to chronological age, andretarded Ss are grouped according to mental age.
bN=13
cN=16
dN= 8
eN=15
fN=12
gN=14
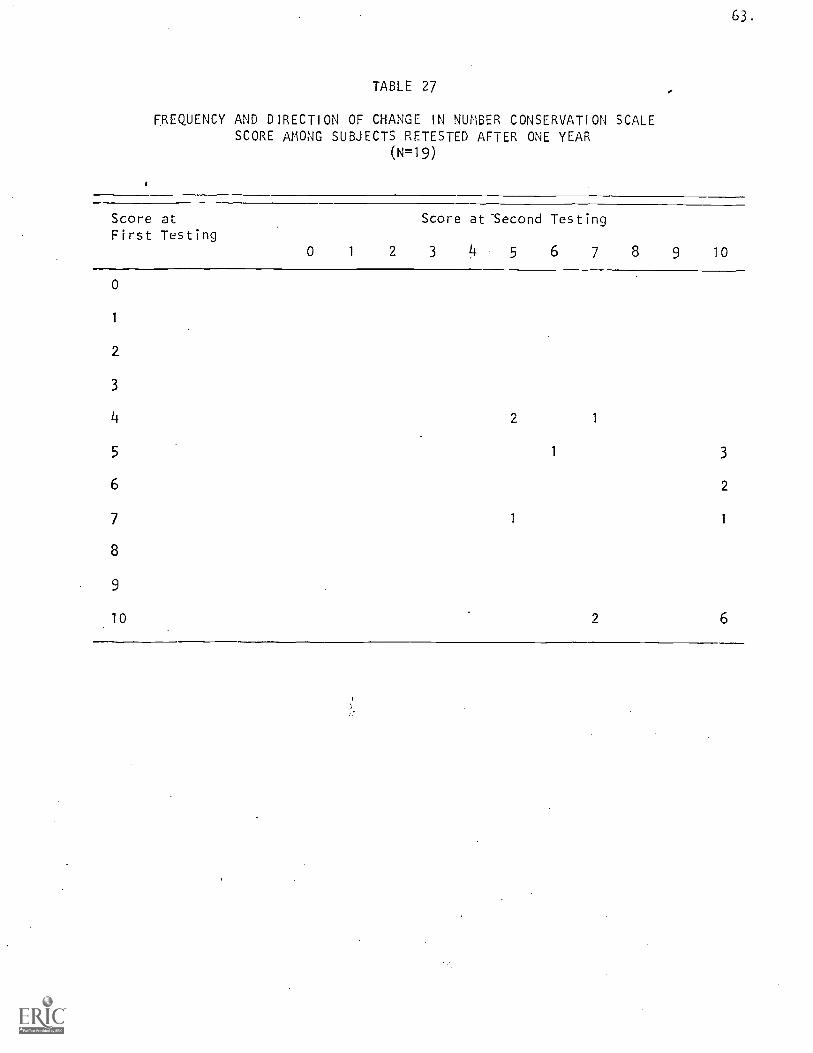
63
TABLE 27
FREQUENCY AND DIRECTION OF CHANGE IN NUMBER CONSERVATION SCALESCORE AMONG SUBJECTS RETESTED AFTER ONE YEAR
(N=19)
Score at Score at-Second TestingFirst Testing
0 1 2 3 4 5 6 7 8 9 10
0
1
2
3
4 2 1
5 1 3
6 2
7 1 1
8
9
10 2 6
64.
Effect of Intelligence on Performance
Sequent ial Order of Acquisition
The scalogram analysis performed separately for each IQ group indicated
that the order of difficulty of scale items does not vary for groups
differ ing in 10. Table 22 shows that the items form a Guttman scale for
bright, average, and retarded children.
Level of Performance
High IQ is associated with better performance on this number conserva-
tion task. Tables 24 26 show that bright children perform at a consistently
higher level than average or retarded children, but that there is littledifference between average and retarded children. An analysis of variance
between performance of bright and average groups showed a significant
difference attributable to IQ (F=18.36,df=1,86,p -< .0001), but no significant
difference in performance was found between average and retarded groups
(F=1.16,df=1, 83 ). However, since mental age is controlled in the comparison
between average and retarded groups, the significant age effect (F=3.44,
cif=2,83,P < .04) reflects the potency of mental age as a performance factor.
Thus, mental age appears to be a more potent: factor than IQ in acquisition
of number conservation.
Sex Differences
Table 25 indicates that there are no sex differences in number
conservation performance for bright children until age seven when boys perform
at a higher level. For average children, girl s are super ior to boys at age
five but are comparable in performance at s ix and seven years. The analysis
of variance results shows a significant interaction between age and sex
(F=13.29,df=2,86, p .04) for bright and average groups. In the comparison
of average and retarded groups, sex al one approaches significance as a
performance factor (F=2.98,df=1,83,p < .09), and the interaction among sex,
65.
age, and IQ also approaches significance (F=2.91,df=2,83,P.06). Thus,
it appears that while the developmental progress of girls toward number
conservation is as good or better than that of boys at ages five and six,
by age seven, this is no longer so, and bright girls suffer more in this
developmental comparison with boys than do average girls. For retor'dates,
a reverse trend appears to exist inasmuch as at m-ntal age seven, girls
perform at a higher level than do boys.
66.
CLASS INCLUSION
METHOD
The procedure used to investigate understanding of the inclusion
relation was based upon work by Piaget 0952). Materials utilized
are fbur chocolate M &M's and one white mint comparable in size to
that of the MO's.
Procedure
The child was seated at a small desk. E placed the mint and the
four M&M's on the desk and asked the following series of questions.
Item I was designed to provide S with the verbal labels "chocolate
candy" and "mint candy" in case he did. not possess these, to indicate
to S that both chocolate and mint are subclasses of a larger class
of candy, and to present the inclusion question. Slowly and clearly,
E said:
Look, here is some candy. Some are chocolate candy, and one ismint candy. Are these chocolate candy (pointing to M&M's)?Is this mint candy (pointing to mint)? Now, I'm going to haveyou pick some, and you must pick the most you can. If you don'tpick what has more to eat, you won't get any candy this time.Now, pick either all the chocolate or all the candy. Why didyou pick that? Which are there more of, chocolate or candy?Why is that?
Item 2 was included in order to ex lore the ability to identify
the whole and the larger subclass with the proper verbal labels. E
held out an open palm to S and said:
Put all the candy in my hand.Put all the chocolate in my hand.
Items 3 and 4 were designed to investigate the ability to recognize
that the whole includes each subclass and is greater than each. It was
expected that these questions might assist some Ss in revising an
incorrect response to Item 1. E asked:
Item 3: Is all the candy chocolate?Is all the candy mint?Is some of the candy chocolate?Is some of the candy mint?
67.
Item 4: Now, listen carefully. If you took some of the chocolateaway, would there be any chocolate left?
If you took all of the chocolate away, would there be anychocolate left?
If you took all of the chocolate away, would there beany candy left?
If you took all of the candy away, would there be anychocolate left?
Item 5 k:',5 designed to ascertain whether the exnerience in Items
3 and 4 did assist S in revising an incorrect inclusion response. E
said, "Then is there more candy or more chocolate? Why do you say
there would be more
Item 6 was included in order to ascertain whether S was viewing
both subclasses as complementar_y_Earof the whole. E asked, "What
kind of candy is here?"
Item 7 finally offered S one last opportunity to obtain all five
candies by correctly answering the inclusion question. E said, "You
take either all the :hocolate or All the candy whichever has more to
eat--and put it in your sack.
Scoring
Ss were scored as passing (-0 or failing (-) each of the following
items:
1. Knows referents for "all the candy" and "all the chocolate"
4.: Responds correctly when asked to "Put all the candy in my hand"and "Put all the chocolate in my hand" on Question 2.
2. Understands "all" and "some" (enveloping class and subclass)
4.: Responds correctly when asked whether all the candy is chocolate/mint and whether some of the candy is chocolate/mint on Question 3.
3. Knows that the whole is comprised of two parts (complementaity)
4.: Responds correctly when asked what kind of candy is presenton Question 6.
4. Says there is more candy t_ han chocolate point
ES.
5. Knows there is more candy than chocolate after the help questions
+: Takes all the candy at the end of the task on Question 6.
6. Knows there is more candy without help (includes)
Responds correcty to whether there is more candy or morechocolate on Question 1.
Note: "Candy" must refer to all five items, not to mint.
In addition, verbalized reasons were scored as follows:
Non-Inclusion Reasons:
I. Irrelevant reason or no reason given, e.g., "Because I like it,"
"Chocolate is good," "I don't like mint," "I looked at it," "This
is chocolate and that's white."
2. Graphic impression, gross or intuitive comparison (non-numerical
e.g., "It's a whole bunch," "It's a lot," "Because all the M&M's
together are bigger than one mint," "You can eat chocolates longer,"
"You can suck the mint longer," "Because it has more."
3. Numerical comparison of A (Chocolates).with A' (mint), e.g.,
"Becaus6' there are four M&M's and one mint."
Inclusion Reasons:
4. Non-logical or no reason given, e.g., "Chocolate is not sweet,"
"Because the chocolate and the mint have lots of taste to it."
5. Focus on whole class (B), e.g., "All of it, it's five," "Because
all together it.'s more," "All together it's bigger."
6. More than A is more than A, e.g., "Because there's one mint and
four chocolates. If I had four and add one, I'l have more."
7. 'Comparison of subclass A (chocolates) with the whole B, e.g.,
B is more than A: "Five is more than four." "There's more candythan chocolates," "All the chocolates aren't allthe candy," "There are five candies and onlyfour chocolates, and the mint makes five,"M&M's are less (not enough) than all the candy."
B-A= 0: "Because then it would be all gone," "It won't be all
69.
gone if you eat only the chocolate/mint," "There's sonmthingleft over after you take out the chocolate/mint."
RESULTS
Several lines of evidence suggest that the set of items presented
above can be accepted as a description of an invariant developmental
sequence of acquisition of inclusion ability:
1. The items are ordered in terms oF increasing difficulty. A
scalogram analysis using Green's (1956) summary statistics was performed
which indicates that the six dichotomous items form a Guttman scale
(See Table 34 for reproducibilities and indices of consistency). Table
35 shows the seven perfect scale patterns possible and indicates the
number of Ss in each ability group found for each scale type.
2. Increasing success on scale items occurs with increasing age and
reflects the order of difficulty. Median age of perfect scale types show a
general increase with increase in scale score. Table 36 indicates that
younger children tend to score at the lower scale levels and that older
children tend to score at the higher levels. This is reflected in an
increase in mean scale scores with increasing age for bright and average
groups as shown in Table 37. An analysis of variance finds age a significant
factor in performance (F=15.38,df=2,86,pc'.0001 for bright and average
groups). More specifically, the age-developmental character of the scale
is indicated by Table 38 which shows that the proportion of Ss passing
each scale item increases with age in a regular fashion.
3. Retesting of a small number of Ss after one year shows a general
progression along the scale. Table 39 indicates that of 19 Ss retested
after one year, 15 either performed at the same of higher level, and that
only 4 Ss scored at a lower level the second year.
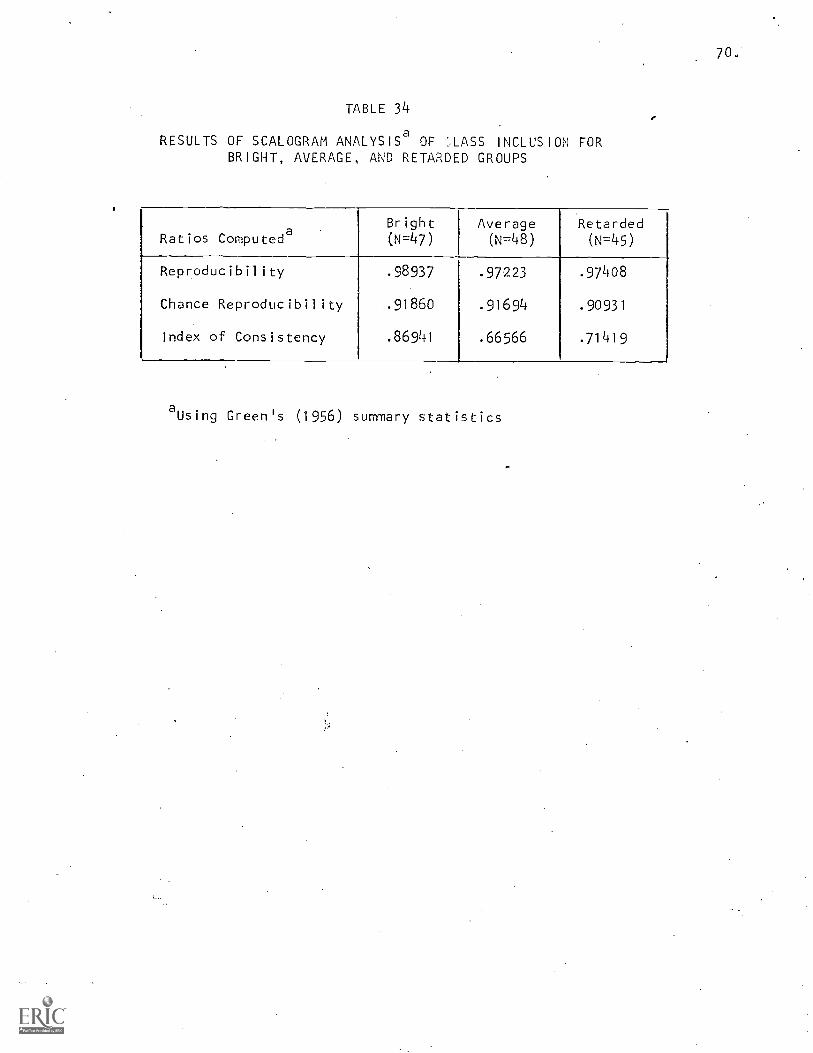
70.
TABLE 34
RESULTS OF SCALOGRAM ANALYSISa OF ;,LASS INCLUSION FORBRIGHT, AVERAGE, AND RETARDED GROUPS
Ratios ComputedaBright(N=47)
Average(N=48)
Retarded(N=45)
Reproducibility .98937 .97223 .97408
Chance Reproducibility .91860 .91694 .90931
Index of Consistency .86941 .66566 .71419
aUsing Green's (1956) summary statistics
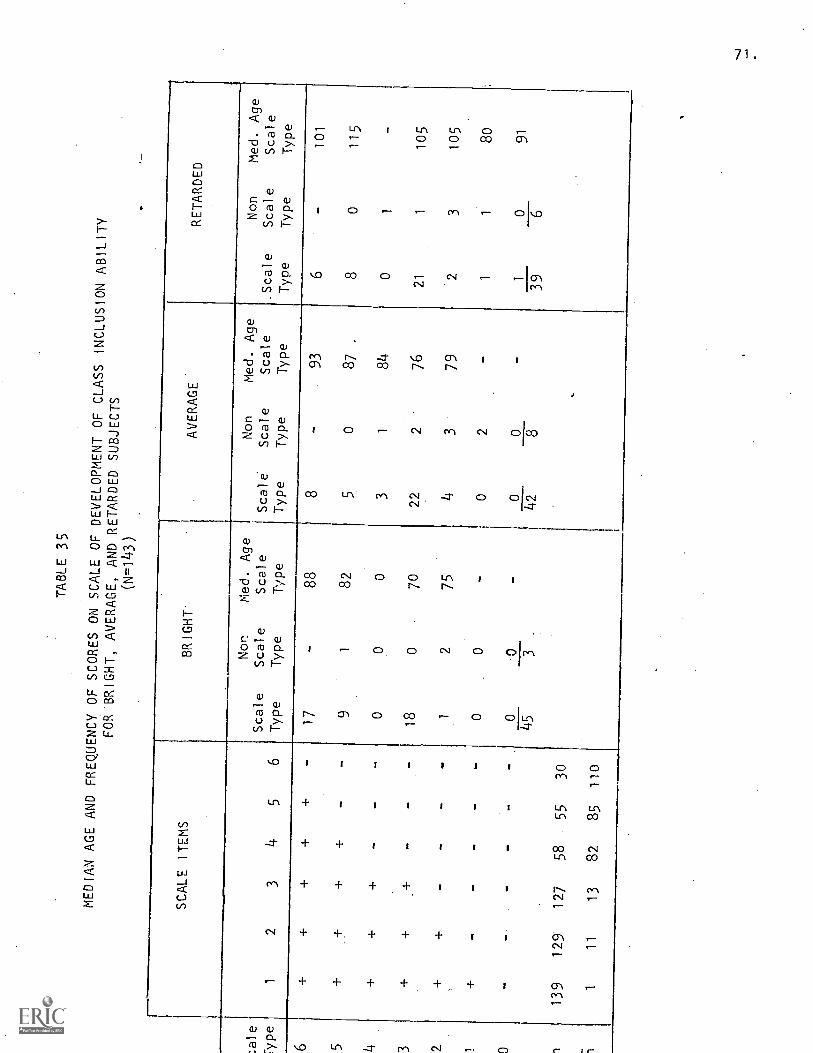
TABLE 35
MEDIAN AGE AND FREQUENCY OF
SCORES ON SCALE OF DEVELOPMENT
OF CLASS INCLUSION ABILITY
FOR BRIGHT, AVERAGE, AND
RETARDED SUBJECTS
(N=143)
SCALE ITEMS
BRIGHT
AVERAGE
RETARDED
Nor
Med. Age
Non
Med. Age
Non
Med. Age
Scale
Scale
Scale
Scale'
Scale
Scale
.Scale
Scale
Scale
12
34
56
Type
Type
Type
Type
Type
Type
Type
Type
Type
++
++
+-
17
-88
8-
936
-101
++
--
91
82
50
87
.8
0115
++
+-
--
00
03
184
01
-+
+-
--
18
070
22
276
21
1105
++
--
--
12
754
379
23
105.
+-
--
--
00
-0
2-
11
80
-0
-0
0-
10
91
45
3.
42
83
96
139
129
127
58
55
30
111
13
82
85
110
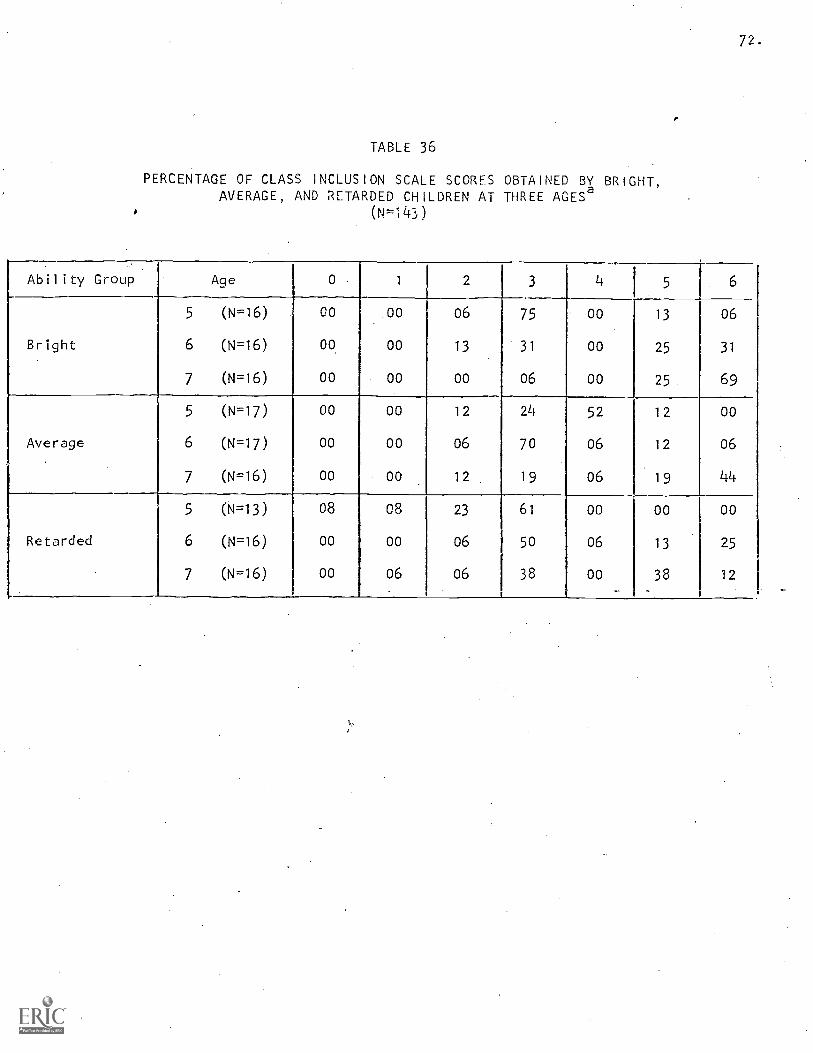
72.
TABLE 36
PERCENTAGE OF CLASS INCLUSION SCALE SCORES OBTAINED BY BRIGHT,AVERAGE, AND RETARDED CHILDREN AT THREE AGESa
(N=143)
Ability Group Age 0 1 2 3 4 5 6
5 (N=16) 00 00 06 75 00 13 06
Bright 6 (N=16) 00 00 13 31 00 25 31
7 (N=16) 00 00 00 06 00 25 69
5 (N=17) 00 00 12 24 52 12 00
Average 6 (N=17) 00 00 06 70 06 12 06
7 (N=16) 00 00 12 19 06 19 44
5 (N=13) 08 08 23 61 00 00 00
Retarded 6 (N=16) 00 00 06 50 06 13 25
7 (N=16) 00 06 06 38 00 38 12._ ..
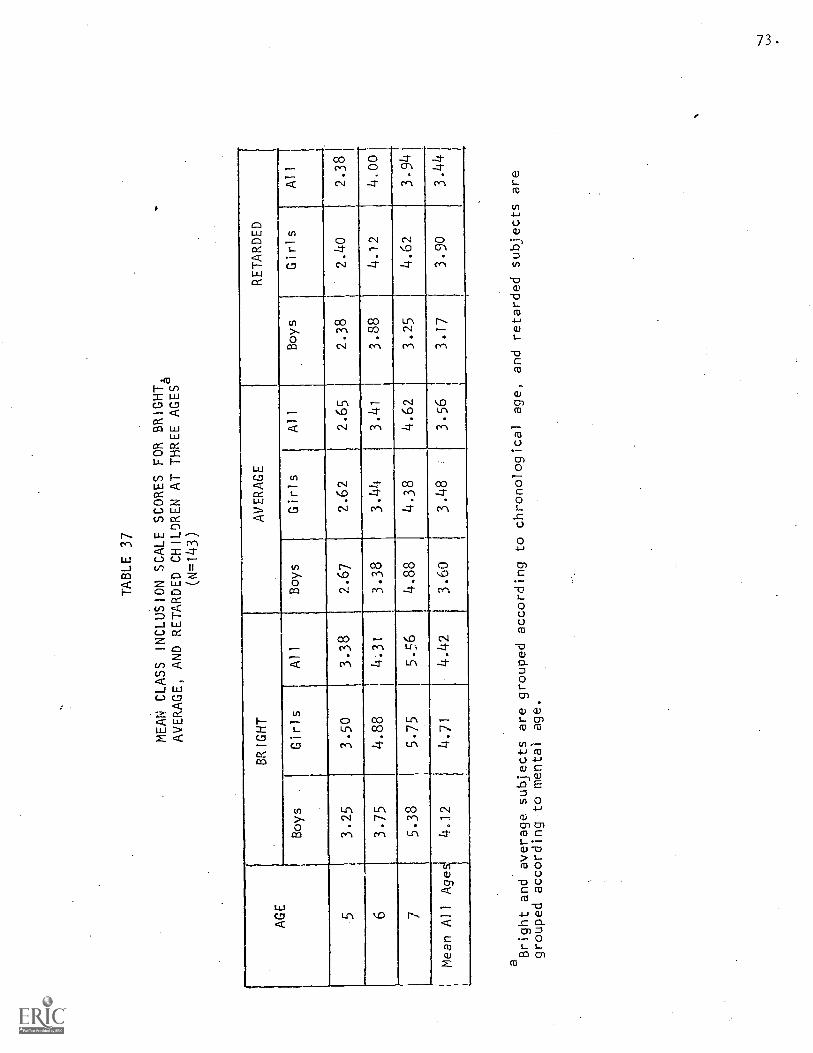
TABLE 37
MEAN CLASS INCLUSION SCALE SCORES FOR BRIGHT6
AVERAGE, AND RETARDED CHILDREN AT THREE
AGES
(N=143)
AGE
BRIGHT
AVERAGE
RETARDED
Boys
Girls
All
Boys
Girls
All
Boys
Girls
All
53.25
3.50
3.38
2.67
2.62
2.65
2.38
2.40
2.38
63.75
4.88
4.31
3.38
3.44
3.41
3.88
4.12
4,00
75.38
5.75
5.56
4.88
4.38
4.62
3.25
4.62
3.94
Mean All Ages
4.12
4.71
4.42
3.60
3.48
3.56
3.17
3.90
3.44
aBright and average subjects are grouped
according to chronological age,
and retarded subjects are
grouped according to mental age.
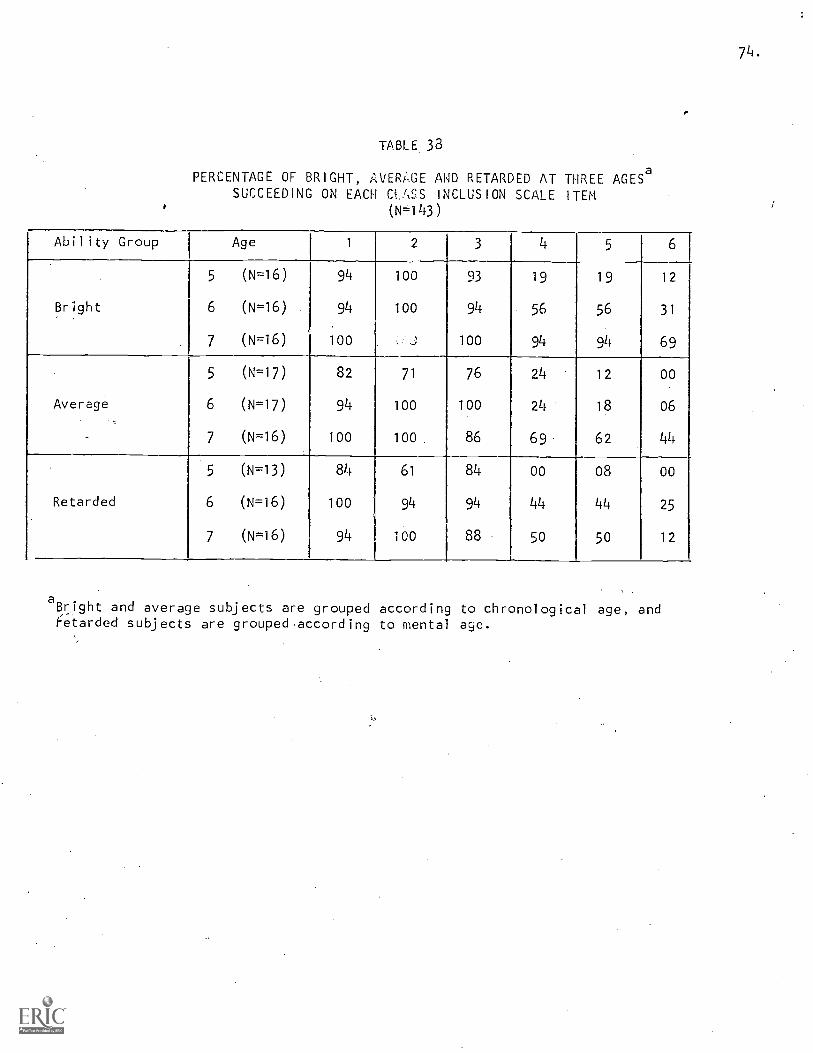
714.
TABLE 38
PERCENTAGE OF BRIGHT, AVERi,GE AND RETARDED AT THREE AGESaSUCCEEDING ON EACH UASS INCLUSION SCALE ITEM
(N=143)
Ability Group Age 1 2 3 4 5 6
5 (N=16) 94 100 93 19 19 12
Bright 6 (N=16) 94 100 94 56 56 31
7 (N=16) 100 100 94 94 69
5 (N=17) 82 71 76 24 12 00
Average 6 (N=17) 94 100 100 24 18 06
7 (N=16) 100 100. 86 69 62 44
5 (N=13) 84 61 84 00 08 00
Retarded 6 (N=16) 100 94 94 44 44 25
7 (N=16) 94 100 88 50 50 12
aBright and average subjects are grouped according to chronological age, andf=etarded subjects are grouped according to mental age.
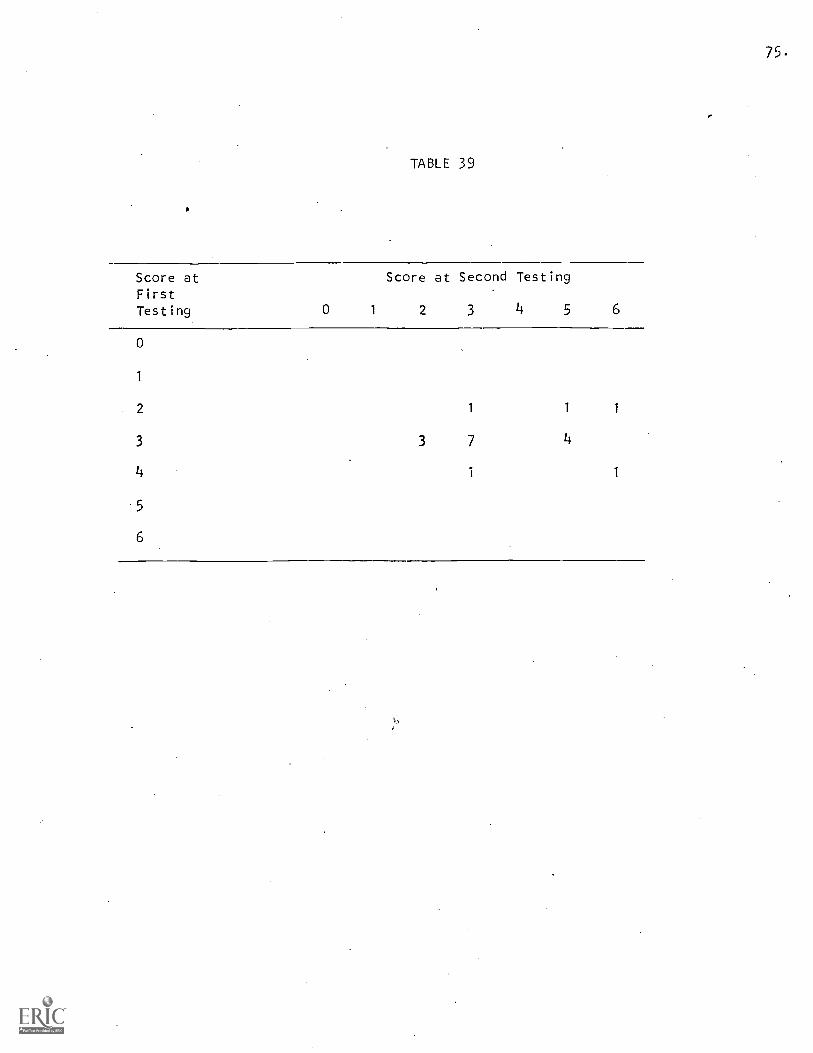
75
TABLE 39
Score atFirst
Testing 0
Score at Second Testing
1 2 3 4 5 6
0
1
2 1 1 1
3 3 7 4
4 i 1
5
6
s
76.
Effect of Intelligence on Performance
Sequential Order of Acquisition
The scalogram analysis performed separately for each ability group
indicates that the order of difficulty does not vary for groups differing
in IQ. Table 34 shows that the six items constitute a scale for bright,
average, and retarded groups. Thus, the sequential order of acquisition
of class inclusion ability is the same for these three IQ groups.
Level of Performance
While IQ significantly enhances the performance of bright Ss in
comparison to average Ss (F=13.014,6=1,86,p < .0006), it does not provide
average Ss with an advantage over retarded Ss of the same mental age
(F=.16,df.1,83,p t.69). Table 37 shows that the mean performance level
of bright Ss is higher than that of average Ss at every age level whereas
average Ss do not consistently perform at levels higher than retardates.
The interaction between mental age and IQ for average and retarded groups
approaches significance (F=2.15,df=-2,83,P .12). Retardates of the seme
mental age as average children perform comparably at mental ages five and
six (with retardates even showing some superiority at mental age six),
but perform less well on the whole at mental age seven. However, retarded
girls show higher levels of performance than both retarded boys and average
Ss at mental ages six and seven; the sex-IQ interaction also approaches
significance (F=2.13,df=2,83,p.15).
Sex Differences
Some tendencies for bright and retarded girls to perform at a higher
level than boys were found, but none of these are significant. Bright
girls at all ages, but expecially at age six, perform at a higher level
than bright boys. Retarded girls, particularly at mental age seven,

77-
obtain higher mean scale scores than do retarded boyS. Performance of
average boys and girls is comparable, but girls do somewhat more poorly
at age seven.
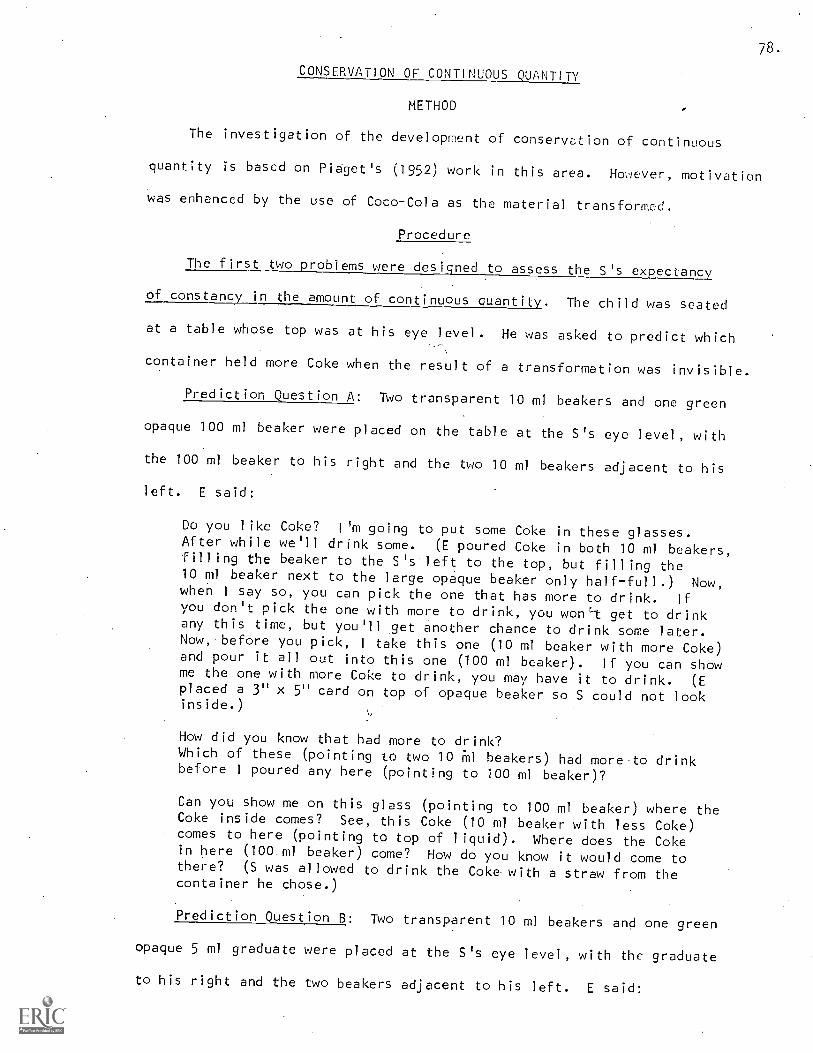
78.
CONSERVATION OF CONTINUOUS QUANTITY
METHOD
The investigation of the development of conservation of continuous
quantity is based on Piaget's (1952) work in this area. However, motivation
was enhanced by the use of Coco-Cola as the material transformed.
Procedure
The first two problems were designed to assess the S's expectancy
of constancy in the amount of continuous quantity. The child was seated
at a table whose top was at his eye level. He was asked to predict which
container held more Coke when the result of a transformation was invisible.
Prediction Question A: Two transparent 10 ml beakers and one green
opaque 100 ml beaker were placed on the table at the S's eye level, with
the 100 ml beaker to his right and the two 10 nil beakers adjacent to his
left. E said:
Do you like Coke? I 'm going to put some Coke in these glasses.After while we'll drink some. (E poured Coke in both 10 nil beakers,filling the beaker to the S's left to the top, but filling the10 ml beaker next to the large opaque beaker only half-full.) Now,when I say so, you can pick the one that has more to drink. Ifyou don't pick the one with more to drink, you won't get to drinkany this time, but you'll get another chance to drink some later.Now, before you pick,
I take this one (10 ml beaker with more Coke)and pour it all out into this one (100 ml beaker). If you can showme the one with more Coke to drink, you may have it to drink. (Eplaced a 3" x 5" card on top of opaque beaker so S could not lookinside.)
How did you know that had more to drink?Which of these (pointing to two 10 M1 beakers) had more-to drinkbefore I poured any here (pointing to 100 ml beaker)?
Can you show me on this glass (pointing to 100 ml beaker) where theCoke inside comes? See, this Coke (10 ml beaker with less Coke)comes to here (pointing to top of liquid). Where does the Cokein here (100 ml beaker) come? How do you know it would come tothere? (S was allowed to drink the Coke with a straw from thecontainer he chose.)
Prediction Question B: Two transparent 10 ml beakers and one green
opaque 5 ml graduate were placed at the S's eye level, with the graduate
to his right and the two beakers adjacent to his left. E said:
79.
Now, let's fill these glasses. Now I fill this glass (10 mlbeaker next to the graduate) up to the very top. I don't fill this-
(other beaker) glass up. Now, see, I put more Coke in one glass thanthe other. When I say so, you can pick the one with more to drink.If you don't pick the one with more Coke to drink, you won't getto drink any this time, but you'll get another chance to drink somelater. Now, before ,you pick, I take this one (beal<er. with lesser
amount) and pour the Coke all out into this one (graduate). (E
placed 3" x 5" card on top of opacur graduate so S could not lookinside.) If you can show me the one with.more Coke. to drink, I'll
give it to you to drink. How did you know that had more to drink?
Which of these (pointing to two beakers) had more to drink beforeI poured any in here (pointing to graduate)?
Can you show me on this glass (pointing to graduate) where the Cokecomes? See, this Coke (beaker with greater amount) comes to here(pointing to top of liquid). Where does the Coke in here (graduate)come? (E provided a straw so that S could drink the Coke from thecontainer he chose.)
Item 1 was designed to assess the S's ability to conserve when faced
with the transformation resulting from pouring the greater content of the
10 ml beaker into a wider 100 ml beaker. (This item is identical to
Prediction Question A, except that the transformation result was visible.)
Two transparent 10 ml beakers and one transparent 100 ml beaker were placed
on the table at the S's eye level, as in Prediction Question A. E said:
Now, I'm going to put some,Coke in these glasses. After whilewe'll drink some. (E poured Coke in both 10 ml beakers, fillingthe beaker to the S's left to the top, but filling the other 10ml beaker only half-full.) You don't need to show me, but can yousee that I put more Coke in one glass than the other? When I sayso, you can pick the one with more Coke to drink. If you don'tpick the one with more to drink, you won't get to drink any thistime. You'll get another chance to drink some later. Now, beforeyou pick, I take this one (beaker with more Coke) and pour the Cokeall out into this one (100 ml beaker). Now, look at them. If you
can show me the one with more Coke to drink, you may have it todrink. How could you tell that had more to drink?
If S said he knew because the empty beaker had more (or the filledone had less), E asked, "But how can you tell now when it's like this(pointing to 100)?"
If S said, "Because it was more," E asked, "When was it more?"
(E provided a straw so that S could drink the Coke from the container he
chose.)
Item 2 was designed to assess the S's ability to conserve when
faced with the transformation resulting from pouring th, lesser content
of the 10 ml beaker into a narrower, 5 ml graduate. (This item is )dentieol
to Prediction Question B, except that the transformation result was visible)
Two transparent 10 ml beakers and one transparent 5 ml graduate were
placed on the table at the S's eye level, as in Prediction Question B.
F lid:
Now, let's fill these two glasses. I fill this one (beaker n:xt
to graduate) up to the very top. I don't fill this (other beaker)
one up. Now, see, I put more Coke in one glass than the other,You don't need to show me, but can you see that one has more Coke
to drink. If you don't pick the one that has more Coke to drink,
you won't get to drink any this time. You'll get another chance to
drink some later. Now, before you pick, I take this one (beaker
with lesser amount) and pour the Coke all out into this one (graduate)
Now, look at them. If you can show me the one with more Coke to
drink, you may have it to drink. How could you tell that had more
to drink?
If S said he knew because the empty beaker had less (or the filled
one had more), E asked,/ "But how can you tell when it's like this
(pointing to graduate)?
If S said, "Because it was more," E asked, "When was it more?"
(If S was correct, E permitted S to drink the Coke he chose.)
Item 2a was provided as a control for the possibility that Ss correct
on both. Items 1 and 2 might be selecting the container greatest in width
in both cases. Such a centration would result in a false positive assess-
ment. Two 10 ml beakers and one 5 ml graduate were presented, as in Item
2. The procedure and instructions were identical to Item 2, except that
the greater quantity, rather than the lesser, was poured into the graduate'
Thus, a choice of the widest container in this situation would be incorrect
and would suggest that S was not actually a conserver.
Item 3 was provided as a control for the possibility that Ss giving
,a conservation response to Item 1 and a nonconservation response to Item
Linightbe selecting the tallest container in both cases. Such a centrati%

Ii.puld attenuate the meaningfulness of the conservation rc5ponse TwO 10
ml Orpduates, one of which had been cut to two-thirds the height of the
procedureother, and two 10 beakers were presented to the child, the
end .1)scructiens were identical to the first two items, e'ccePt that the
grotr guantitY was poured from one beaker into the shorter graduate, and
the 1s5er quantity Was poured frOill the beaker into the taller graduate.
Selection )1) the basis of height wouldiesul t in a noneonservation response.
skt_5E_As desiglid to find whether Ss __--t12E152L11[1922----1-1-e92-1-921-91
°n se if
qeilloOstrated the result ofouringthliq_back into the original_ContPiner. without letting S drin the Coke on Item 2, E said:
Which one had more beForeI poured 1t here (indicating graduate)?
Sce, this one (Pointing to beaker With greater quantity) has moreCake in it- This one (pointing to graduate) has less. See (pouringliquid from graduate back into original beaker), it's less. Thenthis (Pointing to beaker with more) has more. Now, I pour it back(pouring lesser quantity into graduate)- Now look at theM. Novi,you take the one with more Coke to drink.
Des-)it (really) get to be more to drink whenI put it in here
(pointing to graduate)? How does that happen? (E Provided a strawpermitted S to drink the Coke from the container he chose.)
)tem 5 tips_kesialed to find whether Ss hancor?ser-\hriorLini ht
i,vconservat ion
ofth
_response if Li5.1,.1292Jta...-Qiat52LAnS2129eIZal14fal2sistratccl
theltneoriatlaluidbackirorictaii)er Item
1
way t'exiministered, and if S again gave a noncohservation response, E
said;
Which one had more beforeI poured it here (indicating 100 01 1)0,1kc'r)?
ee, this one (pointing to beaker with lesser amount has less Coketo drink. See, (pouring Cww from 100 ml be aker back into or10 ml beaker), this is more. Now, I pour it back (pouring from smallbeaker into larger one). Now look at them. Now you 4ake the oneWith more Coke to drink.
Pes it (really) get to be leSs to drink whenI put it in here
(Larger beaker)? How does that happen?
If OVe a conservation response to the readministered Item 1,E
ON cc3old you tell that had more to drink?
yfrwh had more before I poured it here (pointing to larger bcill\er)?
(1 °ey it change when it's poured in here (larger beaker)?
'11,°veci 5 to drink the Coke he chose.),
Scoring.
Ss 1./1°te scored as passing (+) or failing (-) each of the foll 109
teN
1, Iwivb.prs which beaker had more initial.`: after transformatioo
Answers memory question correctly
2. 746t% constanc
is; Colyectly predicts constant relationship of quantities aft4'htrnsfoi.E:Liao with opaque containers (Correct on Predicti°)Question A and B)
3, FJer hel
1, Makes conservation res ponse on Ql or Q2 (Note: Vacillativ(' 1110YOccur for an S scored + if he drinks the greater quantity Or) al
Or 0)
4, 14q450zquantity did not really chmle,..
5ays transformed ciPantity did not get to be less/more to d(lh14 DOall postulations of the question
5 4.,---15AI,Saas.21_111t12be12
0) conserves on Q1 and Q2b) Conserves on Q4 and 06 after help demonstration (or on 011, if
only one asked)
6. Cons-5t nt 1 conserves,
82.
Correct on Q1 and Q2
7. kol-.)---,"\,e5zitt Certainty
shows no vacillation, no contradiction in choice of greate( 4"tity;ne\'er seems to consider possibility of inconstancy
528,
k. 1r Y111 spite of knowl dcLeofchange in level04_-
83.
+: Correctly anticipates change in level on predictioh Questions Aand B and correctly predicts constancy
, In addition, verbalized reasons For choices were scored as follows:
Nonconservptionkes2nL:
1. Irrelevant reason or no reason giver
2. Quantity relationship changed "because you poured
3. Supernatural cause, "It's magic."
4. Centration on height, e.g., "This one is up to here, and this one
is down to here," "This one is higher."
5. Centration on width, e.g., "This is skinny, and this is fat."
Conservation Reasons
6. Irrelevant reason or no reason given
7. Arre.-,rpnce. is irrclevent to quantity, e.g., it just looks like more/
less."
8. Identity, e-9., "It was more/less before you poured it."
9. Empirical reversibility, e.g., "If you poured it 1%,14 ( into original
container), it be more/less."
10. Compensation of relations, e.g., "This one is wider, 5Q it's not so
high, and this one 15 higher so it's skinny."
11. Addition-subtraction principle, e.g., "You didn't add an' more Coke
in it,'' "Y 1.1 didn't pour any back in the pitcher (before transformation)."
12. G ralizatien, e.g., "It stays the same, no matter what you do."
RESULTS
Several lines of evidence suggest that the set of items Presented
above can be accepted as a description of an invaria developmental sequence
of acquisition;
1. The items are ordered in terms of increasinIALGEt;ully. A
scalogram analysis2
using Green's (1956) summary stati sties was performed
which indicates that the s,oven dichotomous items form a Guttman scale
84.
(See Table 28 for reproducibilities and indices of consistency). Table
29 shows the eight perfect scale patterns possible and indicates the number
of Ss in each ability group found for each scale type.
2. Increasin9 success on scale items occurs with increasing age and
reflects the order of difficulty. Table 30 indicates that younger children
tend to score at the lower scale levels and that older children tend to
Store at the higher levels. This is reflected in an increase in mean scale
scores withincreasing age for bright Ss, but for average Ss only from
age five to age six (See Table 31), Median ages of scale types, shown in
Table 29 generally increase as one proceeds from scale level 0 to 7. Table
32 shows that the proportion of Ss passing each scale item increases with
age in a regular fashion for bright Ss, 'wt for average Ss, the regularity
applies only to the comparison between f:e FInd six-year-olds. The small
amount of change even for bright Ss from age six to seven suggests that a
broader age range is necessary to fully explore the existence of the age-
wise progression for this scale. However, analyses of variance indicate
that age is a significant factor- in performance (F=7.07,df=2.86,p.002
for bright and average groups).
3. Retest i nq of a small numE?r of Ss after one year shows a general
progression along the scale. Table 33 indicates that of 19 Ss retested
after one year, 17 either performed at the same or hi-,;her level, and that
only 2 Ss scored at a lower level the second year.
Effect of Intelligence on Performance
Sequential Order of Acquisition
the scalogram analysis was performed separately for each ability group
t-..; ascertain whether the order of difficulty varies for different IQ
groups and whether the same developmental sequence applies. The order of
item difficulty is identical for bright, average, and retarded groups,
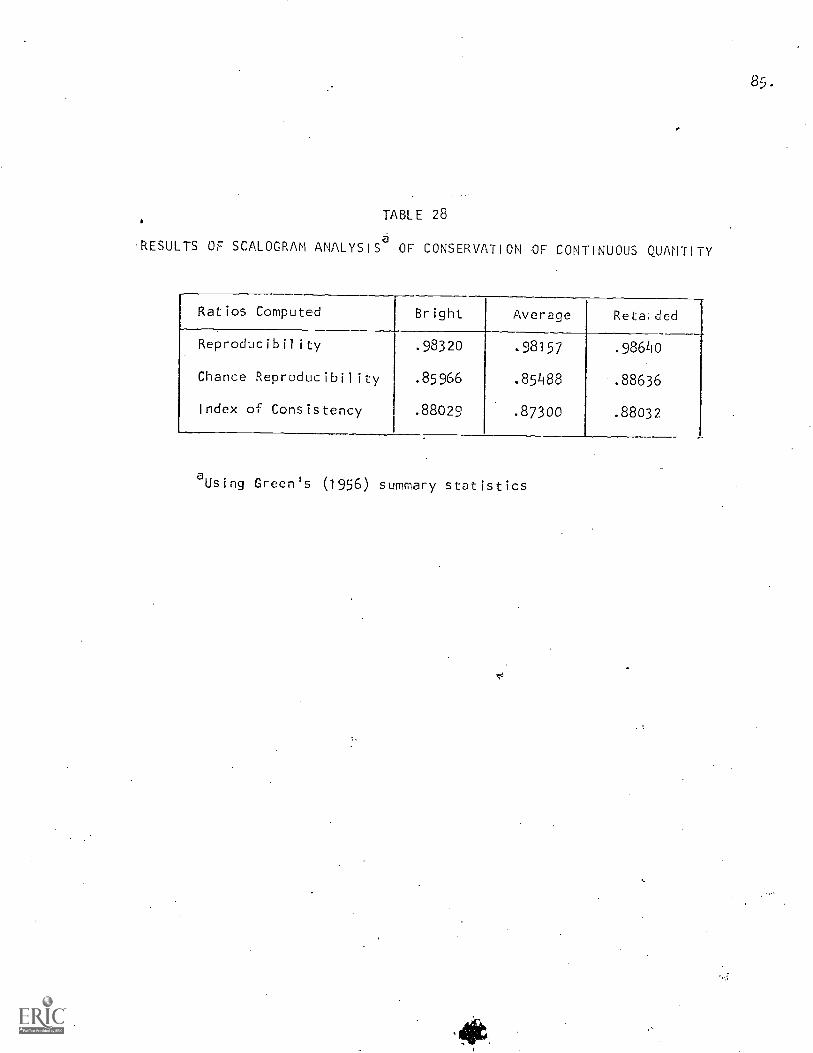
85.
TABLE 28
RESULTS OF SCALOGRAN ANALYSISaOF CONSERVATION OF CONTINUOUS QUANTITY
Ratios Computed Bright Average Reta,ded
Reproducibility .98320 .98157 .986L0
Chance Reproducibility .85966 .85488 .88636
Index of Consistency .88029 .87300 .88032
°Using Green's (1956) summary statistics
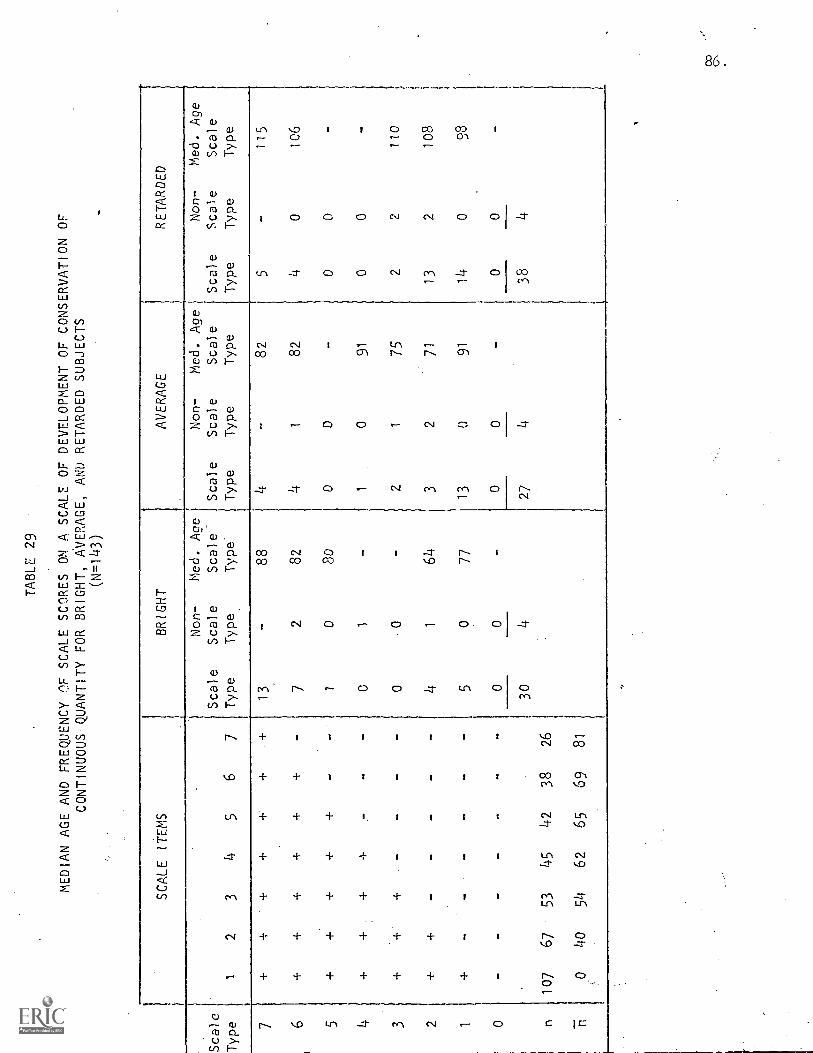
TABLE 29
MEDIAN AGE AND FREQUENCY CT SCALE SCORES ON A SCALE OF DEVELOPMENT OF CONSERVATION OF
CONTINUOUS QUANTITY FOR BRIGHT, AVERAGE, AND RETARDED SUBJECTS
(N=143)
SCALE
ITEMS
BRIGHT
AVERAGE
RETARDED
Non-
Med. Ace
Non-
Med. Age
Non-
Med. Age
Scale
Scale
Scale
Scale
Scale
Scale
Scale
Scale
Scale
Scale
Type
12
34
56
7Type
Type
Type
Type
Type
Type
Type
Type
Type
7+
++
++
+13.
-88
482
5115
6+
++
++
-7
282
, 41
82
40
106
5+
++
++
-1
080
00
-0
0-
4+
+-
-0
1-
10
91
00
-
3+
00
-2
175
22
110
24
164
32
71
13
2108
15
077
13
091
14
098
o-
--
--
--
00
-0
0-
00
-
30
427
438
4
n107
67
53
45
42
38
26
Ti
040
54
62
65
69
81
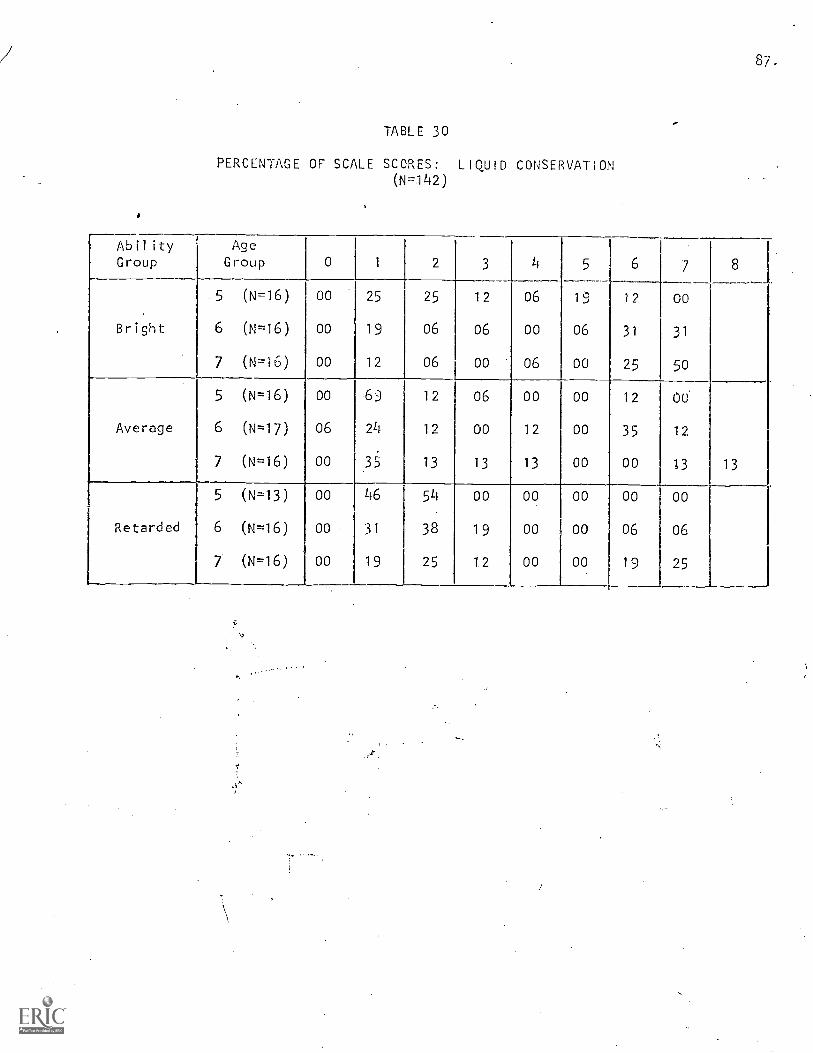
87.
TABLE 30
PERCENTAGE OF SCALE SCORES: LIQUID CONSERVATION(N=142)
AbilityGroup
AgeGroup 0 1 2 3 4 5 6 7 8
5 (N=16) 00 25 25 12 06 19 12 00
Bright 6 (N=16) 00 19 06 06 00 06 31 31
7 (N=16) 00 12 06 00 06 00 25 50
5 (N=16) 00 .69 12 06 00 00 12 00'
Average 6 (N=17) 06 24 12 00 12 00 35 12
7 (N=16) 00 35 13 13 13 00 00 13 13
5 (N=13) 00 46 54 00 00 00 00 00
Retarded 6 (N=16) 00 31 38 19 00 00 06 06
7 (N=16) 00 19 25 12 00 00 19 25
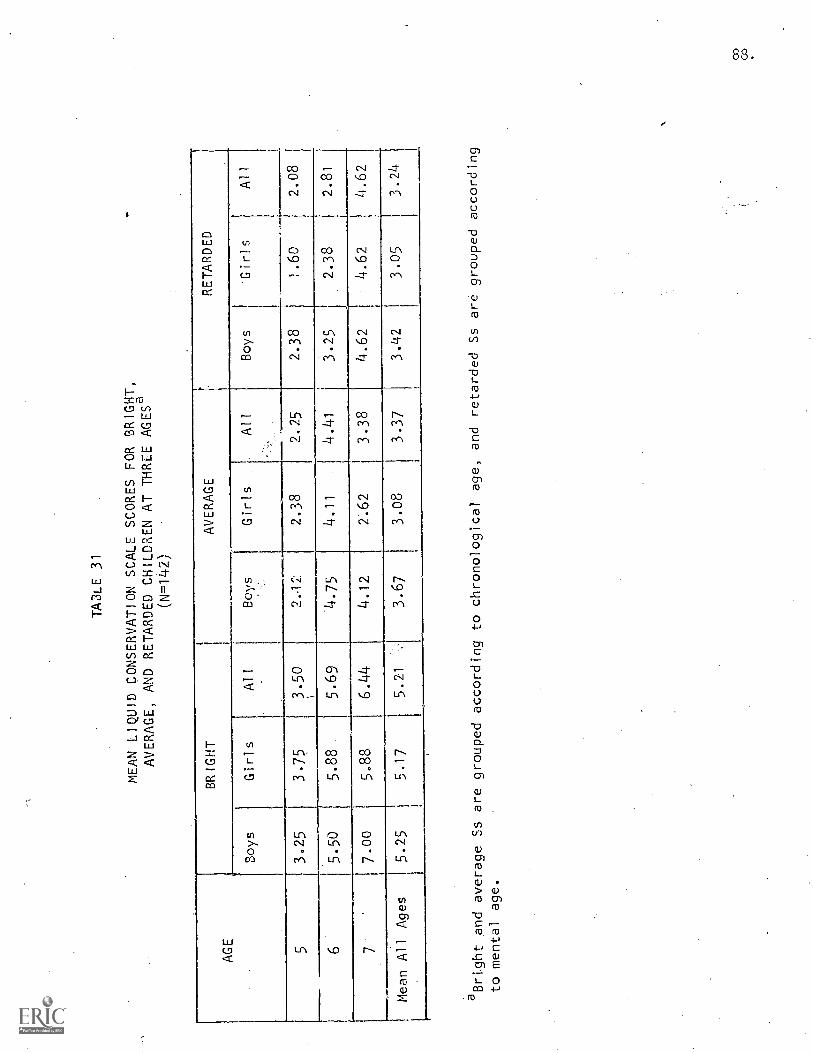
TABLE 31
MEAN LIQUID CONSERVATION SCALE SCORES FOR BRIGHT,
AVERAGE, AND RETARDED CHILDREN AT THREE
AGESa
(N=142)
AGE
BRIGHT
AVERAGE
RETARDED
Boys
Girls
Al!
Boys
Girls
Al!
-,
Boys
Girls
All
53.25
3.75
3.50
2.12
2.38
2.25
2.38
1.60
2.08
65.50
5.88
5.69
4.75
4.11
4.41
3.25
2.38
2.81
77.00
5.88
6.44
4.12
2.62
3.38
4.62
4.62
,4.62
Mean All Ages
5.25
5.17
5.21
3.67
3.08
3.37
3.42
3.05
3.24
aBright and average Ss are grouped according to chronological age,
and retarded Ss are grouped according
to mental age.
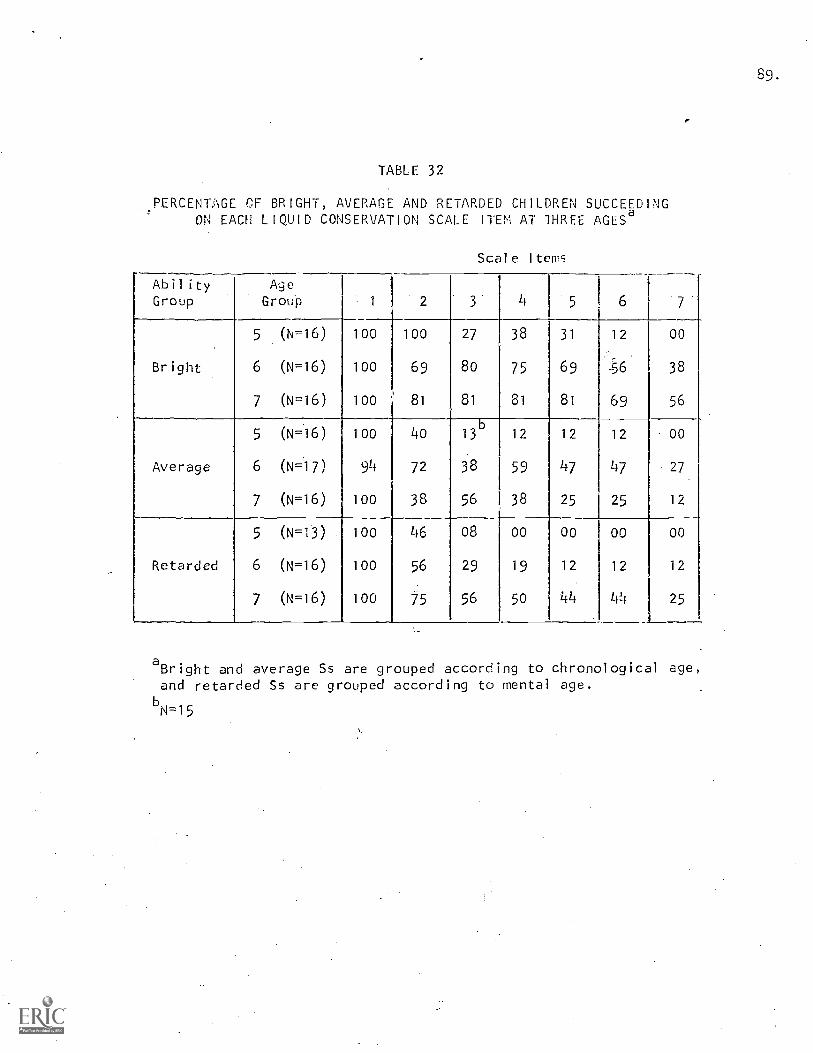
89.
TABLE 32
PERCENTAGE CF BRIGHT, AVERAGE AND RETARDED CHILDREN SUCCEEDINGON EACH LIQUID CONSERVATION SCALE ITEM AT THREE AGES
a
Scale Items
AbilityGroup
Age
Gro4 1 2 3 4 5 6
5 (N=16) loo 100 27 38 31 12 00
Bright 6 (N=16) 100 69 8o 75 69 :56 38
7 (N=16) loo 81 81 81 81 69 56
5 (N=16) loo 4o 13' 12 12 12 00
Average 6 (N=17) 94 72 38 59 47 47 27
7 (N=16) loo 38 56 38 25 25 12
5 (N=13) 100 46 08 00 00 00 00
Retarded 6 (N=16) 100 56 29 19 12 12 12
7 (N=16) 100 75 56 5o 44 44 25
aBright and average Ss are grouped according to chronological age,and retarded Ss are grouped according to mental age.
b
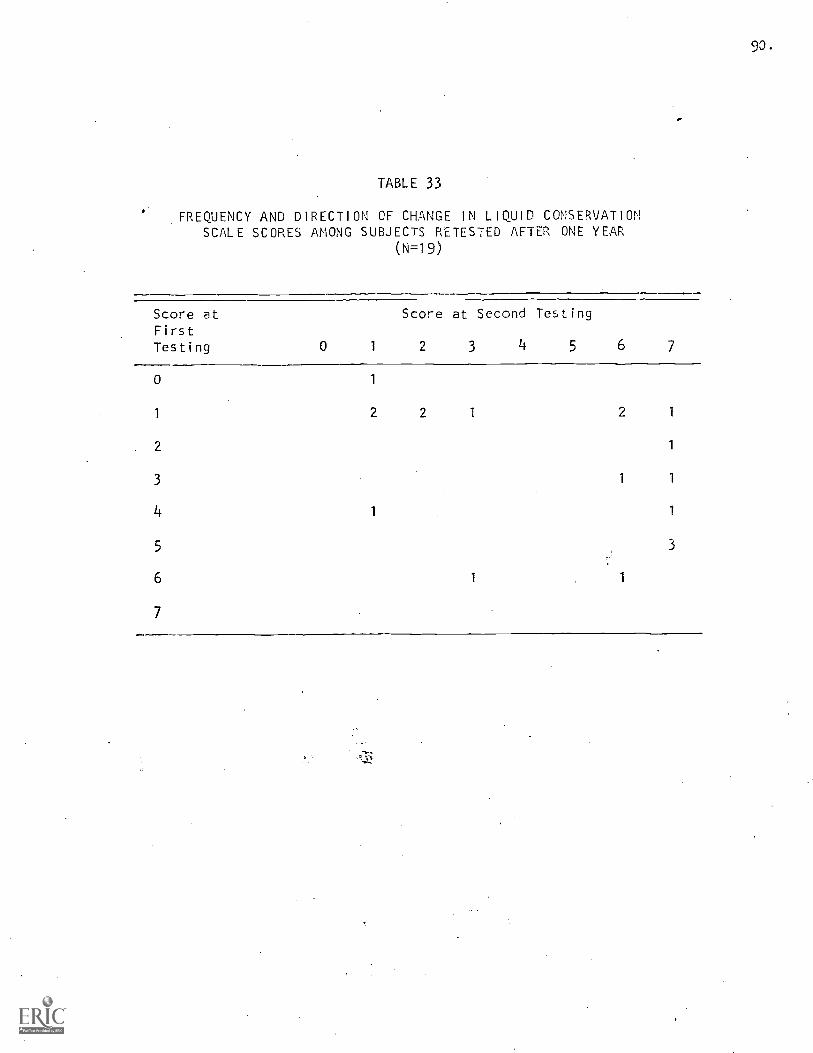
90.
TABLE 33
FREQUENCY AND DIRECTION OF CHANGE IN LIQUID CONSERVATIONSCALE SCORES AMONG SUBJECTS RETESTED AFTER ONE YEAR
(N=19)
Score at Score at Second TestingFirstTesting 0 1 2 3 4 5 6 7
0 1
1 2 2 1 2 1
2 1
3 1 1
4 1 1
5 3
6 1 1
7
91.
and Table 28 indicates that the set of items is scalable for all thr-ee
groups.
Level of Performer,.,
While IQ significantly enhances the performance of bright Ss in
comparison to average Ss (P=12.45,6=1X,p<:.0007), it does not provide
average Ss with an advantage over retarded Ss of the same mental age
(F=.17,df=1,83,p<:.68). Table 31 indicates that the mean performance levei
of bright Ss is higher than that of average Ss at every age level whereas
average Ss do not consistently perform at levels higher than retardates.
The interaction between mental age and !Q for average and retarded groups
approaches significance (P=2.87,df=1,83,p<;.06); retardates at mental age
seven are superior to average Ss at mental age seven, but the reverse is
true for mental age six.
Sex Differences
Although bright and average girls show a tendency to perform better
than boys at age five and considerably worse than boys at age seven, the
sex difference was found not to be statistically significant.
92.
CONSERVATION OF LENGTH
METHOD
Procedures for assessing ability to conserve length were based on
some of those described by Piaget (1960). Stimulus materials were
cylindrical colored gum straws. The child was seated at a child-sized
desk on which the following series of problems involving pairs of sticks
(one 4 inches and one 4Z- inches) were presented parallel to his line of
sight.
Procedure
The first two problems were designed to assess the S's expectancy
of constancy in length. The child was asked to predict which of two
gum sticks was longer when an invisible position displaceMent left
equal portions of the sticks in view. Colors of pairs and color of longest
stick were systematically varied. Also, the prediction procedure controls
led for differing tendencies of Ss tc center on either near or far ends of
sticks.
Prediction Question A: Two unequal sticks (4-inch yellow and
inch green) were presented with ends farthest from child al igned. E said:
Here are two gum sticks. Show me the bigger and longer one. Now,when I say so, you can pick the bigger one that has more gum tochew to keep. If you don't pick the one with more gum to chew, youwon't get any this .time, but you'll get another chance to get gumlater. Now, before you pick, I put them like this (E placed cardover aligned ends and pushed the longer stick into visible alignmentwith shorter stick. Is one gum stick longer now? Show me thelonger one with more gum to chew.
How did you know that had more to chew?Which had more to chew before I covered them?
'Prediction Question B: Two sticks (4-inch pink and 44-inch yellow)
were presented with ends nearest the child aligned. E said:
Here are two more gum sticks. Show me the bigger one. Now, when I
say so, you can pick the longer one that has more gum to chew.If you don't pick the one with more to chew, you won't get any thistime. You'll get another chance to get gum later. Now, before you
93.
pick, I put them like this (E placed card over aligned ends and pushedthe protruding longer stick into alignment with shorter stick). Isone guru :,tick longer now? Show me the longer one with more gum tochew.
How did you know that had more to chew?Which one,had more to chew before
I covered them?
Items 1 and 3 are the conservation test items which parallel Prediction
Questions A and B, controlling for centration tendencies by moving the
shorter stick away from S in Item 1 and by moving the shorter stick toward
S in Item 3. Items 2 and it were given only to Ss who did not conserve on
Items 1 or 3 in order to provide an opportunity for the child tc recogni7e
the contradiction in his selections and to investigate the degree to which
the S believed the transformation really changed the quantity.
Item 1 was designed to eulore S's ability to conserve when a shorter
stick was displaced so that the end nearest S extended beyond the longer
one. 'Placing two gum sticks (4-inch orange and 477-Inch purple) on the
table, with the ends farthest from the child aligned, E said:
Here are two gum sticks. One is bigger than the other. One islonger. You don't need to show me, but can you see that one is biggerthan the other? When I say so, you can pick the bigger one to keepor to chew. If you don't pick the biggest one with more gum to chew,you won't get gum this time. You'll get another chance to get gumlater. Now, before you pick, I put them like this (E moved shorterorange stick toward child so that it extended about 1-inch beyondthe other stick). Now, look at them. If you can show me the one withmore gum to chew, you may have it. How could you tell it was bigger?
If S said, "I looked at it," "I saw this was biggest," or similar ambiguous
response which could refer to a remembrance of which was bigger prior to
the transformation, E asked: "When did you look/see it?" If S said, "I
measured," or demonstrates by aligning the sticks, E replaced the sticks
in the transformation position and asked, "But how can ycu tell when they're
like this?" Finally, the memory question was asked: "Which had more to
chew before I moved them like this?"
Item 2 was administered only to Ss who nonconserved on Item 1 in order
to challenge their response and explore beliefs about the reality and
911.
causality of the phenomenon. E said:
You told me this was the biggest one (pointing to shorter orange).(E moved longer purple stick toward S so that its end ncdrestextended about 1-inch beyond the orange one.) Ncw show me the bigone.
If S picked the longer purple stick, Item 2a was administered:
Item 2a: (E replaced sticks in original position, with ends farthestfrom child aligned.) Before, you said this (E moved orange towardS as in Item 1 so it extended beyond the purple) was biggest. Now,(E moved purple toward S as in ir.:em 2 so it extended beyond orange)you say this (pointing to purple) is bigger. Does it really change?Does this get to be more gum to chew? How does that happen?
Item 3 was designed to explore S's ability to conserve when a shorter
stick was displaced so that the end furthest from S extended beyond the
longer one. Placing two gum sticks (4-inch purple and 44-inch pink) on
the table, with the ends nearest S aligned. E said
Here are two more sticks of gum. One is bigger than the other.One is longer. You don't need to show me, but can you see that oneis Liggr than the other? When I say so, you can pick the biggerone to keep or to chew. If you don't pick the biggest one withmore gum to chew, you won't get gum this time. You'll get anotherchance to get gum later. Now, before you pick,
I put them like this(E moved the purple stick aTlay from S so that its far end extendedabout 2 -inch beyond the pin!: stick). Now, look at them. If you canshow me the biggest one, you may have it. How could you tell it wasbigger?
If S realigned the sticks or gave an ambiguous response possibly reTerring
to a memory of the pre-transformation state, E probed as described in
Item 1, above. Finally, the memory question was asked: "Which had more
to chew beforeI moved them like this?"
Item 4 was administered only to Ss who nonconserved on Item 3 in order
to challenge their response and explore beliefs about the reality and
causality of the phenomenon. This procedure was identical to that of
Item 2, except that it explores beliefs about the transformation resulting
from moving the shorter stick away from, instead of toward, the child.
Item 5 was intended to investigate S's ability to conserve in the
95.
context of a somewhat more difficult situation where the longer gum stick
is bent in an arc so that its end points describe a shorter straight line
than that of the shorter stick. Placing two gum sticks (4-inch pink,
4*-iinch orange) on the table with ends aligned in accordance with any
centration expressedon prev;ous items, E'said:
See, one is bigger, one is longer? When I say so, you can pick thebigger one with more gum to chew. if you don't pick the biggest one,you won't get gum this time. You'll get another chance to get gumlater. Now, before you pick, ; put them iike this. (E bent longerorange stick so that a straight line drawn between the end pointswould be about 3-3/4-inches long; end alignment was maintained.)Now, look at them. If you can show me the biggest one with more gumto chew, you may have it..
Which was bigger before I bent it? What happened?
Nonconservers were further investigated in the following manner.
(E straightened the longer orange stick and bent the shorter pinkone.) Now show me the big one. Does it (reali,;, change when I
bend it? Why (not)?
Item 6 was intended to elicit measuring behavior a.: well as _provide
a useful response latency measurement. Two gum sticks (4-inches and 414-
inches, of the same color) were presented in a random, non-parallel
arrangement. E said, "Show me the bigger one." If S did not measure,
E said, "Show me how you can tell which is bigger. How can you make
sure?" If S still did not measure, E said, "IfI thought this (child's
non-choice) is the bigger one, how could you show me it's not?" If S
still did not measure, E said, "Can you measure?" For Ss still not
measuring, E said, "Put them together so you can really be sure." Measuring
behavior was carefully noted.
Scoring
Ss were scored as passing (+) or failing (-) each of the following
items:
1. Discriminates greater length when two sticks are aligned
+: a. Points to longer sticks when aligned on Prediction Questions
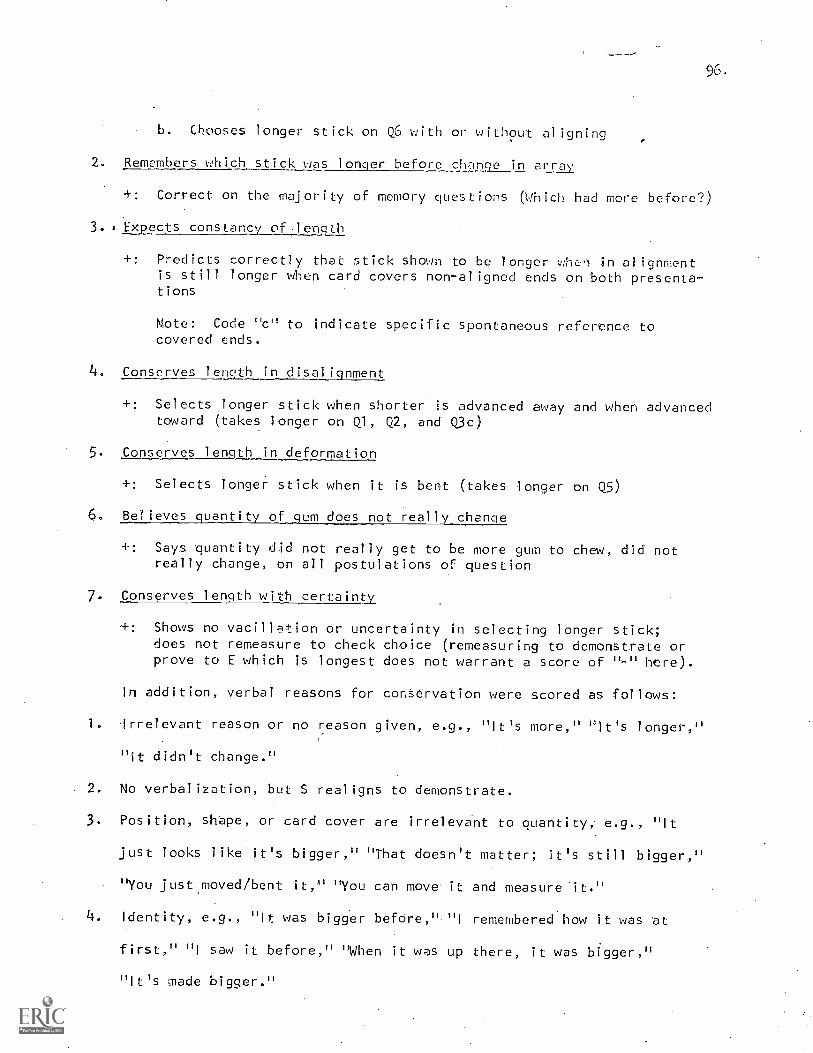
96.
b. Chooses longer stick on Q6 with or without aligning
2. Remembers which stick was longer before ch7Inge in array
+: Correct on the majority of memory questions Which had more before?)
3.. Expects constancy of length
+: Predicts correctly that stick shown to be longer whoa in alignmentis still longer when card covers non-aligned ends on both presenta-tions
Note: Code "c" to indicate specific spontaneous reference tocovered ends.
4. Conserves length in disalignment
+: Selects longer stick when shorter is advanced away and when advancedtoward (takes longer on Ql, Q2, and Q3c)
5. Conserves length in deformation
+: Selects longer stick when it is bent (takes longer on Q5)
6. Believes quantity of gum does not really change
+: Says quantity did not really get to be more gum to chew, did notreally change, on all postulations of question
7. Conserves length with certainty
+: Shows no vacillation or uncertainty in selecting longer stick;does not remeasure to check choice (rerneasuring to demonstrate orprove to E which is longest does not warrant a score of here).
In addition, verbal reasons for conservation were scored as follows:
1. Irrelevant reason or no reason given, e.g., "It's more," "It's longer,"
"it didn't change."
2. No verbalization, but S realigns to demonstrate.
3. Position, shape, or card cover are irrelevant to quantity, e.g., "It
just looks like it's bigger," "That doesn't matter; it's still bigger,"
"You just moved /bent it," "You can move it and measure it."
4. Identity, e.g., "It was bigger before "11 remembered how it was at
first," "I saw it before," "When it was up there, it was bigger,"
"It's made bigger."
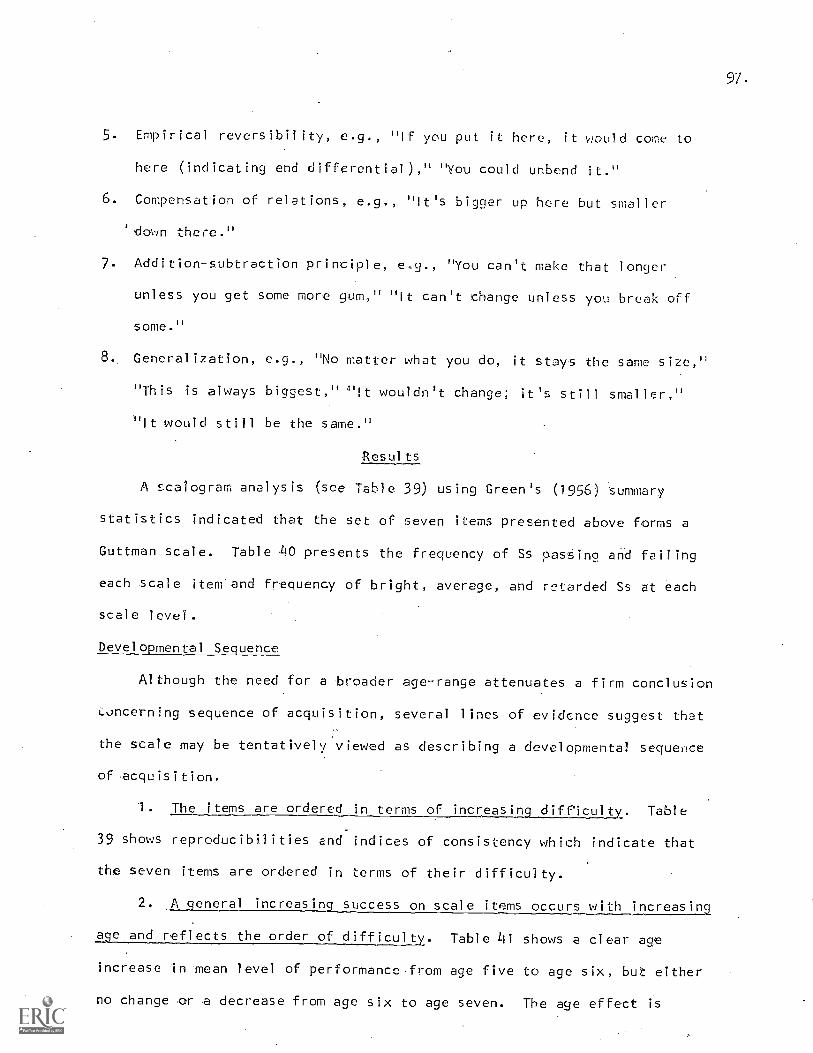
97.
5. Empirical reversibility, e.g., "If you put it here, it would come to
here (indicating end differential)," "You could unbend it."
6. Compensation of relations, e.g., "It's bigger up -here but smaller
down there."
7. Addition- subtraction principle, e.g., "You can't make that longer
unless you get some more gum," "It can't change unless you break off
some."
8., Generalization, e.g., "No matter what you do, it stays the same size,"
"This is always biggest," 'It wouldn't change; it's still smaller,"
"It would still be the same."
Results
A scalogram analysis (see Table 39) using Green's (1956) 'summary
statistics indicated that the set of seven items presented above forms a
Guttman scale. Table 40 presents the frequency of Ss pasSing and failing
each scale item-and frequency of bright, average, and retarded Ss at each
scale level.
Developmental Sequence
Although the need for a -broader age-range attenuates a firm conclusion
Concerning sequence of acquisition, several lines of evidence suggest that
the scale may be tentatively viewed as describing a developmental sequence
of -acquisition.
I. The items are ordered in terms of increasing difficulty. Table
39 shows reproducibilities and indices of consistency which indicate that
the seven items are ordered in terms of their difficulty.
2. A general increasing success on scale items occurs with increasing
age and reflects the order, of difficulty. Table 41 shows a clear age
increase in mean level of performance from age five to age six, but either
no change or a decrease from age six to age seven. The age effect is
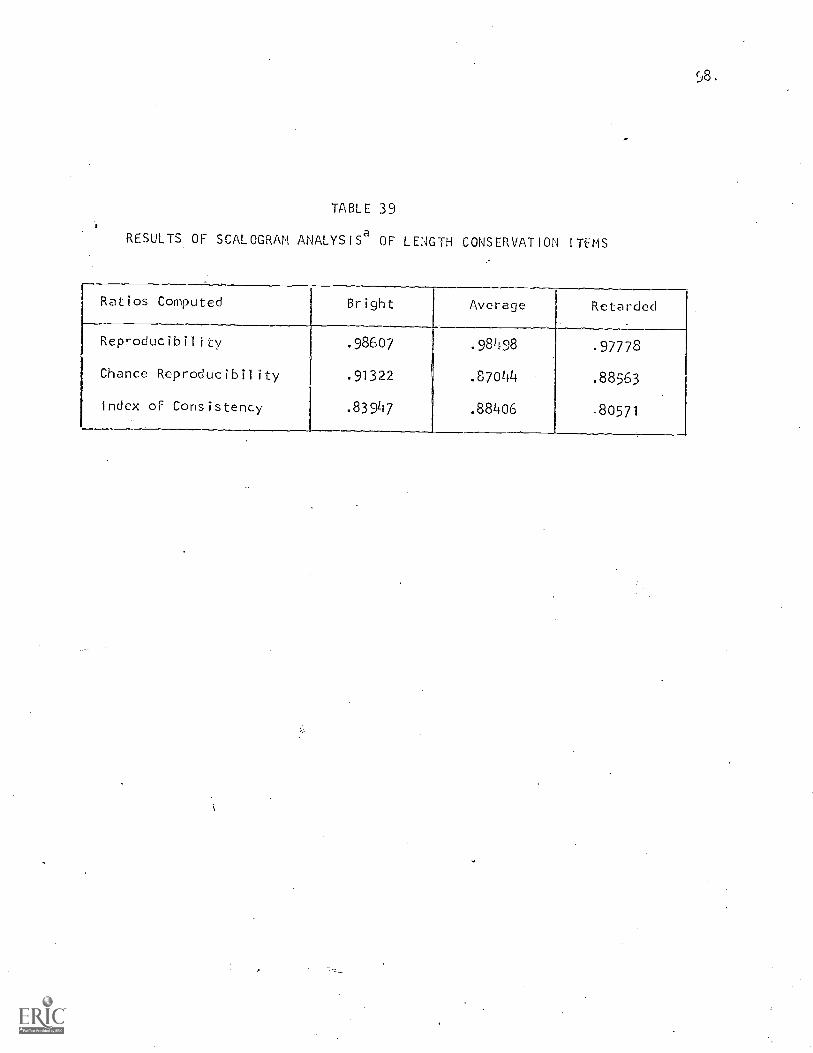
58.
TABLE :39
RESULTS OF SCALOGRAM ANALYSISa
OF LENGTH CONSERVATION ITEMS
Ratios Computed Bright Average Retarded
Reproducibility .98607 .98498 .97778
Chance Reproducibility .91322 .87044 .88563
Index of Consistency .839L7 .88406 ,80571
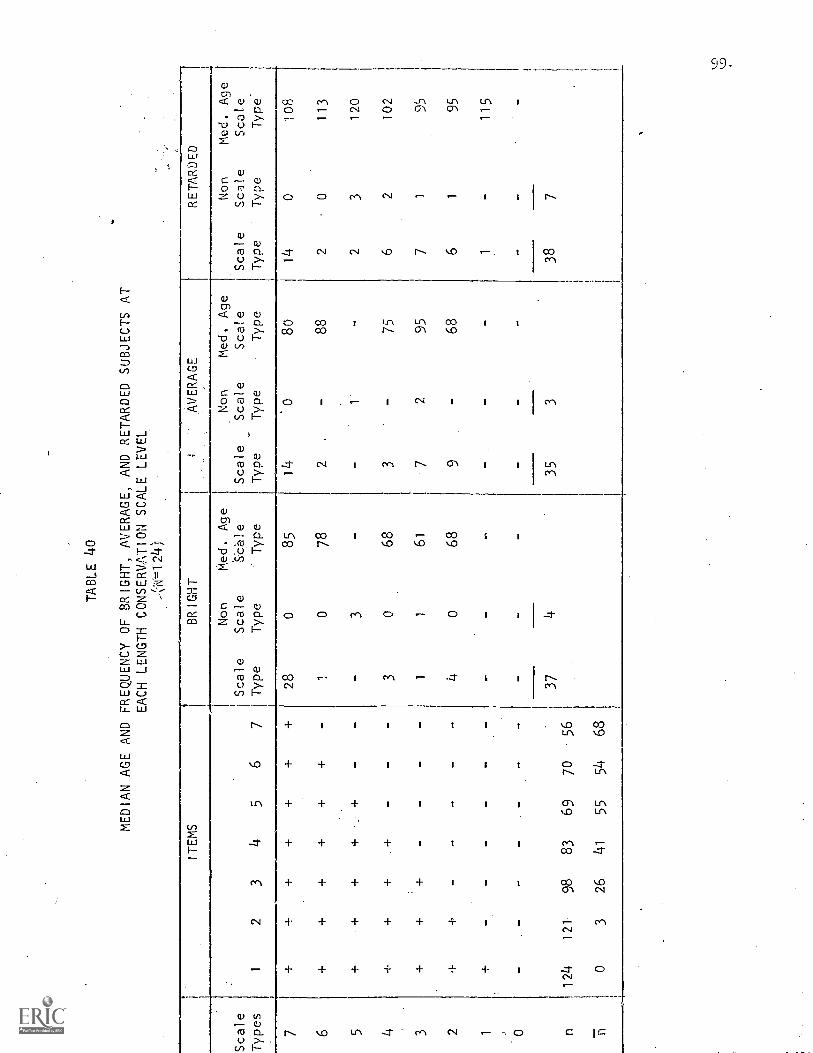
TABLE 40
MEDIAN AGE AND FREQUENCY OF BRIGHT, AVERAGE, AND RETARDED SUBJECTS AT
EACH LENGTH CONSERVATION SCALE LEVEL
-10=124)
ITEMS
BRIGHT
AVERAGE-
RETARDED
Non
Med. Age
: Non
Med. Age
Non
Med. Age
Scale
Scale
Scale
:Scale
Scale
Scale
Scale
Scale
Scale
Scale
Types
12
34
56
7Type
Type
: Type
Type
Type
Type
Type
Type
Type
7+
++
++
+28
085
14'0
80
14
0108
6+
++
++
+-
10
78
2.
88
20
113
5+
++
+-
--
3-
-1
-2
3120
4+
++
--
-3
068
375
62
102
3+
+-
--
-1
161
-7
295
71
95
2+
40
68
9-
68
61
95
1+
--
--
--
--
--
--
1-
115
o-
--
--
--
--
--
--
--
-
37
435
338
7
n124
121
98
83
69
70
56
03
26
41
55
54
68
LC
1
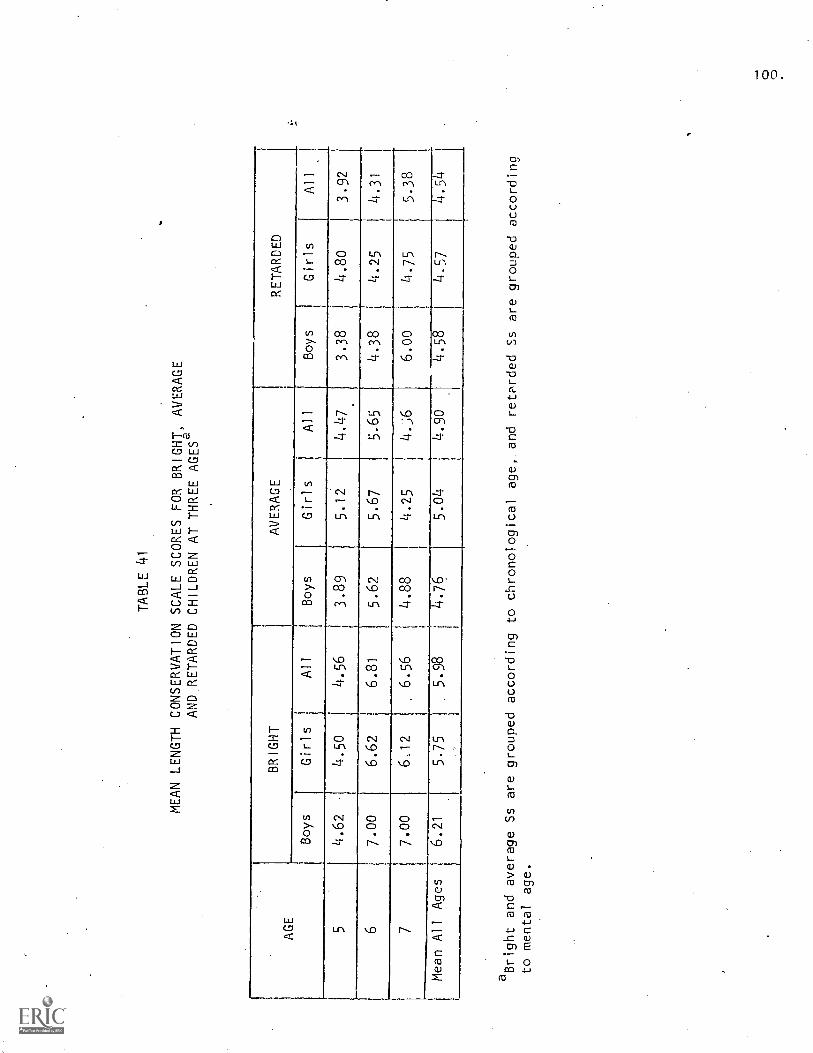
TABLE 41
MEAN LENGTH CONSERVATION SCALE SCORES FOR
BRIGHT, AVERAGE
AND. RETARDED CHILDREN AT THREE AGESa
AGE
BRIGHT
AVERAGE
RETARDED
Boys
Girls
All
Boys
Girls
All
Boys
1Girls
All
54.62
4.50
1-.56
3.89
5.12
4.47.
3.38
4.80
3.92
67.00
6.62
6.81
5.62
5.67
5.65
4.38
4.25
4.31
77.00
6,12
6.56
4.88
4.25
4.;6
6.00
4.75
5.38
Mean All Ages
6.21
5.75
5.98
i4.76
5.04
4.90
4.58
4.57
4.54
aBright and average Ss are grouped according to chronological
age, and retprded Ss are grouped according
to mental age.
101.
significant for bright and average groups (F=8.12, df-'2, 86, P<.000). These
age trends are also reflected in Table 42 which shows percentage of scale
scores at each age level and in Table 43 which shows the percen,3ge of Ss
succeeding on each scale item. The need for a sample of younger Ss in
order to assess the scale's age relatedness results from the fact that no
S fails the easiest scale item, and only three Ss fail the second scale
item. Broadening the sample to older Ss than those studied here (especially
with regard to average Ss) would clarify whether the scale is not age-
related in terms of progression or whether progress occurs so slowly and
with such oscillation during the years six and seven that these years
should be viewed as unitary. It may be that the regularity in age change
is visible when broader age-ranges are grouped.
3. Retesting of a small number of Ss after one year shows a general
progression along the scale. Table 44 presents the Frequency distribution
of scale scores at first testing and again one year later. Eight o the
nineteen Ss remained at the same level the second year as the first year.
Eight Ss performed at a higher level the second year, and three Ss appear
to have regressed. While more longitudinal data is needed to ascertain
whether the sequence described by the scale can be viewed as one which
individuals must pass through in an invariant fashion, it seems a promising
direction of further inquiry inasmuch as it accounts for performance
hang.e for most Ss.
Effect of IQ on Performance
IQ is not as potent a factor as mental age with regard to level of
performance on this length conservation task. Bright children perform at
significantly higher levels than average children (F=9.75, df=1, 86, p<
.0025), especially at ages six and seven. However, the difference between
average and retarded Ss of the same mental age is not significant.
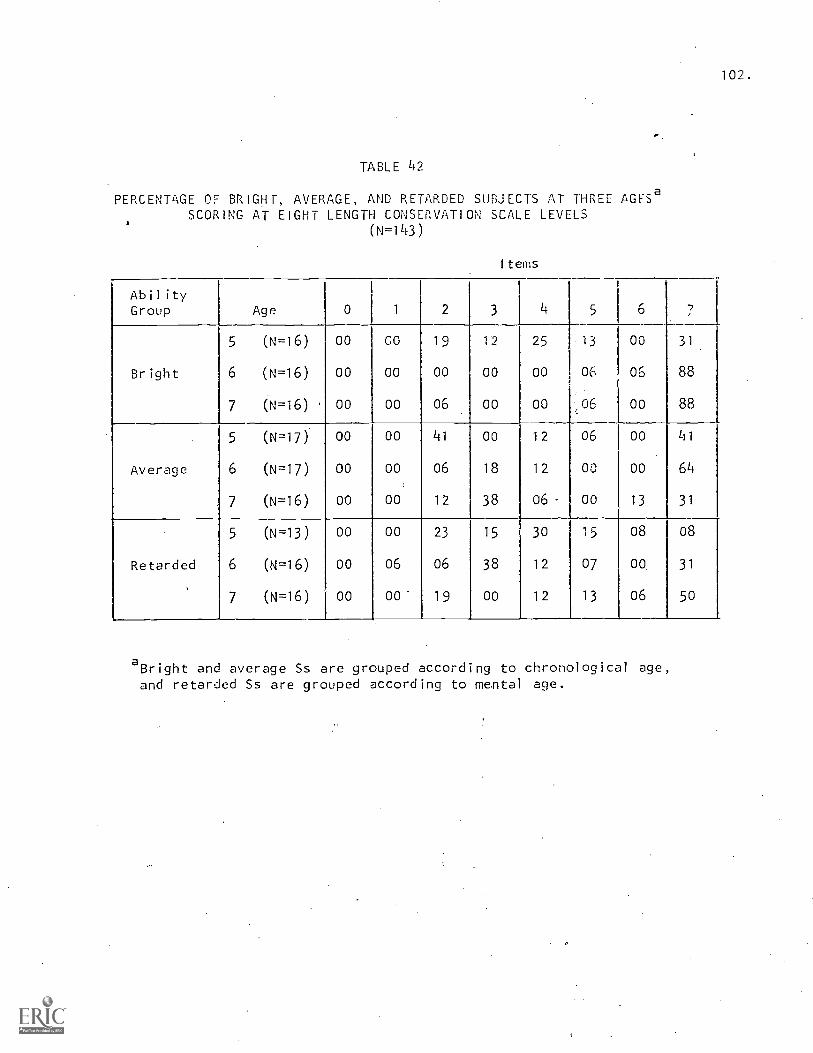
102.
TABLE 42
PERCENTAGE OF BRIGHT, AVERAGE, AND RETARDED SUBJECTS AT THREE AGESeSCORING AT EIGHT LENGTH CONSERVATION SCALE LEVELS
(N=143)
Items
AbilityGroup Age 0 1 2 3 4 5 6
5 (N=16) 00 co 19 12 25 13 00 31
Bright 6 (N=16) 00 00 00 00 00 o6 06 88
7 (N-16) . 00 00 06 00 00 -06 00 88
5 (N=17) 00 00 41 00 12 06 00 41
Average 6 (N=17) 00 00 06 18 12 00 00 64
7 (N-16) 00 00 12 38 06- 00 13 31
5 (N-13) 00 00 23 15 3o 15 08 08
Retarded 6 (N-16) 00 06 06 38 12 07 00 31
7 (N=16) 00 00' 19 00 12 13 06 50
aBright and average Ss are grouped according to chronological age,and retarded Ss are grouped according to mental age.
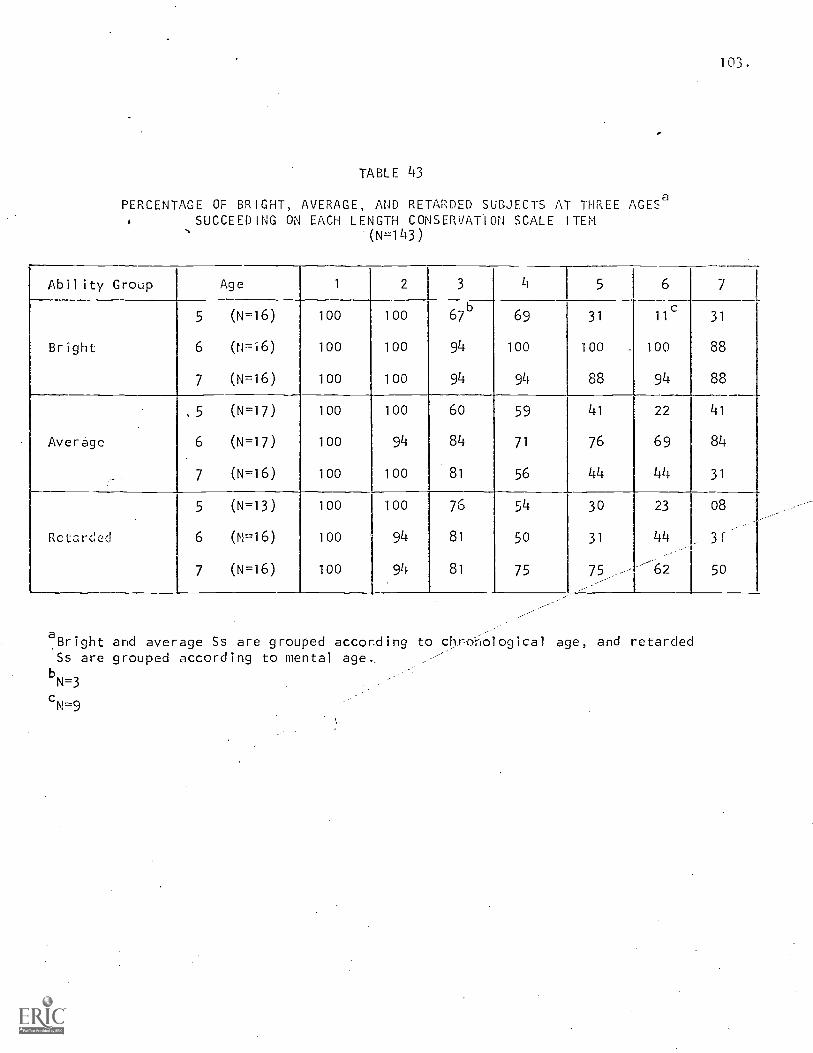
103.
TABLE 43
PERCENTAGE OF BRIGHT, AVERAGE, AND RETARDED SUBJECTS AT THREE AGES"'SUCCEEDING ON EACH LENGTH CONSERVATION SCALE ITEM
'(N=143)
Ability Group Age 1 2 3 4 5 6 7
5 (N=16) 100 100 67b
69 31 11 31
Bright 6 (N=i6) 100 100 94 100 100 100 88
7 (N=16) 100 100 94 94 88 94 88
,5 (N=17) 100 100 60 59 41 22 41
Average 6 (N=17) 100 94 84 71 76 69 84
7 (N=16) 100 100 81 56 44 44 31
5 (N=13) 100 100 76 54 30 23 08
Retarded 6 (N=16) 100 94 81 50 31 44
7 (N=16) 100 94 81 75 75 62 50
aBright and average Ss are grouped according to chronologicalSs are grouped according to mental age,
bN=3
cN=9
age, and retarded
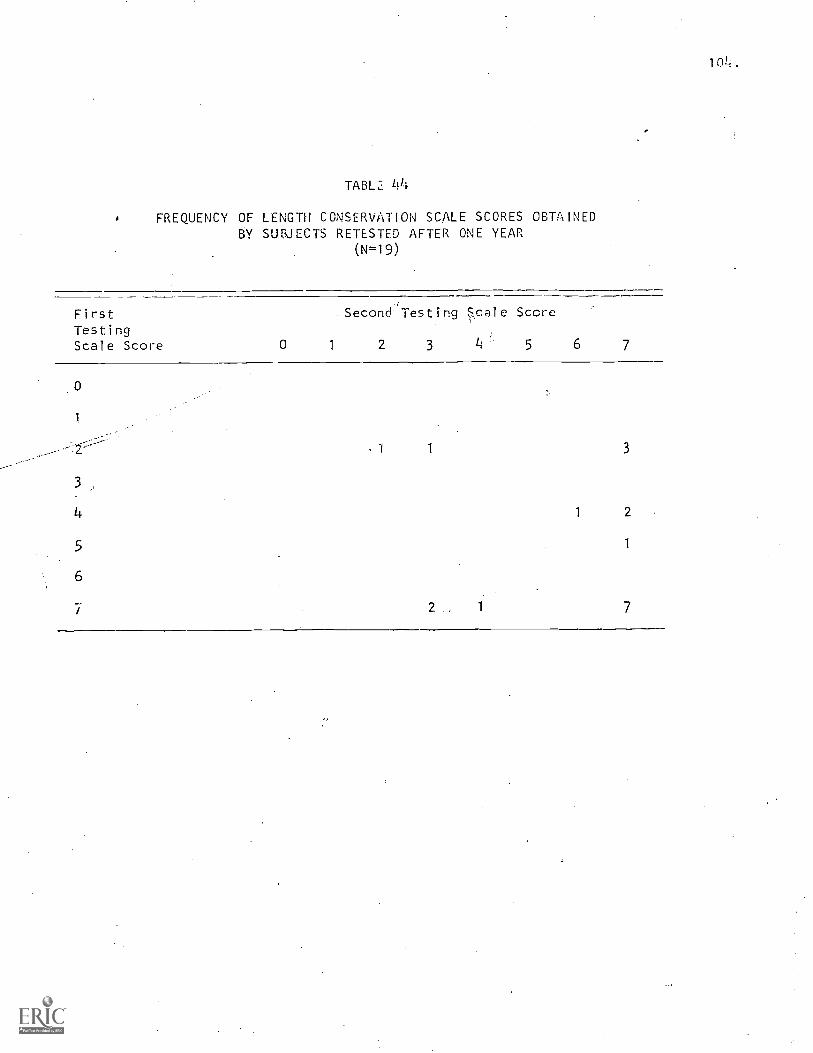
104.
TABLa 44
FREQUENCY OF LENGTH CONSERVATION SCALE SCORES OBTAINEDBY SUBJECTS RETESTED AFTER ONE YEAR
(N=19)
First . Second' Testing Scale Score
TestingScale Score 0 1 2 3 4 5 6 7
0
1
5
6
1 3
1 2
1
2 1 7
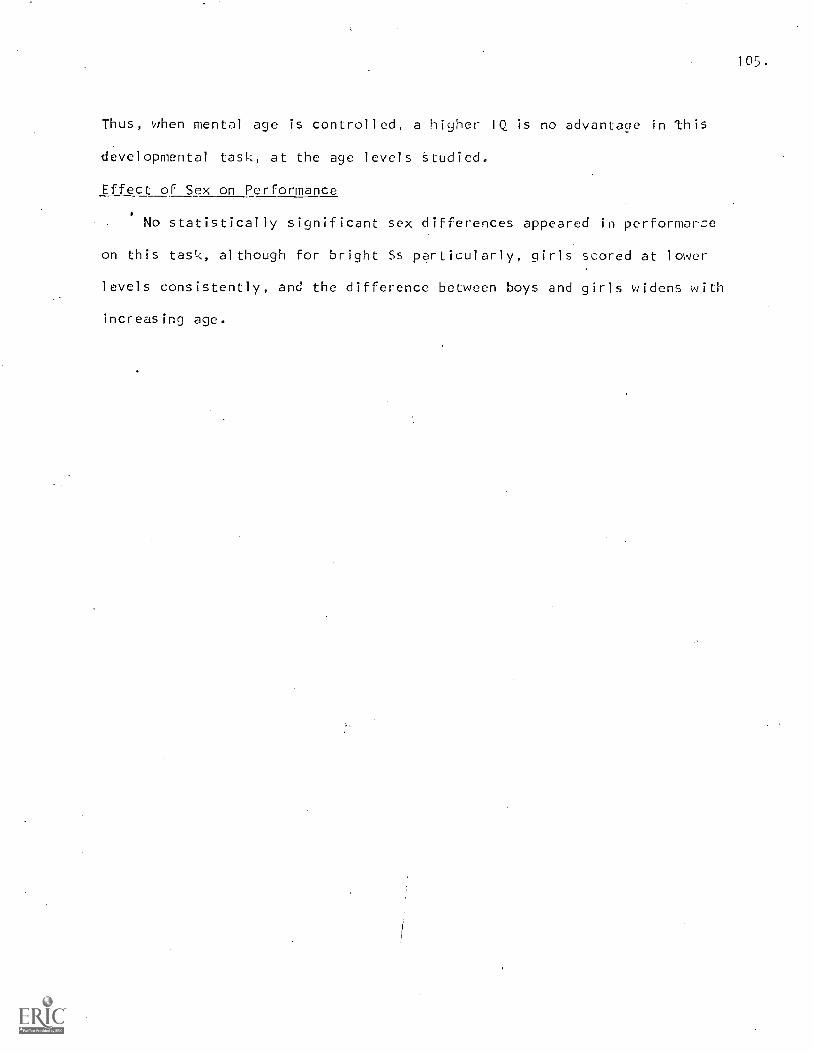
105.
Thus, when mental age is controlled, a higher IQ is no advantage in this
developmental task, at the age levels Studied.
Effect of Sex on Performance
No statistically significant sex differences appeared in performarce
on this task, although for bright Ss particularly, girls scored at lower
levels consistently, and the difference between boys and girls widens with
increasing age.
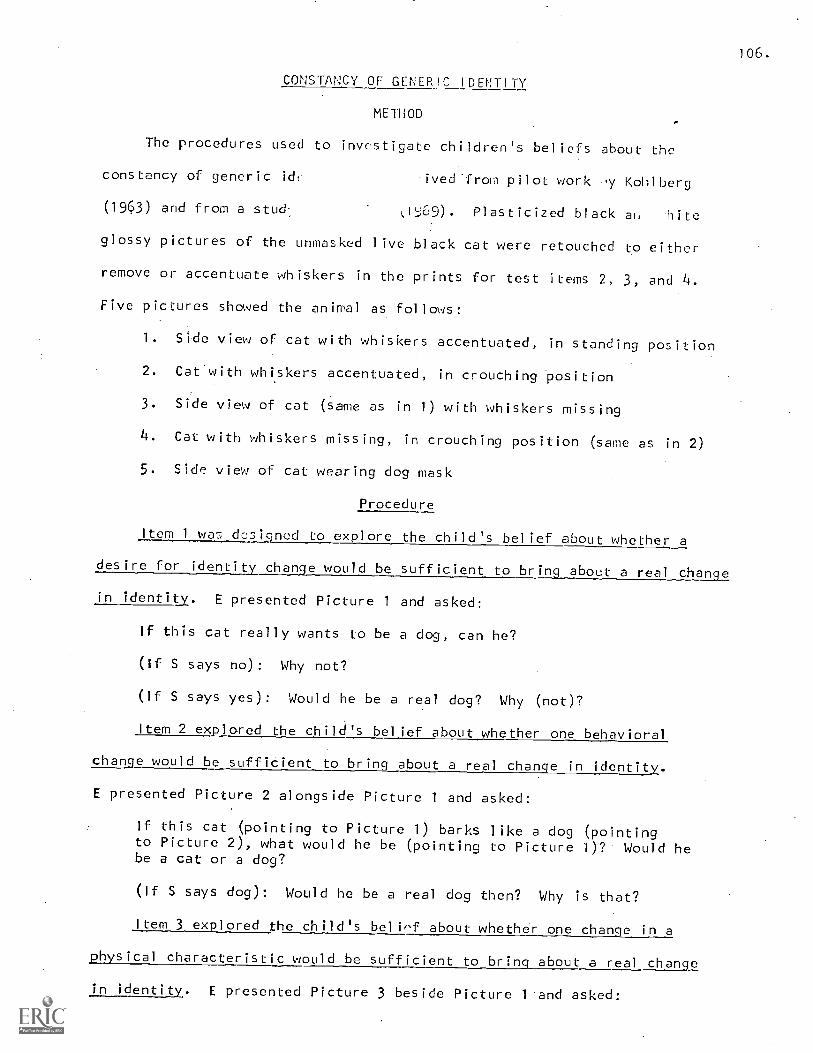
106.
CONSTANCY OF GENERIC IDENTITY
METHOD
The procedures used to investigate children's beliefs about the
constancy of generic idc -ived-from pilot work -y Kohlberg
(1963) and from a stud 0,-)69). Plasticized black al, hite
glossy pictures of the unmasked live black cat were retouched to either
remove or accentuate whiskers in the prints for test items 2, 3, and 4.
Five pictures showed the animal as follows:
1. Side view of cat with whiskers accentuated, in standing position
2. Cat'with whiskers accentuated, in crouching position
3. Side view of cat (same as in 1) with whiskers missing
4. Cat with whiskers missing, in crouching position (same as in 2)
5. Side view of cat wearing dog mask
Procedure
Item 1 was designed to explore the child's belief about whether a
desire for identity change would be sufficient to bring about a real change
in identity. E presented Picture 1 and asked:
If this cat really wants to be a dog, can he?
(If S says no): Why not?
(If S says yes): Would he be a real dog? Why (not)?
Item 2 explored the child's belief about whether one behavioral
change would be sufficient to bring about a real change in identity.
E presented Picture 2 alongside Picture 1 and asked:
If this cat (pointing to Picture 1) barks like a dog (pointingto Picture 2), what would he be (pointing to Picture 1)? Would hebe a cat or a dog?
(If S says dog): Would he be a real dog then? Why is that?
Item 3 explored the child's bel irsf about whether one change in a
physical characteristic would be sufficient to bring about a real change
in identity. E presented Picture 3 beside Picture 1 and asked:
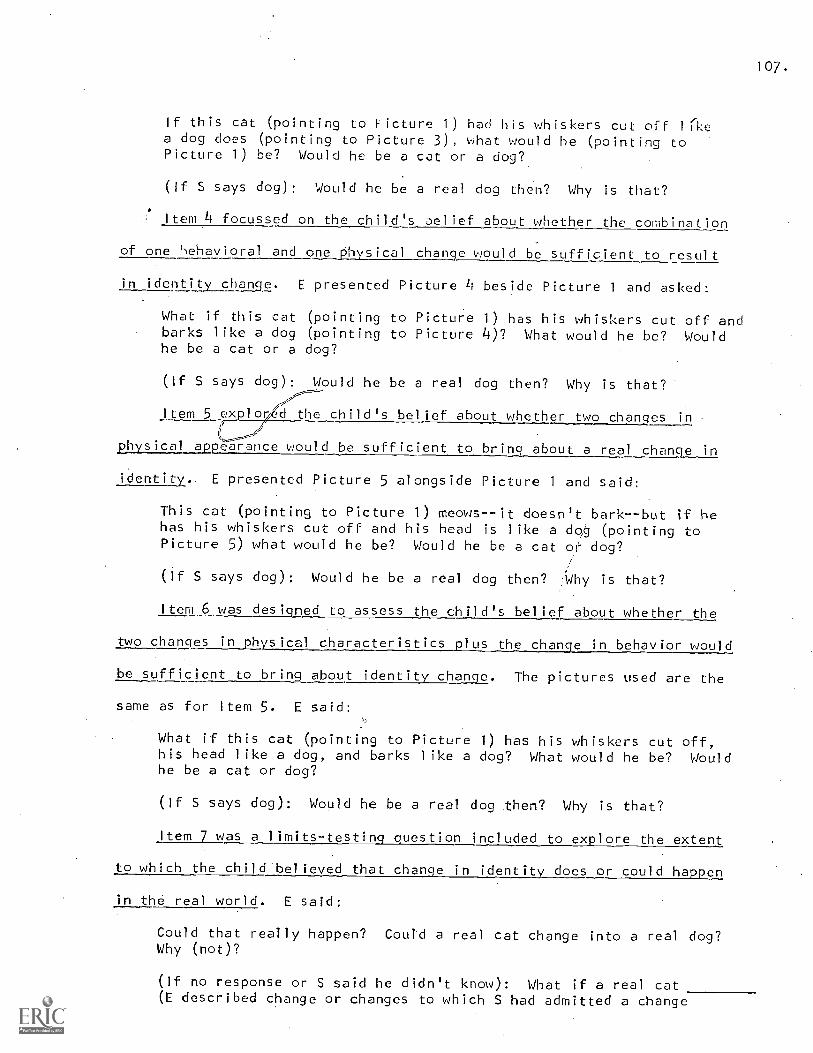
107.
If this cat (pointing to i'icture 1) had his whiskers cut off likea dog does (pointing to Picture 3), what would he (pointing toPicture 1) be? Would he be a cat or a dog?
(If S says dog): Would he be a real dog then? Why is that?
Item 4 focussed on the child's aelief about whether the combination
of one '-)ehavioral and one physical change would be sufficient to result
in identity clean e. E presented Picture /4 beside Picture 1 and asked:
What if this cat (pointing to Picture 1) has his whiskers cut off andbarks like a dog (pointing to Picture 4)? What would he be? Wouldhe be a cat or a dog?
(If S says dog): Would he be a real dog then? Why is that?
'7Item 5 ex lor* the child's belief about whether two changes in
2hysicpl apaparance would be sufficient to bring about a real change in
identity.. E presented Picture 5 alongside Picture 1 and said:
This cat (pointing to Picture 1) meows- -it doesn't bark--but if hehas his whiskers cut off and his head is like a dog (pointing toPicture 5) what would he be? Would he be a cat or dog?
(If S says dog): Would he be a real dog then? 'Why is that?
Item 6 was designed to assess the child's belief about whether the
two changes in physical characteristics plus the change in behavior would
be sufficient to bring about identity change. The pictures used are the
same as for Item 5. E said:
What if this cat (pointing to Picture 1) has his whiskers cut off,his head like a dog, and barks like a dog? What would he be? Wouldhe be a cat or dog?
(If S says dog): Would he be a real dog then? Why is that?
Item 7 was a limits-testing question included to explore the extent
to which the child believed that change in identity does or could happen
in the real world. E said:
Could that really happen? Could a real cat change into a real dog?Why (not)?
(If no response or S said he didn't know): What if a real cat(E described change or changes to which S had admitted a change
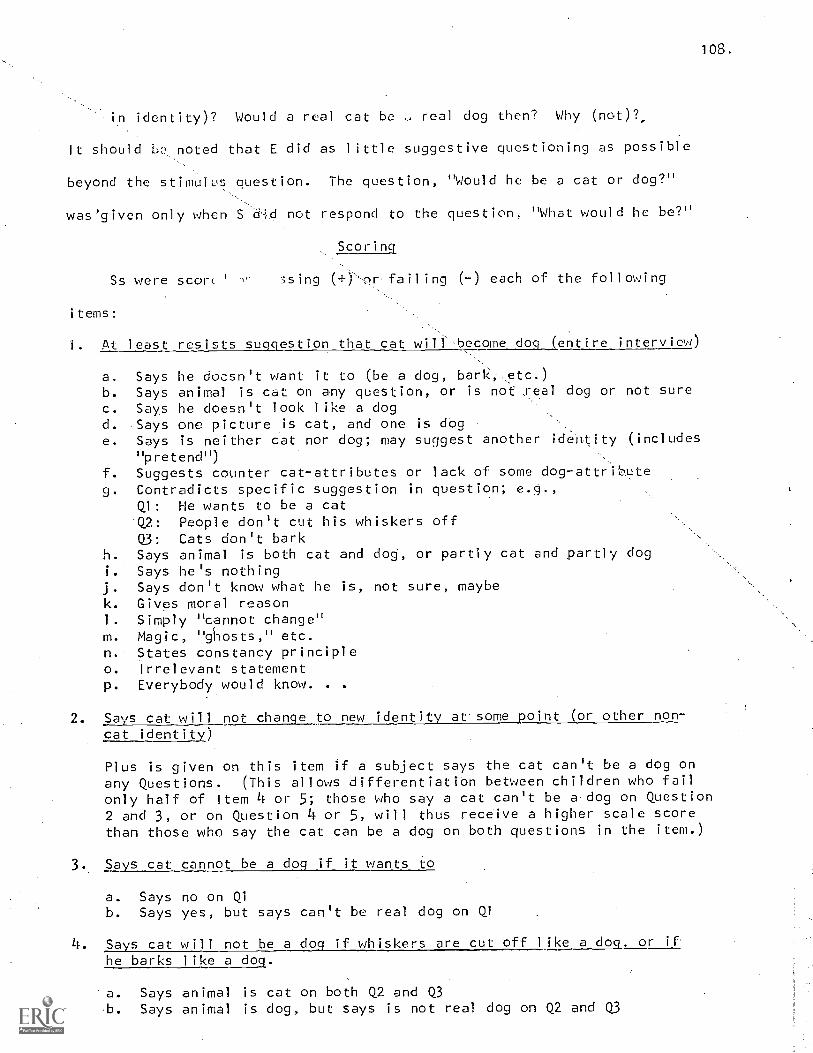
108.
in identity)? Would a real cat be real dog then? Why (not)?,
It should L? noted that E did as little suggestive questioning as possible
beyond the stimulus question. The question, "Would he be a cat or dog?"
was'given only when S not respond to the question, "What would he be?"
Scoring.
Ss were scan. ' 3sing (+) nr failing (-) each of the following
items:
1. At least resists suggestion that cat will become dog (entire interview)
a. Says he doesn't want it to (be a dog, bark;...e.tc.)b. Says animal is cat on any question, or is not feal dog or not surec. Says he doesn't look like a dogd. Says one picture is cat, and one is doge. Says is neither cat nor dog; may suggest another identity (includes
"pretend")f. Suggests counter cat-attributes or lack of some dog - attribute
g. Contradicts specific suggestion in question; e.g.,Ql : He wants to be a catQ2: People don't cut his whiskers off
Q3: Cats don't barkh. Says animal is both cat and dog, or partly cat and partly dogi. Says he's nothingj. Says don't know what he is, not sure, maybek. Gives moral reason1. Simply "cannot change"m. Magic, "ghosts," etc.n. States constancy principleo. Irrelevant statementp. Everybody would know. .
2. Says cat will not change to new identity at some point (pr other non-cat identity)
Plus is given on this item if a subject says the cat can't be a dog onany Questions. (This allows differentiation between children who failonly half of Item 4 or 5; those who say a cat can't be a dog on Question2 and 3, or on Question 4 or 5, will thus receive a higher scale scorethan those who say the cat can be a dog on both questions in the item.)
3. Says cat cannot be a dog if it wants to
a. Says no on Qib. Says yes, but says can't be real dog on Qi
4. Says cat will not be a dog if whiskers are cut off like a dog, or ifhe barks like a dog.
a. Says animal is cat on both Q2 and Q3.b. Says animal is dog, but says is not real dog on Q2 and Q3
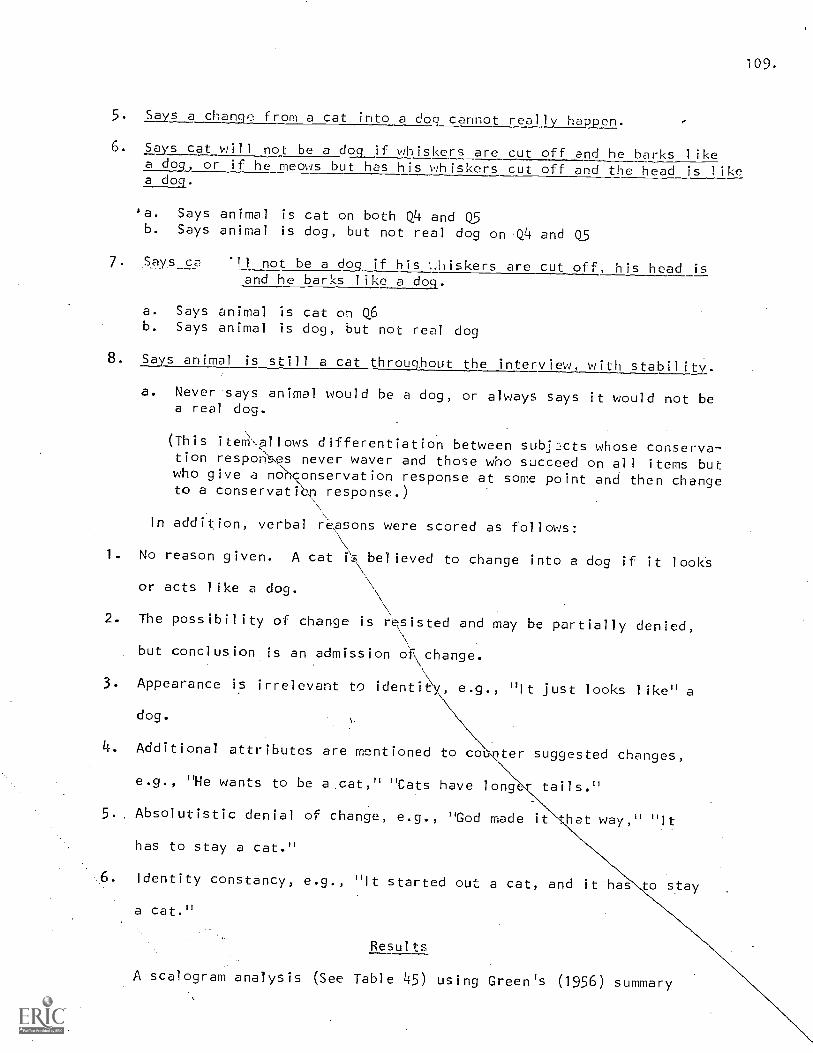
109.
5. Sys a change from a cat into a dog cannot really happen.
6. Says cat will not be a dog if whiskers are cut off and he barks likea dog, or if he meows but has his whiskers cut off and the head is likea dog.
'a. Says animal is cat on both Q4 and Q5b. Says animal is dog, but not real dog on .Q4 and Q5
Says c 'H not be a dog if his Iliskers are cut off, his head isand he barks like a dog.
a. Says animal is cat on Q6b. Says animal is dog, but not real dog
8. Says animal is still a cat throughout the interview, with stabiliy..
a. Never says animal would be a dog, or always says it would not bea real dog.
(This iteM\allows differentiation between sub3L:cts whose conserva-tion responses never waver and those who succeed on all items butwho give a nonconservation response at some point and then changeto a conservatt p response.)
In addition, verbal reasons were scored as follows:
1. No reason given. A cat is,believed to change into a dog if it looks
or acts like a dog.
2. The possibility of change is resisted and may be partially denied,
but conclusion is an admission of\change.
3. Appearance is irrelevant to identity, e.g., "It just looks like" a
dog.
4. Additional attributes are mentioned to cou ter suggested changes,
e.g., "He wants to be a.cat," "Cats have long: tails."
5.. Absolutistic denial of change, e.g., "God made it hat way," "It
has to stay a cat."
6. Identity constancy, e.g., "It started out a cat, and it has to stay
a cat."
Results
A scalogram analysis (See Table 45) using Green's (1956) summary
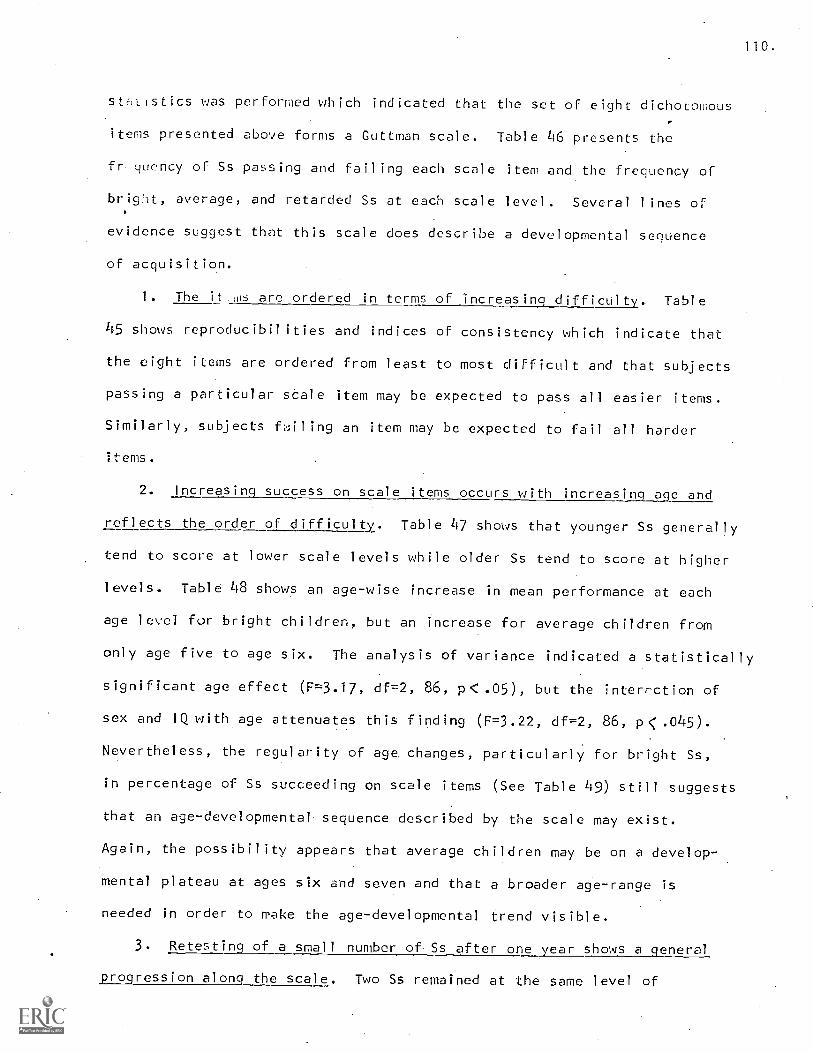
110.
stistics was performed which indicated that the set of eight dichotomous
items presented above forms a Guttman scale. Table 46 presents the
fr, quency of Ss passing and failing each scale item and the frequency of
bright, average, and retarded Ss at each scale level. Several lines of
evidence suggest that this scale does describe a developmental sequence
of acquisition.
1. The it His are ordered in terms of increasing difficulty. Table
45 showS reproducibilities and indices of consistency which indicate that
the eight items are ordered from least to most difficult and that subjects
passing a particular scale item may be expected to pass all easier items.
Similarly, subjects failing an item may be expected to fail all harder
items.
2. Increasing success on scale items occurs with increasirg age and
reflects the order of difficulty. Table 47 shows that younger Ss generally
tend to score at lower scale levels while older Ss tend to score at higher
levels. Table 48 shows an age-wise increase in mean performance at each
age level for bright children, but an increase for average children from
only age five to age six. The analysis of variance indicated a statistically
significant age effect (F=3.17, df=2, 86, pC.05), but the interrction of
sex and IQ with age attenuates this finding (F=3.22, df=2, 86, p < .045).
Nevertheless, the regularity of age changes, particularly for bright Ss,
in percentage of Ss succeeding on scale items (See Table 49) still suggests
that an age-developmental sequence described by the scale may exist.
Again, the possibility appears that average children may be on a develop-
mental plateau at ages six and seven and that a broader age-range is
needed in order to make the age-developmental trend visible.
3. Retesting of a small number of. Ss after one year shows a general
progression along the scale. Two Ss remained at the same level of
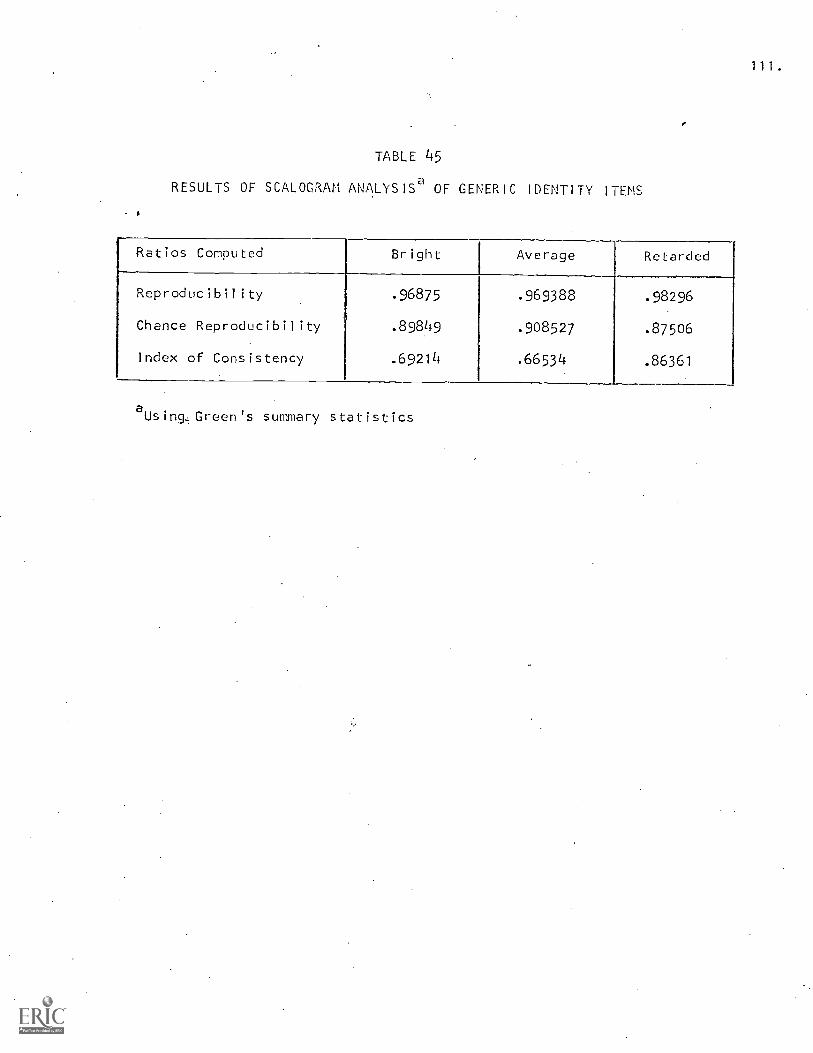
TABLE 45
RESULTS OF SCALOGRAM ANALYSISd OF GENERIC IDENTITY ITEMS
Ratios Computed Bright Average Retarded
Reproducibility .96875 .969388 .98296
Chance Reproducibility .89849 .908527 .87506
Index of Consistency .69214 .66534 .86361
aUsingGreen's summary statistics
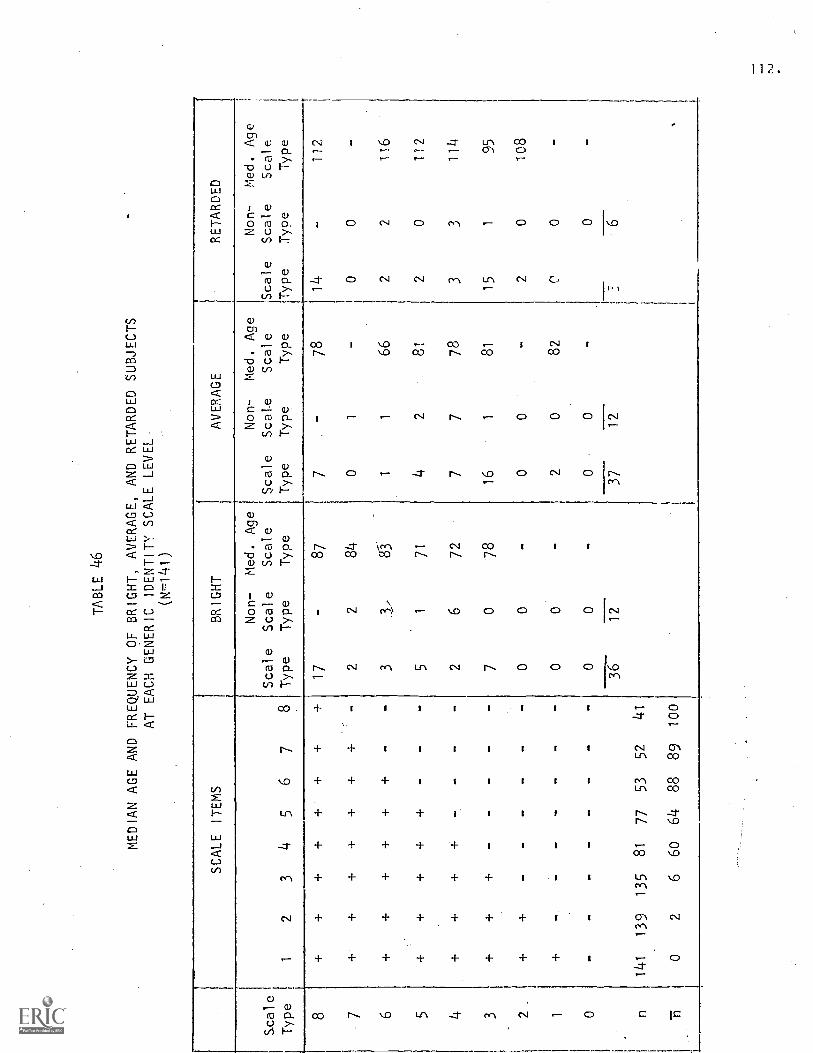
TABLE 46
MEDIAN AGE AND FREQUENCY OF BRIGHT, AVERAGE, AND RETARDED SUBJECTS
AT EACH GENERIC IDENTITY SCALE LEVEL.
(N=141)
SCALE
ITEMS
BRIGHT
AVERAGE
RETARDED
I
I
Scale
Type
12
34
56
78
Scale
Type
Non-
Scale
Type
Med. Age
Scale
Type
Scale
Type
Non-
Med. Age
Scale
Scale
Type
Type
Scale
Type
Non-
Med. Age
Scale
Scale
Type
Type
-
8+
++
++'
++
+17
-87
7-
78
14
112
7+
++
++
++
-2
284
01
-0
0-
6+
++
++
+-
-3
8-3-
11
66
22
116
5+
++
++
--
-5
171
42
81
20
1.12
14
++
+-
--
26
72
77
78
33
114
1
.,
I ,3
++
+-
--
--
70
78
16
181
15
195
2.
++
--
--
--
oo
-o
o-
20
108
1+
0-
20
82
C0
36
12
37
12
_ . .6
n141
139
135
81
77
53
52
41
02
660
64
88
89
100
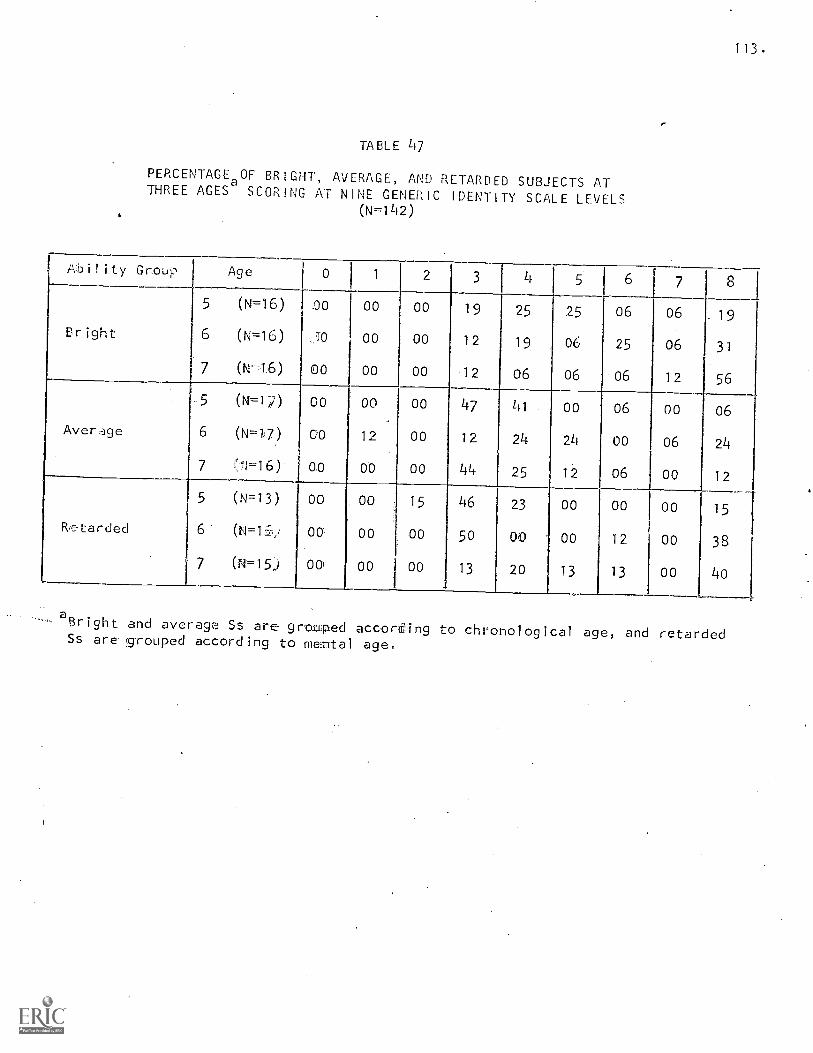
113.
TABLE 47
PERCENTAGEa OF BRIGHT, AVERAGE, AND RETARDED SUBJECTS AT
THREE AGES SCORING AT NINE GENERIC IDENTITY SCALE LEVELS(N=142)
Ability Group I Age 0 1 2 3 4 5 6 7 8 j
5 (N=16) oo 00 00 19 25 25 06 06 19
Bright 6 (N=16) .70 00 00 12 19 06 25 06 31
7 (N-I6) 00 00 00 -12 06 06 .06 12 56
5 (N-1W) 00 00 00 47 41 00 06 00 06
Average 6 (N=17) 00 12 00 12 24 24 00 06 24
7 r1-16y 00 00 00 44 25 12 06 00 12
5 (N=13) 00 00 15 46 23 00 00 00 15
R=etarded 6 (N=1-Lji 00 00 00 50 00 00 12 00 38
7 (W=15) OD 00 00 13 20 13 13 00 40
aBright. and average Ss are groilped according to chronological age, and retardedSs are grouped according to mental age.
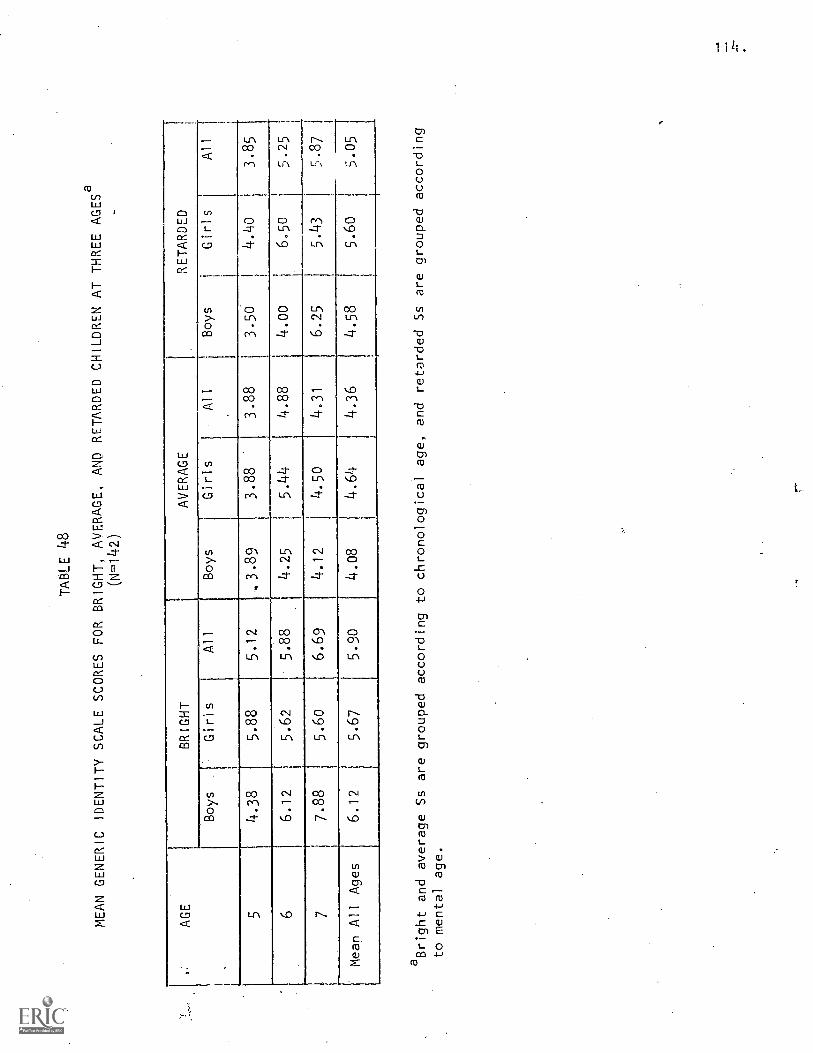
TABLE 48
MEAN GENERIC IDENTITY SCALE SCORES FOR BRIGHT, AVERAGE, AND RETARDED CHILDREN AT THREE
AGESa
(N=142)
AGE
BRIGHT
AVERAGE
RETARDED
Boys
Girls
All
Boys
Girls
All
Boys
Girls
All
54.38
5.88
5.12
,3.89
3.88
3.88
3.50
4.40
3.85
66.12
5.62
5.88
4.25
5.44
4.88
4.00
6.50
5.25
77.88
5.60
6.69
4.12
4.50
4.31
6.25
5.43
5.87
Mean All Ages
6.12
5.67
5.90
4.08
4.64
4.36
4.58
5.60
5.05
aBright and average Ss are grouped according to chronological age, and retarded Ss are grouped according
to mental age.
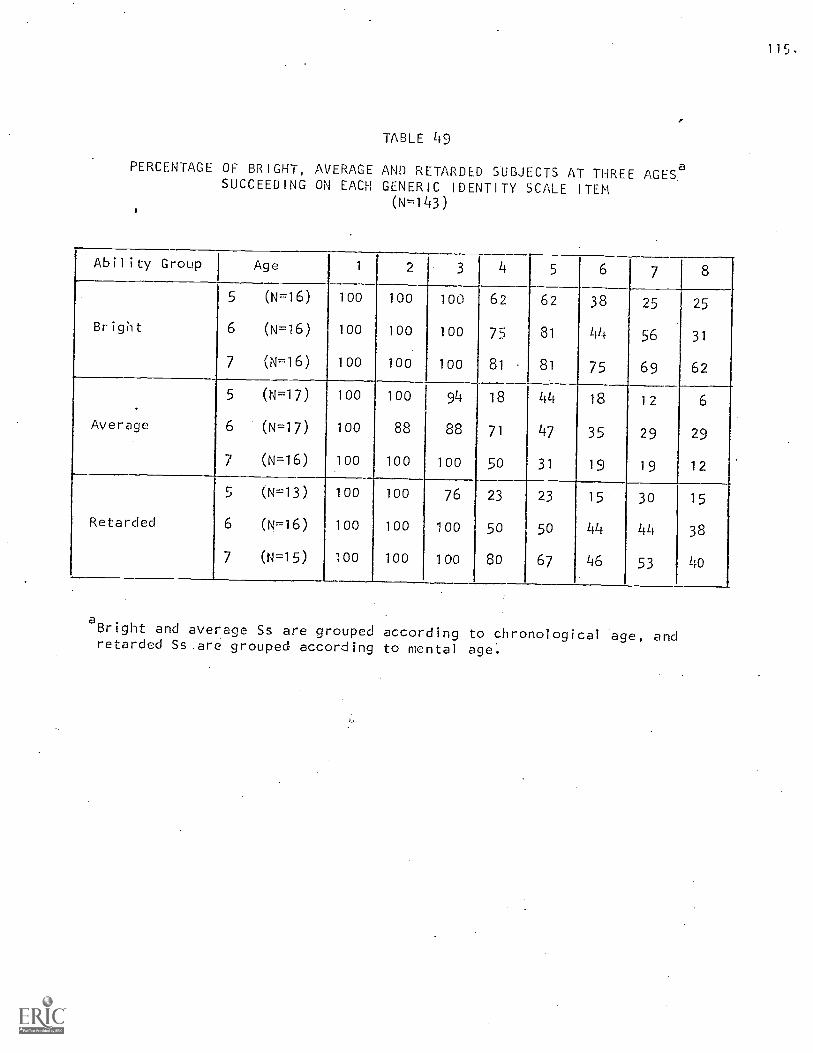
115.
TABLE 49
PERCENTAGE OF BRIGHT, AVERAGE AND RETARDED SUBJECTS AT THREE AGESaSUCCEEDING ON EACH GENERIC IDENTITY SCALE ITEM
(N=143)
Ability Group Age 1 2 3 4 5 6 7
Bright
5 (N=16)
6 (N=16)
7 (N=16)
100
100
100
100
100
100
100
100
100
62
73
81
62
81
81
38
44
75
25
56
69
25
31
62
5 (N=17) 100 100 94 18 44 18 12 6
Average 6 (N=17) 100 88 88 71 47 35 29 29
7 (N=16) 100 100 100 50 31 19 19 12
(N=13) 100 100 76 23 23 15 30 15
Retarded 6 (N=16) 100 100 100 50 50 44 44 38
7 (N=15) 100 100 100 80 67 46 53 40
aBright and average Ss are grouped according to chronological age, andretarded Ss.are grouped according to mental age.
116.
performance, 11 progressed, and 6 appear to have regressed, ti,: ever, 3
of the Ss appearing to have regressed moved from a non-scaft, 'Type 4 to
'a Scale Type 3, so these Ss probably should not he viewed as really
regressing. The scale accounts for change in performance of most of the
retested Ss.
Effect of 10 on Performance
Bright Ss perform at significantly, higher levels than average children
of the same chronological age (F=18.77, df=1, 86, p< .0001), even when the
sex -- age -IQ interaction effect is removed. The higher level of performance
of retarded Ss in comparison to average Ss of the same mental age approaches
significance (F=2.78, df=1, 82, p<.099). This suggests that not only is
higher IQ no advantage in the development of generic identity, but older
chronological age is a facilitating factor in this development.
Effect of Sex on Performance
No significant sex differences in performance appeared, but the sex
effect approached significance for average and retarded Ss (F=3.43,
df=1. 82, p <.068), and the interaction of age with sex approached signif-
icance (F=2.39, df=2, 82, p <.098). There is a general tendency for girls
to perform better than boys at younger ages here, but less well than boys
at age seven (mental age seven in the case of the retardates). For bright
and average Ss, the sex-age-IQ interaction (F=2.88, df=2, 86, p<.06)
approaches significance, but this is due to the tendency of sex to interact
with the primary effect of age which remains a significant factor in
performance even after removing all interaction and other main effects
(F=3.13, df=2, 86, p < .05).
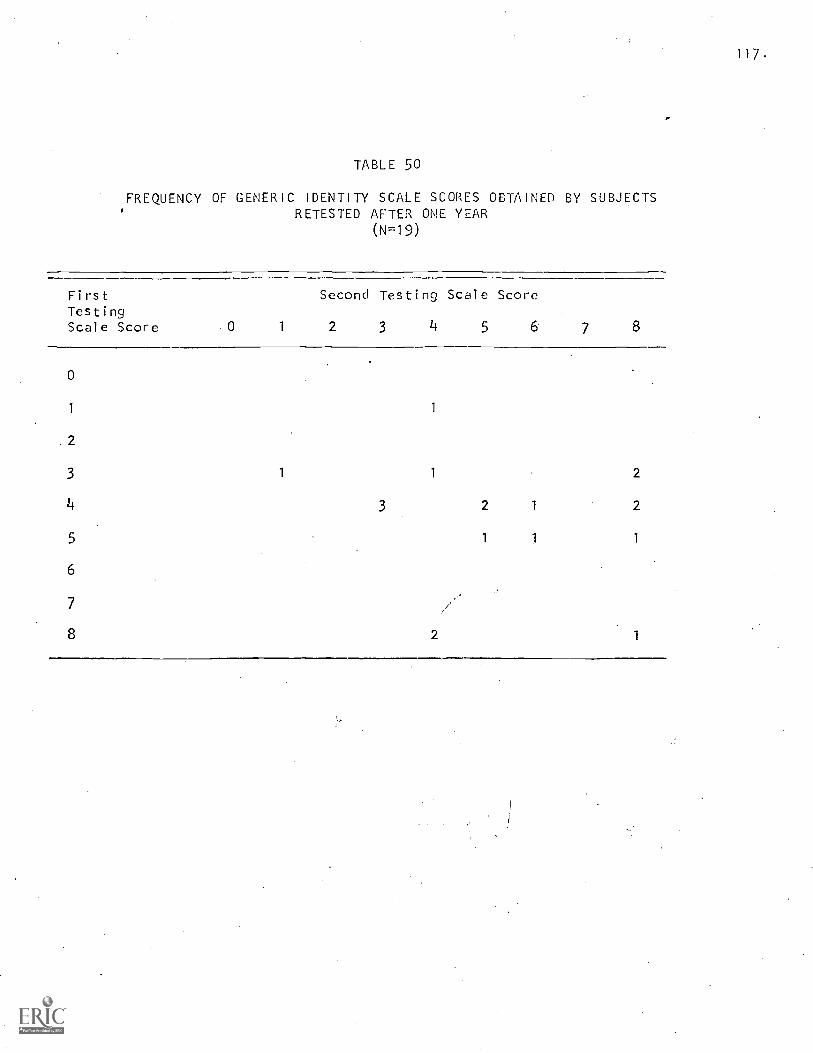
117.
TABLE 50
FREQUENCY OF GENERIC IDENTITY SCALE SCORES OBTAINED BY SUBJECTSRETESTED AFTER ONE YEAR
(N=19)
FirstTestingScale Score 0
Second
1 2
Testing
3 4
Scale Score
5 6 7 8
0
1 1
2
3 1 1 2
4 3 2 1 2
5 1 1 1
6
7
8 2
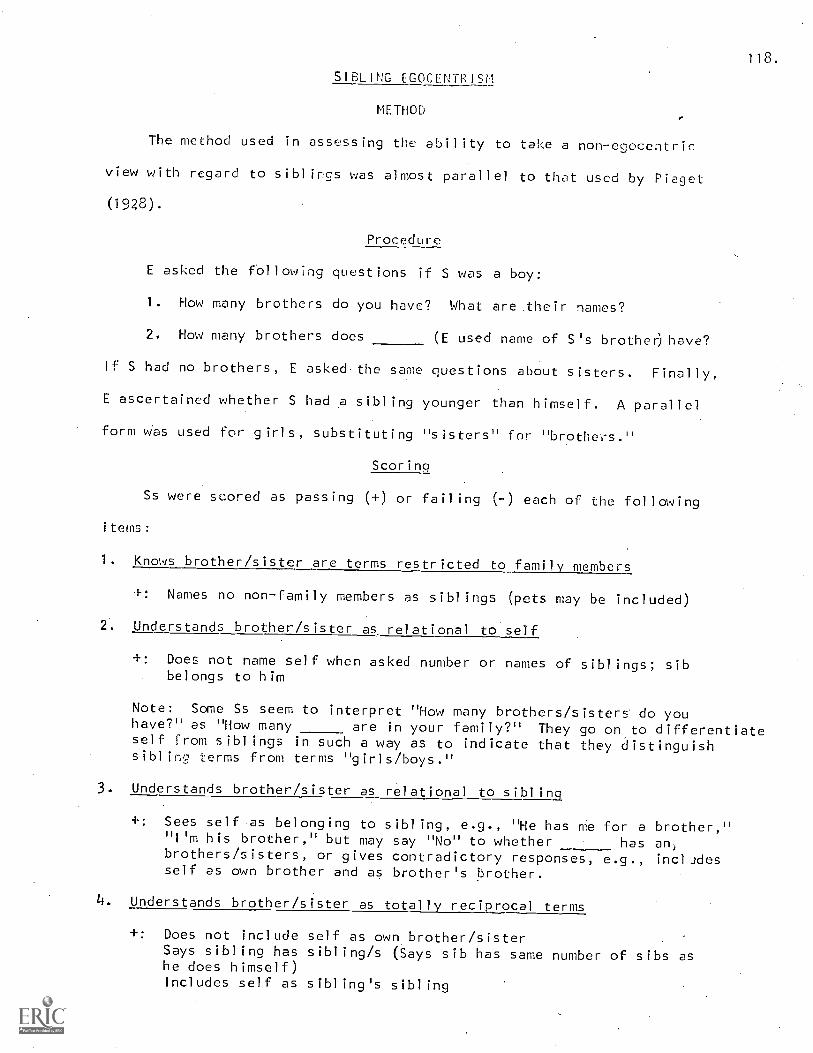
118.
SIBLING EGOCENTRISM
METHOD
The method used in assessing the ability to take a non-egocentric
view with regard to siblings was almost parallel to that used by Piaget
(1928).
Procedure
E asked the following questions if S was a boy:
1. How many brothers do you have? What are their names?
2. How many brothers does (E used name of S's brothers) have?
If S had no brothers, E asked the same questions about sisters. Finally,
E ascertained whether S had a sibling younger than himself. A parallel
form was used for girls, substituting "sisters" for "brothers."
Scoring
Ss were scored as passing (+) or failing (-) each of the following
items:
1. Knows brother/sister are terms restricted to family members
+: Names no non-family members as siblings (pets may be included)
2. Understands brother/sister as relational to self
+: Does not name self when asked number or names of siblings; sibbelongs to him
Note: Some Ss seem to interpret "How many brothers/sisters do youhave?" as "How many are in your family?" They go on to differentiateself from siblings in such a way as to indicate that they distinguishsiblic,3 terms from terms "girls/boys."
3. Understands brother/sister as relational to sibling
+: Sees self as belonging to sibling, e.g., "He has me for a brother,"his brother," but may say "No" to whether has an)
brothers/sisters, or gives contradictory responses, e.g., includesself as own brother and as brother's brother.
4. Understands brother/sister as totally reciprocal terms
+: Does not include self as own brother/sisterSays sibling has sibling/s (Says sib has same number of sibs ashe does himself)Includes self as sibling's sibling
119.
If response was contradictory and contained any indication of non-reciprocity,
it was scored 'LW on Item 3 and "-" on Item 4.
Results
' A scalogram analysis using Green's (1956) summary statistics was
performed (See Table 51 for reproducibilities and indices of consistency)
which indicated that the set of four items presented above forms a Guttman
scale. Table 52 shows the median age and frequency of bright, average,
an' retardeJ Ss at each scale level.
Developmental Sequentiality of Acquisition
The finding:3 do not strongly support a conclusion that the Guttman
Scale describes a develomental sequence of acquisition. However, neither
do they suggest a negative conclusion, but rather that a broader age-range
needs to be sampled. The evidence on the critical points necessary to
consider with regard to developmental sequentiality is as follows:
1. Order of difficulty: The items are-ordered in terms of increasing
difficulty,. as indicated by the scalogram analysis results in Table 51.
2. Age-wise progression along the scale: Mean scale scores for
bright, average, and retarded Ss shown in Table 53 indicate no regular
increase in performance with increased chronological age, and the analysis
of variance showed no statistically significant age effect for bright and
average groups. Table 54 shows little difference in the age distribution
of scale scores, and Table 55 similarly shows little difference in the
percentage of Ss succeeding on scale items at different age levels. However,
it is clear that development of relativity of perspective with regard to
sibling relationships is generally completed later than age seven, especially
by average children. Therefore, the age similarity in performance may
simply reflect a period of no developmental change. Thus, a broader age-
range needs to be sampled to determine whether an age-wise progression does
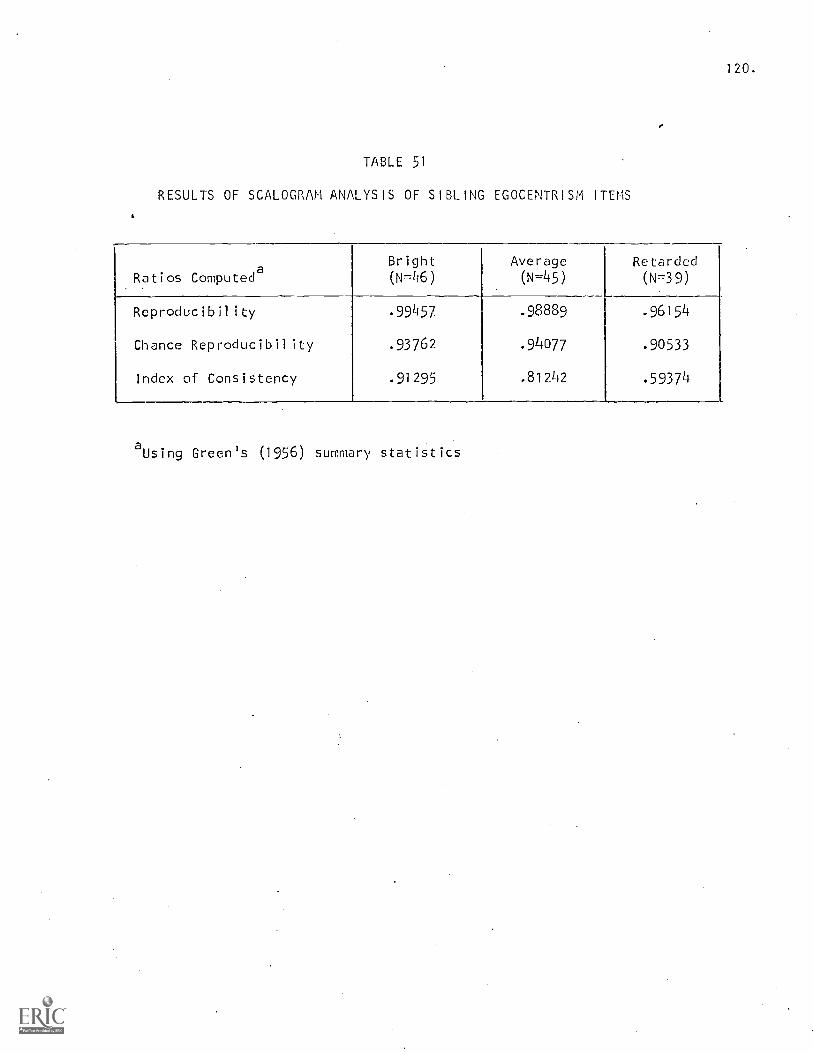
120.
TABLE 51
RESULTS OF SCALOGRAM ANALYSIS OF SIBLING EGOCENTRISM ITEMS
Bright Average RetardedRatios Computeda (N=46) (N=45) (N=39)
Reproducibility .99457 .98889 .96154
Chance Reproducibility .93762 .94077 .90533
Index of Consistency .91295 .81242 .59374
aUsing Green's (1956) summary statistics
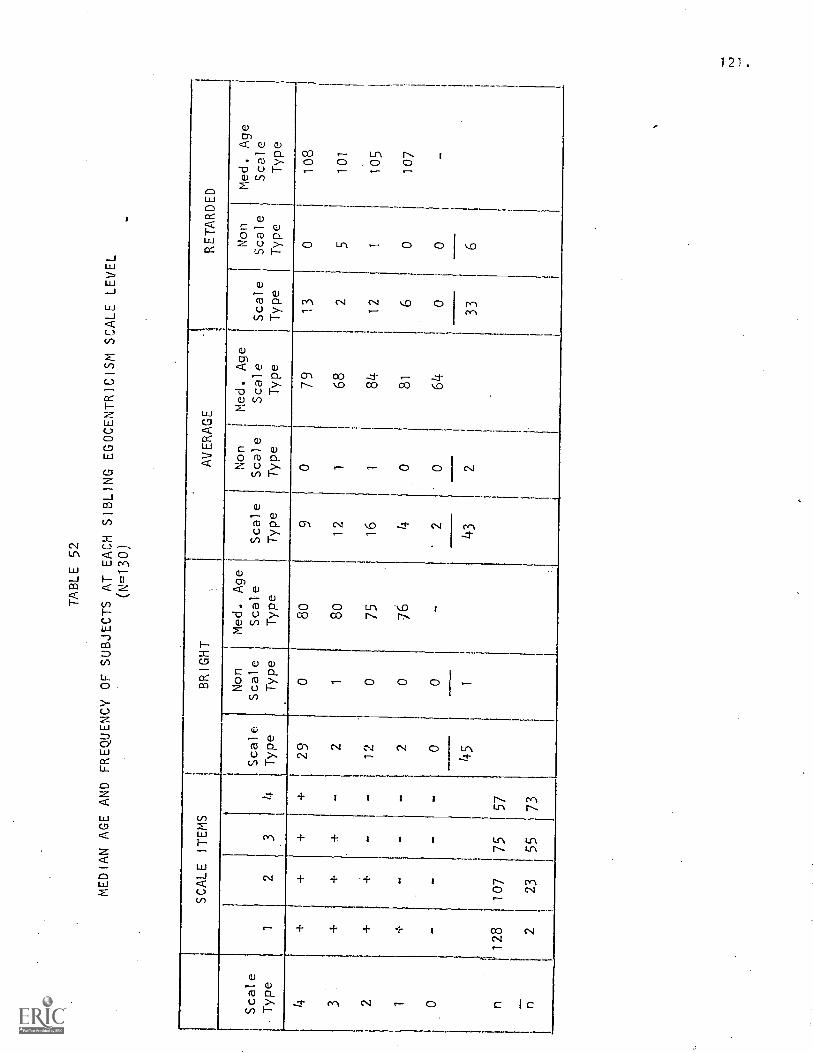
TABLE 52
MEDIAN AGE AND FREQUENCY OF SUBJECTS AT EACHSIBLING EGOCENTRIC1SM SCALE LEVEL
(N=130)
SCALE ITEMS
BRIGHT
AVERAGE
RETARDED
Non
Med. Age
Non
Med. Age
Non
Med. Age
Scale
Scale
Scale
Scale
Scale
Scale
Scale
Scale
Scale
Scale
Type
12
34
Type
Type
Type
Type
Type
Type
Type
Type
Type
4+
++
+29
080
90
79
13
0108
3+
++
-2
180
12
168
25
101
2+
--
12
075
16
184
12
1105
1-1.
--
-2
076
40
81
60
107
0-
--
-0
0-
20
64
00
45
143
233
6
n128
107
75
57
n2
23
55
73
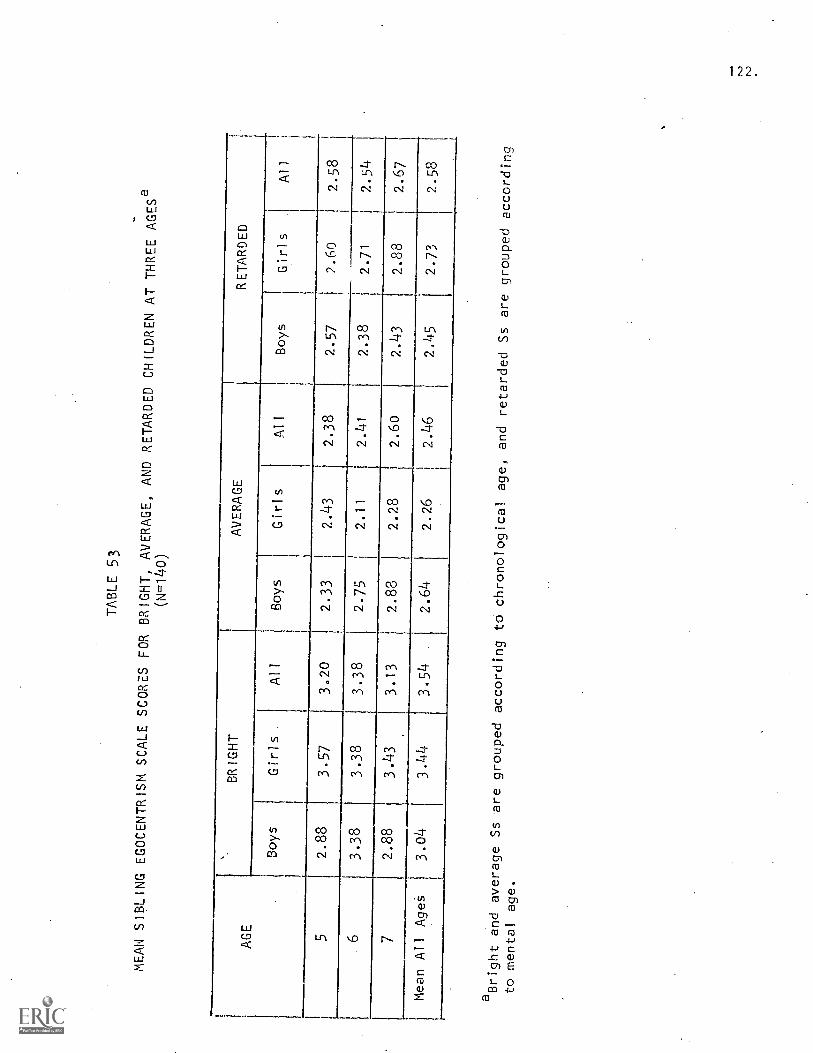
TABLE 53
MEAN SIBLING EGOCENTRISM SCALE SCORES
FOR BRIGHT, AVERAGE, AND
RETARDED CHILDREN AT THREE AGESa
(N=140)
AGE
BRIGHT
AVERAGE
RETARDED
Boys
Girls
All
Boys
Girls
All
Boys
Girls
All
52.88
3.57
3.20
2.33
2.43
2.38
2.57
2.60
2.58
63.38
3.38
3.38
2.75
2.11
2.41
2.38
2.71
2.54
72.88
3.43
3.13
2.88
2.28
2.60
2.43
2.88
2.67
Mean All Ages
3.04
3.44
3.54
2.64
2.26
2.46
2.45
2.73
2.58
aBrIght and average Ss
are grouped according to chronological
age, and retarded Ss are grouped according
to mental age.
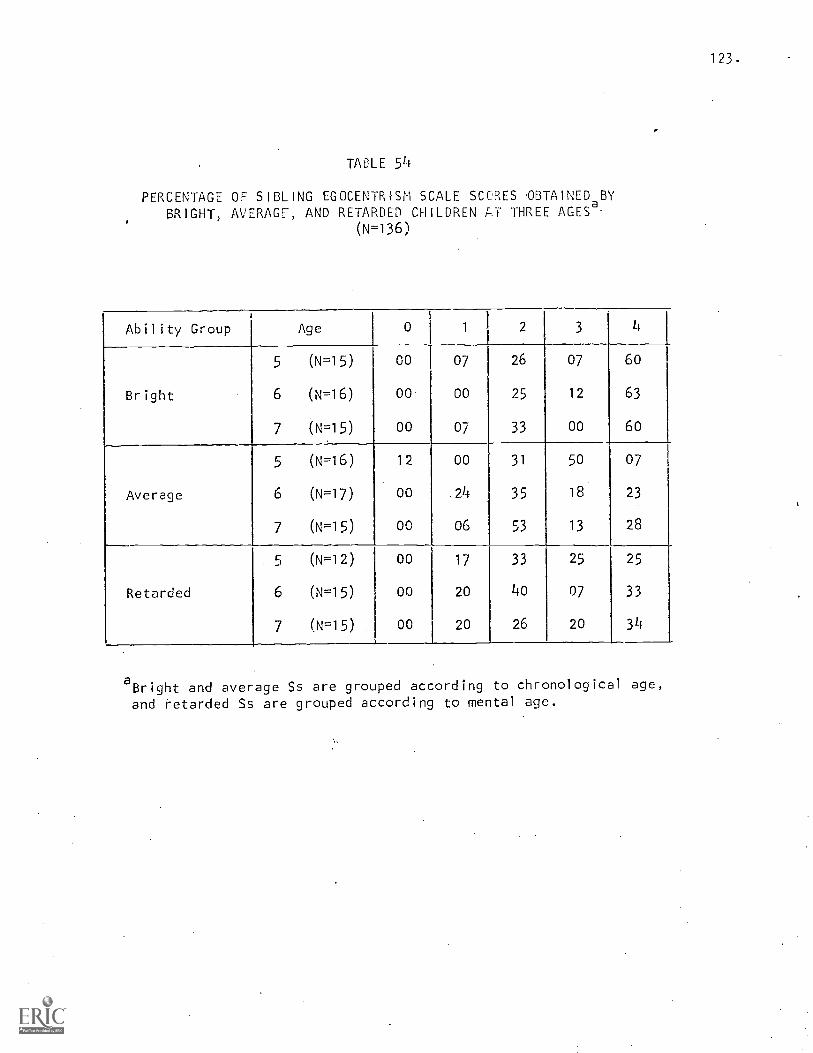
123.
TACLE 54
PERCENTAGE OF SIBLING EGOCENTRISM SCALE SCORES OBTAINED BYBRIGHT, AVERAGE, AND RETARDED CHILDREN AT THREE AGES8-
(N=136)
Ability Group Age 0 1 2 3 4
5 (N=15) 00 07 26 07 60
Bright 6 (N=16) 00 00 25 12 63
7 (N=15) 00 07 33 00 6o
5 (N=16) 12 00 31 50 07
Average 6 (N=17) 00 .24 35 18 23
7 (N-15) 00 06 53 13 28
5 (N=12) 00 17 33 25 25
Retarded 6 (N=15) 00 20 40 07 33
7 (N=15) 00 20 26 20 34
a Bright and average Ss are grouped according to chronological age,
and retarded Ss are grouped according to mental age.
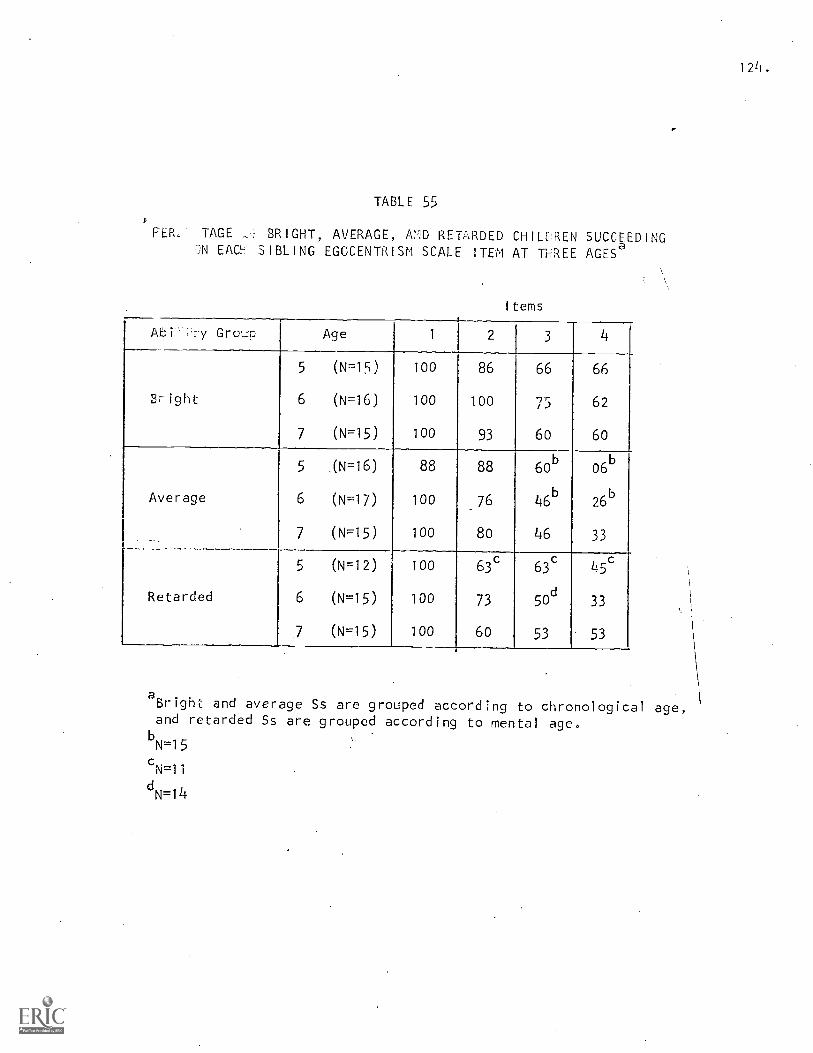
TABLE 55
FER.; TAGE BRIGHT, AVERAGE, MD RETARDED CHILPREN SUCCEEDINGEAa. SIBLING EGOCENTRISM SCALE ITEM AT THREE AGESa
Items
Abi i_y GroLp Age 1 2 3
5 (N=15) 100 86 66 66
Bright 6 (N=16) 100 100 75 i) 62
7 (N=15) 100 93 6o 60
5 .(N-16) 88 88 bob 06b
Average 6 (N=17) 100 76 46b
26b
7 (N=15) 100 8o 46 33
5 (N=12) 100 63 63 45
Retarded 6 (N=15) 100 73 50d50 33
7 (N=15) 100 60 53 53
aBright and average Ss are grouped according to chronologicaland retarded Ss are grouped according to mental age.
bN=15
N= 1
dN=14
ti
age,
1211.
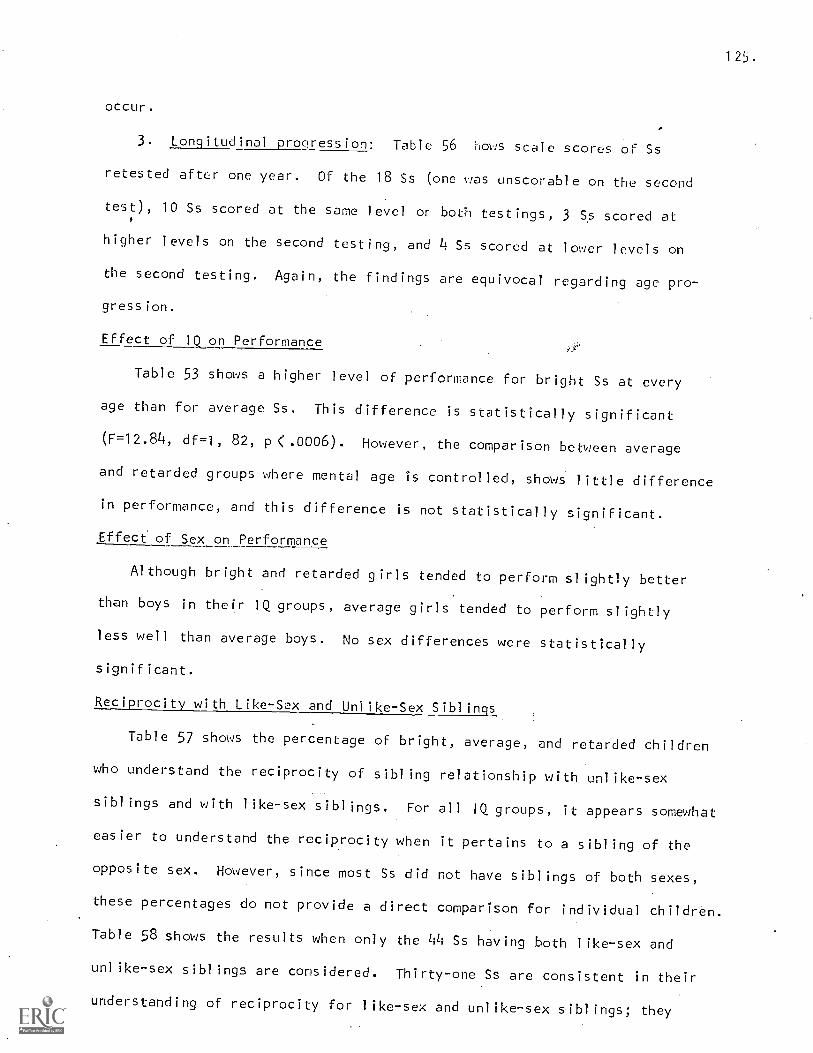
125.
occur.
3. Longitudinal progression: Table 56 hows scale scores of Ss
retested after one year. OF the 18 Ss (one was unscorable on the second
test), 10 Ss scored at the same level or both testings, 3 Ss scored at
higher levels on the second testing, and 4 Ss scored at lower levels on
the second testing. Again, the findings are equivocal regarding age pro-
gression.
Effect of 1112_0n Performance
Table 53 shows a higher level of performance for bright Ss at every
age than for average Ss. This difference is statistically significant
(F=12.84, df=1, 82, p < .0006). However, the comparison between average
and retarded groups where mental age is controlled, shows little difference
in performance, and this difference is not statistically significant.
Effect of Sex on Performance
Although bright and retarded girls tended to perform slightly better
than boys in their IQ groups, average girls tended to perform slightly
less well than average boys. No sex differences were statistically
significant.
Reciprocity with Like-Sax and Unlike-Sex Siblings
Table 57 shows the percentage of bright, average, and retarded children
who understand the reciprocity of sibling relationship with unlike-sex
siblings and with like-sex siblings. For all IQ groups, it appears somewhat
easier to understand the reciprocity when it pertains to a sibling of the
opposite sex. However, since most Ss did not have siblings of both sexes,
these percentages do not provide a direct comparison for individual children.
Table 58 shows the results when only the 44 Ss having both like-sex and
unlike-sex siblings are considered. Thirty-one Ss are consistent in their
understanding of reciprocity for like-sex and unlike-sex siblings; they
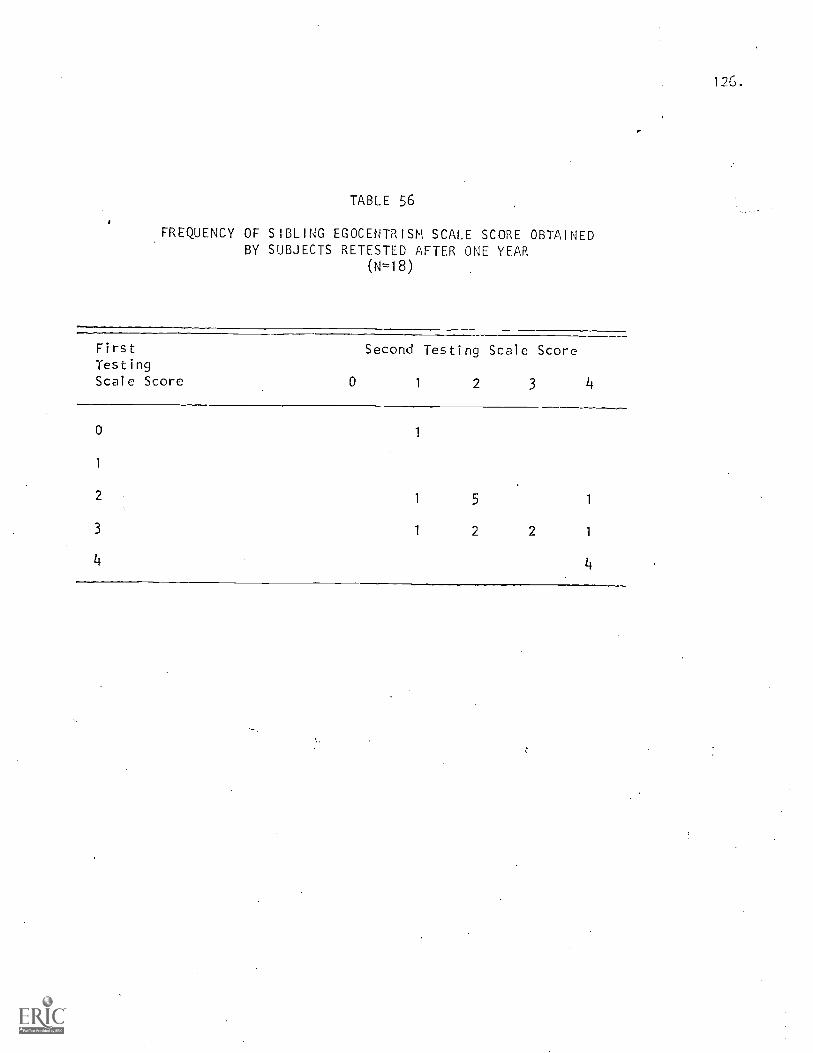
126.
TABLE 56
FREQUENCY OF SIBLING EGOCENTRISM SCALE SCORE OBTAINEDBY SUBJECTS RETESTED AFTER ONE YEAR
(N=18)
First Second Testing Scale ScoreTestingScale Score 0 1 2 3
0 1
1
2 1 5 1
3 1 2 2 1
4
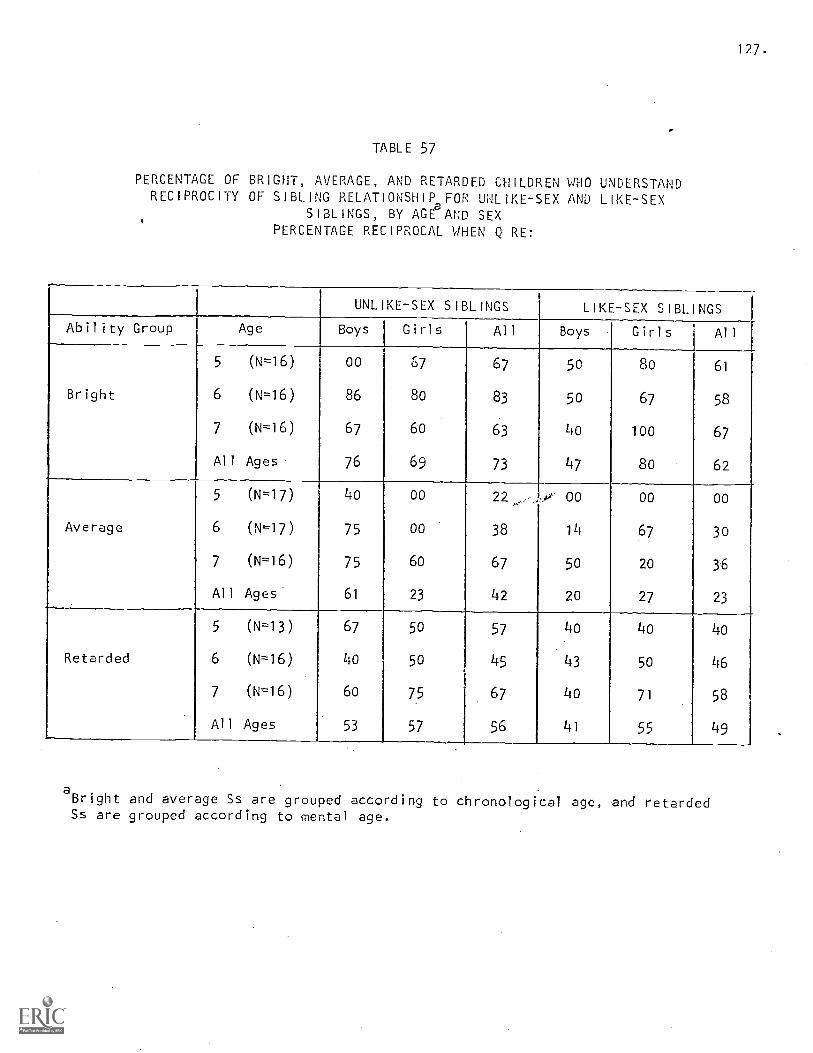
127.
TABLE 57
PERCENTAGE OF BRIGHT, AVERAGE, AND RETARDED CHILDREN WHO UNDERSTANDRECIPROCITY OF SIBLING RELATIONSHIP FOR UNLIKE -SEX AND LIKE-SEX
SIBLINGS, BY AGE AND SEXPERCENTAGE RECIPROCAL WHEN Q RE:
UNLIKE-SEX SIBLINGS LIKE-SEX SIBLINGS
Ability Group Age Boys Girls All Boys Girls All
5 (N-16) 00 67 67 5o 8o 61
Bright 6 (N-16) 86 80 83 5o 67 58
7 (N-16) 67 6o 63 4o 100 67
All Ages. 76 69 73 47 80 62
5 (N-17) 4o 00 22---.
00 00 00
Average 6 (N-17) 75 00 38 14 67 30
7 (N-16) 75 6o 67 5o 20 3.6
All Ages 61 23 42 20 27 23
5 (N-13) 67 5o 57 4o 4o 4o
Retarded 6 (N-16) 40 50 45 43 5o 46
7 (N =16) 6o 75 67 4o 71 58
All Ages 53 57 56 41 55 49
aBright and average Ss are grouped according to chronological age, and retardedSs are grouped according to mental age.
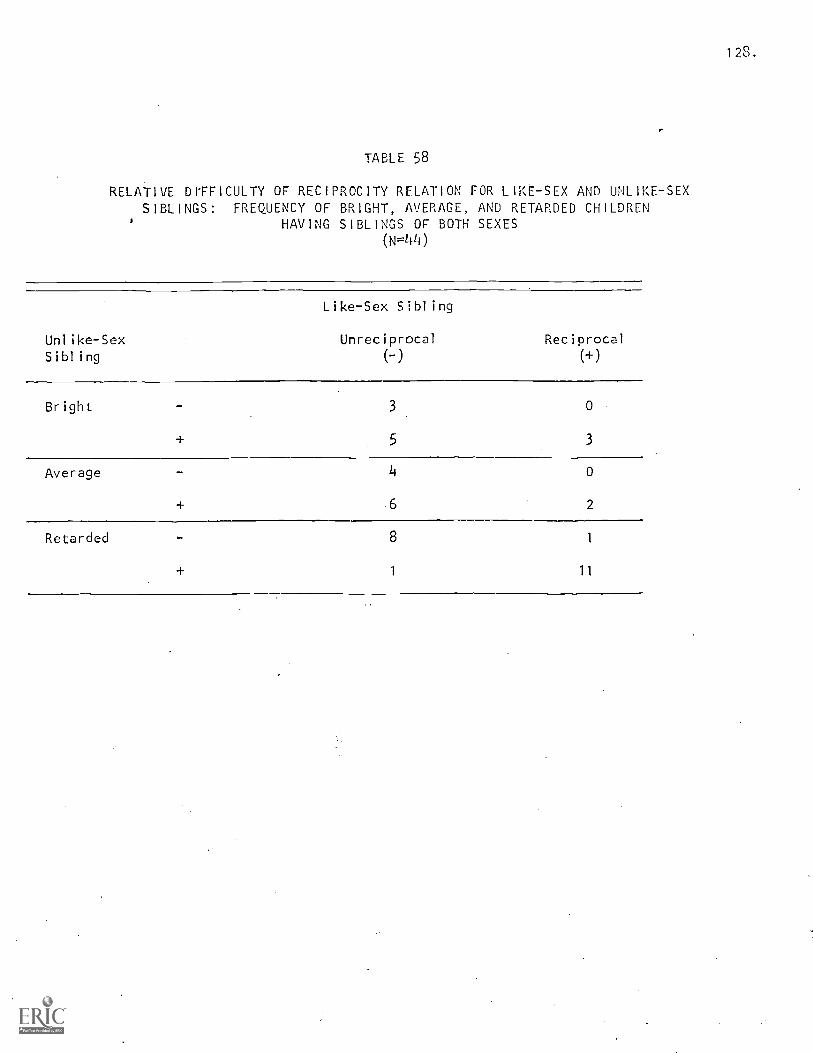
128.
TABLE 58
RELATIVE DIFFICULTY OF RECIPROCITY RELATION FOR LIKE-SEX AND UNLIKE-SEXSIBLINGS: FREQUENCY OF BRIGHT, AVERAGE, AND RETARDED CHILDREN
HAVING SIBLINGS OF BOTH SEXES(N=44)
Unlike-SexSibling
Like-Sex Sibling
Unreciprocal
(-)
Reciprocal
(+)
Bright 3
5
0
3
Average 4
6
0
2
Retarded 8 1
1 11
129.
are either reciprocal for both or unreciprocal for both. Of the remaining
13 Ss who are reciprocal for one and unreciprocal for the other, only one
retarded S was reciprocal for the like-sex sibling and unreciprocal for
the unlike-sex sibling. Thus, it does appear that reciprocity with regard
to a sibling of the opposite sex is an easier cognitive task than for a
sibling of the same sex.
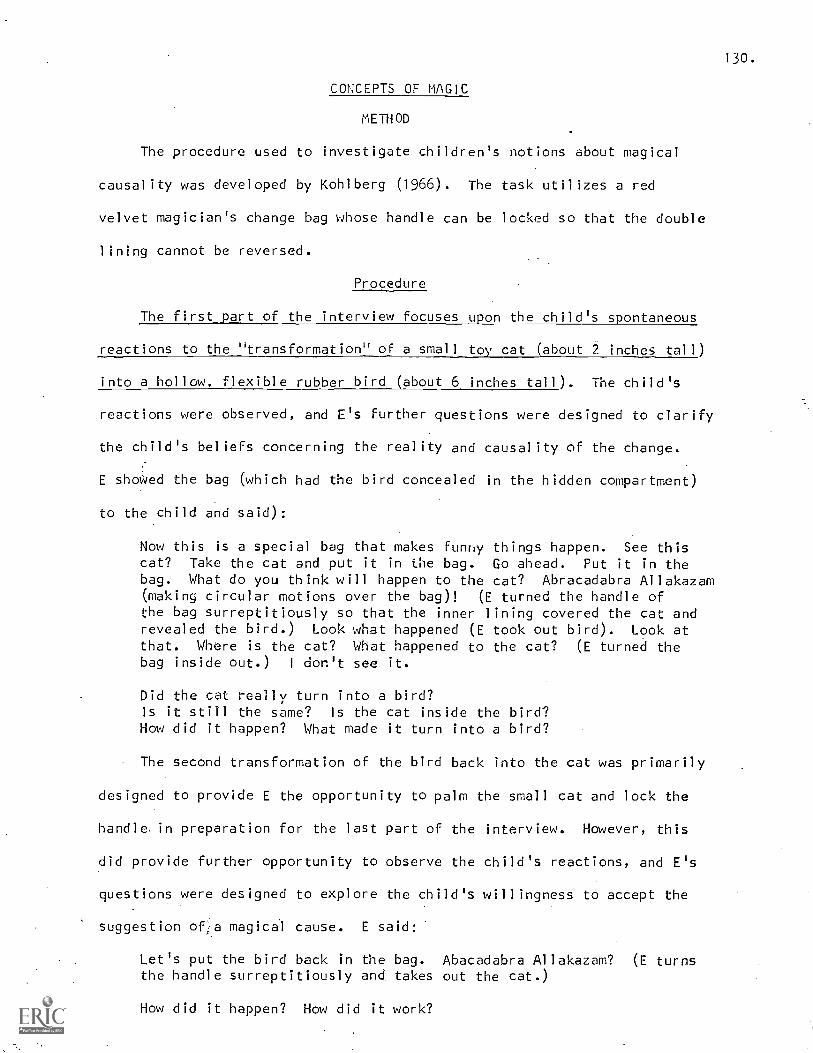
130.
CONCEPTS OF MAGIC
METHOD
The procedure used to investigate children's notions about magical
causality was developed by Kohlberg (1966). The task utilizes a red
velvet magician's change bag whose handle can be locked so that the double
lining cannot be reversed.
Procedure
The first part of the interview focuses upon the child's spontaneous
reactions to the "transformation" of a small toy cat (about 2 inches tall)
into a hollow, flexible rubber bird (about 6 inches tall). The child's
reactions were observed, and E's further questions were designed to clarify
the child's beliefs concerning the reality and causality of the change.
E showed the bag (which had the bird concealed in the hidden compartment)
to the child and said):
Now this is a special bag that makes funky things happen. See thiscat? Take the cat and put it in the bag. Go ahead. Put it in thebag. What do you think will happen to the cat? Abracadabra Allakazam(making circular motions over the bag)! (E turned the handle ofthe bag surreptitiously so that the inner lining covered the cat andrevealed the bird.) Look what happened (E took out bird). Look atthat. Where is the cat? What happened to the cat? (E turned thebag inside out.) I don't see it.
Did the cat really turn into a bird?Is it still the same? Is the cat inside the bird?How did it happen? What made it turn into a bird?
The second transformation of the bird back into the cat was primarily
designed to provide E the opportunity to palm the small cat and lock the
handle in preparation for the last part of the interview. However, this
did provide further opportunity to observe the child's reactions, and E's
questions were designed to explore the child's willingness to accept the
suggestion ofta magical cause. E said:
Let's put the bird back in the bag. Abacadabra Allakazam? (E turnsthe handle surreptitiously and takes out the cat.)
How did it happen? How did it work?
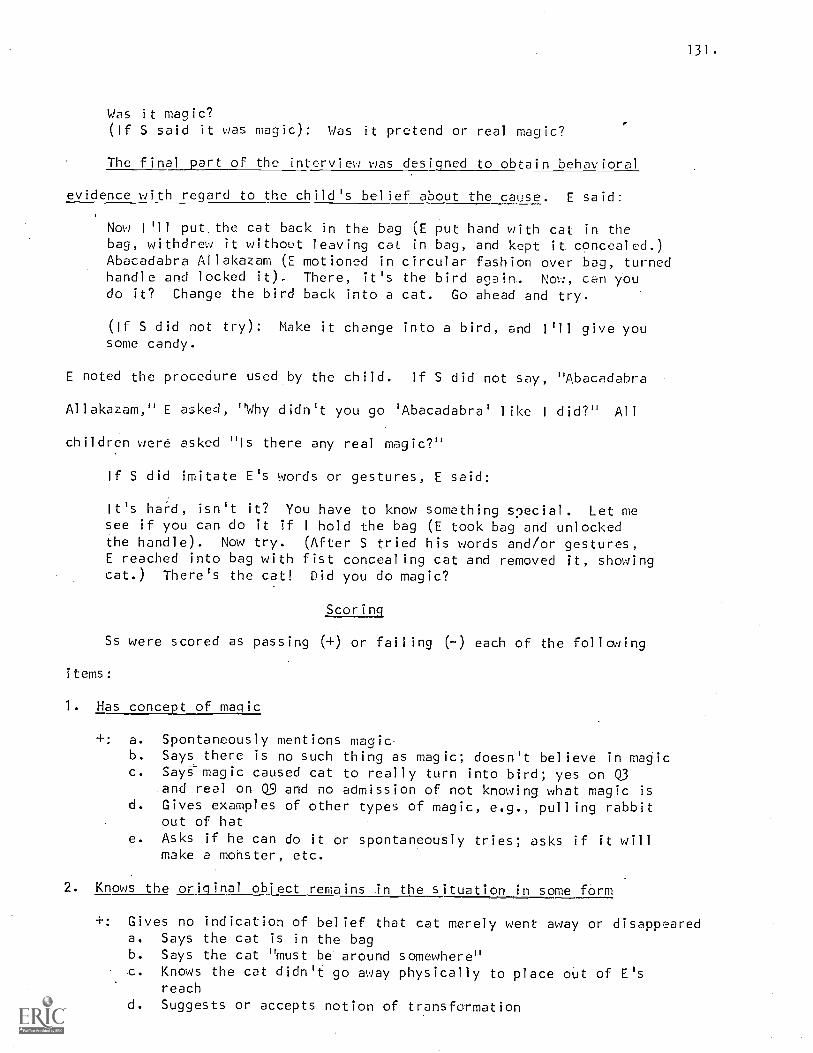
131.
Was it magic?(If S said it was magic): Was it pretend or real magic?
The final _part of the interview was designed to obtain behavioral
evidence with regard to the child's belief about the cause. E said:
Now I '11 put. the cat back in the bag (E put hand with cat in thebag, withdrew it without leaving cat in bag, and kept it. concealed.)Abacadabra Allakazam (E motioned in circular fashion over bag, turnedhandle and locked it), There, it's the bird again- Now, can Youdo it? Change the bird back into a cat. Go ahead and try.
(If S did not try): Make it change into a bird, and I'll give yousome candy.
E noted the procedure used by the child. If S did not say, "Abacadabra
Allakazam," E asked, ''Why didn't you go ' Abacadabra' like I did?" All
children were asked "Is there any real magic?"
If S did imitate E's words or gestures, E said:
It's har=d, isn't it? You have to know something special. Let mesee if you can do it if I hold the bag (E took bag and unlockedthe handle). Now try. (After S tried his words and/or gestures,E reached into bag with fist concealing cat and removed it, showingcat.) There's the cat! Did you do magic?
Scoring
Ss were scored as passing (+) or failing (-) each of the following
items:
1. Has concept of magic
+: a. Spontaneously mentions magicb. Says there is no such thing as magic; doesn't believe in magicc. SayFTmagic caused cat to really turn into bird; yes on Q3
and real on Q9 and no admission of not knowing what magic isd. Gives examples of other types of magic, e.g., pulling rabbit
out of hate. Asks if he can do it or spontaneously tries; asks if it will
make a monster, etc.
2. Knows the original object remains in the situation in some form
+: Gives no indication of belief that cat merely went away or disappeareda. Says the cat is in the bagb. Says the cat "must be around somewhere"c. Knows the cat didn't go away physically to place out of E's
reachd. Suggests or accepts notion of transformation
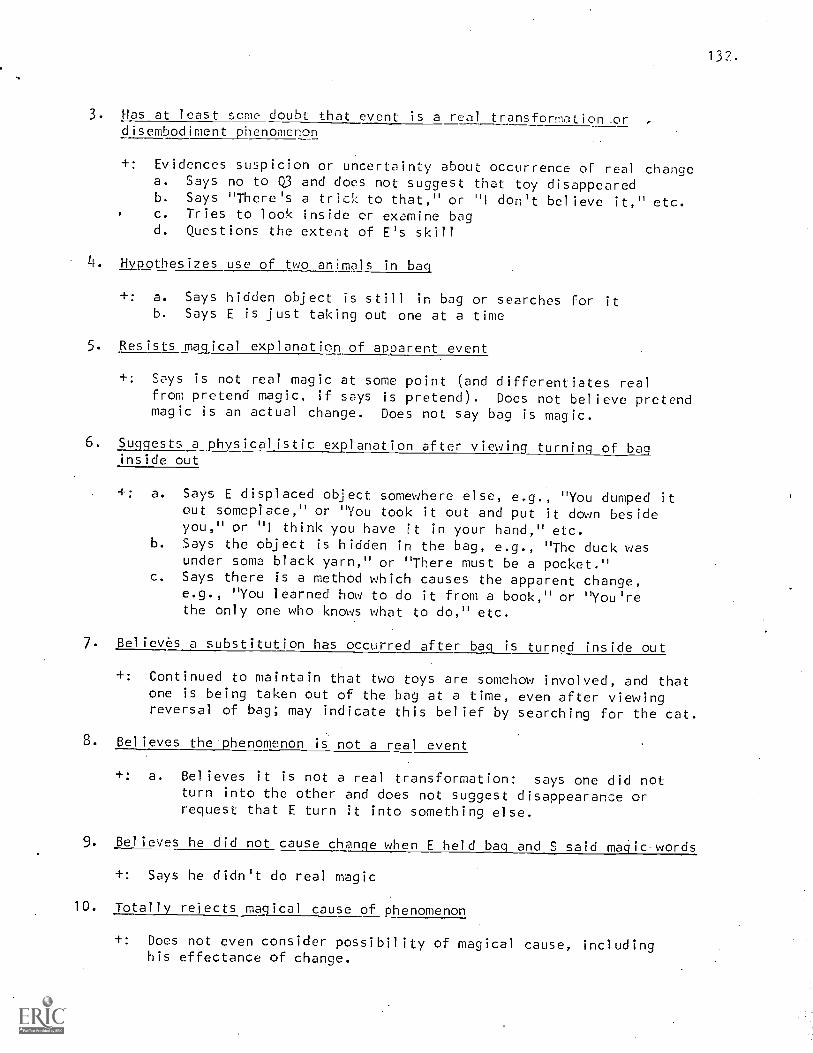
132.
3. Has at least some doubt that event is a real transformation _ordisembodiment phenomenon
+: Evidences suspicion or uncertainty about occurrence of real changea. Says no to Q3 and does not suggest that toy disappearedb. Says "There's a trick to that," or "I don't believe it," etc.c. Tries to look inside or examine bagd. Questions the extent of E's skill
4. Hypothesizes use of two animals in bag
a. Says hidden object is still in bag or searches for itb. Says E is just taking out one at a time
5. Resists magical explanation of apparent event
+: Says is not real magic at some point (and differentiates realfrom pretend magic, if says is pretend). Does not believe pretendmagic is an actual change. Does not say bag is magic.
6. Suggests a physicalistic explanation after viewing turning of baginside out
+: a. Says E displaced object somewhere else, e.g., "You dumped itout someplace," or "You took it out and put it down besideyou," or "I think you have it in your hand," etc.
b. Says the object is hidden in the bag, e.g., "The duck wasunder some black yarn," or "There must be a pocket."
c. Says there is a method which causes the apparent change,e.g., "You learned how to do it from a book," or "You'rethe only one who knows what to do," etc.
7. Believes a substitution has occurred after bag is turned inside out
+: Continued to maintain that two toys are somehow involved, and thatone is being taken out of the bag at a time, even after viewingreversal of bag; may indicate this belief by searching for the cat.
8. Believes the phenomenon is not a real event
+: a. Believes it is not a real transformation: says one did notturn into the other and does not suggest disappearance orrequest that E turn it into something else.
9. Believes he did not cause change when E held bag and S said magic, words
+: Says he didn't do real magic
10. Totally rejects magical cause of phenomenon
+: Does not even consider possibility of magical cause, includinghis effectance of change.
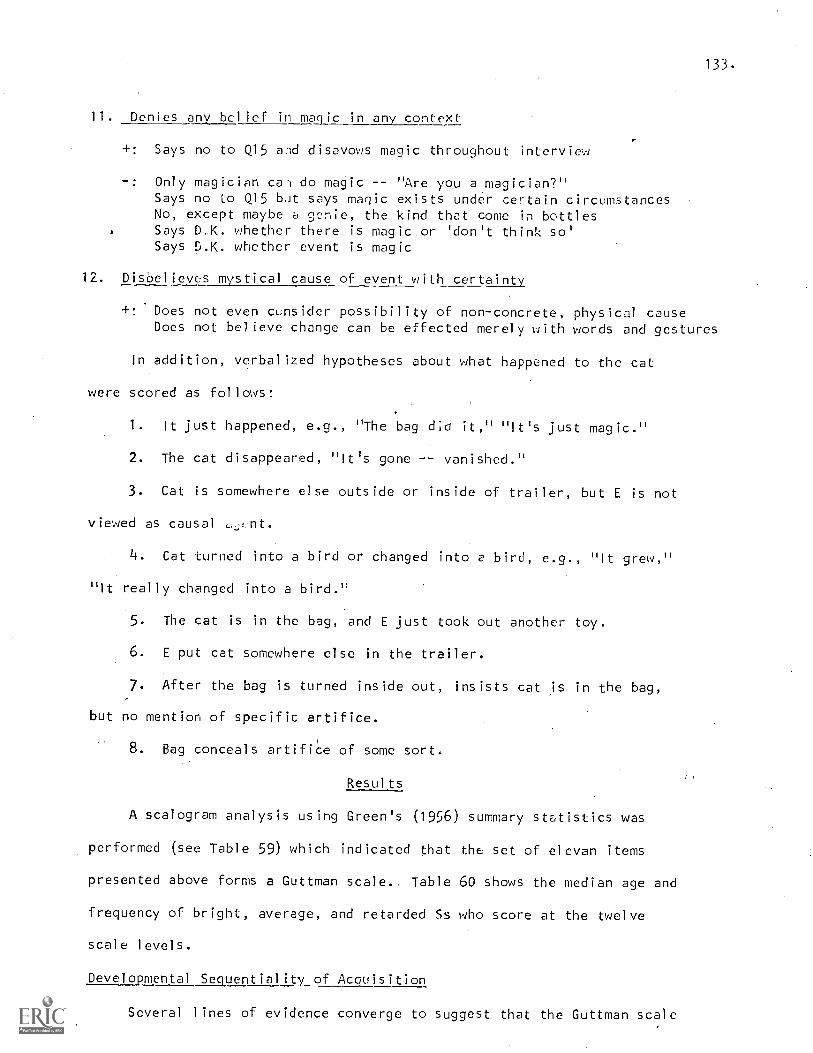
133.
11. Denies any belief in magic in any context
+: Says no to Q15 aid disavows magic throughout interview
-: Only magician cal do magic "Are you a .magician?"Says no to Q15 but says magic exists under certain circumstancesNo, except maybe a genie, the kind that come in bottlesSays D.K. whether there is magic.or 'don't think so'Says D.K. whether event is magic
12. Disbelieves mystical cause of event with certainty
+: Does not even consider possibility of non-concrete, physical causeDoes not believe change can be effected merely with words and gestures
In addition, verbalized hypotheses about what happened to the cat
were scored as follows:
1. It just happened, e.g., "The bag.die it," "It's just magic."
2. The cat disappeared, "It's gone vanished."
3. Cat is somewhere else outside or inside of trailer, but E is not
viewed as causal
4. Cat turned into a bird or changed into e bird, e.g., "it grew,"
It really changed into a bird."
5. The cat is in the bag, and E just took out another toy.
6. E put cat somewhere else in the trailer.
7. After the bag is turned inside out, insists cat is in the bag,
but no mention of specific artifice.
8. Bag conceals artifiCe of some sort.
Results
A scalogram analysis using Green's (1956) summary statistics was
performed (see Table 59) which indicated that the set of elcvan items
presented above forms a Guttman scale.. Table 60 shows the median age and
frequency of bright, average, and retarded Ss who score at the twelve
scare levels.
Developmental_ Sequentiality of Acquisition
Several lines of evidence converge to suggest that the Guttman scale
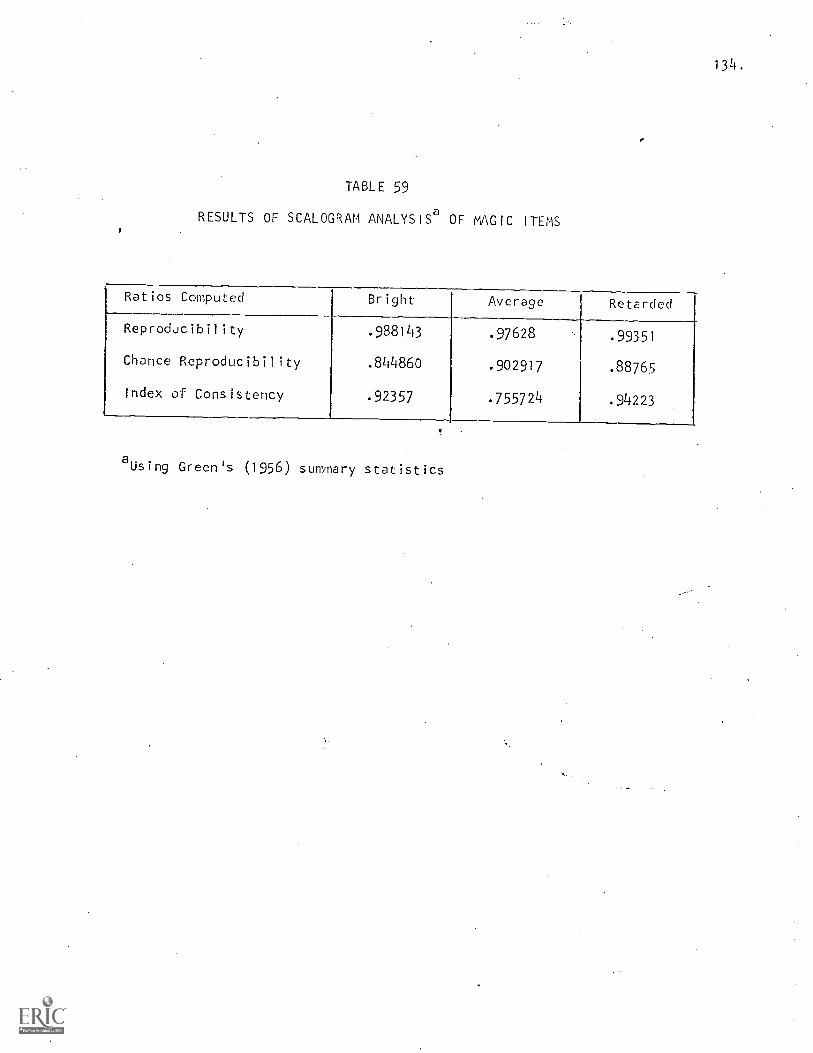
134.
TABLE 59
RESULTS OF SCALOGRAM ANALYSI58 OF MAGIC ITEMS
Ratios Computed Bright Average Retarded
Reproducibility .988143 .97628 .99351
Chance Reproducibility .844860 .902917 .88765
Index of Consistency .92357 .755724 .94223
aUsing Green's (1956) summary statistics
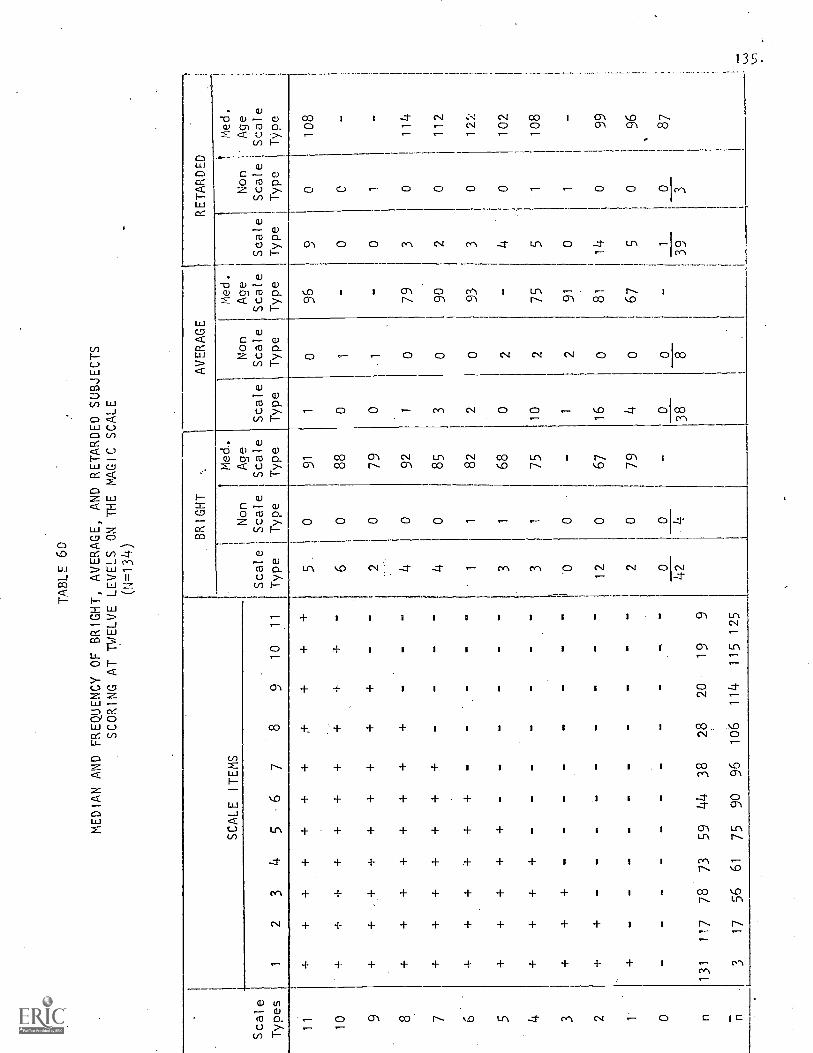
TABLE 60
MEDIAN AND FREQUENCY OF BRIGHT, AVERAGE, AND RETARDED SUBJECTS
SCORING AT TWELVE LEVELS ON THE MAGIC SCALE
(N=134)
SCALE
ITEMS
BRIGHT
AVERAGE
RETARDED
I 1
Scale!
Type
I
Non
Scale
Type
1Med.
Age
Scale
Type
Scale
Type
Non
Scale
Type
Med.
Age
Scale
Type
1
Seale
Type
Non
1 ,
Scale'
Type
Med.
Age
Scale
Type
Scale
Types
12
34
5.6
78
910
11
11
++
++
±+
++
++
5o
91
10
96
9 ,
0108
10
++
++
++
++
...
60
88
01
-o
0-
9+
++
++
++
+-
-2
079
0.
1-
01
8+
++
++
++
--
-4
092
10
79
30
114
7+
++
++
++
--
--
40
85
30
90
,2
0112
64
++
182
20
93
30
122
5+
++
++
--
--
-3
168
02
40
102
4+
++
+-
--
---
31
75
10
275
51
108
i
3+
++
--
--
--
--
1.0
0-
12
91
01
24
+-
--
12
067
16
081
14
099
20
79
40
67
50
96
0-
--
--
-_
-_
,_
00
-0
o-
10
87
42
438
839
3
n131
117
78
73
59
44
38
28
20
19
9
n3
17
56
61
75
90
96
106
114
115
125
136.
describes a developmental sequence of acquisition:
1. The items are ordered in terms of increasing difficulty.
Reproducibilities and indices of consistency shown in Table 59 indicate
that the items are increasingly difficult as one moves from one to eleven.
This order is the same for all IQ groups.
2. Increasing success on scale items occurs with increasing age
and reflects the order of difficulty. Table 60 showed a general median
aye increase from lowest to highest scale levels, and mean scores shown
in Table 61 indicate a regular increase in performance with increased
age which is statistically significant (F=25.77, df=2, 86, p<;.0001 for
average and bright groups). Table 62 shows that older children tend to
score at levels higher than do younger children, and Table 63 shows a
regular age increase in percentage of Ss succeeding on each scale item.
3. Retesting of a small number of Ss after one year shows a general
progression along the scale. Table 64 shows scale scores of Ss at two
points in time, separated by one year. Of the 18 Ss (one was unscorable
on the first testing), 2 Ss scored at the same level on both testings,
12 Ss scored at a higher level on the second testing, and 4 Ss scored
at a lower level at the end of the year. For most Ss, the scale proVides
a good account of their developmental change.
Effect of Intelligence on Performance
Table 61 shows a significantly higher level of performance for bright
children than average (F=20.66, df=1, 86, p <.0001), but no statistically
significant difference between average and retarded children of_the same
mental age.
Effect of Sex on Performance
None of the differences in performance of the sexes is statistically
significant.
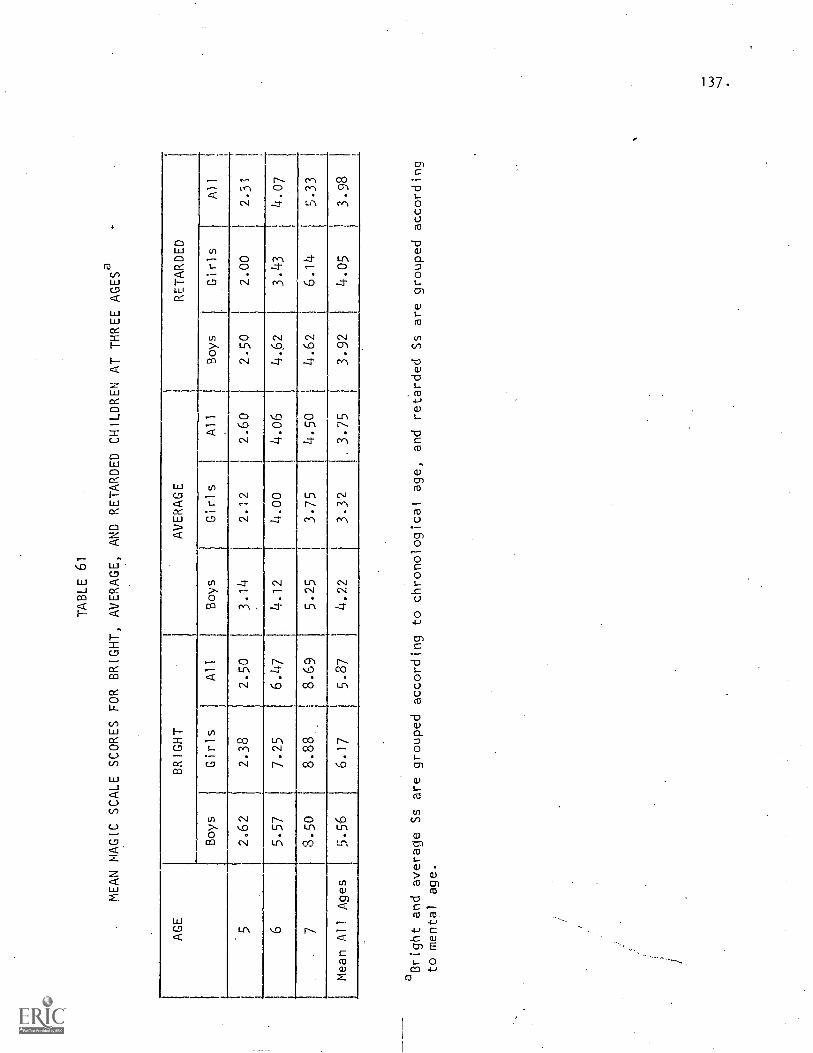
TABLE 61
MEAN MAGIC SCALE SCORES FOR BRIGHT, AVERAGE, AND RETARDED CHILDREN AT THREE AGESa
AGE
BRIGHT
AVERAGE
RETARDED
Boys
Girls
All
Boys
Girls
All
Boys
Girls
All
52.62
2.38
2.50
3.14
2.12
2.60
2.50
2.00
2.31
65.57
7.25
6.47
4.12
4.00
4.06
4.62
3.43
4.07
78.50
8.88
8.69
5.25
3.75
4.50
4.62
6.14
5.33
Mean All Ages
5.56
6.17
5.87
4.22
3.32
,3.75
3.92
4.05
3.98
aBright and average Ss are grouped according to chronological
age, and retarded Ss are grouped according
to mental age.
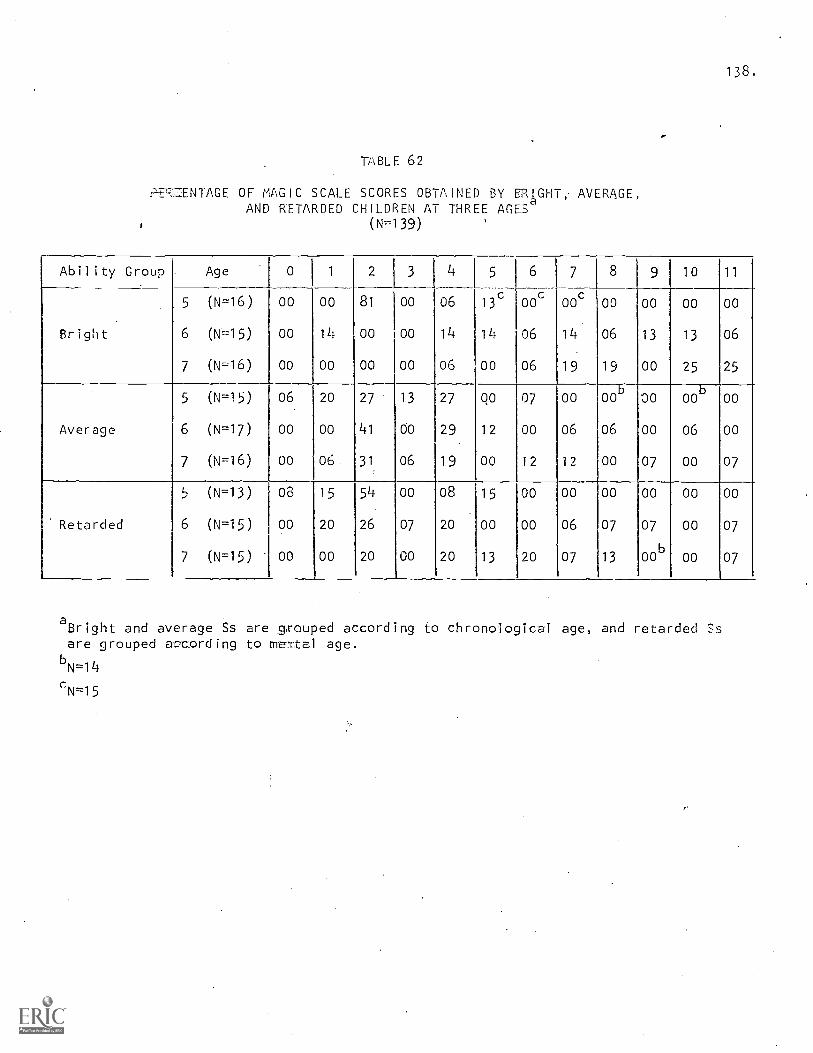
138.
TABLE 62
=ENTAGE OF MAGIC SCALE SCORES OBTAINED BY ER1GHT, AVERAGE,AND RETARDED CHILDREN AT -THREE AGES
(N=139)
Ability Group Age 0 1 2 3 4 5 6 7 8 9 10 11,
5 (N=16) 00 00 81 00 06 13c ooc ooc 00 00 00 00
Bright 6 (N=15) 00 14 00 00 14 14 06 14 06 13 13 06
7 (N =16) 00 00 00 oo 06 00 06 19 19 00 25 25
5 (N=15) 06 20 27 13 27 QO 07 00 008 30 00b 00
Average 6 (N=17) 00 00 41 00 29 12 00 06 06 00 06 00
7 (N=16) 00 06 31 06 19 00 12 12 00 07 00 07
5 (N=13) 08 15 54 00 08 15 00 00 00 00 00 00
Retarded 6 (N=15) 00 20 26 07 20 00 00 06 07 07 00 07
7 (N=15) 00 00 20 00 20 13 20 07 13 00b 00 07
aBrightand average Ss are grouped according to chronological age, and retarded Ss
are grouped anaording to me,rtal age.bN=14
r,
N=15
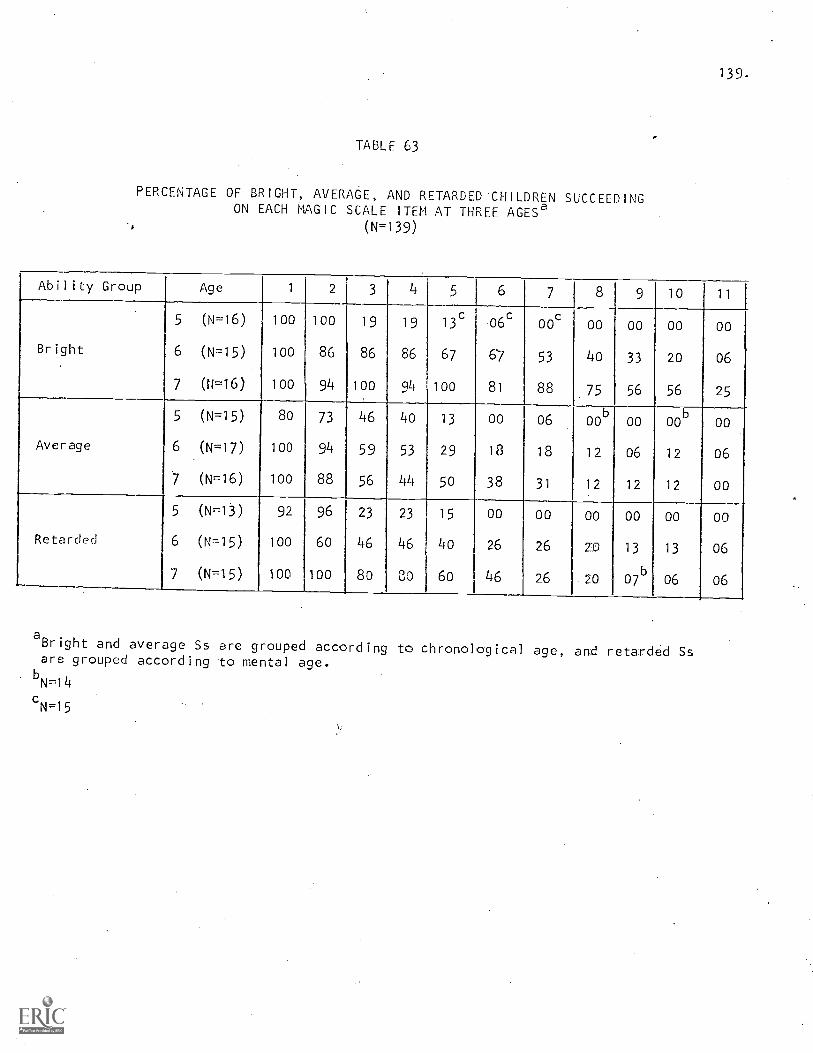
139.
TABLE 63
PERCENTAGE OF BRIGHT, AVERAGE, AND RETARDED CHILDREN SUCCEEDINGON EACH MAGIC SCALE ITEM AT THREE AGESa
(N=139)
Ability Group Age 1 2 3 4 5 6 7 8 9 10 11
Bright
5 (N =16)
6 (N=15)
100
100
100
86
19
86
19
86
13c
67
o6c
6'7
00c
53
00
40
00
33
00
20
00
06
7 (N=16) 100 94 100 94 100 81 88 75 56 56 25
5 (N=15) 80 73 46 4o 13 00 06 o0b oo 0ob oo
Average 6 (N=17) 100 94 59 53 29 18 18 12 06 12 06
7 (N=16) 100 88 56 44 50 38 31 12 12 12 00
5 (N=13) 92 96 23 23 15 00 00 00 00 00 00
Retarded 6 (N=15) 100 60 46 46 40 26 26 210 13 13 06
7 (N=15) 100 100 80 30 60 46 26 ..20 07b 06 06
aBright and average Ss are grouped according to chronological age, and retarded Ssare grouped according to mental age.
bN-14
N=15
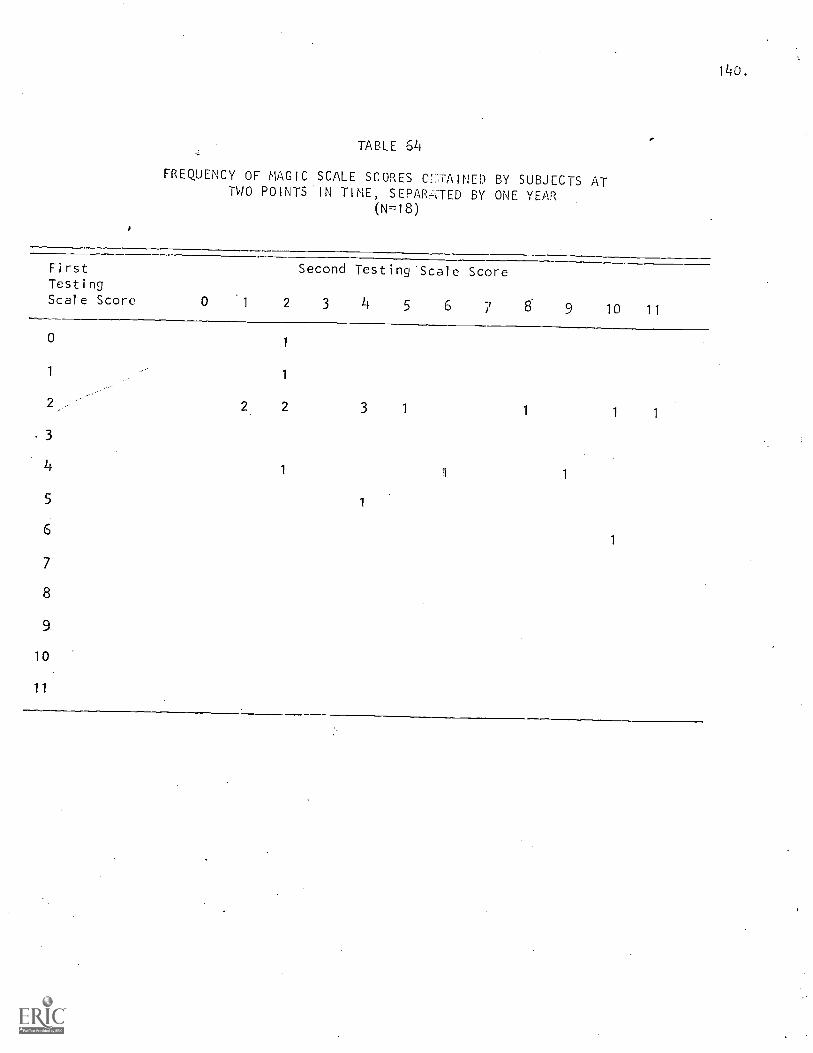
140.
TABLE 64
FREQUENCY OF MAGIC SCALE SCORES C::TAINED BY SUBJECTS ATTWO POINTSIN TIME, SEPAR,2;TED BY ONE YEAR
(N=18)
FirstTestingScale Score 0 1 2
Second Testing'Scale Score
3 4 5 6 7 8 9 10 11
01
1 1
2 2 3 1 1 1 1
-3
4 1l 1
5 1
61
7
8
9
10
11
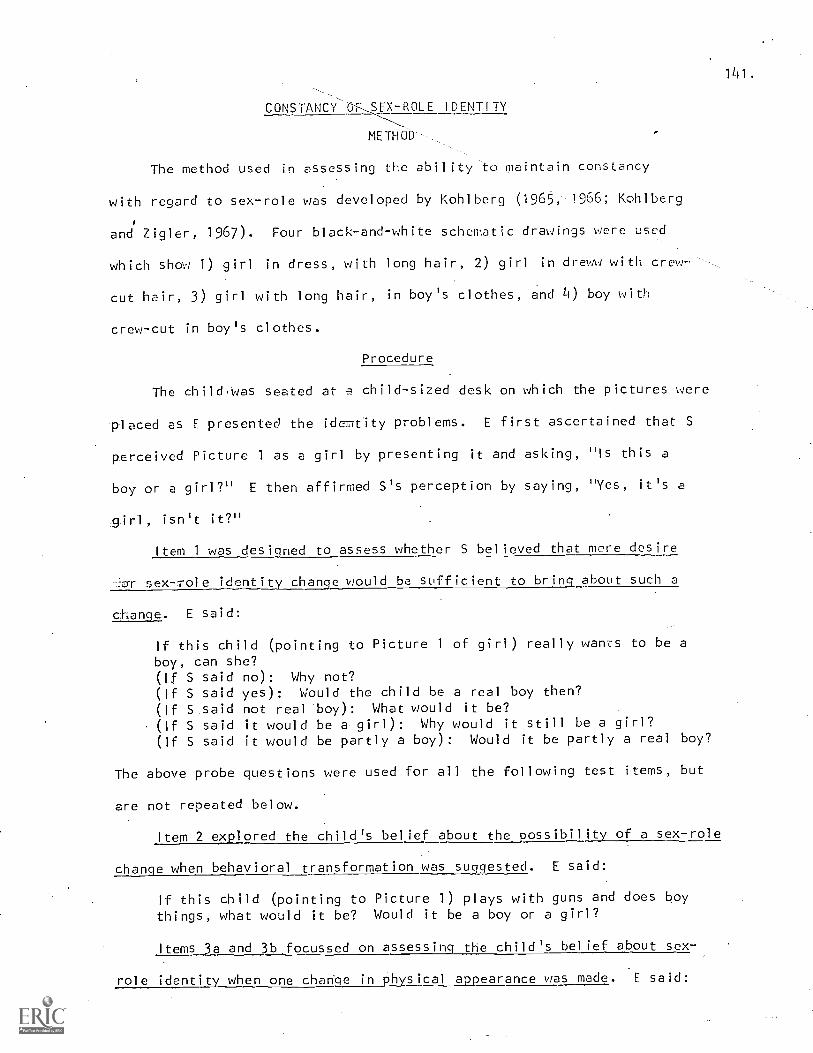
141.
CONSTANCY O'F,SE:ROLE IDENTITY
METHOD
The method used in assessing the ability to maintain constancy
with regard to sex-role was developed by Kohlberg (1965, 1966; Kohlberg
and Zigler, 1967). Four black-and-white schematic drawings were used
which show 1) girl in dress, with long hair, 2) girl in drew with crew-
cut hair, 3) girl with long hair, in boy's clothes, and 4) boy with
crew-cut in boy's clothes.
Procedure
The child was seated at a child-sized desk on which the pictures were
placed as E presented the identity problems. E first ascertained that S
perceived Picture 1 as a girl by presenting it and asking, "Is this a
boy or a girl?" E then affirmed S's perception by saying, "Yes, it's a
girl, isn't it?"
Item 1 was designed to assess whether S believed that mere desire
-77r sex-role identity change would be sufficient to bring about such a
change. E said:
If this child (pointing to Picture 1 of girl) really wants to be a
boy, can she?(If S said no): Why not?(If S said yes): Would the child be a real boy then?
(If S said not real boy): What would it be?
(If S said it would be a girl): Why would it still be a girl?
(If S said it would be partly a boy): Would it be partly a real boy?
The above probe questions were used for all the following test items, but
are not repeated below.
Item 2 explored the child's belief about the possibility of a sex-role
change when behavioral transformation was suggested. E said:
If this child (pointing to Picture 1) plays with guns and does boythings, what would it be? Would it be a boy or a girl?
Items 3a and 3b focussed on assessing the child's belief about sex
role identity when one change in physical appearance was made. E said:
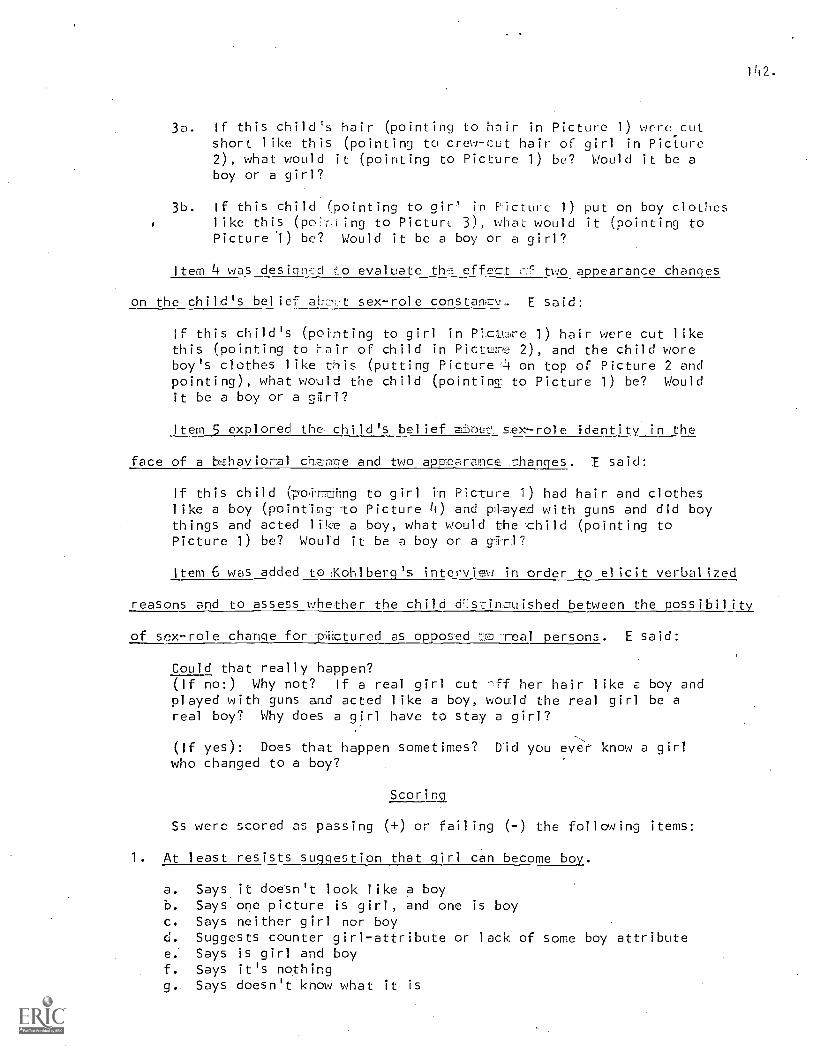
1 4 2 .
3a. If this child's hair (pointing to hair in Picture 1) were cutshort like this (pointing to crew-cut hair of girl in Picture2), what would it (pointing to Picture 1) be? Would it be aboy or a girl?
3b. If this child (pointing to girl in Picture 1) put on boy clotheslike this (por,Aing to Pictur ; 3), what would it (pointing toPicture .1) be? Would it be a boy or a girl?
Item 4 was desicind to evaluate the effect c:f two appearance changes
on the child's belief. abcN:t sex-role constancy,. E said:
If this child's (pointing to girl in Picture 1) hair were cut likethis (pointing to Hair of child in Picture 2), and the child woreboy's clothes like this (putting Picture L4 on top of Picture 2 andpointing), what would the child (pointing: to Picture 1) be? Wouldit be a boy or a gqr12
Item 5 explored the child's belief zbout': sex-role identity in the
face of a b-z.havioral ch-En-ne and two appearance 5hancies. I said:
If this child (poir7limg to girl in Picture 1) had hair and clotheslike a boy (pointing to Picture 4) and played with guns and did boythings and acted like a boy, what would the child (pointing toPicture 1) be? Would it be a boy or a girl?
Item 6 was added to Kohlberg's interview in order to elicit verbalized
reasons and to assess whether the child d'istincuished between the possibility
of sox -role change for pirctured as opposed r';o real persons. E said:
Could that really happen?(If no:) Why not? If a real girl cut -ff her hair like a boy andplayed with guns and acted like a boy, would the real girl be areal boy? Why does a girl have to stay a girl?
(If yes): Does that happen sometimes? Did you ever know a girlwho changed to a boy?
Scoripq
Ss were scored as passing ( +) or failing (-) the following items:
1. At least resists suggestion that girl can become boy.
a. Says it doesn't look like a boyb. Says one picture is girl, and one is boyc. Says neither girl nor boyd. Suggests counter girl-attribute or lack of some boy attributee. Says is girl and boyf. Says it's nothingg. Says doesn't know what it is
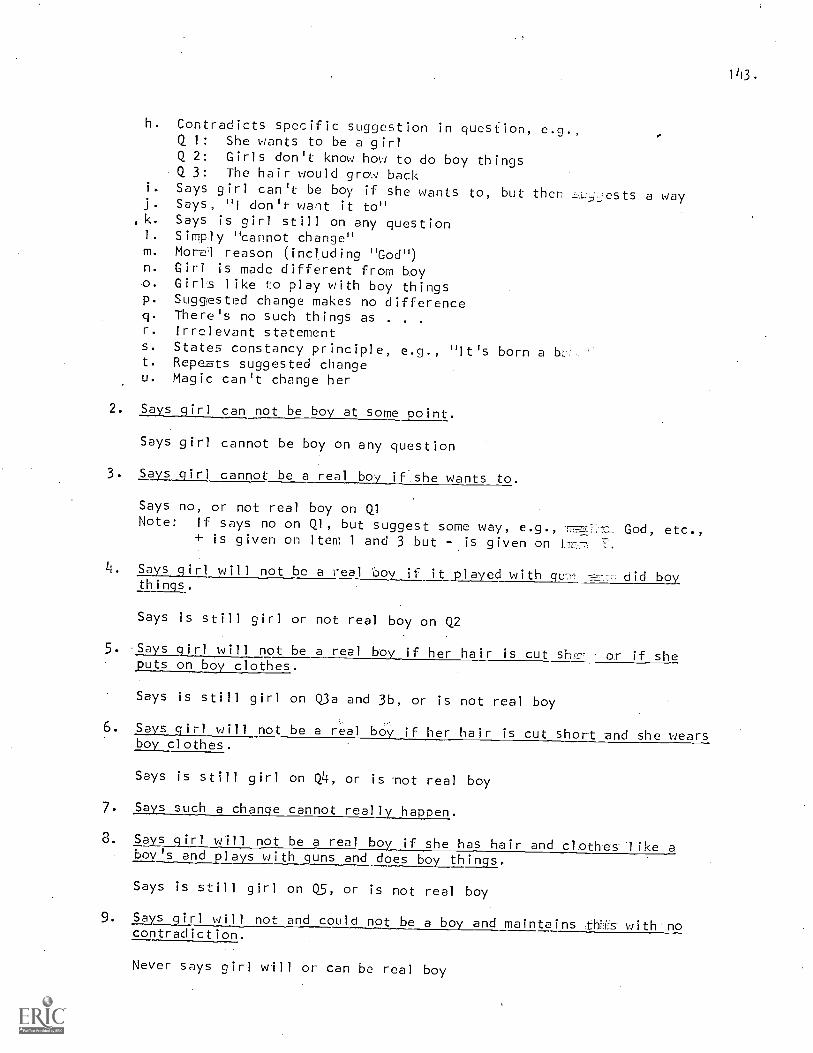
143.
h. Contradicts specific suggestion in question, e.g.,Q 1: She wants to be a girlQ 2: Girls don't know how to do boy thingsQ 3: The hair would grow back
i. Says girl can't be boy if she wants to, but then 3:12Jests a wayj. Says, "I don't want it to"k. Says is girl still on any question1. Simply "cannot change"m. Moral reason (including "God")n. Girl is made different from boyo. Girls like to play with boy thingsp. Suggested change makes no differenceq. There's no such things as . . .
r. Irrelevant statements. States constancy principle, e.g., "It's born a bet. Repeats suggested changeu. Magic can't change her
2. Says girl can not be boy at some_point.
Says girl cannot be boy on any question
3. ,Says girl cannot be areal boy if-she wants to.
Says no, or not real boy on QlNote: If says no on Ql, but suggest some way, e.g., al. God, etc.,
+ is given on Item 1 and 3 but - is given on
4. Says girl will not be a real boy if it played with qu did boythings.
Says is still girl or not real boy on Q2
5. .Says girl will not be a real boy if her hair is cut sf. or if sheputs on boy clothes.
Says is still girl on Oa and 3b, or is not real boy
6. Says girl will not be a real boy if her hair is cut short and she wearsboy clothes.
Says is still girl on Q4, or is -not real boy
7. Says such a change cannot really happen.
8. Says girl will not be a real boy if she has hair and clothes like aboy's and plays with guns and does boy things.
Says is still girl on Q5, or is not real boy
9. Says girl will not and could not be a boy and maintains this with.nocontradiction.
Never says girl will or can be real boy
In addition, verbal reasons were scored according to the same system
presented in the foregoing chapter on development of.generic identity.
Results
A scalogram analysis using Green's (1956) summary statistics was
performed (See Table 65) which indicated that the set of nine items presented
above forms a Guttman scale. Table 66 shows the median age and frequency
of bright, average, and retarded Ss who score at the ten scale levels.
Developmental Sequential ity of Acquisition
Several lines of evidence converge to suggest that the Guttman scale
describes a developmental sequence of acquisition:
1. The items are ordered in terms of increasing difficulty
Reproducibilities and indices of consistency shown in Table 65 indicate
that the items are increasingly difficult as one moves from one to eleven.
This order is the same for all IQ groups.
2. Increasing success on scale items tends to occur with increasing.
age and reflects the order of difficulty. Table 67 shows an increase in
mean level of performance from age five t0 age six, but not always an
increase from six to seven years. The analysis.of variance indicated the
age effect to be significant (F=4.14, .df=2, 86, p<.02 for bright and
average groups). Table 68 shows that older children tend to score at
higher levels than younger children, and Table 69 shows a general increase
in percentage of Ss succeeding on each scale item with increasing age,
though this is not so clear for average children.
3. Retesting of a small number of Ss after one year shows a general
progression along the scale. Table 70 presents scale scores of SS at
two points in time, separated by one year. Of the 19 Ss, 5 Ss scored at
the same level on both testings, 10 Ss scored at a higher level, and 4
Ss scored at a lower level on the second testing. While these apparent
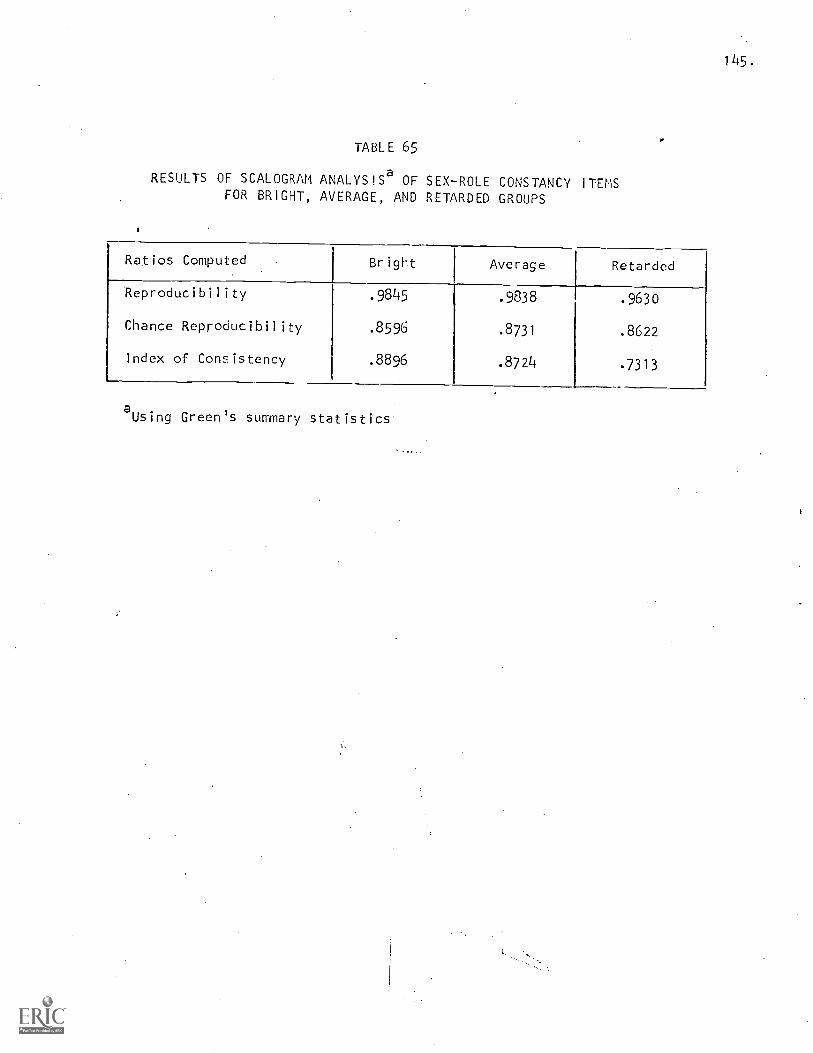
145.
TABLE 65
RESULTS OF SCALOGRAM ANALYSISa OF SEX-ROLE CONSTANCY ITEMSFOR BRIGHT, AVERAGE, AND RETARDED GROUPS
Ratios Computed Bright Average Retarded
Reproducibility .9845 .9838 .9630
Chance Reproducibility .8596 .8731 .8622
Index of Consistency .8896 .8724 .7313
aUsing Green's summary statistics
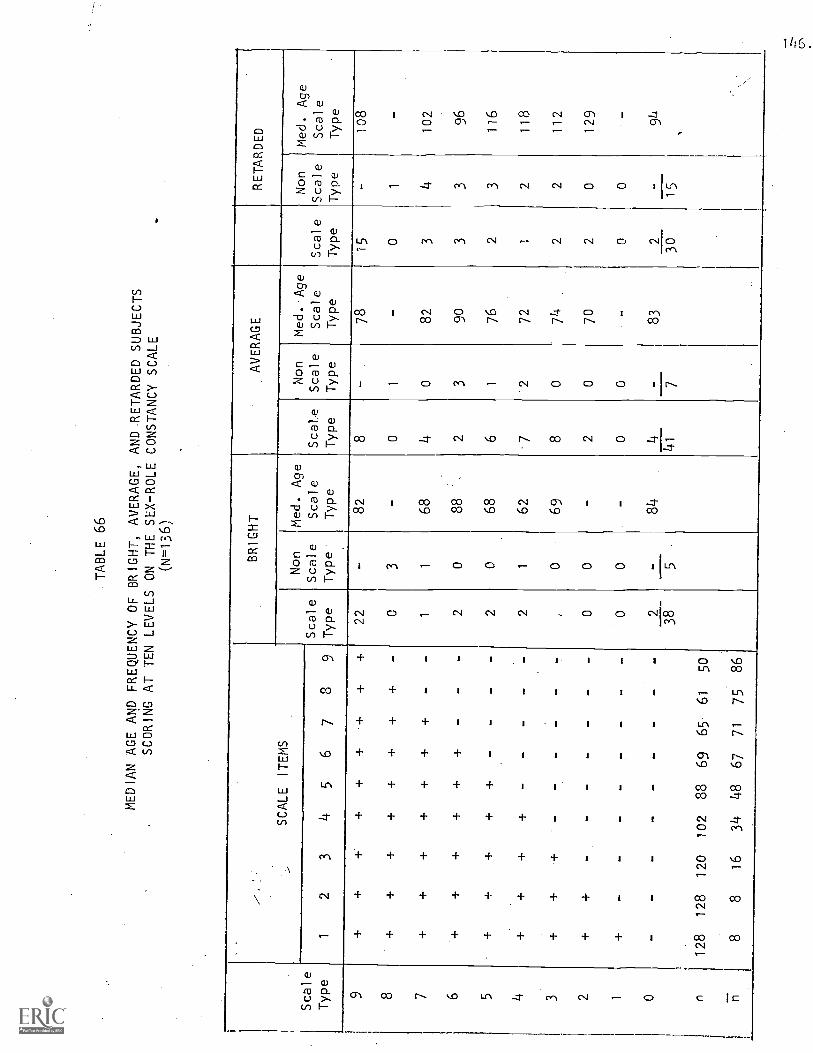
TABLE 66
MEDIAN AGE AND FREQUENCY OF BRIGHT,
AVERAGE, AND RETARDED SUBJECTS
SCORING AT TEN LEVELS ON THE SEX-ROLE CONSTANCY
SCALE
(N=136)
SCALE
ITEMS
BRIGHT
AVERAGE
RETARDED
Non
Med. Age
Non
Med. Age
Non
Med. Age
Scale
Scale
Scale
Scale
Scale
Scale
Scale
Scale
Scale
Scale
Type
12
34
56
78
9Type
Type
Type
Type
Type
Type
Type
Type
Type
9+
++
++
+.+
+22
-82
8-
78
r15
-108
8+
++
++
++
+0
3-
01
-0
1-
7+
++
++
++
-1
168
4O
82
34
102
6+
++
++
--
20
88
23
90
33
96
5+
++
++
--
-2
068
61
76
23
116
4+
++
+-
--
-2
162
-7
272
12
118
3+
++
--
--
069
80
74
22
112
2+
+-
--
--
00
-2
070
20
129
10
-0
0-
00
-
0-
--
--
--
-2
-84
4-
83
294
41
730
15
387
n128
128
120
102
88
69
65,
61
50
_ n8
816
34
48
67
71
75
86
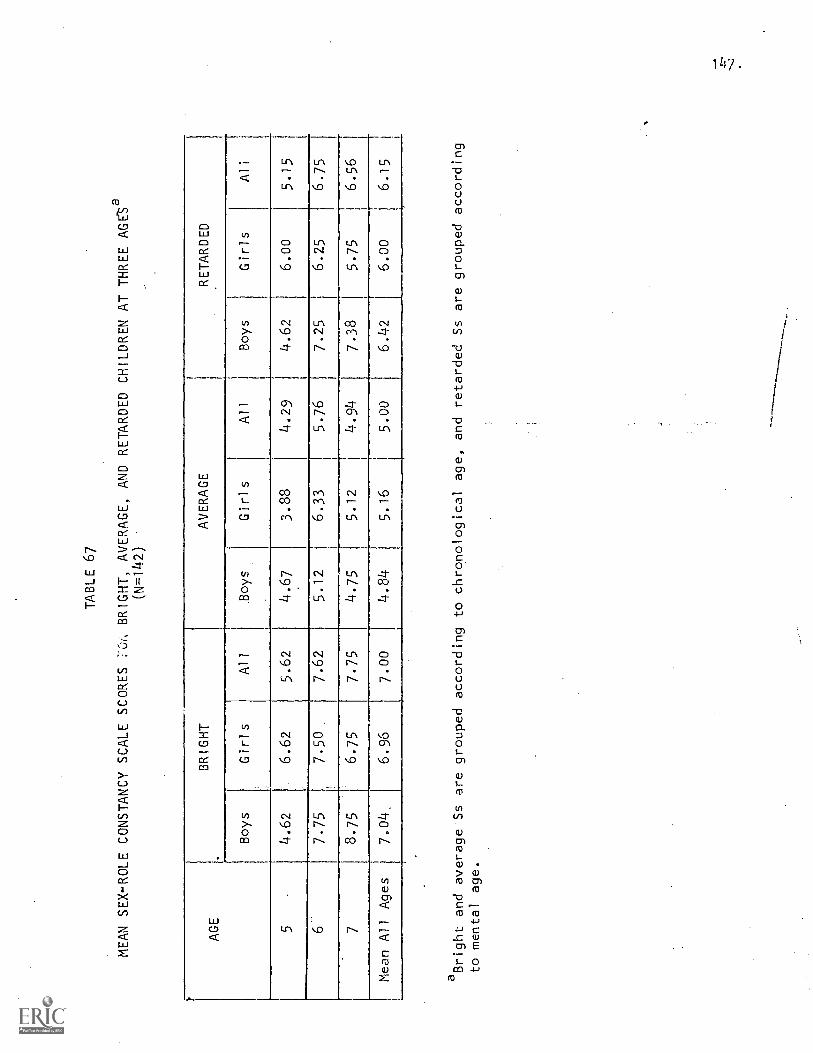
TABLE 67
MEAN SEX-ROLE CONSTANCY SCALE SCORES
BRIGHT, AVERAGE, AND RETARDED CHILDREN AT THREE AGe
(N=142)
AGE
BRIGHT
.
AVERAGE
RETARDED
Boys
Girls
All
Boys
Girls
All
Boys
Girls
All
54.62
6.62
5.62
4.67
3.88
4.29
4.62
6.00
5.15
67.75
7.50
7.62
5.12
6.33
5.76
7.25
6.25
6.75
78.75
6.75
7.75
4.75
5.12
4.94
7.38
5.75
6.56
Mean All Ages
7.04
6.96
7.00
4.84
5.16
5.00
6.42
6.00
6.15
aBright and average Ss are grouped according to chronological age, and retarded Ss are grouped according
to mental age.
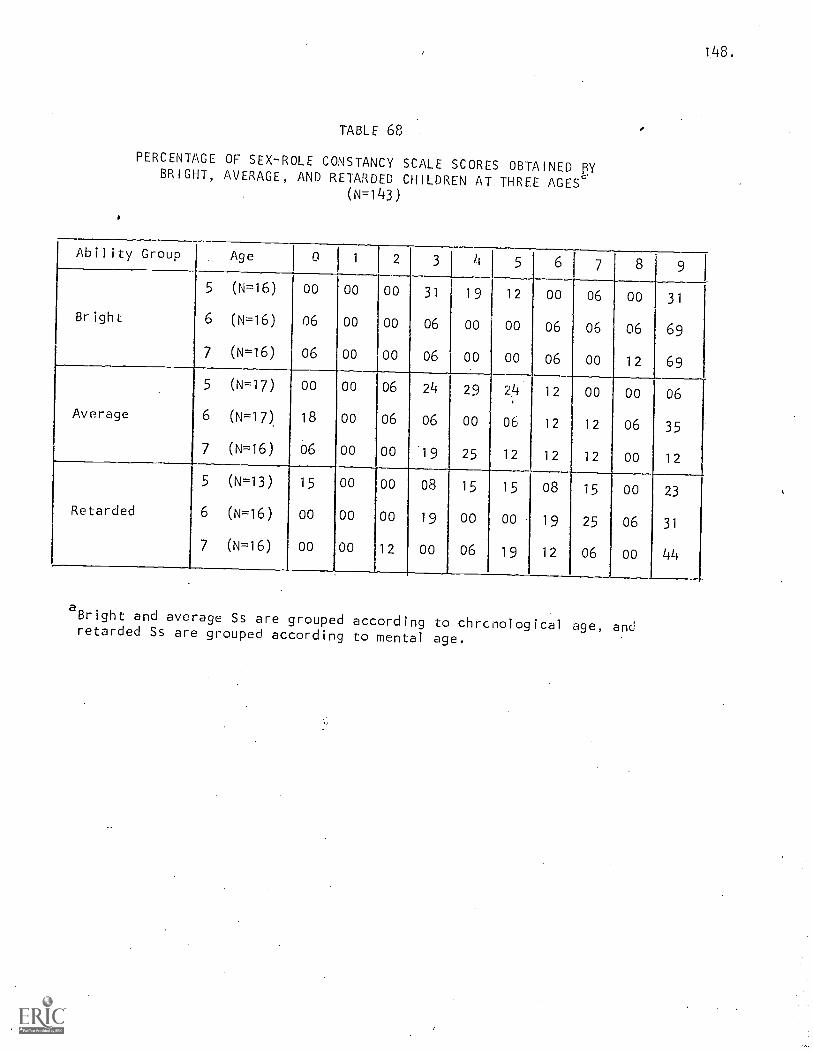
14S.
TABLE 68
PERCENTAGE OF SEX-ROLE CONSTANCY SCALE SCORES OBTAINED IYBRIGHT, AVERAGE, AND RETARDED CHILDREN AT THREE AGESC
(N=143)
Ability Group I. Age 0 2 3 4 5 6 7 8 9 1
5 (N=16) 00 00 00 31 19 12 00 06 00 31
Bright 6 (N=16) 06 00 00 06 00 00 06 06 06 69
7 (N=16) 06 00 00 06 00 00 06 00 12 69
5 (N=17) 00 00 06 24 29 24 12 00 00 06
Average 6 (N=17) 18 00 06 06 00 06 12 12 06 35
7 (N=16) 06 00 00 19 25 12 12 12 00 12
5 (N=13) 15 00 00 08 15 15 08 15 00 23
Retarded 6 (N=16) 00 00 00 19 00 00 19 25 06 31
7 (N=16) 00 00 12 00 06 19 12 06 00 44
aBright and average Ss are grouped according to chrcnological age, andretarded Ss are grouped according to mental age.
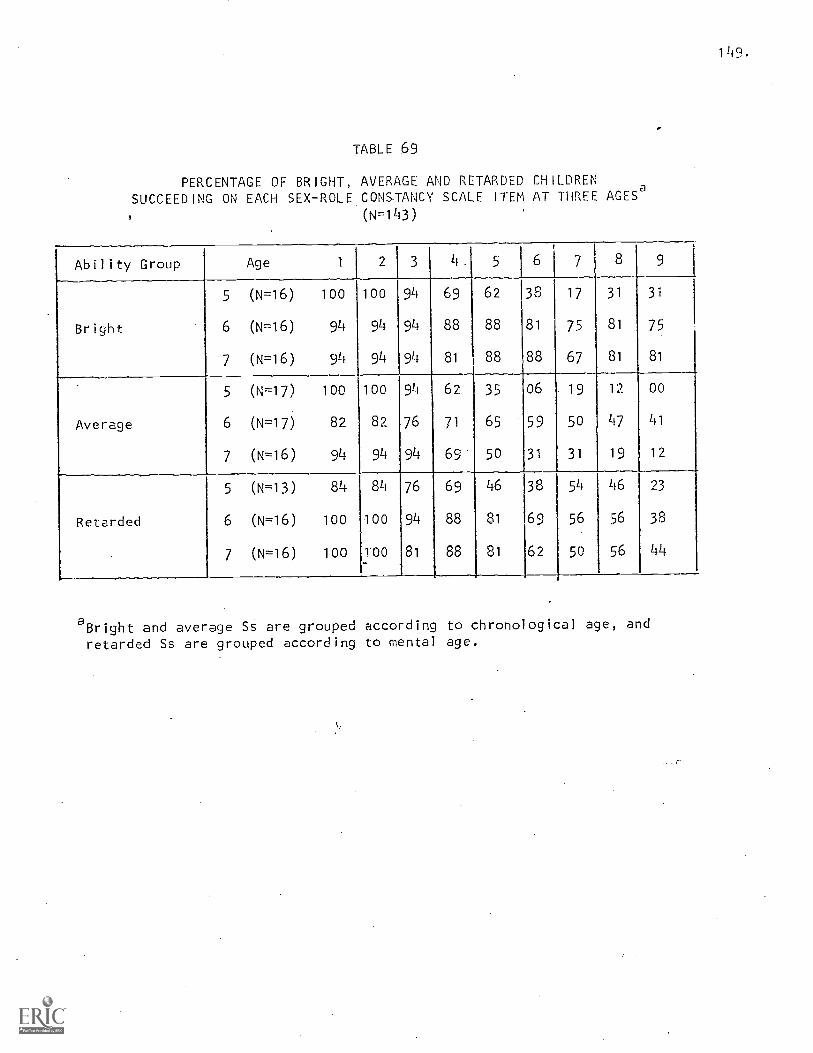
149.
TABLE 69
PERCENTAGE OF BRIGHT, AVERAGE AND RETARDED CHILDRENSUCCEEDING ON EACH SEX-ROLE CONSTANCY SCALE ITEM AT THREE AGESa
(N=143)
Ability Group Age 1 2 3 4. 5 6 7 8
5 (N=16) 100 100 94 69 62 38 17 31 31
Bright 6 (N=16) 94 94 94 88 88 81 75 81 75
7 (N=16) 94 94 94 81 88 88 67 81 81
5 (N=17) 100 100 94 62 35 06 19 12 00
Average 6 (N=17) 82 82 76 71 65 59 50 47 41
7 (N=16) 94 94 94 69' 50 31 31 19 12
5 (N=13) 84 84 76 69 46 38 54 46 23
Retarded 6 (N=16) 100 100 94 88 81 69 56 56 38
7 (N=16) 100 TOO 81 88 81 62 50 56 44
a Bright and average Ss are grouped according to chronological age, and
retarded Ss are grouped according to mental age.
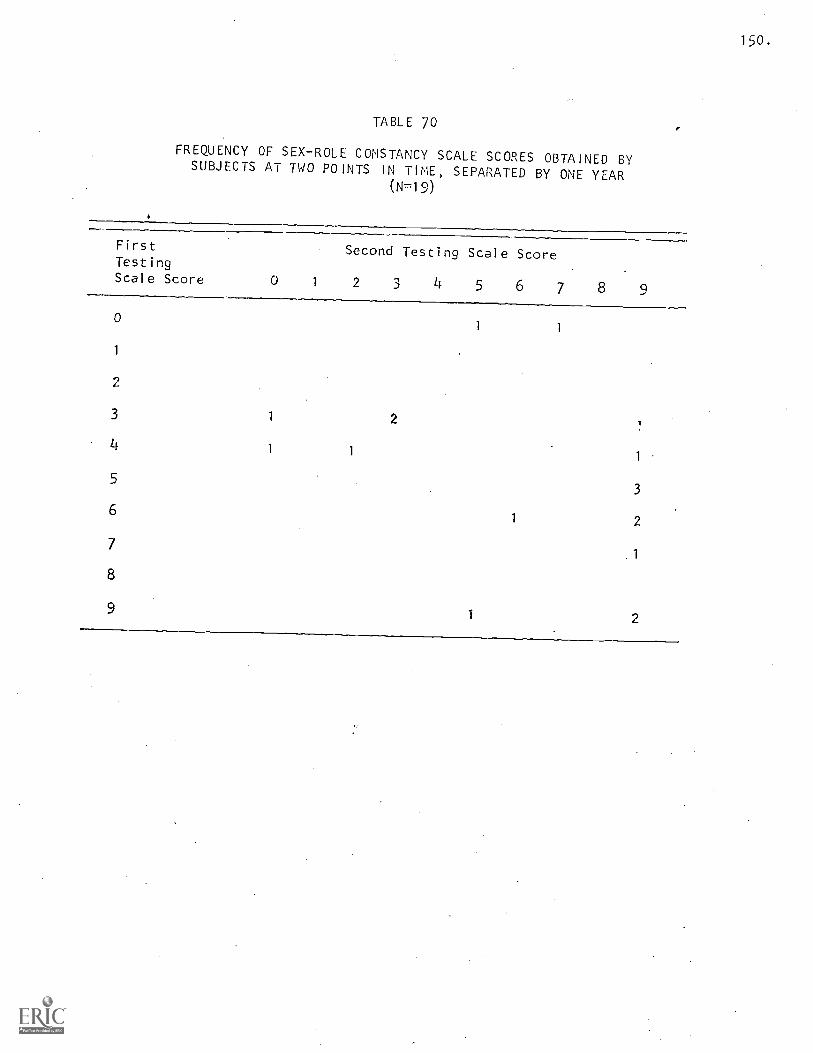
150.
TABLE 70
FREQUENCY OF SEX-ROLE CONSTANCY SCALE SCORES OBTAINED BYSUBJECTS AT TWO POINTS IN TIME, SEPARATED BY ONE YEAR
(N=19)
First
TestingScale Score 0 1
Second Testing Scale Score
2 3 4 5 6 7 8 9
01 1
1
2
3 1 2
41 1
1
53
61 2
7
8
91 2
151.
regressions are troublesome and require further investigation, the scale
does account for performance change for most Ss.
Effect of Intelligence on Performance
/Table 67 indicated a higher level of performance for bright children,
and the analysis of variance showed this difference to be statistically
significant (F=14.56, df=1, 86, p< .0003 for bright and average groups).
However, Table 67 also shows a higher level of performance for retarded
children than average children, and this difference is also statistically
significant (F=4.65, df=1, 83, p < .03).
Effect of Sex on Perfnrmance
The performance of boys does not differ significantly from that of
girls, although the interaction among sex, age, and IQ for bright and
average children approaches significance (F=2.32, df=2, 86, p < .10) .
Bright girls perfo,-m better than boys at age five, but worse than boys
by age seven, whereas the reverse trend is the case for average children.
Average girls do worse than boys at age five and better than boys at ages
six and seven.
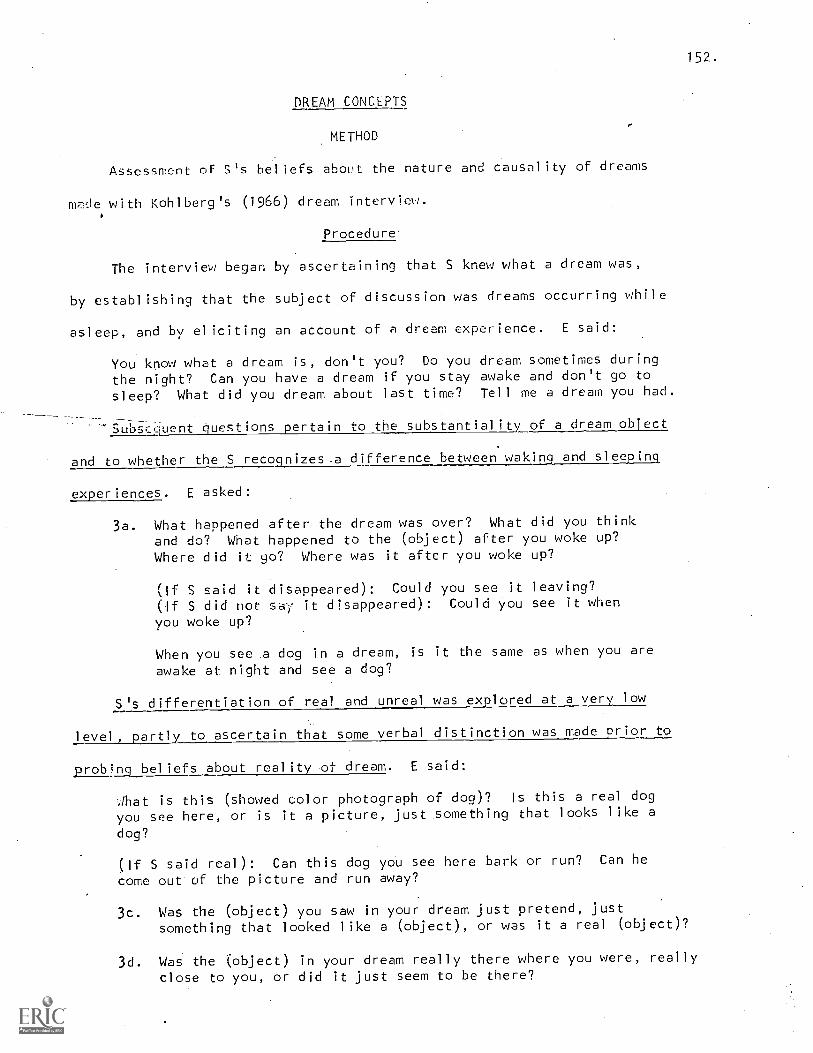
152.
DREAM CONCEPTS
METHOD
Assessment of S's beliefs about the nature and causality of dreams
mrie with Kohlberg's (1966) dream interview.
Procedure
The interview began by ascertaining that S knew what a dream was,
by establishing that the subject of discussion was dreams occurring while
asleep, and by el iciting an account of a dream experience. E said:
You know what a dream is, don't you? Do you dream sometimes during
the night? Can you have a dream if you stay awake and don't go to
sleep? What did you dream about last time? Tell me a dream you had.
"Subsequent questions pertain to the substantiality of a dream object
and to whether the S recognizes.a difference between waking and sleeping
experiences. E asked:
3a. What happened after the dream was over? What did you think
and do? What happened to the (object) after you woke up?Where did it go? Where was it after you woke up?
(if S said it disappeared): Could you see it leaving?
S did not say it disappeared): Could you see it when
you woke up?
When you see .a dog in a dream, is it the same as when you are
awake at night and see a dog?
S's differentiation of real and unreal was explored at a very low
level, partly to ascertain that some verbal distinction was made prior to
probing beliefs about reality of dream. E said:
:That is this (showed color photograph of dog)? Is this a real dog
you see here, or is it a picture, just something that looks like a
dog?
(If S said real): Can this dog yoU see here bark or run? Can he
come out of the picture and run away?
3c. Was the (object) you saw in your dream just pretend, just
something that looked like a (object), or was it a real (object)?
3d. Was the (object) in your dream really there where you were, really
close to you, or did it just seem to be there?
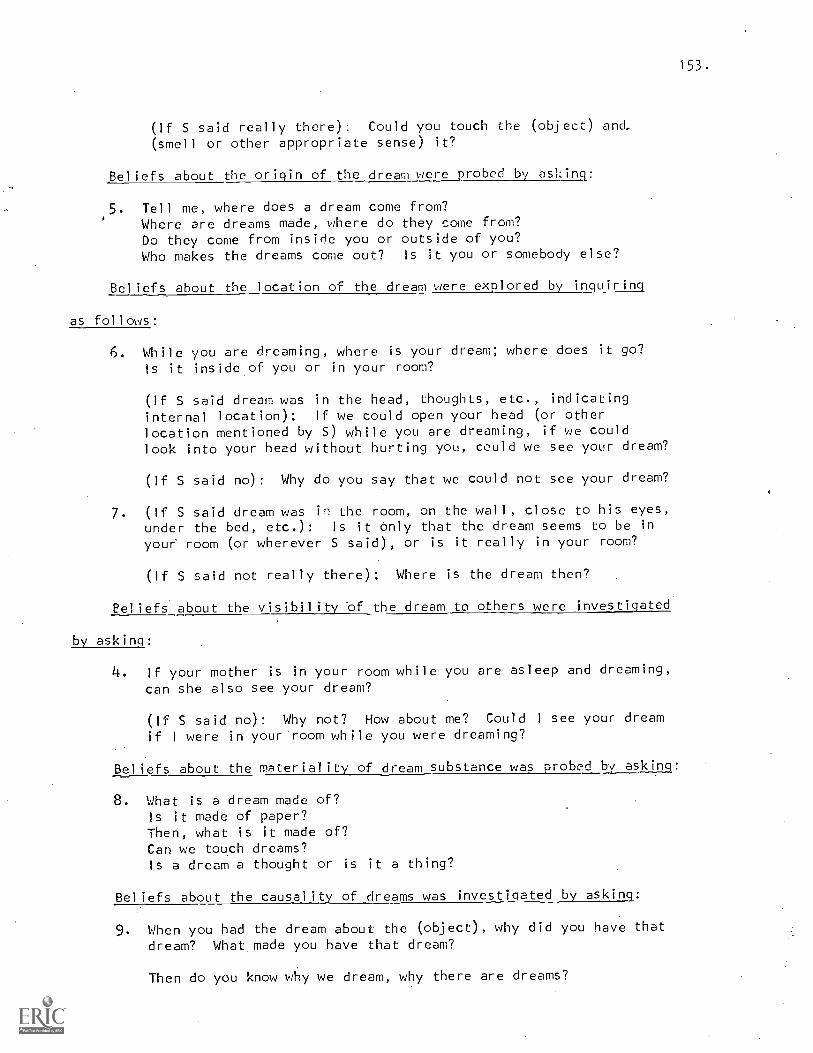
153.
(If S said really there): Could you touch the (object) and(smell or other appropriate sense) it?
Beliefs about the origin of the dream were probed by asking:
5. Tell me, where does a dream come from?Where are dreams made, where do they come from?Do they come from inside you or outside of you?Who makes the dreams come out?. Is it you or somebody else?
Beliefs about the location of the dream were explored by inquiring
as follows:
6. While you are dreaming, where is your dream; where does it go?
Is it inside of you or in your room?
(If S said dream was in the head, thoughts, etc., indicatinginternal location): If we could open your head (or otherlocation mentioned by 5) while you are dreaming, if we couldlook into your head without hurting you, could we see your dream?
(If S said no): Why do you say that we could not see your dream?
7. (If S said dream was in the room, on the wall, close to his eyes,under the bed, etc.): Is it only that the dream seems to be in
your room (or wherever S said), or is it really in your room?
(If S said not really there): Where is the dream then?
Beliefs about the visibility of the dream to others were investigated
by asking:
4. If your mother is in your room while you are asleep and dreaming,can she also see your dream?
(If S said no): Why not? How about me? Could I see your dream
if I were in your room while you were dreaming?
Beliefs about the materiality of dream substance was probed by asking:
8. What is a dream made of?
Is it made of paper?Then, what is it made of?Can we touch dreams?Is a dream a thought or is it a thing?
Beliefs about the causality of dreams was investigated by asking:
9. When you had the dream about the (object), why did you have thatdream? What made you have that dream?
Then do you know why we dream, why there are dreams?
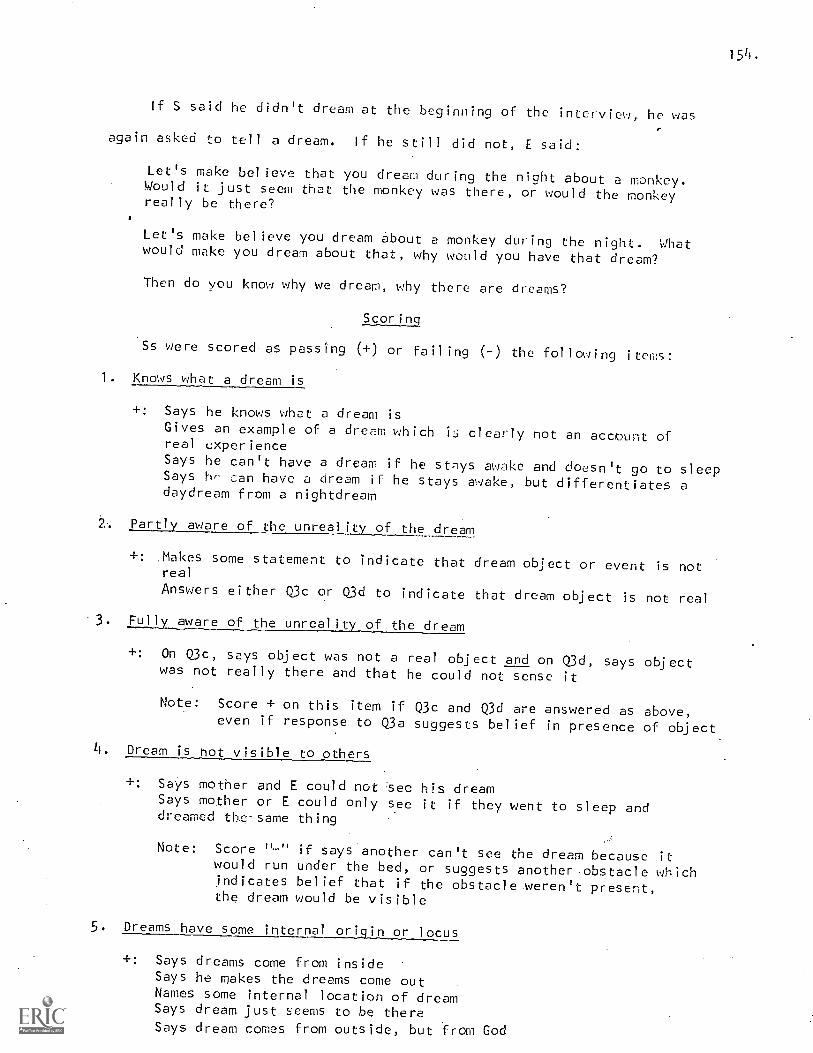
154.
If S said he didn't dream at the beginning of the interview, he was
again asked to tell a dream. If he still did not, E said:
Let's make believe that you dream during the night about a monkey.Would it just seem that the monkey was there, or would the monkeyreally be there?
Let's make believe you dream about a monkey during the night. Whatwould make you dream about that, why would you have that dream?
Then do you know why we dream, why there are dreams?
Scoring
Ss were scored as passing (+) or failing (-) the following items:
1. Knows what a dream is
+: Says he knows what a dream isGives an example of a dream which is clearly not an account ofreal experienceSays he can't have a dream if he stays awake and doesn't go to sleepSays he can have a dream if he stays awake, but differentiates adaydream from a nightdream
Partly aware of the unreality of the dream
+: .Makes some statement to indicate that dream object or event is notreal
Answers either Q3c or Q3d to indicate that dream object is not real
3. Fully aware of the unreality of the dream
+: On Q3c, says object was not a real object and on Q3d, says objectwas not really there and that he could not sense it
Note: Score + on this item if Q3c and Q3d are answered as above,even if response to Q3a suggests belief in presence of object
4. Dream is not visible to others
+: Says mother and E could not see his dreamSays mother or E could only see it if they went to sleep anddreamed the-same thing
Note: Score "U" if says another can't see the dream because itwould run under the bed, or suggests another obstacle whichindicates belief that if the obstacle weren't present,the dream would be visible
5. Dreams have some internal origin or locus
+: Says dreams come from insideSays he makes the dreams come outNames some internal location of dreamSays dream just seems to be there
Says dreaM comes from outside, but from God
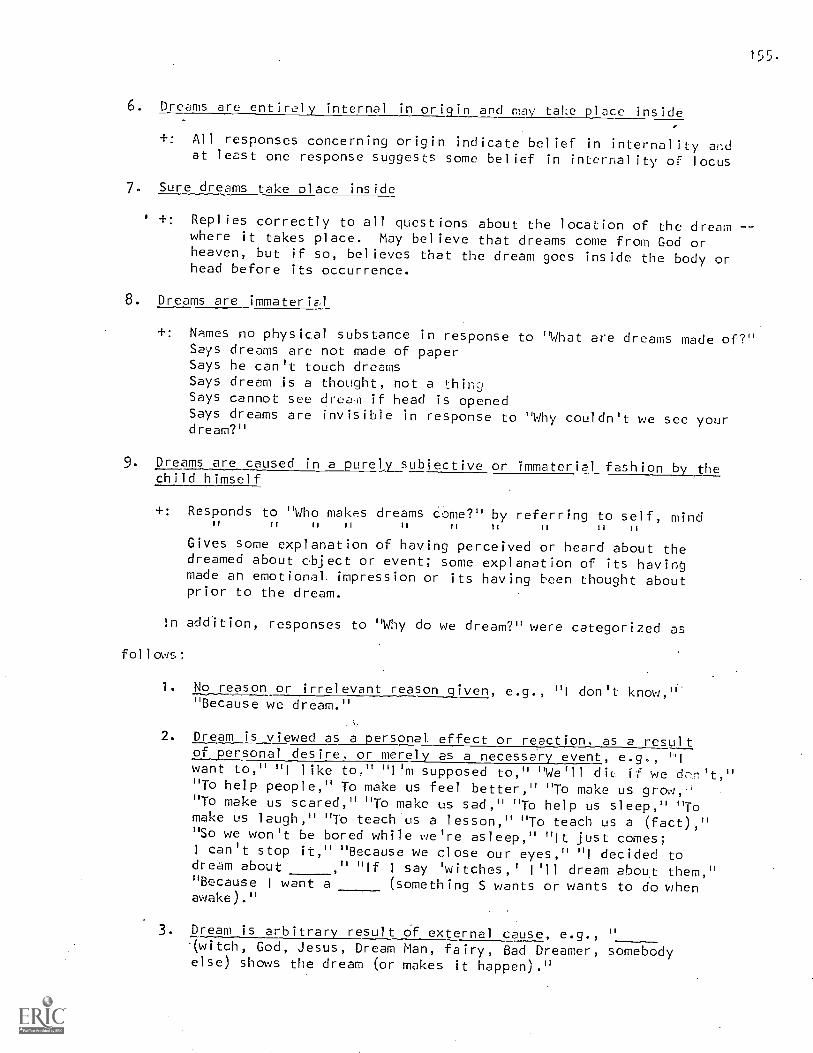
l5f. .
6. Dreams are entirely internal in oriqin and may take place inside
+: All responses concerning origin indicate belief in internality andat lust one response suggests some belief in internality of locus
7 Sure dreams take place inside
+: Replies correctly to all questions about the location of the dream--where it takes place. May believe that dreams come from God orheaven, but if so, believes that the dream goes inside the body orhead before its occurrence.
8. Dreams are immater il
+: Names no physical substance in response to "What are dreams made of ?"Says dreams are not made of paperSays he can't touch dreamsSays drum is a thought, not a thingSays cannot see dveaii if head is openedSays dreams are invisible in response to "Why couldn't we see yourdream ?"
9. Dreams are caused in a purely subjective or immaterial fashion by thechild himself
+: Responds to "Who makes dreams came ?" by referring to self, mind11 II II II tl 11 It II II II
Gives some explanation of having perceived or heard about thedreamed about abject or event; some explanation of its havinzjmade an emotional, impression or its having been thought aboutprior to the dream.
;n addition, responses to "Why do we dream ?" were categorized as
f o i l ows :
1. No reason or irrelevant reason given, e.g., "I don't know,""Because we dream."
2. Dream is viewed as a personal. effect or reaction, as a resultof personal desire, or merely as a necessary event, e.g., "Iwant to," "I like to," "I'm supposed to," "We'll dig if we"To help.people," To make us feel better," "To make u, grow,'''"To make .us scared," "To make us sad," "To help us sleep," "Tomake us laugh," "To teach us a lesson," "To teach us a (fact),""So we won't be bored while we're asleep," "It just comes;I can't stop it," "Because we close our eyes," "I decided todream about ," "If I say 'witches,' I'll dream about them,""Because I want a (something S wants or wants to do whenawake),"
3 Dream is arbitrary result of external cause, e.g., "(witch, God, Jesus, Dream Man, fairy, Bad Dreamer, somebodyelse) shows the dream (or makes it happen)."
156.
4. Dream is direct result of specific experience or thought occurring
when awake, e.g., "I was thinking about it befcre I went to sleep,"
Idid that and then thought about it later," "I saw it on TV and
then dreamed about it."
.5. Dream is indirect result of specific experience, "I ate
to much before going to bed," "There was a storm," "I stayed
up too late."
6. Dream.is self caused, e.g., "It's just imagination." "It's thinking,"
"it's my mind."
A scdogran , u=1-A Green's (1950 summary statistics was
perFormed (See Table 71) which indicated that the set of nine items presented
above forms a Guttman scale. Table 72 shows the median age and frequency
of bright, average, and retarded Ss who score at the ten scale levels.
Developmental Sequentiality of Acquisition
Several lines of evidence converge to suggest that the Guttman scale
describes a developmentalsequence of acquisition:
1. The items are ordered in terms of increasing difficulty.
Reproducibilities and indices of consistency shown in Table 71 indicate
that the items are increasingly difficult as one moves from one to nine.
This order is the same for all IQ groups.
2. Increasing success on scale items tends to occur with increasing
age and reflects the (-rde; of difficulty. Table 73 shows an increase in
mean level of performance with increasing age, and the analysis of variance
indicates that age is a statistically significant factor affecting performance
(F=13.30, df=2, 85, p< .0001 for bright and average children). Table 74
shows that older children tend to score at higher levels than do younger
children, and Table 75 shows an increase in percentage of Ss succeeding
on each scale item with increasing age.
3. Retesting of a small number of Ss after one year shows a general
progression along the scale. Table 76 presents scale scores of Ss at two
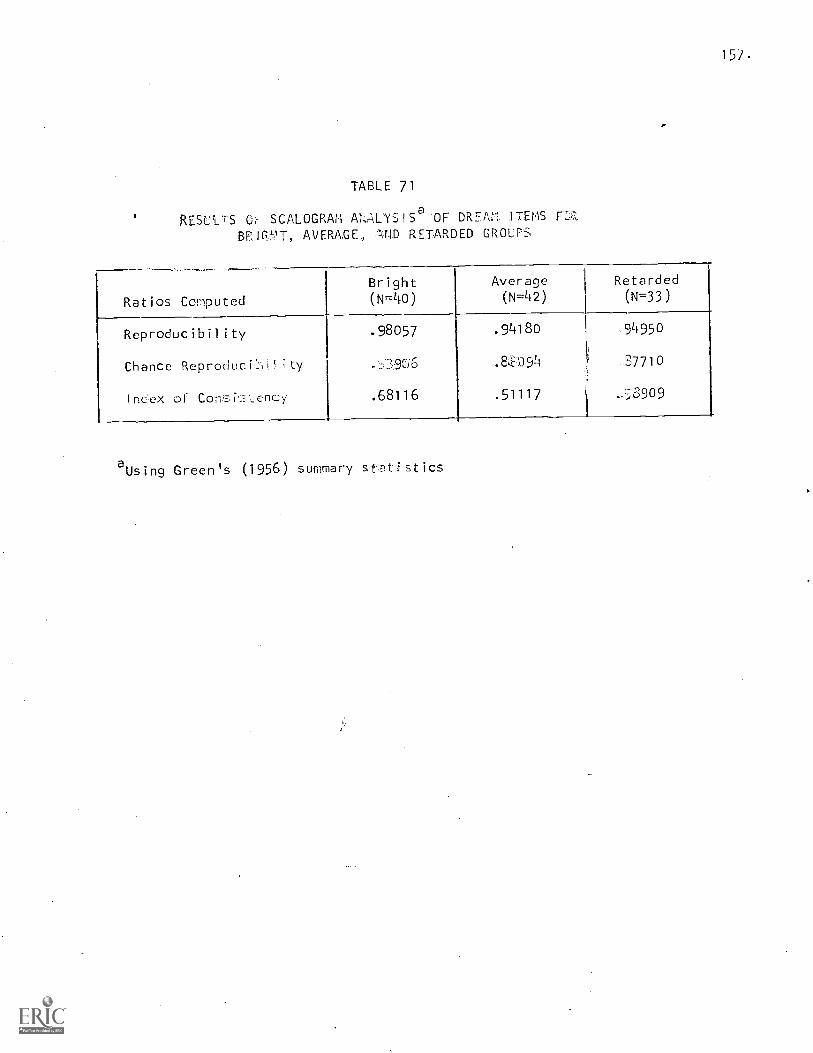
15).
TABLE 71
RESULTS G SCALOGRAM ANAnSISa OF DRAY. ITEMS F:aBRIT, AVERAGE, AND RETARDED GROUPS,
Bright Average Retarded
Ratios Computed (N=40) (N=42) (N=33)
Reproducibility .98057 .9418o ,94950
Chance Reproduci ItY .-j-39C16 .8ifL,;p94 37710
In6ex of Consency .68116 .51117 -53909
aUsing Green's (1956) summary st,attstics
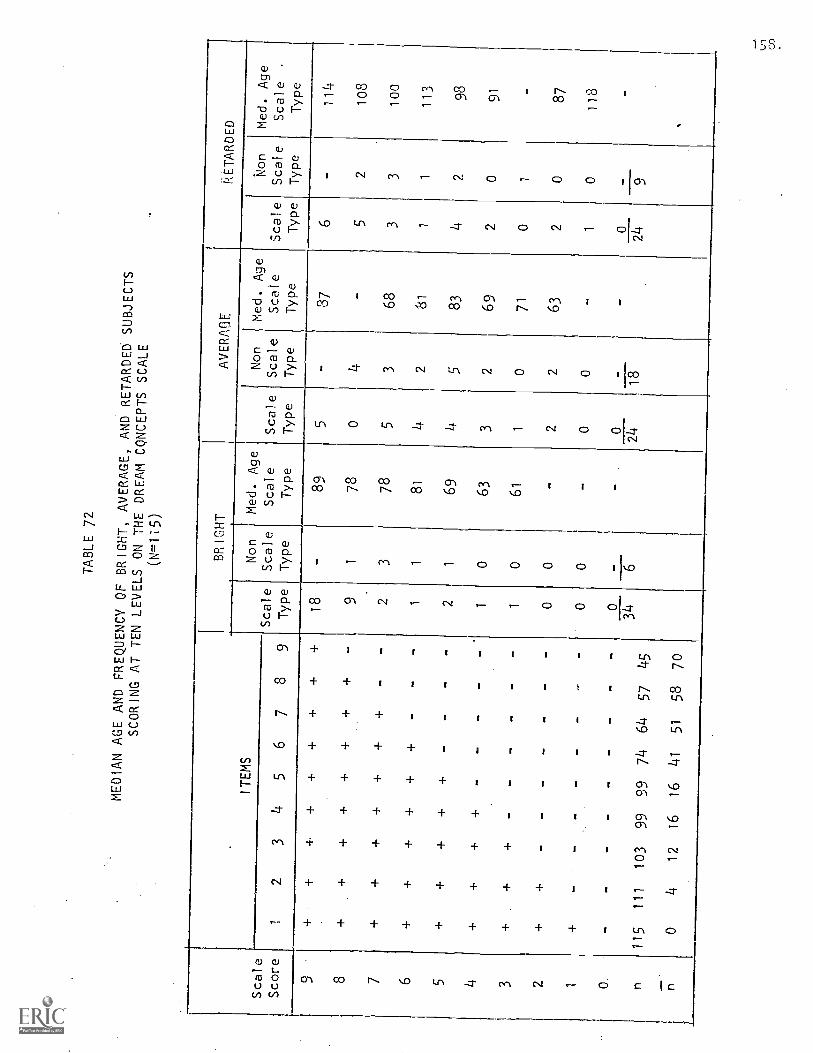
TABLE 72
MEDIAN AGE AND FREQUENCY
OF BRIGHT, AVERAGE,
AND RETARDED SUBJECTS
SCORING AT TEN LEVELS ON
THE DREAM CQNCEPTS
SCALE
(N=115)
Scale
Score
ITEMS
BRIGHT
AVERAOE
RETARDED
Scale
Type
Non
Scale
Type
Med. Age
Scale
Type
Scale
Type
Non
Scale
Type
Med. Age
Scale
Type
Scale
Type
Non
Scale
Type
Med. Age
Scale
Type
12
34
56
78
9
9-
++
4+
++
++
+18
-89
5-
87
6-
114
8+
++
++
++
+-
91
78
04
-5
2108
7+
++
++
++
--
23
78
53
68
33
100
6+
++
++
+-
--
11
81
42
81
11
113
5+
++
++
--
--
21
69
4r ,
83
42
98
4+
++
+-
--
--
10
63
32
69
20
91
3+
++
--
--
--
10
61
10
71
01
-
2+
--
--
--
-0
0-
22
63
20
87
00
-0
0-
10
118
0-
--
--
--
--
0-
0-
0-
34
624
18
24
9n
115
111
103
99
99
74
64
57
45
.n
04
12
16
16
41
51
58
70
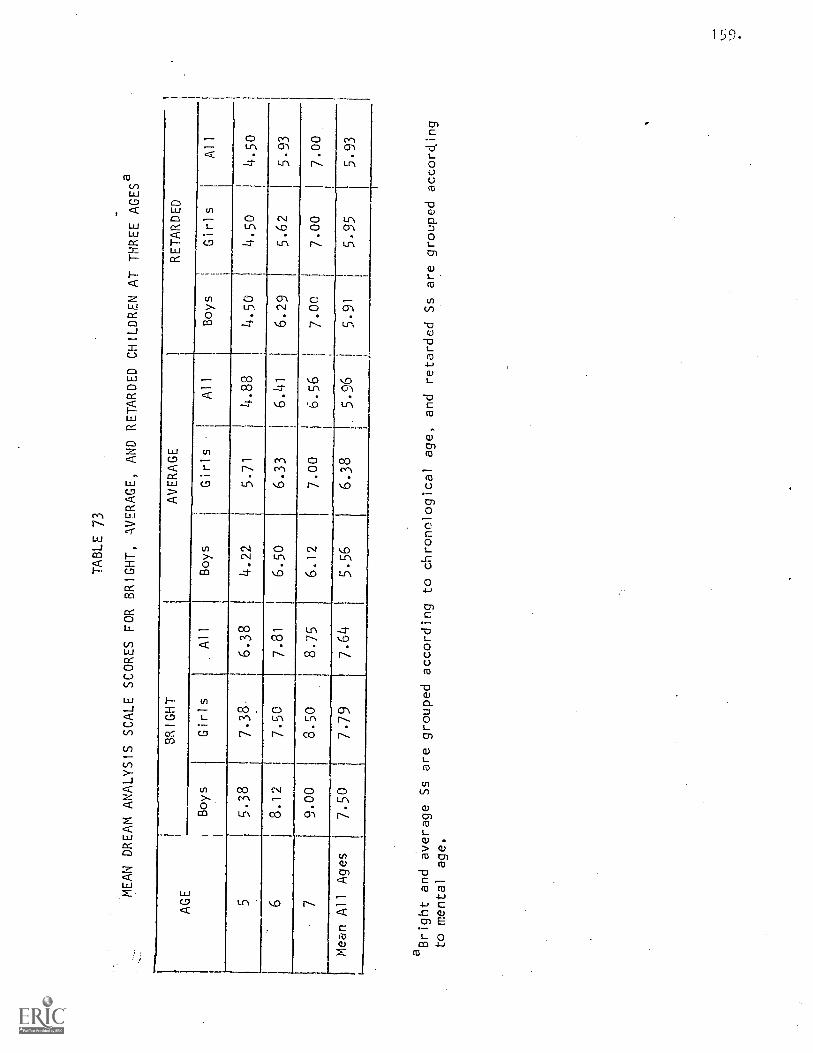
TABLE 73
MEAN DREAM ANALYSIS SCALE SCORES FOR BRIGHT, AVERAGE, AND
RETARDED CHILDREN AT THREE AGESa
AGE
BRIGHT
AVERAGE
RETARDED
Boys
Girls
All
Boys
Girls
All
Boys
Girls
All
55.38
7.38.
6.38
4.22
5.71
i
4.88
4.5o
4.5o
4.5o
68.12
7.50
7.81
6.50
6.33
6.41
6.29
5.62
5.93
79.00
8.50
8.75
6.12
7.00
j6.56
7.00
j7.00
7.00
Mean All
Ages
7.50
7.79
7.64
5.56
6.38
5.96
5.91
5.95
5.93
aBright and average Ss are grouped according to chronological
age, and retarded Ss are grouped according
to mental age.
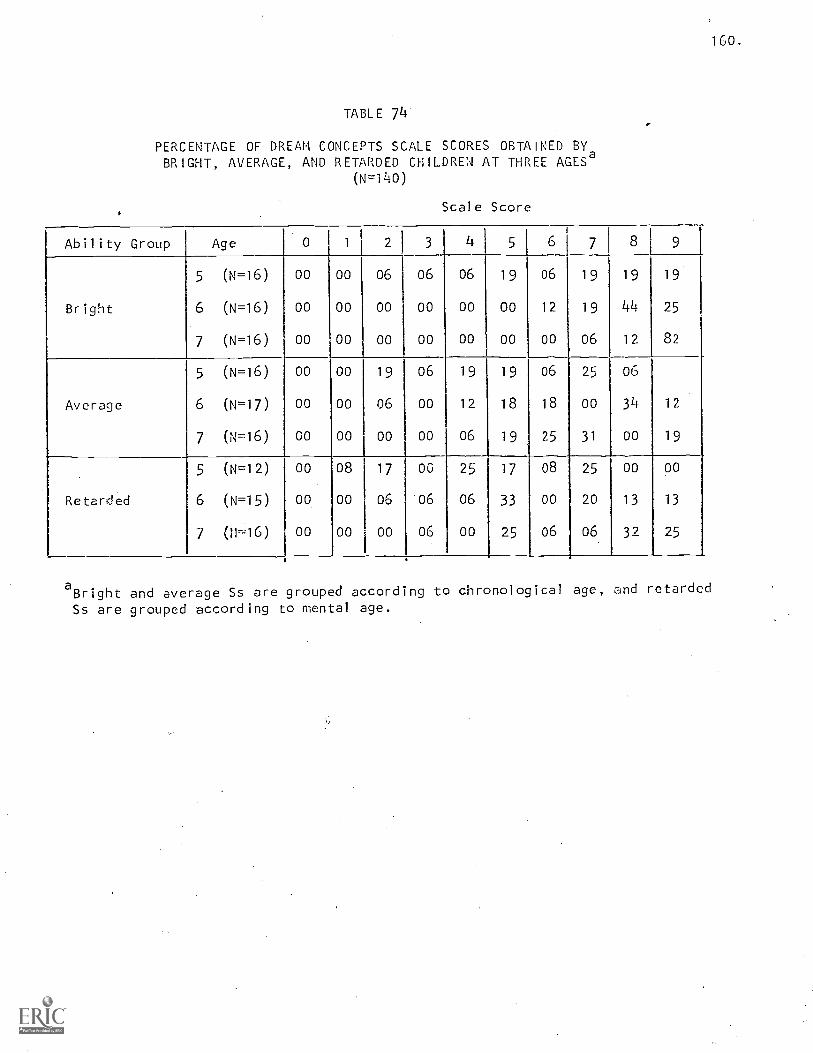
160.
TABLE 74
PERCENTAGE OF DREAM CONCEPTS SCALE SCORES OBTAINED BYBRIGHT, AVERAGE, AND RETARDED CHILDREN AT THREE AGES8
(N-140)
Scale Score
Ability Group Age 0 1 I 2 3 4 5 6 7 8 9
5 (N=16) 00 00 06 06 06 19 06 19 19 19
Bright 6 (N=16) 00 00 00 00 00 00 12 19 44 25
7 (N=16) 00 00 00 00 00 00 00 06 12 82
5 (N=16) 00 00 19 06 19 19 06 25 06
Average 6 (N=17) 00 00 06 00 12 18 18 00 34 12
7 (N=16) 00 00 00 00 06 19 25 31 00 19
5 (N=12) 00 08 17 00 25 17 08 25 00 00
Retarded 6 (N=15) 00 00 06 '06 06 33 00 20 13 13
7 (N=16) 00 00 00 06 00 25 06 06 32 25
aBright and average Ss are grouped according to chronological age, and retarded
Ss are grouped according to mental age.
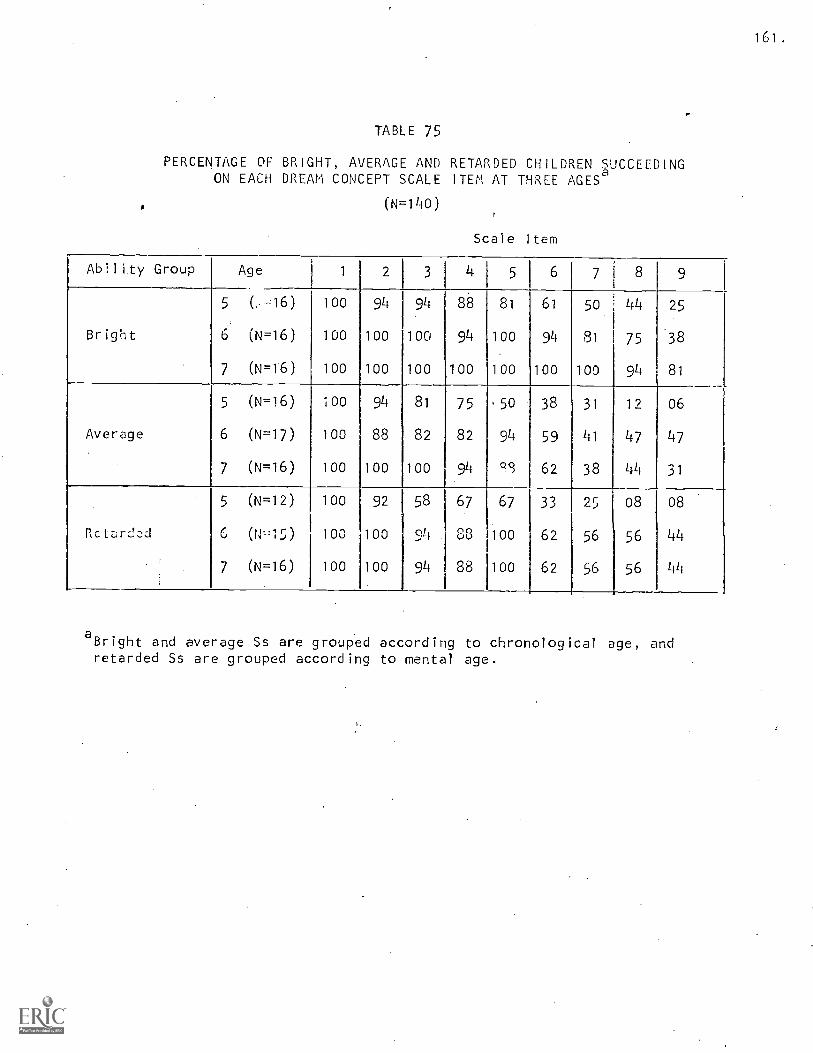
161.
TABLE 75
PERCENTAGE OF BRIGHT, AVERAGE AND RETARDED CHILDREN SUCCEEDINGON EACH DREAM CONCEPT SCALE ITEM AT THREE AGES`'
(N=140)
Scale Item
Ability Group Age 1 2 3 4 5 6 7 8 9
5 (...,16) 100 94 94 88 81 61 50 44 25
Bright 6 (N=16) 100 100 100 94 100 94 81 75 *38
7 (N=16) 100 100 100 100 100 100 100 94 81
5 (N=16) 100 94 81 75 '50 38 31 12 06
Average 6 (N=17) 100 88 82 82 94 59 41 47 47
7 (N=16) 100 100 100 94 q9 62 38 44 31
5 (N=12) 100 92 58 67 67 33 25 08 08
Rctc;rdcd 6 (W-,15) 100 100 94 88 100 62 56 56 44
7 (N=16) 100 100 94 88 100 62 56 56 44
aBright and average Ss are grouped according to chronological age, andretarded Ss are grouped according to mental age.
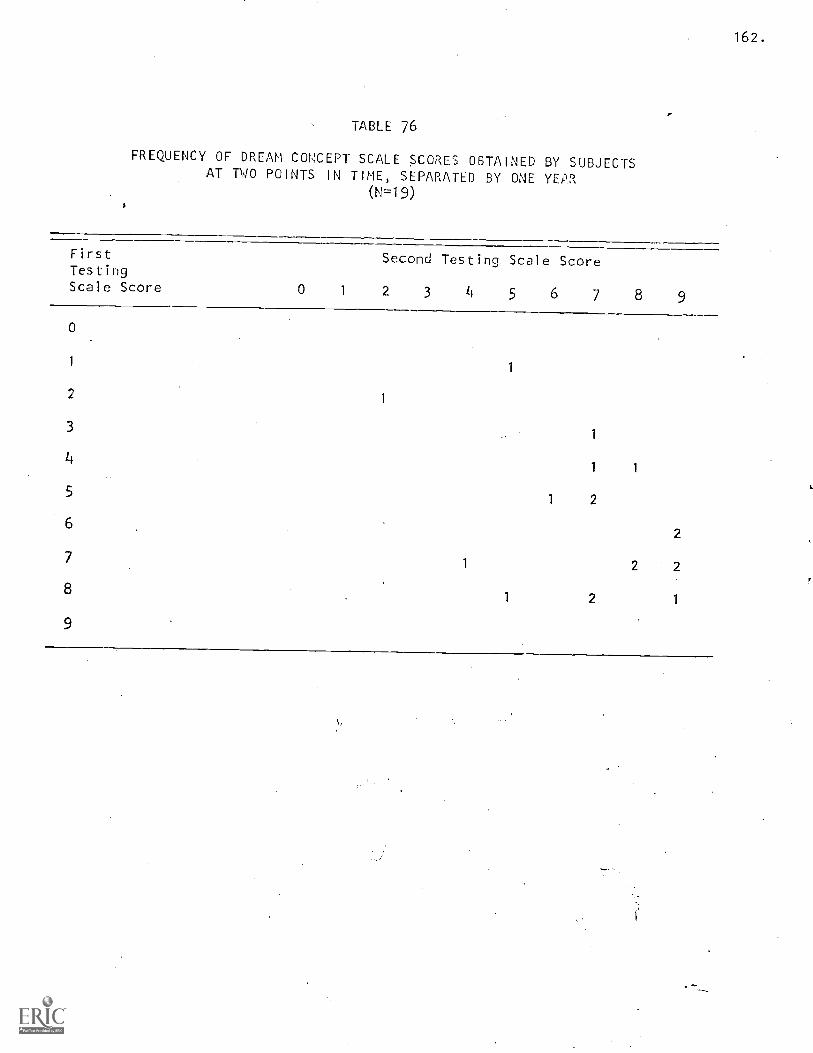
162.
TABLE 76
FREQUENCY OF DREAM CONCEPT SCALE SCORES OBTAINED BY SUBJECTSAT TWO POINTS IN TIME, SEPARATED BY ONE YEAR
(N=19)
FirstTestingScale Score
Second Testing Scale Score
0 1 2 3 4 5 6 7 8 9
0
1
1
21
31
41 1
51 2
62
71 2 2
81 2 1
9
163.
points in time, separated by one year. Of the 19 Ss, only 1 S scores
at the same level on both testings, 14 Ss perform at higher levels at the
second testing, and 4 Ss perform at lower levels. Thus, the scale does
account for performance change for most Ss.
Effect of Intelligence on Performance
Ta le 73 indicates that bright children perform at a higher level
than ave acje children, and the analysis of variance showed that the
different is statistically significant (r=26.62, df=1, 85, p (.0001 for
bright and average groups). However, average children do not differ
significan ly from retarded children of the same mental age in their
acquisition of mature concepts about dreams.
Effect of Sex on Performance
Table 73 shows that both average and bright girls are superior to
boys at age five and that the difference no only lessens at older ages,
but that by age seven, bright girls perform less well then boys. This
sex difference approaches significance (F=3.07, df=1, 85, p -08), and
the interaction of sex with age is statistically significant (F=3.71,
df=2, 85, p (.03).
CONSERVATION OF QUANTITY IN RING-SEGMENT ILLUSION
METHOD
The method used to assess conservation of quantity in an illusion
situation utilized ring-segment cookies which produced the jastrow effect.
Green, red, and blue cookies were 321-inches wide, and white cookies were
3-inches wide.
Procedure
A sheet of black formica (about 8" x 14") was placed on the desk
before the child. A pre-test item was included in order to measure
response latency in a situation likely to induce conflict. Two ring-
segment cookies, identical in size and color, were placed side by side
on the formica. E kept the cookies concealed until she completed the
following instruction:
I have two cookies here, and in a minute I'm going to let youpick the bigger one that has more to eat. But if you don't pickthe one that has more to eat, you won't get a cooky this time.You'll get another chance later. Now, look at them and point to theone that has more cooky to eat.
E Revealed cookies, allowed S to select the one he believed to be bigger,
and permitted S to take the cooky and put it in his paper sack.
A rediction uestion was included to ex lore S's ex ctanc of
constancy in the size relationship of two unequal cookies. E placed
one white and one green cooky on the desk, with the green cooky below in
the illusion position. (Note that the larger cooky was placed so that it
'appeared larger.) E said:
Here are two cookies. Look at them. Can you see that one isbigger and has more to eat than the other? When I say so, you maypick the one with more to eat. If you don't pick the one with moreto eat, you won't get a cooky this time. You'll y.t another chancelater. Now, before you pick,
I put them like this. (E placed3 x 5-inch card over cookies so that only about 4 -inch of the leftside of each cooky was visible and then slid the green cooky to thetop position.) Now, if you can show me the one with more to eat,you may have it.
165.
S was allowed to take the cooky he chose.
The firs.t test item was designed to assess E's conservation of
quantity in the context of the strong illusion of the Jastrow effect.
The problem presented to S was identical to that in the Prediction Question,
except that no care cover was used. After the child made his selection,
E asked:
How could you tell that was more to eat?Is one cooky bigger? Which is bigger? How can you tell?
If S chose the bigger green cooky, even though it appeared smaller in the
illusion, he was allowed to take the green cooky, and E then presented
Test Item 3. If the child selected the smaller white cooky in the lower
illusion position, E asked Test Item 2.
Test Item 2 was designed to explore the limits of the nonconservers'
beliefs about the inconstancy and to find whether calling attention to the
original relationship would assist S in maintaining constancy. After S's
choice of the smaller white cooky in the lower position on Item 1, E said:
Look, here's the one you picked (pointing to white). Now, I putit here (E moved white cooky to upper position). Does it stillhave more to eat than the other cooky? Or, does this one (pointingto green in lower position) have more to eat now?
If S maintained constancy in his prior choice and selected the white
cooky in the upper position, thereby ignoring the illusion, E said:
How did you know this has more to eat?Is one bigger? Which is bigger? How can you tell?
If S selected the green cooky in the upper position, thereby responding
to the appearance of the illusion and denying the choice previously made,
E said:
How is that? How could you tell?Which had more to eat when this (pointing to white) was here pointingto space below green)?
If S said white had more, E asked:
166.
Did it really change? Did it eally get to be more to eat?
If S then said green had more, E asked :.
How is that (moving green back to top position)? Here is the wayit was before. Does it have more to eat now?
Items 3 and 4 were designed to more directly elicit conflict and
explore beliefs about the cause of the apparent transformation. E said:
3. Here are two more cookies (blue and red cookies, identical insize, were presented with blue in lower position). You can pickthe one with more to eat when I say so. Now this is harder.Look at them. Before you pick, I change their places (bluecooky was moved to upper position). Now look at them. Whichhas more to eat? How did you know? How could you tell?
If the child chose the blue cooky in the upper position, E moved to
Item 4. However, if the child chose the red cooky in the lower position
as having more to eat, E asked the following:
Which had more to eat when this (pointing to red) was here (pointingto position above blue cooky)?
If S said the red cooky had more then, E said:
Here's the way it was before (moving blue cooky to lower position).Does it have more to eat now?
If the child said the red cooky in the upper position had more to eat,
E moved to Item 4. However, if the child said the blue cooky in the lower
position then had more to eat, E asked:
Did it really get to be more to eat? Did it get bigger? Whathappened?
If the child chose the blue cooky in the upper rosition,- E moved to Item
4. However, if S chose the red cooky in the lower position as having more
to eat, E asked the following:
Which had more to eat when this (pointing to red) was here (pointingto position above blue cooky)?
(If S said red): Here's the way it was before (moving blue cooky tolower position). Does it have more to eat now? (If S said red inupper position still had'more to eat, E moved to Item 4. If S
said blue had more to eat, E continued.) Did it really get to be moreto eat? Did it get bigger? What happened?
167.
(If S said blue): Did this (pointing to red) really get to be moreto eat-- Did it get bigger? What happened?
4. Look, it looks like they change (E switched red cooky from upperto lower position and back several times, leaving it in upperposition if red was last chosen as more to eat, and in lowerposition if blue was last selected as more). Which has more toeat? Is one bigger?
What happens? Does it really change from big to small when I
move it or what?
Item 5 was included to explore the child's spontaneous utilization
of measurement and the effect or seeing the cookies superimposed on beliefs
about the transformation. E said:
Show me how you can tell which is really the big one.
(If S did not measure): If I thought this (cooky child did not lastchoose as bigger) is the bigger one, how could you show me it isn't?
(If S still did not measure): Can you measure them?
(If S still did not measure): Can you put them together to see whichis bigger and has more to eat?
(If S did not superimpose): Which is bigger now (E superimposedcookies)? How about now (E placed cooky last selected as bigger inupper position)? Now does that happen?
Scoring
Subjects were scored as passing (+) or failing (-) the following items:
1. Remembers which cooky appeared bigger before change in array
+ : a. Says white cooky had more before on Q26b. Says blue cooky had more before on Q3cc.. Spontaneously verbalizes which was more before or says it
changes
2. Expects constancy
a. ,Predicts that green cooky will have more to eat when a cardconceals the illusion
b. First points to top cooky, then changes choice to bottom cookyso that it seems that choice of top at first resulted fromfailure to observe the illusion
c. Points to original bottom cooky as E moves a cookyd. Verbalizes that he expects the size relationship to remain
the same, e.g., "The bottom one cheats."e Surprise is at least moderate in response to the transformationf. Maintains constancy, selecting top cooky while recognizing
that bottom cooky appears larger
168.
g. Insists upon putting the cooky chosen in the bottom position,e.g., "I want to pick it like this."
3. Believes the event is highly unusual, if not impossible
a. Surprise is intense in response to the transformationb. Spontaneously suggests magical causec. Indicates disbelief in change; chooses top cooky while
recognizing that bottom cooky appears largerd. Indicates puzzlement, surprise, suspicion, doubt, e.g., "How
do you do that?" "Do you know how it gets to be more to eat?""It looks funny when you do that." "The bottom one cheats.""It shouldn't do that!" "That one's supposed to be bigger,but its not." Also: accuses E of trick; spontaneousmanipulation of cookies in doubt or disbelief; says doesn'tknow if it changed; marked hesitation in responding
e. Thinks he must have been mistaken in his first view of thecookies and says the bottom cooky had more when it was on top(Failure on memory question is not failure of memory butquestioning of original judgment)
4. At least momentarily denies real change in either quantity of singlecooky or in quantitative relationship between the two cookies
+: a. Says no to one "really change" questionb. Says no to one "more to eat" questionc. Says no to "really bigger" questiond. Says it stays the same or spontaneously offers other verbaliza-
tion of belief in lack of changee. Maintains constancy at some point: picks top cooky while
recognizing that bottom cooky appears biggerf. Thinks he must have been mistaken in first view of cookies
and says the bottom cooky had more when it was on top
Note: Score - if a no response is qualified in such a way as tocontradict, e.g., (Did it get bigger?) "No, the other one gotsmelled."
5. Attempts concrete explanation of apparent change
a Verbalizes .a logical reason for conservation1) Logical compensation: If both are bigger, they're the
same size, or both, are big2) It.just looks like it gets/is bigger; it just does that3) It was bigger before4) It can't change; it stays the same; it's always biggest;
it can't stretch5) One'is bent more; it's tilted/slanted6) Difference in arc lengths7) It's cut bigger; it's born that big8) None was added or taken away9) It's just imagination
10) It looks smaller when it's further away11) It's an eye-fooler12) Shape prevents direct comparison
169.
b. Suggests E just put one further to the side which causesfalse effect
c.
d. Says something concrete causes the change, the board(but not magic), fuse box, camera, microphone
e, Accuses E of sneaking in another cooky or cutting itf. Makes clumsy attempt at concrete explanation, e.g., "Maybe
it takes more room," "The higher it is, the gets like shorter(really shorter) No." "You took some one and put it on theother."
g. Actively experiments, e.g., moves off board to see if changewill occur elsewhere, superimposes or otherwise maniuplatesexperimentally
h. Does not need to seek concrete explanation as maintains constancythroughout'.
6. Maintains identity by the end of the interview: believes in theconstancy in quantity of single cooky
+: A spontaneous verbalization outweighs answers to yes-no questions.A subject may agree to a real change in size or amount to eat,'but then contradict or qualify so that it is clear that he believesthe cooky does not actually increase or decrease. Examples ofidentity statements:
You got another cooky.It cl(N-m't really c.,eL bigger/longer/more to eat.It doesn't really change from big to small when you move it (0).They stay alike.If you put it on top, it will still be bigger.They don't change. It really is the same size.It can't grow.
7. Maintains equivalency relationship by the end of the interview:believes in the constancy of the quantitative relationship betweenthe two cookies
+ Says they are the same when in the illusion position aftersuperimposition demonstrates equality, or maintains that onecontinues to be bigger when, placed in top position although theother appears bigger.
8. Consistently conserves
+: Maintains constancy throughout the interview
9. Conserves with certainty.
+: Never considers possibility that one cooky could have more in oneposition and not more in another position; does not vacillate inchoices; does not remeasure.
Note that a response was considered unscorable if subject said the bottomcooky looked smaller or the top cooky looked bigger. If the bottom
170.
cooky was selected and that choice was maintained when placed in upperposition, the response was considered a conservation response.
In addition, verbalizations about the cause of the apparent transforma-
tion were classified as follows:
Nonconservation Reasons:
1. No reason or irrelevant reason given, e.g., "You move it,""You put it there," "I like that color," "That is curved bigger,""It's longer," "I measured it (but did not superimpose),""They're made to be like that," "If you put this (upper cooky)here (in lower position), it's bigger, but if it's here (upperposition), it's smaller."
2. Physical chancLe is specified, e.g., "It's sprea out," "Itgrew/shrank," "It takes more room when it's closer," "itgets smaller when it's further away."
3. Magic, e.g., "It's magic!"
4. Impossible or unreasonable concrete cause, e.g., "The board makesit happen (but not magic)," "You took some off one and put it onthe other,'" "The camera (or other object in room) made it."
5. Arc difference, e.g., "It's longer here (top arc of lower cooky)thn here (hotto crc of upper cooky) ."
Conservation Reasons:
6. Vague reference to shape, e.g., "One is bent more," "It's tilted/slanted," "You can't get them together to check it because they'rebent."
Identity, e.g., "It was bigger before," "It had the same amountbefore," "It can't change," "It stays the same," "It's alwaysbiggest," "It can't stretch," "The short stays short and the longstays long," "It's cut bigger," "It's born that big."
8. Addition-subtraction principle, e.g., "You didn't put any morecooky on it," "You didn't take any cooky away."
9. Illusion, e.g., "It just looks like it gets bigger," "it justdoes that," "Maybe it's just my imagination," "It makes your eyesthink it's changing," "It's an eye - footer," "The one that'sclosest looks bigger, and the one that's further away looks smaller."
10. Arc difference, e.g., "This looks bigger because this (top arcof lower cooky) is next to this (bottom arc of upper cooky)."
RESULTS
Developmental Sequence
The foregoing set of items can be said to describe an invariant
171.
developmental sequence of acquisition, on the basis of the following,
converging lines of evidence:
1. The items are ordered in terms of increasing difficulty. A
scalbgram analysis using Green's (1956) summary statistics was performed
which indicates that the nine dichotomous items form a Guttman scab
(Table 77 shows reproducibilities and indices of consistency). Table
78 presents the ten perfect scale patterns possible and shows the
frequency and median age of bright, average, and retarded Ss found for
each scale type.
2. Increasing success on scale items occurs with increasing age
and reflects the order of difficult. .Table 79 indicates that mean level
of performance increases significantly with age (P=9.89, df=2.86, P <
.0002). Table 80 shows that younger Ss tend to score at lower scale
levels while older Ss tend to score at upper scale levels. Table 81
shows that the percentage of Ss succeeding on each scale item increases
with age.
3. Retesting of a small number of Ss after one year shows a general
progression along the scale. Table 82 shows the scale scores of 19 Ss
at two testings separated by one year. Three Ss performed at the same
level both times, 13 Ss performed at a higher level after one year, and
3 Ss perfcwmed at a slightly lower level. The scale accounts for performance
change for most Ss.
Effect of Intelligence on Performance
Sequential Order of Acquisition
The scalogram analysis performed separately for each IQ group indicated
that the order of difficulty of scale items does not vary for groups
differing in IQ (See Table 77). Evidence cited in the foregoing section
concerning developmental .572quentiality applies equally to all IQ groups.
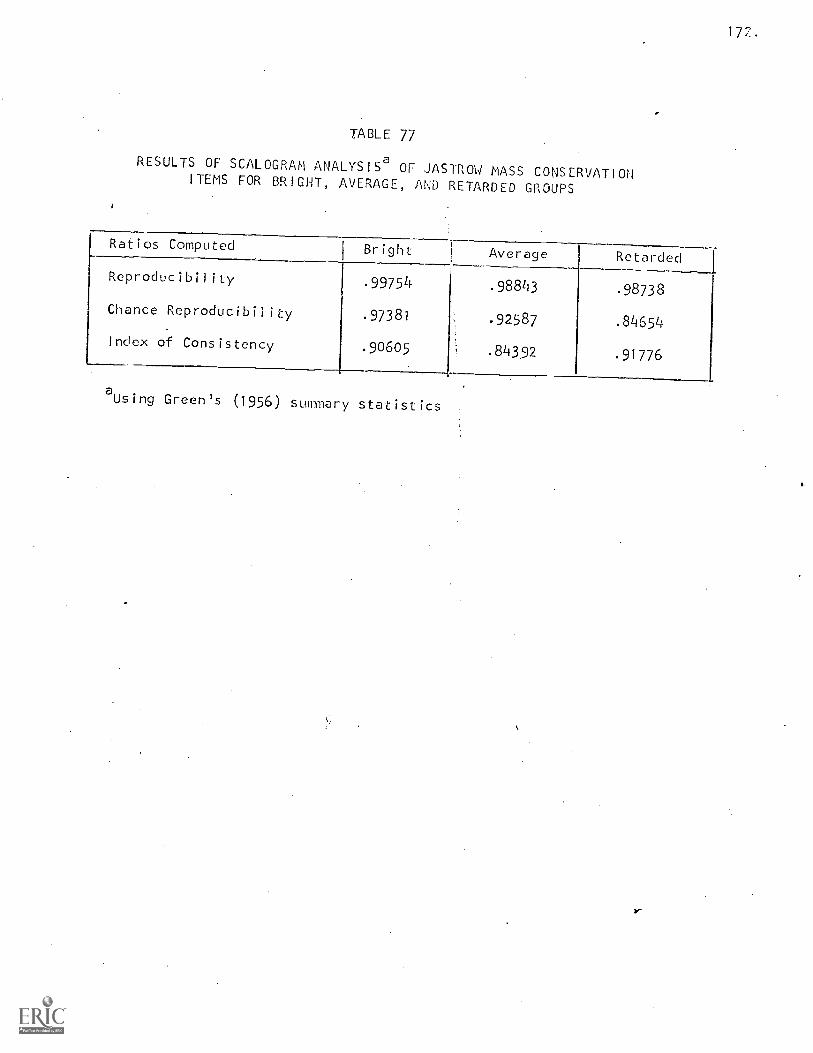
172.
TABLE 77
RESULTS OF SCALOGRAM ANALYSIS° OF JASTROW MASS CONSERVATIONITEMS FOR BRIGHT, AVERAGE, AND RETARDED GROUPS
Ratios Computed Bright Average Retarded
Reproducibility .99751+ .98843 .98738
Chance Reproducibility.97381 .92587 .84654
Index of Consistency .90605 .84392 .91776
aUsing Green's (1956) summary statistics
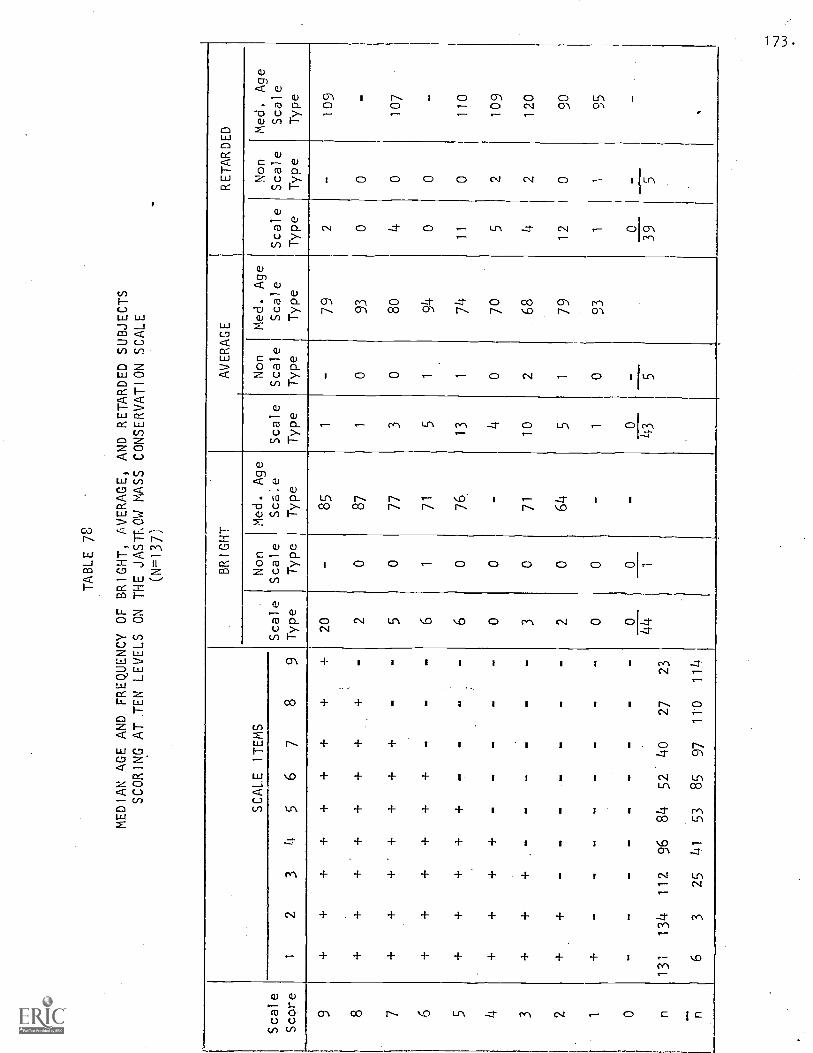
TABLE 76
MEDIAN AGE AND FREQUENCY OF BRIGHT, AVERAGE, AND RETARDED SUBJECTS
SCORING AT TEN LEVELS ON THE JASTROW MASS CONSERVATION SCALE
(N=137)
Scale
Score
SCALE
ITEMS
BRIGHT
AVERAGE
RETARDED
Scale
Type
Non
Scale
Type
Med. Age
Suie
Type
Scale
Type
Non
Scale
Type
Med. Age
Scale
Type
Scale
Type
Non
Scale
Type
Med. Age
Scale
Type
12
34
56
78
9
9+
++
++
++
+20
-85
1-
79
2-
109
8+
++
++
++
-2
087
10
930
0-
17
++
+-
++
++
--
50
77
3,
08o
4107
6+
++
++
+-
--
61
71
51
940
0
5+
++
++
--
-6
076.
13
174
11
0110
4+
++
+-
---
00
-4
070
52
109
3+
++
--
--
-3
071
10
2.68
42
120
2+
--
--
--
20
64
51
79
12
090
10
-1
093
11
95
0-
--
--
--
-o
0-
44
143
539
5n
131
134
112
96
84
52
40
27
23
n6
325
41
53
85
97
110
114
.
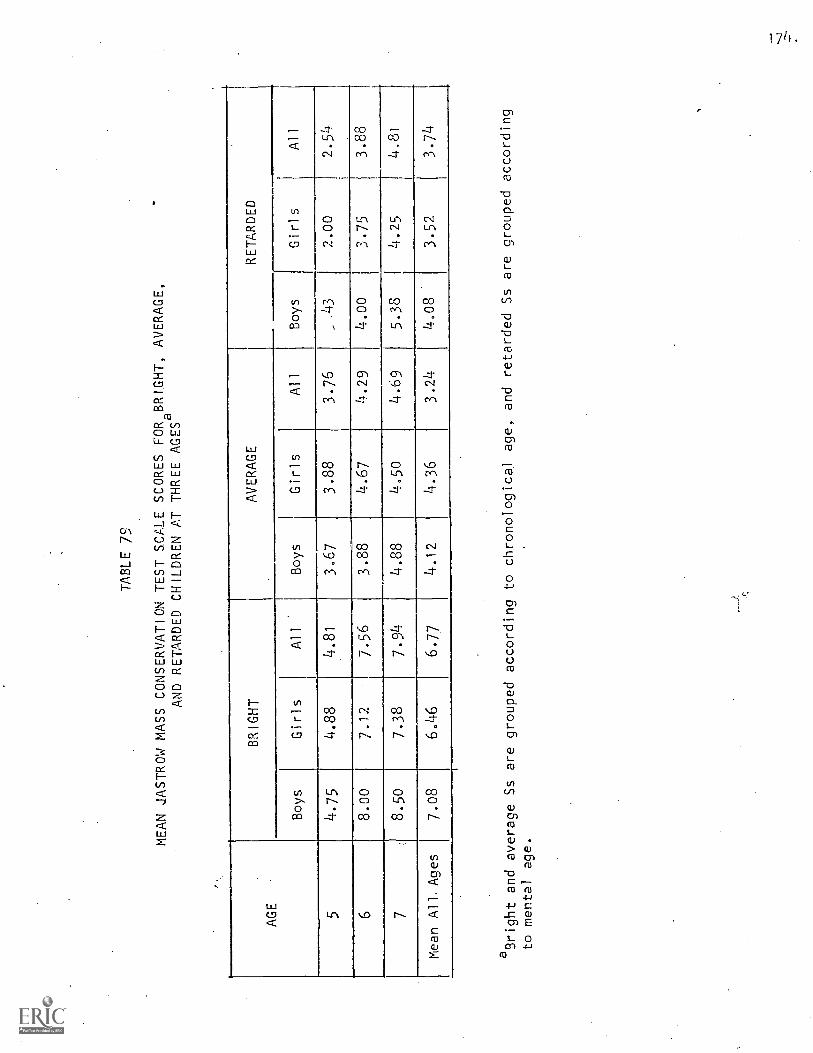
TABLE 79
MEAN JASTROW MASS CONSERVATION TEST SCALE SCORES
FOR BRIGHT, AVERAGE,
AND RETARDED CHILDREN AT THREE. AGESa
AGE
BRIGHT
AVERAGE
RETARDED
Boys
Girls
All
Boys
Girls
All
Boys
Girls
All
54.75
4.88
4.81
3.67
3.88
3.76
-43
2.00
2.54
68.00
7.12
7.56
3.88
4.67
4.29
4.00
3.75
3.88
78.5o
7.38
7.94
4.88
4.5o
4.69
5.38
4.25
4.81
Mean All, Ages
7.08
6.46
6.77
4.12
4.36
3.24
4.08
3.52
3.74
aBright and average Ss are grouped according to chronological age,
and retarded Ss are grouped according
to mental age.
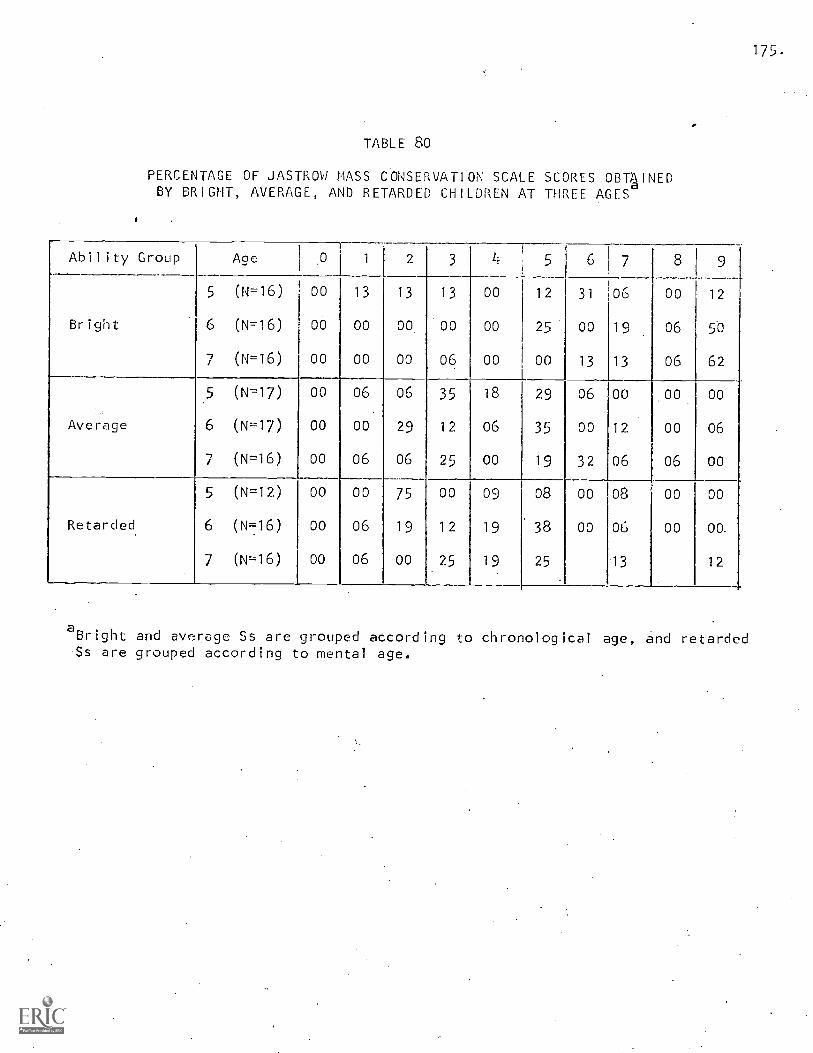
175.
TABLE 80
PERCENTAGE OF JASTROW MASS CONSERVATION SCALE SCORES OBTNEDBY BRIGHT, AVERAGE, AND RETARDED CHILDREN AT THREE AGES
Ability Group Age , 0 1 2 3 4 5 6 7 8 9
5 (N=16) 00 13 13 13 00 12 31 06 00 12
Bright 6 (N=7.16) 00 00 00 00 00 25 00 19 06 50
(N=16) 00 00 00 06 00 00 13 13 06 62
5 (N=17) 00 06 06 35 18 29 06 00 00 00
Average 6 (W=17) 00 00 29 12 06 35 00 12 00 06
7 (N=16) 00 06 06 25 00 19 32 06 06 00
5 (N=12) 00 00 75 00 09 08 00 08 00 00
Retarded 6 (N716) 00 06 19 12 19 38 00 06 00 00.
7 (N=16) 00 06 00 25 19 25 13 12
aBright and average Ss are grouped according to chronological age, and retardedSs are grouped according to mental age.
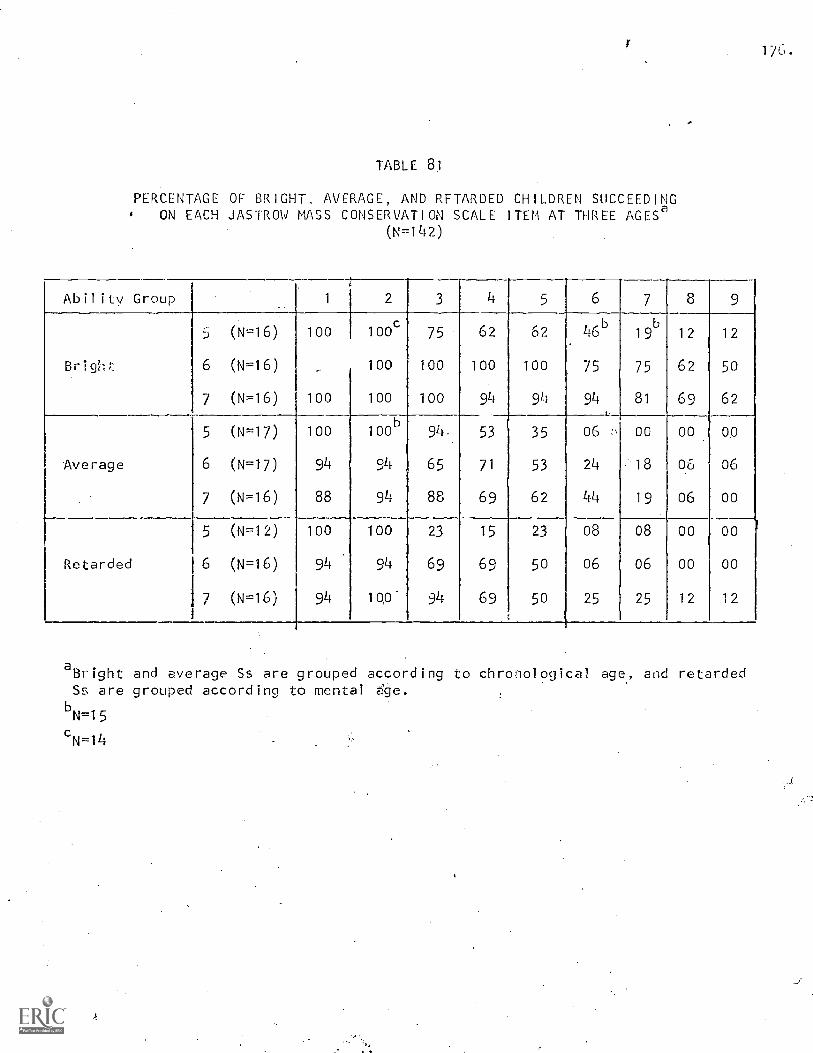
TABLE 81
PERCENTAGE OF BRIGHT, AVERAGE, AND RETARDED CHILDREN SUCCEEDINGON EACH JASTROW MASS CONSERVATION SCALE ITEM AT THREE AGES°
(N=142)
Ability Group 1 2 3 4 5 6 7 8 9
(N =16) 100 looc 75 62 62 46b 19b 12 12
Bright 6 (N-16) 100 100 100 100 75 75 62 5o
7 (N=16) 100 100 100 94 94 94 81 69 62.,
5 (N=17) 100 loo 94. 53 35 06 : 00 00 00
Average 6 (N-17) 94 94 65 71 53 24 18 06 06
7 (N-16) 88 94 88 69 62 44 19 06 00
5 (N.'.12) 100 100 23 15 23 08 08 00 00
Retarded 6 (N=16) 94 94 69 69 50 06 06 00 00
(N=16) 94 100 94 69 50 25 25 12 12
aBright and average Ss are grouped according to chronological age, and retardedSs are grouped according to mental age.
bN=1 5
cN=14
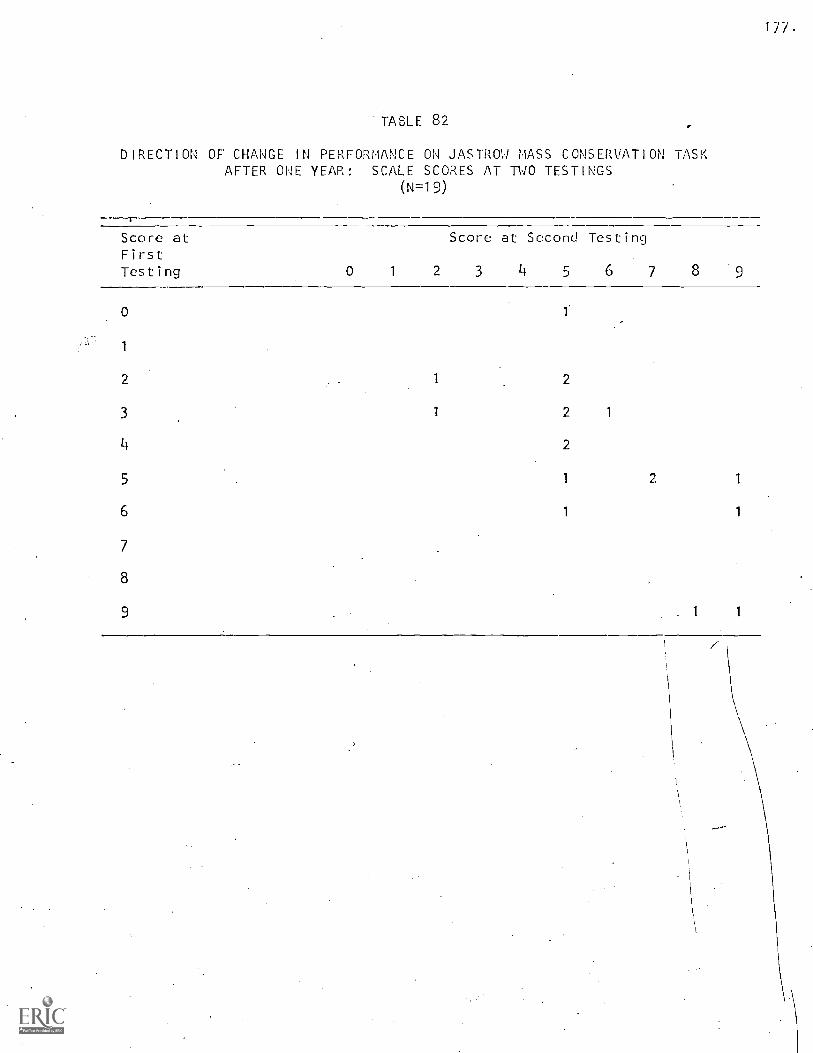
DIRECTION
TABLE 82
OF CHANGE IN PERFORMANCE ON JASTROW MASS CONSERVATION TASKAFTER ONE YEAR: SCALE SCORES AT TWO TESTINGS
(N=19)
Score at Score at Second TestingFirstTesting 0 1 2 3 4 5 6 7 8
1
1
2 1 2
3 1 2 1
4 2
5 1 2 1
6 1 1
7
8
9 1
178,
It appears that the order of developmental change is the same, regardless
of IQ.
Level of Performance
Table 79 shows that bright children perform at a higher level than
average or retarded children (F=40.39, di-1, 86, p <.0001 for bright and
average groups). However, average children do not differ significantly
from retarded children of the same mental age. Mental age is a significant
factor in the performance of average and retarded children (F=4.37, df=2.
81, p (.02).
Sex Differences
No statistically significant differences in the performance of s
and boys were found.
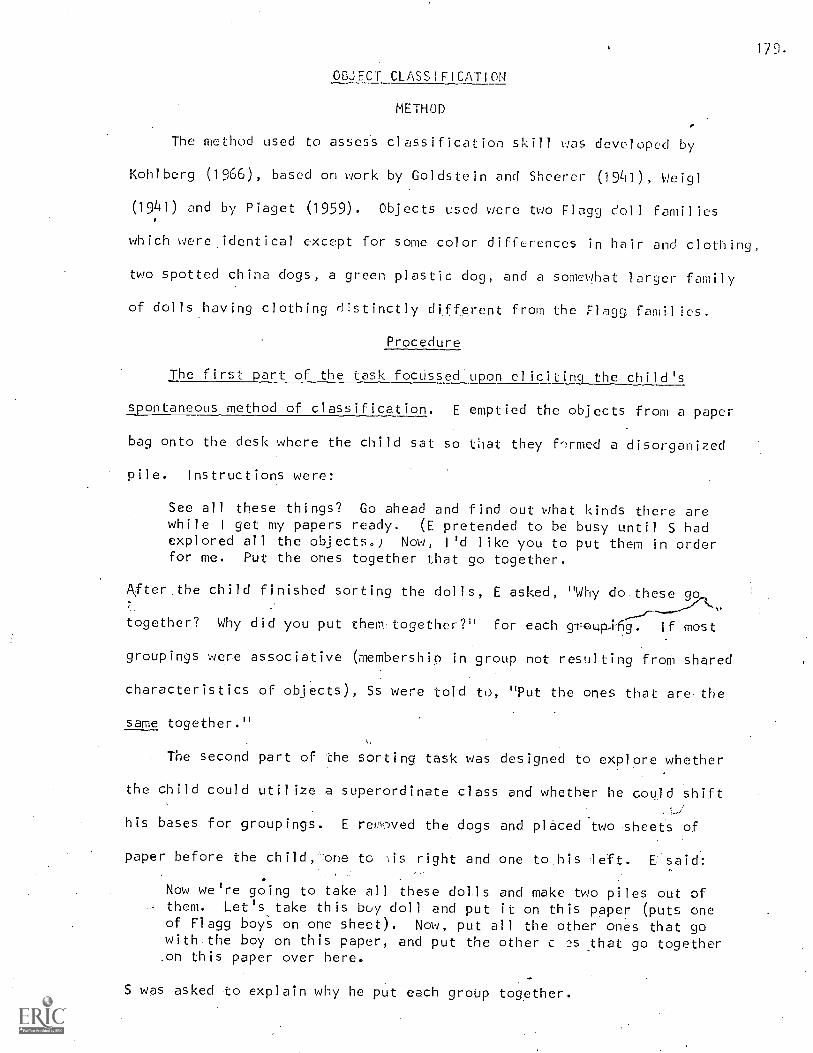
179.
OBJECT CLASSIFICATION
METHOD
The method used to assess classification skill gas developed by
Kohlberg (1966), based on work by Goldstein and Sheerer (1941), Weigl
(1941) and by Piaget (1959). Objects used were two Flagg doll families
which were identical except for some color differences in hair and clothing,
two spotted china dogs, a green plastic dog, and a somewhat larger family
of dolls having clothing' distinctly different from the Flagg. families.
. Procedure
The first part of the task focussed upon elicitinq the child's
spontaneous method of classification. E emptied the objects from a paper
bag onto the desk where the child sat so that they formed a disorganized
pile. Instructions were:
See all these things? Go ahead and find out what kinds there arewhile I get my papers ready. (E pretended to be busy until S hadexplored all the objects.) Now, I'd like you to put them in orderfor me. Put the ones together that go together.
A,fter.the child finished sorting the dolls, E asked, "Why do.these go
together? Why did you put them:together?" for each roup,ing. if most
groupings were associative (membership in group not resulting from shared
characteristics of objects), Ss were told to, "Put the ones that are the
same together."
The second part of the sorting task was designed to explore whether
the child could utilize a superordinate class and whether he could shift
his bases for groupings. E reuoved the dogs and placed two sheets of
paper before the child, one to is right and one to his left. E said:
Now we're going to take all these dolls and make two piles out ofthem. Let's take this boy doll and put it on this paper (puts oneof Flagg boys on one sheet). Now, put all the other ones that gowith the boy on this paper, and put the other c 25 that go togetheron this paper over here.
S was asked to explain why he put each group together.
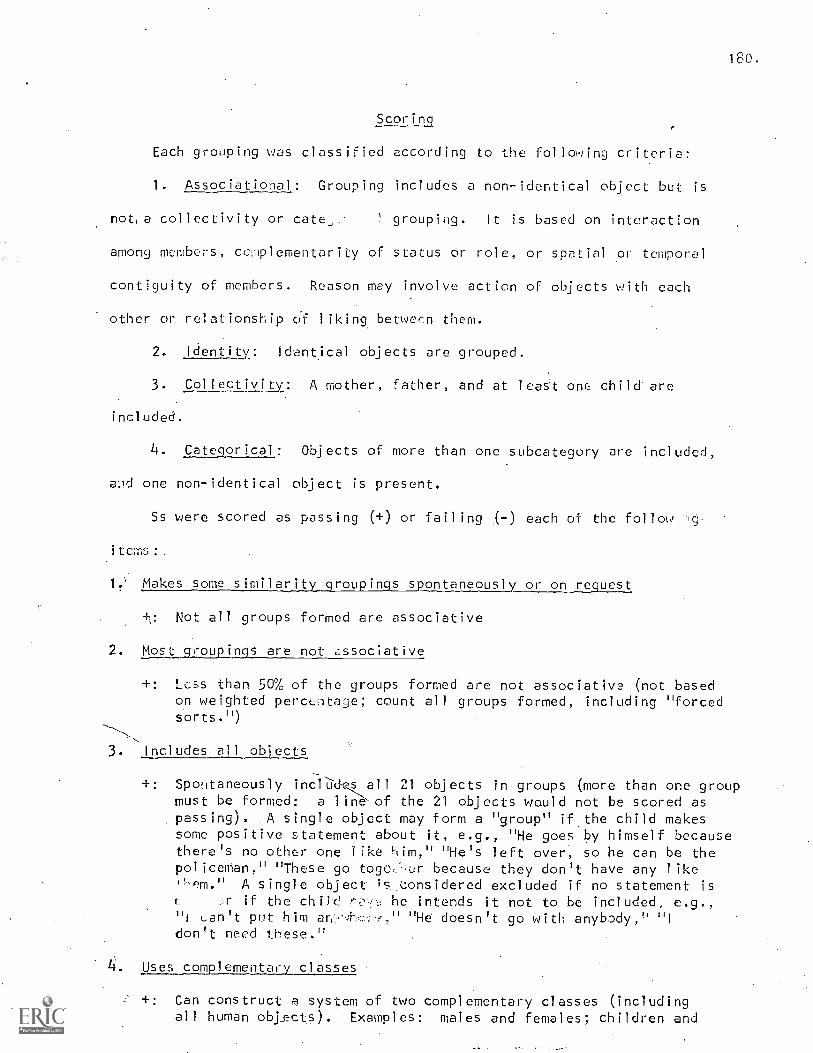
180.
Scoring
Each grouping was classified according to the folloqing criteria:
1. Associational: Grouping includes a non-identical object but is
not, a collectivity or cate_, ! grouping. It is based on interaction
among members, cemplementarity of status or role, or spatial or temporal
contiguity of members. Reason may involve action of objects with each
other or relationship liking between them.
2. Identity: Identical objects are grouped.
3. Collectivi/i: A mother, father, and at leaS't one child are
included.
4. Categorical: Objects of more than one subcategory are included,
alld one non-identical object is present.
Ss were scored as passing (+) or failing (-) each of the follow
items:.
1.' Makes some similarity groupings spontaneously or on request
+: Not all groups formed are associative
2. Most,_aroupings are not associative
+: Less than 50% of the groups formed are not associative (not basedon weighted percc:Ita'L3e; count all groups formed, including "forcedsorts.")
3. Includes all objects
+: Spontaneously include,s all 21 objects in groups (more than one groupmust be formed: a 1 int. of the 21 objects would not be scored aspassing). A single object may form a "group" if the child makessome positive statement about it, e.g., "He goes by himself becausethere's no other one 1;ke him," "He's left over, so he can be thepoliceman," "These go togcr because they don't have any likeil,nm." A single object is .considered excluded if no statement is
,r if the chile he intends it not to be included, e.g.,"I can't put him an " "He doesn't go with anybody," "Idon't need these."
. Uses complementary classes
+: Can constructa system of two complementary classes (includingall human objects). Examples: males and females; children and
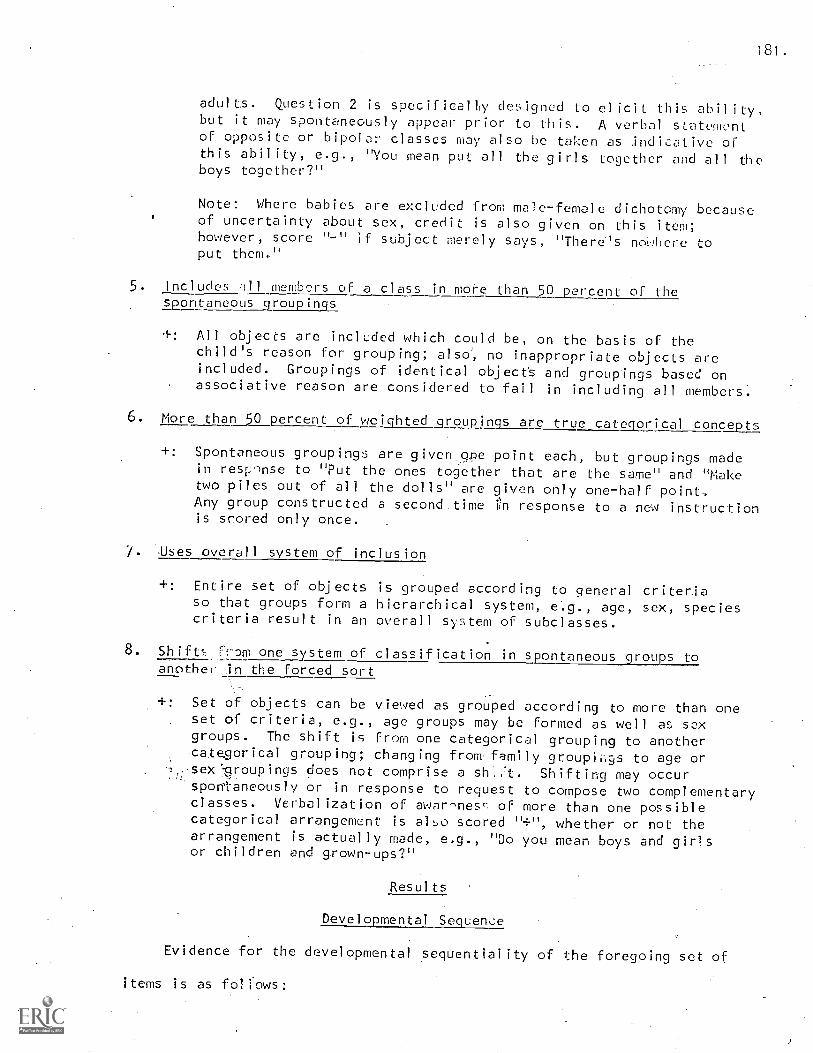
181.
adults. Question 2 is specifically designed to elicit this ability,but it may spontaneously appear prior to this. A verbal sttementof opposite or bipolar classes may also be taken as .indicative ofthis ability, e.g., "You mean put all the girls together and all theboys together?"
Note: Where babies are excluded from male-female dichotomy becauseof uncertainty about sex, credit is also given on this item;however, score "-" if subject merely says, "There's nollcre toput them."
5 Includes members of .a class in more than 50 percent of thespontaneous groupings
+: All objects are included which could be, on the basis of thechild's reason for grouping; also, no inappropriate objects areincluded. Groupings of identical object's and groupings based onassociative reason are considered to fail in including all members.
6. More tharl_50 percent of weighted groupings are true categorical concepts
+: Spontaneous groupings are given one point each, but groupings madein response to "Put the ones together that are the same" and "Maketwo piles out of all the dolls" are given only one-half point.Any group constructed a second time in response to a new instructionis scored only once.
/. Alses overall system of inclusion
+: Entire set of objects is grouped according to general criteriaso that groups form a hierarchical system, e.g., age, sex, speciescriteria result in an overall system of subclasses.
8. Shift.7,, from one system of classification in spontaneous groups toanother In the forced sort
+: Set of objects can be viewed as grouped according to more than oneset of criteria, e.g., age groups may be formed as well as saxgroups. The shift is from one categorical grouping to anothercategorical grouping; changing from family groupiwgs to age orse)Ogroupings does not comprise a sh.,-t. Shifting may occurspontaneously or in response to request to compose two complementaryclasses. Verbalization of awar^nes of more than one possiblecategorical arrangement is also scored "+", whether or not thearrangement is actually made, e.g., "Do you mean boys and girlsor children and grown-ups?"
Results
Developmental Sequence
Evidence for the developmental sequentiality of the foregoing set of
items is as f
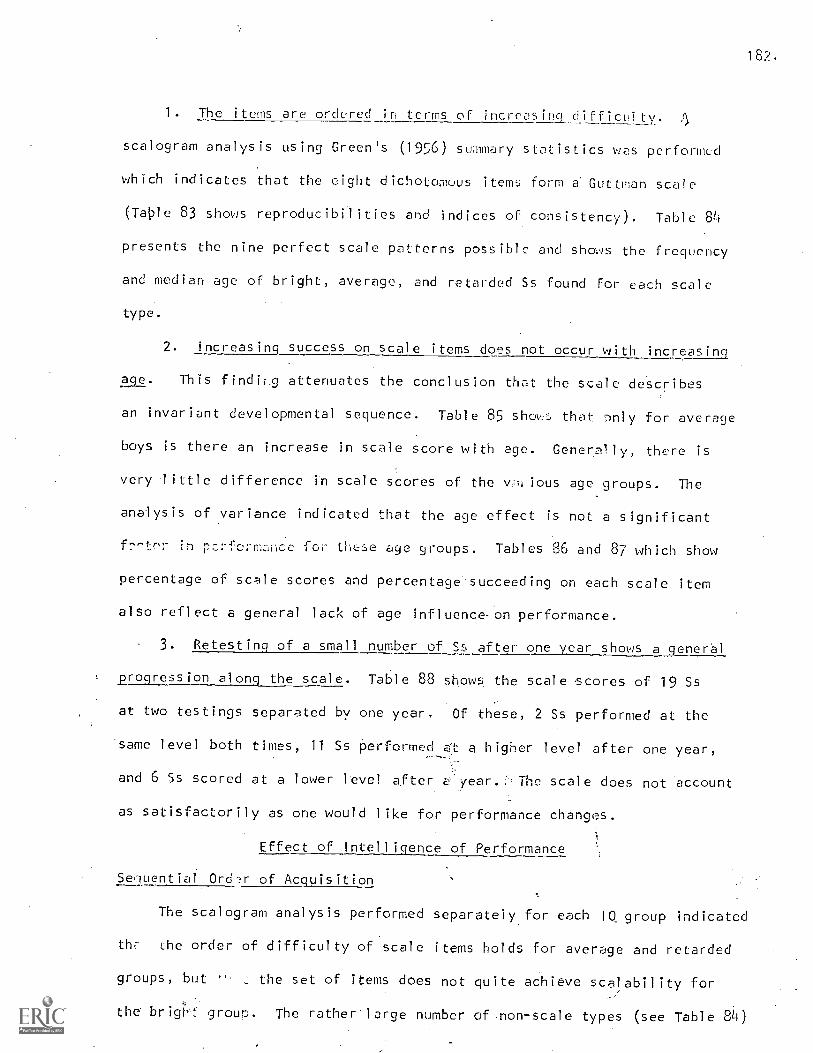
182.
1. The items are ordered in terms of increasing difficulty. 4
scalogram analysis using Green's (1956) summary statistics was performed
which indicates that the eight dichotomous items form a Guttman scale
(Table 83 shows reproducibilities and indices of consistency). Table 84
presents the nine perfect scale patterns possible and shows the frequency
and median age of bright, average, and retarded Ss found for each scale
type.
2. increasing success on scale items does not occur with increasing
This findiilg attenuates the conclusion that the scale describes
an invariant developmental sequence. Table 85 shop:'; that Drily. for average
boys is there an increase in scale score with age. Generally, there is
very little difference in scale scores of the viious age groups. The
analysis of variance indicated that the age effect is not a significant
f7-tr in rcrfermce for these aye groups. Tables 86 and 87 which show
percentage of scale scores and percentage succeeding on each scale item
also reflect a general lack of age influence-on performance.
3. Retesting of a small number of Ss after one year shows a general
Progression along the scale. Table 88 shows the scale -scores of 19 Ss
at two testings separated by one year. Of these, 2 Ss performed at the
same level both times, 11 Ss performed at .a higher level after one year,
and 6 Ss scored at a lower level after a...year. The scale does not account
as satisfactorily as one would like for performance changes.
Effect of Intelligence of Performance
Sequential Ord .r of Acquisition
The scalogram analysis performed separately for each IG group indicated
the the order of difficulty of scale items holds for average and retarded
groups, but " the set of items does not quite achieve scalability for
the bright group. The rather large number of non -scale types (see. Table 84)
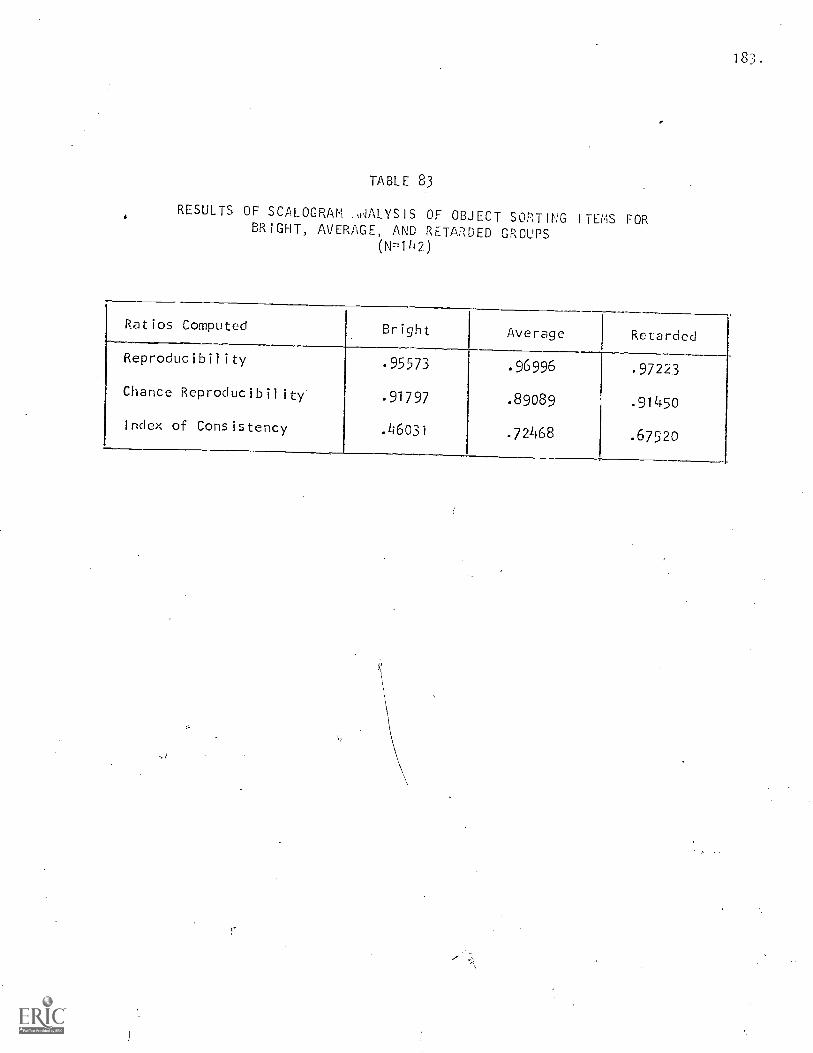
183.
TABLE 83
RESULTS OF SCALOGRAM .wIALYSIS OF OBJECT SORTING ITEMS FORBRIGHT, AVERAGE, AND RETARDED GROUPS
(N='142)
Ratios Computed Bright Average Retarded
Reproducibility .95573 .96996 .97223
Chance Reproducibility .91797 .89089 .91450
Index of Consistency .46031 .72468 .67520
ti
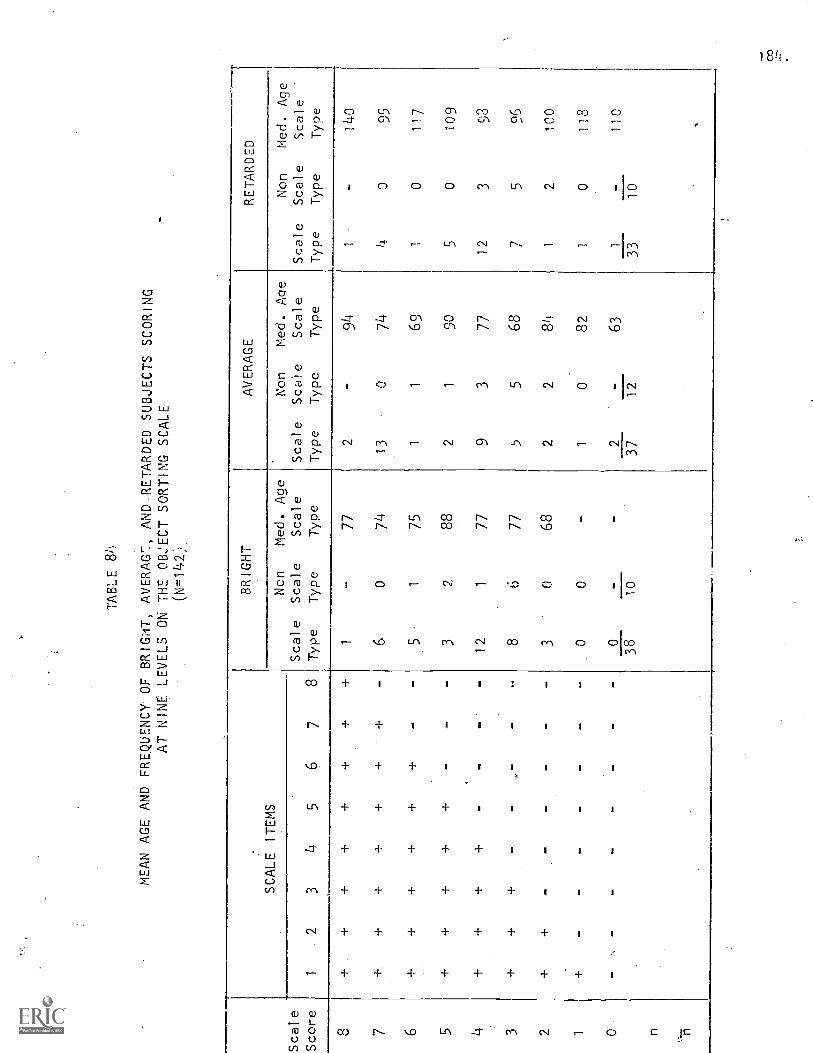
TABLE 8L
MEAN AGE 'AND FREQUENCY. OF BRIGHT, AVERAG7., AND-RETARDED SUBJECTS SCORING
AT NINE LEVELS ON THE OKECT SORTING SCALE
(N=1422,1_
SCALE ITEMS
BRIGHT
AVERAGE
RETARDED
Scale
Type
Ncn
Scale
Type
Med. Age
Scale
Type
Scale
Type
Non
Med. Acie
Scae
Scale
Type
Type
Scale
Type
Non
Med. Age
Scale
Scale
'
Type
Type
Scale
Score
12
34
56
78
8+
++
++
++
+1
-77
2-
94
1-
140
7+
++
++
+-
60
74
13
074
40
95
6+
++
++
--
5.
175
11
69
10
117
5+
++
++
--
-3
288
21
90
50
109
4+
++
+-
--
12
177
93
77
12
3 .)
co ju
3+
++
--
--
86
77
55
68
75
96
2+
+-
--
--
-3
068
22
84
12
100
10
-1
082
10
118
0-
-2
63
1110
38
10
37
12
33
10
n
co
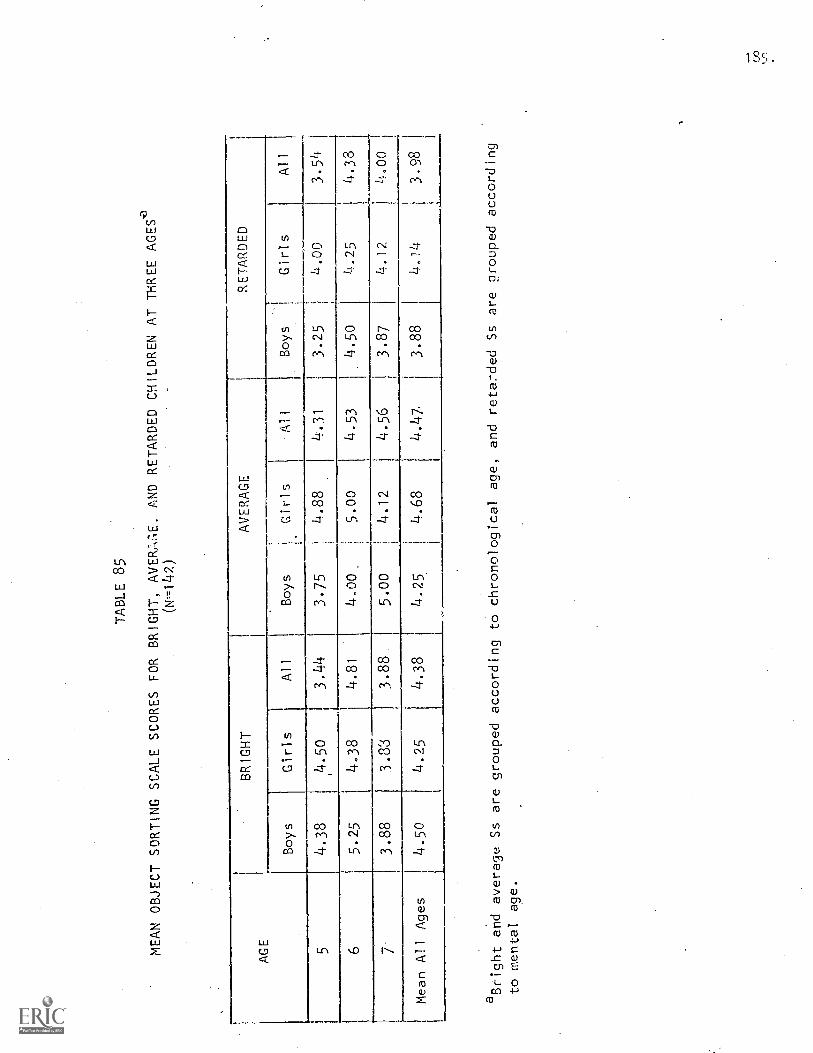
TABLE 85
MEAN OBJECT SORTING SCALE SCORES FOR BRIGHT, AVERW,E,
AND RETARDED CHILDREN AT THREEAGES
(N-142)
AGE
BRIGHT
AVERAGE
RETARDED
Boys
Girls
All
Boys
Girls
All
Boys
.Girls
All
54.38
,4.50
3.44
3.75
4.88
4.31.
3.25
1
4,00
3.54
65.25
4.38
4.81
4.00
5.00
4.53
4.50
4.25
4.38
73.88
3.83
3.88
5.00
4.12
4.56
I,
3.87
4.12
4,00
Mean All
Ages
4.50
4.25
4.38
4.25
4.68
4.47
3.88
4.14
3.98
aBright and average Ss are grouped according to
chronological age, and retarded Ss are grouped according
to mental age.
Co
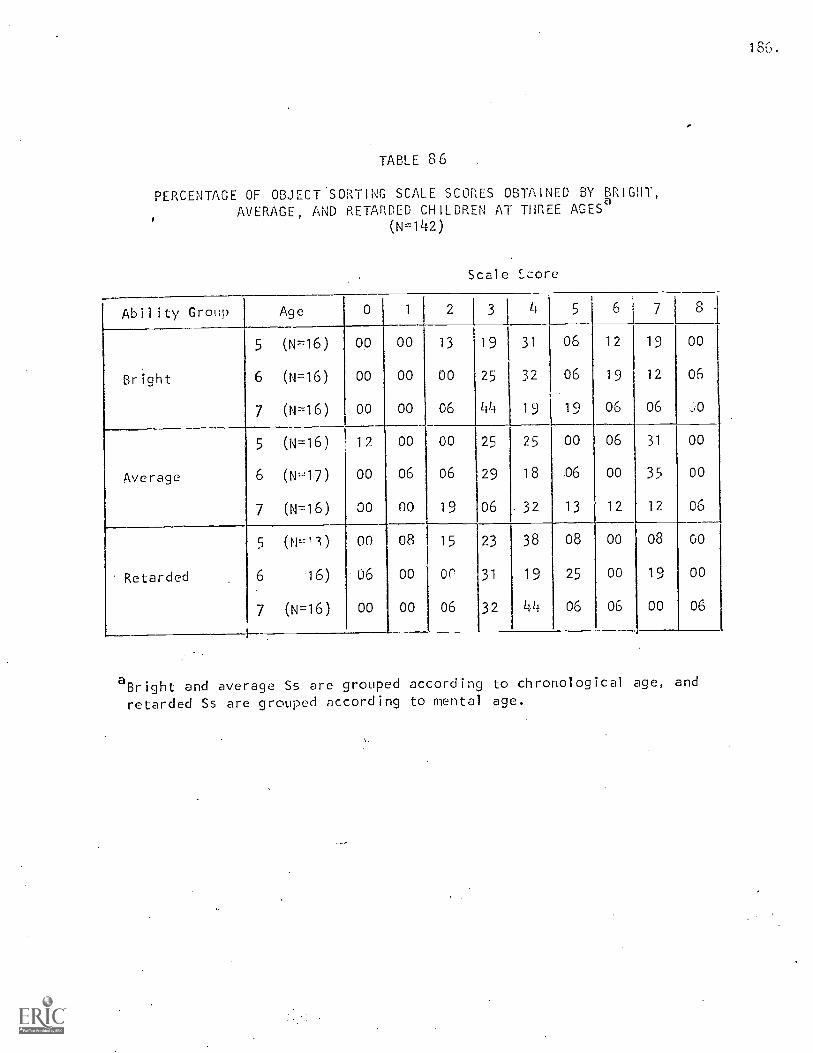
186.
TABLE 86
PERCENTAGE OF OBJECT SORTING SCALE SCORES OBTAINED BY BRIGHT,AVERAGE, AND RETARDED CHILDREN AT THREE AGESa
(N=142)
Scale .(.:ore
Ability Group Age 0 1 2 l 3 4 5 6 7 8
5 (N=16) 00 00 13 19 31 06 12 19 00
Bright 6 (N=16) 00 00 00 25 32 06 19 12 06
7 (N-16) 00 00 06 44 19 19 06 06 )0
5 (N=16) 12 00 00 25 25 00 06 31 00
Average 6 (N-17) 00 06 06 29 18 06 00 35 00
7 (N=16) 00 00 19 06 .32 13 12 12 06
(N.--.11) 00 08 15 23 38 08 00 08 co
Retarded 6 16) 06 00 or 31 19 25 00 19 00
7 (N=16) 00 00 06 32 44 06 06 00 06
aBright and average Ss are grouped according to chronological age, andretarded Ss are grouped according to mental age.
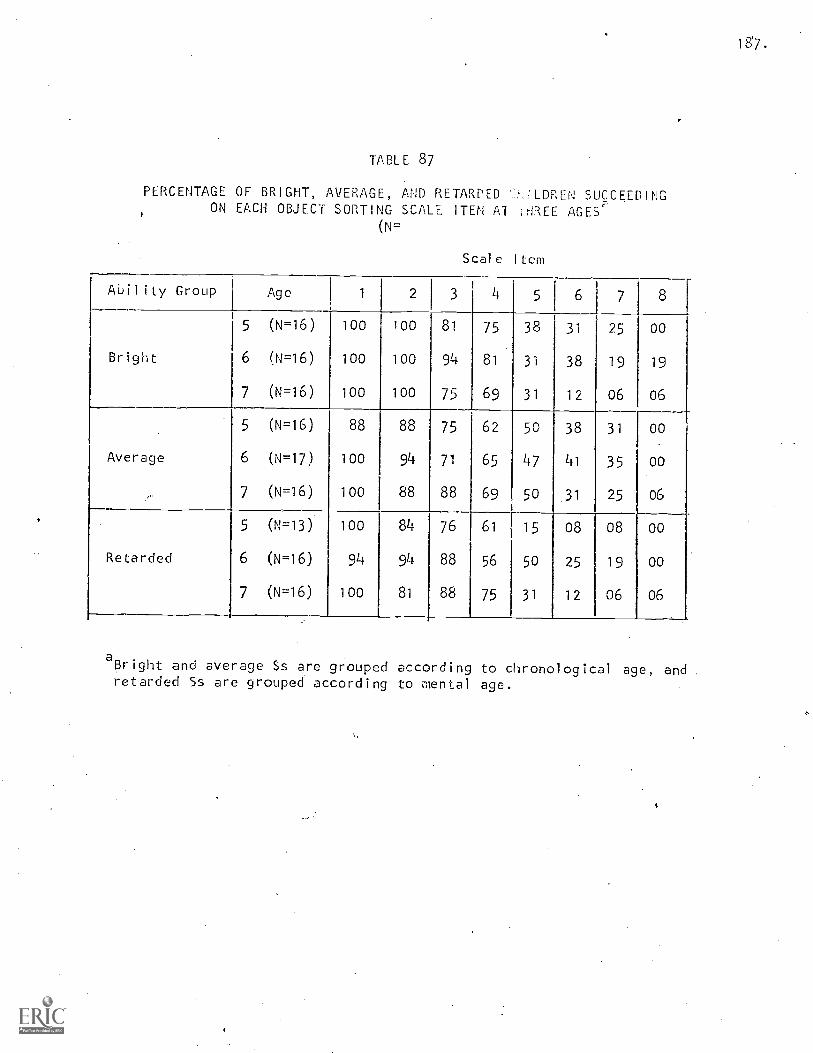
18'7.
TABLE 87
PERCENTAGE OF BRIGHT, AVERAGE, AND RETARDED ',LDREN SUCCEEDINGON EACH OBJECT SORTING SCALE ITEM Al ;HREE AGES'
(N=
Scale Item
Ability Group Age 1 2 3 4 J 5 6 7 8
5 (N =16) 100 100 81 75 38 31 25 00
Bright 6 (N=16) 100 100 94 81 3i 38 19 19
7 (N=i6) 100 100 75 69 31 12 06 06
5 (N=16) 88 88 75 62 50 38 31 00
Average 6 (N=17) 100 94 71 65 47 41 35 00
7 (N=16) 100 88 88 69 50 31 25 06
5 (N-13) 100 84 76 61 15 08 08 00
Retarded 6 (N-16) 94 94 88 56 50 25 19 00
(N=16) 100 81 88 75 31 12 06 06
aBright and average Ss are grouped according to chronological age, andretarded Ss are grouped according to mental age.
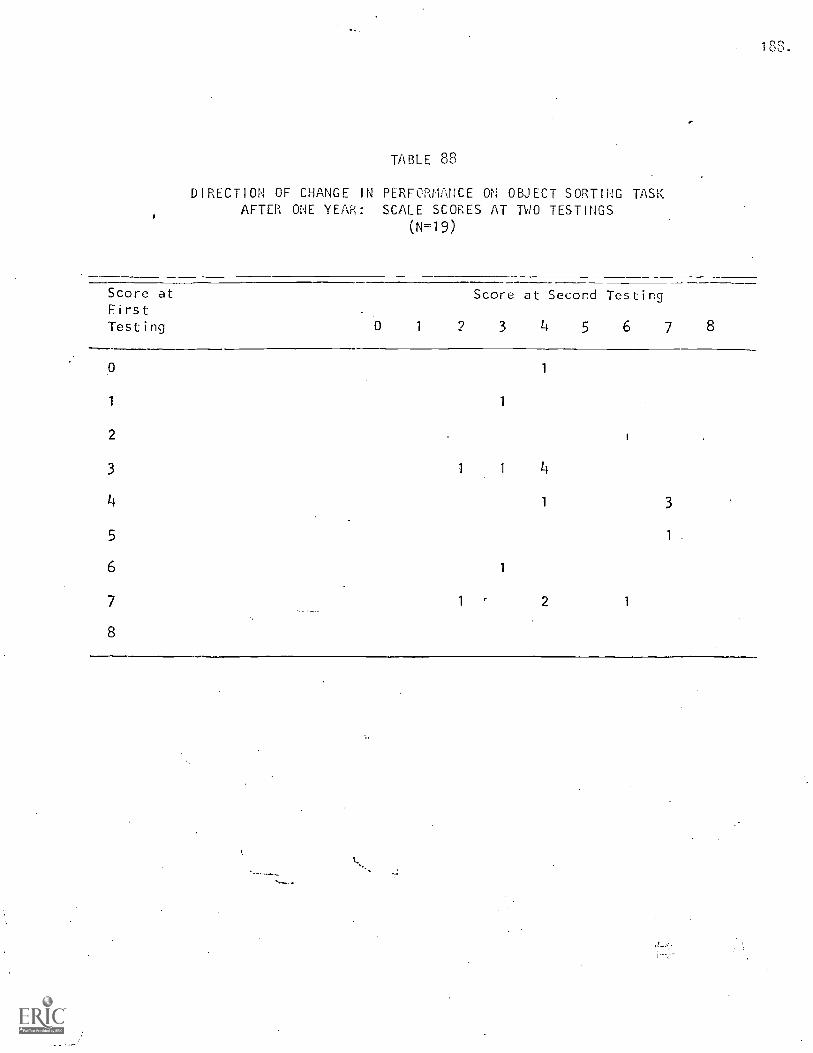
188.
TABLE 88
DIRECTION OF CHANGE IN PERFORMANCE ON OBJECT SORTING TASKAFTER ONE YEAR: SCALE SCORES AT TWO TESTINGS
(N=19)
Score atFirstTesting 2
Score at Second Testing
3 5 6 7 8
1
1 1
2
3 1 4
4 1 3
5 1.
6 1
7 1 2 1
8
189.
for all IQ groups also raises questions about the scale as a descripc-ion
of sequence of acquisition of classification ability.
Level of Performance
'No statistically significant differences were found in the performance
of the three IQ groups as reflected by scale scores.
Sex Differences.
No statistically significant differences were found in the performance
of boys and girls on this object sorting task.
193.TRANSITIVITY OF LENGTH RELATIONS
METHOD
The method of assessing ability to use transitiveinference is
based on the work of Piaget, Inhelder and Szeminska (1960). Materialsused were twelve colored straws of gum and four wooden dowels 4 .-inch
in diameter, in the following lengths and colors:
Gum sticks
2 inches: two purple, four pink, two green3-15/16 inches: one green and one yellow3-13/16 inches: one yellow and one purple3-1/4 inches: one purple3-3/4 inches: one yellow
Wooden dowels (one each)
1-7/8 inches2-1/8 inches3-1/8 inches3-7/8 inches
Position and color of correct gum were varied so that position or colorpreference would not result in false positives.
Procedure
Two small wooden stands (desk-height, with tops about 6 inches square)were placed at either side of the desk at which S was seated. E satacross from S with the wooden dowels concealed in a cardboard box underthe clipboard on which she recorded the interview.
The first item was designed to assess the child's spontaneous useof meadirement in order to arrive at a transitive inference. E placed a
short yellow (3-13/16")gum stick on the stand to S's left and a long green
(3-15/16") gum stick on the stand to S's right, saying:
Now, when _I say so, I want you to find out which of these two piecesof gum is bigger, which has more gum to chew. If you can pick thebigger one, I'll give it to you to keep. If you don't pick the biggerone, you won't get gum this time, but you'll have another chance toget gum later. You have to tell which one is bigger without movingthe pieces of gum away from the tables, but you can use this woodenstick any way you want.
191.
You can move it to the .tables if you want to. Go ahead. Find outwhich is bigger. Point to the bigger one that has more guN to chew.
E gave S the 3-7/8" dowel and noted whether he measured spontaneously or
not. E asked:
How do you know it's bigger?
(If did not measure): What if I thought this (gum Ciild did notchoose). is the bigger one, how could you show me it's not?
(If S still did no measure): Can you measure with the stick andmake sure?
All Ss were allowed to take the gum selected.
Item 2 was used to demonstrate measuring, to insure the opportunity
for S to note the size of gum sticks relative to a measuring rod, and '4'o
find whether S could use transitive inference when these facts were
presented. E dropped the dowel used in Item 1 back in the box in her lap
and placed a purple gum stick (2") the stand to S's left and a pink
gum stick (2") on the stand to S's risht, saying:
Here, now I'll take a stick (1-7/8" dowel). 1'11 want you to showme the bigger piece of gum when i say so. IF you pick the biggerpiece, you can keep it. If you don't pick the biggest one with moregum to chew, you won't get gum this time, but you'll have anotherchance later. Watch me first.
(E stood pink gum and stick side by side on the stand.) Which isbigger? Point to the b1gger one. Yes, the _gum is bigger.
(E dropped the dowel back in 'the box and wrote on the protocol amoment. Then E took 2-1/8" dowel and stood it beside the greengum on the stand.) Which is bigger? Point to the bigger. one. Yas,the stick is Hues.
Now (pointing simultaneously to the two gum sticks), which gum Asbigger? You point to the bigger piece of gum with more to chew.How do you know it's bigger?
IfS was correct on both Items 1 and 2, E moved to Item 6. If S did not
use transitive inference on Item 1 but made the transitive pink choice
on Item 2, he was allowed to take the gum, and E moved to Item 5. If S
made the non-transitive purple choice, he was not allowed to take the gum,
192,.
and E moved to Item 3.
Item 3 was designed to assess whether S remrmhcred the Si2C rela-
tions of the gum sticks with the dowels, to provide a review of these
if S had forgotten, and to find whether this' help would result in change
to a correct response. E asked:
Which is bigger, the purple gum or the stick (pointing to purplegum)? Which is bigger, the pink gum or the stick (pointing to pinkgum)?
If S was incorrect on either question): No, see (E 'measured withdowel , as in Item 2), the stick/gum is bigger.
Which is bigger, the pink or purple gum (pointing to both simultaneously)Point to the bigger one. How do you know it's bigger?
Item 4 was a repeat of Item 2, to find whether the assistance provided
in Item 3 would result in use of transitive inference in a new situation
since a correct response to Item 3 might have occurred if S did not use
transitive inference but viewed E's help as an instruction to merely change
his choice. E placed a pink gum stick (21) on the stand to S's left and
a green (2 ") gum stick on the stand to S's right, repeating the procedures
as in Item 2 (measuring green gum with 1-7/8" dowel and pink with 2-1/8H
dowel). S was permitted to take the gum he selected, and Item 5 was
administered next.
Item 5 was a repeat of Item 1, to assess whether S had learned how
to measure and whether he could use the middle term to arrive at a
transitive inference after the helping Items. E placed a long yellow gum
stick (3-15/16') on the stand to S's left and a short purple gum stick
(3-13/16') on the stand to S's right. Instructions were identical to those
in Item 1. S was allowed to take the gum stick he chose. S selected
the short green gum, E terminated the test. If the long yellow gum was
selected, Items 6 and 7 were adMinistered.
Item 6 was designed to explore the S's possible reliance on the
193.
sing lc comparison of bigver cilp to shorter stick without reforent.ctp the
comoarison of shorter gum to longer stick. Also, it provided an opportunity
to assess S's view of the measurement of both gum sticks as a logical
necessity. E placed a green gum (2") on the stand to S's left and a pink
gum (2") on the stand to S's right, saying:
When I say so, I want you to tell me which of these is bigger, whichhas more sum to chew. If you pick the bigger one, you can have itto keep. If you don't pick the bigger one, you won't set gum thistime. Watch me first. (E measured the green gum with the shorter1-7/8" dowel.). Now, which gum is bigger (pointing to both)? 'Showme the bigger one. How do you know it's bigger?
E permitted the child to take the gum he selected and then placed a purple
gum (2") on the stand to S's left and a pink (2") on the stand to S's
right. The same instructions were given, and E measured the purple gum
with a lorGer (2-1/8") dowel.
Item 7 was designed to assess the use of transitive inference in a
situation where it contradicts a strong perceptual cue. E placed a shorter
purple gum stick (3-1/4') on the stand to S's left and a longer yellow
gum stick (33/4") on the stand to S's right, saying:
Now when I say so, I want you to tell me which of these is bigger,which has more gum to chew. if you pick the bigger one, you can haveit to keep. If you don't pick the bigger one, you won't get gumthis time. Look at both of them. Now watch me. (E measured purplegum with shorter dowel (3-1/8"). Which is bigger? Yes, the gum isbigger. (E replaced dowel in box and wrote momentarily on the protocal,then took longer dowel (3-7/8") and measured yellow gum.) Whichis bigger? Yes, the stick is bigger. Now (pointing to both gumsticks), which is bigger? You point to the bigger piece of gum withmore to chew. How do you know it's bigger?
If the child chose the yellow gum, E ascertained whether he had forgotten
the outcome of the measuring operation:
Which is bigger, the stick or the purple gum?Which is 13gger, the stick or the yellow gum?
If S gave incorrect responses, E again demonstrated the measuring and then
instructed S to take the bigger one. If the choice was changed, E asked,
"Why did you change your mind?" If the child selected the shorter purple
gum, E ascertained whether the perceptual disparity was noticed by saying,
"Yes. Which one looks bigger?" The child was allo...!ed to take the gum
selected.
Length Transitivity Scoring
1. Shows some use of transitive inference prior to help
+: Chooses longer on Q2Spontaneously measures and chooses longer on Ql (Note: "Spontaneously"is defined as comparison of both gums with the stick before E says,"Can you measure?")
2. Does not rely solely on simile conlparison of stick with loncler qum
+: Correct on Q6 when the longer Stick is measured against a shortergum stick
Wants to measure 'both gum sticks on Q6Incorrect selection occurs, but subject indicates that he can'treally know for sure when only one gum is measured, e.g., "Youonly measured that one."
3. At least makes transitive riference after help
+: Measures and picks longer on Qi and picks gum measured with shorterstick on Q2
Measures and picks longer on Q5 and picks gum measured with shorterstick on Q2
Measures and picks longer on Q5 and picks gum measured with shorterstick on Q4'
4. Makes use of transitive inference where there is no perceptualcontradiction
+: Measures and picks longer gum on Q1 and picks gum measured withshorter stick on Q2
5. Uses transitive inference in the face of strong_perceptual contradiction
+: On Q7, takes the shorter gum, but says the other looks biggerOn Q7, takes the shorter gum, but points to the longer one beforethe misleading measuring operation is performed
6. Consistently uses transitive inference throughout test.
+: At no time selects intransitive gum stick. c,r vacillates withuncertainty
Note: Spontaneous measuring is not required for success on Items 3 and4, as long as both gum sticks are compared with the stick at somepoint before the item is finished.
19().
RESULTS
Developmental Sequence
The foregoing set of items seem to describe an invariant developm2ntal
segunce of acquisition, on the basis of the following lines of evidence:
1. The items are ordered in terms of increasing difficulty. A
scalogram analysis using Green's (1956) summary statistics was Performed
which indicates that the six dichotomous items presented above Form a
Guttman scale (Table 89 shows reproducibilities and indices of consistency).
Table 90 presents the seven perfect scale patterns possible and indicates
the number of Ss in each ability group found for each scale type.
2. Increasing success on scale items occurs with increasing_age and
reflects the order of difficulty. Table 91 indicates that mean performance
tends to increase with age for bright and average children, although mean
performance for bright seven-year-olds drops somewhat behind that of bright
six-year-olds. The analysis of variance showed the age effe_ct to be
significant (F=3.17, df=2, 84, p <.05 for bright and average groups).
Table 92 shows that the lower scores tend to be made by younger children
and the higher scores by older children, with the exception noted above
regarding bright six- and seven-year-olds. These age trends are also
reflected in Table 93 which shows that the percentage of subjects succeeding
on each scale item increases with age, except for the older bright group.
3. Retesting of Ss after one year shows a general progression along
the scale. Table 94 indicates that of the 18 retested Ss, 17 either performed
at the same or higher levels, and that only 1 S scored at a lower level
at the second testing. Thus, the scale accounts quite well for the performance
changes in most Ss.
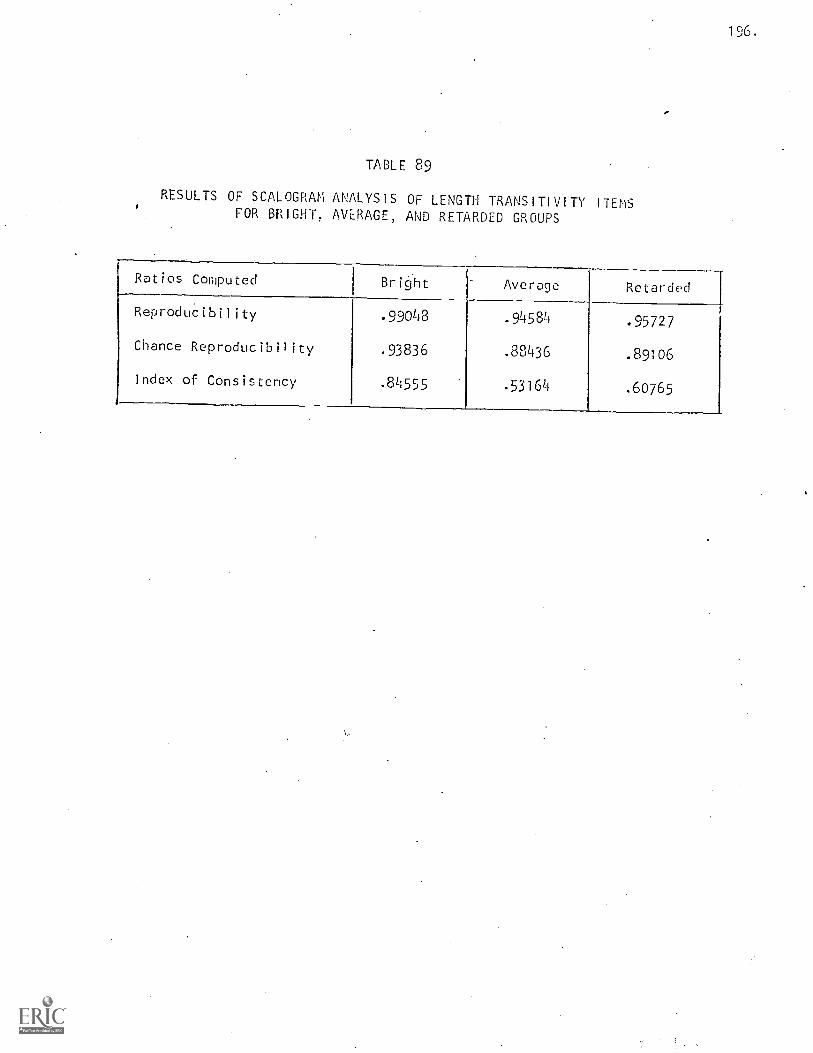
196.
TABLE 89
RESULTS OF SCALOGRAM ANALYSIS OF LENGTH TRANSITIVITY ITEMSFOR BRIGHT, AVERAGE, AND RETARDED GROUPS
Ratios Computed Bright Average Retarded
Reproducibility .99048 .94584 .95727
Chance Reproducibility .93836 .88436 .89106
Index of Consistency .84555 .53164 .60765
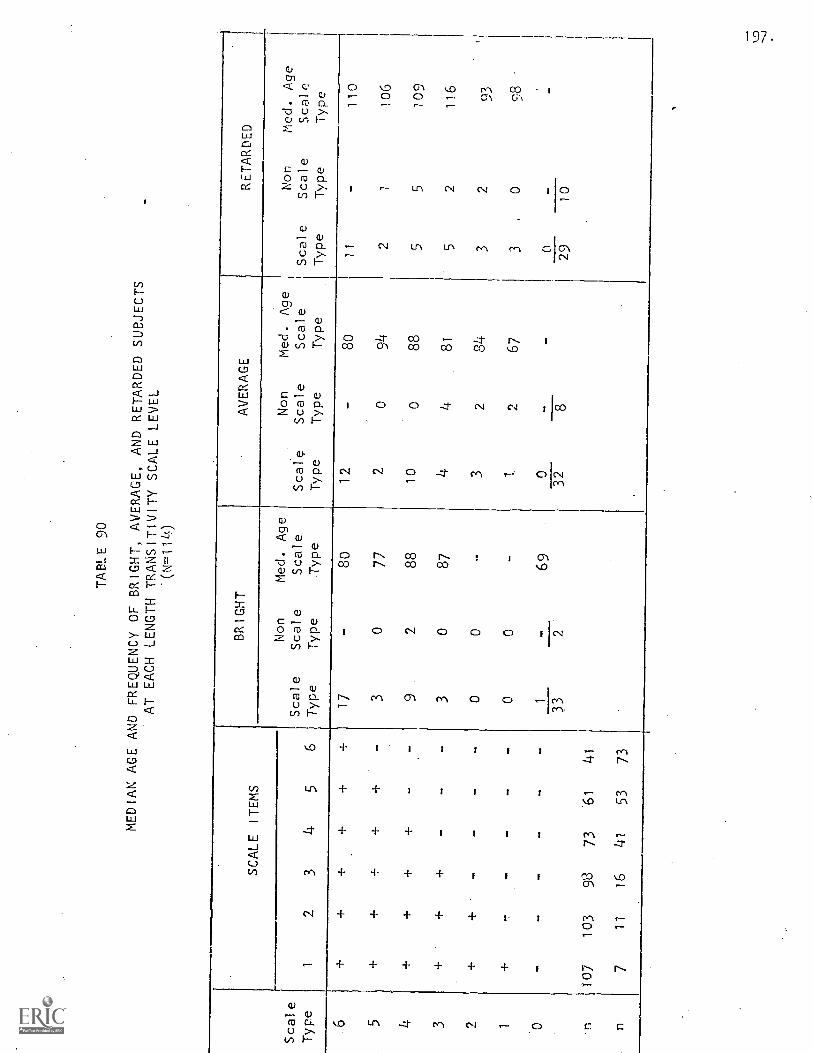
TABLE 90
MEDIAN AGE AND FREQUENCY OF BRIGHT,
AVERAGE, AND RETARDED SUBJECTS
AT EACH LENGTH TRANSITIVITY SCALE
LEVEL
.(N=11)
Scale
Type
SCALE
ITEMS
BRIGHT
AVERAGE
RETARDED
Scale
Type
Non
Scale
Type
Med. Age
Scale
Type
Scale
Type
Non
Scale
Type
Med. Age
Scale
Type
Scale
Type
Non
Med. Age
Scale
Scale
Type
Type
12
34
56
6+
++
++
+17
-80
12
-80
11
-110
5+
++
++
-3
077
20
94
21
106
4+
++
+-
-9
288
10
088
55
109
3+
++
--
-3
087
44
81
52
116
2+
o0
-3
2of.
oq
32
93
1+
--
--
00
-2 ,,
67
30
T8
0-
--
--
-1
-69
0-
0-
33
232
829
10
n107
103
98
73
61
41
n7
11
16
41
53
73
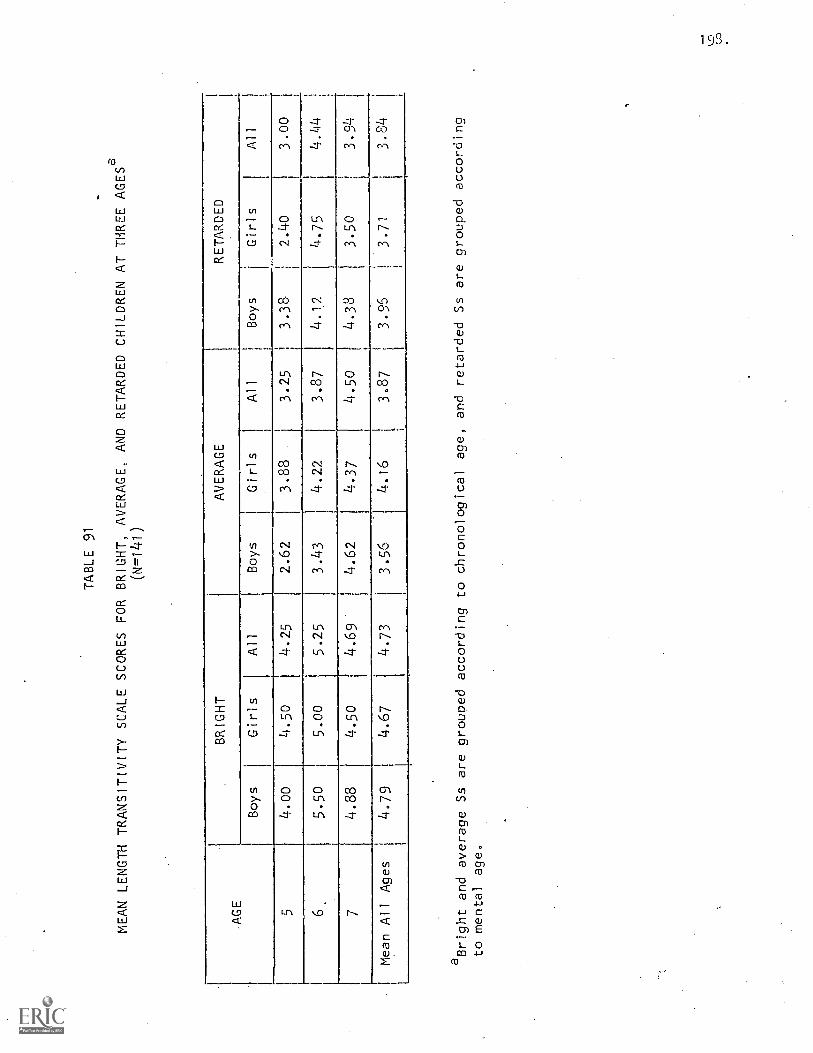
TABLE 91
MEAN LENGTH TRANSITIVITY SCALE SCORES FOR BRIGHT, AVERAGE, AND RETARDED
CHILDREN AT THREE AGES°
(N=141)
AGE
BRIGHT
AVERAGE
RETARDED
Boys
Girls
All
Boys
Girls
All
Boys
fGirls
All
-5
4.00
4.50
4.25
2.62
3.88
3.25
i3.38
2.40
3.00
6.
5.50
5.00
5.25
3.43
4.22
3.87
4.12
4.75
4.44
74.88
4.50
4.69
4.62
4.37
4.50
4.33
3.50
3.94Oli J
Mean All
Ages
4.79
4.67
4.73
3.56
4.16
3.87
3.96
3.71
3.84
aBright and average Ss are grouped according to chronological age,
and retarded Ss are grouped according
to mental age.
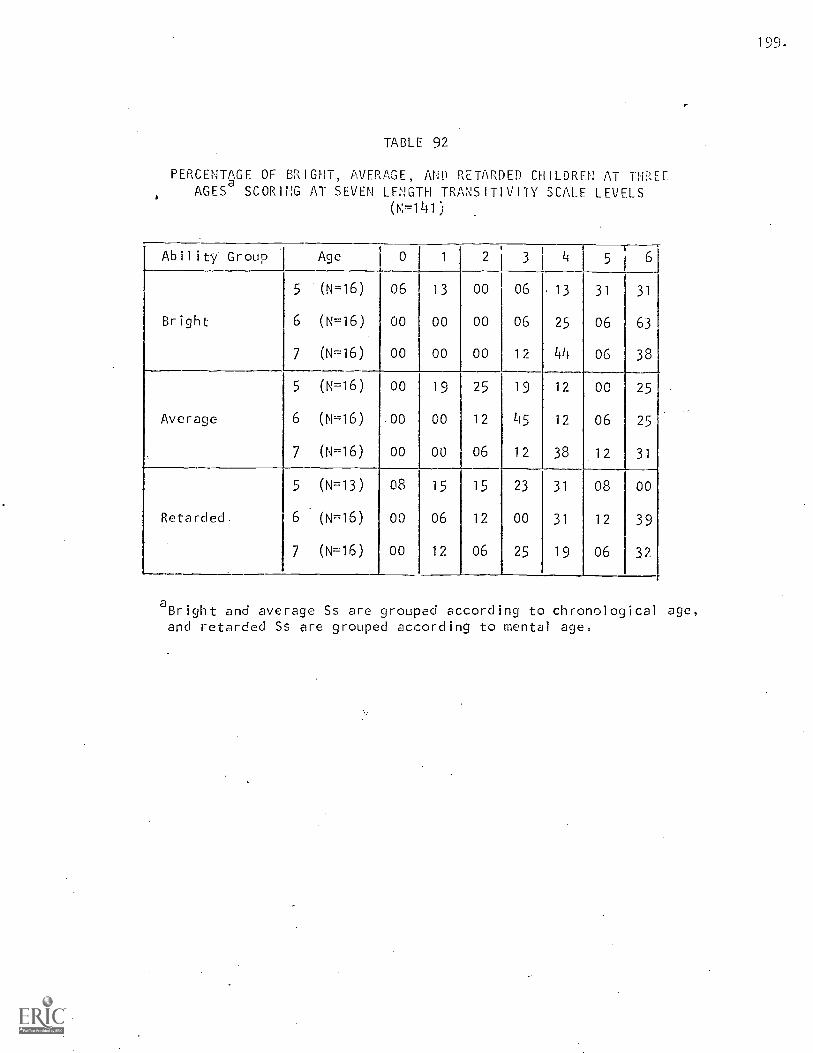
199.
TABLE 92
PERCENTAGE OF BRIGHT, AVERAGE, AND RETARDED CHILDREN AT THREEAGES
aSCORING AT SEVEN LENGTH TRANSITIVITY SCALE LEVELS
(11=141)
Ability Group Age 0 1 2 3 4 5 j 6
5 (N=16) 06 13 00 06 13 31 31
Bright 6 (N=16) 00 00 00 06 25 06 63
7 (N-16) 00 00 00 12 44 06 38
5 (N=16) 00 19 25 19 12 00 25
Average 6 (N=16) .00 00 12 45 12 06 25
7 (N=16) 00 00 06 12 38 12 31
5 (N=13) 08 15 15 23 31 08 00
Retarded. 6 (N=16) 00 06 12 00 31 12 39
7 (N=16) 00 12 06 25 19 06 32
aBright and average Ss are grouped according to chronological age,and retarded Ss are grouped according to mental age.
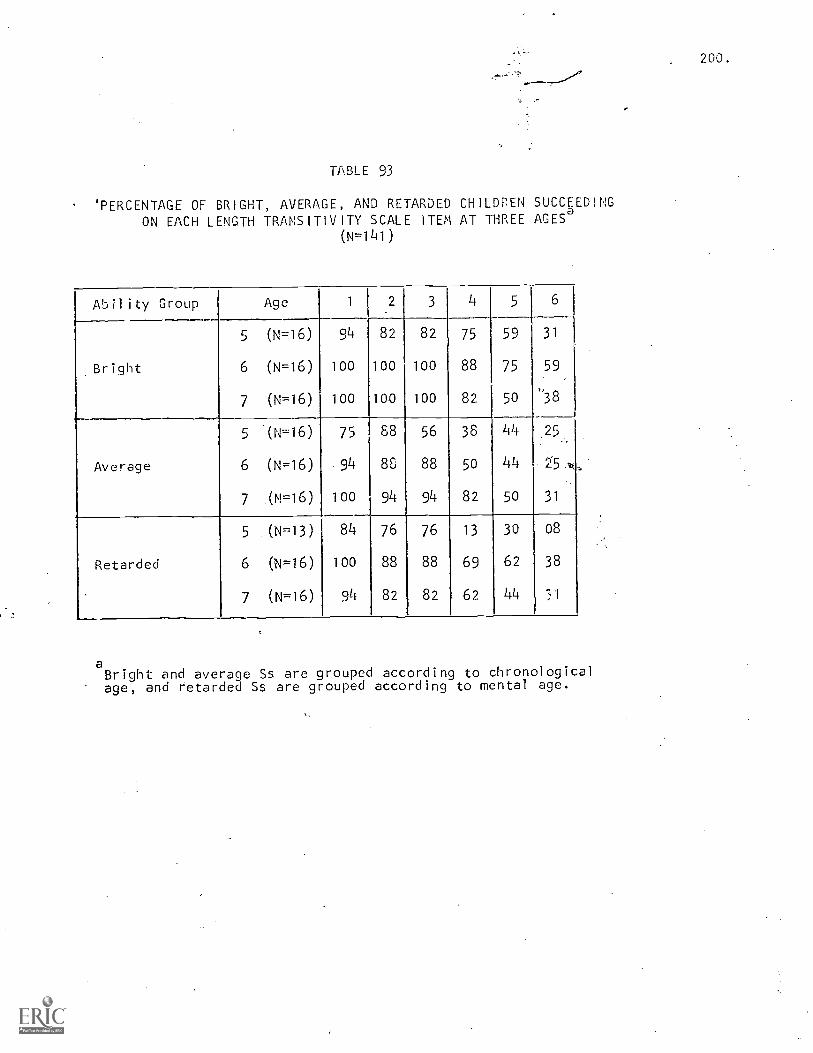
200.
TABLE 93
'PERCENTAGE OF BRIGHT, AVERAGE, AND RETARDED CHILDREN SUCCEEDINGON EACH LENGTH TRANSITIVITY SCALE ITEM AT THREE AGESa
(N=141)
Ability Group Age 1 2 3 4 5 6
5 (N=16) 94 82 82 75 59 31
Bright 6 (N=16) 100 100 100 88 75 59
7 (N=16) 100 100 100 82 5,0 ''38
5 (N=16) 75 1 88 56 38 44 25
Average 6 (N=16) -94 88 88 50 44 25.'4,,
7 (N=16) 100 94 94 82 5o 31
5 (N =13) 84 76 76 13 30 08
Retarded 6 (N=16) 100 88 88 69 62 38
7 (N=16) 94 82 82 62 44 7,1
aBright and average Ss are grouped according to chronologicalage, and retarded Ss are grouped according to mental age.
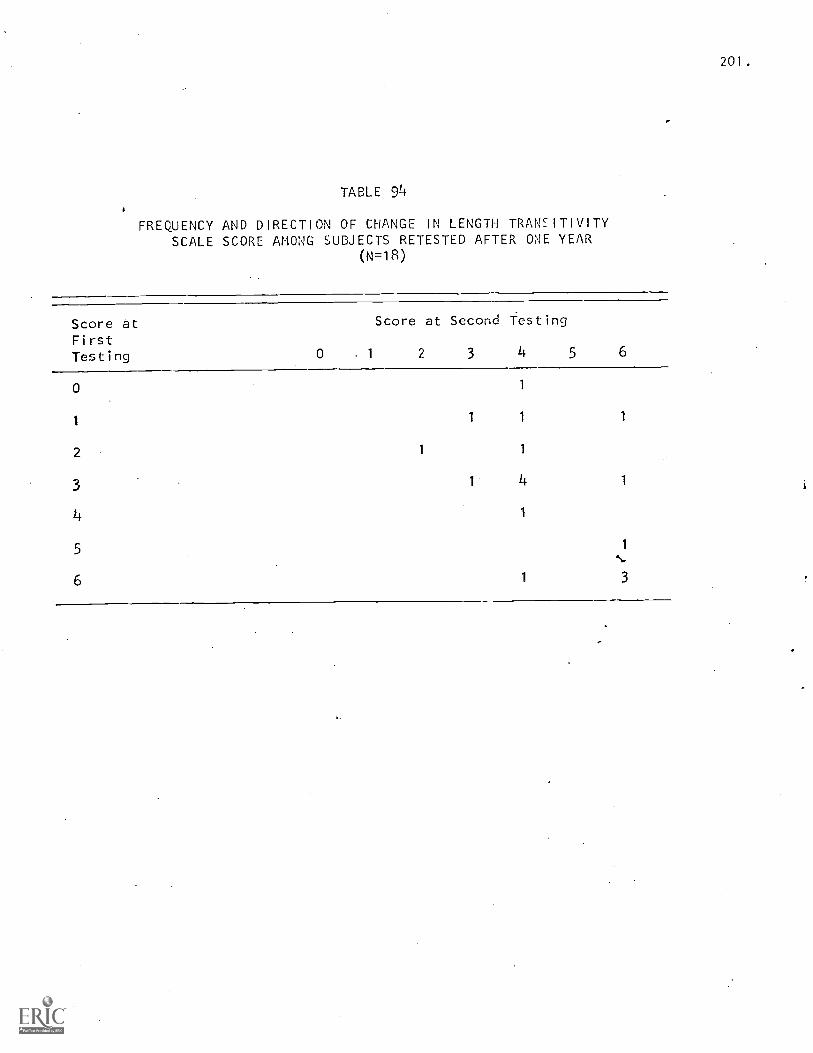
201.
TABLE 94
FREQUENCY AND DIRECTION OF CHANGE IN LENGTH TRANSITIVITYSCALE SCORE AMONG SUBJECTS RETESTED AFTER ONE YEAR
(N=18)
Score atFirstTesting
Score at Second Testing
0 1 2 3 4 5 6
0 1
1 1 1 1
2 1 1
3 1 4 1
4 1
202.
Effect of Intelligence on Performance
Sequential n. '-r on Acquisition
nalysis performed separately for each IQ group indicatedthht L, of difficulty of scale items does not vary for groups
differing in IQ (see Table 89).
Level of Performance
Bright children's performance is better than than that of averageand retarded children (see Table 91). The analysis of variance indicated
this difference is statistically significant (F=7.72, df=1, 84, p< .0007for bright and average groups). However, the difference in performance of
average children and retardates of the same mental age is not significant.
Mental age appears to be a more potent factor than IQ in acquisition oftransitive inference.
Sex Differences
No significant sex differences appeared, but once again the patternof girls being somewhat superior at lower ages and inferior at age sevenappears.
********************NOTE: Pages 203-214 are not available for reproduction at this time.
This section is copyrighted 1970 by the Society for Research in ChildDevelopment, Inc. This section, The Development of Role-Taking asReflected by Behavior of Bright, Average, and Retarded Children in aSocial Guessing Game," is available in Child Development v41 n3,p759-770, September 1970.
215.
RELATIONS AMC G PIAGET, PSYCHOMETRIC, ACHIEVEMENT, AND INKBLOT ASSESSMENTS
A previous factor-analytic (Kohlberg and DeVries, 1969) supported
the notion that Piagetian assessments tap something quite general and
diqtinct from hereditary general intelligence. That factor analysis of
performance on a battery of psychometric tests and Piaget tests defined
a first psychometric factor, a second Piaget conservation factor, and a
third Piaget classification factor. The present study was designed to
explore the relationship of Piagetian assessments to standardized achieve-
ment measures and to measures of performance on a projective inkblot task.
Tables 95-103 present the factors and loadings of var'r'is groupings of
these measures. Analyses were made of 1) Piaget tests and Stanford-Binet
MA (Table 95), 2) Piaget tests and Stanford-Binet IQ (Table 96),3) Piaget
tests, California Test of Mental Maturity (CTMM), and Stanford-Binet
MA (Table 97), 4) Piaget tests, CTMM, and Stanford-Binet IQ (Table 98),
5) Metropolitan Test of Achievement (MAT), and Stanford-Binet MA (Table
99), 6) Piaget tests, MAT, and Stanford-Binet IQ (Table 100), 7) Piaget
tests and Thorpe's HIT Developmental Variables (Table 101), 8) Piaget
tests, Developmental Variables, and CTMM (Table 102), and 9) Piaget tests,
Developmental Variables, and MAT (Table 103). Since some Ss (83 Ss)
had been given the California Test and some the Metropolitan (56 Ss), and
since no retardates had been given any achievement tests, these analyses
together provide the composite for study.
It is clear that the mental age measure is more closely associated
with Piagetian measures than IQ, and that measures of achievement are
related only to the more difficult Piagetian tasks. The CTMM factor
includes S-B MA, Class Inclusion, Left-Right Perspective, Magic Concepts
and Dream Concepts, but the MAT factor includes no Piagetian tasks except
for a low loading of Sibling Egocentrism. It is interesting that the MAT
216.
Arithmetic measure loads on a different factor than Number Conservation.
In summary, the findings indicate that achievement tests and Piaget tests
are tapping generally different aspects of cognitive functioning.
Tables 101-103 preseot the results of factor analyses of Piaget
assessments, achievement measures, and assessments of inkblot projections
d by Thorpe (1960) from Holtzman's (1961) scoring variables.
ILrary to expectation, Thorpe's developmental indices are not generally
associated either with Piagetian measures or achievement measures. The
MAT, particularly, is defined by a factor separate from both Piagetian
and inkblot measures. In summary, it appears that measures of inkblot
performance also tap an aspect of functioning separate from both Piagetian
and achievement measures.
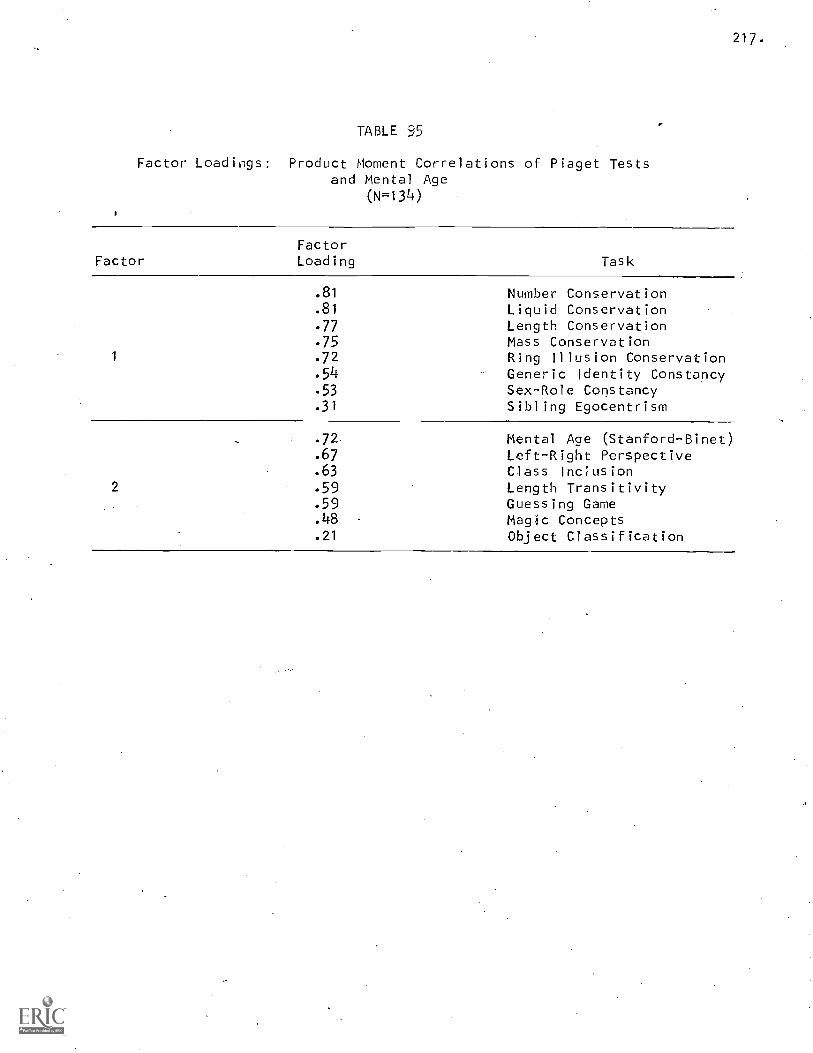
217.
TABLE 95
Factor Loadings: Product Moment Correlations of Piaget Testsand Mental Age
(N=134)
FactorFactorLoading Task
1
.81 Number Conservation
. 81 Liquid Conservation
.77 Length Conservation
. 75 Mass Conservation
.72 Ring Illusion Conservation
.54 Generic Identity Constancy. 53 SexRole Constancy. 31 Sibling Egocentrism
2
.72= Mental Age (Stanford-Binet)
.67 Left-Right Perspective
. 63 Class Inciusion
.59 Length Transitivity
.59 Guessing Game
.48 Magic Concepts
.21 Object Classification
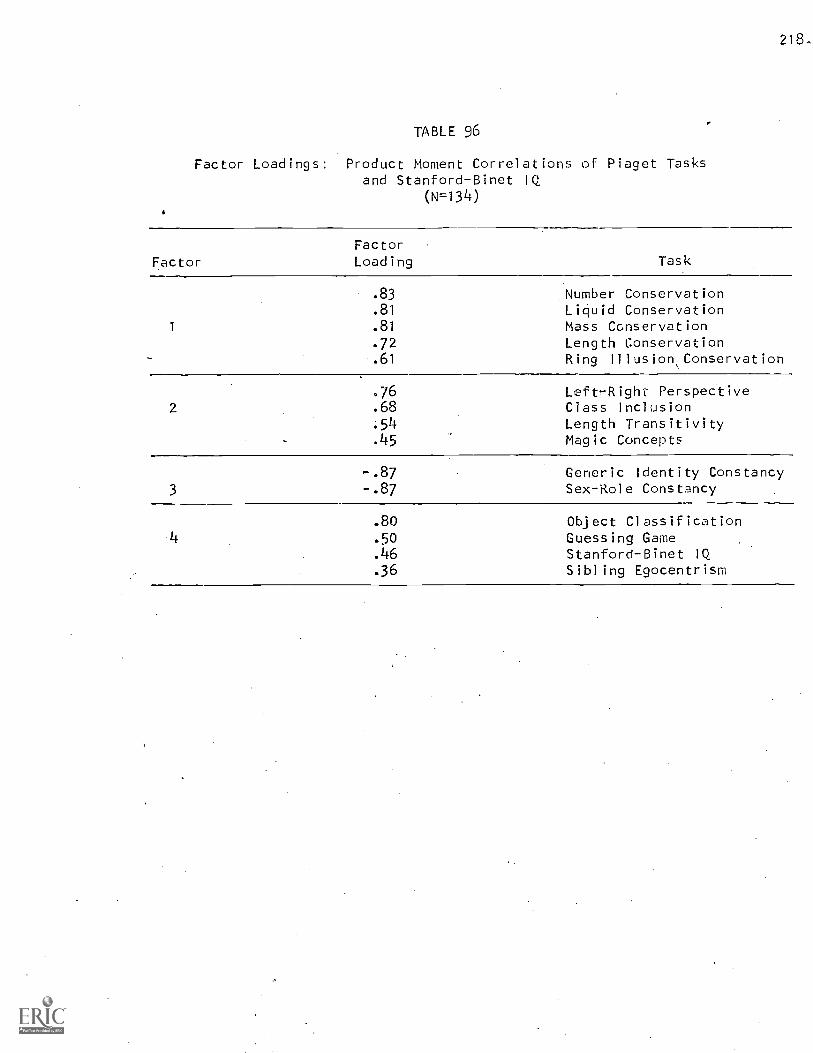
218..
TABLE 96
Factor Loadings: Product Moment Correlations of Piaget Tasksand Stanford-Binet IQ
(N=134)
FactorFactorLoading Task
1
83 Number Conservation.81 Liquid Conservation.81 Mass Conservation.72 Length Conservation.61 Ring Illusion,Conservation
2
.76 Left-Right Perspective
.68 Class Inclusion
.54 Length Transitivity
.45 Magic Concepts
3
-.87 Generic Identity Constancy-.87 Sex-Role Constancy
.80 Object Classification
.50 Guessing Game
.46 Stanford-Binet IQ
.36 Sibling Egocentrism
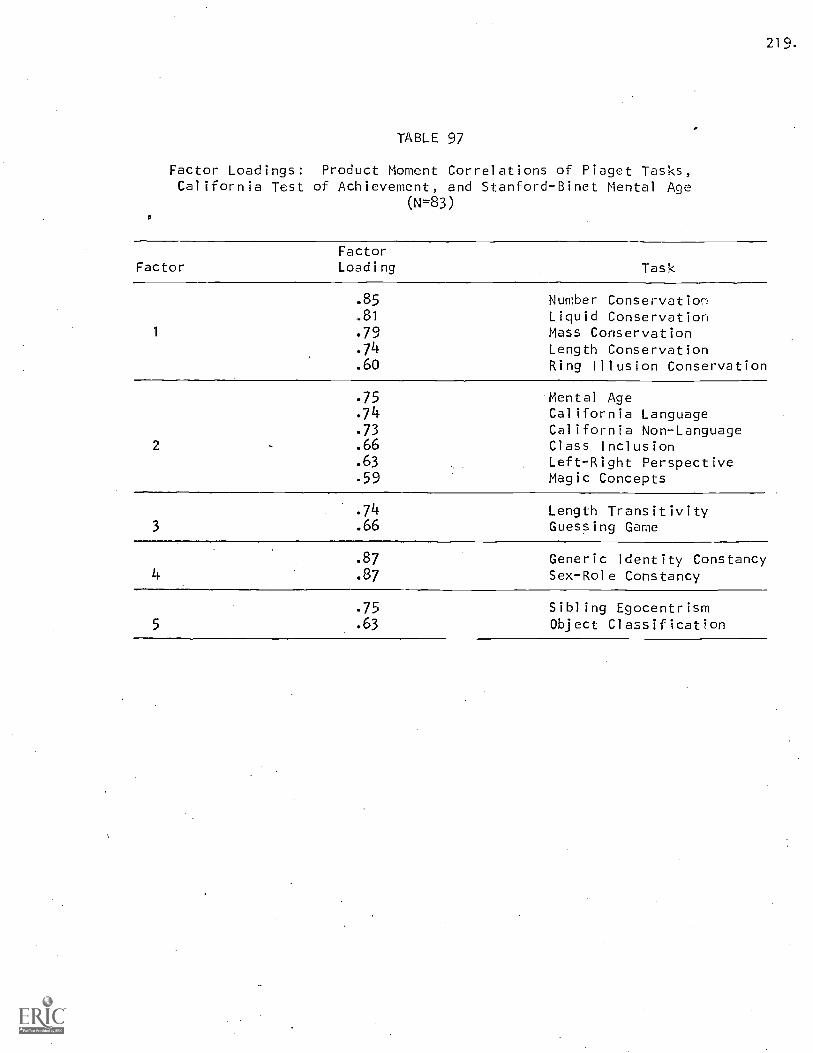
TABLE 97
Factor Loadings: Product Moment Correlations of Piaget Tasks,California Test of Achievement, and Stanford-Binet Mental Age
(N=83)
FactorFactorLoading Task
1
.85 Number Conservation
.81 Liquid Conservation
.79 Mass Conservation
.74 Length Conservation. 60 Ring Illusion Conservation
219.
2
. 75 Mental Age
.74 California Language. 73 California Non-Language. 66 Class Inclusion. 63 Left-Right Perspective. 59 Magic. Concepts
.74 Length Transitivity3 .66 Guessing Game
.87 Generic Identity Constancy4 .87 Sex-Role Constancy
. 75 Sibling Egocentrism5 .63 Object Classification
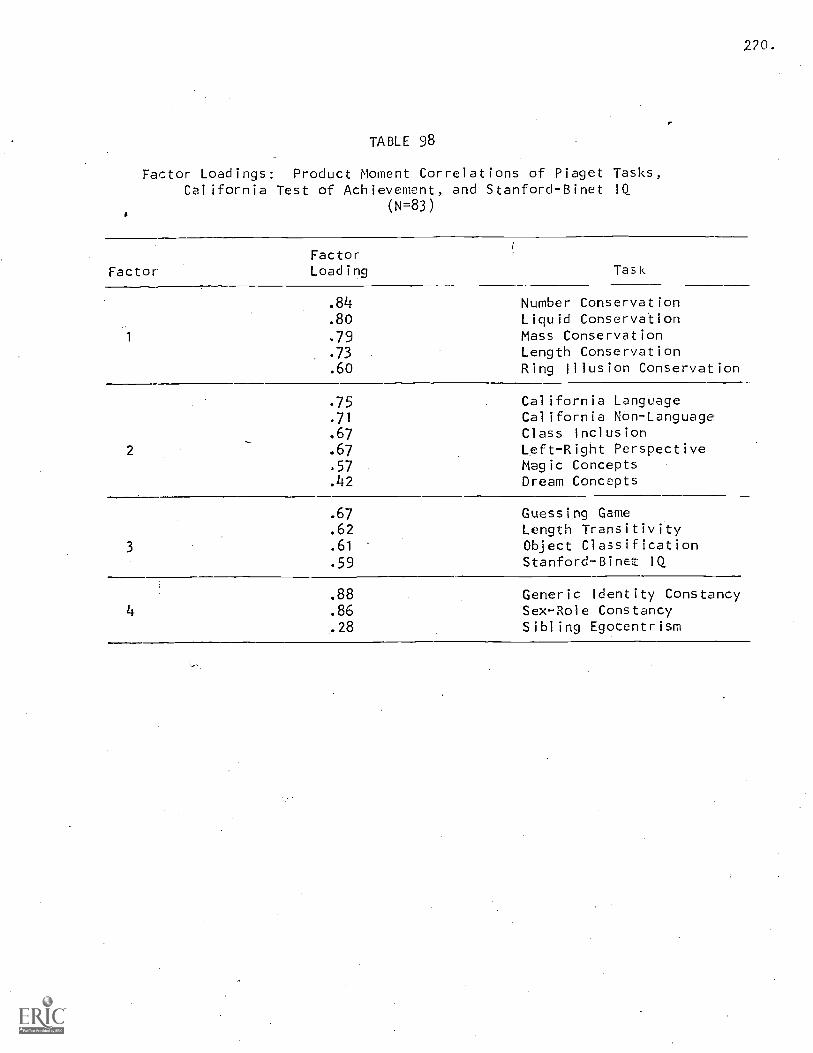
220.
TABLE 98
Factor Loadings: Product Moment Correlations of Piaget Tasks,California Test of Achievement, and Stanford-Binet IQ
(N=83)
FactorFactorLoading Task
.84 Number Conservation
.80 Liquid Conservation
.79 Mass Conservation
.73 Length Conservation
.60 Ring Illusion Conservation
2
.75 California Language
.71 California Non-Language
.67 Class Inclusion
.67 Left-Right Perspective57 Magic Concepts
.42 Dream Concepts
3
.67 Guessing Game
.62 Length Transitivity
.61 Object Classification
.59 Stanford-Binet IQ
4
.88 Generic Identity Constancy
.86 Sex-Role Constancy,28 Sibling Egocentrism
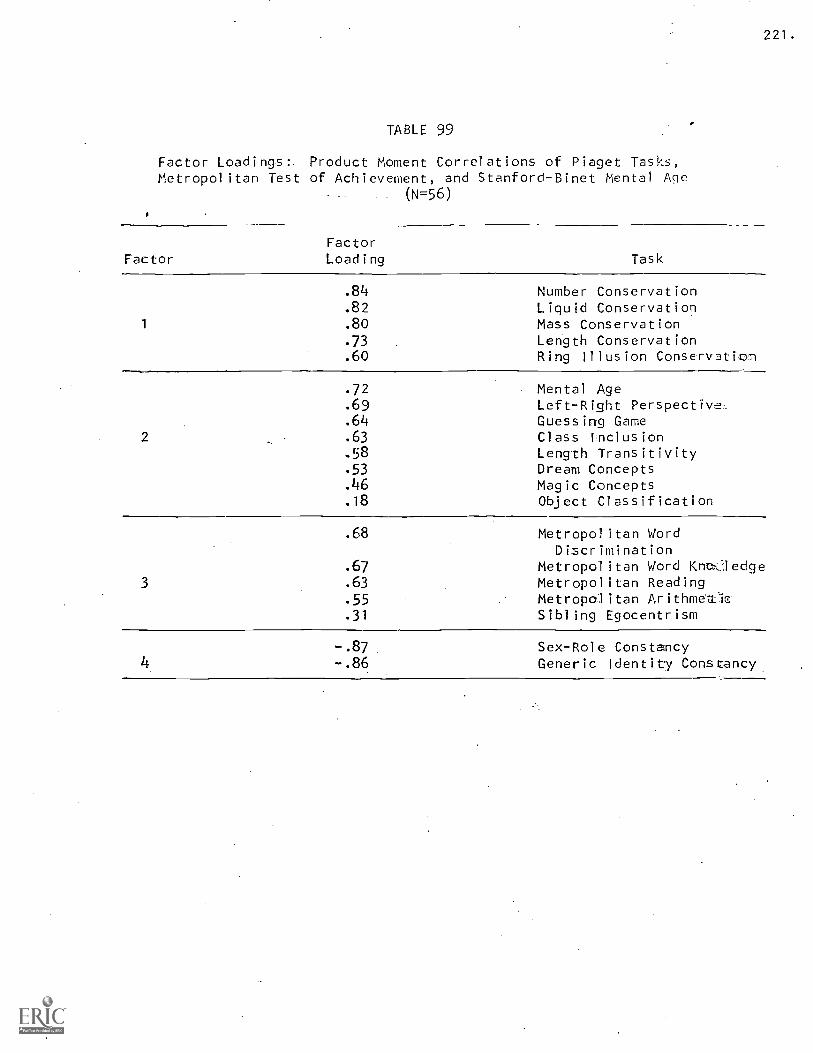
TABLE 99
Factor Loadings:. Product Moment Correlations of Piaget Tasks,Metropolitan Test of Achievement, and Stanford-Binet Mental Age
(N=56)
FactorFactorLoading Task
221.
1
. 84 Number Conservation
.82 Liquid Conservation
. 80 Mass Conservation
.73 Length Conservation
. 60 Ring Illusion ConservDtiom
2
. 72 Mental Age.69 Left-Right Perspective.64 Guessing Game. 63 Class Inclusion.58 Length Transitivity..53 Dream Concepts.46 Magic Concepts.18 Object Classification
3
.68 Metropolitan WordDiscrimination
.67 Metropolitan Word Kno.J edge
.63 Metropolitan Reading
. 55 Metropolitan Arithmet)c
.31 Sibling Egocentrism
-.87 Sex-Role Constancy-.86 Generic Identity Constancy.
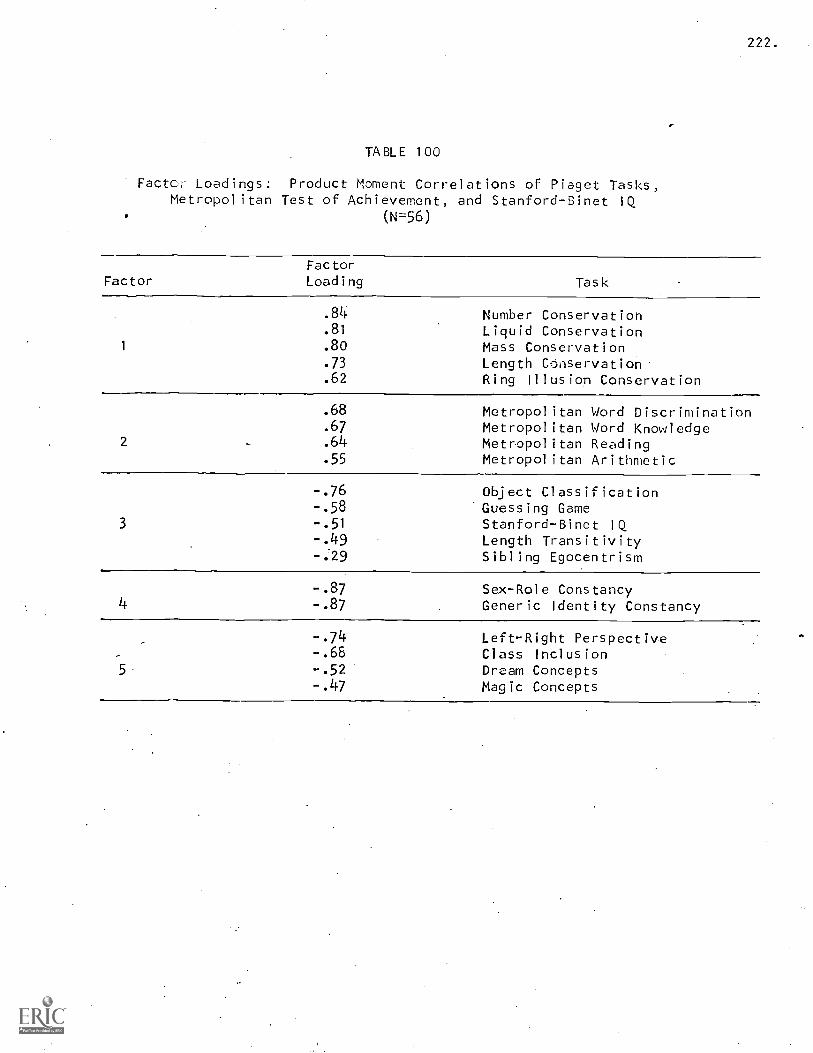
222.
TABLE 100
Facto =r Loadings: Product Moment Correlations of Piaget Tasks,Metropolitan Test of Achievement, and Stanford-Binet IQ
(N=756)
FactorFactorLoading Task
1
.84 Number Conservation
.81 Liquid Conservation
.80 Mass Conservation
.73 Length C6nservation.
.62 Ring Illusion Conservation
2
.68 Metropolitan Word Discrimination
.67 Metropolitan Word Knowledge
.64 Metropolitan Reading
.55 Metropolitan Arithmetic
3
-.76 Object Classification-.58 Guessing Game-.51 Stanford-Binet IQ-.49 Length Transitivity
Sibling Egocentrism
-.87 Sex-Role Constancy-.87 Generic Identity Constancy
5
-.74 Left-Right Perspective-.66 Class Inclusion-.52 Dream Concepts-.47 Magic Concepts
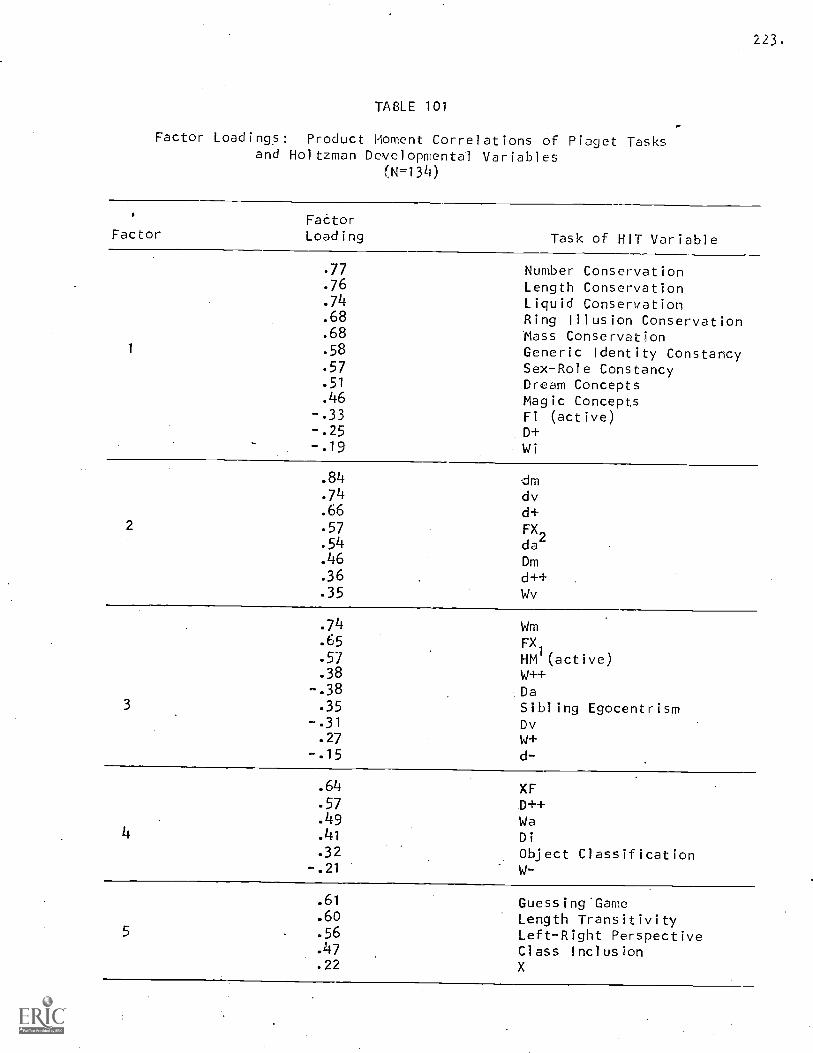
223.
TABLE 101
Factor Loadings: Product Moment Correlations of Piaget Tasksand Holtzman Developmental Variables
(N=134)
FactorFactorLoading Task of HIT Variable
1
.77 Number Conservation
.76 Length Conservation
.74 Liquid Conservation
.68 Ring Illusion Conservation
.68 Mass Conservation
.58 Generic Identity Constancy
.57 Sex-Role Constancy
.51 Dream Concepts
.46 Magic Concepts-.33 Fi (active)-.25 D+-.19 Wi
2
.84 dm
.74 dv
.66 d+
.57 FX
.54 da2
.46 Dm
.36 d++
.35 Wv
3
.74 Wm
.65 FX
. 57 HM1 (act ive)
.38 1./++
-.38 Da. 35 Sibling Egocentrism
-.31 Dv. 27 W+
-.15 d-
4
. 64
. 57
. 49
.41
. 32
-.21
XFD++WaDi
Object ClassificationW-
5
.61 Guessing.Game
.60 Length Transitivity
.56 Left-Right Perspective
.47 Class Inclusion
.22 X
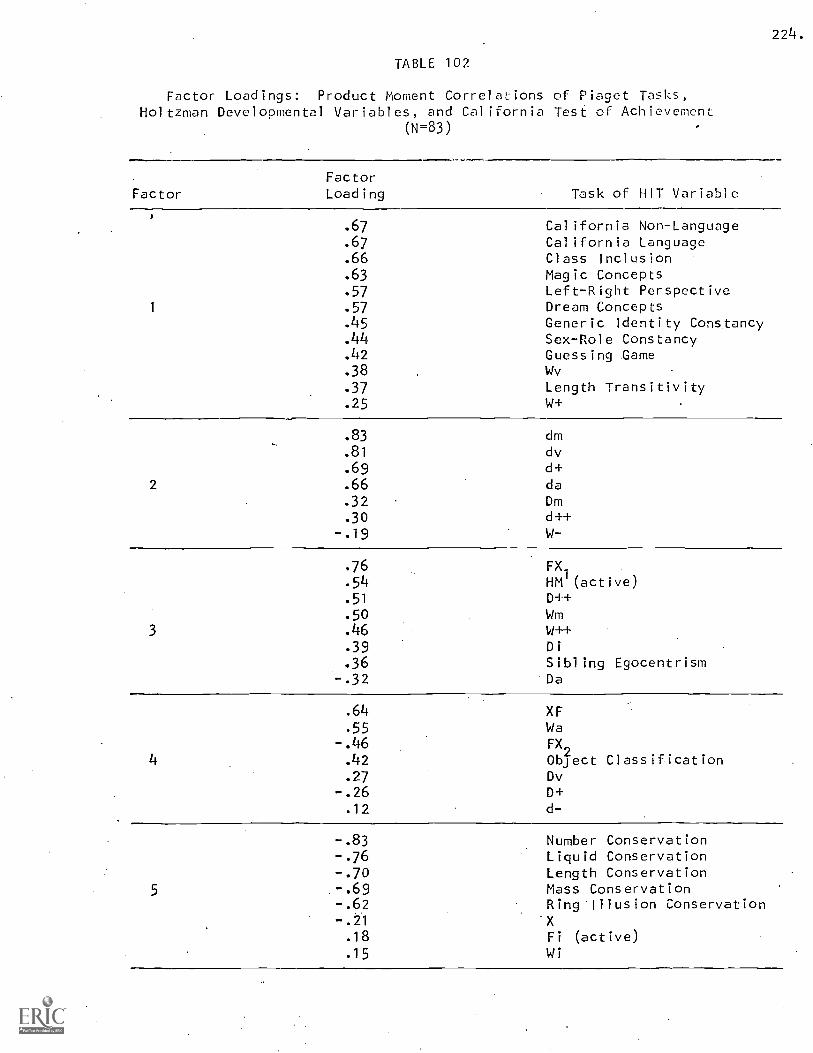
224.
TABLE 102
Factor Loadings: Product Moment Correlaions of Piaget Tasks,Holtzman Developmental Variables, and California Test of Achievement
(N=83)
FactorFactorLoading Task of HIT Variable
1
.67
.67
.66
.63
.57
.57
.45
.44
.42
.38
California Non-LanguageCalifornia LanguageClass InclusionMagic ConceptsLeft-Right PerspectiveDream ConceptsGeneric Identity ConstancySex-Role ConstancyGuessing GameWv
.37 Length Transitivity
.25 W+
.83 dm
.81 dv
.69 d+2 .66 da
.32 Dm
.30 d++-.19 W-
.76 FX
.541
HM (active).51 D+.50 Wm
3 .46 W++.39 Di
.36 Sibling Egocentrism-.32 Da
.64 XF
.55 Wa-.46 FX
4 .42 Object Classification.27 Dv
-.26 D+.12 d-
-.83 Number Conservation-.76 Liquid Conservation-.70 Length Conservation
5 -.69 Mass Conservation-.62 Ring Illusion Conservation-.21 X
.18 Fi (active)
.15 Wi
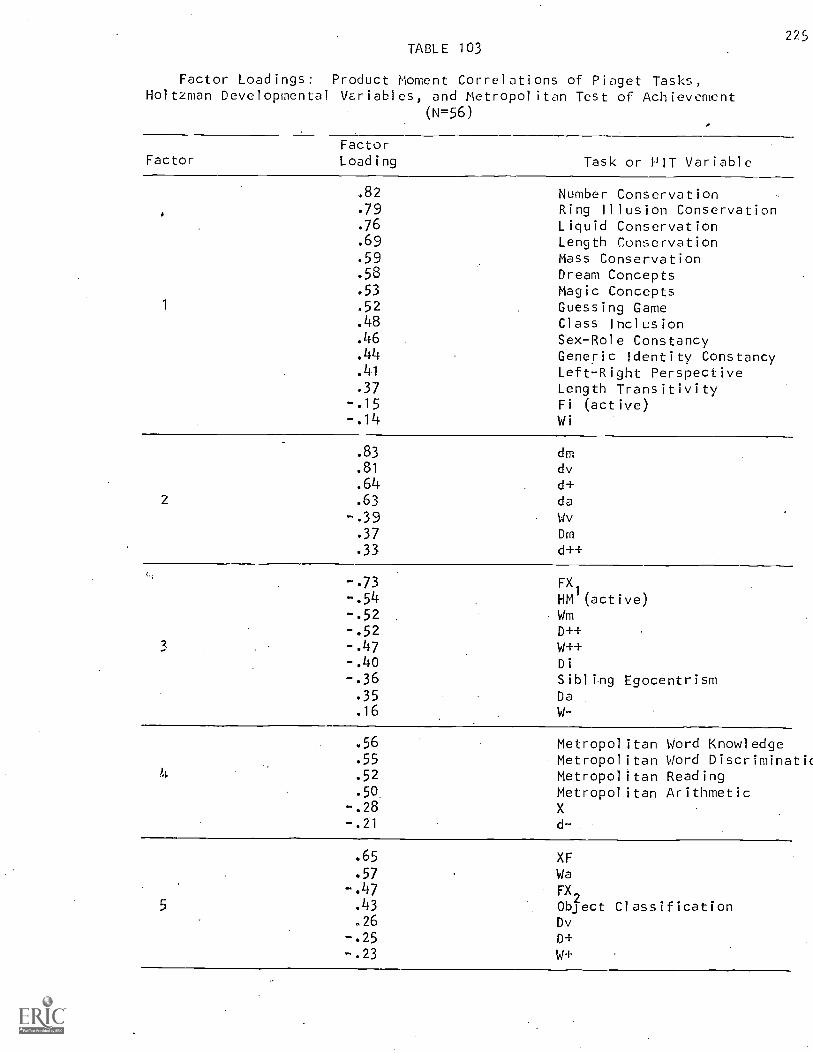
225TABLE 103
Factor Loadings: Product Moment Correlations of Piaget Tasks,Holtzman Developmental Variables, and Metropolitan Test of Achievement
(N=56)
FactorFactorLoading Task or PIT Variable
1
.82 Number Conservation
. 79 Ring Illusion Conservation
.76 Liquid Conservation
.69 Length Conservation
.59 Mass Conservation
.58 Dream Concepts
.53 Magic Concepts
.52 Guessing Game. 48 Class Inclusion. 46 Sex-Role Constancy.44 Generic Identity Constancy. 41 Left-Right Perspective.37 Length Transitivity
-.15 Fi (active)-.14 Wi
2
. 83 dm
. 81 dv
.64 d+
. 63 da
-.39 Wv
. 37 Dm
. 33 d++
3
-.73 FX1
-.54 HM (active)-.52 Wm-.52 D++-.47 w++-.40 Di
-.36 Sibling Egocentrism. 35 Da. 16 W-
.56 Metropolitan Word Knowledge
. 55 Metropolitan Word Discriminatic
.52 Metropolitan Reading. 50- Metropolitan Arithmetic
-.28 X-.21 d-
5
.65 XF
.57 Wa-.47 FX
2.43 Object Classification.26 Dv
-.25 D+-.23 W+
226.
EDUCATIONAL IMPLICATIONS
The implications of this study for education center upon what is
usually considered the definitive objective of public education: the
intellectual growth 'of the child, These concern the nature of inteliigence,
its course of growth, its assessment, and its development in children more
and less relatively well-endowed.
Individual intellectual power has been traditionally assessed with
psychometric intelligence tests, and intellectual growth has been assessed
with standardized achievement tests. The findings of this study, taken
together with those of a previous study (Kohlberg and DeVries, 1969),
suggest that these measurement techniques provide limited measures of
cognitive functioning. The fact that Piagetian assessments measure aspects
of the intellect different from what is measured by either intelligence
tests or achievement tests suggests that they and other such measures
should be seriously considered for use in assessing cognitive growth.
It is suggested that the Piagetian methods actually provide a clearer
assessment of reasoning process and the quality of thought than the
standardized measures which tend to provide an assessment of thought
product. Achievement tests, psychometric tests, and Piaget-type tests
are all probably important and desirable assessments, but it is necessary
to be clear about what each measures and how each is limited in its
assessment. The development of reasoning abilities, usually cited as
a, if not the, high-priority objective of schooll.'q, are more appropriately
assessed by Piaget-type methods.
It is significant that even though the CTMM subtests were supposed
to measure different intellectual skills, these subtests loaded on the
same factor and were highly correlated. The CTMM Language Subtest correlated
.49 with the Non-Language Subtest. The MAT Subtests together defined a
227.
separate factor, but their intercorrelations were not high (ranging .17
to .30). Thus, these achievement subtests appear to be measuring areas
of functioning more similar than dissimilar when placed in the context
of,Piagetian task functioning. In this regard, it is also interesting to
note that the MAT Arithmetic test loads on a different factor than does
Number Conservation, and that these two tasks correlate only .07. Thus,
it appears that the arithmetic achievement test fails to measure a most
basic aspect of number knowledge which is necessary for elementary
arithmetic tasks.
The study clearly indic;ces that the sequence of acquisition of the
skills assessed by these Paget -type tasks is the same For children
differing in psychometrically-defined intelligence. This suggests that
curricula designed to facilitate developmental progression in these
areas might not need to be generally different for groups differing in
I Q.
It is significant that psychometric mental age is a better predictor
of performance in Piagetian tasks than IQ. Even bright children 5-7 years
of age exhibit preoperational thought on the Piagetian tasks. At age
5, bright children appear to be more, like average children on most of the
tasks. However, bright children move through the stage sequence faster
than average children, and they are in general superior to average
children in their reasoning. Nonetheless, even bright children at age 7
have not generally completed the transition to concrete operational
thought. it is a mistake, therefore, for educators to assume the young
bright child's reasoning is as mature as his vocabulary and language
development might suggest. Similarly, the reasoning of retardates mentally
aged 5-7 years is little different from that of average children comparable
in mental age. 'However, on two tasks, retardates are superior to average
228.
children (Constancy of Generic Identity and Sex-Role Identity), and on
five other tasks (Liquid, Length, Magic, and Dream) they are superior
at mental age 7 years. This may suggest that the greater general experience
of the retardates has contributed to their advance in some areas of
reasoning. Thus, it is a mistake fDr special educators of young retarded
children to assume that their reasoning is quite as immature as their
vocabulary and language development might suggest. It should be cautioned,
however, that this picture might be and probably is, very different when
one considers children of higher mental age. There is likely a point
beyond which retardates do not go, and this point may be prior to the
level of formal operations on some reasoning process abilities.
In summary, the study of cognitive development with Piaget-type
tasks points out some limitations of traditional achievement tests in
assessing intellectual competence and indicates that Piaget-type tests
provide an assessment of a different and important dimension to intellectual
functioning.
Footnotes
1 Since the goal here is diagnostic rather than educational, the child'sspontaneous way of thinking is reinforced.
2Q12-13 were added to the procedure midway in the testing as a result ofa spontaneous comment by a bright six-year-old. He correctly identifiedE's right and left hands as she faced him and said, "Ha, ha, you know howI know.? My college sister told me it's always opposite for the other person!"This suggested the possibility that he might be answering the Q correctlywithout really understanding the relativity. In order to explore this,E turned her back to him, asked him to identify her hands, and discoveredthat he then incorrectly labelled them as a result of applying his verbalrule. Therefore, only 79 Ss were storable on all scale items, and thescaling results reported are based on these Ss.
3These non-scale types are patterns of scores different from the perfectpatterns shown. The individual's scale score is simply the number-of itemspassed.
4Scale Item 1 is probably improperly included as part of the developmentalsequence. However, it contributed little error (only 3 Ss with non-random patterns failed Item 1).
5Recipe: Mix together 1/3 cup margarine, 1/3 cup white syrup, 1/2 teaspoonsalt, 1 teaspoon vanilla, and 3-1/2 cups powdered sugar. Add red foodcoloring to make bright pink candy.
REFERENCES
Almy, Millie. Young Children's Thinking: Studies of Some Aspects ofPiaget's Theory. New York: Horace Mann-Lincoln Institute of SchoolExperimentation, Teachers College, Columbia University, 1.36.
Allies, Louis Bates, Learned, Janet, Metraux, Ruth. ker, R7,7 .are, ChildRorschach Responses: Developmental Trends fr....;m Two tc n Years.New Yor : Paul B. Hoeber, Inc., 19521.
Beck, Samual J. The Rorschach Exriment. New York: Grune and Stratton,1960.
Bentler, Peter. "Monotonicity AnFlysis: An Alternative to LineE1,- Factorand Test Analysis," Paper presented at the Symposium on OrdinalScales of Development. Monterey, California, 1969.
Bruner, J. S. "On the Conservation of Liquids," in J. S. Bruner, RoseR. Olver, and Patricia M. Greenfield (Eds.). Studies in CognitiveGrooith. New York: Wiley, 1966, pp. 183-207.
Charlesworth, W. R. "Instigation and Maintenance of Curiosity Behavioras a Function of Surprise Versus Novel and Familiar Stimuli,"Child Development, 1964, 35, 1169-1186.
DeVries, Rheta. Constancy of Generic Identity in the Years Three toSix, Monograph of the Society for Research in Child Development,1969, Serial No. 127, Vol. 34(3)0
DeVries, Rheta. "The Development of Role-Taking in Young Bright, Average,and Retarded Children as Reflected in Social Guessing-Game Behavior,"Child Development, September, 1970.
Elkind, David. "Piaget's Conservation Problems," Child Development,1967, 38, 15-27.
Flavell, John H. The Developmental Psychology of Jean Piaget. Princeton,New Jersey: D. Van Nostrand Company, inc., 1963.
Ford, Mary. The Application of the Rorschach Test to Young Children.Minneapolis: University of Minnesota Press, 19460
Gair, Mollie. "Rorschach Characteristics of a Group of Very SuperiorSeven-Year-Old Children," Rorschach Research Exchange, 1947, 8, 10-30.
Griffiths, Judith, Shantz, Carolyn, and Sigel, I.E. "A MethodologicalProblem in Conservation Studies: The Use of Relational Terms,"Child Development, 1967, 38, 841-848.
Holtzman, Wayne, Thorpe, Joseph S., Swartz, Jon D., Herron, E. Wayne.Inkblot Perception and Personality: Holtzman Inkblot Technique.Austin, Texas: University of Texas Press, 1961.
Hunt, J. McVicker. Intelligence and Experience. New York: Ronald, 1961.
Kohlberg, Lawrence. "Cognitive Stages and Preschool Education," HumanDevelopment, Vol. 6, Nos. 1-2, 1966.
Kohlberg, Lawrence. Stages in Children's Conceptions of Physical andSocial Objects. Unpublished monograph, in preparation as a book,1963.
hlberg, Lawrence and DCfries, Rheta. "Relations between Piaget andPsychometric Assessments of Intelligence," Paper presented to Symposiumon the Natural Curriculum of the Child, to be published in Proceedingsof Symposium on the Natural Curriculum of the Child, Urbana, Illinois:University of Illinois Press, 1969.
Ledwith, Nettie H. Rorschach Responses of Elementary School Children:A Normative Study. Pittsburgs: University of Pittsburgs Press,1959.
Meyer and Thompson, "The Performance of Kindergarten Children on theRorschach Test: A Normative Study," Journal of Projective Technique,1952, 16, 86-111.
Piaget, Jean. "Affect," Bulletin of the Menninger Foundation, 1962.
Piaget, Jean. Judament and Reasoning in the Child. London: Routledgeand Kegan Paul, 1951.
Piaget, Jean. The Child's Conception of Number. New York: HumanitiesPress, 1952.
Piaget, Jean. The Construction of Reality in the Child. New York: BasicBooks, 1954.
Piaget, Jean. "The Theory of Stages in Cognitive Development," Del MonteResearch Park, Monterey, California:- McGraw-Hill, 1969.
Piaget, Jean, Inhelder, Barbel, and Szeminska. The Child's Conceptionof Geometry.. London: Routledge and Kegan Paul, 1960.
Rorschach, Hermann. Psychodiagnostic. New York: Grune and Stratton, 1942.
Smedslund, Jan. Concrete Reasoning: A 'Study of Intellectual Development.Monograph of the Society for Research in Child Development, 1964,29, No. 2.
Smedslund, Jan. "The Acquisition of Conservation of Substance and Weightin Children. V. Practice in Conflict Situations without ExternalReinforcement," Scandanavian Journal of Psychology, 1961, 2, 156-160.
Stein, Harry. "Developmental Changes in Content of M.Responses," Journalof Projective Technique, 1956, 20, 216-223.
Thorpe, Joseph. "Level of Perceptual Development as Reflected in Responsesto the Holtzman Inkblot Technique," Dissertation, University of Texas,1960.