Embed Size (px)
Citation preview
1521-009X46126ndash32$2500 httpsdoiorg101124dmd117077834DRUG METABOLISM AND DISPOSITION Drug Metab Dispos 4626ndash32 January 2018Copyright ordf 2017 by The American Society for Pharmacology and Experimental Therapeutics
Evaluation of Clinical Drug Interaction Potential of Clofazimine UsingStatic and Dynamic Modeling Approaches s
Ramachandra Sangana Helen Gu Dung Yu Chun1 and Heidi J Einolf
Novartis Healthcare Pvt Ltd Hyderabad India (RS) and Novartis Institutes for Biomedical Research East Hanover New Jersey(HG DYC HJE)
Received July 28 2017 accepted October 12 2017
ABSTRACT
The 2016 World Health Organization treatment recommendationsfor drug-resistant tuberculosis (DR-TB) positioned clofazimine as acore second-line drug Being identified as a cytochrome P450 (P450)inhibitor in vitro a P450-mediated drug interaction may be likelywhen clofazimine is coadministered with substrates of theseenzymes The P450-mediated drug interaction potential of clofazi-mine was evaluated using both static [estimation of the R1 and areaunder the plasma concentration-time curve ratio (AUCR) values] anddynamic [physiologically based pharmacokinetics (PBPK)]modelingapproaches For static and dynamic predictions midazolam repa-glinide and desipramine were used as probe substrates forCYP3A45 CYP2C8 and CYP2D6 respectively The AUCR staticmodel estimations for clofazimine with the substrates midazolam
repaglinide and desipramine were 559 134 and 169 respectivelyThe fold increases in the area under the curve (AUC) predicted formidazolam repaglinide and desipraminewith clofazimine (based onPBPK modeling) were 269 160 and 147 respectively Clofaziminewas predicted to be a moderate-to-strong CYP3A45 inhibitor andweak CYP2C8 and CYP2D6 inhibitor based on the calculated AUCRby static and PBPK modeling Additionally for selected antiretro-viral antitubercular antihypertensive antidiabetic antileproticsand antihyperlipidemic CYP3A45 substrate drugs approximately2- to 6-fold increases in the AUCwere predictedwith staticmodelingwhen coadministered with 100 mg of clofazimine Therefore thepossibility of an increase in the AUC of CYP3A45 substrates whencoadministered with clofazimine cannot be ignored
Introduction
Tuberculosis (TB) is an airborne infectious disease caused byorganisms of the Mycobacterium tuberculosis complex Over the pasttwo decades the incidence of TB has declined in most regions of theworld however the emergence of resistance to anti-TB drugs is a threatto the gains in TB control Drug-resistant TB (DR-TB) cases aregenerally of three types 1) rifampicin-resistant TB caused by bacteriathat do not respond to rifampicin 2) multidrug-resistant TB (MDR-TB)caused by bacteria that do not respond to at least isoniazid andrifampicin and 3) extensively drug-resistant TB a form of MDR-TBthat is also resistant to fluoroquinolones and second-line injectable drugs[see the World Health Organization (WHO) MDR-TB factsheet httpwwwwhointtbareas-of-workdrug-resistant-tbtreatmenten]Clofazimine is an antimycobacterial agent originally developed in the
1950s for TB and currently approved for the treatment of lepromatousleprosy and its complication erythema nodosum leprosum (Fajardoet al 1999 Hwang et al 2014) Clofazimine has been used off-label as
a second-line TB drug in a multidrug regimen for DR-TB (see thecompanion handbook to the WHO guidelines for the programmaticmanagement of drug-resistant tuberculosis httpswwwncbinlmnihgovbooksNBK247431) Publication of various drug regimens used by theDamien Foundation in Bangladesh (Van Deun et al 2010) which includedclofazimine as part of the treatment protocol has drawn the attention ofresearchers and authors have continued to study clofazimine as part of amultidrug regimen in the treatment of MDR-TB (Dooley et al 2013)Among the five different regimens used in Bangladesh the regimencontaining clofazimine for MDR-TB had a low failure rate and a treatmentdefault rate of 79without any relapses up to 2 years in cured patients (VanDeun et al 2010) In the follow-up study 844 of patients hadbacteriologically favorable treatment outcomes after 2 years (Aung et al2014) A similar outcome has been reported from countries in Africa(Piubello et al 2014 Kuaban et al 2015) The 2016 WHO DR-TBtreatment guidelines positioned clofazimine as a core second-line drug (groupC) (httpwwwwhointtbareas-of-workdrug-resistant-tbtreatmenten)In 2015 an estimated 104 million new (incident) TB cases were
reported worldwide and among these 12 million (11) cases had beenliving with human immunodeficiency virus (HIV) In addition to the 14million TB deaths in 2015 04 million deaths were reported amongpeople living with HIV (see the WHO global tuberculosis reportwwwwhointtbpublicationsglobal_reporten) TB is one of the most
1Current affiliation Insmed Inc Bridgewater New JerseyThe funding for writing assistance was provided by Novartis Pharma AG Basel
Switzerlandhttpsdoiorg101124dmd117077834s This article has supplemental material available at dmdaspetjournalsorg
ABBREVIATIONS AUC area under the curve AUCR area under the curve ratio DDI drug-drug interaction DR-TB drug-resistant tuberculosisfa fraction absorbed Fg fraction of dose that escapes first-pass elimination in the intestine fm fraction metabolized by an enzyme fup fractionunbound in plasma HIV human immunodeficiency virus [Igut] gut concentration ka first-order absorption rate constant in vivo Kiu unboundinhibition constant MDR-TB multidrug-resistant tuberculosis P450 cytochrome P450 PBPK physiologically based pharmacokinetics PKpharmacokinetics PopPK population pharmacokinetics TB tuberculosis WHO World Health Organization
26
httpdmdaspetjournalsorgcontentsuppl20171016dmd117077834DC1Supplemental material to this article can be found at
at ASPE
T Journals on February 18 2022
dmdaspetjournalsorg
Dow
nloaded from
at ASPE
T Journals on February 18 2022
dmdaspetjournalsorg
Dow
nloaded from
at ASPE
T Journals on February 18 2022
dmdaspetjournalsorg
Dow
nloaded from
at ASPE
T Journals on February 18 2022
dmdaspetjournalsorg
Dow
nloaded from
at ASPE
T Journals on February 18 2022
dmdaspetjournalsorg
Dow
nloaded from
at ASPE
T Journals on February 18 2022
dmdaspetjournalsorg
Dow
nloaded from
at ASPE
T Journals on February 18 2022
dmdaspetjournalsorg
Dow
nloaded from
at ASPE
T Journals on February 18 2022
dmdaspetjournalsorg
Dow
nloaded from
at ASPE
T Journals on February 18 2022
dmdaspetjournalsorg
Dow
nloaded from
at ASPE
T Journals on February 18 2022
dmdaspetjournalsorg
Dow
nloaded from
at ASPE
T Journals on February 18 2022
dmdaspetjournalsorg
Dow
nloaded from
at ASPE
T Journals on February 18 2022
dmdaspetjournalsorg
Dow
nloaded from
at ASPE
T Journals on February 18 2022
dmdaspetjournalsorg
Dow
nloaded from
at ASPE
T Journals on February 18 2022
dmdaspetjournalsorg
Dow
nloaded from
at ASPE
T Journals on February 18 2022
dmdaspetjournalsorg
Dow
nloaded from
at ASPE
T Journals on February 18 2022
dmdaspetjournalsorg
Dow
nloaded from
at ASPE
T Journals on February 18 2022
dmdaspetjournalsorg
Dow
nloaded from
at ASPE
T Journals on February 18 2022
dmdaspetjournalsorg
Dow
nloaded from
at ASPE
T Journals on February 18 2022
dmdaspetjournalsorg
Dow
nloaded from
at ASPE
T Journals on February 18 2022
dmdaspetjournalsorg
Dow
nloaded from
at ASPE
T Journals on February 18 2022
dmdaspetjournalsorg
Dow
nloaded from
at ASPE
T Journals on February 18 2022
dmdaspetjournalsorg
Dow
nloaded from
at ASPE
T Journals on February 18 2022
dmdaspetjournalsorg
Dow
nloaded from
at ASPE
T Journals on February 18 2022
dmdaspetjournalsorg
Dow
nloaded from
at ASPE
T Journals on February 18 2022
dmdaspetjournalsorg
Dow
nloaded from
common opportunistic infections and a leading cause of death in HIVpatients (wwwwhointtbpublicationsglobal_reporten) The aug-mented reports of MDR-TB and synergistic interactions with the HIVepidemic are posing difficult challenges for effective management andcontrol of TB (Zumla et al 2013)Clofazimine is always prescribed as part of a multidrug regimen for
the treatment of DR-TB Given that TB contributes to comorbidity inpatients with HIV concomitant administration of anti-HIV drugs withclofazimine is most likely In vitro cytochrome P450 (P450) inhibitionresults (Supplemental Table 1) have suggested that clofazimine hasreversible inhibitory effects on CYP3A45 CYP2C8 and CYP2D6 atconcentrations of up to 10 mM Therefore it becomes imperative toevaluate the drug interaction potential of clofazimine with drugs that aresubstrates for CYP3A45 CYP2C9 and CYP2D6 This study evaluatedthe CYP3A45 CYP2C8 and CYP2D6 inhibition-mediated druginteraction potential of clofazimine (as a perpetrator) using static anddynamic [ie physiologically based pharmacokinetics (PBPK)] models
Materials and Methods
The drug interaction potential of clofazimine (P450 mediated) was evaluatedusing static and mechanistic dynamic model predictions according to the Foodand Drug Administration Guidance for Industry for drug interaction studies(httpswwwfdagovdownloadsdrugsguidancesucm292362pdf)
Static Model Predictions
P450 inhibition parameters were collected from data obtained using pooledhuman liver microsomes which indicated that clofazimine reversibly inhibitsCYP3A45 CYP2C8 and CYP2D6 with unbound dissociation constant values of0000786 000372 and 000246mM respectively (see Supplemental Table 1) Thehuman plasma protein binding of clofazimine was reported as 999 ranging from999 to 9996 (see the TB Alliance report on clofazimine in clinical trials fortuberculosis httpwwwresisttborgwp-contentuploads201308Global-Alliance-Clinical-Work-with-Clofaziminepdf) Therefore a correction for plasma proteinbinding of 999 [fraction unbound in plasma (fup) of 0001] was used for allcalculations in this analysis Although there is one report of potential weak (2-fold)CYP3A4 activity induction in vitro (Horita and Doi 2014) there are no publishedreports that have implicated clofazimine as a clinical inducer of CYP3A4 (see theUniversity of Washington Drug Interaction Database httpsdidbdruginteractioninfoorg) Therefore it was assumed in the models that any potential CYP3A4 inductionwould be negligible and for the worst-case scenario CYP3A4 inhibitionwould predominate A population pharmacokinetics (PopPK) model was de-veloped for clofazimine using plasma concentration-time data obtained fromhealthy volunteers and leprosy patients (internal data) Simulationswere performedusing the PopPK parameter estimates obtained from the final model A steady-stateplasma Cmax value of 890 ngml (189 mM) (after repeat dose administrationof 100 mg once daily) was obtained from the model which was used for the R1and area under the curve (AUC) plasma concentration-time ratio (AUCR)calculations
Determination of the R1 Value The R1 value was calculated using thefollowing formula
R1 frac14 1thorn frac12IKiu eth1THORN
where [I] is the maximum anticipated Cmax of clofazimine in patients [189 mM(total Cmax) or 000189 mM (unbound Cmax)] and Kiu is the unbound inhibitionconstant determined in vitro The Kiu values used in the models for P450inhibition were 000372 mM (CYP2C8) 000246 mM (CYP2D6) and 0000786mM (CYP3A45) vide supra
Since clofazimine is a CYP3A45 inhibitor that will be administered orally theR1 value was also determined using the gut concentration [Igut] to take intoaccount intestinal CYP3A inhibition
R1 frac14 1thorn frac12IgutKiu eth2THORN
where [Igut] = dose250 ml (or 845mM for 100mg dose) Initially the R1 value forP450 (CYP3A45 CYP2C8 and CYP2D6) inhibition by clofazimine was
calculated if the R1 values were 11 (systemic) or 11 (gut only forCYP3A45) then the AUCR and AUCinhibitorAUCcontrol were estimated usingthe mechanistic static (net effect) model
Determination of the AUCR Value by Using the Mechanistic Static (NetEffect) Model The net effect model was used to calculate the AUCR (Fahmiet al 2008 2009 Einolf et al 2014) The AUCR value was calculated using thefollowing formula
AUCR frac14
1Ag Bg Cg
12Fg
thorn Fg
1ethAh Bh ChTHORN fm thorn eth12 fmP450 THORN
eth3THORN
where Fg is the fraction of dose that escapes first-pass metabolism in the intestinefmP450 is the fraction of total systemic clearance of the substrate that is metabolizedby an individual P450 enzyme and subscripts ldquohrdquo and ldquogrdquo denote liver and gutrespectively
Since clofazimine exhibits reversible inhibition but not time-dependentinactivation or clinically relevant induction
Ag frac14 1=eth1thorn frac12IentTHORN=Ki eth4THORNAh frac14 1=eth1thorn frac12IhTHORN=Ki eth5THORN
and Bg Cg Bh and Ch were set as 1In eq 4 [Ient] is the enterocyte concentration of clofazimine defined as follows
frac12Ient frac14 fa ka dose=Qent eth6THORN
where fa is the fraction of clofazimine absorbed after oral administration (07)(Vischer 1969) ka is the first-order absorption rate constant in vivo (0088 hour21internal data) and Qent is the enterocytic blood flow (248 mlmin) (Obach et al2006)
In eq 5 [Ih] is the hepatic concentration of clofazimine defined as follows
frac12Ih frac14 fup Cmax total thorn ethka fa dose=QhTHORN
eth7THORN
whereQh is the hepatic blood flow [1470 mlmin for a 70-kg individual (21 mlminper kilogram)] and fup is the fraction unbound in plasma (0001) (httpwwwresisttborgwp-contentuploads201308Global-Alliance-Clinical-Work-with-Clofaziminepdf) The dose was defined as 100mg and theCmax total value(at steady state) was 189 mM The input data [fraction metabolized by an enzyme(fm) values] for midazolam repaglinide and desipramine were 09 (Einolf et al2014) 071 (Kajosaari et al 2005 Varma et al 2013 ) and 09 (Obach et al2006) respectively The input data (fm values) for other drugs were calculated fromthe published literature (Supplemental Table 2)
The fmP450 value was calculated as follows
fm frac14 frac1212 eth1=AUCiTHORN eth8THORN
where AUCi represents the fold increase in the exposure of a substrate aftercoadministration with a strong inhibitor (Rowland and Matin 1973) Thisequation assumes complete inhibition of the enzyme The Fg values were notavailable for a majority of these substrates a value of 051 (Fg value ofmidazolamwhich undergoes predominant gut metabolism) was used (Gertz et al2010)
Selection of Drugs for AUCR Determination
To predict the magnitude of CYP3A45- CYP2C8- and CYP2D6-mediatedinhibition by clofazimine the AUCR values were estimated using midazolamrepaglinide and desipramine as probe substrates respectively Various classes ofpossible coadministered drugs such as antituberculars antiretrovirals antidia-betics antihypertensives antileprotics and antihyperlipidemics (statins) wereconsidered for further evaluation
PBPK Model Predictions
Input Parameters The platform used for the PBPKmodeling was the SimcypSimulator (version 15 release 1 Certara Princeton NJ) The healthy volunteer
Clinical Drug Interaction Potential of Clofazimine 27
at ASPE
T Journals on February 18 2022
dmdaspetjournalsorg
Dow
nloaded from
population library file provided by the software was used for all simulations Forsimulations that included patients up to 70 years of age the default maximum agefor the healthy volunteer population file was increased from 65 to 70 The PBPKmodel input parameters are summarized in Table 1 and described in detailsubsequently
The molecular weight of clofazimine is 473 gmol and the log P octanolwatervalue used was 766 (ChemIDplus database US National Library of MedicineBethesda MD httpschemnlmnihgovchemidplus) The compound type wasentered as a monoprotic base with an acid dissociation constant pKa value of 851(Quigley et al 1990) The blood-to-plasma ratio was entered as 05 (minimallydistributed into blood internal data) and the fup was entered as 0001 (httpwwwresisttborgwp-contentuploads201308Global-Alliance-Clinical-Work-with-Clofaziminepdf) A first-order absorption model was used and the fraction
of dose absorbed (fa) was entered as 07 (Vischer 1969) A parameter sensitivityanalysis was performed on the impact of the clofazamine fa value on the druginteraction with the sensitive CYP3A4 substrate midazolam (SupplementalFig 1A) Varying the fa value from 042 to 098 (076 40 of the value used inthe model) resulted in a predicted midazolam AUCR range of 22ndash37 which waswithin 38 of the predicted AUCR of 27 with a fa value of 07 The results of thisparameter sensitivity analysis suggested that the CYP3A drug-drug interaction(DDI) was not highly sensitive to the clofazimine fa values evaluated and wouldremain categorized as a moderate CYP3A4 inhibitor The absorption rate constant(ka) used was 025 hour
21 and the lag time was entered as 055 hour These valueswere optimized to predict the pharmacokinetics (PK) parameters (eg the Cmax
and time to reach maximum plasma concentration values) The effectivepermeability in humans was user defined as 438 1024 cms predicted based
TABLE 1
PBPK model (Simcyp Simulator) input parameters for clofazimine
Parameter Value Source
Physicochemical propertiesMolecular weight (gmol) 473Log Pow 766 ChemIDplus databasepKa 851 Quigley et al (1990)Compound type Monoprotic baseBP 055 Internal datafup 0001 TB Alliancea
AbsorptionModel First-order absorptionfa 07 (CV 10) Vischer (1969)ka (h
21) 025 (CV 30) Optimized to predict PKTlag (h) 055 (CV 30) Optimized to predict PKQgut (lh) 127 Predicted in Simcypfugut 0001 Assumption same as fupPeffman ( 1024 cms) 438 Predicted in GastroPlus
DistributionModel Minimal PBPK modelQ (lh) 426 Internal PopPK analysisVsac (lkg) 327 Internal PopPK analysisVss (lkg) 475 (CV 20) Internal PopPK analysis
EliminationCLiv (lh) 418 (CV 30) Internal PopPK analysisCLR (lh) 0 Levy (1974)
InteractionReversible inhibitionCYP3A4 Kiu (mM) 0000786 Measuredb
CYP2C8 Kiu (mM) 000372 Measuredb
CYP2D6 Kiu (mM) 000246 Measuredb
BP blood-to-plasma ratio CLiv in vivo intravenous clearance CLR renal clearance fugut fraction unbound in the enterocyte log Powlogarithmic partition coefficient octonalwater Peffman effective permeability in man Q inter-compartment clearance Tlag lag time Vsacsingle adjusted compartment volume Vss volume of distribution at steady state
aGlobal Alliance for TB Drug Development (httpwwwresisttborgwp-contentuploads201308Global-Alliance-Clinical-Work-with-Clofaziminepdf)
bSupplemental Table 1
TABLE 2
Summary of clofazimine PK simulations
The elimination half-life of clofazimine is approximately 25 days thus it is assumed that the exposure clofazimine reaches steady state in plasma by day 126 (approximately five half-lives)
Study (Model)Clofazimine Dosing
RegimenSimulated Population Observed Population PK Measurement of Substrate
Model developmentClofazimine PK(Internal data)
50 mg once daily for43 days (fasting)
Age range 35ndash64 years proportionof females 25 n = 120 (10 trialsof 12 subjects)
Age range 35ndash64 years proportionof females 25 n = 12
Day 1 Tmax Cmax and AUC0ndash24 h
Clofazimine PK(Internal data)
100 mg once daily for43 days (fasting)
Age range 45ndash70 years proportionof females 50 n = 120 (10 trialsof 12 subjects)
Age range 45ndash76 years proportionof females 50 n = 12
Day 1 Tmax Cmax and AUC0ndash24 h
Model applicationClofazimine PK 100 mg once daily for
126 days (fasting)Age range 18ndash70 years proportion
of females 50 n = 100 (10 trialsof 10 subjects)
NA Day 126 Cmax and AUC0ndash24 h
AUC0ndash24 h area under plasma-drug concentration curve between 0 and 24 hours NA not applicable Tmax time to reach maximum concentration
28 Sangana et al
at ASPE
T Journals on February 18 2022
dmdaspetjournalsorg
Dow
nloaded from
on the clofazimine chemical structure by using the absorption distributionmetabolism excretion and toxicity predictor in GastroPlus (SimulationsPlus Inc Lancaster CA) The Qgut value was predicted as 127 lh by theSimcyp Simulator The fraction unbound in the enterocyte value was set at0001 (assumed to be the same as fup) The coefficient of variation (30) forthe input parameters was the default value in the Simcyp Simulator Inaddition sensitivity analyses of the clofazimine fraction unbound in theenterocyte as well as the ka value were performed to determine the impact ofthese values on the drug interaction with midazolam The results ofthe sensitivity analysis can be found in Supplemental Fig 1 B and CVariation of the fraction unbound in the enterocyte (range of 0001ndash1)resulted in minimal impact in the midazolam AUCR (range of 30ndash39)and categorization of the DDI The predicted DDI of clofazimine withmidazolam was not sensitive to ka values ranging from 0088 to 025 hour21
(ie values used in either the static or PBPK models) The minimal PBPKmodel in the Simcyp Simulator was used with a single adjusting compart-ment The input parameters for distribution were optimized to best fit the PKdata obtained from the clinical trial (PopPK analysis internal data) thevolume of distribution at steady state intercompartment clearance (Q) andsingle adjusted compartment volume were estimated to be 475 lkg 426 lhand 327 lkg respectively The in vivo intravenous clearance was userdefined as 418 lh also optimized to best fit of the PK data from the clinicaltrial Renal clearance of clofazimine was deemed to be negligible since lessthan 1 of the administered drug was reported to be eliminated in the urine(Levy 1974) The inhibition parameters entered in the Simcyp Simula-tor were already corrected for microsomal protein binding (SupplementalTable 3)
Model Performance and Application
PK Trial Simulations The PK parameter inputs for the simulations wereestimated using the clinical PK data of clofazimine The simulated data werequalified using the observed PK data from the same study (Table 2)
DDI Predictions of Clofazimine as a Perpetrator of P450 Substrates ForDDI simulations using PBPK modeling midazolam and selected antivirals suchas saquinavir or efavirenz were considered as CYP3A45 substrates Repaglinideand desipramine were used as CYP2C8 and CYP2D6 substrates respectivelyThe Supplemental Material contains details of the input parameters for thesubstrates used in the PBPKmodel (Supplemental Tables 4ndash8) A total of 10 trialsincluding 10 subjects were simulated the age range of the simulated subjects was18ndash70 years with 50 of the population being women (Table 3)
Results
Static Model Predictions
R1 Values for CYP3A45 Inhibition The R1 values for P450inhibition by clofazimine are listed in Table 4 Since the calculated R1
values of clofazimine were11 for both total and unbound maximumanticipated Cmax (inhibitor concentration) and11 for [Igut] the AUCRwas determined using the mechanistic static (net effect) model and byincorporating estimated fm and Fg values of the interacting substrates
AUCR Values for Clofazimine with Sensitive Substrates
The AUCR values were determined to estimate the extent of risk withrespect to P450 inhibition in vivo when clofazimine was coadministeredwith P450 substrates The AUCR values of midazolam repaglinide anddesipramine with clofazimine were estimated as 559 134 and 169respectively Based on these calculated net effect values clofaziminewas predicted to be a strong CYP3A45 inhibitor and a weak CYP2C8and CYP2D6 inhibitor in vivoPredicted AUCR for Inhibition of CYP3A45-Mediated Clear-
ance For the selected substrates evaluated approximately 2- to 6-foldincrease in the AUCwas predicted when coadministered once daily with100 mg clofazimine (Table 5)
PBPK Model Predictions
Simulations of Clofazimine PK on Days 1 and 126 The predictedthe AUC Cmax and time to reach maximum plasma concentrationvalues on day 1 using the PBPK model were within 2-fold of theobserved values The observed and simulated clinical PK parameters onday 1 for clofazimine following single oral doses (50 and 100 mg) aresummarized in Table 6 The simulated clinical PK parameters forclofazimine at day 126 following multiple oral doses of 100 mg oncedaily can be found in Table 7 The predicted Cmax value (797 ngml) onday 126 after multiple doses was comparable to theCmax value (890 ngml)predicted from the PopPK model which was used for the static modelDDI Simulations of CYP3A (Midazolam Saquinavir and
Efavirenz) CYP2C8 (Repaglinide) and CYP2D6 (Desipramine)Substrates with Clofazimine The predicted AUC and Cmax ratiosfor midazolam with clofazimine were predicted as 269 and 168respectively The predicted AUC and Cmax ratios of saquinavir when
TABLE 3
DDI predictions of clofazimine with P450 substrates
Model Application (P450 Substrate) Study Dosing Regimen PK Measurement of Substrate
CYP3A45 Midazolam + clofazimine Midazolam 5 mg on day 126 + clofazimine 100 mgonce daily on days 1ndash126
Day 126 AUCinf Cmax
CYP3A4 Saquinavir + clofazimine Saquinavir 1200 mg on day 126 + clofazimine 100 mgonce daily on days 1ndash126
Day 126 AUCinf Cmax
CYP3A4 Efavirenz + clofazimine Efavirenz 600 mg on day 126 + clofazimine 100 mgonce daily on days 1ndash126
Day 126 AUCinf Cmax
CYP2C8 Repaglinide + clofazimine Repagalinide 025 mg on day 126 + clofazimine 100 mgonce daily on days 1ndash126
CYP2D6 Desipramine + clofazimine Desipramine 50 mg on day 126 + clofazimine 100 mgonce daily on days 1ndash126
AUCinf area under the plasma concentration-time curve from 0 to infinity
TABLE 4
Input parameters and R1 values for P450 inhibition by clofazimine
Input ParameterR1 ValueP450 Enzyme
CYP3A45 CYP2C8 CYP2D6
Input parameterKiu (mM) 0000786 000372 000246[I] (mM) total Cmax 189a 189a 189a
[I] (mM) unbound Cmax 000189 000189 000189[Igut] (mM) total 845 mdash
bmdash
R1 ValueSystemic [I] = Cmaxtotal 2406 509 769Systemic [I] = Cmaxu 340 2 2Gut [I] = [Igut] 1075065 mdash mdash
[I] inhibitor concentration (maximum anticipated Cmax)aPredicted concentration after repeat administration of 100 mgday clofaziminebmdash not applicable
Clinical Drug Interaction Potential of Clofazimine 29
at ASPE
T Journals on February 18 2022
dmdaspetjournalsorg
Dow
nloaded from
coadministered with clofaziminewere predicted to be 289- and 242-foldrespectively No change in the AUC or Cmax ratios was predicted by thePBPKmodel for efavirenz in the presence of clofazimine In addition thepredicted AUCRs for repaglidine (CYP2C8 substrate) and desipramine(CYP2D6 substrate) with clofazimine were 160 and 147 respectively(Table 8)
Discussion
Clofazimine is currently being considered as a core second-linedrug for treatment of DR-TB (see the WHO treatment guidelineshttpwwwwhointtbareas-of-workdrug-resistant-tbtreatmenten)As per the WHO TB treatment guidelines clofazimine is adminis-tered as part of a multidrug regimen therefore evaluating the druginteraction potential of clofazimine will be beneficial to arrive atappropriate dosing regimens for the coadministered drugs In theabsence of clinical drug interaction studies data derived from in vitroexperiments and modeling were used to predict the drug interactionpotential of clofazimine
In the static model the clofazimine R1 values for CYP3A45 CYP2C8and CYP2D6 were found to be 11 and 11 for systemic inhibitorconcentration and [Igut] respectively Therefore the possibility of a P450inhibitionndashmediated interaction for clofazimine cannot be ruled out (httpswwwfdagovdownloadsdrugsguidancesucm292362pdf) The DDI po-tential was further evaluated by the mechanistic static (net effect) modelwhere the AUCR was determined using the probe substrates (midazolamrepaglinide and desipramine for CYP3A45 CYP2C8 and CYP2D6respectively) P450 inhibitors are typically classified as strongmoderate orweak based on the magnitude of changes in the plasma AUC of the probesubstrates $5-fold strong inhibitor between 2- and 5-fold moderateinhibitor and between 125- and 2-fold weak inhibitor (httpswwwfdagovdownloadsdrugsguidancesucm292362pdf) The estimated AUCRvalues of clofazimine are 559 134 and 169 for midazolam (CYP3A45)repaglinide (CYP2C8) and desipramine (CYP2D6) respectively Similarresults were obtained for clofazimine when the DDI was simulated using aPBPK model for repaglinide and desipramine Thus clofazimine can beclassified as a weak inhibitor of CYP2C8 and CYP2D6The fold increase in exposure predicted using the PBPK model
(AUCR of 269) was approximately 50 lower than that calculatedusing the mechanistic static (net effect) model (AUCR of 559) formidazolam No change in the AUC or Cmax value was predicted by thePBPK model for efavirenz in the presence of clofazimine howeverthe static model predicted a 248-fold increase in the AUC Consideringthe fold increase in the AUC predicted using both models clofaziminecan be classified as a moderate-to-strong inhibitor of CYP3A45The findings from the drug interaction predictions were further
qualified against the available clinical evidence in Balakrishnan andSeshadri (1981) where clofazimine was coadministered with dapsone(a CYP3A4 substrate) The study concluded that there was nosignificant effect on the exposure of dapsone when administered withclofazimine (Balakrishnan and Seshadri 1981) The AUCR value fordapsone with clofazimine was estimated to be 197 and predictedweak inhibition by clofazimine on dapsone PK This is in agreementwith the clinical data where no interaction was observed The minimaldifference between the findings from the predicted and observed valuecan be attributed to the fact that dapsone is also metabolized byCYP2C9 (Gill et al 1995)
TABLE 5
Predicted fold change in the AUC of selected substrates of CYP3A45
For the weak CYP3A45 inhibitor the AUCRs are 125 and 2 For the moderate CYP3A45inhibitor the AUCRs are 2 and 5 For the strong CYP3A45 inhibitor the AUCR is $5
ClassSubstrate Predicted AUCR
AntiretroviralsAtazanavir 210Amprenavir 239Darunavir 250Delaviridine 257Dolutegravir 300Efavirenz 248Elvitegravir 262Etravirine 257Indinavir 448Lopinavir 252Nelfinavir 241Raltegravir 281Ritonavir 257Rilpivirine 257Saquinavir 296Simeprevir 516Tipranavir 583
AntitubercularsBedaquiline 225Clarithromycin 293Delamanid 559
AntihypertensivesLosartan 235Verapamil 250Diltiazem 262Nitrendipine 337Amlodipine 379Guanfacine 379Nifedipine 385Eplerenone 472Felodipine 488Lercanidipine 596
AntidiabeticsAlogliptin 223Pioglitazone 239Repaglinide 248Teneligliptin 257Saxagliptin 346
AntihyperlipidemicsPravastatin 290Atorvastatin 488Simvastatin 583Lovastatin 623
AntileproticsDapsone 197
TABLE 6
Observed and simulated clinical PK parameters for clofazimine in patients followingsingle oral doses (50 and 100 mg)
ParameterClofazimine (Mean 6 SD)
Oral Dose (50 mg) Oral Dose (100 mg)
Cmax (ngml)Observeda 718 6 341 131 6 599Predicted 833 6 219 178 6 465PE ()b +16 +36
AUC0ndash24 h (ngtimeshml)Observeda 1084 6 409 1856 6 821Predicted 976 6 1633 2090 6 3691PE ()b 210 +13
Tmax (h)c
Observeda 8 6Predicted 95 95PE ()b +19 +58
AUC0ndash24 h area under plasma-drug concentration curve between 0 and 24 hours PEprediction error () Tmax time to reach maximum concentration
aClinical PK parameters were not available on day 43 hence the day 1 PK parameters wereused for comparison picomoles per grams was converted to nanograms per milliliter as followspmolg = (pmolg) molecular weight (gmol) = pmolmol = ngg = ngml where plasma densityassumes a value of 1 gml
bPrediction error = [(predicted value 2 observed value)observed value] 100cMedian
30 Sangana et al
at ASPE
T Journals on February 18 2022
dmdaspetjournalsorg
Dow
nloaded from
In view of the most frequent comorbidities associated with TB andthe multidrug regimen used for DR-TB treatment various classes ofantituberculars antiretrovirals antidiabetics antihypertensives antile-protics and antihyperlipidemics (statins) that undergo metabolism byCYP3A45 were considered for AUCR evaluation Clofazimine isalways administered as part of a multidrug regimen either as a shorter orconventional regimen (WHO guidelines httpwwwwhointtbareas-of-workdrug-resistant-tbtreatmenten) The shorter regimen containskanamycin (an injectable agent) moxifloxacin prothionamide clofazi-mine isoniazid pyrazinamide and ethambutol given together in aninitial phase of 4 months and followed by 5 months of treatment withfour of the medicines (moxifloxacin clofazimine pyrazinamide andethambutol) For the conventional regimen the intensive phase includespyrazinamide and four second-line drugs (fluoroquinolones levoflox-acin moxifloxacin and gatifloxacin second-line injectables amikacincapreomycin kanamycin and streptomycin and core second-lineagents ethionamide prothionamide cycloserineterizidone linezolidand clofazimine) If the minimum of effective TB medicines cannot becomposed either a group D2 drug (bedaquiline or delamanid) andpossibly group D3 agents (p-aminosalicylic acid imipenem-cilastatinmeropenem amoxicillin-clavulanate or thioacetazone) could be addedWith the exception of bedaquiline and delaminid no P450-mediatedinteraction was predicted for other antitubercular drugs (fluroquino-lones second-line injectables core second-line agents and D1 and D3agents) that are currently recommended by WHO for treatment ofDR-TB (both shorter and conventional regimens)For most of the tested antiretroviral drugs known to bemetabolized by
CYP3A45 moderate interactions were assessed with an estimation ofbetween 2- and 5-fold increase in the AUC of the antiretroviral drug
[except simeprevir (513-fold) and tipranavir (583-fold)] when admin-istered concomitantly with clofazimine 100 mgdaily Moderate inhibi-tions were predicted for some of the dipeptidyl peptidase-4 inhibitorstested Moderate-to-strong inhibitions were predicted for antihyperten-sives and antihyperlipidemic drugs (pravastatin atorvastatin simvasta-tin and lovastatin) when administered concomitantly with clofazimine100 mgdIn conclusion clofazimine was predicted to be a weak CYP2C8
and CYP2D6 inhibitor Thus the possibility of a clinically signifi-cant interaction when coadministered with CYP2C8 and CYP2D6substrate is minimal Clofazimine is predicted to be a moderate-to-strongCYP3A45 inhibitor based on the net effect and PBPK modelingpredictions In the absence of a clinical DDI study the possibility of anincrease in the AUC of CYP3A45 substrates when coadministered withclofazimine cannot be ignored Thus caution is recommended whenclofazimine is prescribed along with a CYP3A45 substrate
Acknowledgments
We acknowledgeVSMuthuswamy (Novartis Healthcare Pvt Ltd HyderabadIndia) for the literature review support in this study We thank Jitendriya Mishra(Novartis Healthcare Pvt Ltd Hyderabad India) for providing medical writingassistance of this manuscript
Authorship ContributionsParticipated in research design Sangana Gu Chun EinolfConducted experiments Sangana Gu ChunPerformed data analysis Sangana Gu EinolfWrote or contributed to the writing of the manuscript Sangana Gu Chun
Einolf
TABLE 7
Simulated clinical PK parameters for clofazimine on day 126 following multiple oral doses of 100 mg once daily
An example of the summary model input output and PK statistical output for this scenario can be found in the Supplemental Tables 9ndash11
Parameter Value
Mean Cmax (ngml) 797 (SD 392)Mean AUC0ndash24h (ngtimeshml) 16627 (SD 5367)Median Cmax (ngml) 703 (minimum 255 maximum 2966)Median AUC0ndash24 h (ngtimeshml) 15919 (minimum 5868 maximum 36902)Geometric mean Cmax (ngml) 728 (CV 49)Geometric mean AUC0ndash24 h (ngtimeshml) 15797 (CV 32)
AUC0ndash24 h area under plasma-drug concentration curve between 0 and 24 hours
TABLE 8
Predicted clinical PK parameters in plasma for midazolam saquinavir efavirenz repaglinide and desipramine
Single dose given on day 126 in the presence and absence of clofazimine (100 mg once daily days 1ndash126)
Substrate (dose) Simulated n = 100
Mean (SD) Geometric Mean (CV) Geometric Mean Ratio (90 CI)
AUCinf Cmax AUCinf Cmax
AUC Cmax
ngmltimesh ngml ngmltimesh ngml
Midazolam (5 mg) 721 (558) 251 (169) 560 (77) 204 (68)Midazolam (5 mg) + clofazimine 214 (174) 423 (270) 151 (81) 342 (64) 269 (258 280) 168 (162 174)Saquinavir (1200 mg) 2197 (1519) 388 (309) 1810 (69) 304 (80)Saquinavir (1200 mg) + clofazimine 6164 (3730) 886 (567) 5224 (60) 736 (64) 289 (287 290) 242 (230 253)Efavirenz (600 mg) 118424 (78432) 2376 (1653) 97306 (66) 1950 (70)Efavirenz (600 mg) + clofazimine 124951 (86932) 2389 (1671) 101211 (64) 1958 (70) 104 (104 104) 100 (100 100)Repaglinide (025 mg) 827 (416) 383 (136) 714 (50) 356 (36)Repaglinide (025 mg) + clofazimine 136 (875) 504 (178) 114 (59) 469 (35) 160 (158 176) 132 (129 134)Desipramine (50 mg) 2836 (7808) 173 (114) 688 (275) 145 (66)Desipramine (50 mg) + clofazimine 3125 (7745) 204 (116) 1009 (248) 177 (57) 147 (144 150) 127 (124 130)
AUCinf area under plasma-drug concentration curve from 0 to infinity CI confidence interval
Clinical Drug Interaction Potential of Clofazimine 31
at ASPE
T Journals on February 18 2022
dmdaspetjournalsorg
Dow
nloaded from
References
Aung KJ Van Deun A Declercq E Sarker MR Das PK Hossain MA and Rieder HL (2014)Successful lsquo9-month Bangladesh regimenrsquo for multidrug-resistant tuberculosis among over500 consecutive patients Int J Tuberc Lung Dis 181180ndash1187
Balakrishnan S and Seshadri PS (1981) Drug interactionsmdashthe influence of rifampicin and clo-fazimine on the urinary excretion of DDS Lepr India 5317ndash22
Dooley KE Obuku EA Durakovic N Belitsky V Mitnick C and Nuermberger EL EfficacySubgroup RESIST-TB (2013) World Health Organization group 5 drugs for the treatment ofdrug-resistant tuberculosis unclear efficacy or untapped potential J Infect Dis 2071352ndash1358
Einolf HJ Chen L Fahmi OA Gibson CR Obach RS Shebley M Silva J Sinz MW Unadkat JDZhang L et al (2014) Evaluation of various static and dynamic modeling methods to predictclinical CYP3A induction using in vitro CYP3A4 mRNA induction data Clin Pharmacol Ther95179ndash188
Fahmi OA Hurst S Plowchalk D Cook J Guo F Youdim K Dickins M Phipps A Darekar AHyland R et al (2009) Comparison of different algorithms for predicting clinical drug-druginteractions based on the use of CYP3A4 in vitro data predictions of compounds as precipitantsof interaction Drug Metab Dispos 371658ndash1666
Fahmi OA Maurer TS Kish M Cardenas E Boldt S and Nettleton D (2008) A combinedmodel for predicting CYP3A4 clinical net drug-drug interaction based on CYP3A4 in-hibition inactivation and induction determined in vitro Drug Metab Dispos 361698ndash1708
Fajardo TT Abalos RM dela Cruz EC Villahermosa LG Walsh DS Cellona RV Balagon MVTan EV and Walsh GP (1999) Clofazimine therapy for lepromatous leprosy a historical per-spective Int J Dermatol 3870ndash74
Gertz M Harrison A Houston JB and Galetin A (2010) Prediction of human intestinal first-passmetabolism of 25 CYP3A substrates from in vitro clearance and permeability data Drug MetabDispos 381147ndash1158
Gill HJ Tingle MD and Park BK (1995) N-Hydroxylation of dapsone by multiple enzymes ofcytochrome P450 implications for inhibition of haemotoxicity Br J Clin Pharmacol 40531ndash538
Horita Y and Doi N (2014) Comparative study of the effects of antituberculosis drugs and anti-retroviral drugs on cytochrome P450 3A4 and p-glycoprotein Antimicrob Agents Chemother 583168ndash3176
Hwang TJ Dotsenko S Jafarov A Weyer K Falzon D Lunte K Nunn P Jaramillo E KeshavjeeS and Wares DF (2014) Safety and availability of clofazimine in the treatment of multidrug and
extensively drug-resistant tuberculosis analysis of published guidance and meta-analysis ofcohort studies BMJ Open 4e004143
Kajosaari LI Laitila J Neuvonen PJ and Backman JT (2005) Metabolism of repaglinide byCYP2C8 and CYP3A4 in vitro effect of fibrates and rifampicin Basic Clin Pharmacol Toxicol97249ndash256
Kuaban C Noeske J Rieder HL Aiumlt-Khaled N Abena Foe JL and Treacutebucq A (2015) Higheffectiveness of a 12-month regimen for MDR-TB patients in Cameroon Int J Tuberc Lung Dis19517ndash524
Levy L (1974) Pharmacologic studies of clofazimine Am J Trop Med Hyg 231097ndash1109Obach RS Walsky RL Venkatakrishnan K Gaman EA Houston JB and Tremaine LM (2006)The utility of in vitro cytochrome P450 inhibition data in the prediction of drug-drug interactionsJ Pharmacol Exp Ther 316336ndash348
Piubello A Harouna SH Souleymane MB Boukary I Morou S Daouda M Hanki Y and VanDeun A (2014) High cure rate with standardised short-course multidrug-resistant tuberculosistreatment in Niger no relapses Int J Tuberc Lung Dis 181188ndash1194
Quigley JM Fahelelbom KMS Timoney RF and Corrigan OI (1990) Temperature depen-dence and thermodynamics of partitioning of clofazimine analogues in the n-octanolwatersystem Int J Pharm 58107ndash113
Rowland M and Matin SB (1973) Kinetics of drug-drug interactions J Pharmacokinet Biopharm1553ndash567
Van Deun A Maug AK Salim MA Das PK Sarker MR Daru P and Rieder HL (2010) Shorthighly effective and inexpensive standardized treatment of multidrug-resistant tuberculosisAm J Respir Crit Care Med 182684ndash692
Varma MV Lai Y Kimoto E Goosen TC El-Kattan AF and Kumar V (2013) Mechanisticmodeling to predict the transporter- and enzyme-mediated drug-drug interactions of repaglinidePharm Res 301188ndash1199
Vischer WA (1969) The experimental properties of G 30 320 (B 663)mdasha new anti-leprotic agentLepr Rev 40107ndash110
Zumla A Raviglione M Hafner R and von Reyn CF (2013) Tuberculosis N Engl J Med 368745ndash755
Address correspondence to Dr Heidi J Einolf Novartis PharmaceuticalsCorporation East Hanover NJ 07936 E-mail heidieinolfnovartiscom
32 Sangana et al
at ASPE
T Journals on February 18 2022
dmdaspetjournalsorg
Dow
nloaded from
1
SUPPLEMENTAL DATA TO
Evaluation of clinical drug interaction potential of clofazimine using static and dynamic
modeling approaches
Ramachandra Sangana Helen Gu Dung Yu Chun Heidi J Einolf
Drug Metabolism and Disposition
MATERIAL AND METHODS
Inhibitory effect of clofazimine on CYP-selective probe substrate metabolism
The potential of clofazimine to inhibit human cytochrome P450 (CYP) enzyme activity was
assessed in pooled human liver microsomes (HLM) by testing the effect of increasing
concentrations of clofazimine on the in vitro metabolism of several probe substrates whose
metabolism is known to be selective for individual CYP enzymes CYP activity was assessed
using the probe reactions phenacetin O-deethylation (CYP1A2) coumarin 7-hydroxylation
(CYP2A6) bupropion hydroxylation (CYP2B6) amodiaquine N-deethylation (CYP2C8)
diclofenac 4prime-hydroxylation (CYP2C9) S-mephenytoin 4prime-hydroxylation (CYP2C19) bufuralol
1prime-hydroxylation (CYP2D6) chlorzoxazone 6-hydroxylation (CYP2E1) and midazolam-
1prime-hydroxylation or testosterone 6β-hydroxylation (CYP3A) Probe substrate concentrations used
for these determinations were less than or equal to their reported MichaelisndashMenten constant
(Km) values For reversible inhibition the incubations (37degC 10ndash20 min) were composed of
(final concentrations) potassium phosphate buffer (100 mM pH 74) nicotinamide adenine
dinucleotide phosphate (NADPH) (1 mM) magnesium chloride (5 mM) HLM protein (005ndash05
mg proteinmL) probe substrate (1 μM midazolam or coumarin 5 μM phenacetin diclofenac or
bufuralol 2 μM amodiaquine 10 μM chlorzoxazone 15 μM S-mephenytoin 25 μM bupropion
2
or 50 μM testosterone) and varying concentrations of clofazimine (0ndash10 μM) After pre-
incubation for 3 min the reactions were initiated by addition of NADPH and terminated by
addition of acetonitrile (2 volumes) These were conducted in a 96-well plate format at 37degC
using a TECAN Freedom Evo system (Zurich Switzerland) The reactions were initiated by
adding NADPH after at least a 3-min thermal equilibrium Incubations were terminated by the
addition of acetonitrile (200 μL) Due to the poor aqueous solubility of clofazimine in HLM
incubation mixture the organic content was increased to ~5 for all the experiments Formation
of probe substrate metabolites from the above samples acetaminophen 7-hydroxycoumarin
hydroxybupropion N-desethylamodiaquine 4prime-hydroxydiclofenac 4prime-hydroxy-S-mephenytoin
1prime-hydroxybufuralol 6-hydroxychlorzoxazone 1prime-hydroxymidazolam and 6β-
hydroxytestosterone was determined by liquid chromatographyndashtandem mass spectrometry (LC-
MSMS) after concentration and reconstitution of the samples in acetonitrilewater containing an
internal standard Values for 50 half maximal inhibitory concentration (IC50) for the inhibition
of CYP enzyme were determined by visual inspection of the data (percentage of control CYP
activity vs clofazimine concentration) The apparent inhibition constant (Ki) values were
determined for CYP inhibition of CYP2C8 CYP2D6 and CYP3A45 (midazolam
1ʹ-hydroxylation) The assay conditions are generally similar to those described above with a
range of clofazimine concentrations on a range of probe substrate concentrations for CYP2C8
(0ndash5 microM clofazimine on 02ndash20 microM amodiaquine) CYP2D6 (0ndash24 microM clofazimine on 125ndash
100 microM bufuralol) and CYP3A45 (0ndash07 microM clofazimine on 02ndash20 microM midazolam) The Ki
values were determined using the software package SigmaPlot (SigmaPlot 2004 version 121
SPSS Inc US) The equation for data evaluation was selected based on visual inspection of the
fitting and best-fit criteria (R2 values) For CYP2C8 and CYP3A45 the Ki value was derived
3
using a mixed (partial) inhibition model and for CYP2D6 the Ki value was derived using a
competitive (partial) inhibition model The equations used to calculate the Ki values are listed as
below
Competitive inhibition (partial) ( ) ( ) ( )iim
max
]I[1]I[1]S[1 KKKVv
sdot++sdot+=
a (1)
Mixed inhibition (partial) ( ) ( )[ ]( ) ( ) ( )iim
iimax
]I[1]I[1]S[1]I[1]I[1
KKKKKVvsdot++sdot+sdot+sdotsdot+
=sdot
aaaβ (2)
where v is initial rate of metabolism Vmax is maximal rate of metabolism Km is Michaelisndash
Menten constant [S] is substrate concentration [I] is inhibitor (clofazimine) concentration Ki is
inhibition constant
To investigate the possibility of time-dependent inhibition (TDI) of CYP1A2 CYP2B6
CYP2C8 CYP2C9 CYP2C19 CYP2D6 and CYP3A45 clofazimine (0ndash10 microM) was
preincubated with HLM using protein concentrations of 10 mg microsomal proteinmL for
CYP1A2 CYP2B6 and CYP2C19 and 05 mg microsomal proteinmL for CYP2C8 CYP2C9
CYP2D6 and CYP3A45 The concentrations of clofazimine were 01 05 1 25 5 and 10 microM
for all experiments The assessment of the TDI of the total seven CYP enzymes was divided into
two experiments The first experiment included CYP2B6 CYP2C8 CYP2D6 and CYP3A45
while the second experiment included CYP1A2 CYP2C9 and CYP2C19 After specified
incubation times aliquots (5 microL) of the pre-incubation mixture were transferred to a 95 microL
enzyme activity assay mixture to determine the CYP activity remaining The concentrations of
probe substrates in the enzyme activity assay were 50 μM phenacetin (CYP1A2) 15 mM
bupropion (CYP2B6) 20 μM amodiaquine (CYP2C8) 25 μM diclofenac (CYP2C9) 300 μM S-
mephenytoin (CYP2C19) 25 μM bufuralol (CYP2D6) and 20 μM midazolam (CYP3A45) The
enzyme activity assay reactions were incubated at 37degC for 6 min and terminated as above
4
Positive-control time-dependent inhibitors included furafylline (CYP1A2) ticlopidine (CYP2B6
and CYP2C19) gemfibrozil glucuronide (CYP2C8) tienilic acid (CYP2C9) paroxetine
(CYP2D6) and troleandomycin (CYP3A4) Sample preparation for analysis of probe substrate
metabolite formation by LC-MSMS was as described above For positive controls the
inactivation parameters kinact (maximum inactivation rate) and KI (concentration at frac12 kinact)
were determined by plotting the natural log of the percentage of control activity remaining
following incubations with increasing inhibitor concentration against time of pre-incubation The
absolute value of the observed rate of inactivation (kobs) was then plotted against inhibitor
concentration ([I]) and the data analyzed by non-linear regression using the equation
kobs = (kinact [I]) (KI + [I]) (3)
Unbound fraction of clofazimine in microsomes (fumic)
Clofazimine (1 or 10 microM) was mixed with pooled HLM at various protein concentrations (0025
005 or 05 mg proteinmL) in 100 mM potassium phosphate buffer (pH 74) containing 5 mM
MgCl2 (final concentrations) using glass vials Aliquots of 05 mL of each sample were
transferred to ultracentrifuge tubes and incubated for 10 min at 37degC in an Eppendorf
Thermomixer (Eppendorf Germany) The samples were centrifuged at 306000 times g for 30 min at
~37degC in a Sorvallreg RC-M120GX Micro-ultracentrifuge (Newtown CT US) The ultracentrifuge
was allowed to stop without using the brake Two aliquots from the resulting supernatants were
removed from individual tubes for LC-MSMS analysis and protein analysis respectively Prior to
ultracentrifugation 50 microL aliquots of the samples were removed from each ultracentrifuge tube
for LC-MSMS analysis The MS area ratio (peak area of clofaziminepeak area of clofazimine-
d7) of the pre- and post-ultracentrifugation samples obtained from LC-MSMS analysis was used
for the calculation of unbound fraction (fumic) with the following equation
5
119891119891119891119891119898119898119898119898119898119898 = 119860119860119860119860119860119860119860119860 119860119860119860119860119903119903119898119898119903119903119891119891119891119891119891119891119891119891119860119860119860119860119860119860119860119860 119860119860119860119860119903119903119898119898119903119903119905119905119905119905119905119905119905119905119905119905
(4)
where Area ratiototal is the area ratio of the sample before ultracentrifugation and Area ratiofree is
the area ratio in the supernatant after ultracentrifugation
6
Supplemental TABLE 1
Inhibitory effect of clofazimine on CYP-selective probe substrate metabolism
CYP enzyme
Probe reaction IC50 value (μM) Ki value (μM) (Inhibition mechanism)
Totala Unboundb Totala Unboundb CYP1A2 Phenacetin O-
deethylation gt10 gt0016 ni ni
CYP2A6 Coumarin 7- hydroxylation
gt10 gt010 ni ni
CYP2B6 Bupropion hydroxylation
gt10 gt0079 ni ni
CYP2C8 Amodiaquine N- deethylation
25 0025 0372 plusmn 000753 (mixed partial)
000372 plusmn 00000753 (mixed partial)
CYP2C9 Diclofenac 4prime-hydroxylation
gt10 gt010 ni ni
CYP2C19 S-mephenytoin 4prime-hydroxylation
gt10 gt0016 ni ni
CYP2D6 Bufuralol 1prime-hydroxylation
12 00095 0311 plusmn 000432 (competitive partial)
000246 plusmn 00000342 (competitive partial)
CYP2E1 Chlorzoxazone 6-hydroxylation
gt10 gt0079 ni ni
CYP3A45 Midazolam 1prime-hydroxylation
035 00035 00786 plusmn 00170 (mixed partial)
0000786 plusmn 0000170 (mixed partial)
CYP3A45 Testosterone 6β-hydroxylation
033 00033 ni ni
atotal (bound + unbound) IC50 or Ki value bunbound IC50 or Ki value fumic values are listed in Supplemental Table 5 μM micromole CYP cytochrome P450 fumic unbound fraction in microsomes IC50 half maximal inhibitory concentration Ki inhibition constant ni not investigated
7
Supplemental TABLE 2
Fm values for antiretroviral antitubercular antihypertensive antidiabetic antileprotic and antihyperlipidemic drugs collected from literature Drug type Substrate CYP3A45
Inhibitor AUCi fm
a Reference
Antiretroviral
ARV (PI) Atazanavir Ketoconazole 110 009 Reyatazreg 2017
ARV (PI) Darunavir Ketoconazole 142 030 Sekar et al 2008
ARV (PI) Amprenavir Ketoconazole 134 025 Polk et al 1999
ARV (PI) Indinavir Ritonavir 450 078 Hsu et al 1998
ARV (PI) Lopinavir Ritonavir 146 031 Kaletrareg 2017
ARV (PI) Nelfinavir Ketoconazole 135 026 Viraceptreg 2013
ARV (PI) Ritonavir Ketoconazole 150 033 Morcos et al 2014
ARV (PI) Saquinavir Ketoconazole 190 047 Grub et al 2001
ARV (PI) Tipranavir Ritonavir 1200 092 MacGregor et al 2004
ARV (NS3PI) Simeprevir Ritonavir 718 086 Olysioreg 2017
ARV (NNRTI) Efavirenz Voriconazole 143 030 Liu et al 2008
ARV (NNRTI) Etravirine Atazanavir 150 033 Intelencereg 2014
ARV (NNRTI) Nevirapine Ritonavir 143 030 Sekar et al 2009
ARV (NNRTI) Rilpivirine Ketoconazole 149 033 Edurantreg 2015
ARV (NNRTI) Delaviridine Ketoconazole 150 033 Rescriptorreg 2012
ARV (II) Dolutegravir Atazanavir 191 048 Tivicayreg 2014
ARV (II) Elvitegravir Ketoconazole 148 035 Striblidreg 2016
ARV (II) Raltegravir Atazanavir 172 042 Iwamoto et al 2008
Anti-TB
Bedaquiline Ketoconazole 122 018 Sirturotrade 2012
Clarithromycin Ritonavir 177 046 Ouellet et al 1998
Delamanidb - - 090 -
Antidiabetic
8
Pioglitazone Ketoconazole 134 025 Actosreg 2011
Repaglinide Itraconzaole 140 029 PrandiMetreg 2012
Saxagliptin Ketoconazole 250 060 Onglyzareg 2009
Alogliptin Ketoconazole 120 017 Nesinareg 2013
Teneligliptin
Ketoconazole 149 033 Nakamaru et al 2014
Antihypertensive
Amlodipine Telaprevir 300 067 Lee et al 2011
Felodipine Itraconazole 600 083 Jalava et al1997
Lercanidipine Ketoconazole 1500 093 Zanidipreg 2010
Nifedipine Diltiazem 310 068 Adalatreg CC 2010
Nitrendipine Cimetidine 240 058 Soons et al 1991
Diltiazem Cimetidine 153 035 Tiazacreg 2011
Verapamil Grape fruit 143 030 Fuhr et al 2002
Losartan Erythromycin 130 023 Cozaarreg 2015
Eplerenone Ketoconazole 539 081 Cook et al 2004
Guanfacine Ketoconazole 300 067 Intunivreg 2013
Antihyperlipidemic
Simvastatin Itraconazole 131 092 Zocorreg 2012
Lovastatin Itraconazole 22 095 Mevacorreg 2012
Atorvastatin lopinavir ritonavir
59 083 Lipitorreg 2009
Pravastatin Darunavir ritonavir
181 045 Pravachol 2016
Antileprotics
Daspone Clarithromycin 101 001 Winter et al 2004 aAs described in Section 313 fm values are calculated for all the substrates based on their magnitude of change in plasma AUC (AUCi=AUC in presence of an inhibitorAUC in absence of an inhibitor) with a CYP3A45 inhibitor bAs no in vivo drug interaction studies were found reported for CYP3A45 inhibitors an fm value of 090 was assumed for delamanid ARV antiretroviral CYP cytochrome P450 AUC area under the plasma concentration-time curve fm fraction metabolized by an enzyme II integrase inhibitor NNRTI non-nucleoside reverse transcriptase inhibitor NS3 non-structural protein 3 PI protease inhibitor
9
Supplemental TABLE 3
Unbound fraction of clofazimine in microsomes (fumic)
[HLM] (mg proteinmLminus1)
Clofazimine (μM)
Mean ARa Avg fumic plusmn SDb Before UC (total)
After UC (free)
0025 10 197 157 000794 plusmn 00005 1 201 0244 00121 plusmn 000023 Averagec 00100 plusmn 00023 005 10 203 148 000729 plusmn 000021 1 206 0176 000856 plusmn 00005 Averagec 000792 plusmn 000077 05 10 212 0337 000159 plusmn 0000056 1 225 0037 000165 plusmn 000015 Averagec 000162 plusmn 000011 aAverage area ratio of triplicates bAverage fumic (unbound fraction) = ARfree ARtotal plusmn SD of triplicate samples for each clofazimine concentration examined cThe average plusmn SD of the two clofazimine concentrations at each HLM concentration examined AR area ratio fumic microsomal protein binding HLM human liver microsomes μM micromole mg milligram SD standard deviation UC ultracentrifugation
10
Supplemental TABLE 4
PBPK model input parameters for midazolam Parameter Value Physical chemistry and blood binding
Molecular weight (gmol) 3258 LogP 353 Compound type Ampholyte pKa1 1095 pKa2 62 BP 0603 fup 0032
Absorption Model used First-order absorption fa 1 Lag time (h) 0 ka (hminus1) 3 fugut 1 Qgut (lh) 1402 Peffman (10minus4 cms) 6045
Distribution Model used Minimal PBPK Vss (lkg) (CV) 1 (30) Liver tissueplasma partition coefficient 1
Elimination Model used Enzyme kinetics recombinant CYP CYP3A4 Vmax (minminus1) 523 (1-OH pathway) 52 (4-OH pathway) CYP3A4 Kmu (microM) 216 (1-OH pathway) 318 (4-OH pathway) CYP3A5 Vmax (minminus1) 197 (1-OH pathway) 403 (4-OH pathway) CYP3A5 Kmu (microM) 416 (1-OH pathway) 348 (4-OH pathway) Active uptake into hepatocytes 1 CLR (lh) 0085
microM micromole BP blood-to-plasma ratio CLR renal clearance CV coefficient of variation fa fraction of dose absorbed fugut unbound fraction of drug in enterocyte fumic fraction unbound in the microsomes fup fraction unbound in the plasma g gram h hour ka absorption rate constant Kmu unbound MichaelisndashMenten constant LogP log of the partition coefficient mol moles PBPK Peffman effective permeability in man pKa acid dissociation constant Qgut nominal flow in gut model Vmax maximum velocity Vss volume of distribution at steady state
11
Supplemental TABLE 5
PBPK model input parameters for saquinavir
Parameter Value Physical chemistry and blood binding
Molecular weight (gmol) 67086 logP 39 Compound type Ampholyte pKa1 1094 pKa2 667 BP 06 fup 0025
Absorption Model used First-order absorption fa 1 Lag time (h) 0 ka (hminus1) 255 fugut 0025 Qgut (lh) 49089 Peffman (10minus4 cms) 07668
Distribution Model used Minimal PBPK Vss (lkg) (CV) 363 (30) Liver tissueplasma partition coefficient 1
Elimination Model used Enzyme kinetics HLM CYP3A4 Vmax (pmolminmg protein) 2860 CYP3A4 Kmu (microM) 051 CLR (lh) 095
Interaction CYP3A4 Ki (microM) (fumic) 35 (058)
microM micromole BP blood-to-plasma ratio CLR renal clearance CV coefficient of variation fa fraction of dose absorbed fugut unbound fraction of drug in enterocyte fumic fraction unbound in the microsomes fup fraction unbound in the plasma g gram h hour HLM human liver microsomes ka absorption rate constant Kmu unbound MichaelisndashMenten constant LogP log of the partition coefficient mol moles PBPK Peffman effective permeability in man pKa acid dissociation constant Qgut nominal flow in gut model Vmax maximum velocity Vss volume of distribution at steady state
12
Supplemental TABLE 6
PBPK model input parameters for efavirenz Parameter Value Physical chemistry and blood binding
Molecular weight (gmol) 31568 logP 402 Compound type Monoprotic Acid pKa 102 BP 074 fup 0029
Absorption Model used First-order absorption fa (CV) 067 (15) Lag time (h) (CV) 036 (15) ka (hminus1) (CV) 041 (0) fugut 0005 Qgut (lh) 1378 Peffman (10minus4 cms) 5680
Distribution Model used Minimal PBPK kin (hminus1) 029 kout (hminus1) 009 Vsac (lkg) 11 Vss (lkg) (CV) 2256 Kp scalar 0155
Elimination Model used Enzyme kinetics recombinant CYP CYP1A2 CLint (microLminpmol CYP) 003 CYP2B6 CLint (microLminpmol CYP) 136 CYP2A6 CLint (microLminpmol CYP) 047 CYP3A4 CLint (microLminpmol CYP) 0012 Additional HLM CLint (microLminmg protein) 0694 Active uptake into hepatocytes 1 CLR (lh) 0
Interaction CYP2B6 Indmax (fold) 62 CYP2B6 IndC50 (microM) (fuinc) 12 (015) CYP3A4 Indmax (fold) 99 CYP3A4 IndC50 (microM) (fuinc) 38 (015)
microM micromole BP blood-to-plasma ratio CLint intrinsic clearance CLR renal clearance CV coefficient of variation CYP cytochrome P450 fa fraction of dose absorbed fugut unbound fraction of drug in enterocyte fumic fraction unbound in the microsomes fup fraction unbound in the plasma fuinc fraction unbound in intrinsic clearance g gram h hour IndC50 calibrated concentration of inducer at frac12 Indmax Indmax calibrated maximal fold change of induction over vehicle control ka absorption rate constant Kmu unbound MichaelisndashMenten constant Kp tissueplasma partition coefficient
13
LogP log of the partition coefficient mol moles PBPK physiologically based pharmacokinetic Peffman effective permeability in man pKa acid dissociation constant Qgut nominal flow in gut model Vsac single adjusted compartment volume Vss volume of distribution at steady state
14
Supplemental TABLE 7
PBPK model input parameters for repaglinide Parameter Value Physical chemistry and blood binding
Molecular weight (gmol) 4526 logP 398 Compound type Ampholyte pKa1 416 pKa2 601 BP 062 fup 0023
Absorption Model used First-order absorption fa 0981 Lag time (h) 0 ka (hminus1) 1598 fugut 1 Qgut (lh) 1219 Peffman (10minus4 cms) 3886
Distribution Model used Full PBPK Vss (lkg) (CV) 02375 Kp scalar 33
Elimination Model used Enzyme kinetics HLM CYP2C8 Vmax (pmolminmg protein) 3008 CYP2C8 Kmu (microM) 23 CYP3A4 Vmax (pmolminmg protein) 9582 CYP3A4 Kmu (microM) 132 CLR (lh) 0013
Transport Model Permeability limited liver model Sinusoidal uptake OATP1B1 CLintT (microLminmillion cells) (fuinc)
246 (1) microM micromole BP blood-to-plasma ratio CLR renal clearance CV coefficient of variation fa fraction of dose absorbed fugut unbound fraction of drug in enterocyte fuinc fraction unbound in intrinsic clearance fumic fraction unbound in the microsomes fuplasma fraction unbound in the plasma g gram h hour HLM human liver microsomes ka absorption rate constant Kmu unbound MichaelisndashMenten constant LogP log of the partition coefficient mol moles OATP1B1 Organic Anion Transporting Polypeptide 1B1 pmol picomole PBPK physiologically based pharmacokinetic Peffman effective permeability in man pKa acid dissociation constant Qgut nominal flow in gut model Vmax maximum velocity Vss volume of distribution at steady state
15
Supplemental TABLE 8
PBPK model input parameters for desipramine Parameter Value Physical chemistry and blood binding
Molecular weight (gmol) 2664 logP 457 Compound type Monoprotic base pKa 1026 BP 116 fup 024
Absorption Model used First-order absorption fa 1 Lag time (h) 0 ka (hminus1) 062 fugut 1 Qgut (lh) 1273 Peffman (10minus4 cms) 44
Distribution Model used Minimal PBPK Vss (lkg) (CV) 208 Liver tissueplasma partition coefficient 1
Elimination Model used Enzyme kinetics HLM CYP2D6 Vmax (pmolminmg protein) 935 CYP2D6 Kmu (microM) 084 Active uptake into hepatocytes 1 CLR (lh) 15
microM micromole BP blood-to-plasma ratio CLR renal clearance CV coefficient of variation fa fraction of dose absorbed fugut unbound fraction of drug in enterocyte fumic fraction unbound in the microsomes fup fraction unbound in the plasma g gram h hour HLM human liver microsomes ka absorption rate constant Kmu unbound MichaelisndashMenten constant LogP log of the partition coefficient mol moles pmol picomole PBPK physiologically based pharmacokinetic Peffman effective permeability in man pKa acid dissociation constant Qgut nominal flow in gut model Vmax maximum velocity Vss volume of distribution at steady state
16
Supplemental TABLE 9
Summary input and output parameters from the simulation of the trial design described in Table 2 (Model application) of the manuscript (Simulated clinical PK parameters for clofazimine at Day 126 following multiple oral doses of 100 mg QD)
Input ParametersOutput Parameters
Workspace LAM320_100mg43QDSubstrate HG-LAM320_patientSimulation Mode PKPD Parameters + PKPD Profiles
Substrate SubstrateCompound Name HG-LAM320_patient Absorption Model 1st orderMol Weight (gmol) 473000 Permeability Assay Enteredlog P 7660 Peffman RegionalCompound Type Monoprotic BasepKa 1 8510 Distribution Model Minimal PBPK ModelpKa 2 na Vss (Lkg) 47500BP 0550 Prediction Method EnteredHaematocrit 45000fu 0001 Clearance Type In Vivo Clearance
Trial DesignSubstrate
Population Name LAMSim-Healthy Volunteers FastedFed FastedUse Pop Representative No Route OralPopulation Size 100000 Dose Units Dose (mg)Number of Trials 10000 Dose 100000No of Subjects per Trial 10000 Start DayTime Day 1 0900Start DayTime Day 1 0900 Dosing Regimen Multiple Dose
End DayTime Day 127 0900 Dose Interval (h) 24000
Study Duration (h) 3024000 Number of Doses 126000
Sampling Time Pre-defined Uniform
Sampling Site Selection Off
PKPD Parameters Mean Median Geometric mean Can be found in Excel sheet
CL (Lh) 399 372 380 358 404 Clearance Trials SS
CLpo (Lh) 626 567 588 550 629 Clearance Trials SS
fa (Sub) 070 070 070 069 071 Clearance Trials SS
Fg (Sub) 100 100 100 100 100 Clearance Trials SS
Fh (Sub) 092 093 092 092 093 Clearance Trials SS
F (Sub) 065 065 065 063 066 Clearance Trials SS
Vss (Subs)(LKg) 4638 4539 4546 4371 4728 Distribution - Vols
PKPD Profiles Mean Median Geometric mean Can be found in Excel sheet
CMax (ngmL) 79653 70291 72802 67191 78881 AUC
TMax (h) 677 700 659 625 694 AUC
AUC (ngmLh) 1662709 1591914 1579708 1481991 1683869 AUC
CL (DoseAUC)(Lh) 668 628 633 594 675 AUC
Confidence Interval
Simcyp Population Based Simulator1062017 1128
Simcyp Version 15 (02122015)
Input Parameters
Output Parameters
Confidence Interval
17
Supplemental TABLE 10
Input sheet from the trial design described in Table 2 (Model application) of the manuscript (Simulated clinical PK parameters for clofazimine at Day 126 following multiple oral doses of 100 mg QD)
Substrate Trial Design Software Version Detail
Compound Name HG-LAM320_patient Use Pop Representative No Simulation Duration(seconds) 23000Version number Not applicable Population Size 100000 Windows Version Windows 7Compound Type Small Molecule Number of Trials 10000 Excel Version Excel 2010Route Oral No of Subjects per Trial 10000 Source File Location CProgram FilesSimcypSimcyp Simulator V15ScreensDose Units Dose (mg) Population name LAMSim-Healthy Volunteers Data Path Location CUsersPublicDocumentsDose 100000 Version number Not applicable Excel Embedded Workspace NoStart Day 1000 Minimum Age (years) 18000 SimcypexeStart Time 9h0m Maximum Age (years) 70000 File Version 150860Dosing Regimen Multiple Dose Propn of Females 0500 Date Modified 02122015Dose Interval (h) 24000 FastedFed Fasted File Size (bytes) 2584064Number of Doses 126000 Fluid intake with dose (mL) 250000 SimcypExcelPluginV15dll
Fluid intake with dose CV () 30000 File Version 150860PhysChem and Blood Binding PKPD Parameters On Date Modified 02122015
PKPD Profiles On File Size (bytes) 3110400Mol Weight (gmol) 473000 Start DayTime Day 1 0900 SimcypUICommondlllog P 7660 End DayTime Day 127 0900 File Version 15000Compound Type Monoprotic Base Study Duration (h) 3024000 Date Modified 02122015pKa 1 8510 File Size (bytes) 4302848BP input type User Sub Route Oral SimcypViewModelAnimaldllBP 0550 File Version 15000Haematocrit 45000 Random Generator Mersenne Twister (MT19937) Date Modified 02122015fu Input User Seed Fixed File Size (bytes) 64000fu 0001 Seed Value 1000 SimcypViewModelCommondllReference Binding Component HSA File Version 150860Protein Reference Conc (gL) 45000 Solver sampling interval (h) 0050 Date Modified 02122015 Bound to Lipoprotein 0000 Sampling Time Pre-defined Uniform File Size (bytes) 253440 Bound to Lipoprotein (CV ) 0000 Number of time samples 1200000 SimcypLicenceManagerdll
File Version 1002Absorption Sampling Site Selection Off Date Modified 02122015
File Size (bytes) 86016Absorption Model 1st order AUCt for the first dose Off simcypViewModeldllInput type User AUC_INF for the first dose On File Version 150860fa 0700 AUCt for the last dose Off Date Modified 02122015CV fa () 10000 AUC Calculation Method Linear Trapezoid File Size (bytes) 488448ka (1h) 0250 simcyplicencingdllCV ka () 30000 Memory Size 15387836000 File Version 150860lag time (h) 0550 Solubility Cap (mgmL) 500000 Date Modified 02122015CV lag time () 30000 Differential Solver 5th-order Runge-Kutta File Size (bytes) 56832fu(Gut) input type User Maximum number of steps 1000000000 simcypmodelXmlSerializersdllfu(Gut) 0001 Relative Tolerance 0000 File Version 0000Q(Gut) Input Predicted Relative Tolerance when ADAM is used 0000 Date Modified 02122015Peffman Type na Integration error tolerance 0001 File Size (bytes) 2979840
Use UBL fluid volumes Off simcypmodeldllDistribution File Version 150860
Paediatric Module Not Loaded Date Modified 02122015Distribution Model Minimal PBPK Model No Differential Equations 15000 File Size (bytes) 3415040SAC kin (1h) 0031SAC kout (1h) 0016SAC CLin (Lh) 39690SAC CLout (Lh) 26749SAC Q (Lh) 42600Volume [Vsac] (Lkg) 327E+01Vss input type UserVss (Lkg) 47500CV Vss () 20000Liver input type UserLiver Kp 1000
Elimination
Allometric Scaling Not Used
Clearance Type In Vivo ClearanceCL (iv) (Lh) 4180CL (iv) CV 30000Active Uptake into Hepatocyte 1000CL R (Lh) 0000
CYPs andor UGTs Interaction
Enzyme CYP2C8Ki (microM) 0004fu mic 1000
Enzyme CYP2D6Ki (microM) 0002fu mic 1000
Enzyme CYP3A4Ki (microM) 786E-04fu mic 1000
Simcyp Population Based Simulator1062017 1128
Simcyp Version 15 (02122015)
18
Supplemental TABLE 11
PK statistical output from Simcyp from the simulation of the clinical PK parameters for clofazimine at Day 126 following multiple oral doses of 100 mg QD (refers to Table 7 of the manuscript)
StatisticsAUC (ngmLh) TMax (h) CMax (ngmL) Dose (mg) CL (DoseAUC) (Lh)
Mean 1662709 677 79653 10000 668Median 1591914 700 70291 10000 628
Geometric Mean 1579708 659 72802 10000 63395 Confidence interval around the geometric mean (lower limit) 1481991 625 67191 10000 59495 Confidence interval around the geometric mean (upper limit) 1683869 694 78881 10000 675
5th centile 932352 485 41081 10000 39995th centile 2505686 835 155203 10000 1073Skewness 083 -173 249 na 153
cv 032 019 049 000 035Min Val 586757 200 25483 10000 271Max Val 3690211 965 296581 10000 1704
Fold 629 482 1164 100 629Std Dev 536700 131 39223 000 235
19
Supplemental FIGURE 1
Sensitivity analysis of clofazamine fa (A) ka (B) and fugut (C) value on the AUC ratio of midazolam Dosing regimen Midazolam 5 mg on Day 126 + clofazimine 100 mg QD on Day 1-Day
126 A
B C
0000
0500
1000
1500
2000
2500
3000
3500
4000
000 020 040 060 080 100 120
AUC
Ratio
(MDZ
)
AUC Ratio (MDZ)
fa (clofazamine)
0000
0500
1000
1500
2000
2500
3000
3500
000 005 010 015 020 025 030
AUC
Ratio
(MDZ
)
AUC Ratio (MDZ)
ka (clofazamine)
0000
0500
1000
1500
2000
2500
3000
3500
4000
4500
000 020 040 060 080 100 120
AUC
Ratio
(MDZ
)
AUC Ratio (MDZ)
Fugut Value (clofazamine)
20
References
Actosreg (pioglitazone hydrochloride) (2011) Highlights of Prescribing Information accessed on
June 17 2017
Adalatreg CC (Nifedipine) (2010) Highlights of Prescribing Information accessed June 17 2017
Cook CS Berry LM Burton E (2004) Prediction of in vivo drug interactions with eplerenone in
man from in vitro metabolic inhibition data Xenobiotica 34215ndash228
Cozaarreg (losartan) (2015) Prescribing Information accessed on accessed June 17 2017
EDURANTreg (rilpivirine) (2015) Full Prescribing Information accessed on June 17 2017
Fuhr U Muumlller-Peltzer H Kern R Lopez-Rojas P Juumlnemann M Harder S Staib AH (2002)
Effects of grapefruit juice and smoking on verapamil concentrations in steady state Eur J Clin
Pharmacol 58(1)45-53
Grub S Bryson H Goggin T Luumldin E Jorga K (2001) The interaction of saquinavir (soft gelatin
capsule) with ketoconazole erythromycin and rifampicin comparison of the effect in healthy
volunteers and in HIV-infected patients Eur J Clin Pharmacol 57 115-121
Hsu A Granneman GR Cao G Carothers L Japour A El-Shourbagy T Dennis S Berg J
Erdman K Leonard JM Sun E (1998) Pharmacokinetic interaction between ritonavir and
indinavir in healthy volunteers Antimicrob Agents Chemother 422784-2791
INTELENCEreg (etravirine) (2014) Highlights of Prescribing Information accessed on June 17
2017
INTUNIVreg (guanfacine) (2013) Highlights of Prescribing Information accessed on June 17
2017
Iwamoto M Wenning LA Mistry GC Petry AS Liou SY Ghosh K Breidinger S Azrolan N
Gutierrez MJ Bridson WE Stone JA Gottesdiener KM Wagner JA (2008) Atazanavir
21
modestly increases plasma levels of raltegravir in healthy subjects Clin Infect Dis 47137-
140
Jalava KM Olkkola KT Neuvonen PJ (1997) Itraconazole greatly increases plasma
concentrations and effects of felodipine Clin Pharmacol Ther 61(4)410-415
KALETRAreg (lopinavir and ritonavir) (2017) Highlights of Prescribing Information accessed on
June 17 2017
Lee JE van Heeswijk R Alves K Smith F Garg V (2011) Effect of the hepatitis C virus
protease inhibitor telaprevir on the pharmacokinetics of amlodipine and atorvastatin
Antimicrob Agents Chemother 55(10)4569-4574
LIPITORreg (atorvastatin calcium) (2009) Highlights of Prescribing Information accessed on
June 17 2017
Liu P Foster G LaBadie RR Gutierrez MJ Sharma A (2008) Pharmacokinetic interaction
between voriconazole and efavirenz at steady state in healthy male subjects J Clin Pharmacol
4873-84
MacGregor TR1 Sabo JP Norris SH Johnson P Galitz L McCallister S (2004)
Pharmacokinetic characterization of different dose combinations of coadministered tipranavir
and ritonavir in healthy volunteers HIV Clin Trials 5371-382
MEVACORreg (lovastatin) (2012) Prescribing Information accessed on June 17 2017
Morcos PN Chang L Navarro M Chung D Smith PF Brennan BJ Tran JQ (2014) Two-way
interaction study between ritonavir boosted danoprevir a potent HCV protease inhibitor and
ketoconazole in healthy subjects Int J Clin Pharmacol Ther 52 103-111
Nakamaru Y Hayashi Y Sekine M Kinoshita S Thompson J Kawaguchi A Davies M Juumlrgen
Heuer H Yamazaki H Akimoto K (2014) Effect of ketoconazole on the pharmacokinetics of
22
the dipeptidyl peptidase-4 inhibitor teneligliptin an open-label study in healthy white subjects
in Germany Clin Ther 36(5)760-769
NESINAreg (alogliptin) (2013) Highlights of Prescribing Information accessed on June 17 2017
OLYSIOreg (simeprevir) (2017) Highlights of Prescribing Information accessed on June 17
2017
ONGLYZAreg (saxagliptin) (2009) Highlights of Prescribing Information accessed on June 17
2017
Ouellet D Hsu A Granneman GR Carlson G Cavanaugh J Guenther H Leonard JM (1998)
Pharmacokinetic interaction between ritonavir and clarithromycin Clin Pharmacol Ther
64355-362
Polk RE Crouch MA Israel DS Pastor A Sadler BM Chittick GE Symonds WT Gouldin W
Lou Y (1999) Pharmacokinetic interaction between ketoconazole and amprenavir after single
doses in healthy men Pharmacotherapy 191378-1384
PRANDIMETreg (repaglinide and metgormin hydrochloride) (2012) Highlights of Prescribing
Information accessed on June 17 2017
PRAVACHOLreg (pravastatin sodium) (2016) Highlights of Prescibing Information accessed on
November 24 2016
RESCRIPTORreg (delaviridine mesylate) (2012) Prescribing Information accessed on June 2017
REYATAZreg (atazanavir) (2017) Highlights of Prescribing Information accessed on June 2017
Sekar V Lefebvre E Marieumln K De Pauw M Vangeneugden T Pozniak A Hoetelmans RM
(2009) Pharmacokinetic interaction between nevirapine and darunavir with low-dose ritonavir
in HIV-1-infected patients Br J Clin Pharmacol 68116-119
23
Sekar VJ Lefebvre E De Pauw M Vangeneugden T Hoetelmans RM (2008) Pharmacokinetics
of darunavirritonavir and ketoconazole following co-administration in HIVndashhealthy
volunteers Br J Clin Pharmacol 66215-221
SIRTUROtrade (bedaquiline) (2012) Highlights of Prescribing Information accessed on June 17
2017
Soons PA Vogels BA Roosemalen MC Schoemaker HC Uchida E Edgar B Lundahl J Cohen
AF Breimer DD (1991) Grapefruit juice and cimetidine inhibit stereoselective metabolism of
nitrendipine in humans Clin Pharmacol Ther 50(4)394-403
STRIBILDreg (elvitegravir cobicistat emtricitabine tenofovir disoproxil fumarate) (2016)
Highlights of Prescribing Information accessed on June 17 2017
TIAZACreg (diltiazem hydrochloride) (2011) Prescribing Information accessed on accessed on
June 17 2017
TIVICAYreg (dolutegravir) (2014) Highlights of Prescribing Information accessed on June 17
2017
VIRACEPTreg (nelfinavir mesylate) (2013) Highlights of Prescribing Information accessed on
June 17 2017
Winter HR Trapnell CB Slattery JT Jacobson M Greenspan DL Hooton TM Unadkat JD
(2004) The effect of clarithromycin fluconazole and rifabutin on dapsone hydroxylamine
formation in individuals with human immunodeficiency virus infection (AACTG 283) Clin
Pharmacol Ther 76(6)579-857
ZANIDIPreg (lercanidipine hydrochloride) (2010) Summary of Product Characteristics accessed
on June 17 2017
ZOCORreg (simvastatin) (2010) Highlights of Prescribing Information accessed on June 17 2017

References
Aung KJ Van Deun A Declercq E Sarker MR Das PK Hossain MA and Rieder HL (2014)Successful lsquo9-month Bangladesh regimenrsquo for multidrug-resistant tuberculosis among over500 consecutive patients Int J Tuberc Lung Dis 181180ndash1187
Balakrishnan S and Seshadri PS (1981) Drug interactionsmdashthe influence of rifampicin and clo-fazimine on the urinary excretion of DDS Lepr India 5317ndash22
Dooley KE Obuku EA Durakovic N Belitsky V Mitnick C and Nuermberger EL EfficacySubgroup RESIST-TB (2013) World Health Organization group 5 drugs for the treatment ofdrug-resistant tuberculosis unclear efficacy or untapped potential J Infect Dis 2071352ndash1358
Einolf HJ Chen L Fahmi OA Gibson CR Obach RS Shebley M Silva J Sinz MW Unadkat JDZhang L et al (2014) Evaluation of various static and dynamic modeling methods to predictclinical CYP3A induction using in vitro CYP3A4 mRNA induction data Clin Pharmacol Ther95179ndash188
Fahmi OA Hurst S Plowchalk D Cook J Guo F Youdim K Dickins M Phipps A Darekar AHyland R et al (2009) Comparison of different algorithms for predicting clinical drug-druginteractions based on the use of CYP3A4 in vitro data predictions of compounds as precipitantsof interaction Drug Metab Dispos 371658ndash1666
Fahmi OA Maurer TS Kish M Cardenas E Boldt S and Nettleton D (2008) A combinedmodel for predicting CYP3A4 clinical net drug-drug interaction based on CYP3A4 in-hibition inactivation and induction determined in vitro Drug Metab Dispos 361698ndash1708
Fajardo TT Abalos RM dela Cruz EC Villahermosa LG Walsh DS Cellona RV Balagon MVTan EV and Walsh GP (1999) Clofazimine therapy for lepromatous leprosy a historical per-spective Int J Dermatol 3870ndash74
Gertz M Harrison A Houston JB and Galetin A (2010) Prediction of human intestinal first-passmetabolism of 25 CYP3A substrates from in vitro clearance and permeability data Drug MetabDispos 381147ndash1158
Gill HJ Tingle MD and Park BK (1995) N-Hydroxylation of dapsone by multiple enzymes ofcytochrome P450 implications for inhibition of haemotoxicity Br J Clin Pharmacol 40531ndash538
Horita Y and Doi N (2014) Comparative study of the effects of antituberculosis drugs and anti-retroviral drugs on cytochrome P450 3A4 and p-glycoprotein Antimicrob Agents Chemother 583168ndash3176
Hwang TJ Dotsenko S Jafarov A Weyer K Falzon D Lunte K Nunn P Jaramillo E KeshavjeeS and Wares DF (2014) Safety and availability of clofazimine in the treatment of multidrug and
extensively drug-resistant tuberculosis analysis of published guidance and meta-analysis ofcohort studies BMJ Open 4e004143
Kajosaari LI Laitila J Neuvonen PJ and Backman JT (2005) Metabolism of repaglinide byCYP2C8 and CYP3A4 in vitro effect of fibrates and rifampicin Basic Clin Pharmacol Toxicol97249ndash256
Kuaban C Noeske J Rieder HL Aiumlt-Khaled N Abena Foe JL and Treacutebucq A (2015) Higheffectiveness of a 12-month regimen for MDR-TB patients in Cameroon Int J Tuberc Lung Dis19517ndash524
Levy L (1974) Pharmacologic studies of clofazimine Am J Trop Med Hyg 231097ndash1109Obach RS Walsky RL Venkatakrishnan K Gaman EA Houston JB and Tremaine LM (2006)The utility of in vitro cytochrome P450 inhibition data in the prediction of drug-drug interactionsJ Pharmacol Exp Ther 316336ndash348
Piubello A Harouna SH Souleymane MB Boukary I Morou S Daouda M Hanki Y and VanDeun A (2014) High cure rate with standardised short-course multidrug-resistant tuberculosistreatment in Niger no relapses Int J Tuberc Lung Dis 181188ndash1194
Quigley JM Fahelelbom KMS Timoney RF and Corrigan OI (1990) Temperature depen-dence and thermodynamics of partitioning of clofazimine analogues in the n-octanolwatersystem Int J Pharm 58107ndash113
Rowland M and Matin SB (1973) Kinetics of drug-drug interactions J Pharmacokinet Biopharm1553ndash567
Van Deun A Maug AK Salim MA Das PK Sarker MR Daru P and Rieder HL (2010) Shorthighly effective and inexpensive standardized treatment of multidrug-resistant tuberculosisAm J Respir Crit Care Med 182684ndash692
Varma MV Lai Y Kimoto E Goosen TC El-Kattan AF and Kumar V (2013) Mechanisticmodeling to predict the transporter- and enzyme-mediated drug-drug interactions of repaglinidePharm Res 301188ndash1199
Vischer WA (1969) The experimental properties of G 30 320 (B 663)mdasha new anti-leprotic agentLepr Rev 40107ndash110
Zumla A Raviglione M Hafner R and von Reyn CF (2013) Tuberculosis N Engl J Med 368745ndash755
Address correspondence to Dr Heidi J Einolf Novartis PharmaceuticalsCorporation East Hanover NJ 07936 E-mail heidieinolfnovartiscom
32 Sangana et al
at ASPE
T Journals on February 18 2022
dmdaspetjournalsorg
Dow
nloaded from
1
SUPPLEMENTAL DATA TO
Evaluation of clinical drug interaction potential of clofazimine using static and dynamic
modeling approaches
Ramachandra Sangana Helen Gu Dung Yu Chun Heidi J Einolf
Drug Metabolism and Disposition
MATERIAL AND METHODS
Inhibitory effect of clofazimine on CYP-selective probe substrate metabolism
The potential of clofazimine to inhibit human cytochrome P450 (CYP) enzyme activity was
assessed in pooled human liver microsomes (HLM) by testing the effect of increasing
concentrations of clofazimine on the in vitro metabolism of several probe substrates whose
metabolism is known to be selective for individual CYP enzymes CYP activity was assessed
using the probe reactions phenacetin O-deethylation (CYP1A2) coumarin 7-hydroxylation
(CYP2A6) bupropion hydroxylation (CYP2B6) amodiaquine N-deethylation (CYP2C8)
diclofenac 4prime-hydroxylation (CYP2C9) S-mephenytoin 4prime-hydroxylation (CYP2C19) bufuralol
1prime-hydroxylation (CYP2D6) chlorzoxazone 6-hydroxylation (CYP2E1) and midazolam-
1prime-hydroxylation or testosterone 6β-hydroxylation (CYP3A) Probe substrate concentrations used
for these determinations were less than or equal to their reported MichaelisndashMenten constant
(Km) values For reversible inhibition the incubations (37degC 10ndash20 min) were composed of
(final concentrations) potassium phosphate buffer (100 mM pH 74) nicotinamide adenine
dinucleotide phosphate (NADPH) (1 mM) magnesium chloride (5 mM) HLM protein (005ndash05
mg proteinmL) probe substrate (1 μM midazolam or coumarin 5 μM phenacetin diclofenac or
bufuralol 2 μM amodiaquine 10 μM chlorzoxazone 15 μM S-mephenytoin 25 μM bupropion
2
or 50 μM testosterone) and varying concentrations of clofazimine (0ndash10 μM) After pre-
incubation for 3 min the reactions were initiated by addition of NADPH and terminated by
addition of acetonitrile (2 volumes) These were conducted in a 96-well plate format at 37degC
using a TECAN Freedom Evo system (Zurich Switzerland) The reactions were initiated by
adding NADPH after at least a 3-min thermal equilibrium Incubations were terminated by the
addition of acetonitrile (200 μL) Due to the poor aqueous solubility of clofazimine in HLM
incubation mixture the organic content was increased to ~5 for all the experiments Formation
of probe substrate metabolites from the above samples acetaminophen 7-hydroxycoumarin
hydroxybupropion N-desethylamodiaquine 4prime-hydroxydiclofenac 4prime-hydroxy-S-mephenytoin
1prime-hydroxybufuralol 6-hydroxychlorzoxazone 1prime-hydroxymidazolam and 6β-
hydroxytestosterone was determined by liquid chromatographyndashtandem mass spectrometry (LC-
MSMS) after concentration and reconstitution of the samples in acetonitrilewater containing an
internal standard Values for 50 half maximal inhibitory concentration (IC50) for the inhibition
of CYP enzyme were determined by visual inspection of the data (percentage of control CYP
activity vs clofazimine concentration) The apparent inhibition constant (Ki) values were
determined for CYP inhibition of CYP2C8 CYP2D6 and CYP3A45 (midazolam
1ʹ-hydroxylation) The assay conditions are generally similar to those described above with a
range of clofazimine concentrations on a range of probe substrate concentrations for CYP2C8
(0ndash5 microM clofazimine on 02ndash20 microM amodiaquine) CYP2D6 (0ndash24 microM clofazimine on 125ndash
100 microM bufuralol) and CYP3A45 (0ndash07 microM clofazimine on 02ndash20 microM midazolam) The Ki
values were determined using the software package SigmaPlot (SigmaPlot 2004 version 121
SPSS Inc US) The equation for data evaluation was selected based on visual inspection of the
fitting and best-fit criteria (R2 values) For CYP2C8 and CYP3A45 the Ki value was derived
3
using a mixed (partial) inhibition model and for CYP2D6 the Ki value was derived using a
competitive (partial) inhibition model The equations used to calculate the Ki values are listed as
below
Competitive inhibition (partial) ( ) ( ) ( )iim
max
]I[1]I[1]S[1 KKKVv
sdot++sdot+=
a (1)
Mixed inhibition (partial) ( ) ( )[ ]( ) ( ) ( )iim
iimax
]I[1]I[1]S[1]I[1]I[1
KKKKKVvsdot++sdot+sdot+sdotsdot+
=sdot
aaaβ (2)
where v is initial rate of metabolism Vmax is maximal rate of metabolism Km is Michaelisndash
Menten constant [S] is substrate concentration [I] is inhibitor (clofazimine) concentration Ki is
inhibition constant
To investigate the possibility of time-dependent inhibition (TDI) of CYP1A2 CYP2B6
CYP2C8 CYP2C9 CYP2C19 CYP2D6 and CYP3A45 clofazimine (0ndash10 microM) was
preincubated with HLM using protein concentrations of 10 mg microsomal proteinmL for
CYP1A2 CYP2B6 and CYP2C19 and 05 mg microsomal proteinmL for CYP2C8 CYP2C9
CYP2D6 and CYP3A45 The concentrations of clofazimine were 01 05 1 25 5 and 10 microM
for all experiments The assessment of the TDI of the total seven CYP enzymes was divided into
two experiments The first experiment included CYP2B6 CYP2C8 CYP2D6 and CYP3A45
while the second experiment included CYP1A2 CYP2C9 and CYP2C19 After specified
incubation times aliquots (5 microL) of the pre-incubation mixture were transferred to a 95 microL
enzyme activity assay mixture to determine the CYP activity remaining The concentrations of
probe substrates in the enzyme activity assay were 50 μM phenacetin (CYP1A2) 15 mM
bupropion (CYP2B6) 20 μM amodiaquine (CYP2C8) 25 μM diclofenac (CYP2C9) 300 μM S-
mephenytoin (CYP2C19) 25 μM bufuralol (CYP2D6) and 20 μM midazolam (CYP3A45) The
enzyme activity assay reactions were incubated at 37degC for 6 min and terminated as above
4
Positive-control time-dependent inhibitors included furafylline (CYP1A2) ticlopidine (CYP2B6
and CYP2C19) gemfibrozil glucuronide (CYP2C8) tienilic acid (CYP2C9) paroxetine
(CYP2D6) and troleandomycin (CYP3A4) Sample preparation for analysis of probe substrate
metabolite formation by LC-MSMS was as described above For positive controls the
inactivation parameters kinact (maximum inactivation rate) and KI (concentration at frac12 kinact)
were determined by plotting the natural log of the percentage of control activity remaining
following incubations with increasing inhibitor concentration against time of pre-incubation The
absolute value of the observed rate of inactivation (kobs) was then plotted against inhibitor
concentration ([I]) and the data analyzed by non-linear regression using the equation
kobs = (kinact [I]) (KI + [I]) (3)
Unbound fraction of clofazimine in microsomes (fumic)
Clofazimine (1 or 10 microM) was mixed with pooled HLM at various protein concentrations (0025
005 or 05 mg proteinmL) in 100 mM potassium phosphate buffer (pH 74) containing 5 mM
MgCl2 (final concentrations) using glass vials Aliquots of 05 mL of each sample were
transferred to ultracentrifuge tubes and incubated for 10 min at 37degC in an Eppendorf
Thermomixer (Eppendorf Germany) The samples were centrifuged at 306000 times g for 30 min at
~37degC in a Sorvallreg RC-M120GX Micro-ultracentrifuge (Newtown CT US) The ultracentrifuge
was allowed to stop without using the brake Two aliquots from the resulting supernatants were
removed from individual tubes for LC-MSMS analysis and protein analysis respectively Prior to
ultracentrifugation 50 microL aliquots of the samples were removed from each ultracentrifuge tube
for LC-MSMS analysis The MS area ratio (peak area of clofaziminepeak area of clofazimine-
d7) of the pre- and post-ultracentrifugation samples obtained from LC-MSMS analysis was used
for the calculation of unbound fraction (fumic) with the following equation
5
119891119891119891119891119898119898119898119898119898119898 = 119860119860119860119860119860119860119860119860 119860119860119860119860119903119903119898119898119903119903119891119891119891119891119891119891119891119891119860119860119860119860119860119860119860119860 119860119860119860119860119903119903119898119898119903119903119905119905119905119905119905119905119905119905119905119905
(4)
where Area ratiototal is the area ratio of the sample before ultracentrifugation and Area ratiofree is
the area ratio in the supernatant after ultracentrifugation
6
Supplemental TABLE 1
Inhibitory effect of clofazimine on CYP-selective probe substrate metabolism
CYP enzyme
Probe reaction IC50 value (μM) Ki value (μM) (Inhibition mechanism)
Totala Unboundb Totala Unboundb CYP1A2 Phenacetin O-
deethylation gt10 gt0016 ni ni
CYP2A6 Coumarin 7- hydroxylation
gt10 gt010 ni ni
CYP2B6 Bupropion hydroxylation
gt10 gt0079 ni ni
CYP2C8 Amodiaquine N- deethylation
25 0025 0372 plusmn 000753 (mixed partial)
000372 plusmn 00000753 (mixed partial)
CYP2C9 Diclofenac 4prime-hydroxylation
gt10 gt010 ni ni
CYP2C19 S-mephenytoin 4prime-hydroxylation
gt10 gt0016 ni ni
CYP2D6 Bufuralol 1prime-hydroxylation
12 00095 0311 plusmn 000432 (competitive partial)
000246 plusmn 00000342 (competitive partial)
CYP2E1 Chlorzoxazone 6-hydroxylation
gt10 gt0079 ni ni
CYP3A45 Midazolam 1prime-hydroxylation
035 00035 00786 plusmn 00170 (mixed partial)
0000786 plusmn 0000170 (mixed partial)
CYP3A45 Testosterone 6β-hydroxylation
033 00033 ni ni
atotal (bound + unbound) IC50 or Ki value bunbound IC50 or Ki value fumic values are listed in Supplemental Table 5 μM micromole CYP cytochrome P450 fumic unbound fraction in microsomes IC50 half maximal inhibitory concentration Ki inhibition constant ni not investigated
7
Supplemental TABLE 2
Fm values for antiretroviral antitubercular antihypertensive antidiabetic antileprotic and antihyperlipidemic drugs collected from literature Drug type Substrate CYP3A45
Inhibitor AUCi fm
a Reference
Antiretroviral
ARV (PI) Atazanavir Ketoconazole 110 009 Reyatazreg 2017
ARV (PI) Darunavir Ketoconazole 142 030 Sekar et al 2008
ARV (PI) Amprenavir Ketoconazole 134 025 Polk et al 1999
ARV (PI) Indinavir Ritonavir 450 078 Hsu et al 1998
ARV (PI) Lopinavir Ritonavir 146 031 Kaletrareg 2017
ARV (PI) Nelfinavir Ketoconazole 135 026 Viraceptreg 2013
ARV (PI) Ritonavir Ketoconazole 150 033 Morcos et al 2014
ARV (PI) Saquinavir Ketoconazole 190 047 Grub et al 2001
ARV (PI) Tipranavir Ritonavir 1200 092 MacGregor et al 2004
ARV (NS3PI) Simeprevir Ritonavir 718 086 Olysioreg 2017
ARV (NNRTI) Efavirenz Voriconazole 143 030 Liu et al 2008
ARV (NNRTI) Etravirine Atazanavir 150 033 Intelencereg 2014
ARV (NNRTI) Nevirapine Ritonavir 143 030 Sekar et al 2009
ARV (NNRTI) Rilpivirine Ketoconazole 149 033 Edurantreg 2015
ARV (NNRTI) Delaviridine Ketoconazole 150 033 Rescriptorreg 2012
ARV (II) Dolutegravir Atazanavir 191 048 Tivicayreg 2014
ARV (II) Elvitegravir Ketoconazole 148 035 Striblidreg 2016
ARV (II) Raltegravir Atazanavir 172 042 Iwamoto et al 2008
Anti-TB
Bedaquiline Ketoconazole 122 018 Sirturotrade 2012
Clarithromycin Ritonavir 177 046 Ouellet et al 1998
Delamanidb - - 090 -
Antidiabetic
8
Pioglitazone Ketoconazole 134 025 Actosreg 2011
Repaglinide Itraconzaole 140 029 PrandiMetreg 2012
Saxagliptin Ketoconazole 250 060 Onglyzareg 2009
Alogliptin Ketoconazole 120 017 Nesinareg 2013
Teneligliptin
Ketoconazole 149 033 Nakamaru et al 2014
Antihypertensive
Amlodipine Telaprevir 300 067 Lee et al 2011
Felodipine Itraconazole 600 083 Jalava et al1997
Lercanidipine Ketoconazole 1500 093 Zanidipreg 2010
Nifedipine Diltiazem 310 068 Adalatreg CC 2010
Nitrendipine Cimetidine 240 058 Soons et al 1991
Diltiazem Cimetidine 153 035 Tiazacreg 2011
Verapamil Grape fruit 143 030 Fuhr et al 2002
Losartan Erythromycin 130 023 Cozaarreg 2015
Eplerenone Ketoconazole 539 081 Cook et al 2004
Guanfacine Ketoconazole 300 067 Intunivreg 2013
Antihyperlipidemic
Simvastatin Itraconazole 131 092 Zocorreg 2012
Lovastatin Itraconazole 22 095 Mevacorreg 2012
Atorvastatin lopinavir ritonavir
59 083 Lipitorreg 2009
Pravastatin Darunavir ritonavir
181 045 Pravachol 2016
Antileprotics
Daspone Clarithromycin 101 001 Winter et al 2004 aAs described in Section 313 fm values are calculated for all the substrates based on their magnitude of change in plasma AUC (AUCi=AUC in presence of an inhibitorAUC in absence of an inhibitor) with a CYP3A45 inhibitor bAs no in vivo drug interaction studies were found reported for CYP3A45 inhibitors an fm value of 090 was assumed for delamanid ARV antiretroviral CYP cytochrome P450 AUC area under the plasma concentration-time curve fm fraction metabolized by an enzyme II integrase inhibitor NNRTI non-nucleoside reverse transcriptase inhibitor NS3 non-structural protein 3 PI protease inhibitor
9
Supplemental TABLE 3
Unbound fraction of clofazimine in microsomes (fumic)
[HLM] (mg proteinmLminus1)
Clofazimine (μM)
Mean ARa Avg fumic plusmn SDb Before UC (total)
After UC (free)
0025 10 197 157 000794 plusmn 00005 1 201 0244 00121 plusmn 000023 Averagec 00100 plusmn 00023 005 10 203 148 000729 plusmn 000021 1 206 0176 000856 plusmn 00005 Averagec 000792 plusmn 000077 05 10 212 0337 000159 plusmn 0000056 1 225 0037 000165 plusmn 000015 Averagec 000162 plusmn 000011 aAverage area ratio of triplicates bAverage fumic (unbound fraction) = ARfree ARtotal plusmn SD of triplicate samples for each clofazimine concentration examined cThe average plusmn SD of the two clofazimine concentrations at each HLM concentration examined AR area ratio fumic microsomal protein binding HLM human liver microsomes μM micromole mg milligram SD standard deviation UC ultracentrifugation
10
Supplemental TABLE 4
PBPK model input parameters for midazolam Parameter Value Physical chemistry and blood binding
Molecular weight (gmol) 3258 LogP 353 Compound type Ampholyte pKa1 1095 pKa2 62 BP 0603 fup 0032
Absorption Model used First-order absorption fa 1 Lag time (h) 0 ka (hminus1) 3 fugut 1 Qgut (lh) 1402 Peffman (10minus4 cms) 6045
Distribution Model used Minimal PBPK Vss (lkg) (CV) 1 (30) Liver tissueplasma partition coefficient 1
Elimination Model used Enzyme kinetics recombinant CYP CYP3A4 Vmax (minminus1) 523 (1-OH pathway) 52 (4-OH pathway) CYP3A4 Kmu (microM) 216 (1-OH pathway) 318 (4-OH pathway) CYP3A5 Vmax (minminus1) 197 (1-OH pathway) 403 (4-OH pathway) CYP3A5 Kmu (microM) 416 (1-OH pathway) 348 (4-OH pathway) Active uptake into hepatocytes 1 CLR (lh) 0085
microM micromole BP blood-to-plasma ratio CLR renal clearance CV coefficient of variation fa fraction of dose absorbed fugut unbound fraction of drug in enterocyte fumic fraction unbound in the microsomes fup fraction unbound in the plasma g gram h hour ka absorption rate constant Kmu unbound MichaelisndashMenten constant LogP log of the partition coefficient mol moles PBPK Peffman effective permeability in man pKa acid dissociation constant Qgut nominal flow in gut model Vmax maximum velocity Vss volume of distribution at steady state
11
Supplemental TABLE 5
PBPK model input parameters for saquinavir
Parameter Value Physical chemistry and blood binding
Molecular weight (gmol) 67086 logP 39 Compound type Ampholyte pKa1 1094 pKa2 667 BP 06 fup 0025
Absorption Model used First-order absorption fa 1 Lag time (h) 0 ka (hminus1) 255 fugut 0025 Qgut (lh) 49089 Peffman (10minus4 cms) 07668
Distribution Model used Minimal PBPK Vss (lkg) (CV) 363 (30) Liver tissueplasma partition coefficient 1
Elimination Model used Enzyme kinetics HLM CYP3A4 Vmax (pmolminmg protein) 2860 CYP3A4 Kmu (microM) 051 CLR (lh) 095
Interaction CYP3A4 Ki (microM) (fumic) 35 (058)
microM micromole BP blood-to-plasma ratio CLR renal clearance CV coefficient of variation fa fraction of dose absorbed fugut unbound fraction of drug in enterocyte fumic fraction unbound in the microsomes fup fraction unbound in the plasma g gram h hour HLM human liver microsomes ka absorption rate constant Kmu unbound MichaelisndashMenten constant LogP log of the partition coefficient mol moles PBPK Peffman effective permeability in man pKa acid dissociation constant Qgut nominal flow in gut model Vmax maximum velocity Vss volume of distribution at steady state
12
Supplemental TABLE 6
PBPK model input parameters for efavirenz Parameter Value Physical chemistry and blood binding
Molecular weight (gmol) 31568 logP 402 Compound type Monoprotic Acid pKa 102 BP 074 fup 0029
Absorption Model used First-order absorption fa (CV) 067 (15) Lag time (h) (CV) 036 (15) ka (hminus1) (CV) 041 (0) fugut 0005 Qgut (lh) 1378 Peffman (10minus4 cms) 5680
Distribution Model used Minimal PBPK kin (hminus1) 029 kout (hminus1) 009 Vsac (lkg) 11 Vss (lkg) (CV) 2256 Kp scalar 0155
Elimination Model used Enzyme kinetics recombinant CYP CYP1A2 CLint (microLminpmol CYP) 003 CYP2B6 CLint (microLminpmol CYP) 136 CYP2A6 CLint (microLminpmol CYP) 047 CYP3A4 CLint (microLminpmol CYP) 0012 Additional HLM CLint (microLminmg protein) 0694 Active uptake into hepatocytes 1 CLR (lh) 0
Interaction CYP2B6 Indmax (fold) 62 CYP2B6 IndC50 (microM) (fuinc) 12 (015) CYP3A4 Indmax (fold) 99 CYP3A4 IndC50 (microM) (fuinc) 38 (015)
microM micromole BP blood-to-plasma ratio CLint intrinsic clearance CLR renal clearance CV coefficient of variation CYP cytochrome P450 fa fraction of dose absorbed fugut unbound fraction of drug in enterocyte fumic fraction unbound in the microsomes fup fraction unbound in the plasma fuinc fraction unbound in intrinsic clearance g gram h hour IndC50 calibrated concentration of inducer at frac12 Indmax Indmax calibrated maximal fold change of induction over vehicle control ka absorption rate constant Kmu unbound MichaelisndashMenten constant Kp tissueplasma partition coefficient
13
LogP log of the partition coefficient mol moles PBPK physiologically based pharmacokinetic Peffman effective permeability in man pKa acid dissociation constant Qgut nominal flow in gut model Vsac single adjusted compartment volume Vss volume of distribution at steady state
14
Supplemental TABLE 7
PBPK model input parameters for repaglinide Parameter Value Physical chemistry and blood binding
Molecular weight (gmol) 4526 logP 398 Compound type Ampholyte pKa1 416 pKa2 601 BP 062 fup 0023
Absorption Model used First-order absorption fa 0981 Lag time (h) 0 ka (hminus1) 1598 fugut 1 Qgut (lh) 1219 Peffman (10minus4 cms) 3886
Distribution Model used Full PBPK Vss (lkg) (CV) 02375 Kp scalar 33
Elimination Model used Enzyme kinetics HLM CYP2C8 Vmax (pmolminmg protein) 3008 CYP2C8 Kmu (microM) 23 CYP3A4 Vmax (pmolminmg protein) 9582 CYP3A4 Kmu (microM) 132 CLR (lh) 0013
Transport Model Permeability limited liver model Sinusoidal uptake OATP1B1 CLintT (microLminmillion cells) (fuinc)
246 (1) microM micromole BP blood-to-plasma ratio CLR renal clearance CV coefficient of variation fa fraction of dose absorbed fugut unbound fraction of drug in enterocyte fuinc fraction unbound in intrinsic clearance fumic fraction unbound in the microsomes fuplasma fraction unbound in the plasma g gram h hour HLM human liver microsomes ka absorption rate constant Kmu unbound MichaelisndashMenten constant LogP log of the partition coefficient mol moles OATP1B1 Organic Anion Transporting Polypeptide 1B1 pmol picomole PBPK physiologically based pharmacokinetic Peffman effective permeability in man pKa acid dissociation constant Qgut nominal flow in gut model Vmax maximum velocity Vss volume of distribution at steady state
15
Supplemental TABLE 8
PBPK model input parameters for desipramine Parameter Value Physical chemistry and blood binding
Molecular weight (gmol) 2664 logP 457 Compound type Monoprotic base pKa 1026 BP 116 fup 024
Absorption Model used First-order absorption fa 1 Lag time (h) 0 ka (hminus1) 062 fugut 1 Qgut (lh) 1273 Peffman (10minus4 cms) 44
Distribution Model used Minimal PBPK Vss (lkg) (CV) 208 Liver tissueplasma partition coefficient 1
Elimination Model used Enzyme kinetics HLM CYP2D6 Vmax (pmolminmg protein) 935 CYP2D6 Kmu (microM) 084 Active uptake into hepatocytes 1 CLR (lh) 15
microM micromole BP blood-to-plasma ratio CLR renal clearance CV coefficient of variation fa fraction of dose absorbed fugut unbound fraction of drug in enterocyte fumic fraction unbound in the microsomes fup fraction unbound in the plasma g gram h hour HLM human liver microsomes ka absorption rate constant Kmu unbound MichaelisndashMenten constant LogP log of the partition coefficient mol moles pmol picomole PBPK physiologically based pharmacokinetic Peffman effective permeability in man pKa acid dissociation constant Qgut nominal flow in gut model Vmax maximum velocity Vss volume of distribution at steady state
16
Supplemental TABLE 9
Summary input and output parameters from the simulation of the trial design described in Table 2 (Model application) of the manuscript (Simulated clinical PK parameters for clofazimine at Day 126 following multiple oral doses of 100 mg QD)
Input ParametersOutput Parameters
Workspace LAM320_100mg43QDSubstrate HG-LAM320_patientSimulation Mode PKPD Parameters + PKPD Profiles
Substrate SubstrateCompound Name HG-LAM320_patient Absorption Model 1st orderMol Weight (gmol) 473000 Permeability Assay Enteredlog P 7660 Peffman RegionalCompound Type Monoprotic BasepKa 1 8510 Distribution Model Minimal PBPK ModelpKa 2 na Vss (Lkg) 47500BP 0550 Prediction Method EnteredHaematocrit 45000fu 0001 Clearance Type In Vivo Clearance
Trial DesignSubstrate
Population Name LAMSim-Healthy Volunteers FastedFed FastedUse Pop Representative No Route OralPopulation Size 100000 Dose Units Dose (mg)Number of Trials 10000 Dose 100000No of Subjects per Trial 10000 Start DayTime Day 1 0900Start DayTime Day 1 0900 Dosing Regimen Multiple Dose
End DayTime Day 127 0900 Dose Interval (h) 24000
Study Duration (h) 3024000 Number of Doses 126000
Sampling Time Pre-defined Uniform
Sampling Site Selection Off
PKPD Parameters Mean Median Geometric mean Can be found in Excel sheet
CL (Lh) 399 372 380 358 404 Clearance Trials SS
CLpo (Lh) 626 567 588 550 629 Clearance Trials SS
fa (Sub) 070 070 070 069 071 Clearance Trials SS
Fg (Sub) 100 100 100 100 100 Clearance Trials SS
Fh (Sub) 092 093 092 092 093 Clearance Trials SS
F (Sub) 065 065 065 063 066 Clearance Trials SS
Vss (Subs)(LKg) 4638 4539 4546 4371 4728 Distribution - Vols
PKPD Profiles Mean Median Geometric mean Can be found in Excel sheet
CMax (ngmL) 79653 70291 72802 67191 78881 AUC
TMax (h) 677 700 659 625 694 AUC
AUC (ngmLh) 1662709 1591914 1579708 1481991 1683869 AUC
CL (DoseAUC)(Lh) 668 628 633 594 675 AUC
Confidence Interval
Simcyp Population Based Simulator1062017 1128
Simcyp Version 15 (02122015)
Input Parameters
Output Parameters
Confidence Interval
17
Supplemental TABLE 10
Input sheet from the trial design described in Table 2 (Model application) of the manuscript (Simulated clinical PK parameters for clofazimine at Day 126 following multiple oral doses of 100 mg QD)
Substrate Trial Design Software Version Detail
Compound Name HG-LAM320_patient Use Pop Representative No Simulation Duration(seconds) 23000Version number Not applicable Population Size 100000 Windows Version Windows 7Compound Type Small Molecule Number of Trials 10000 Excel Version Excel 2010Route Oral No of Subjects per Trial 10000 Source File Location CProgram FilesSimcypSimcyp Simulator V15ScreensDose Units Dose (mg) Population name LAMSim-Healthy Volunteers Data Path Location CUsersPublicDocumentsDose 100000 Version number Not applicable Excel Embedded Workspace NoStart Day 1000 Minimum Age (years) 18000 SimcypexeStart Time 9h0m Maximum Age (years) 70000 File Version 150860Dosing Regimen Multiple Dose Propn of Females 0500 Date Modified 02122015Dose Interval (h) 24000 FastedFed Fasted File Size (bytes) 2584064Number of Doses 126000 Fluid intake with dose (mL) 250000 SimcypExcelPluginV15dll
Fluid intake with dose CV () 30000 File Version 150860PhysChem and Blood Binding PKPD Parameters On Date Modified 02122015
PKPD Profiles On File Size (bytes) 3110400Mol Weight (gmol) 473000 Start DayTime Day 1 0900 SimcypUICommondlllog P 7660 End DayTime Day 127 0900 File Version 15000Compound Type Monoprotic Base Study Duration (h) 3024000 Date Modified 02122015pKa 1 8510 File Size (bytes) 4302848BP input type User Sub Route Oral SimcypViewModelAnimaldllBP 0550 File Version 15000Haematocrit 45000 Random Generator Mersenne Twister (MT19937) Date Modified 02122015fu Input User Seed Fixed File Size (bytes) 64000fu 0001 Seed Value 1000 SimcypViewModelCommondllReference Binding Component HSA File Version 150860Protein Reference Conc (gL) 45000 Solver sampling interval (h) 0050 Date Modified 02122015 Bound to Lipoprotein 0000 Sampling Time Pre-defined Uniform File Size (bytes) 253440 Bound to Lipoprotein (CV ) 0000 Number of time samples 1200000 SimcypLicenceManagerdll
File Version 1002Absorption Sampling Site Selection Off Date Modified 02122015
File Size (bytes) 86016Absorption Model 1st order AUCt for the first dose Off simcypViewModeldllInput type User AUC_INF for the first dose On File Version 150860fa 0700 AUCt for the last dose Off Date Modified 02122015CV fa () 10000 AUC Calculation Method Linear Trapezoid File Size (bytes) 488448ka (1h) 0250 simcyplicencingdllCV ka () 30000 Memory Size 15387836000 File Version 150860lag time (h) 0550 Solubility Cap (mgmL) 500000 Date Modified 02122015CV lag time () 30000 Differential Solver 5th-order Runge-Kutta File Size (bytes) 56832fu(Gut) input type User Maximum number of steps 1000000000 simcypmodelXmlSerializersdllfu(Gut) 0001 Relative Tolerance 0000 File Version 0000Q(Gut) Input Predicted Relative Tolerance when ADAM is used 0000 Date Modified 02122015Peffman Type na Integration error tolerance 0001 File Size (bytes) 2979840
Use UBL fluid volumes Off simcypmodeldllDistribution File Version 150860
Paediatric Module Not Loaded Date Modified 02122015Distribution Model Minimal PBPK Model No Differential Equations 15000 File Size (bytes) 3415040SAC kin (1h) 0031SAC kout (1h) 0016SAC CLin (Lh) 39690SAC CLout (Lh) 26749SAC Q (Lh) 42600Volume [Vsac] (Lkg) 327E+01Vss input type UserVss (Lkg) 47500CV Vss () 20000Liver input type UserLiver Kp 1000
Elimination
Allometric Scaling Not Used
Clearance Type In Vivo ClearanceCL (iv) (Lh) 4180CL (iv) CV 30000Active Uptake into Hepatocyte 1000CL R (Lh) 0000
CYPs andor UGTs Interaction
Enzyme CYP2C8Ki (microM) 0004fu mic 1000
Enzyme CYP2D6Ki (microM) 0002fu mic 1000
Enzyme CYP3A4Ki (microM) 786E-04fu mic 1000
Simcyp Population Based Simulator1062017 1128
Simcyp Version 15 (02122015)
18
Supplemental TABLE 11
PK statistical output from Simcyp from the simulation of the clinical PK parameters for clofazimine at Day 126 following multiple oral doses of 100 mg QD (refers to Table 7 of the manuscript)
StatisticsAUC (ngmLh) TMax (h) CMax (ngmL) Dose (mg) CL (DoseAUC) (Lh)
Mean 1662709 677 79653 10000 668Median 1591914 700 70291 10000 628
Geometric Mean 1579708 659 72802 10000 63395 Confidence interval around the geometric mean (lower limit) 1481991 625 67191 10000 59495 Confidence interval around the geometric mean (upper limit) 1683869 694 78881 10000 675
5th centile 932352 485 41081 10000 39995th centile 2505686 835 155203 10000 1073Skewness 083 -173 249 na 153
cv 032 019 049 000 035Min Val 586757 200 25483 10000 271Max Val 3690211 965 296581 10000 1704
Fold 629 482 1164 100 629Std Dev 536700 131 39223 000 235
19
Supplemental FIGURE 1
Sensitivity analysis of clofazamine fa (A) ka (B) and fugut (C) value on the AUC ratio of midazolam Dosing regimen Midazolam 5 mg on Day 126 + clofazimine 100 mg QD on Day 1-Day
126 A
B C
0000
0500
1000
1500
2000
2500
3000
3500
4000
000 020 040 060 080 100 120
AUC
Ratio
(MDZ
)
AUC Ratio (MDZ)
fa (clofazamine)
0000
0500
1000
1500
2000
2500
3000
3500
000 005 010 015 020 025 030
AUC
Ratio
(MDZ
)
AUC Ratio (MDZ)
ka (clofazamine)
0000
0500
1000
1500
2000
2500
3000
3500
4000
4500
000 020 040 060 080 100 120
AUC
Ratio
(MDZ
)
AUC Ratio (MDZ)
Fugut Value (clofazamine)
20
References
Actosreg (pioglitazone hydrochloride) (2011) Highlights of Prescribing Information accessed on
June 17 2017
Adalatreg CC (Nifedipine) (2010) Highlights of Prescribing Information accessed June 17 2017
Cook CS Berry LM Burton E (2004) Prediction of in vivo drug interactions with eplerenone in
man from in vitro metabolic inhibition data Xenobiotica 34215ndash228
Cozaarreg (losartan) (2015) Prescribing Information accessed on accessed June 17 2017
EDURANTreg (rilpivirine) (2015) Full Prescribing Information accessed on June 17 2017
Fuhr U Muumlller-Peltzer H Kern R Lopez-Rojas P Juumlnemann M Harder S Staib AH (2002)
Effects of grapefruit juice and smoking on verapamil concentrations in steady state Eur J Clin
Pharmacol 58(1)45-53
Grub S Bryson H Goggin T Luumldin E Jorga K (2001) The interaction of saquinavir (soft gelatin
capsule) with ketoconazole erythromycin and rifampicin comparison of the effect in healthy
volunteers and in HIV-infected patients Eur J Clin Pharmacol 57 115-121
Hsu A Granneman GR Cao G Carothers L Japour A El-Shourbagy T Dennis S Berg J
Erdman K Leonard JM Sun E (1998) Pharmacokinetic interaction between ritonavir and
indinavir in healthy volunteers Antimicrob Agents Chemother 422784-2791
INTELENCEreg (etravirine) (2014) Highlights of Prescribing Information accessed on June 17
2017
INTUNIVreg (guanfacine) (2013) Highlights of Prescribing Information accessed on June 17
2017
Iwamoto M Wenning LA Mistry GC Petry AS Liou SY Ghosh K Breidinger S Azrolan N
Gutierrez MJ Bridson WE Stone JA Gottesdiener KM Wagner JA (2008) Atazanavir
21
modestly increases plasma levels of raltegravir in healthy subjects Clin Infect Dis 47137-
140
Jalava KM Olkkola KT Neuvonen PJ (1997) Itraconazole greatly increases plasma
concentrations and effects of felodipine Clin Pharmacol Ther 61(4)410-415
KALETRAreg (lopinavir and ritonavir) (2017) Highlights of Prescribing Information accessed on
June 17 2017
Lee JE van Heeswijk R Alves K Smith F Garg V (2011) Effect of the hepatitis C virus
protease inhibitor telaprevir on the pharmacokinetics of amlodipine and atorvastatin
Antimicrob Agents Chemother 55(10)4569-4574
LIPITORreg (atorvastatin calcium) (2009) Highlights of Prescribing Information accessed on
June 17 2017
Liu P Foster G LaBadie RR Gutierrez MJ Sharma A (2008) Pharmacokinetic interaction
between voriconazole and efavirenz at steady state in healthy male subjects J Clin Pharmacol
4873-84
MacGregor TR1 Sabo JP Norris SH Johnson P Galitz L McCallister S (2004)
Pharmacokinetic characterization of different dose combinations of coadministered tipranavir
and ritonavir in healthy volunteers HIV Clin Trials 5371-382
MEVACORreg (lovastatin) (2012) Prescribing Information accessed on June 17 2017
Morcos PN Chang L Navarro M Chung D Smith PF Brennan BJ Tran JQ (2014) Two-way
interaction study between ritonavir boosted danoprevir a potent HCV protease inhibitor and
ketoconazole in healthy subjects Int J Clin Pharmacol Ther 52 103-111
Nakamaru Y Hayashi Y Sekine M Kinoshita S Thompson J Kawaguchi A Davies M Juumlrgen
Heuer H Yamazaki H Akimoto K (2014) Effect of ketoconazole on the pharmacokinetics of
22
the dipeptidyl peptidase-4 inhibitor teneligliptin an open-label study in healthy white subjects
in Germany Clin Ther 36(5)760-769
NESINAreg (alogliptin) (2013) Highlights of Prescribing Information accessed on June 17 2017
OLYSIOreg (simeprevir) (2017) Highlights of Prescribing Information accessed on June 17
2017
ONGLYZAreg (saxagliptin) (2009) Highlights of Prescribing Information accessed on June 17
2017
Ouellet D Hsu A Granneman GR Carlson G Cavanaugh J Guenther H Leonard JM (1998)
Pharmacokinetic interaction between ritonavir and clarithromycin Clin Pharmacol Ther
64355-362
Polk RE Crouch MA Israel DS Pastor A Sadler BM Chittick GE Symonds WT Gouldin W
Lou Y (1999) Pharmacokinetic interaction between ketoconazole and amprenavir after single
doses in healthy men Pharmacotherapy 191378-1384
PRANDIMETreg (repaglinide and metgormin hydrochloride) (2012) Highlights of Prescribing
Information accessed on June 17 2017
PRAVACHOLreg (pravastatin sodium) (2016) Highlights of Prescibing Information accessed on
November 24 2016
RESCRIPTORreg (delaviridine mesylate) (2012) Prescribing Information accessed on June 2017
REYATAZreg (atazanavir) (2017) Highlights of Prescribing Information accessed on June 2017
Sekar V Lefebvre E Marieumln K De Pauw M Vangeneugden T Pozniak A Hoetelmans RM
(2009) Pharmacokinetic interaction between nevirapine and darunavir with low-dose ritonavir
in HIV-1-infected patients Br J Clin Pharmacol 68116-119
23
Sekar VJ Lefebvre E De Pauw M Vangeneugden T Hoetelmans RM (2008) Pharmacokinetics
of darunavirritonavir and ketoconazole following co-administration in HIVndashhealthy
volunteers Br J Clin Pharmacol 66215-221
SIRTUROtrade (bedaquiline) (2012) Highlights of Prescribing Information accessed on June 17
2017
Soons PA Vogels BA Roosemalen MC Schoemaker HC Uchida E Edgar B Lundahl J Cohen
AF Breimer DD (1991) Grapefruit juice and cimetidine inhibit stereoselective metabolism of
nitrendipine in humans Clin Pharmacol Ther 50(4)394-403
STRIBILDreg (elvitegravir cobicistat emtricitabine tenofovir disoproxil fumarate) (2016)
Highlights of Prescribing Information accessed on June 17 2017
TIAZACreg (diltiazem hydrochloride) (2011) Prescribing Information accessed on accessed on
June 17 2017
TIVICAYreg (dolutegravir) (2014) Highlights of Prescribing Information accessed on June 17
2017
VIRACEPTreg (nelfinavir mesylate) (2013) Highlights of Prescribing Information accessed on
June 17 2017
Winter HR Trapnell CB Slattery JT Jacobson M Greenspan DL Hooton TM Unadkat JD
(2004) The effect of clarithromycin fluconazole and rifabutin on dapsone hydroxylamine
formation in individuals with human immunodeficiency virus infection (AACTG 283) Clin
Pharmacol Ther 76(6)579-857
ZANIDIPreg (lercanidipine hydrochloride) (2010) Summary of Product Characteristics accessed
on June 17 2017
ZOCORreg (simvastatin) (2010) Highlights of Prescribing Information accessed on June 17 2017
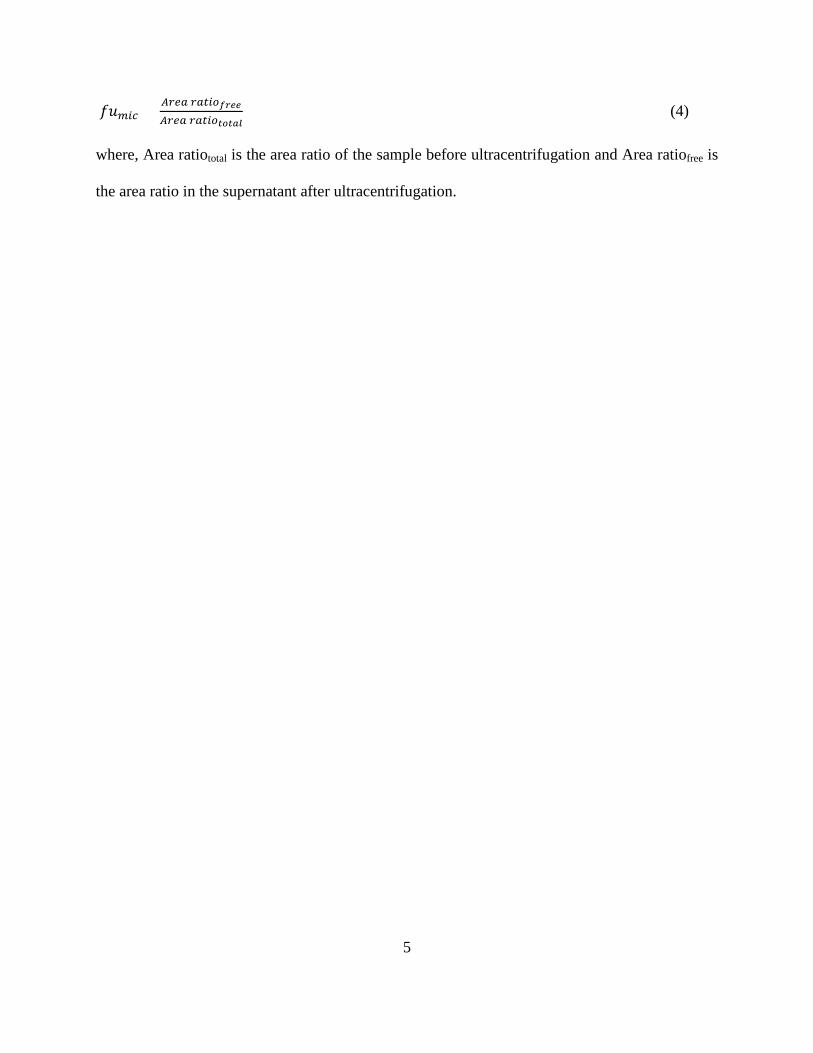
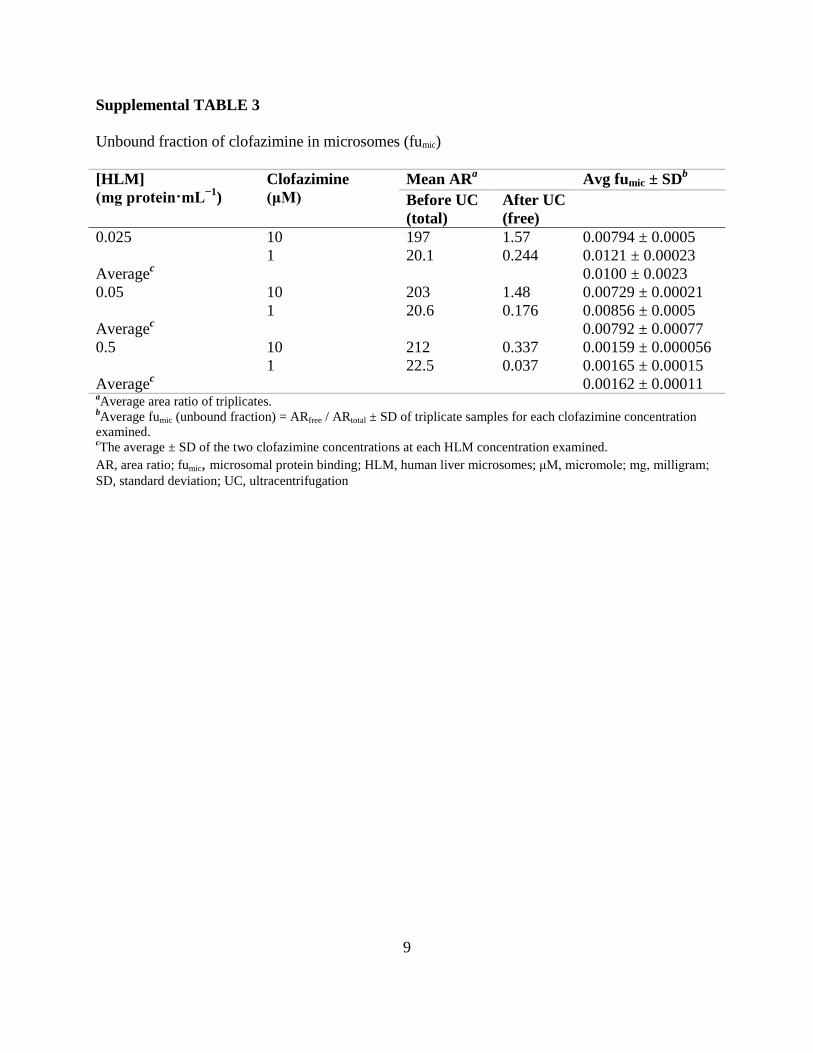
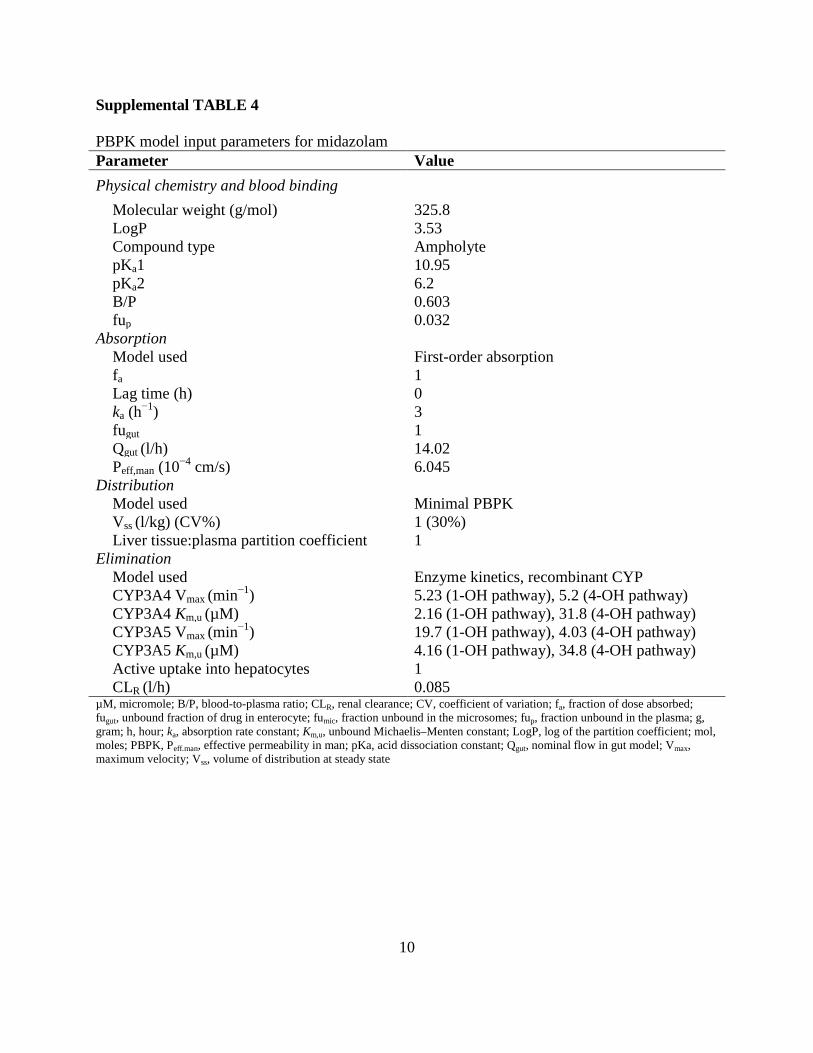
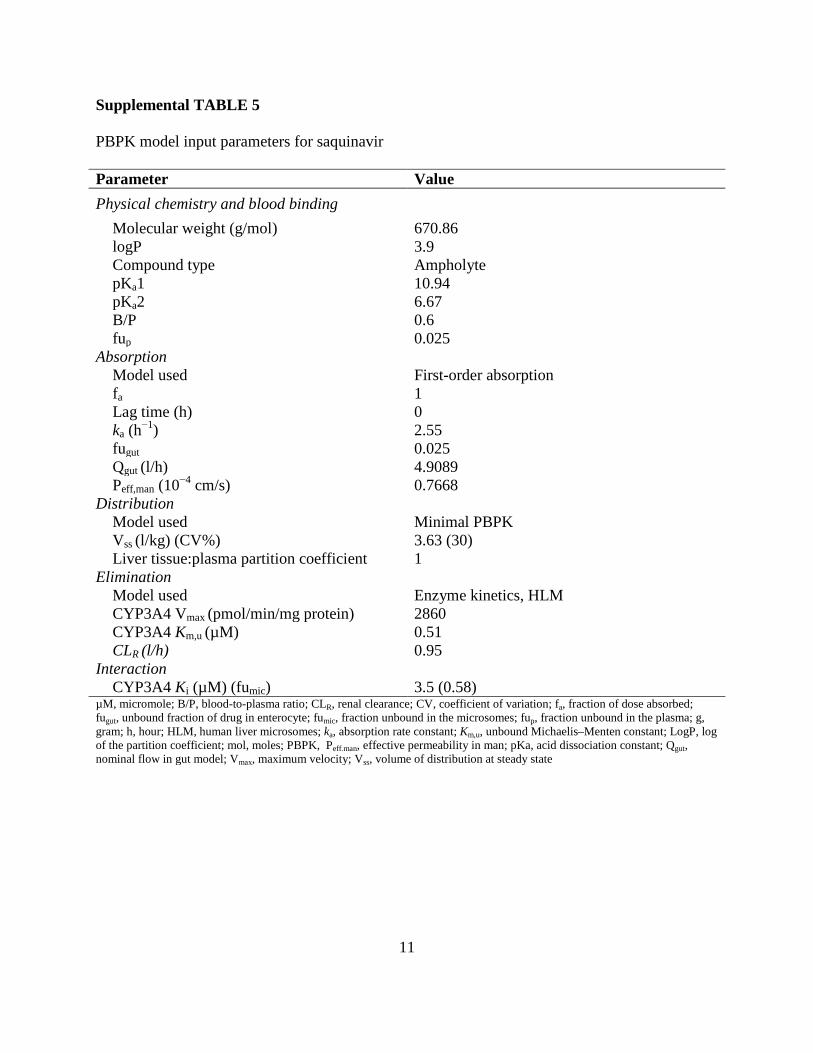


![New Towards a foundational representation of potential drug- drug …ceur-ws.org/Vol-1309/paper2.pdf · 2014. 12. 8. · interactions: the Drug Interaction Ontology (DIO)[24] and](https://img.pdfslide.us/doc/110x75/604429923b5a3f0cd64102f4/new-towards-a-foundational-representation-of-potential-drug-drug-ceur-wsorgvol-1309.jpg)