Embed Size (px)
Citation preview
�
�
EVALUATION OF CARNAUBA WAX
A THESIS SUBMITTED TO THE DEPARTMENT OF
BIOLOGICAL
�
�
OKAFO SINODUKOO EZIUZO
EVALUATION OF CARNAUBA WAX IN SUSTAINED
DICLOFENAC SODIUM TABLET FORMULATION
����������������������������������������
A THESIS SUBMITTED TO THE DEPARTMENT OF BIOCHEMISTRY
BIOLOGICAL SCIENCES, UNIVERSITY OF NIGERIA, NSUKKA�
� ��� �����
�
� �������������� ��� � � ����������� ��
�� ����� ���� � � ���������� ����� ��� ������������� ��������������
�� �����������������
����
��
�
SUSTAINED RELEASE
TABLET FORMULATION.
BIOCHEMISTRY, FACULTY OF
�� ����� ���� � � ���������� ����� ��� ������������� ���������������

���
�
�
�
TITLE PAGE
EVALUATION OF CARNAUBA WAX IN SUSTAINED RELEASE DICLOFENAC SODIUM TABLET
FORMULATION.

����
�
�
DEDICATION
This work is dedicated to my lovely wife, Chinenye, my children
Dilichukwu, Chimelumunma, Eziuzo and Daluchukwu.
���
�
�
DECLARATION
We certify that OKAFO SINODUKOO EZIUZO; a postgraduate student in the department of
Pharmaceutical Technology and Industrial Pharmacy, University of Nigeria, Nsukka, has
completed the requirements for the award of the Degree of Master of Pharmacy in
Pharmaceutical Technology and Industrial Pharmacy.
The research work reported in this dissertation is original and has not been submitted
in support of an application for another degree or qualification of this or any other
University.
…………………………………………… ………………………………………
Dr Jacob O. Onyechi Prof G. C. Onunkwo
(Supervisor) (Head of Department)
………………………………………………………………

��
�
�
(External Examiner)
ACKNOWLEDGEMENT
I thank the Almighty God for the gift of life and the enablement to finish this project.
I wish to express my profound gratitude to my supervisor, Dr Jacob O. Onyechi, for his
assistance and guidance throughout the duration of the program.
I also wish to acknowledge the efforts of the Laboratory and Office staff of the Department of
Pharmaceutical Technology and Industrial Pharmacy especially Emeka Okeh.
Pharm Abali Okolie’s, assistance during the analysis of data was highly appreciated.
The efforts of the management and staff of Pauco Pharmaceutical Industries Nigeria Limited
Awka, Anambra state cannot go unnoticed especially the Managing Director/Chairman, Chief
Paul Okafor, the Superintendent Pharmacist, Pharm Emeka Okpana and the Quality Control
Officer, Mrs Chinwe Chukwurah for allowing me to use their equipment such as DBK
Dissolution Test Apparatus and DBK Ultra Violet Spectrophotometer.
Last but not the least, Mrs. Chinenye, Dilichukwu, Chimelumunma, Eziuzo and Daluchukwu
Okafo, are appreciated for their encouragement and peace of mind at home.
���
�
�
TABLE OF CONTENTS
TITLE PAGE………………………………………………………………………………….i
DEDICATION…………………………………………………………………………………..ii
DECLARATION………………………………………………………………………………..iii
ACKNOWLEDGEMENT……………………………………………………………………….iv
TABLE OF CONTENTS ………………………………………………………..........................v
LIST OF FIGURES ……..……………………………………………………………………….x
LIST OF TABLES……………………………………………………………………………….xi
ABSTRACT…………………………………………………………………………………….xiii
CHAPTER ONE
1.0: INTRODUCTION
1.1: Sustained release tablets……………………………………………………………………1
1.1.1: Formulation of sustained – release tablets………………………………………………1
1.1.2: Methods of achieving sustained – release………………………………………………..2
1.1.2.1: Diffusion – controlled release…………………………………………………………….3
����
�
�
1.1.2.2: Dissolution – controlled release……………………………………………..……………4
1.1.3: Benefits of sustained – release tablets…………………………………….......……………4
1.1.4: Disadvantages of sustained – release tablets………………………………………………5
1.1.5: Mechanism of drug release from wax matrices……………………………………………5
1.2: Carnauba wax………………………………………………………………………………6
1.2.1: Composition………………………….……………………………………………………6
1.2.2: Physicochemical properties………..……………………………………………………...6
1.2.3: Uses……………………………………………………………………………..…………7
1.3: Arthritis………………………………………………………………………………………7
1.3.1: Signs and Symptoms……………………………………………………………………….8
1.3.2: Treatment………………………………………………………………………………….9
1.3.2.1: Non Steroidal Anti Inflammatory Drugs (NSAIDs)…………………………….............9
1.4: Diclofenac Sodium…………………………………………………………………………10
1.4.1: Therapeutic Indication, Dose and Therapeutic Index……………………………………11
1.4.2: Pharmacokinetic Properties of Diclofenac Sodium………………………………………11
1.4.2.1: Absorption …………………………………………………..………………………....11
1.4.2.2: Distribution……………………………………………………………………………..12
�����
�
�
1.4.2.3: Metabolism……………………………………………………………………………..12
1.4.2.4: Excretion………………………………………………………………………………..13
1.5: Melt Granulation……………………………………………………………………………13
1.5.1: Uses………………………………………………………..………………………….…14
1.5.2: Advantages of Melt Granulation…………………………………………………………14
1.5.3: Disadvantages of Melt Granulation………………………………………….……………14
1.5.4: Dissolution Test…………………………………………………………………………..15
CHAPTER TWO
2.0: MATERIALS AND METHODS
2.1: Materials…………………………………………………………………………………….17
2.2: Methods…………………………………………………………………………………….17
2.2.1: Preformulation Studies……………………………………………………………………17
2.2.2: Preparation of Diclofenac Sodium granules….......................……………………………17
2.2.3: Compression of Diclofenac Sodium granules....................................………………...20
2.2.4: Dissolution test studies ...........................................................…….……………………20
2.2.5: Friability Test.…………………………………………………………………………21
� �
�
�
2.2.6: Uniformity of Weight test...………………………………………………………..21
2.2.7: Determination of Crushing Strength of Batches DS1 – DS6 of Diclofenac Sodium
tablets...........................................................................................................................................21
2.2.8: Melting point determination.……………………………………………………………..22
2.2.9: Preparation of Buffer Solutions…………………………………………………………22
2.2.9.1: Preparation of Buffer Solution of pH 1.2………………………………………………22
2.2.9.2: Preparation of Phosphate Buffer Solution of pH 6.8…………………………………..23
2.2.10: Analysis of Data…....……………………………………………………………..........23
2.2.11: Assay of active ingredients .............................................................................................25
2.2.12: Measurement of tablet thickness and diameter..................................................................25
CHAPTER THREE
3.0: RESULTS AND DISCUSSION
3.1: Some physical properties of batches of diclofenac sodium tablet .........................………...26
3.2: In – vitro preformulation studies…................................……………………………………28
3.3: Release characteristics..........................…………………………………………………….28
3.3.1: Kinetics of drug release...............………………………………………………………..38
3.3.2: Mechanisms of drug release..........................................................……………………….46
�
�
�
CHAPTER FOUR
4.0: Summary, Conclusion and Recommendations
4.1: Summary and Conclusion…………………………………………………………………57
4.2: Recommendations………………………………………………………………………...58
4.3: References………………………………………………………………………………….59
APPENDICES…………………………………………………………………………….…...64

��
�
�
LIST OF FIGURES
Fig. 1: Sequential release of diclofenac sodium from batches DS1, DS2, DS2’, DS3, DS4, DS5,
DS6 and DSC ……………………………...…………………………………………………….29
Fig. 2: Sequential release of diclofenac sodium from batch DS 1 tablets in aqueous media
of pH 1.2 and phosphate buffer, pH 6.8…………………………………………….......30
Fig. 3: Sequential release of diclofenac sodium from batch DS 2 tablets……………………...31
Fig. 4: Sequential release of diclofenac sodium from batch DS 2’ tablets…………………….32
Fig. 5: Sequential plot of the release of diclofenac sodium from batch DS 3 tablets………….33
Fig. 6: Sequential release of diclofenac sodium from batch DS 4 tablets……………………...34
Fig. 7: Sequential release of diclofenac sodium from batch DS 5 tablets……………………...35
Fig. 8: Sequential release of diclofenac sodium from batch DS 6 tablets……………………36
Fig. 9: Sequential plot of the release of diclofenac sodium from batch DS C tablets…………37
Fig. 10: Higuchi plot of the release of diclofenac sodium from batch DS 1 tablets………….....38
Fig. 11: First order plot of the release of diclofenac sodium from batch DS 2 tablets…………39
Fig. 12: First order plot of the release of diclofenac sodium from batch DS 2’ tablets…………40
Fig. 13: First order plot of the release of diclofenac sodium from batch DS 3 tablets………….41
Fig. 14: First order plot of diclofenac sodium from batch DS 4 tablets………………………42
���
�
�
Fig. 15: First order plot of the release of diclofenac sodium from batch DS 5 tablets…………43
Fig. 16: First order plot of the release of diclofenac sodium from batch DS 6 tablets…………44
Fig. 17: First order plot of the release of diclofenac sodium from batch DS C tablets…………45
Fig. 18: Korsmeyer – Peppas plot f the release of diclofenac sodium from batch DS 1 tablets...47
Fig. 19: Korsmeyer – Peppas plot of the release of diclofenac sodium from batch DS 2 tablets.48
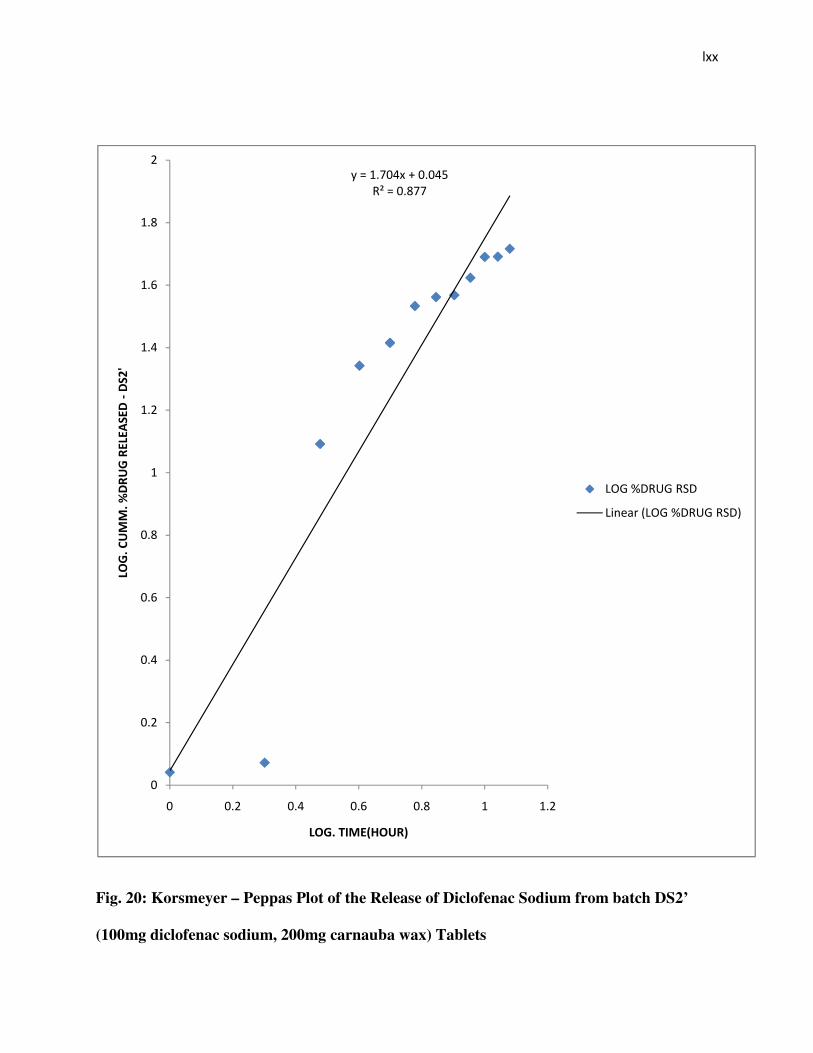
Fig. 20: Korsmeyer – Peppas plot of the release of diclofenac sodium from batch DS 2’
tablets…………………………………………………………………………………………….49
Fig. 21: Korsmeyer – release plot for the release of diclofenac sodium from batch DS 3
tablets…........................................................................................................................................50
Fig. 22: Korsmeyer – Peppas plot of the release of diclofenac sodium from batch DS 4
tablets…………………………………………………………………………………………..51
Fig. 23: Korsmeyer – Peppas plot of the release of diclofenac sodium from batch DS 5
tablets………………………………………………..………………………….52
Fig. 24: Korsmeyer – Peppas plot of the release of diclofenac sodium from batch DS 6...53
Fig. 25: Korsmeyer – release plot for the release of diclofenac sodium from batch DS C
tablets....................................................................................................................................54
����
�
�
LIST OF TABLES
Table 1: Formula for preparing 81.2g of Diclofenac sodium granules…....................................19
Table 2: Uniformity of tablet weight………………………………............................................21
Table 3: Diffusion exponent and solute release mechanism for cylindrical shape......................25 Table 4: Some physical properties of batches of diclofenac sodium tablets..............................26
Table 5: Summary of pharmacokinetic parameters for the release of Diclofenac sodium from
batches of Diclofenac sodium tablets…............................................................………..55
���
�
�
ABSTRACT
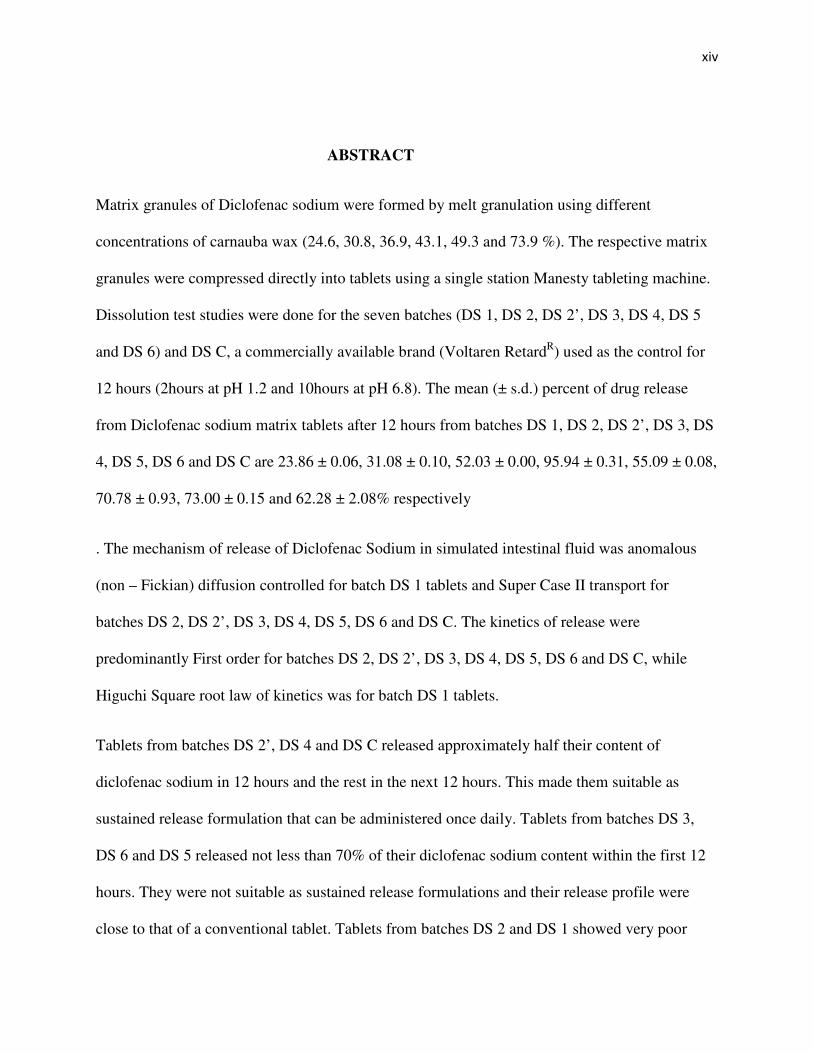
Matrix granules of Diclofenac sodium were formed by melt granulation using different
concentrations of carnauba wax (24.6, 30.8, 36.9, 43.1, 49.3 and 73.9 %). The respective matrix
granules were compressed directly into tablets using a single station Manesty tableting machine.
Dissolution test studies were done for the seven batches (DS 1, DS 2, DS 2’, DS 3, DS 4, DS 5
and DS 6) and DS C, a commercially available brand (Voltaren RetardR) used as the control for
12 hours (2hours at pH 1.2 and 10hours at pH 6.8). The mean (± s.d.) percent of drug release
from Diclofenac sodium matrix tablets after 12 hours from batches DS 1, DS 2, DS 2’, DS 3, DS
4, DS 5, DS 6 and DS C are 23.86 ± 0.06, 31.08 ± 0.10, 52.03 ± 0.00, 95.94 ± 0.31, 55.09 ± 0.08,
70.78 ± 0.93, 73.00 ± 0.15 and 62.28 ± 2.08% respectively
. The mechanism of release of Diclofenac Sodium in simulated intestinal fluid was anomalous
(non – Fickian) diffusion controlled for batch DS 1 tablets and Super Case II transport for
batches DS 2, DS 2’, DS 3, DS 4, DS 5, DS 6 and DS C. The kinetics of release were
predominantly First order for batches DS 2, DS 2’, DS 3, DS 4, DS 5, DS 6 and DS C, while
Higuchi Square root law of kinetics was for batch DS 1 tablets.
Tablets from batches DS 2’, DS 4 and DS C released approximately half their content of
diclofenac sodium in 12 hours and the rest in the next 12 hours. This made them suitable as
sustained release formulation that can be administered once daily. Tablets from batches DS 3,
DS 6 and DS 5 released not less than 70% of their diclofenac sodium content within the first 12
hours. They were not suitable as sustained release formulations and their release profile were
close to that of a conventional tablet. Tablets from batches DS 2 and DS 1 showed very poor

��
�
�
release profile (less than 32%) in the first 12 hours. They may require the addition of more
channeling agents to enhance their release profile.
���
�
�
CHAPTER ONE
1.0: INTRODUCTION
1.1: Sustained – Release Tablets
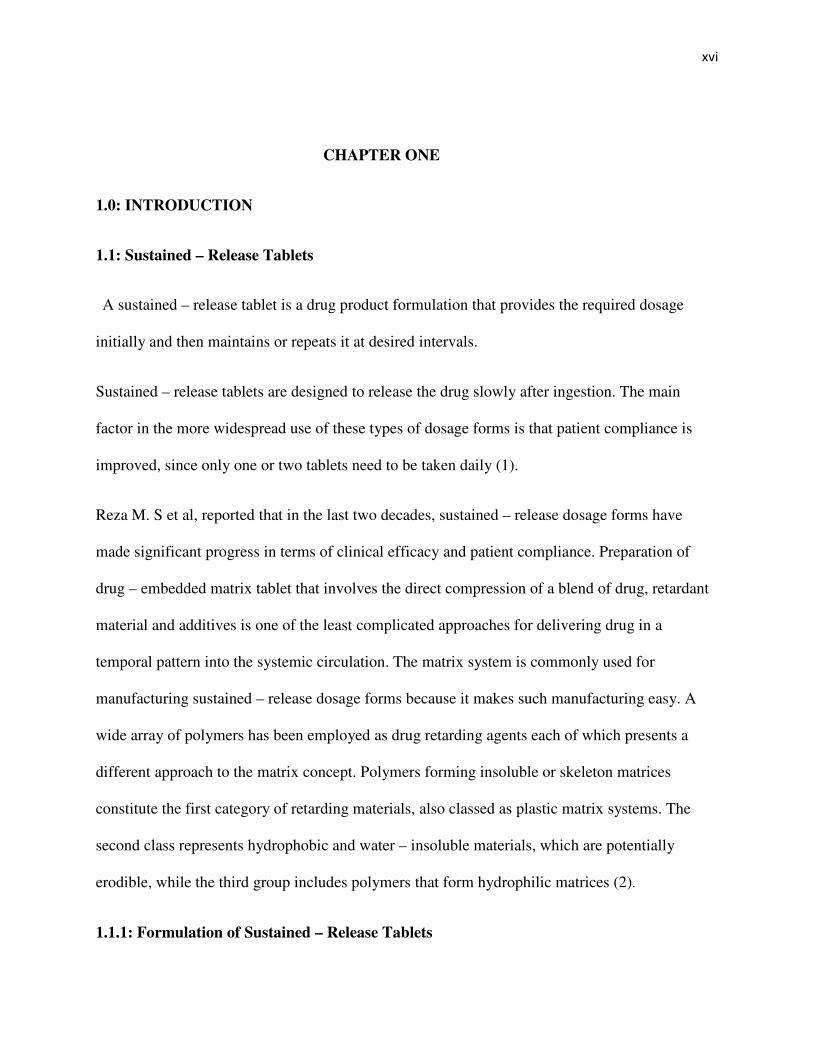
A sustained – release tablet is a drug product formulation that provides the required dosage
initially and then maintains or repeats it at desired intervals.
Sustained – release tablets are designed to release the drug slowly after ingestion. The main
factor in the more widespread use of these types of dosage forms is that patient compliance is
improved, since only one or two tablets need to be taken daily (1).
Reza M. S et al, reported that in the last two decades, sustained – release dosage forms have
made significant progress in terms of clinical efficacy and patient compliance. Preparation of
drug – embedded matrix tablet that involves the direct compression of a blend of drug, retardant
material and additives is one of the least complicated approaches for delivering drug in a
temporal pattern into the systemic circulation. The matrix system is commonly used for
manufacturing sustained – release dosage forms because it makes such manufacturing easy. A
wide array of polymers has been employed as drug retarding agents each of which presents a
different approach to the matrix concept. Polymers forming insoluble or skeleton matrices
constitute the first category of retarding materials, also classed as plastic matrix systems. The
second class represents hydrophobic and water – insoluble materials, which are potentially
erodible, while the third group includes polymers that form hydrophilic matrices (2).
1.1.1: Formulation of Sustained – Release Tablets
����
�
�
Sustained – release tablets can consist of two parts: an immediately available dose and a
sustaining part, containing many times the therapeutic dose for protracted blood drug levels. The
immediately available dose is normally directly added to the sustaining part of the tablet or
alternatively is incorporated in the tablet coating with the sustaining portion in the core of the
tablet (1).
Uncoated sustained – released tablets are prepared by embedding the drug in the tablet matrix.
The matrix system can be of three types -
i. Plastic matrix system
ii. Hydrophobic matrix system
iii. Hydrophilic matrix system
Plastic matrix systems have been widely used for sustaining the release of drug due to their
chemical inertness and drug embedding ability. Liquid penetration into the matrix is the rate –
limiting step in such systems unless channeling agents are used.
The hydrophobic matrix systems are potentially erodible and control the release of drug through
pore diffusion and erosion (3).
The hydrophilic matrix system, when exposed to an aqueous medium does not disintegrate but
immediately after hydration develops a highly viscous gelatinous surface barrier which controls
the drug release from, and liquid penetration into the centre of the matrix system (4).
1.1.2: Methods of Achieving Sustained – Release
Sustained – release can be achieved through various methods such as:
i. Diffusion – controlled release
�����
�
�
ii. Dissolution – controlled release
iii. Release controlled by ion exchange
iv. Release controlled by osmotic pressure.
.1.2.1: Diffusion – Controlled Release
Diffusion involves the movement of drug molecules from region of high concentration in the
tablet to one of a lower concentration in the gastrointestinal fluids. The rate at which
diffusion occurs will depend upon the surface, the diffusional pathway, the drug
concentration gradient and the diffusion coefficient of the system. In any one dosage form
these factors will be kept constant so that a predetermined diffusion rate of drug out of the
tablet will be achieved. In practice, diffusion – controlled release can be produced by
formulating the drug in an insoluble matrix. The gastrointestinal fluids penetrate the matrix
and drug diffuses out of the matrix and is absorbed. Alternatively the drug particles can be
coated with a polymer coat of defined thickness. In this case the portion of the drug which
has dissolved in the polymer coat diffuses through an unstirred film of fluid into the
surrounding liquid. In both cases a constant concentration of drug and a constant area of
diffusion, together with a constant diffusional pathway are essential to achieve a constant
drug release (1).
With matrix tablets the initial dose is normally placed in the coat of the tablet. The coat and
the matrix can be tableted together by compression coating or the coat can be applied using a
coating pan or air suspension technique. In non – coated systems the initial dose is normally
tableted with the matrix granulation. Matrix can be composed of polymeric materials such as
� �
�
�
methycellulose or insoluble plastic inert substances such as methylmethacrylate (1). Higuchi
found that for matrix tablets a plot of the square root of time against amount of drug released
produced a straight line and this square root plot is often used to record the dissolution rate of
matrix tablets (5).
1.1.2.2: Dissolution – Controlled Release
Dissolution can be employed as the rate – limiting step in sustained – release tablets. Drugs
with poor dissolution rates are inherently prolonged but with water – soluble drugs it is
possible to incorporate a water – insoluble carrier into the tablet formulation to reduce
dissolution. Prolonged drug action can also be achieved by leaving out the disintegrating
agent in the tablet formulation. Encapsulation drug products also utilize dissolution to control
release. With these products, individual drug particles or granules are coated with a slowly
soluble coating material such as polyethylene glycol of varying thickness. The time required
for dissolution of the coat is proportional to the coating thickness. The coated particles can be
compressed directly into tablets. A pulsed dosing effect is obtained by tableting a small
number of different thickness coated particles or more usually by utilizing a spectrum of
different thickness coatings (1).
1.1.3: Benefits of Sustained – Release Tablets:
i. Sustained release can mean less frequent dosing for short half – life drugs and
thus better compliance.
ii. More consistent result due to reduction in variations in plasma/blood levels
iii. No need to wake patient until morning, as the drug’s activity can be extended
to take effect throughout the night.

�
�
�
iv. The severity and frequency of untoward side effects are reduced with sustained
– release medications. Aspirin for example, has been shown to produce less
gastric bleeding when formulated as a sustained – release formulation than
conventional aspirin preparations (1).
1.1.4: Disadvantages of Sustained – Release Tablets
i. There may be more erratic result due to more complicated formulation.
ii. A sustained – release product may contain a larger dose, i.e. the dose for
two or three (or more) ‘normal’ dosing intervals which may be difficult
to swallow.
iii. A failure of the controlled release mechanism may result in release of a
large toxic dose.
iv. It involves more expensive technology. Therefore the cost per unit dose of
a sustained – release tablet is more than that of same unit of a conventional
tablet.
v. Accidental poisoning with sustained – release dosage forms does present
special treatment problems not seen with conventional oral tablets. The
slow release of the drug into the gastrointestinal tract and its extended
absorption often results in slow clearance of drug from the body.
1.1.5: Mechanism of drug release from wax matrices
The mechanism of drug release from wax matrices has been a matter of controversy since wax
– systems tend to be crude and more heterogeneous than other classes of polymeric systems (6).
��
�
�
In some cases, it has been reported that the mechanism of release from wax matrices involves the
leaching of drug by the eluting medium. Fluid enters through the cracks and pores of the matrix
with diffusion of drug through the matrix being insignificant (7, 8). Others have reported that
release from a typical wax matrix is diffusion – controlled and is best described by Higuchi’s
Square root model (9).
1.2: Carnauba Wax
Carnauba, also called Brazil wax and palm wax is a wax of the leaves of the palm,
copernicia prunifera, a plant native to and grown in the northeastern Brazilian states of Piaui,
Ceara, Rio Grande do Norte (10). It is known as ‘’ queen of waxes’’ (11) and usually comes in
the form of hard yellow – brown flakes. It is obtained from the leaves of the carnauba or fan
palm by collecting them, beating them to loosen the wax, then refining and bleaching the wax.
1.2.1: Composition
Carnauba wax contains mainly esters of fatty acids (80 – 85%), fatty alcohols (10 – 16%), acids
(3 -6%) and hydrocarbons (1 – 3%). Specific for carnauba wax is the content of esterified fatty
diols (about 20%), hydroxylated fatty acids (about 6%) and cinnamic acid (about 10%).
Cinnamic acid, an antioxidant, may be hydroxylated or methoxylated.
1.2.2: Physicochemical properties
It has a melting point: 82 – 860C (180 – 1870F), among the highest of natural waxes.
���
�
�
Its relative density is about 0.97. It is among the hardest of natural waxes, being harder than
concrete in its pure form. It is practically insoluble in water, soluble on heating in ethylacetate
and in xylene, practically insoluble in ethyl alcohol.
1.2.3: Uses
Carnauba wax can produce a glossy finish and as such is used in automobile waxes, shoe
polishes, dental floss, food products such as sweets, instrument polishes, and floor and furniture
waxes and polishes, especially when mixed with beeswax and with turpentine.
Its hypoallergenic and emollient properties as well as its shine makes it to be used in cosmetics
formulas where it is used to thicken lipstick, eyeliner, mascara, eye shadow, foundations,
deodorant and various skin care preparations.
It is used in the pharmaceutical industry as a tablet – coating agent.
1.3: Arthritis
Arthritis is a group of conditions involving damage to the joints of the body. There are over 100
different forms of arthritis (12). The most common form, osteoarthritis (degenerative joint
disease) is a result of trauma to the joint, infection of the joint, or age. Other arthritis forms are
rheumatoid arthritis, psoriatic arthritis, and autoimmune diseases in which the body attacks itself.
Septic arthritis is caused by joint infection.
Arthritis can be classified as the primary forms or secondary to other diseases. Primary forms of
arthritis include;
����
�
�
i. Osteoarthritis
ii. Rheumatoid arthritis
iii. Septic arthritis
iv. Gout and pseudo – gout
v. Juvenile idiopathic arthritis
vi. Still’s disease
vii. Ankylosing spondylitis
Secondary forms may be due to diseases such as;
i. Haemochromatosis
ii. Hepatitis
iii. Lyme disease
iv. Psoriatic arthritis
v. Reactive arthritis
vi. Inflammatory bowel disease (including Crohn’s Disease and ulcerative colitis) etc.
The major complaint by individuals who have arthritis is pain. Pain is often a constant and daily
feature of the disease. The pain may be localized to the back, neck, hip, knee or feet. The pain
from arthritis occurs due to inflammation that occurs around the joint, damage to the joint from
disease, daily wear and tear of joint, muscle strains caused by forceful movements against stiff,
painful joints and fatigue.
1.3.1: Signs and Symptoms
Irrespective of the type of arthritis, the common symptoms for all arthritic disorders include
varied levels of pain, swelling, joint stiffness and sometimes a constant ache around the joint(s).

���
�
�
Arthritic disorders like lupus and rheumatoid can also affect other organs in the body with a
variety of symptoms (12).
1.3.2: Treatment
There is no cure for either rheumatoid or osteoarthritis but treatments are available for a variety
of symptoms
1.3.3: Non Steroidal Anti Inflammatory Drugs (NSAIDs)
As the class name suggests, non steroidal anti-inflammatory drugs (NSAIDs) reduce
inflammation but are not related to steroids which also reduce inflammation. NSAIDs work by
reducing the production of prostaglandins. Prostaglandins are chemicals that promote
inflammation, pain and fever. They also protect the lining of the stomach and intestines from the
damaging effects of acid and promote blood clotting by activating blood platelets. Prostaglandins
also affect kidney function.
The enzymes that produce prostaglandins are called cycloxygenase (Cox). There are two types of
Cox enzymes, Cox – 1 and Cox – 2. Both enzymes produce prostaglandins that promote
inflammation, pain and fever; however, only Cox – 1 produces prostaglandins that activate
platelets and protect the stomach and intestinal lining.
NSAIDs block Cox enzymes and reduce production of prostaglandins thereby producing relief
from inflammation, pain and fever.
Other mechanisms may exist as well, such as inhibition of lipoxygenase, leukotriene synthesis,
lysosomal enzyme release, neutrophil aggregation and various cell membrane functions. They
may also suppress rheumatoid factor production.
��
�
�
NSAIDs can be divided into selective and non – selective Cox – 2 inhibitors. Selective Cox – 2
inhibitors include celecoxib and nimesulide. Non – selective Cox – 2 inhibitors include;
i. The Pyrazolon derivatives such as phenylbutazone,
ii. The Methylated indole derivatives such as indomethacin,
iii. The fenamates such as mefenamic acid,
iv. The propioic acid derivates such as ibuprofen,
v. The Oxicam such as piroxicam and
vi. The phenylacetic acid derivatives such as Diclofenac.
Diclofenac is commonly used as two of its salt form namely potassium and sodium. Diclofenac
potassium has faster onset of action, therefore mainly used in acute cases while Diclofenac
sodium has slower onset of action and used mainly in chronic cases such as rheumatoid arthritis.
1.4: Diclofenac sodium
Diclofenac Sodium enteric – coated tablet is a benzene – acetic acid derivative.
Diclofenac Sodium contains not less than 99.0per cent and not more than the equivalent of 101.0
per cent of Sodium 2 – [(2, 6 – dichlorophenyl) amino] phenyl acetate, calculated with reference
to the dried substance (13).
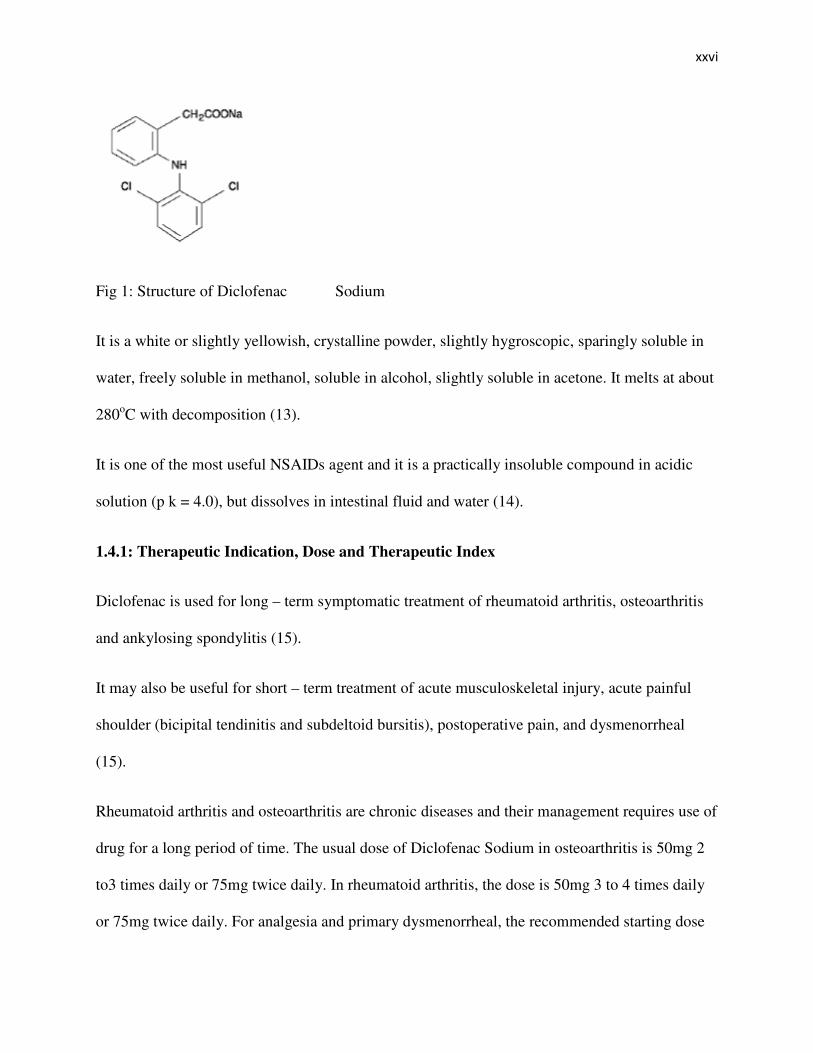
The molecular weight is 318.14. Its molecular formula is C14H10CL2NNaO2, and it has the
following structural formula.
���
�
�
Fig 1: Structure of Diclofenac Sodium
It is a white or slightly yellowish, crystalline powder, slightly hygroscopic, sparingly soluble in
water, freely soluble in methanol, soluble in alcohol, slightly soluble in acetone. It melts at about
280oC with decomposition (13).
It is one of the most useful NSAIDs agent and it is a practically insoluble compound in acidic
solution (p k = 4.0), but dissolves in intestinal fluid and water (14).
1.4.1: Therapeutic Indication, Dose and Therapeutic Index
Diclofenac is used for long – term symptomatic treatment of rheumatoid arthritis, osteoarthritis
and ankylosing spondylitis (15).
It may also be useful for short – term treatment of acute musculoskeletal injury, acute painful
shoulder (bicipital tendinitis and subdeltoid bursitis), postoperative pain, and dysmenorrheal
(15).
Rheumatoid arthritis and osteoarthritis are chronic diseases and their management requires use of
drug for a long period of time. The usual dose of Diclofenac Sodium in osteoarthritis is 50mg 2
to3 times daily or 75mg twice daily. In rheumatoid arthritis, the dose is 50mg 3 to 4 times daily
or 75mg twice daily. For analgesia and primary dysmenorrheal, the recommended starting dose
����
�
�
is 50mg, 3 times daily. Compliance is usually a problem. Controlled – release Diclofenac
Sodium 100mg tablet is given once daily. This improves compliance and ultimately therapeutic
success.
1.4.2: Pharmacokinetic Properties of Diclofenac Sodium
1.4.2.1: Absorption
Diclofenac is 100% absorbed after oral administration compared to IV administration as
measured by urine recovery. However, due to first – pass metabolism, only about 50% 0f the
absorbed dose is systemically available. Food has no significant effect on the extent of
Diclofenac absorption. However, there is usually a delay in the onset of absorption of 1 to 4.5
hours and a reduction in peak plasma levels of <20%.
1.4.2.2: Distribution
The apparent volume of distribution (V/F) of Diclofenac Sodium is 1.4L/Kg. Diclofenac is more
than 99% bound to human serum proteins, primarily to albumin. Serum protein binding is
constant over the concentration range (0.15 - 105µg/ml) achieved with recommended dose.
Diclofenac diffuses into and out of the synovial fluid. Diffusion into the joint occurs when
plasma levels are higher than those in the synovial fluid, after which the process reverses and
synovial fluid levels are higher than plasma levels. It is not known whether diffusion into the
joints plays a role in the effectiveness of Diclofenac (16).
�����
�
�
1.4.2.3: Metabolism
Five Diclofenac metabolites have been identified in human plasma and urine. The metabolites
include 4’ – hydroxyl - , 5 – hydroxyl -, 3’ – hydroxyl -, 4’, 5 – dihydroxy – and 3’ – hydroxyl –
4’ – methoxy Diclofenac. In patients with renal dysfunction, peak concentrations of metabolites
4’ – hydroxyl – and 5 – hydroxyl – Diclofenac were approximately 50% and 4% of the parent
compound after single oral dosing compared to 27% and 1% in normal healthy subjects.
However, Diclofenac metabolites undergo further glucuronidation and sulfation followed by
biliary excretion.
One Diclofenac metabolite 4’ – hydroxyl – Diclofenac has very weak pharmacologic activity
(16).
1.4.2.4: Excretion
Diclofenac is eliminated through metabolism and subsequent urinary and biliary excretion of the
glucuronide and the sulfate conjugates of the metabolites. Little or no free unchanged Diclofenac
is excreted in the urine. Approximately 65% of the dose is excreted in the urine and
approximately 35% in the bile as conjugates of unchanged Diclofenac plus metabolites. Because
renal elimination is not a significant pathway of elimination for unchanged Diclofenac, dosing
adjustment in patients with mild to moderate renal dysfunction is not necessary. The terminal
half – life of unchanged Diclofenac is approximately 2 hours (16).
1.5: Melt Granulation
Melt granulation could be an easy and fast method to formulate sustained release tablets (17).
Melt granulation is a well known process whereby fine powders are agglomerated by means of a
� �
�
�
molten binder and processed into spherical or nearly spherical granules of homogeneous size.
With hydrophobic binders and appropriate fillers sustained – release systems can be obtained by
this process (18).
Melt granulation of the matrix granules is achieved by mixing a drug powder/or granule with a
melt of a wax material (e.g. Carnauba wax or glyceryl monostearate), with the objective of
coating the granules and further retarding drug release from the granules. Thus, matrix
granulation and wax coating of the matrix granules are approaches for retarding drug release and
hence prolonging the biologic action of drugs with short biologic half life (19).
Melt granulation is one of the most widely applied processing techniques in the array of
pharmaceutical manufacturing operations. Melt granulation process is currently applied in the
pharmaceutical for the manufacture of variety of dosage forms and formulation such as
immediate release and sustained – release pellets, granules and tablets (20).
1.5.1: Uses
Melt granulation is used to;
i. Improve the dissolution rate and bioavailability of the drug by forming a solid
dispersion or solid solution.
ii. Control or modify the release of the drug.
iii. Mask the bitter taste of an active drug.
1.5.2: Advantages
i. Neither solvent nor water is used in the process.
ii. Fewer processing steps needed thus time consuming drying steps eliminated.
�
�
�
iv. There are no requirements on the compressibility of active ingredients and the entire
procedure is simple, continuous and efficient.
v. Uniform dispersion of fine particles occurs.
vi. Good stability at varying pH and moisture levels.
vii. Safe application in humans due to their non – swellable and water insoluble nature.
1.5.3: Disadvantages
i. Requires high energy input.
ii. It cannot be applied to heat – sensitive materials owing to the elevated
temperatures.
iv. Lower – melting point binder risks situation where melting or softening of the binder
occurs during handling and storage of the agglomerates.
1.5.4: Dissolution Test
Whilst the test for tablet disintegration gives some control over those drugs whose bioavailability
from tablets is governed by the rate at which the tablet disintegrates, it gives no information
regarding those cases where the tablet disintegrates satisfactorily, but the rate – limiting step is
the rate at which the active drug substance dissolves in the fluids of the gastrointestinal tract
(21).
Dissolution test is a measure of the proportion of drug dissolving in a stated time under
standardized conditions in vitro (21).
The principal purposes of dissolution testing are 3 – fold:

��
�
�
1. For quality control, to ensure the uniformity of product from batch to batch.
2. To help to predict bioavailability for formulation development.
3. As a measure of change when formulation changes are made to an existing formulation
(22).
Bai et al also supported the above points in their work;
They wrote that in the pharmaceutical industry, drug dissolution testing is routinely used to
provide critical in vitro drug release information for both quality control purposes, i.e., to assess
batch to batch consistency of solid oral dosage forms such as tablets, and drug development, i.e.,
to predict in vivo drug release profiles (a).
In vitro drug dissolution data generated from dissolution testing experiments can be related to in
vivo pharmacokinetic data by means of in vitro-in vivo correlations (IVIVC). A well established
predictive IVIVC model can be very helpful for drug formulation design and post-approval
manufacturing changes (b).
The main objective of developing and evaluating an IVIVC is to establish the dissolution test as
a surrogate for human bioequivalence studies, as stated by the Food and Drug Administration
(FDA). Analytical data from drug dissolution testing are sufficient in many cases to establish
safety and efficacy of a drug product without in vivo tests, following minor formulation and
manufacturing changes (Qureshi and Shabnam, 2001). Thus, the dissolution testing which is
conducted in dissolution apparatus must be able to provide accurate and reproducible results.
Several dissolution apparatuses exist. In United States Pharmacopeia (USP), there are four
dissolution apparatuses standardized and specified (c). They are:
���
�
�
• USP Dissolution Apparatus 1 - Basket (37°C)
• USP Dissolution Apparatus 2 - Paddle (37°C)
• USP Dissolution Apparatus 3 - Reciprocating Cylinder (37°C)
• USP Dissolution Apparatus 4 - Flow-Through Cell (37°C)
The performances of dissolution apparatuses are highly dependent on hydrodynamics due to the
nature of dissolution testing. The designs of the dissolution apparatuses and the ways of
operating dissolution apparatuses have huge impacts on the hydrodynamics, thus the
performance
����
�
�
CHAPTER TWO
2.0: MATERIALS AND METHODS
I: Materials
Diclofenac Sodium (Alpha Lab, Germany), Carnauba wax, refined NO 1, yellow (Sigma –
Aldrich U.K), Hydrochloric acid 37% (Haig Laboratory Chemical Corporation Wembley,
MIDDX, England), Potassium dihydrogen orthophosphate (BDH Chemicals Ltd Poole England).
Potassium Hydroxide (BDH Chemicals Ltd Poole England), Microcrystalline cellulose (N.B
Entrepreneur Nagpur India), Magnesium stearate and Silicon dioxide.
II: Methods
2.1.1: Preformulation studies
Development of calibration curve for Diclofenac Sodium:
A stock solution of Diclofenac sodium was prepared by dissolving 100mg of drug in 100ml of phosphate
buffer of pH 6.8 (0.1%w/v) . From this stock solution, 0.06%, 0.04%, 0.006%, 0.004%, 0.003%, 0.002%,
0.0006%, 0.0004%, 0.0003%, 0.0002%, 0.00006%, 0.00004%, 0.00002%, 0.000004%, 0.000002% w/v
dilutions were prepared. The �max of the drug was determined by scanning one of the dilutions between
400 to 200 nm using a UV- visible spectrophotometer.
2.1.2: Preparation of Formulations DS 1 – DS 6 of Diclofenac Sodium Granules
Diclofenac sodium was prepared by melt granulation using the quantities of active ingredients
and excipients as in table 2 below.
���
�
�
Diclofenac sodium was blended thoroughly with microcrystalline cellulose in a polyethylene
bag. Carnauba wax was placed in a beaker and heated to about 880C using a water – bath.
The mixture of Diclofenac sodium and diluents was added to the melted carnauba wax and
blended together. It was allowed to cool. The granules formed were passed through sieve NO
100. This was formulation DS 1.
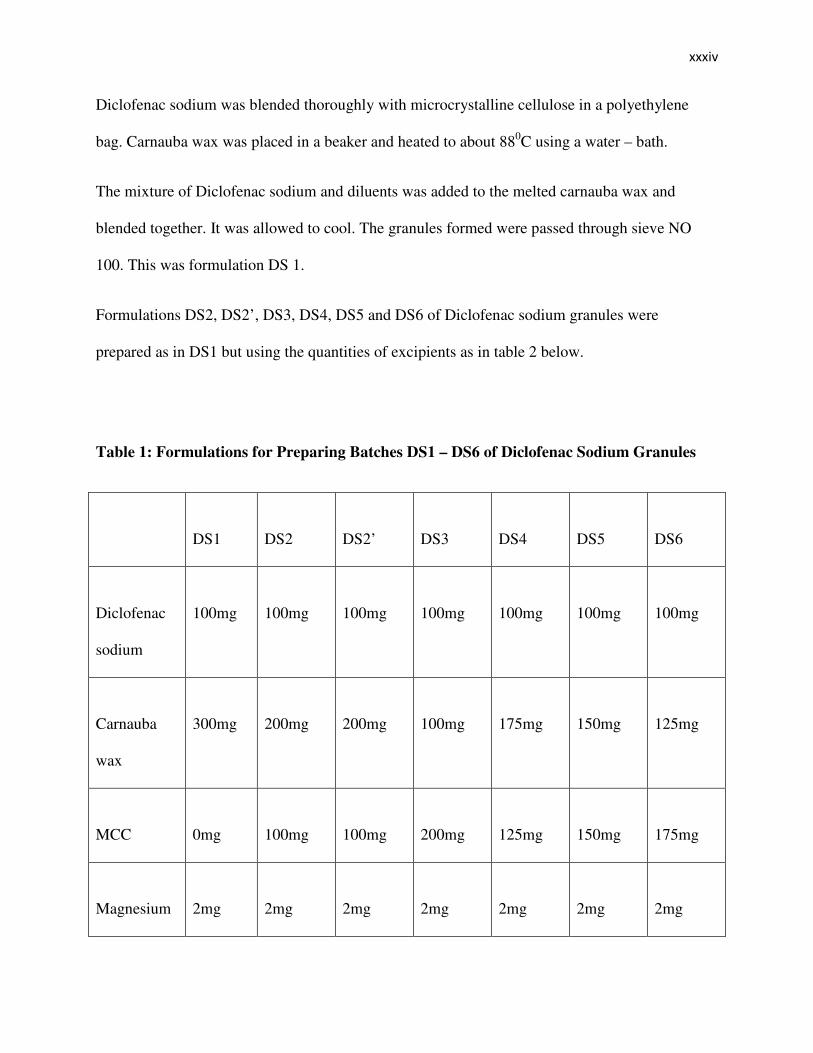
Formulations DS2, DS2’, DS3, DS4, DS5 and DS6 of Diclofenac sodium granules were
prepared as in DS1 but using the quantities of excipients as in table 2 below.
Table 1: Formulations for Preparing Batches DS1 – DS6 of Diclofenac Sodium Granules
DS1
DS2
DS2’
DS3
DS4
DS5
DS6
Diclofenac
sodium
100mg
100mg
100mg
100mg
100mg
100mg
100mg
Carnauba
wax
300mg
200mg
200mg
100mg
175mg
150mg
125mg
MCC
0mg
100mg
100mg
200mg
125mg
150mg
175mg
Magnesium
2mg
2mg
2mg
2mg
2mg
2mg
2mg

��
�
�
stearate
Cab - O –
Sil
4mg
4mg
4mg
4mg
4mg
4mg
4mg
TOTAL
406mg
406mg
406mg
406mg
406mg
406mg
406mg
Table 2: Formulations for preparing 200 tablets of the respective Batches DS 1 – DS 6 of
Diclofenac Sodium Granules
DS 1 DS 2 DS 2’ DS 3 DS 4 DS 5 DS 6
Diclofenac
Sodium
20g 20g 20g 20g 20g 20g 20g
Carnauba Wax
60g 40g 40g 20g 35g 30g 25g
Microcrystalline
Cellulose
0g 20g 20g 40g 25g 30g 35g
Magnesium
Stearate
0.4g 0.4g 0.4g 0.4g 0.4g 0.4g 0.4g
Silicon dioxide 0.8g 0.8g 0.8g 0.8g 0.8g 0.8g 0.8g
���
�
�
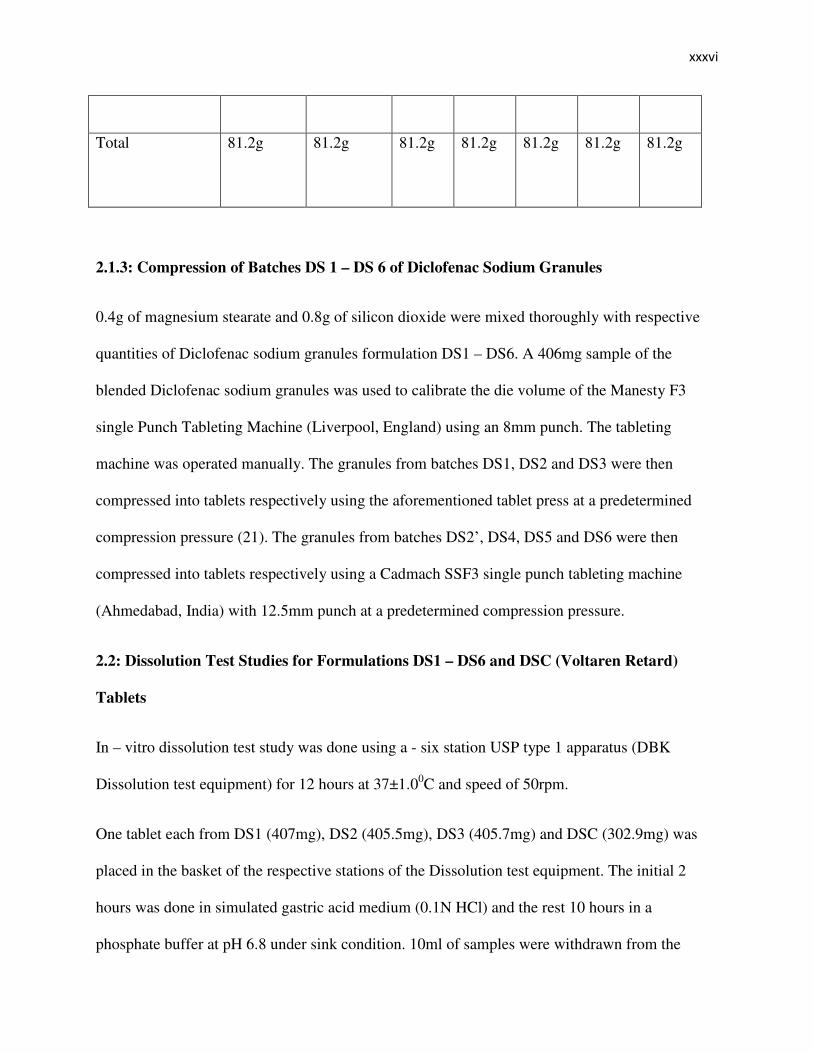
Total
81.2g 81.2g 81.2g 81.2g 81.2g 81.2g 81.2g
2.1.3: Compression of Batches DS 1 – DS 6 of Diclofenac Sodium Granules
0.4g of magnesium stearate and 0.8g of silicon dioxide were mixed thoroughly with respective
quantities of Diclofenac sodium granules formulation DS1 – DS6. A 406mg sample of the
blended Diclofenac sodium granules was used to calibrate the die volume of the Manesty F3
single Punch Tableting Machine (Liverpool, England) using an 8mm punch. The tableting
machine was operated manually. The granules from batches DS1, DS2 and DS3 were then
compressed into tablets respectively using the aforementioned tablet press at a predetermined
compression pressure (21). The granules from batches DS2’, DS4, DS5 and DS6 were then
compressed into tablets respectively using a Cadmach SSF3 single punch tableting machine
(Ahmedabad, India) with 12.5mm punch at a predetermined compression pressure.
2.2: Dissolution Test Studies for Formulations DS1 – DS6 and DSC (Voltaren Retard)
Tablets
In – vitro dissolution test study was done using a - six station USP type 1 apparatus (DBK
Dissolution test equipment) for 12 hours at 37±1.00C and speed of 50rpm.
One tablet each from DS1 (407mg), DS2 (405.5mg), DS3 (405.7mg) and DSC (302.9mg) was
placed in the basket of the respective stations of the Dissolution test equipment. The initial 2
hours was done in simulated gastric acid medium (0.1N HCl) and the rest 10 hours in a
phosphate buffer at pH 6.8 under sink condition. 10ml of samples were withdrawn from the
����
�
�
dissolution medium and replaced with 10ml of fresh medium to maintain constant volume every
1 hour. After filtration, the sample solution was analyzed at 270nm for Diclofenac sodium using
a DBK UV spectrophotometer. Twelve samples were collected at respective 12 hours for each of
formulations DS1, DS2, DS3 and DSC. This was repeated in triplicate. The above process was
repeated in triplicate for batches DS2’ (406mg), DS4 (407mg), DS5 (406.5mg), DS6 (405.8mg)
and DSC (303mg).
2.3: Friability Test
DBK Friability Test Apparatus made by DBK Mumbai instruments was used. 10 tablets from
batch DS1 were weighed (4058mg) and placed at the right hand side (RHS) of the apparatus
while another 10 tablets were weighed (3980mg) and placed at the left hand side (LHS). The
apparatus was set to make 100 revolutions after which the tablets were re – weighed.
This was repeated for batches DS2 (RHS = 4004mg, LHS = 4108mg), DS2’ (RHS = 4110mg, LHS =
4090mg), DS3 (RHS = 4041mg, LHS = 4049mg), DS4 (RHS = 4080mg, LHS = 4100mg), DS5 (RHS =
4060mg, LHS = 4040mg) and DS6 (RHS = 4090mg, LHS = 4085mg).
2.4: Uniformity of Weight Test
About 20 tablets from formulations DS1 were weighed and the mean weight determined. This
was repeated for formulation DS2, DS2’, DS3, DS4, DS5 and DS6. The mean weight governs
the permitted deviations from the mean. These are given in table 3 below.

�����
�
�
Table 3: Uniformity of tablet weight (22)
Average weight of tablet Percentage deviation
80mg or less 10
More than 80mg and less than 250mg 7.5
250mg or more 5
2.5: Determination of Crushing Strength of Batches DS 1 - DS 6 of Diclofenac Sodium
Tablets.
The crushing strengths of the tablets were determined with Shital Scientific tablet hardness tester
using ten tablets immediately after compression.
2.6: Melting Point Determination
Capillary tube was filled with small quantity of the Diclofenac sodium powder and placed in a
DBK Melting Point apparatus. The melting point was determined. The melting point for
carnauba wax was also determined.
2.7: Preparation of Buffer Solutions
2.7.1: Preparation of Buffer Solution of pH 12
A 2g sample of NaCl was dissolved in about 950ml of distilled water. The p H of the solution
was adjusted to 1.2 using concentrated HCl and the volume of the solution made up to 1000ml
with distilled water.
2.7.2: Preparation of Phosphate Buffer Solution of pH 6.8
� �
�
�
A 0.5g sample of Potassium Dihydrogen Phosphate (NaH2PO4) was dissolved in about 950ml of
distilled water and the pH of the solution adjusted to 6.8 with 0.4N NaOH. The volume of the
solution was made up to 1000ml with distilled water.
2.8: Analysis of Data
Statistical analysis was done using Microsoft Excel and SPSS version 17.0. Data were analyzed by one –
way ANOVA. Differences between means were assessed by a two – tailed student’s T – test. P < 0.05
was considered statistically significant.
The dissolution kinetics of Diclofenac sodium from formulations DS1, DS2, DS2’, DS3, DS4,
DS5, DS6 and DSC tablets in phosphate buffer solution of p H 6.8 were determined by
application of the Zero Order, First Order, Higuchi and Hixson – Crowell’s Cuberoot Law . The
mechanism of drug release was obtained by fitting the first 60% drug release data into the
Korsmeyer – Peppas model as shown below:
Zero Order Model
C = K…………………………………………………………………………… (23, 24, 25)
C = %Release, K0 = Zero Order rate constant expressed in units of concentration/time (t).
First Order Model
LogCr = LogC0 – K1t/2.303…………………………………………………………… (23, 24, 25)
Cr = %Remaining, C0 = Initial concentration of drug, K1 = First Order constant, t = Time
Higuchi’s Square root Law Model
Q = KHt1/2……………………………………………………………………………… (5, 25, 26)
��
�
�
Q = %Released, KH = Constant reflecting design variables of the system, t = Time
Hixson – Crowell’s Cuberoot Law Model
[(100 – f)/100]1/3 = 1 – KHCt………………………………………………………………… (27)
f = %Released, KHC = Rate constant, t = Time
Korsmeyer – Peppas Model
Mt/M� = Ktn……………………………………………………………………………… (28, 29)
Mt/M� = Fraction of drug released at time (t), K = Rate constant, ‘n – value’ is used to
characterize different release mechanisms.
���
�
�
CHAPTER THREE
3.0: RESULTS AND DISCUSSION
3.1: Evaluation of Diclofenac Sodium
3.1.1: Pre formulation studies
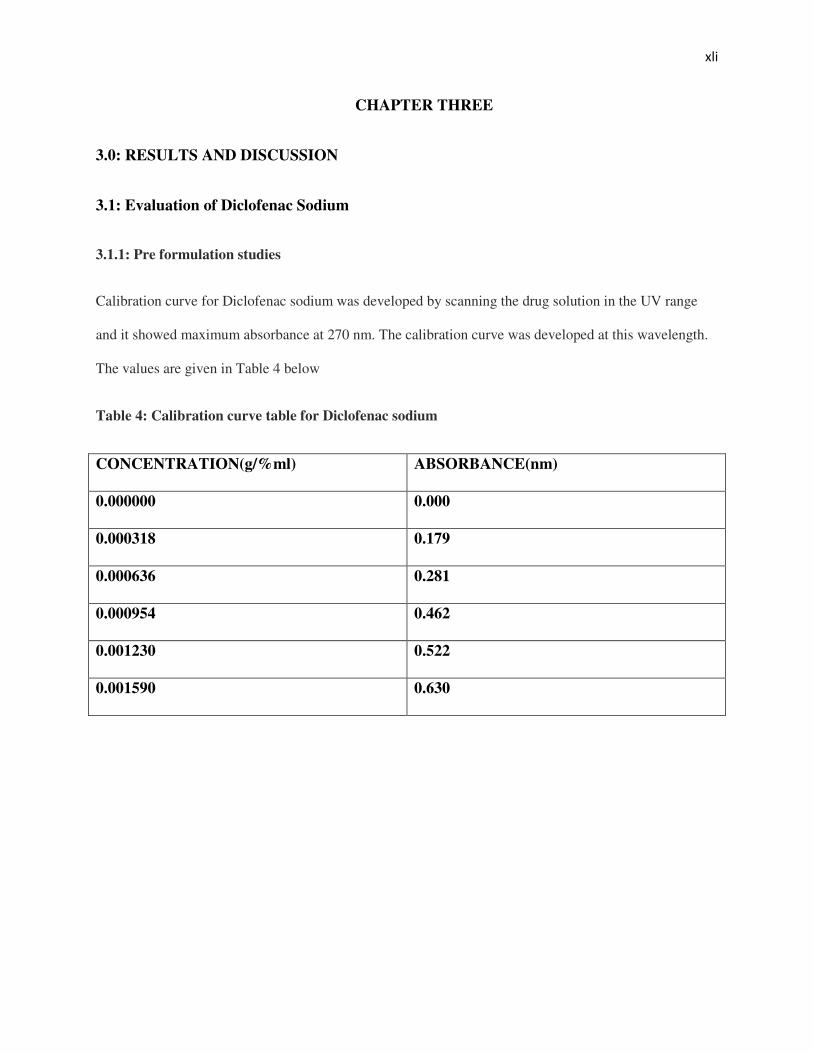
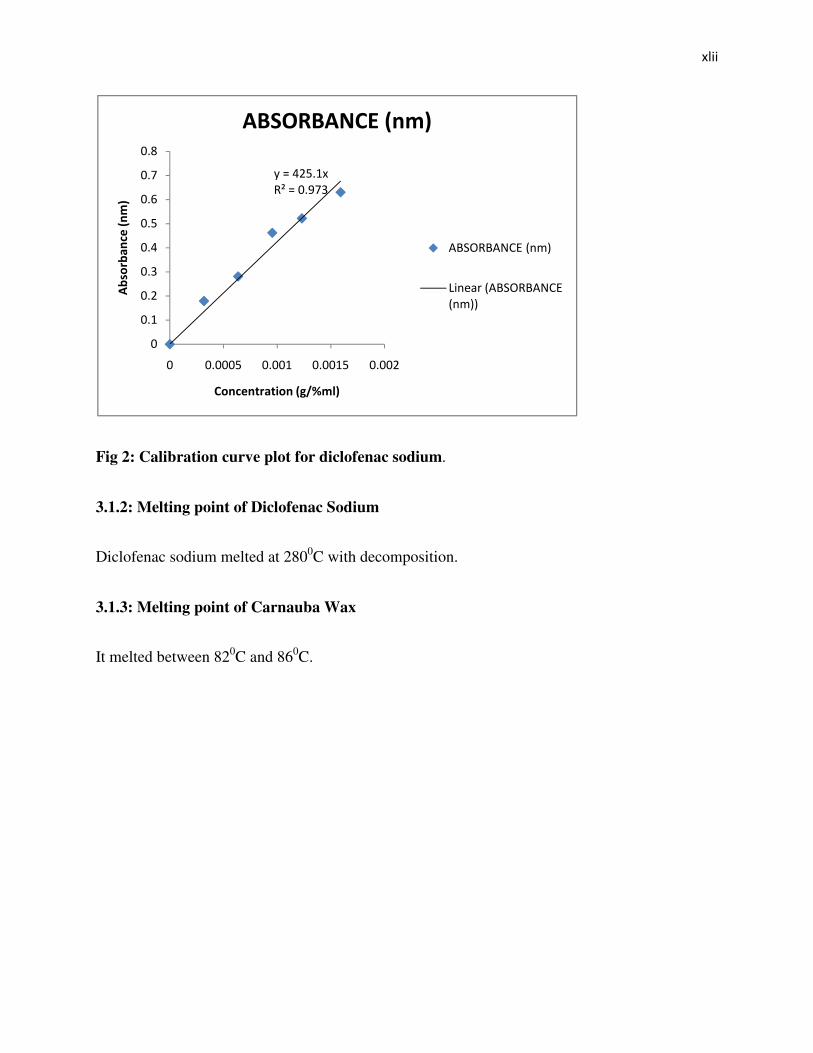
Calibration curve for Diclofenac sodium was developed by scanning the drug solution in the UV range
and it showed maximum absorbance at 270 nm. The calibration curve was developed at this wavelength.
The values are given in Table 4 below
Table 4: Calibration curve table for Diclofenac sodium
CONCENTRATION(g/%ml) ABSORBANCE(nm)
0.000000 0.000
0.000318 0.179
0.000636 0.281
0.000954 0.462
0.001230 0.522
0.001590 0.630
����
�
�
Fig 2: Calibration curve plot for diclofenac sodium.
3.1.2: Melting point of Diclofenac Sodium
Diclofenac sodium melted at 2800C with decomposition.
3.1.3: Melting point of Carnauba Wax
It melted between 820C and 860C.
����!"#$%
&'���($)*+
(
($%
($"
($+
($!
($#
($,
($*
($-
( ($(((# ($((% ($((%# ($(("
�������������
����������������� � ��
��� �� � ������ �
./� &/.��0�1� 2
3�����1./� &/.��0�
1� 22
�����
�
�
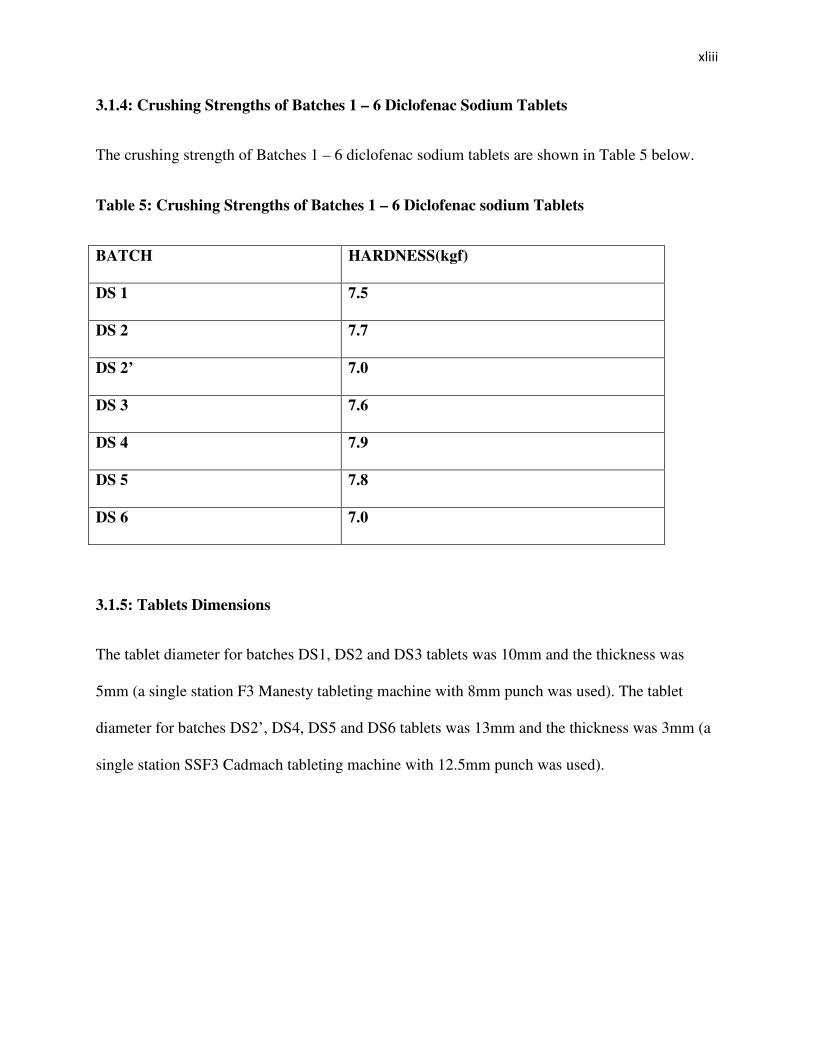
3.1.4: Crushing Strengths of Batches 1 – 6 Diclofenac Sodium Tablets
The crushing strength of Batches 1 – 6 diclofenac sodium tablets are shown in Table 5 below.
Table 5: Crushing Strengths of Batches 1 – 6 Diclofenac sodium Tablets
BATCH HARDNESS(kgf)
DS 1 7.5
DS 2 7.7
DS 2’ 7.0
DS 3 7.6
DS 4 7.9
DS 5 7.8
DS 6 7.0
3.1.5: Tablets Dimensions
The tablet diameter for batches DS1, DS2 and DS3 tablets was 10mm and the thickness was
5mm (a single station F3 Manesty tableting machine with 8mm punch was used). The tablet
diameter for batches DS2’, DS4, DS5 and DS6 tablets was 13mm and the thickness was 3mm (a
single station SSF3 Cadmach tableting machine with 12.5mm punch was used).
����
�
�
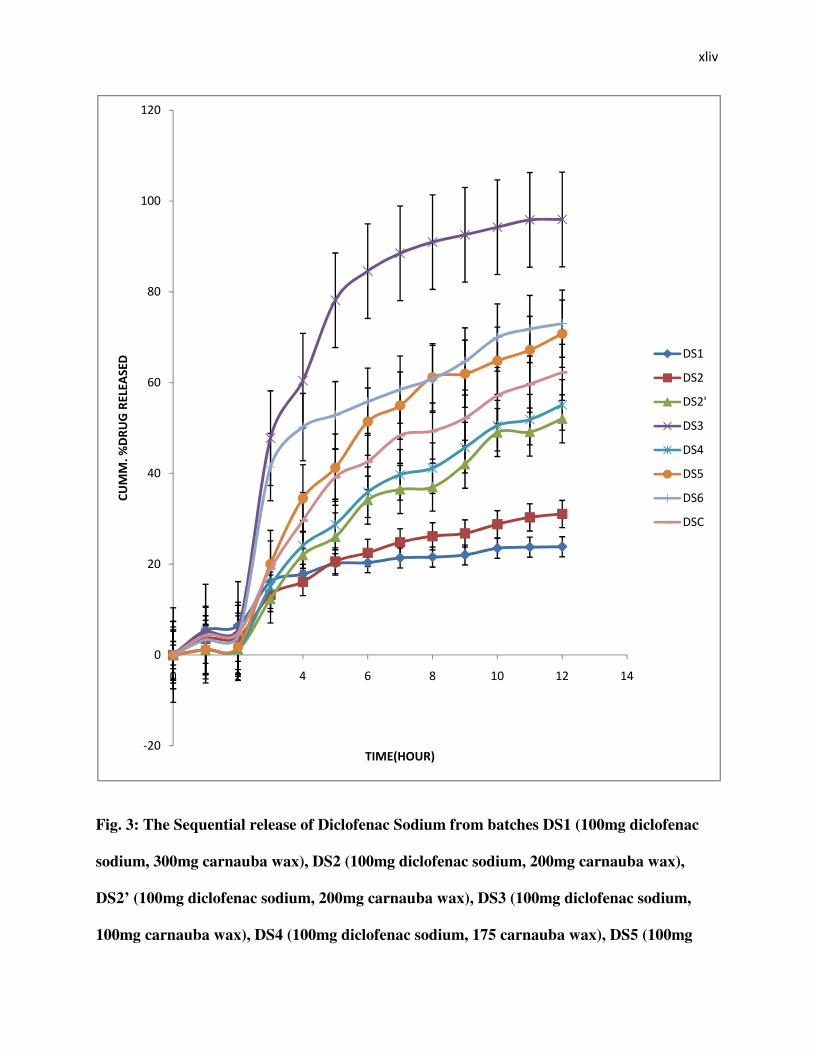
Fig. 3: The Sequential release of Diclofenac Sodium from batches DS1 (100mg diclofenac
sodium, 300mg carnauba wax), DS2 (100mg diclofenac sodium, 200mg carnauba wax),
DS2’ (100mg diclofenac sodium, 200mg carnauba wax), DS3 (100mg diclofenac sodium,
100mg carnauba wax), DS4 (100mg diclofenac sodium, 175 carnauba wax), DS5 (100mg
4"(
(
"(
!(
,(
-(
%((
%"(
( " ! , - %( %" %!
�� !��"��#���$� ��"
%& ��'� ���
�%
�"
�"5
�+
�!
�#
�,
��

���
�
�
diclofenac sodium, 150mg carnauba wax), DS6 (100mg diclofenac sodium, 125 carnauba
wax)and DSC (Voltaren retard 100mg) Tablets.
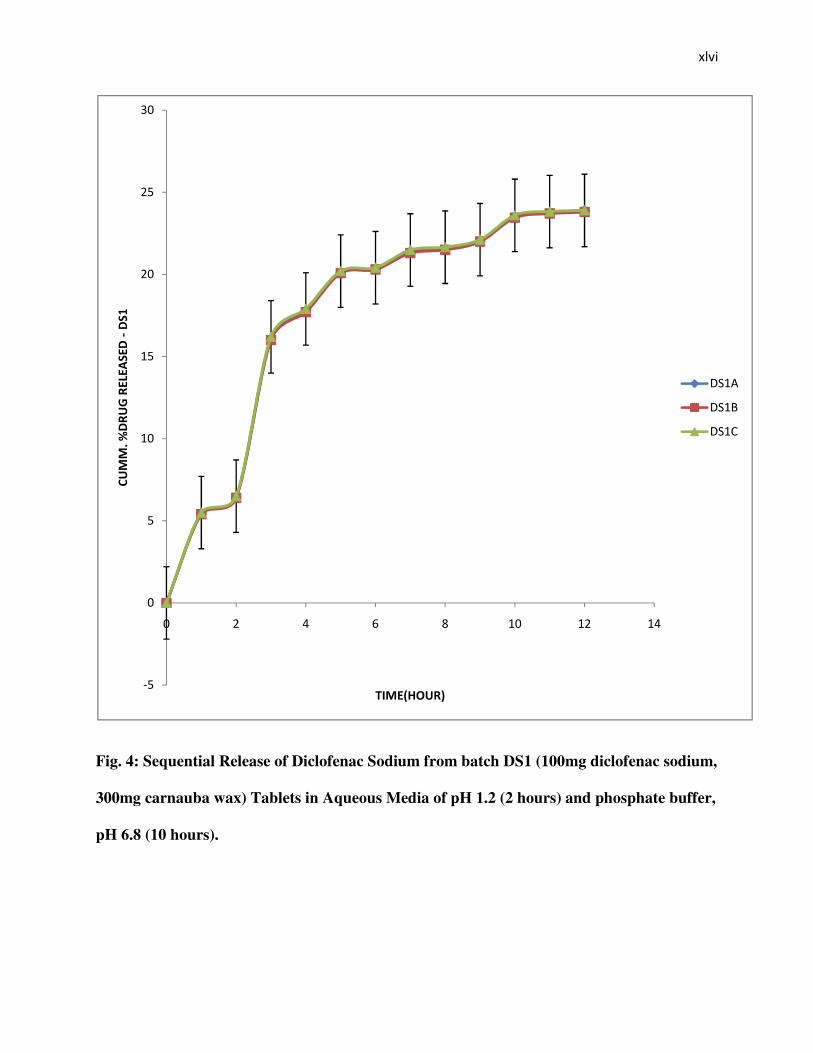
3.2.1: In Vitro Drug Release Characteristics of Formulation DS1 of Diclofenac Sodium
Tablets:
The in vitro drug release characteristics of diclofenac sodium from formulation DS1 tablets are
shown in fig. 4 – 9.
����
�
�
Fig. 4: Sequential Release of Diclofenac Sodium from batch DS1 (100mg diclofenac sodium,
300mg carnauba wax) Tablets in Aqueous Media of pH 1.2 (2 hours) and phosphate buffer,
pH 6.8 (10 hours).
4#
(
#
%(
%#
"(
"#
+(
( " ! , - %( %" %!
�� !��"��#���$� ��"�("��
%& ��'� ���
�%.
�%/
�%�

�����
�
�
The mean (± s.d.) percent of in vitro drug release of Diclofenac sodium from batch DS1 tablets
as in fig. 4 above showed that only 6.44 ±0.05% of Diclofenac sodium was released after the first
2 hours in the simulated gastric fluid of pH 1.2. This showed the poor solubility of the
Diclofenac sodium at the acidic pH of 1.2.
The plot in fig. 4 above showed approximately a straight line, indicating controlled release.
However, a cumulative quantity of 23.86 ± 0.06% was released after 12 hours (2hours at p. H.
1.2 and 10 hours in the simulated intestinal fluid of pH 6.8), which showed a poor release profile
for the batch. This may be due to the high concentration of the hydrophobic matrix (75% of
carnauba wax) in the batch.
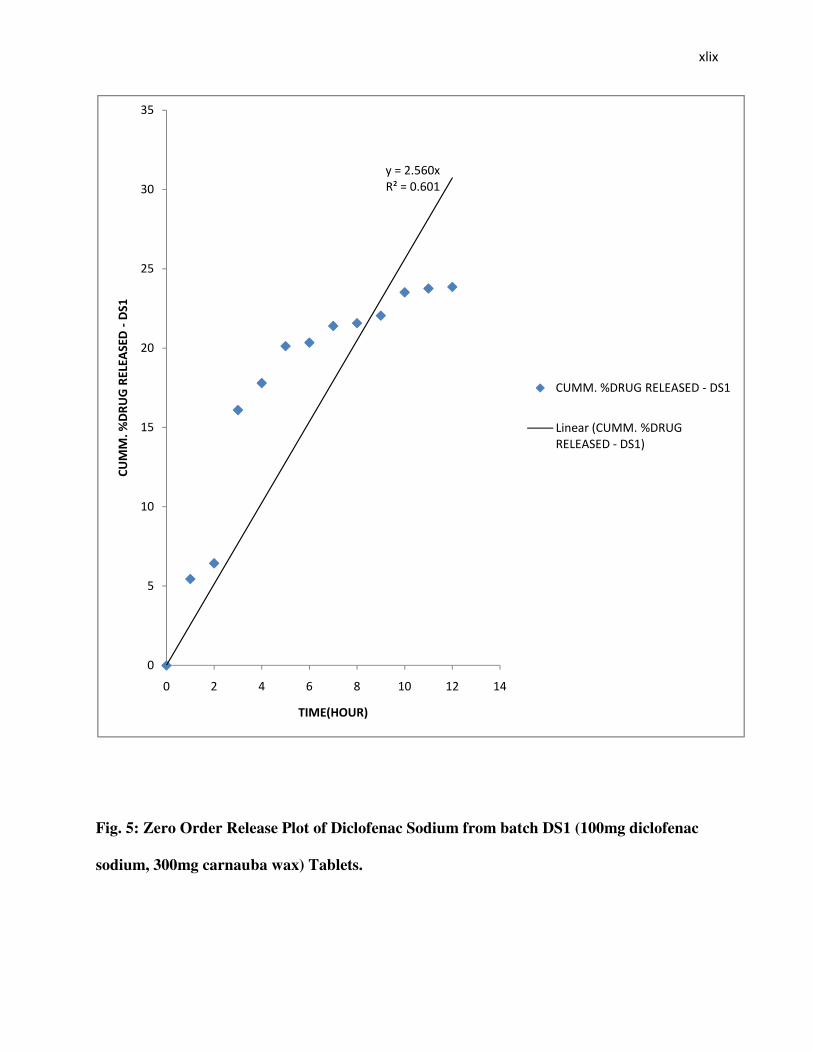
When the dissolution result was fitted into several kinetic models as shown in fig. 5 – 9 below, it
was obvious that Higuchi’s Square root Law, First Order, Cuberoot Law and Zero Order Kinetics
were all in operation during drug release. But Higuchi’s Square root Law Kinetic was most
dominant, which shows that drug release from the tablet matrix was diffusion dependent with
average diffusion rate of 7.60% per hr1/2. The mechanism of drug release was determined by the
application of the Korsmeyer – Peppas equation which gave an n – value of 0.858 and this is
indicative of an anomalous (non – fickian) diffusion controlled mechanism of release (23, 24,
25). This means that the release profile does not obey Fick’s Law of Diffusion (30).

������
�
�
�� �
�
�
Fig. 5: Zero Order Release Plot of Diclofenac Sodium from batch DS1 (100mg diclofenac
sodium, 300mg carnauba wax) Tablets.
����"$#,(
&'���($,(%
(
#
%(
%#
"(
"#
+(
+#
( " ! , - %( %" %!
�� !��"��#���$� ��"�("��
%& ��'� ���
��6 6 $�7 �&�8 �&030.0��4 �%
3�����1��6 6 $�7 �&�8 �
&030.0��4 �%2
��
�
�
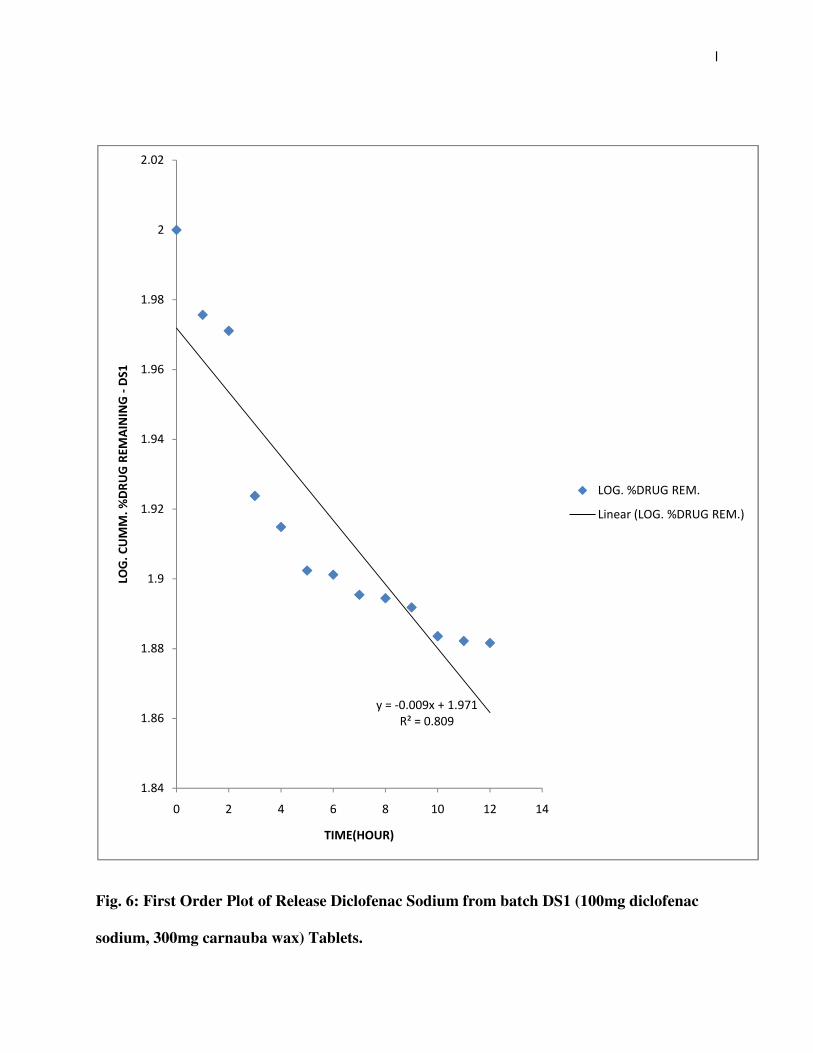
Fig. 6: First Order Plot of Release Diclofenac Sodium from batch DS1 (100mg diclofenac
sodium, 300mg carnauba wax) Tablets.
����4($(() �9�%$)*%
&'���($-()
%$-!
%$-,
%$--
%$)
%$)"
%$)!
%$),
%$)-
"
"$("
( " ! , - %( %" %!
$�#!��� !��"��#��� &�&�#�("��
%& ��'� ���
3� 8$�7 �&�8 �&06 $
3�����13� 8$�7 �&�8 �&06 $2
���
�
�
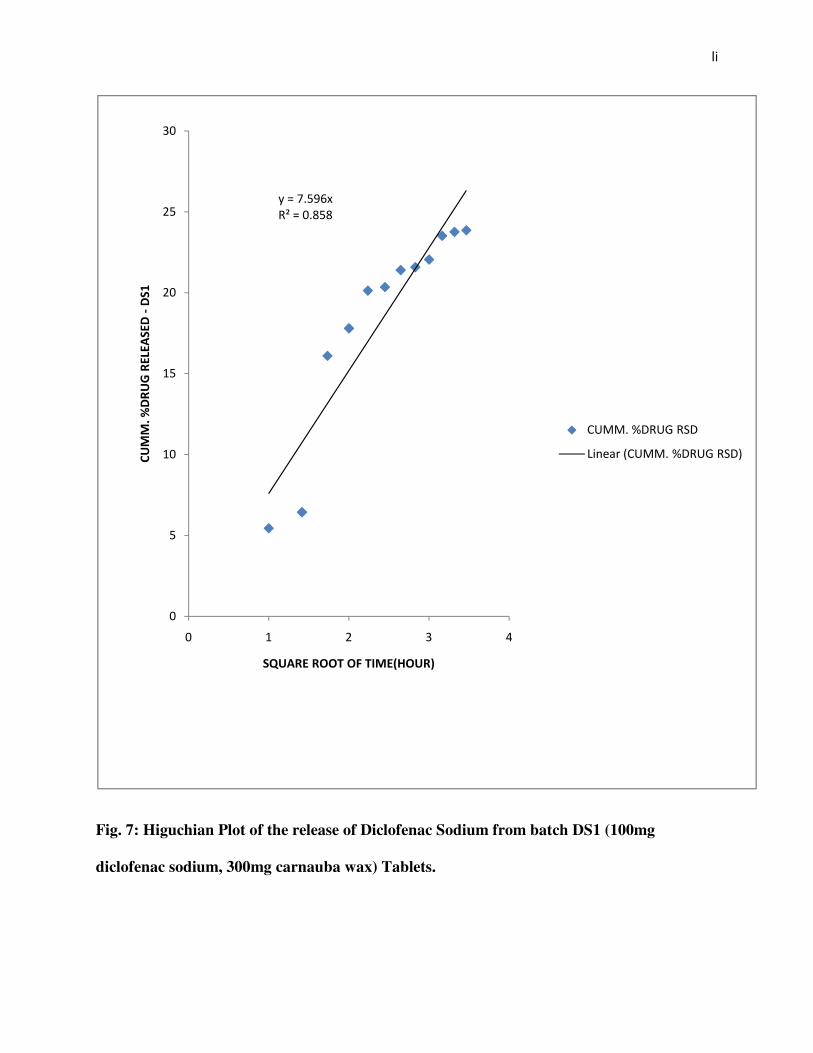
Fig. 7: Higuchian Plot of the release of Diclofenac Sodium from batch DS1 (100mg
diclofenac sodium, 300mg carnauba wax) Tablets.
����*$#),
&'���($-#-
(
#
%(
%#
"(
"#
+(
( % " + !
�� !��"��#���$� ��"�("��
�) � ����� � %�� *�%& ��'� ���
��6 6 $�7 �&�8 �&�
3�����1��6 6 $�7 �&�8 �&�2

����
�
�
Fig. 8: Korsmeyer – Peppas Plot of the Release of Diclofenac Sodium from batch DS1
(100mg diclofenac sodium, 300mg carnauba wax) Tablets.
����($,"( �9�($**)
&'���($-,%
(
($"
($!
($,
($-
%
%$"
%$!
%$,
( ($" ($! ($, ($- % %$"
$�#!��� !��"��#���$� ��"�("��
$� #!�%& ��'� ���
3� 8$�7 �&�8 �&�
3�����13� 8$�7 �&�8 �&�2
�����
�
�
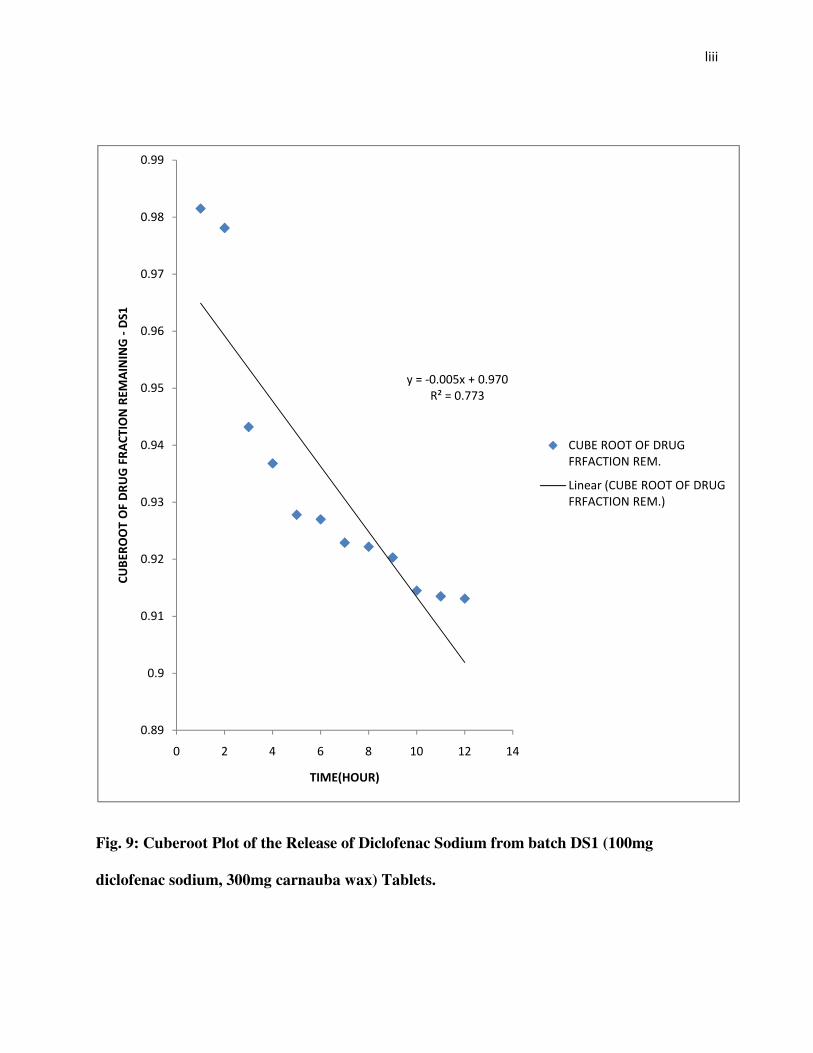
Fig. 9: Cuberoot Plot of the Release of Diclofenac Sodium from batch DS1 (100mg
diclofenac sodium, 300mg carnauba wax) Tablets.
����4($((# �9�($)*(
&'���($**+
($-)
($)
($)%
($)"
($)+
($)!
($)#
($),
($)*
($)-
($))
( " ! , - %( %" %!
�������%��*�"��#�*� �%&����� &�&�#�("��
%& ��'� ���
��/0�&� � :�� ;��&�8 �
;&;.�:�� � �&06 $
3�����1��/0�&� � :�� ;��&�8 �
;&;.�:�� � �&06 $2
����
�
�
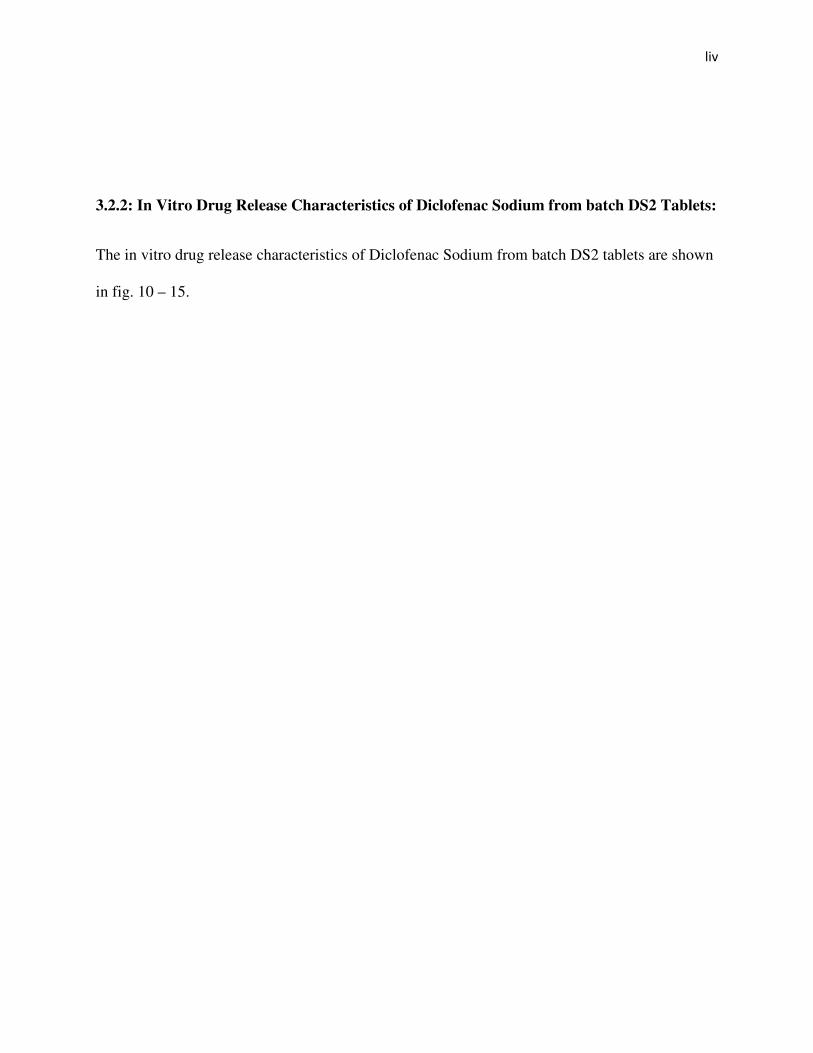
3.2.2: In Vitro Drug Release Characteristics of Diclofenac Sodium from batch DS2 Tablets:
The in vitro drug release characteristics of Diclofenac Sodium from batch DS2 tablets are shown
in fig. 10 – 15.
���
�
�
Fig. 10: Sequential Release of Diclofenac Sodium from batch DS2 (100mg diclofenac
sodium, 200mg carnauba wax) Tablets.
4#
(
#
%(
%#
"(
"#
+(
+#
!(
( " ! , - %( %" %!
�� !��"��#���$� ��"�("�
%& ��'� ���
�".
�"/
�"�

����
�
�
From fig. 10 above, it showed that the plot was almost a straight line indicating a controlled
release process. The drug release profile of 3.88 ± 0.03% within the first 2 hours showed good
drug release retardation by the matrix system at acidic pH.
The drug release of 13.25 ± 0.05% and 31.08 ± 0.10% after 1 hour and 10 hours respectively in
simulated intestinal fluid showed appreciable release when compared to batch DS1.
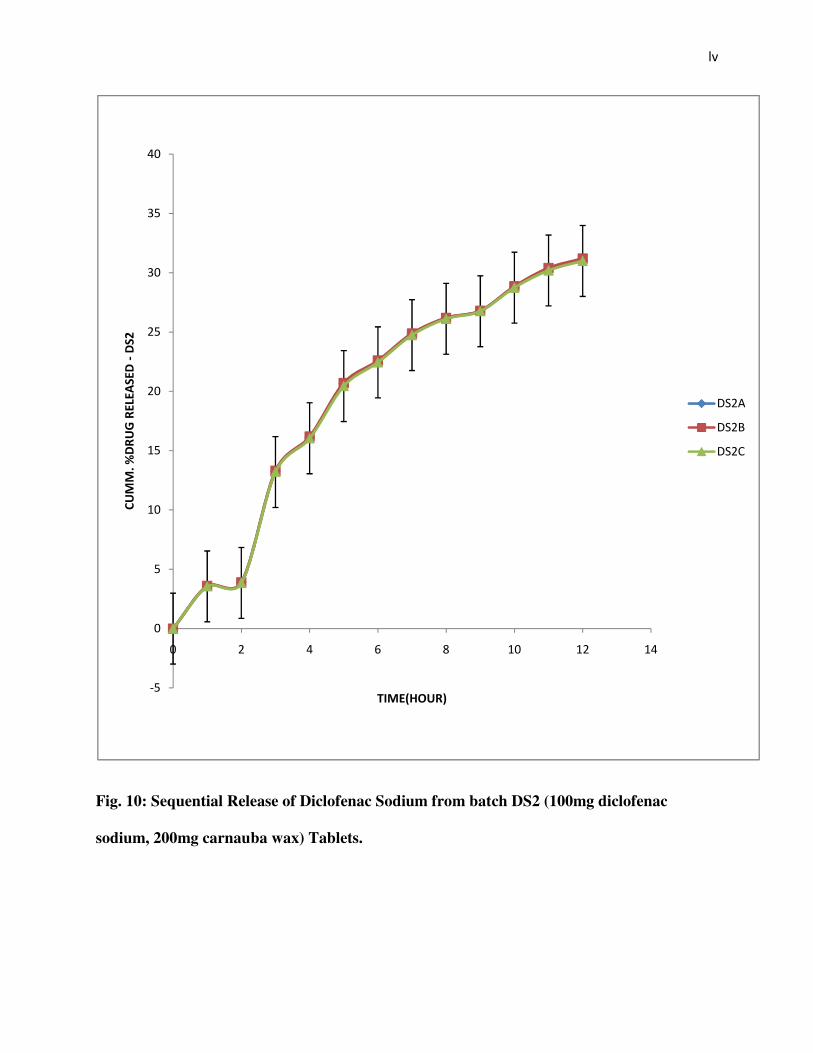
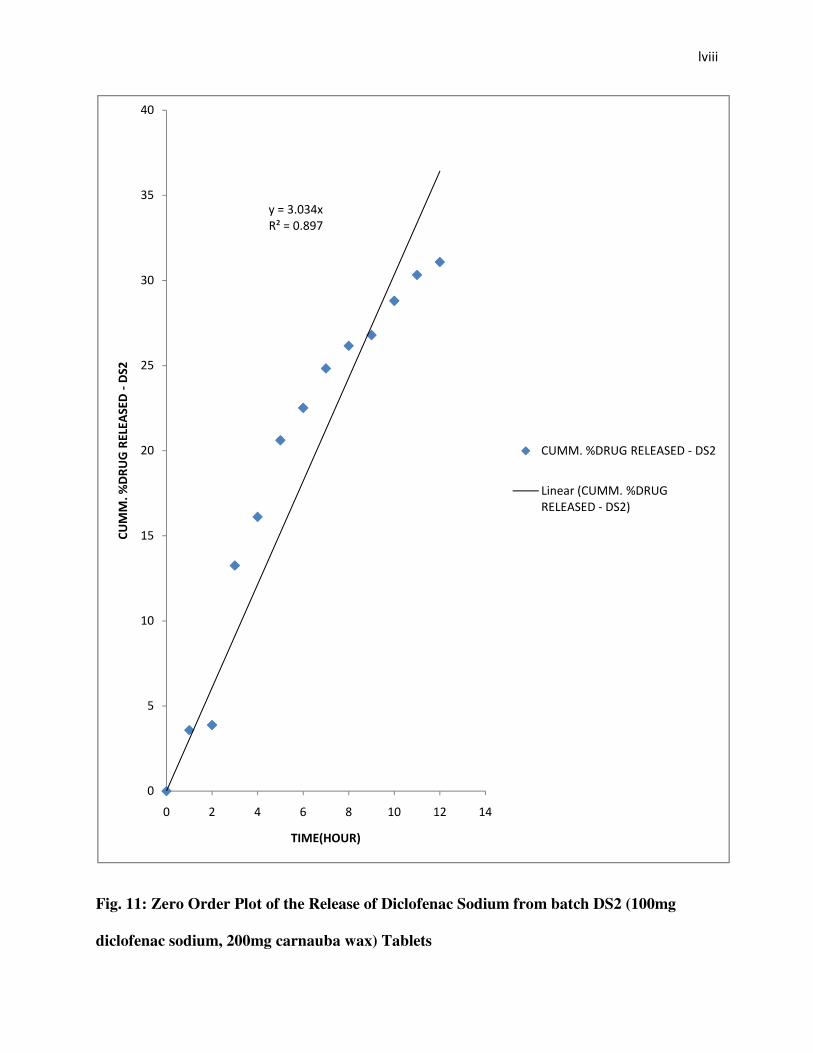
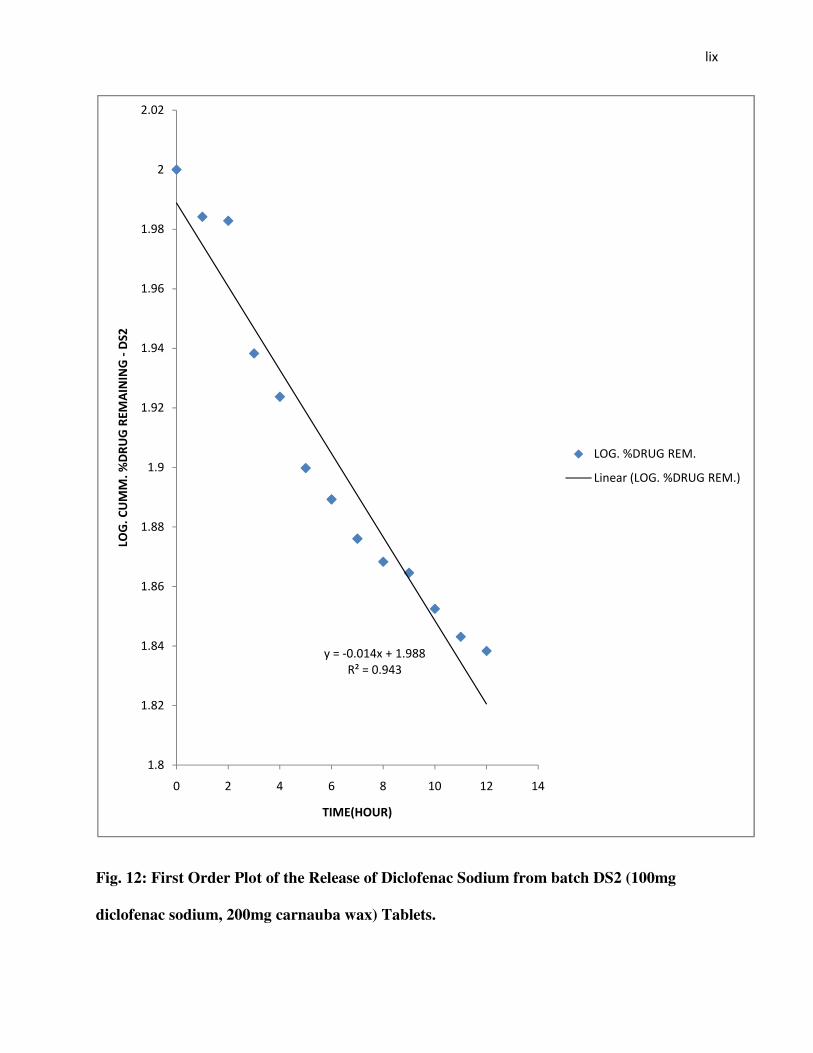
When the dissolution results were fitted into different release kinetic models as shown in fig.11 –
15, it was observed that Zero Order Kinetics, First Order Kinetics, Higuchi’s Square root Law
and Cuberoot Law were all in operation but First Order Kinetics was the most dominant. The
mechanism of drug release was determined by application of the Korsmeyer – Peppas equation
which gave an n – value of 0.953 and this is indicative of super case - II transport.

�����
�
�
������
�
�
Fig. 11: Zero Order Plot of the Release of Diclofenac Sodium from batch DS2 (100mg
diclofenac sodium, 200mg carnauba wax) Tablets
����+$(+!
&'���($-)*
(
#
%(
%#
"(
"#
+(
+#
!(
( " ! , - %( %" %!
�� !��"��#���$� ��"�("�
%& ��'� ���
��6 6 $�7 �&�8 �&030.0��4 �"
3�����1��6 6 $�7 �&�8 �
&030.0��4 �"2
�� �
�
�
Fig. 12: First Order Plot of the Release of Diclofenac Sodium from batch DS2 (100mg
diclofenac sodium, 200mg carnauba wax) Tablets.
����4($(%! �9�%$)--
&'���($)!+
%$-
%$-"
%$-!
%$-,
%$--
%$)
%$)"
%$)!
%$),
%$)-
"
"$("
( " ! , - %( %" %!
$�#!��� !��"��#��� &�&�#�("�
%& ��'� ���
3� 8$�7 �&�8 �&06 $
3�����13� 8$�7 �&�8 �&06 $2
� �
�
�
����-$**)
&'���($--#
(
#
%(
%#
"(
"#
+(
+#
( ($# % %$# " "$# + +$# !
�� !��"��#���$� ��"�("�
�) � ����� � %�� *�%& ���'� ���
7 �&�8 �&�
3�����17 �&�8 �&�2

� ��
�
�
Fig. 13: Higuchian Plot of the Release of Diclofenac Sodium from batch DS2 (100mg
diclofenac sodium, 200mg carnauba wax) Tablets.

� ���
�
�
Fig. 14: Korsmeyer – Peppas Plot of the Release of Diclofenac Sodium from batch DS2
(100mg diclofenac sodium, 200mg carnauba wax) Tablets
����($)#+ �9�($#!!
&'���($)(,
(
($"
($!
($,
($-
%
%$"
%$!
%$,
%$-
( ($" ($! ($, ($- % %$"
$�#!��� !��"��#���$� ��"�("�
$� # �%& ��'� ���
3� 8$�7 �&�8 �&�
3�����13� 8$�7 �&�8 �&�2

� ����
�
�
Fig. 15: Cuberoot Plot of the Release of Diclofenac Sodium from batch DS2 (100mg
diclofenac sodium, 200mg carnauba wax) Tablets.
����4($(() �9�($)-*
&'���($)""
($-,
($--
($)
($)"
($)!
($),
($)-
%
( " ! , - %( %" %!
��������%��*�"��#�*� �%&����� &�&�#�("�
%& ��'� ���
��/0�&� � :�� ;��&�8 �;&.$�&06 $
3�����1��/0�&� � :�� ;��&�8 �
;&.$�&06 $2
� ���
�
�
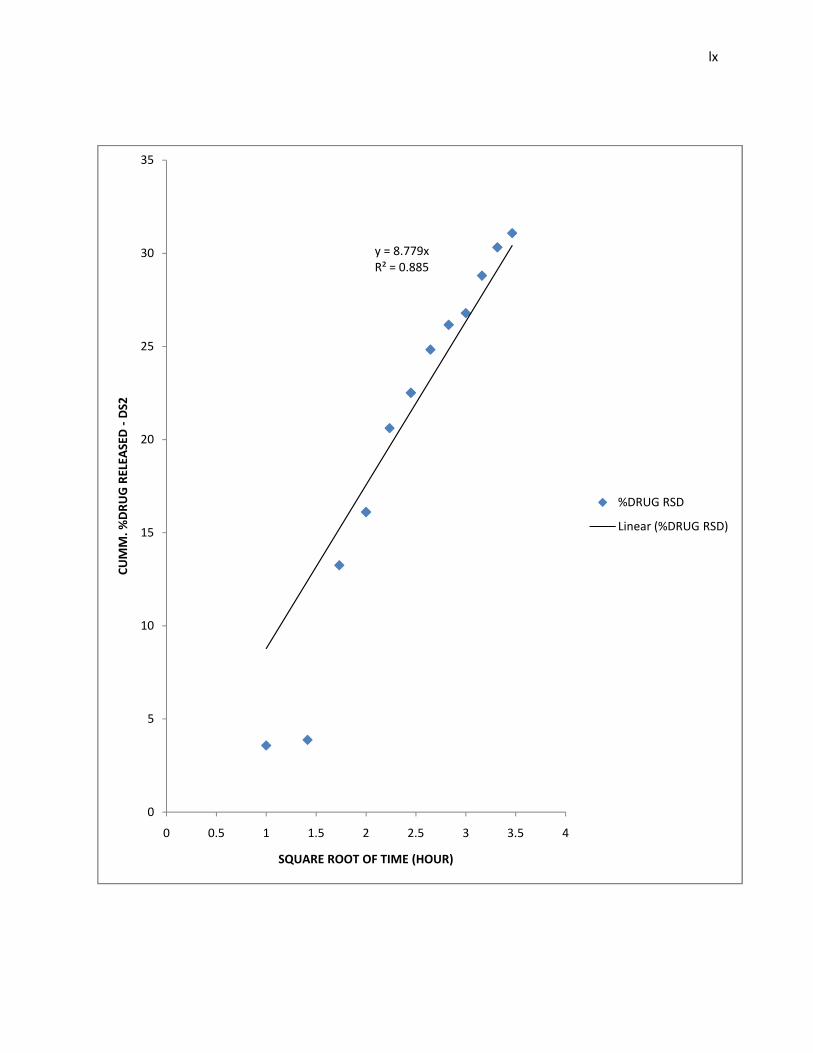
3.2.3: In Vitro Drug Release Characteristics of Diclofenac Sodium from batch DS2’
Tablets:
The in vitro drug release characteristics of Diclofenac sodium from batch DS2’ tablets are shown
in fig. 16 – 21.

� ��
�
�
Fig. 16: Sequential Release of Diclofenac Sodium from batch DS2’ (100mg diclofenac
sodium, 200mg carnauba wax) Tablets
4%(
(
%(
"(
+(
!(
#(
,(
*(
( " ! , - %( %" %!
�� !��"��#���$� ��"�("�+
%& ��'� ���
�"5�.
�"5/
�"5�
� ���
�
�
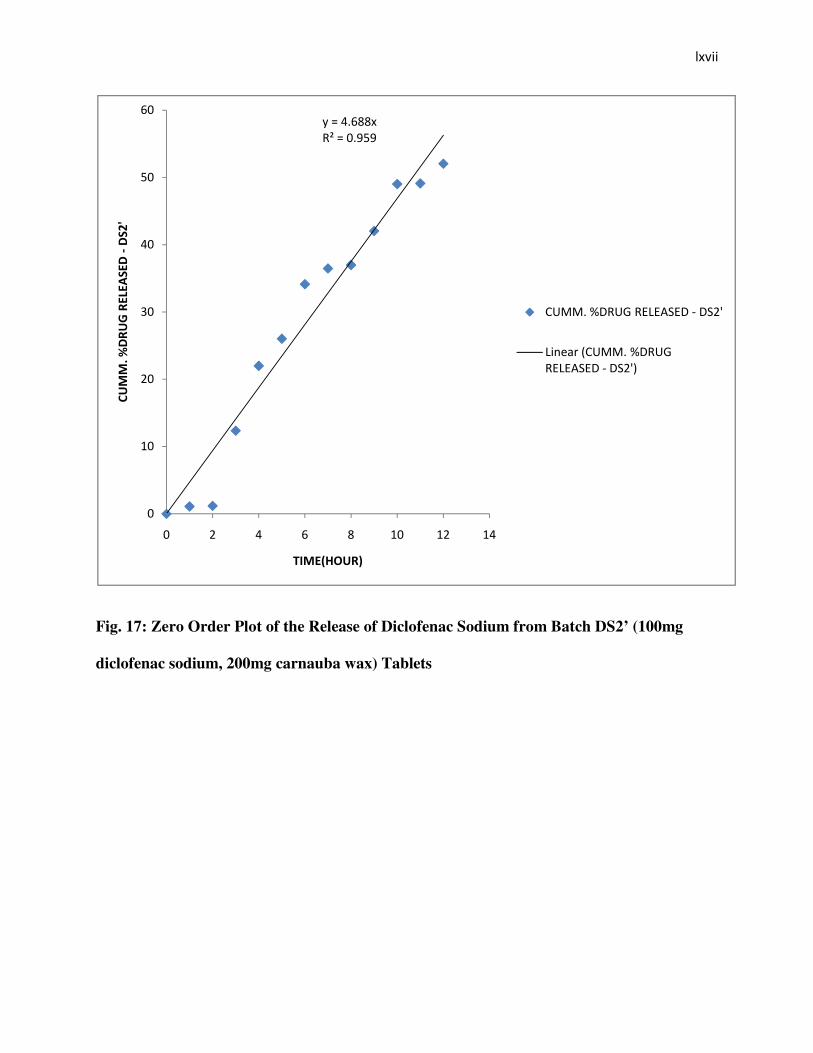
From fig. 16 above, it showed that the plot was almost a straight line indicating a controlled
release process. The drug release profile of 1.18 ± 0.00% within the first 2 hours showed good
drug release retardation by the matrix system at acidic pH.
The drug release of 12.35 ± 0.01% and 52.03 ± 0.00% after 1 hour and 10 hours respectively in
simulated intestinal fluid showed appreciable release when compared to batch DS1.
When the dissolution results were fitted into different release kinetic models as shown in fig.17 –
21, it was observed that Zero Order Kinetics, First Order Kinetics, Higuchi’s Square root Law
and Cuberoot Law were all in operation but First Order Kinetics was the most dominant. The
mechanism of drug release was determined by application of the Korsmeyer – Peppas equation
which gave an n – value of 1.704 and this is indicative of super case - II transport.
� ����
�
�
Fig. 17: Zero Order Plot of the Release of Diclofenac Sodium from Batch DS2’ (100mg
diclofenac sodium, 200mg carnauba wax) Tablets
����!$,--
&'���($)#)
(
%(
"(
+(
!(
#(
,(
( " ! , - %( %" %!
�� !��"��#���$� ��"�("�+
%& ��'� ���
��6 6 $�7 �&�8 �&030.0��4 �"5
3�����1��6 6 $�7 �&�8 �
&030.0��4 �"52

� �����
�
�
Fig. 18: First Order Plot of the Release of Diclofenac Sodium from batch DS2’ (100mg
diclofenac sodium, 200mg carnauba wax) Tablets.
����4($(") �9�"$(%-
&'���($)*-
(
($#
%
%$#
"
"$#
( " ! , - %( %" %!
$�#!��� !��"��#��� &�&�#�("�+
%& ��'� ���
3� 8$�7 ��&�8 �&06 .����8
3�����13� 8$�7 ��&�8 �
&06 .����82

� � �
�
�
Fig. 19: Higuchian Plot of the Release of Diclofenac Sodium from Batch DS2’ (100mg
diclofenac sodium, 200mg carnauba wax) Tablets
����%+$"*
&'���($*)+
(
%(
"(
+(
!(
#(
,(
( ($# % %$# " "$# + +$# !
�� !��"��#���$� ��"�("�+
�) � ����� � %�� *�%& ��'� ���
7 �&�8 �&�
3�����17 �&�8 �&�2
� �
�
�
Fig. 20: Korsmeyer – Peppas Plot of the Release of Diclofenac Sodium from batch DS2’
(100mg diclofenac sodium, 200mg carnauba wax) Tablets
����%$*(! �9�($(!#
&'���($-**
(
($"
($!
($,
($-
%
%$"
%$!
%$,
%$-
"
( ($" ($! ($, ($- % %$"
$�#!��� !��"��#���$� ��"�("�+
$� #!�%& ��'� ���
3� 8 �7 �&�8 �&�
3�����13� 8 �7 �&�8 �&�2

� ��
�
�

� ���
�
�
Fig. 21: Cuberoot Plot of the Release of Diclofenac Sodium from Batch DS2’ (100mg
diclofenac sodium, 200mg carnauba wax) Tablets
����4($("( �9�%$(%+
&'���($)*(
(
($"
($!
($,
($-
%
%$"
( # %( %#
��������%��*�"��#�*� �%&����� &�&�#�("�+
%& ��'� ���
��/0�&� � :�;&.��&06
3�����1��/0�&� � :�;&.��&06 2

� ����
�
�
3.2.4: In Vitro Drug Release Characteristics of Diclofenac Sodium from Formulation DS3
Tablets:
The in vitro drug release characteristics of Diclofenac sodium from batch DS3 tablets are shown
in fig. 22 – 27.
4"(
(
"(
!(
,(
-(
%((
%"(
( " ! , - %( %" %!
�� !��"��#���$� ��"�("�,
%& ��'� ���
�+.
�+/
�+�

� ���
�
�
Fig. 22: Sequential Release of Diclofenac Sodium from batch DS3 (100mg diclofenac
sodium, 100mg carnauba wax) Tablets.
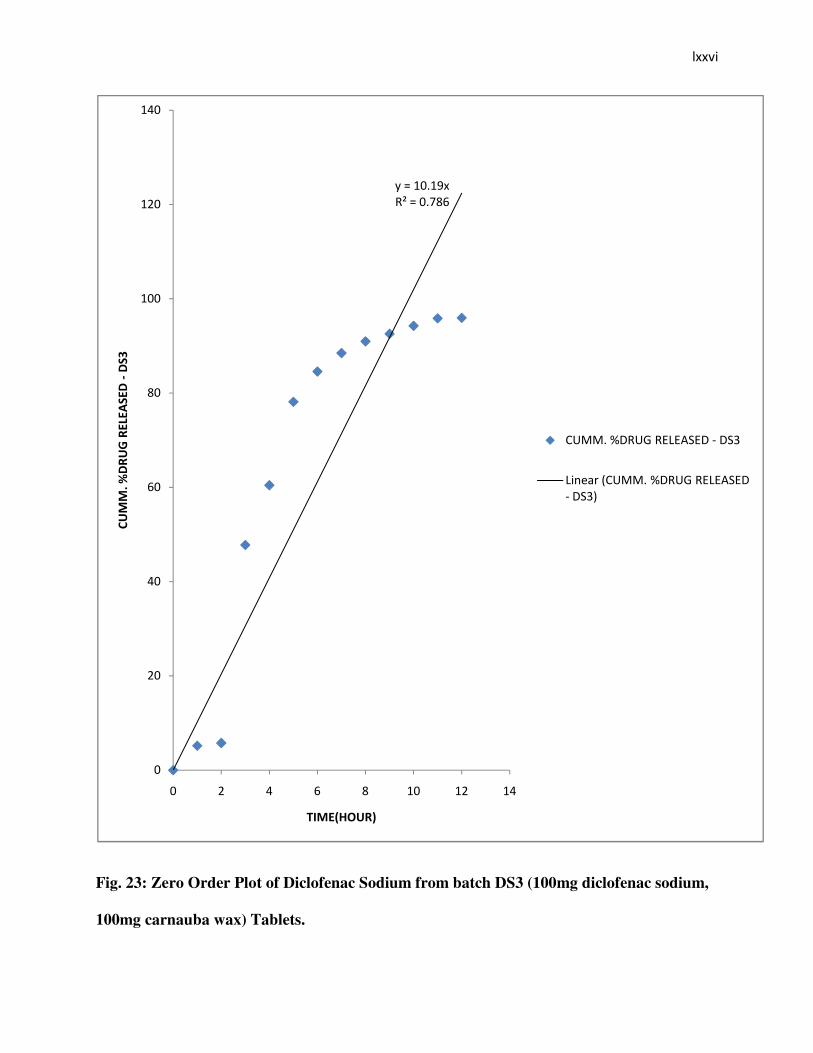
From fig. 22 above, it showed that only 5.76 ±0.05% of Diclofenac Sodium was released from
batch DS3 tablets after 2 hours in the simulated gastric fluid. The drug release retardation effect
of the matrix system may be as a result of poor solubility of the drug at acidic pH. A total of
47.77 ± 0.07%, 88.48 ± 0.55% and 95.94 ± 0.31% of Diclofenac Sodium were released after 1
hour, 5 hours and 10 hours respectively in simulated intestinal fluid (phosphate buffer pH. 6.8)
from formulation DS3 tablets. This showed that about 88.48 ± 0.55% and 95.0.31% of drug were
released after a total of 7 hours and 12 hours respectively and that the drug release retardation
effect of the matrix system (25% carnauba wax) in batch DS3 was weak.
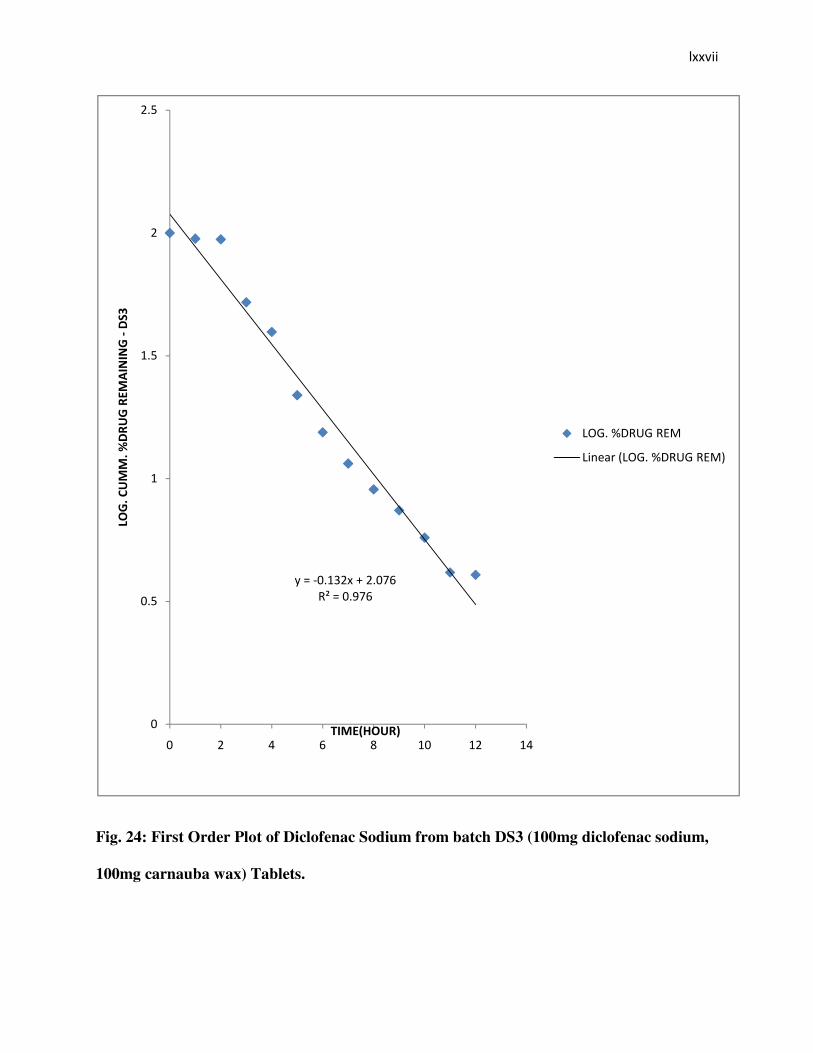
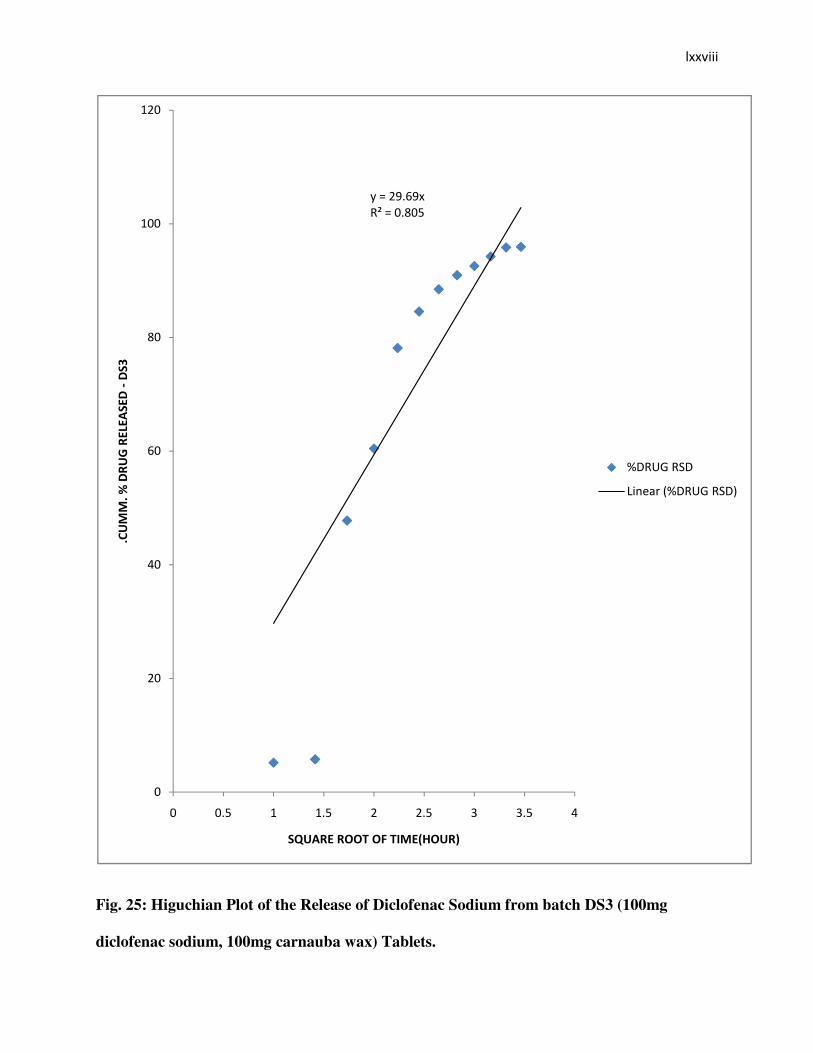
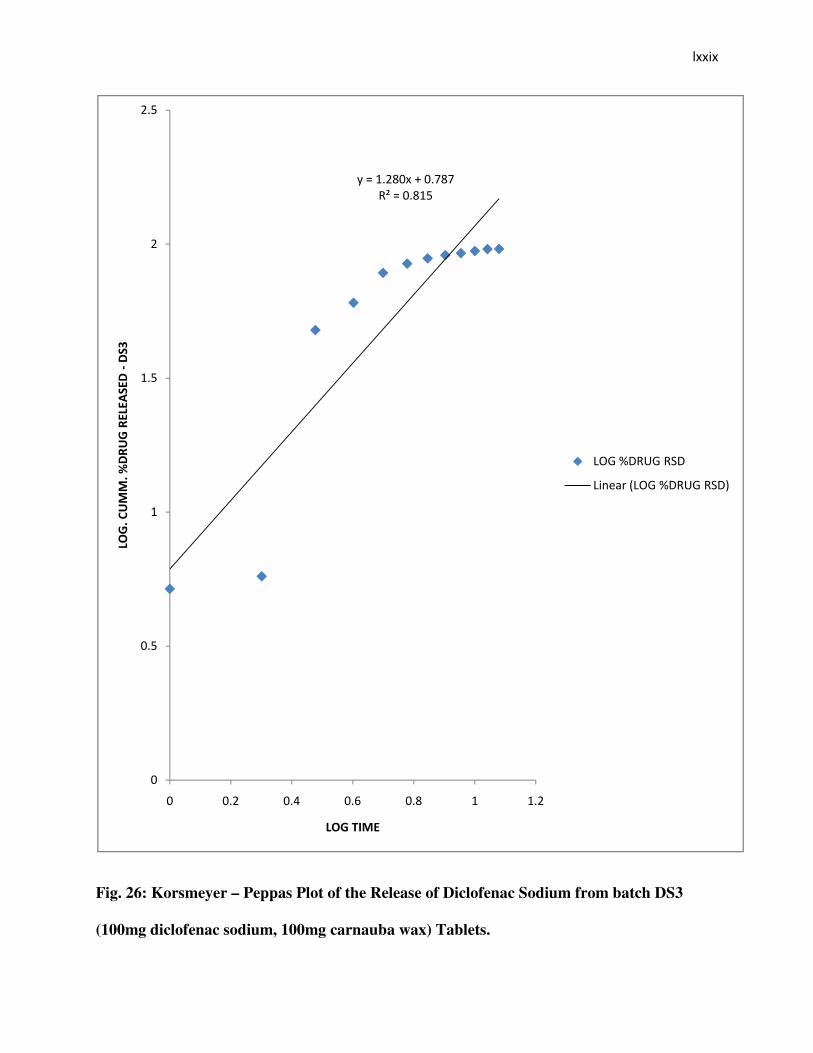
When the dissolution results were fitted into different release kinetic models as shown in fig. 23
– 27 below, it appeared that all the kinetic models, Zero Order, First Order, Higuchi’s Square
root Law and Hixson – Crowell’s Cube root Law were in operation but the First Order Kinetics
Model appeared the most dominant. The mechanism of drug release was determined by the
application of Korsmeyer – Peppas equation; which gave an n – value of 1.280 indicating that
the drug release is by Super Case – II transport.

� ��
�
�
� ���
�
�
Fig. 23: Zero Order Plot of Diclofenac Sodium from batch DS3 (100mg diclofenac sodium,
100mg carnauba wax) Tablets.
����%($%)
&'���($*-,
(
"(
!(
,(
-(
%((
%"(
%!(
( " ! , - %( %" %!
�� !��"��#���$� ��"�("�,
%& ��'� ���
��6 6 $�7 �&�8 �&030.0��4 �+
3�����1��6 6 $�7 �&�8 �&030.0��
4 �+2
� ����
�
�
Fig. 24: First Order Plot of Diclofenac Sodium from batch DS3 (100mg diclofenac sodium,
100mg carnauba wax) Tablets.
����4($%+" �9�"$(*,
&'���($)*,
(
($#
%
%$#
"
"$#
( " ! , - %( %" %!
$�#!��� !��"��#��� &�&�#�("�,
%& ��'� ���
3� 8$�7 �&�8 �&06
3�����13� 8$�7 �&�8 �&06 2
� �����
�
�
Fig. 25: Higuchian Plot of the Release of Diclofenac Sodium from batch DS3 (100mg
diclofenac sodium, 100mg carnauba wax) Tablets.
����")$,)
&'���($-(#
(
"(
!(
,(
-(
%((
%"(
( ($# % %$# " "$# + +$# !
!�� !���"��#���$� ��"�("�,
�) � ����� � %�� *�%& ��'� ���
7 �&�8 �&�
3�����17 �&�8 �&�2
� � �
�
�
Fig. 26: Korsmeyer – Peppas Plot of the Release of Diclofenac Sodium from batch DS3
(100mg diclofenac sodium, 100mg carnauba wax) Tablets.
����%$"-( �9�($*-*
&'���($-%#
(
($#
%
%$#
"
"$#
( ($" ($! ($, ($- % %$"
$�#!��� !��"��#���$� ��"�("�,
$� # �%& �
3� 8 �7 �&�8 �&�
3�����13� 8 �7 �&�8 �&�2
� �
�
�
����4($(," �9�($))"
&'���($)"%
(
($"
($!
($,
($-
%
%$"
( " ! , - %( %" %!
��������%��*�"��#�*� �%&����� &�&�#�("�,
%& ��'� ���
��/0�&� � :�� ;�&�8 �;&.�:�� � �
&06 .����8
3�����1��/0�&� � :�� ;�&�8 �
;&.�:�� � �&06 .����82
� ��
�
�
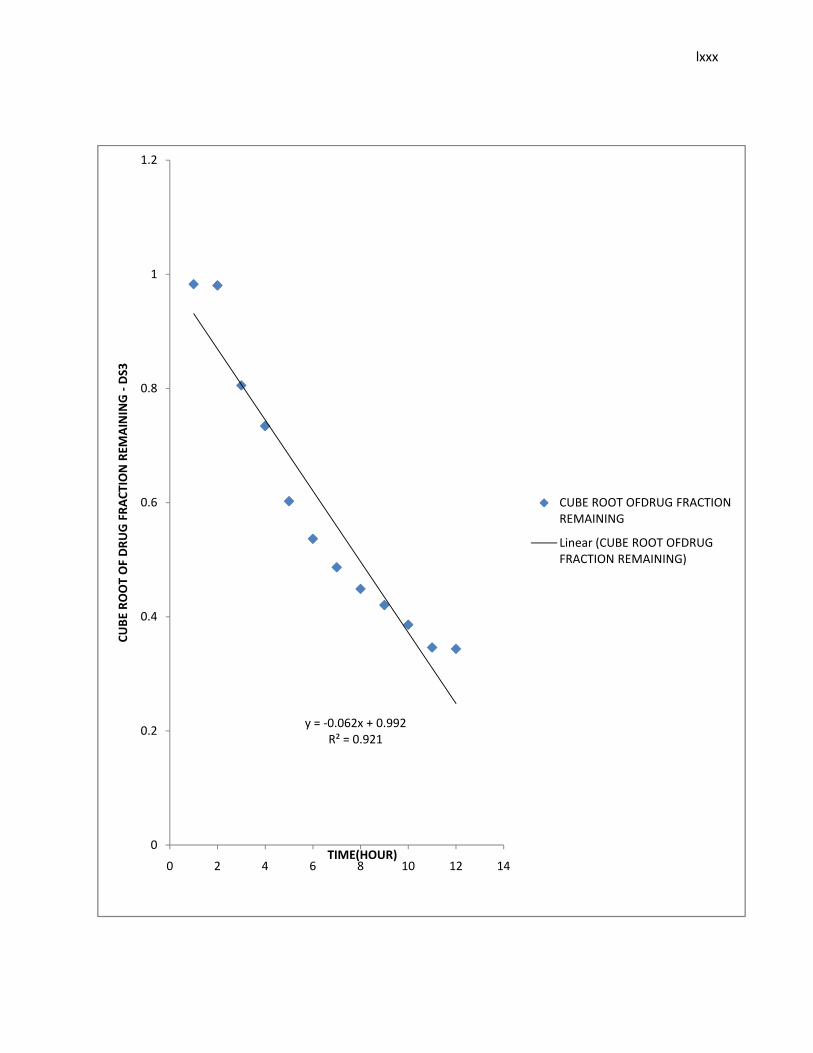
Fig. 27: Cuberoot Plot of the Release of Diclofenac Sodium from batch DS3 (100mg
diclofenac sodium, 100mg carnauba wax) Tablets.
3.2.5: In Vitro Drug Release Characteristics of Diclofenac Sodium from Formulation DS4
Tablets:
The in vitro drug release characteristics of Diclofenac sodium from formulations DS4 tablets are
shown in fig. 28 – 33.
� ���
�
�
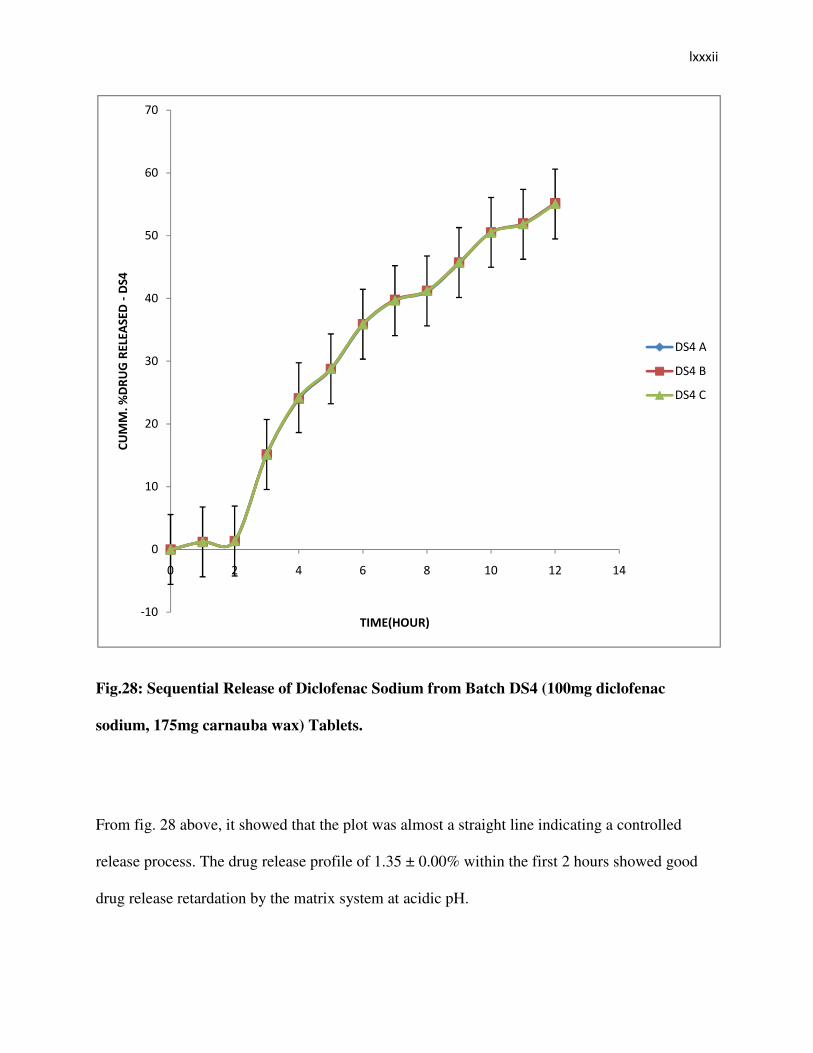
Fig.28: Sequential Release of Diclofenac Sodium from Batch DS4 (100mg diclofenac
sodium, 175mg carnauba wax) Tablets.
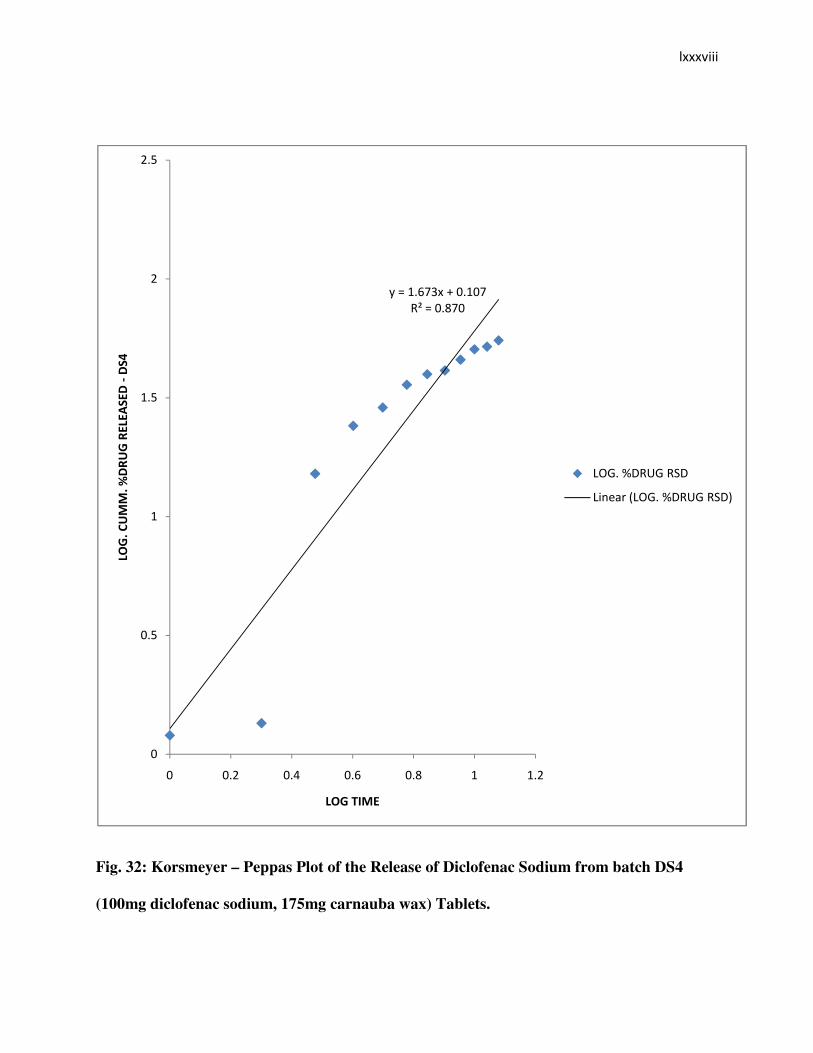
From fig. 28 above, it showed that the plot was almost a straight line indicating a controlled
release process. The drug release profile of 1.35 ± 0.00% within the first 2 hours showed good
drug release retardation by the matrix system at acidic pH.
4%(
(
%(
"(
+(
!(
#(
,(
*(
( " ! , - %( %" %!
�� !��"��#���$� ��"�("�-
%& ��'� ���
�!�.
�!�/
�!��
� ����
�
�
The drug release of 15.14 ± 0.00% and 55.09 ± 0.08% after 1 hour and 10 hours respectively in
simulated intestinal fluid showed appreciable release when compared to batch DS1.
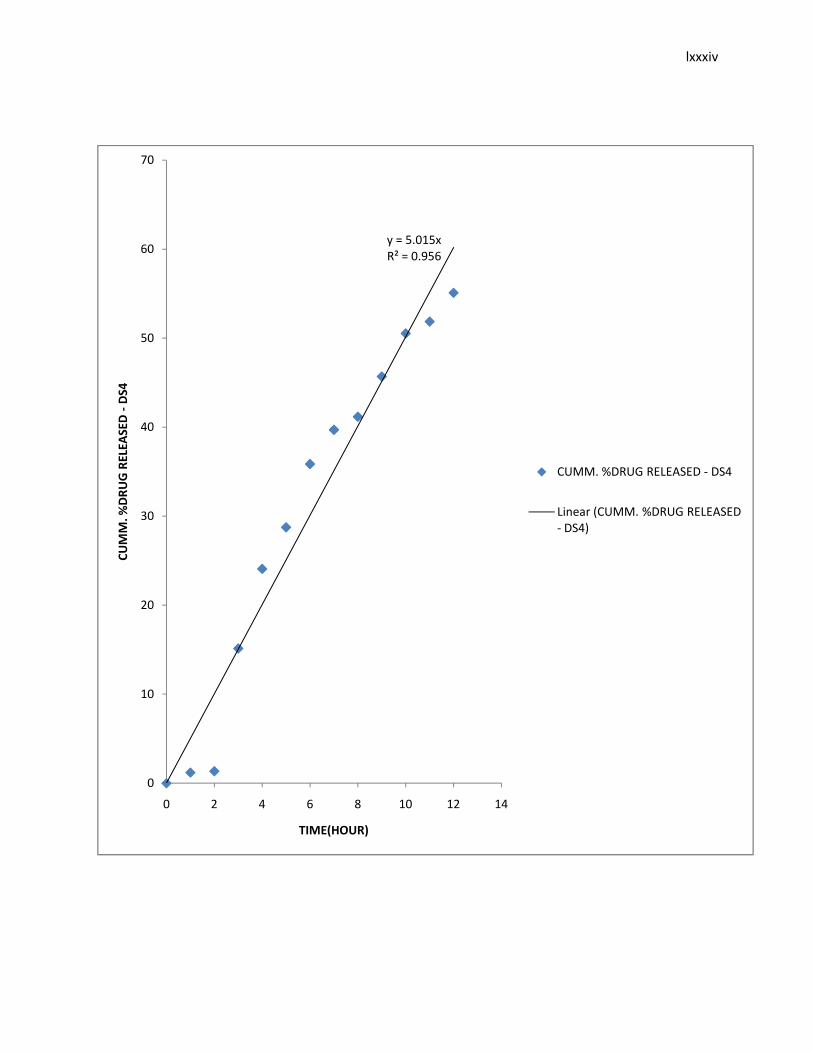
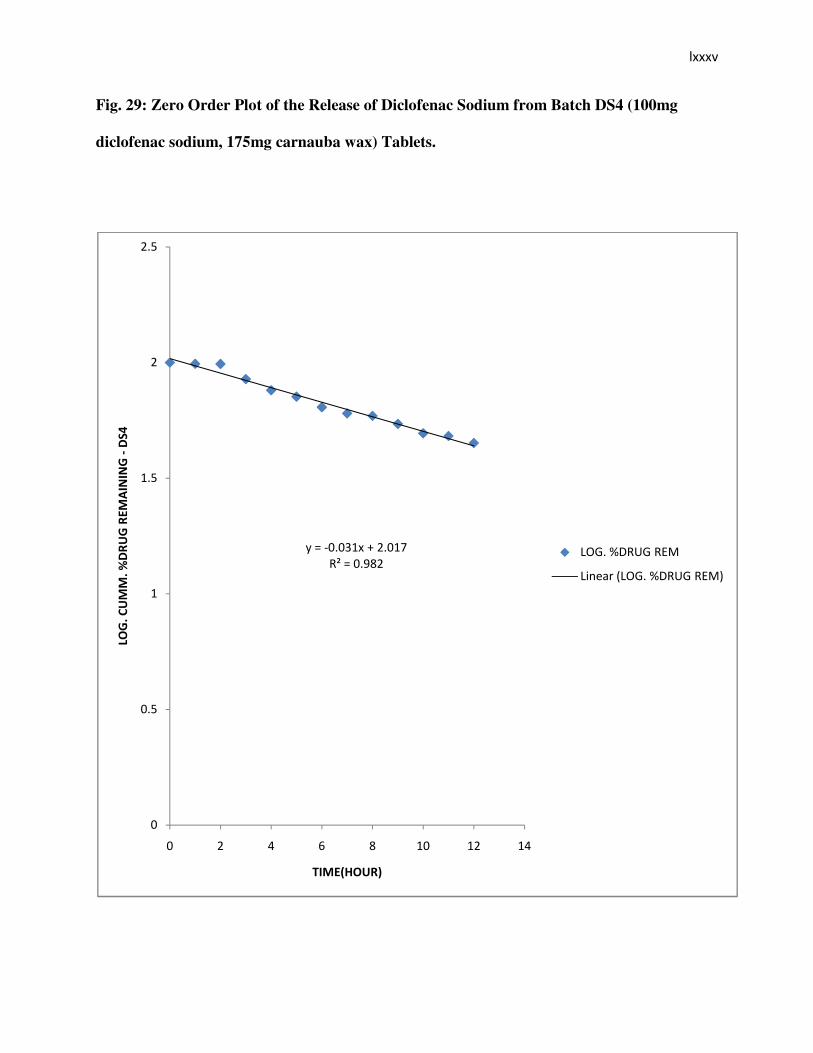
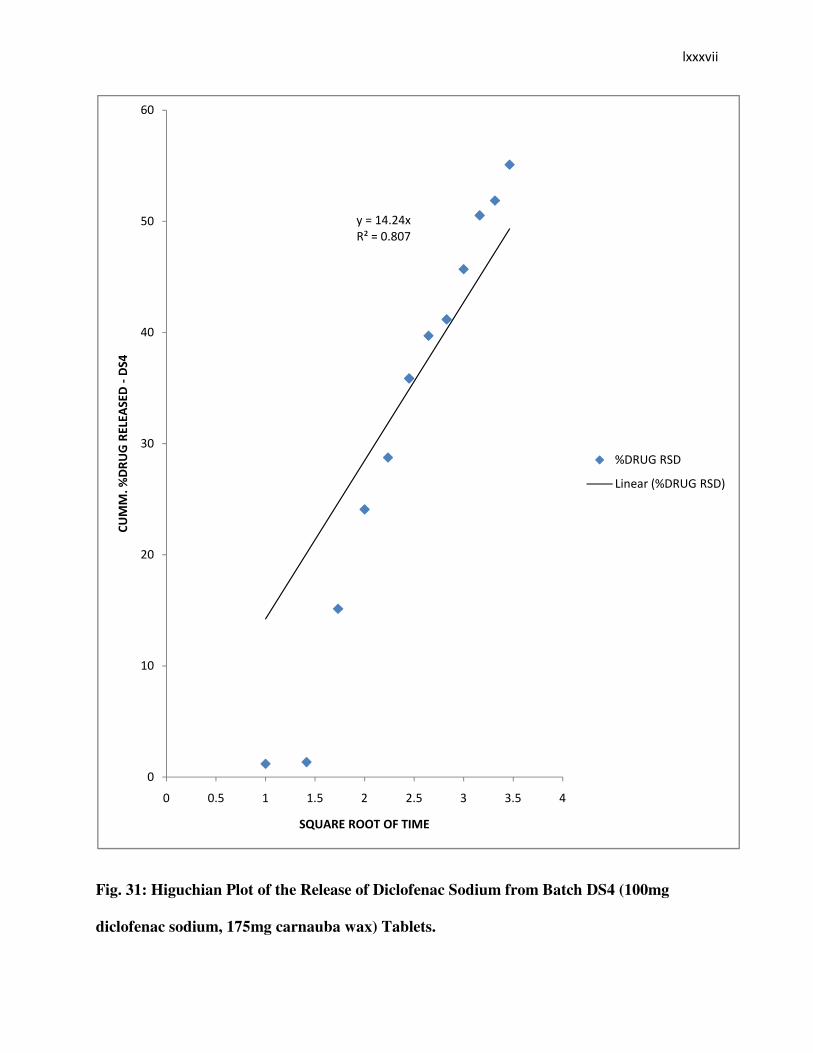
When the dissolution results were fitted into different release kinetic models as shown in fig.29 –
33, it was observed that Zero Order Kinetics, First Order Kinetics, Higuchi’s Square root Law
and Cuberoot Law were all in operation but First Order Kinetics was the most dominant. The
mechanism of drug release was determined by application of the Korsmeyer – Peppas equation
which gave an n – value of 1.673 and this is indicative of super case - II transport.
� ���
�
�
����#$(%#
&'���($)#,
(
%(
"(
+(
!(
#(
,(
*(
( " ! , - %( %" %!
�� !��"��#���$� ��"�("�-
%& ��'� ���
��6 6 $�7 �&�8 �&030.0��4 �!
3�����1��6 6 $�7 �&�8 �&030.0��
4 �!2
� ��
�
�
Fig. 29: Zero Order Plot of the Release of Diclofenac Sodium from Batch DS4 (100mg
diclofenac sodium, 175mg carnauba wax) Tablets.
����4($(+% �9�"$(%*
&'���($)-"
(
($#
%
%$#
"
"$#
( " ! , - %( %" %!
$�#!��� !��"��#��� &�&�#�("�-
%& ��'� ���
3� 8$�7 �&�8 �&06
3�����13� 8$�7 �&�8 �&06 2

� ���
�
�
Fig. 30: First Order Plot of the Release of Diclofenac Sodium from batch DS4 (100mg
diclofenac sodium, 175mg carnauba wax) Tablets.
� ����
�
�
Fig. 31: Higuchian Plot of the Release of Diclofenac Sodium from Batch DS4 (100mg
diclofenac sodium, 175mg carnauba wax) Tablets.
����%!$"!
&'���($-(*
(
%(
"(
+(
!(
#(
,(
( ($# % %$# " "$# + +$# !
�� !��"��#���$� ��"�("�-
�) � ����� � %�� *�%& �
7 �&�8 �&�
3�����17 �&�8 �&�2
� �����
�
�
Fig. 32: Korsmeyer – Peppas Plot of the Release of Diclofenac Sodium from batch DS4
(100mg diclofenac sodium, 175mg carnauba wax) Tablets.
����%$,*+ �9�($%(*
&'���($-*(
(
($#
%
%$#
"
"$#
( ($" ($! ($, ($- % %$"
$�#!��� !��"��#���$� ��"�("�-
$� # �%& �
3� 8$�7 �&�8 �&�
3�����13� 8$�7 �&�8 �&�2
� � �
�
�
����4($("% �9�%$(%%
&'���($)*%
(
($"
($!
($,
($-
%
%$"
( " ! , - %( %" %!
��������%��*�"��#�*� �%&����� &�&�#�("�-
%& ��'� ���
��/0�&� � :�� ;��&�8 �;&.�$
3�����1��/0�&� � :�� ;��&�8 �
;&.�$2
<�
�
�
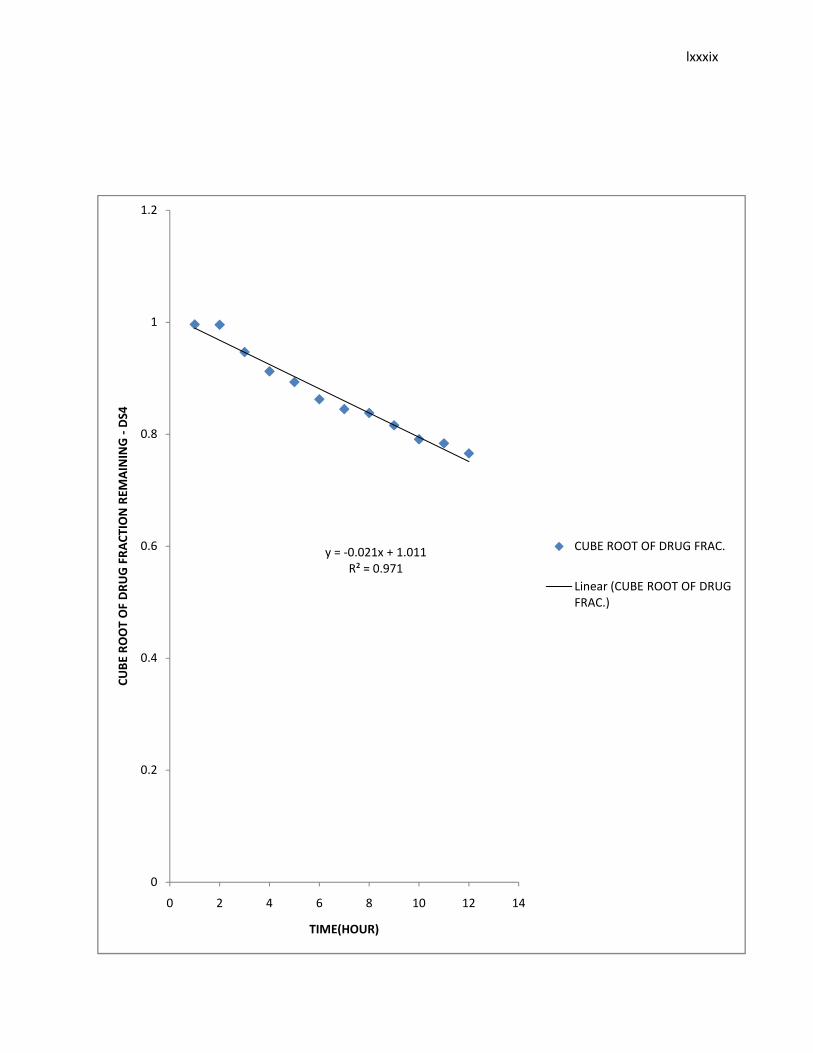
Fig. 33: Cuberoot Plot of the Release of Diclofenac Sodium from Batch DS4 (100mg
diclofenac sodium, 175mg carnauba wax) Tablets.
3.2.6: In Vitro Drug Release Characteristics of Diclofenac Sodium from batch DS5 Tablets:
The in vitro drug release characteristics of Diclofenac sodium from batch DS5 tablets are shown
in fig. 34 – 39.
<��
�
�
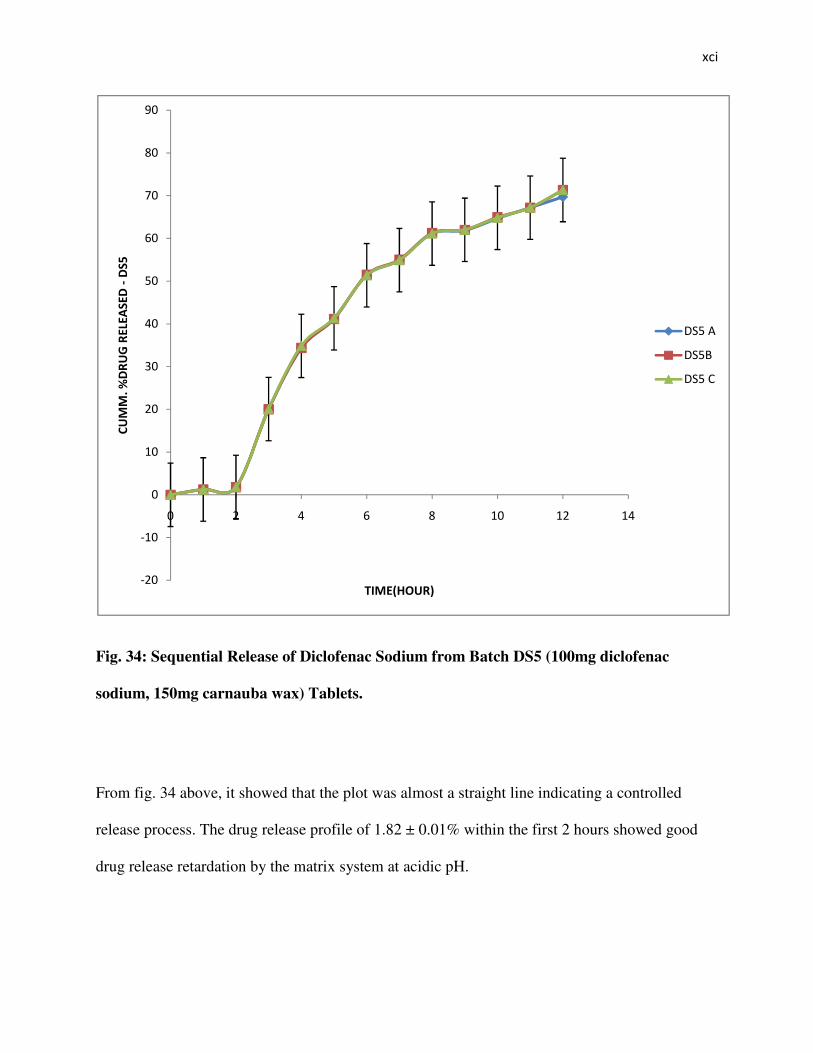
Fig. 34: Sequential Release of Diclofenac Sodium from Batch DS5 (100mg diclofenac
sodium, 150mg carnauba wax) Tablets.
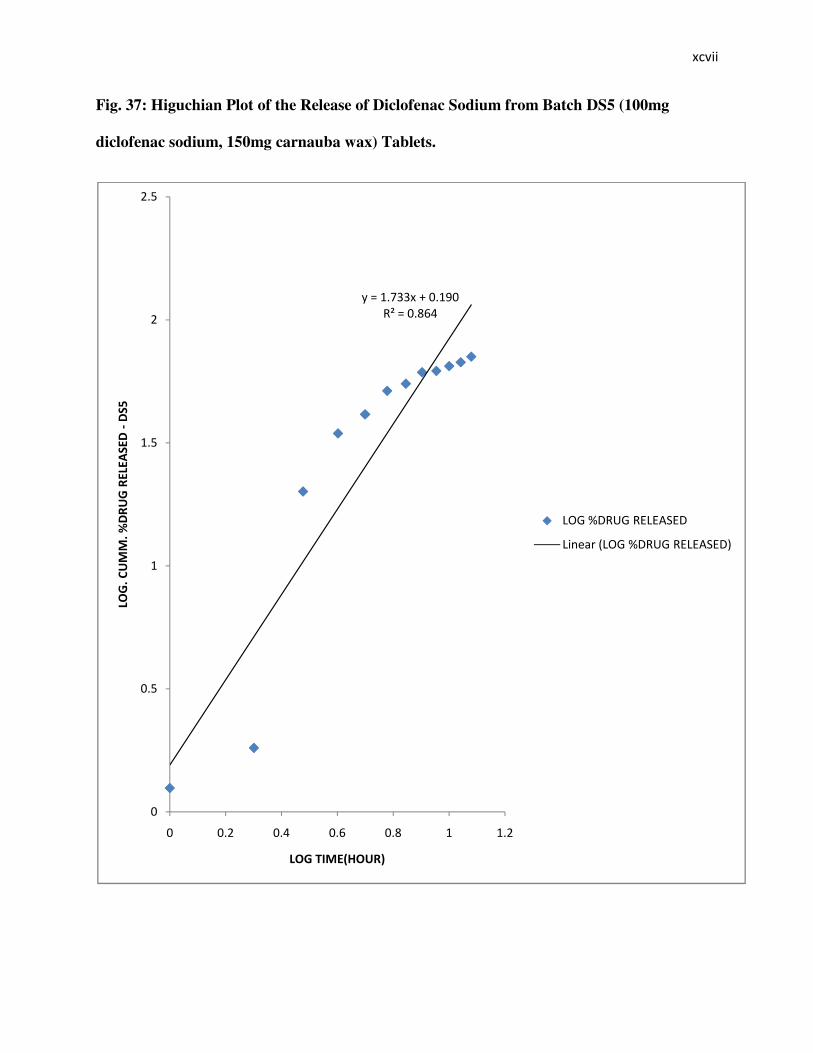
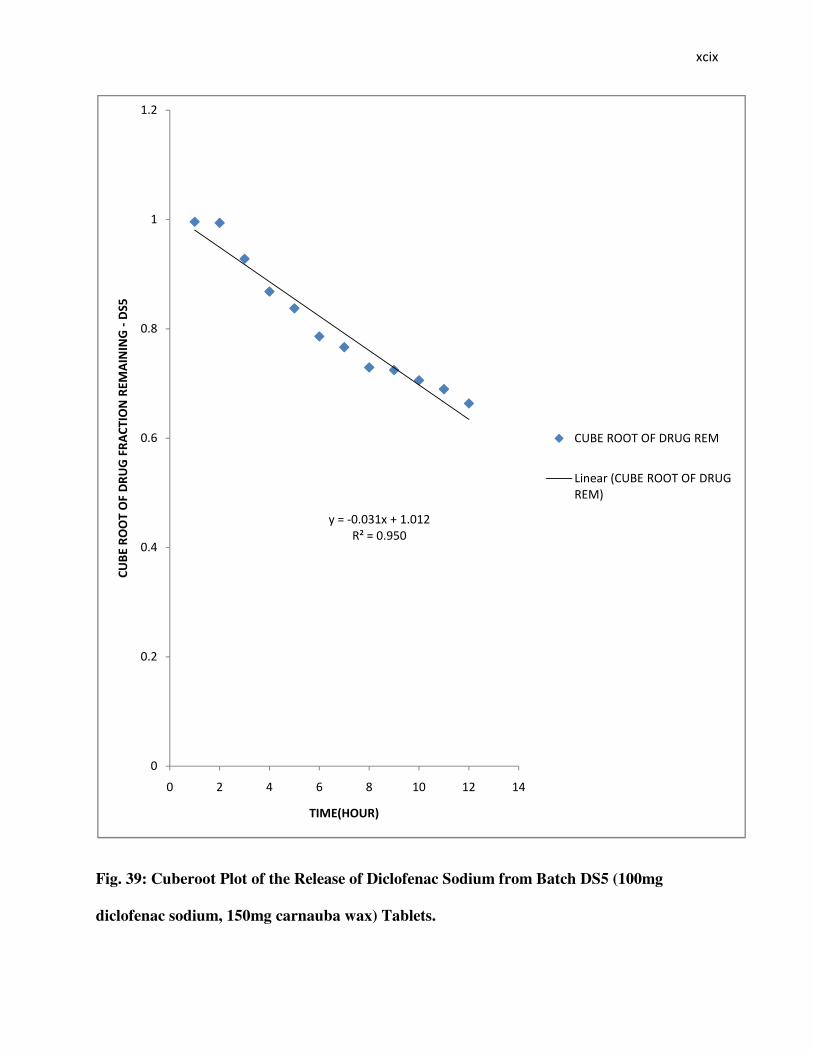
From fig. 34 above, it showed that the plot was almost a straight line indicating a controlled
release process. The drug release profile of 1.82 ± 0.01% within the first 2 hours showed good
drug release retardation by the matrix system at acidic pH.
4"(
4%(
(
%(
"(
+(
!(
#(
,(
*(
-(
)(
( " ! , - %( %" %!
�� !��"��#���$� ��"�("�.
%& ��'� ���
�#�.
�#/
�#��
<���
�
�
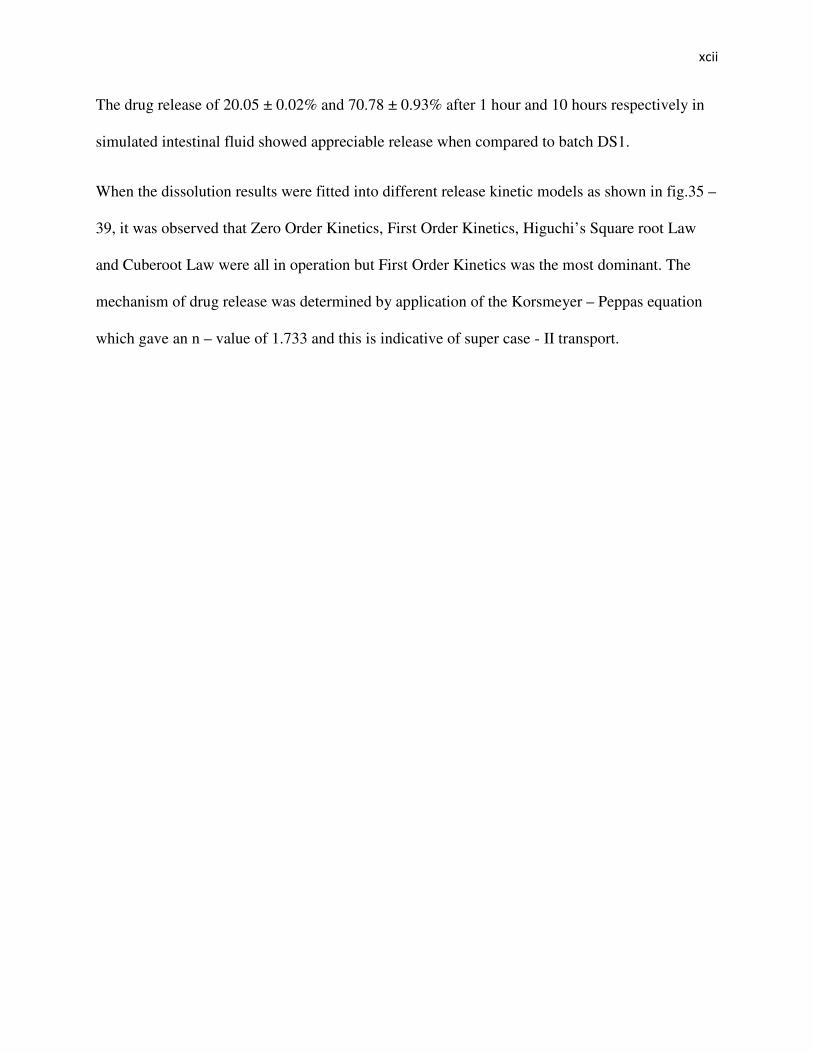
The drug release of 20.05 ± 0.02% and 70.78 ± 0.93% after 1 hour and 10 hours respectively in
simulated intestinal fluid showed appreciable release when compared to batch DS1.
When the dissolution results were fitted into different release kinetic models as shown in fig.35 –
39, it was observed that Zero Order Kinetics, First Order Kinetics, Higuchi’s Square root Law
and Cuberoot Law were all in operation but First Order Kinetics was the most dominant. The
mechanism of drug release was determined by application of the Korsmeyer – Peppas equation
which gave an n – value of 1.733 and this is indicative of super case - II transport.
<����
�
�
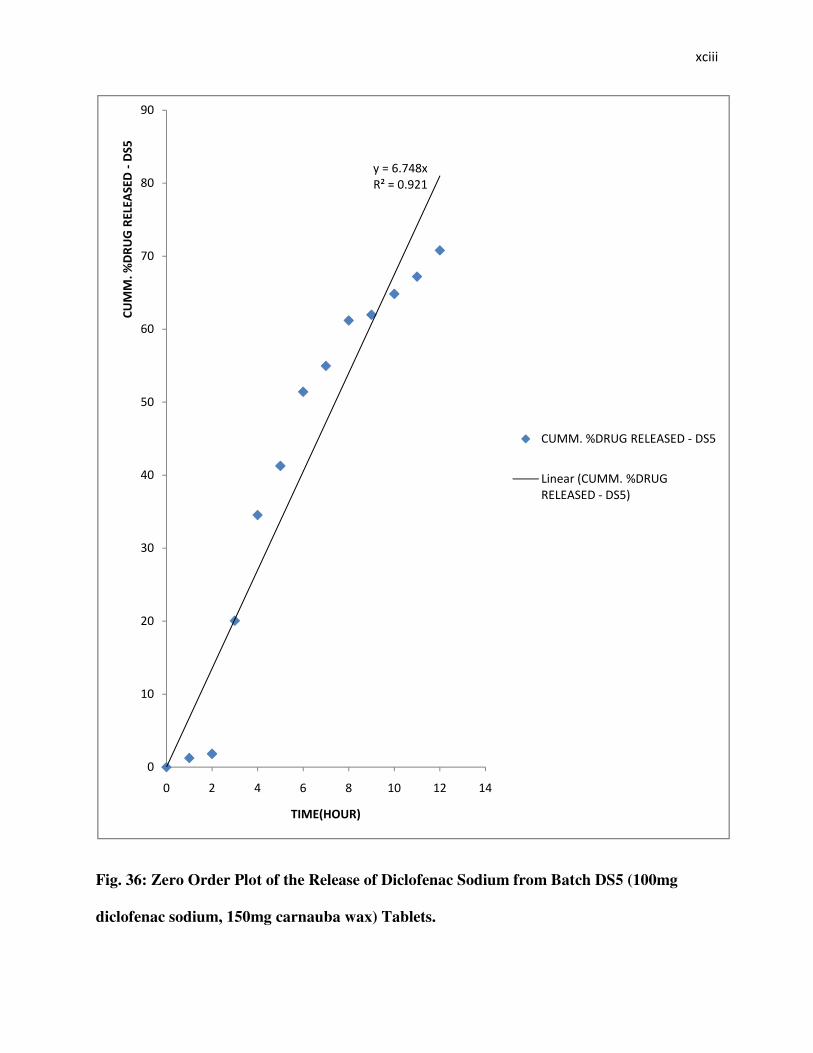
Fig. 36: Zero Order Plot of the Release of Diclofenac Sodium from Batch DS5 (100mg
diclofenac sodium, 150mg carnauba wax) Tablets.
����,$*!-
&'���($)"%
(
%(
"(
+(
!(
#(
,(
*(
-(
)(
( " ! , - %( %" %!
�� !��"��#���$� ��"�("�.
%& ��'� ���
��6 6 $�7 �&�8 �&030.0��4 �#
3�����1��6 6 $�7 �&�8 �
&030.0��4 �#2
<���
�
�
����4($(!) �9�"$("#
&'���($)*%
(
($#
%
%$#
"
"$#
( " ! , - %( %" %!
$�#!��� !��"��#��� &�&�#�("�.
%& ��'� ���
3� 8$�7 �&�8 �&06 $
3�����13� 8$�7 �&�8 �&06 $2

<��
�
�
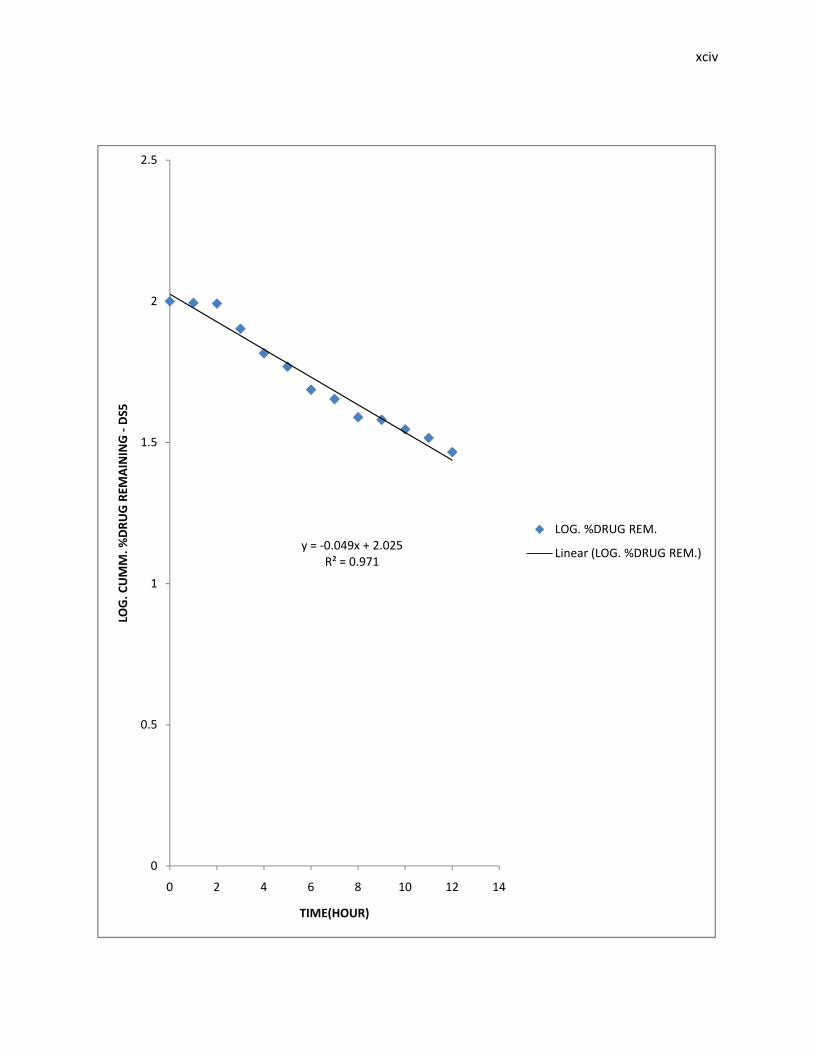
Fig. 36: First Order Plot of the Release of Diclofenac Sodium from batch DS5 (100mg
diclofenac sodium, 150mg carnauba wax) Tablet
<���
�
�
����%)$"*
&'���($-(,
(
%(
"(
+(
!(
#(
,(
*(
-(
( ($# % %$# " "$# + +$# !
�� !��"��#���$� ��"�("�.
�) � ����� � %�� *�%& ��'� ���
7 �&�8 �&�
3�����17 �&�8 �&�2
<����
�
�
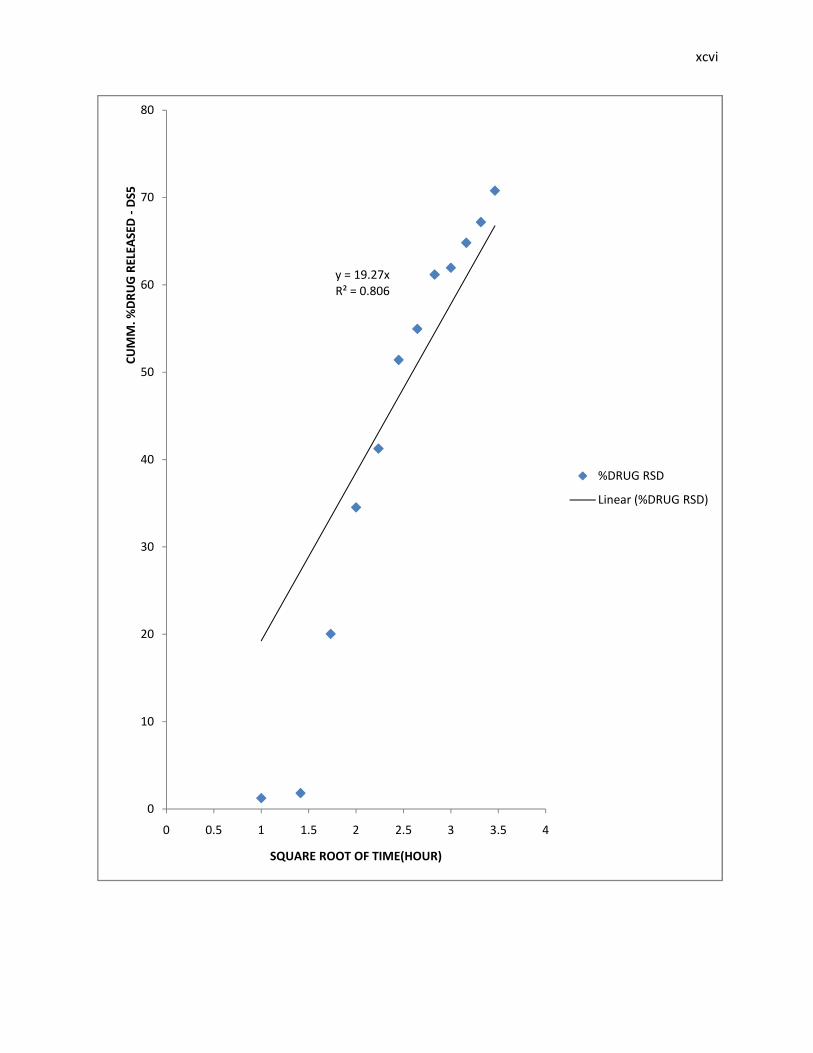
Fig. 37: Higuchian Plot of the Release of Diclofenac Sodium from Batch DS5 (100mg
diclofenac sodium, 150mg carnauba wax) Tablets.
����%$*++ �9�($%)(
&'���($-,!
(
($#
%
%$#
"
"$#
( ($" ($! ($, ($- % %$"
$�#!��� !��"��#���$� ��"�("�.
$� # �%& ��'� ���
3� 8 �7 �&�8 �&030.0�
3�����13� 8 �7 �&�8 �&030.0�2

<�����
�
�
Fig. 38: Korsmeyer – Peppas Plot of the Release of Diclofenac Sodium from batch DS5
(100mg diclofenac sodium, 150mg carnauba wax) Tablets.
<� �
�
�
Fig. 39: Cuberoot Plot of the Release of Diclofenac Sodium from Batch DS5 (100mg
diclofenac sodium, 150mg carnauba wax) Tablets.
����4($(+% �9�%$(%"
&'���($)#(
(
($"
($!
($,
($-
%
%$"
( " ! , - %( %" %!
��������%��*�"��#�*� �%&����� &�&�#�("�.
%& ��'� ���
��/0�&� � :�� ;��&�8 �&06
3�����1��/0�&� � :�� ;��&�8 �
&06 2

<�
�
�
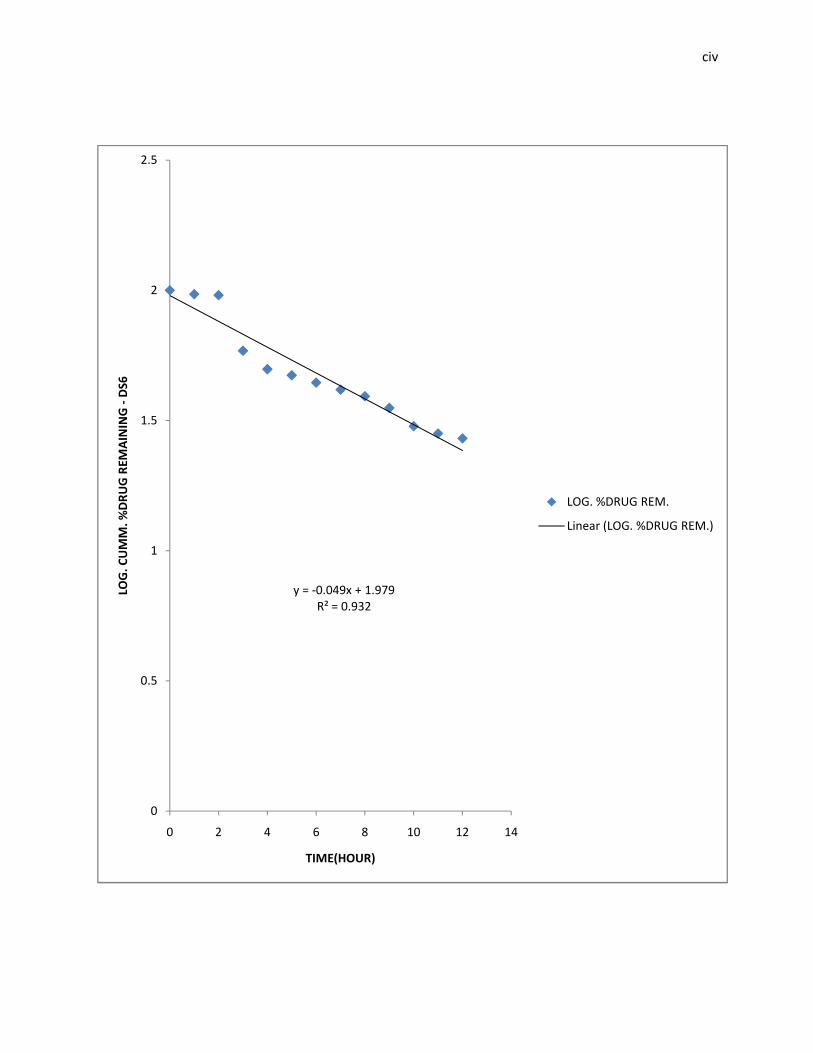
3.2.7: In Vitro Drug Release Characteristics of Diclofenac Sodium from batch DS6 Tablets:
The in vitro drug release characteristics of Diclofenac sodium from batch DS6 tablets are shown
in fig. 40 – 45.
4"(
4%(
(
%(
"(
+(
!(
#(
,(
*(
-(
)(
( " ! , - %( %" %!
�� !��"��#���$� ��"�("�/
%& ��'� ���
�,�.
�,�/
�,��
<��
�
�
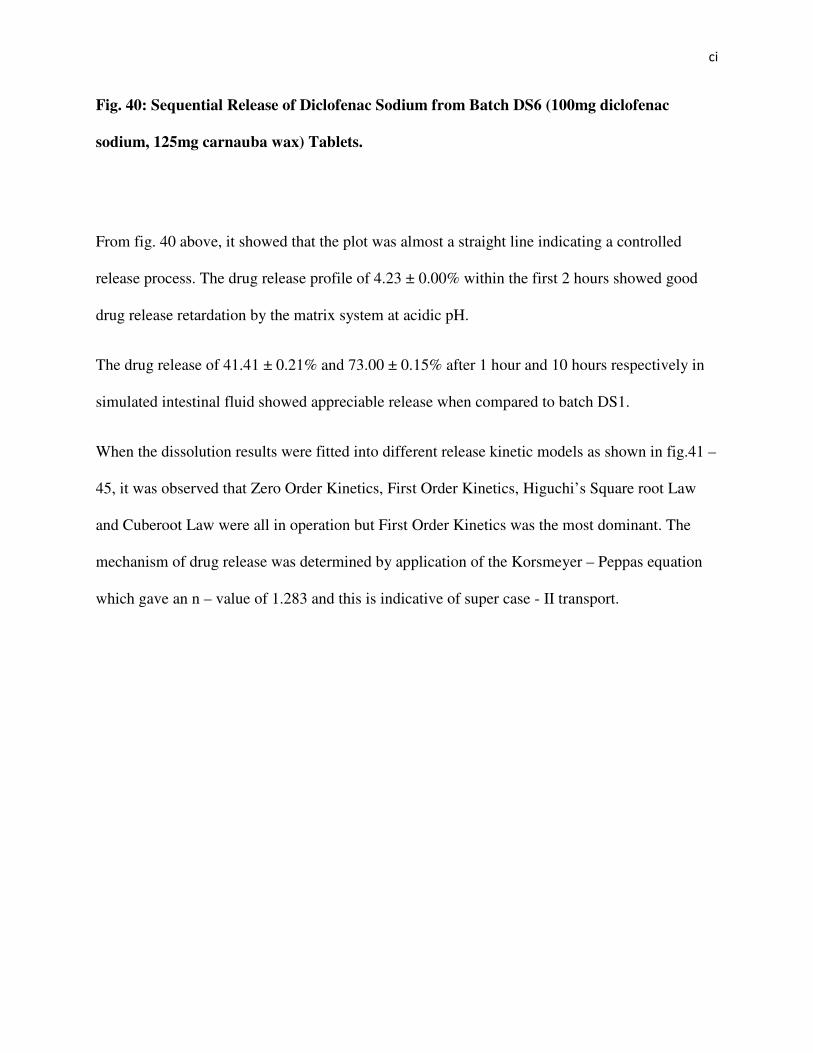
Fig. 40: Sequential Release of Diclofenac Sodium from Batch DS6 (100mg diclofenac
sodium, 125mg carnauba wax) Tablets.
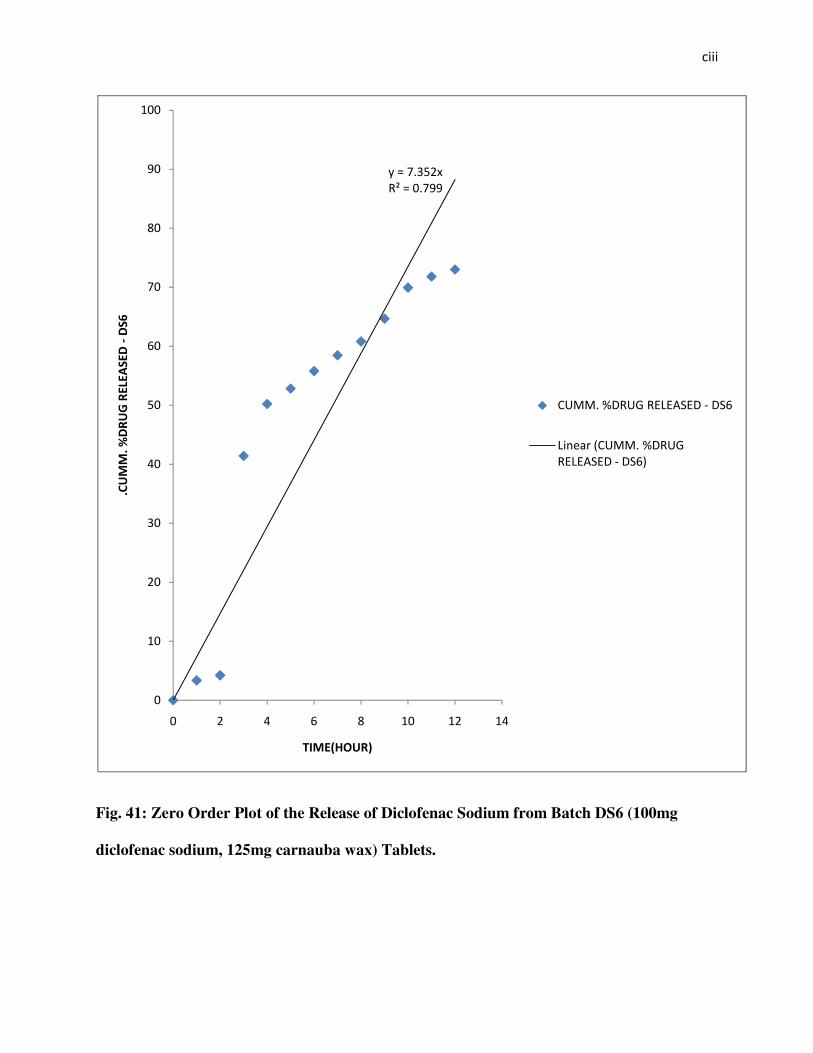
From fig. 40 above, it showed that the plot was almost a straight line indicating a controlled
release process. The drug release profile of 4.23 ± 0.00% within the first 2 hours showed good
drug release retardation by the matrix system at acidic pH.
The drug release of 41.41 ± 0.21% and 73.00 ± 0.15% after 1 hour and 10 hours respectively in
simulated intestinal fluid showed appreciable release when compared to batch DS1.
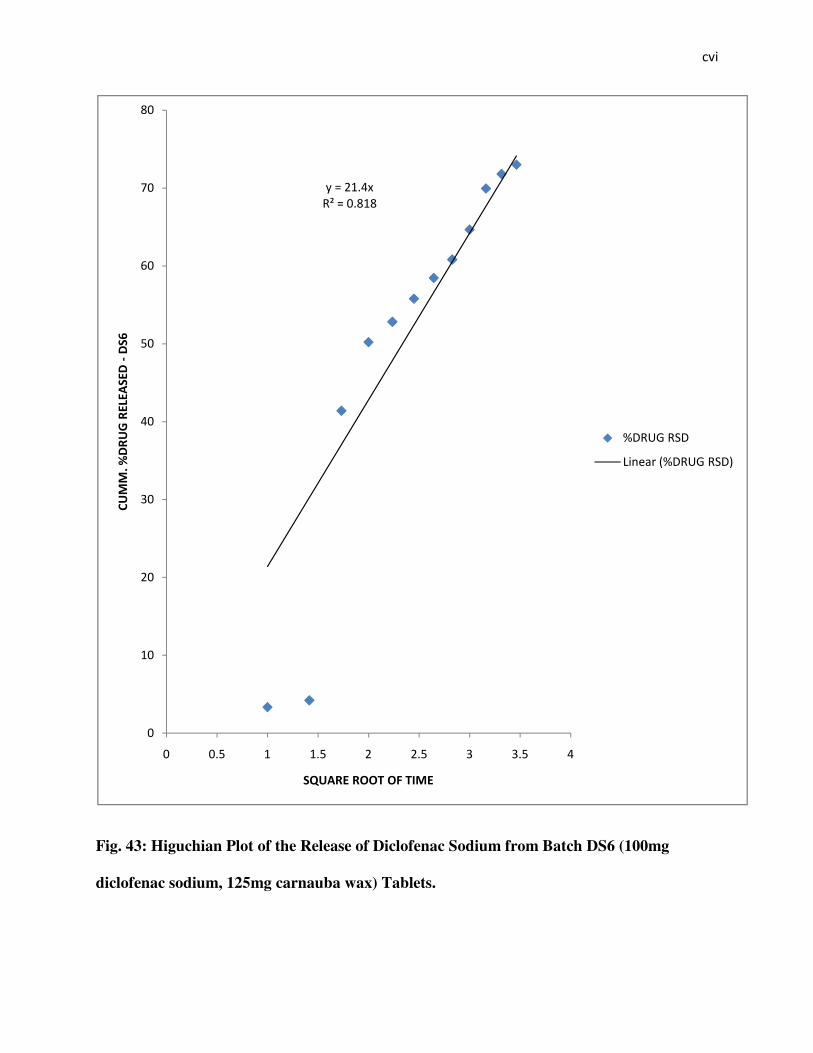
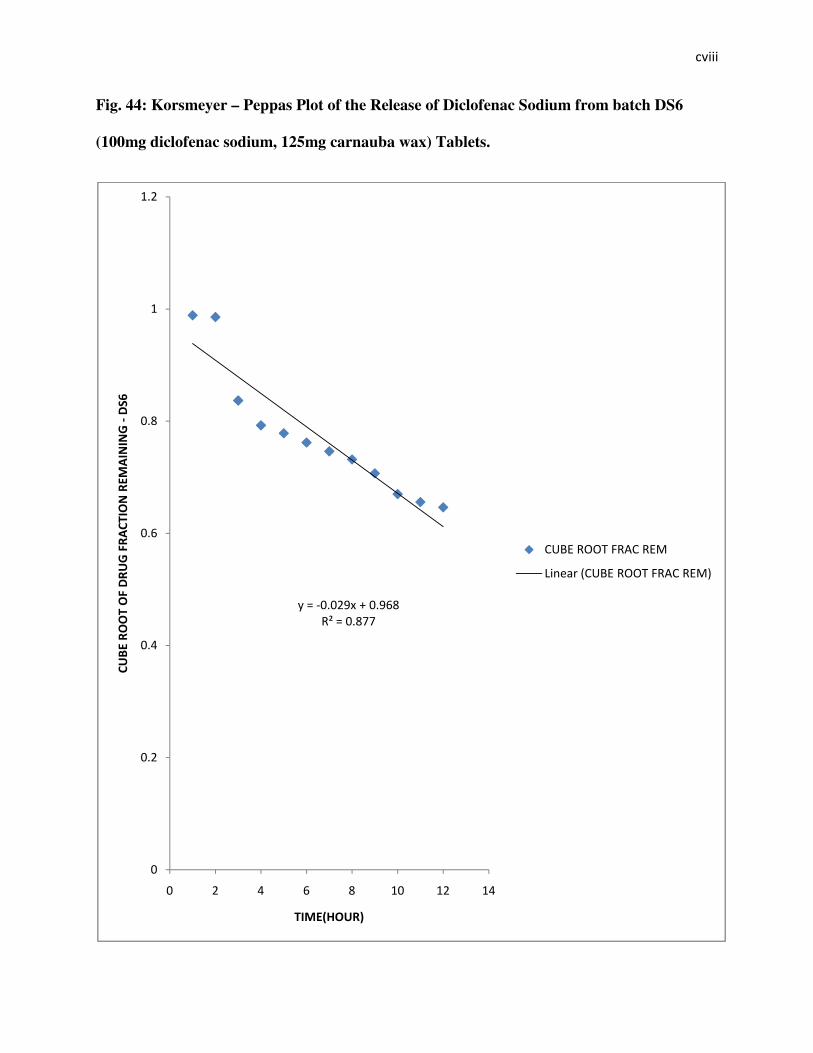
When the dissolution results were fitted into different release kinetic models as shown in fig.41 –
45, it was observed that Zero Order Kinetics, First Order Kinetics, Higuchi’s Square root Law
and Cuberoot Law were all in operation but First Order Kinetics was the most dominant. The
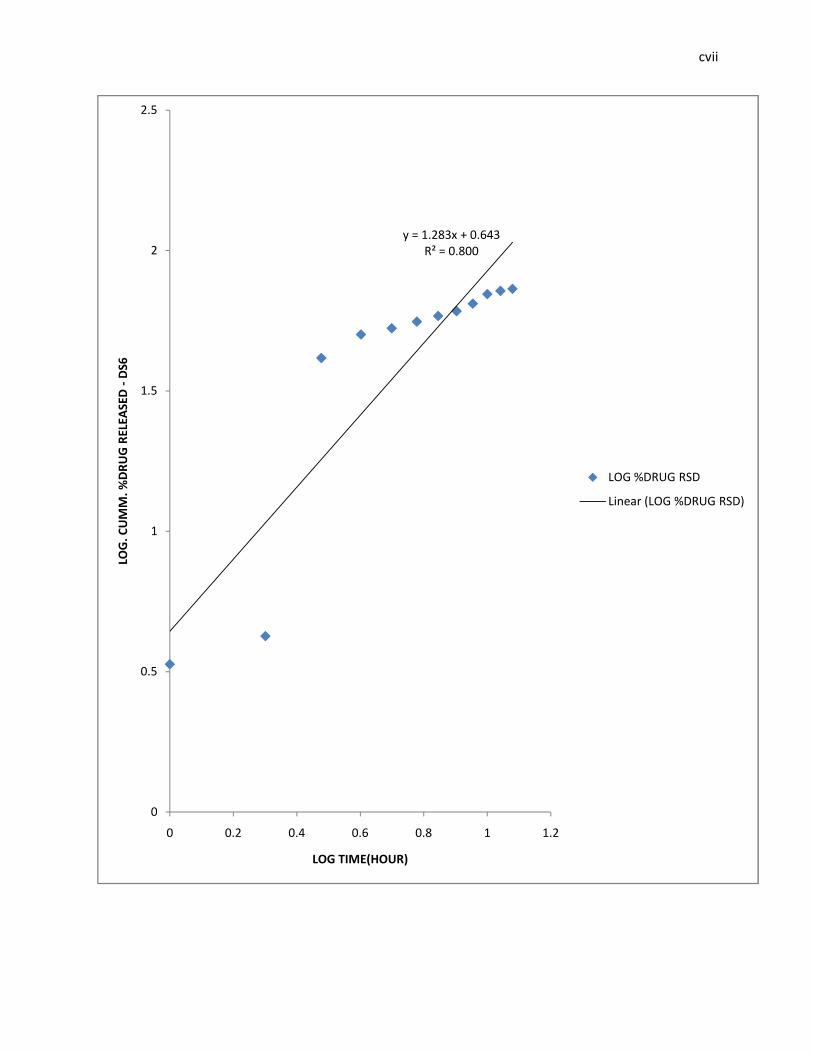
mechanism of drug release was determined by application of the Korsmeyer – Peppas equation
which gave an n – value of 1.283 and this is indicative of super case - II transport.

<���
�
�
<����
�
�
Fig. 41: Zero Order Plot of the Release of Diclofenac Sodium from Batch DS6 (100mg
diclofenac sodium, 125mg carnauba wax) Tablets.
����*$+#"
&'���($*))
(
%(
"(
+(
!(
#(
,(
*(
-(
)(
%((
( " ! , - %( %" %!
!�� !��"��#���$� ��"�("�/
%& ��'� ���
��6 6 $�7 �&�8 �&030.0��4 �,
3�����1��6 6 $�7 �&�8 �
&030.0��4 �,2
<���
�
�
����4($(!) �9�%$)*)
&'���($)+"
(
($#
%
%$#
"
"$#
( " ! , - %( %" %!
$�#!��� !��"��#��� &�&�#�("�/
%& ��'� ���
3� 8$�7 �&�8 �&06 $
3�����13� 8$�7 �&�8 �&06 $2

<��
�
�
Fig. 42: First Order Plot of the Release of Diclofenac Sodium from batch DS6 (100mg
diclofenac sodium, 125mg carnauba wax) Tablets.
<���
�
�
Fig. 43: Higuchian Plot of the Release of Diclofenac Sodium from Batch DS6 (100mg
diclofenac sodium, 125mg carnauba wax) Tablets.
����"%$!
&'���($-%-
(
%(
"(
+(
!(
#(
,(
*(
-(
( ($# % %$# " "$# + +$# !
�� !��"��#���$� ��"�("�/
�) � ����� � %�� *�%& �
7 �&�8 �&�
3�����17 �&�8 �&�2
<����
�
�
����%$"-+ �9�($,!+
&'���($-((
(
($#
%
%$#
"
"$#
( ($" ($! ($, ($- % %$"
$�#!��� !��"��#���$� ��"�("�/
$� # �%& ��'� ���
3� 8 �7 �&�8 �&�
3�����13� 8 �7 �&�8 �&�2
<�����
�
�
Fig. 44: Korsmeyer – Peppas Plot of the Release of Diclofenac Sodium from batch DS6
(100mg diclofenac sodium, 125mg carnauba wax) Tablets.
����4($(") �9�($),-
&'���($-**
(
($"
($!
($,
($-
%
%$"
( " ! , - %( %" %!
��������%��*�"��#�*� �%&����� &�&�#�("�/
%& ��'� ���
��/0�&� � :�;&.��&06
3�����1��/0�&� � :�;&.��&06 2
<� �
�
�
Fig. 45: Cuberoot Plot of the Release of Diclofenac Sodium from Batch DS6 (100mg
diclofenac sodium, 125mg carnauba wax) Tablets.
3.2.8: In Vitro Drug Release Characteristics of Diclofenac Sodium from Batch DSC
(Voltaren RetardR) Tablets:
The in vitro drug release characteristics of Diclofenac sodium from standard formulation
(Voltaren RetardR) tablets are shown in fig.46 – 51.
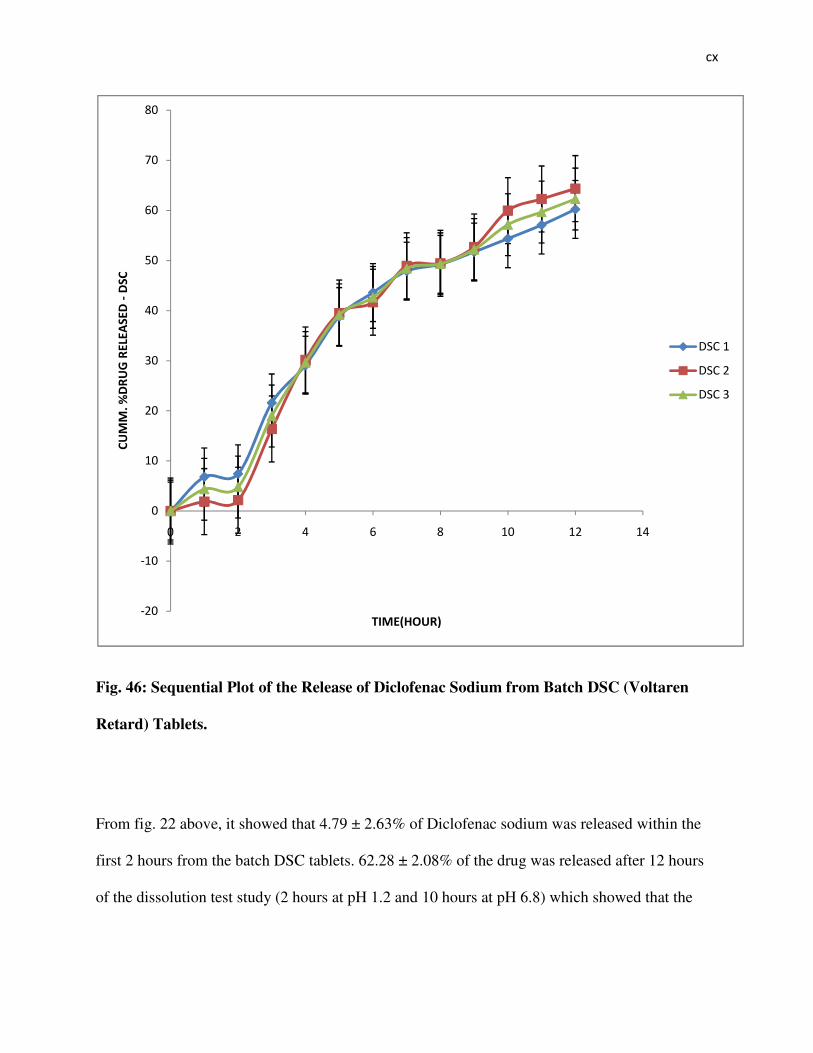
< �
�
�
Fig. 46: Sequential Plot of the Release of Diclofenac Sodium from Batch DSC (Voltaren
Retard) Tablets.
From fig. 22 above, it showed that 4.79 ± 2.63% of Diclofenac sodium was released within the
first 2 hours from the batch DSC tablets. 62.28 ± 2.08% of the drug was released after 12 hours
of the dissolution test study (2 hours at pH 1.2 and 10 hours at pH 6.8) which showed that the
4"(
4%(
(
%(
"(
+(
!(
#(
,(
*(
-(
( " ! , - %( %" %!
�� !��"��#���$� ��"�("��
%& ��'� ���
���%
���"
���+
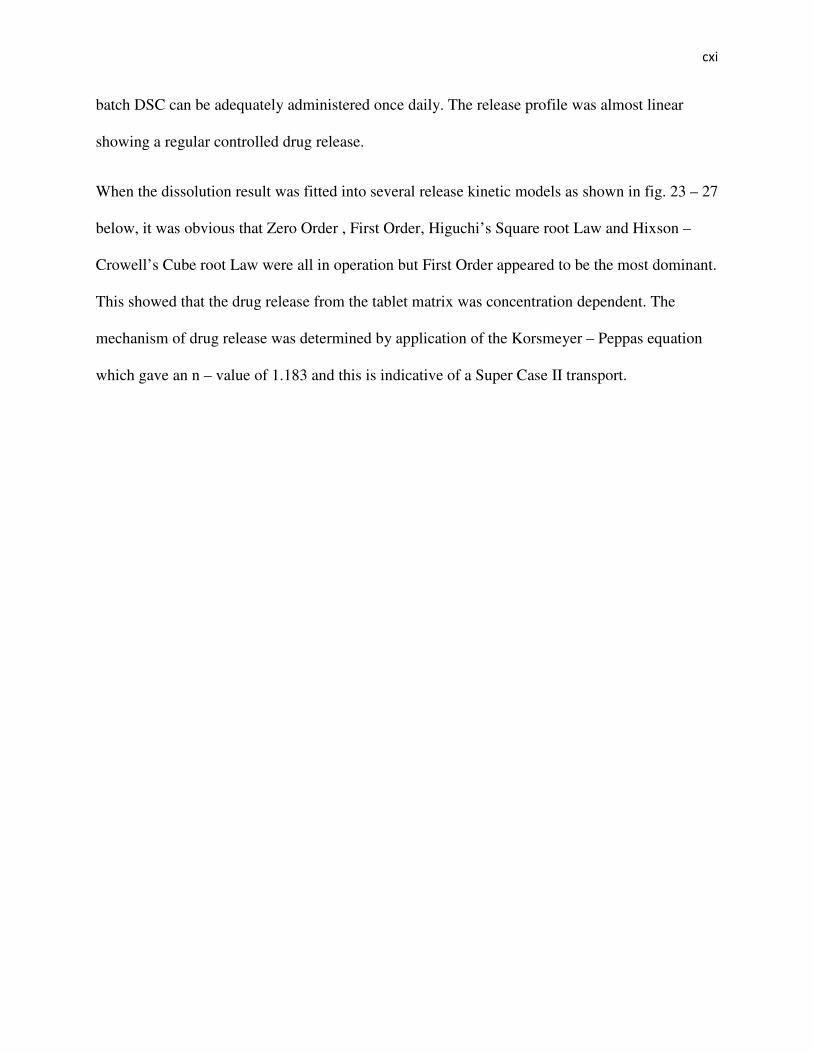
< ��
�
�
batch DSC can be adequately administered once daily. The release profile was almost linear
showing a regular controlled drug release.
When the dissolution result was fitted into several release kinetic models as shown in fig. 23 – 27
below, it was obvious that Zero Order , First Order, Higuchi’s Square root Law and Hixson –
Crowell’s Cube root Law were all in operation but First Order appeared to be the most dominant.
This showed that the drug release from the tablet matrix was concentration dependent. The
mechanism of drug release was determined by application of the Korsmeyer – Peppas equation
which gave an n – value of 1.183 and this is indicative of a Super Case II transport.

< ���
�
�
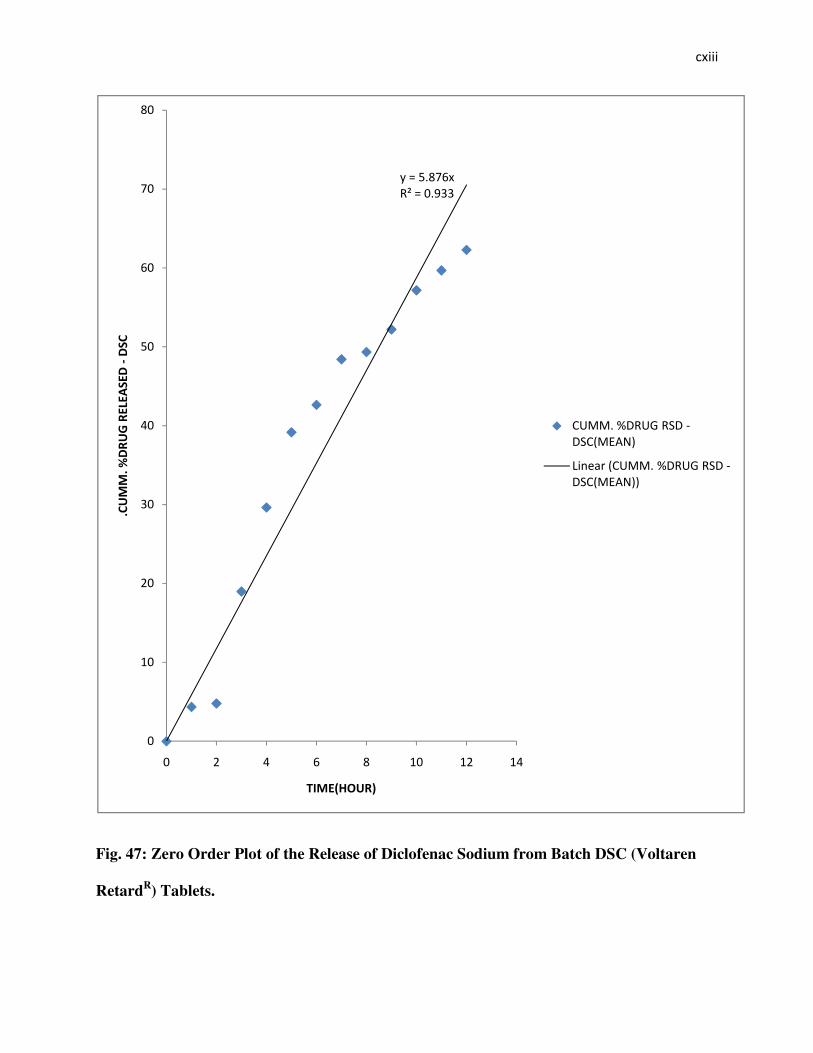
< ����
�
�
Fig. 47: Zero Order Plot of the Release of Diclofenac Sodium from Batch DSC (Voltaren
RetardR) Tablets.
����#$-*,
&'���($)++
(
%(
"(
+(
!(
#(
,(
*(
-(
( " ! , - %( %" %!
!�� !��"��#���$� ��"�("��
%& ��'� ���
��6 6 $�7 �&�8 �&� �4
��16 0.�2
3�����1��6 6 $�7 �&�8 �&� �4
��16 0.�22
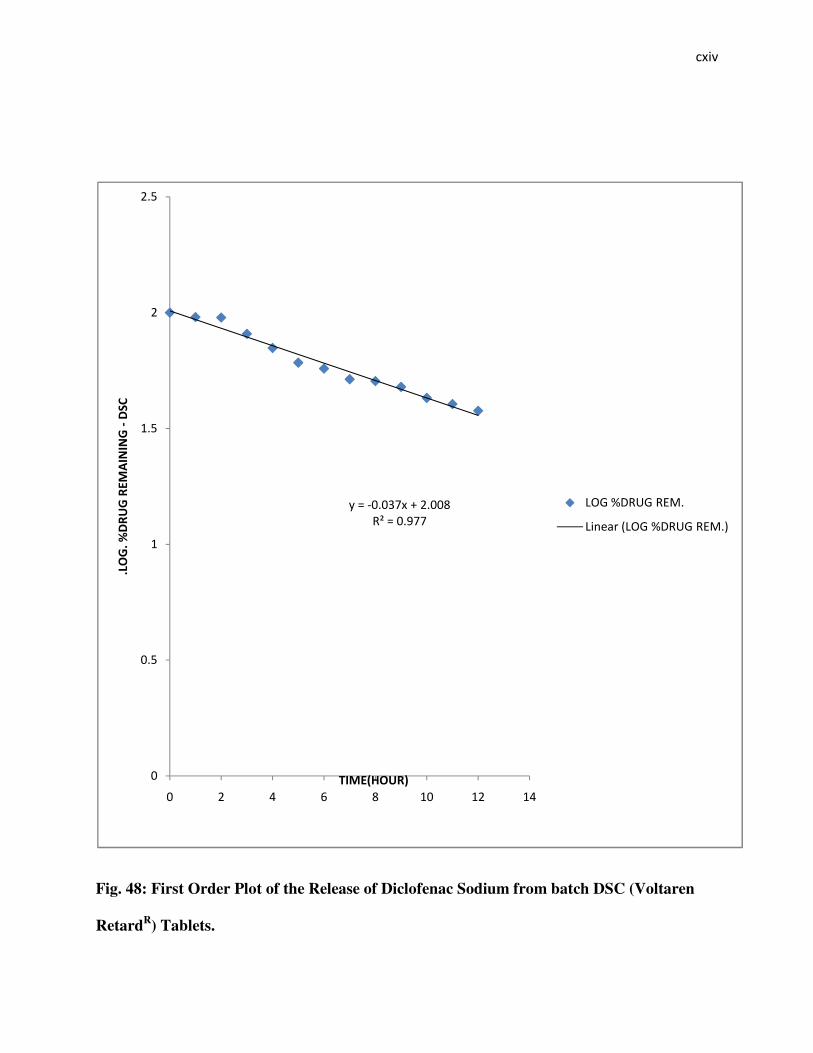
< ���
�
�
Fig. 48: First Order Plot of the Release of Diclofenac Sodium from batch DSC (Voltaren
RetardR) Tablets.
����4($(+* �9�"$((-
&'���($)**
(
($#
%
%$#
"
"$#
( " ! , - %( %" %!
!$�#!��"��#��� &�&�#�("��
%& ��'� ���
3� 8 �7 �&�8 �&06 $
3�����13� 8 �7 �&�8 �&06 $2
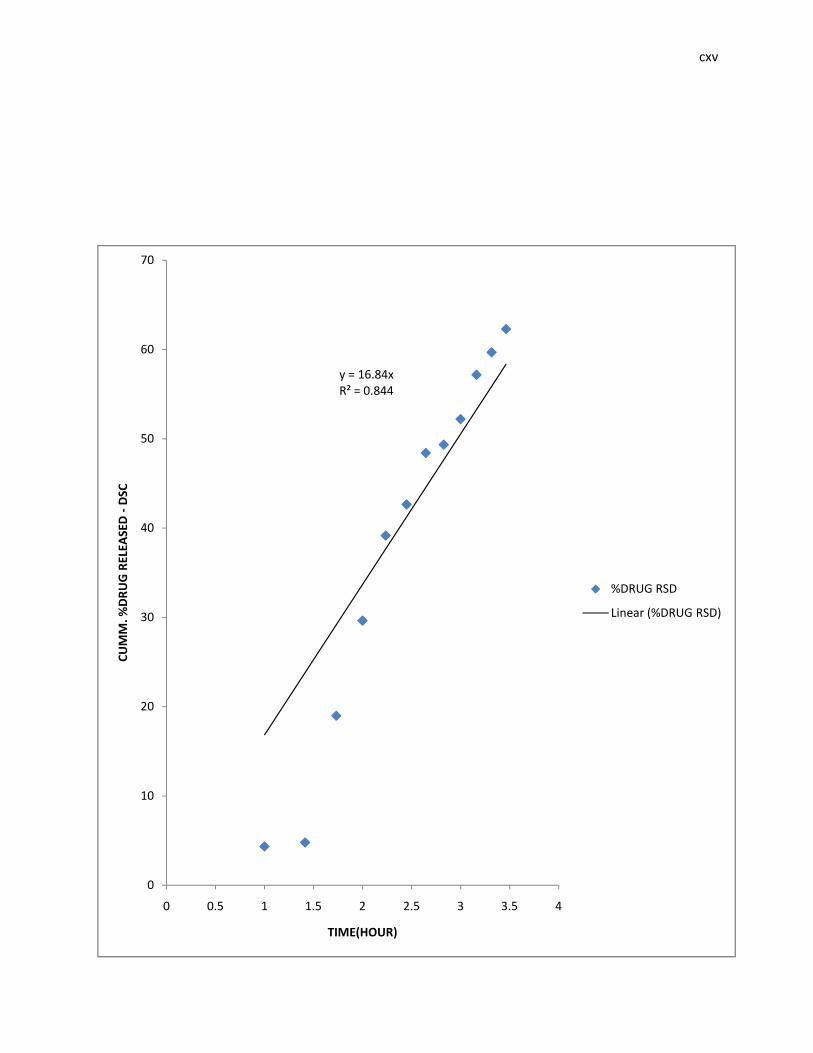
< ��
�
�
����%,$-!
&'���($-!!
(
%(
"(
+(
!(
#(
,(
*(
( ($# % %$# " "$# + +$# !
�� !��"��#���$� ��"�("��
%& ��'� ���
7 �&�8 �&�
3�����17 �&�8 �&�2

< ���
�
�
Fig. 49: Higuchian Plot of the Release of Diclofenac Sodium from Batch DSC (Voltaren
RetardR) Tablets.
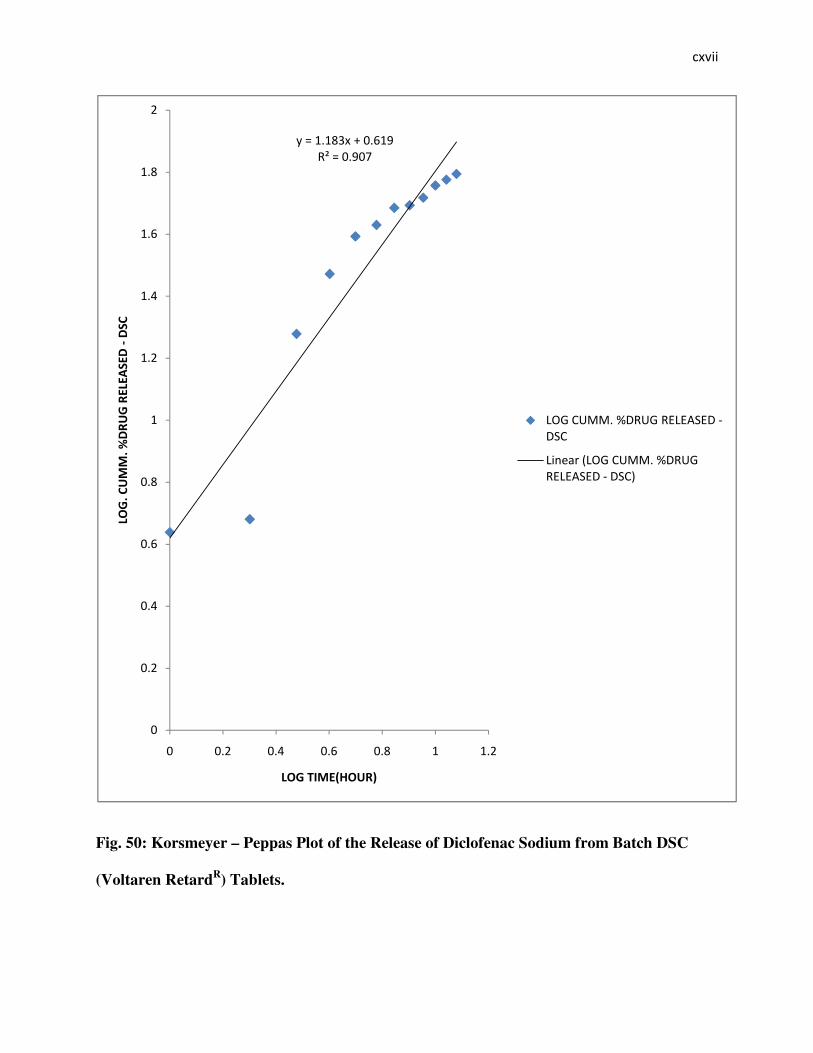
< ����
�
�
Fig. 50: Korsmeyer – Peppas Plot of the Release of Diclofenac Sodium from Batch DSC
(Voltaren RetardR) Tablets.
����%$%-+ �9�($,%)
&'���($)(*
(
($"
($!
($,
($-
%
%$"
%$!
%$,
%$-
"
( ($" ($! ($, ($- % %$"
$�#!��� !��"��#���$� ��"�("��
$� # �%& ��'� ���
3� 8 ���6 6 $�7 �&�8 �&030.0��4
��
3�����13� 8 ���6 6 $�7 �&�8 �
&030.0��4 ��2

< �����
�
�
Fig. 51: Cuberoot Plot of the Release of Diclofenac Sodium from Batch DSC (Voltaren
RetardR) Tablets.
����4($("! �9�($)))
&'���($)#-
(
($"
($!
($,
($-
%
%$"
( " ! , - %( %" %!
��������%��*�"��#�*� �%&����� &�&�#�("��
%& ��'� ���
��/0�&� � :�� ;��&�8 �;&.�$�
&06 $
3�����1��/0�&� � :�� ;��&�8 �
;&.�$�&06 $2
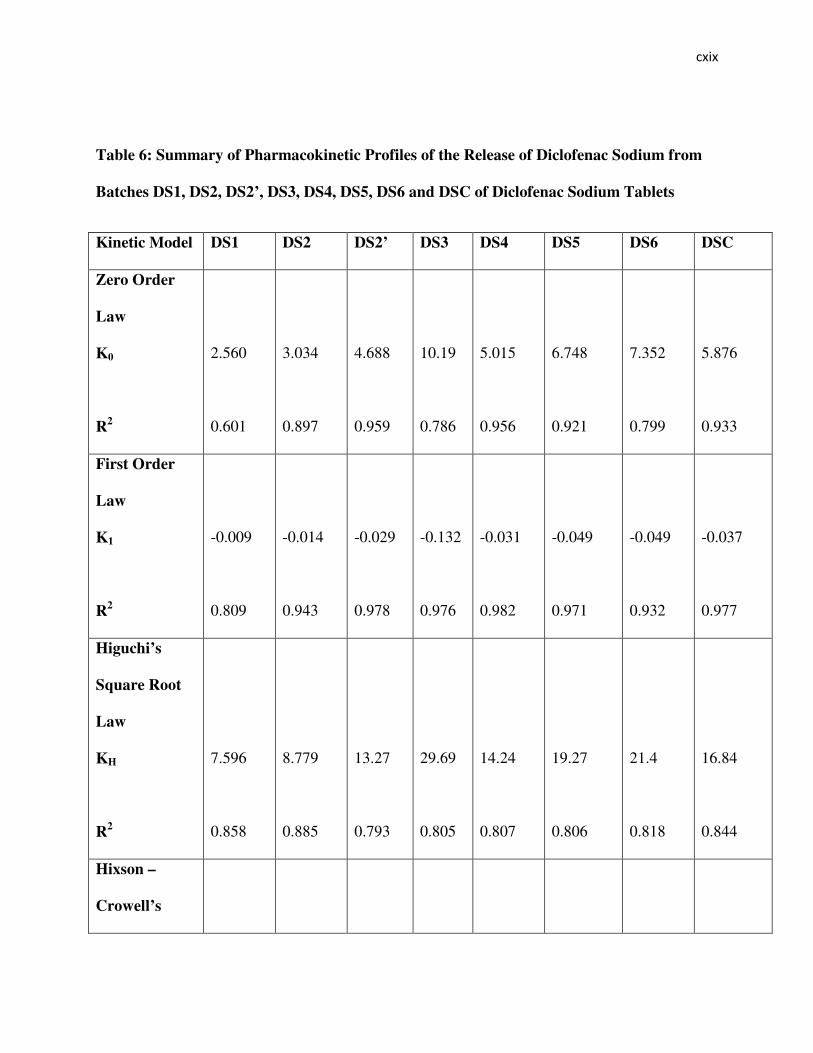
< � �
�
�
Table 6: Summary of Pharmacokinetic Profiles of the Release of Diclofenac Sodium from
Batches DS1, DS2, DS2’, DS3, DS4, DS5, DS6 and DSC of Diclofenac Sodium Tablets
Kinetic Model DS1 DS2 DS2’ DS3 DS4 DS5 DS6 DSC
Zero Order
Law
K0
R2
2.560
0.601
3.034
0.897
4.688
0.959
10.19
0.786
5.015
0.956
6.748
0.921
7.352
0.799
5.876
0.933
First Order
Law
K1
R2
-0.009
0.809
-0.014
0.943
-0.029
0.978
-0.132
0.976
-0.031
0.982
-0.049
0.971
-0.049
0.932
-0.037
0.977
Higuchi’s
Square Root
Law
KH
R2
7.596
0.858
8.779
0.885
13.27
0.793
29.69
0.805
14.24
0.807
19.27
0.806
21.4
0.818
16.84
0.844
Hixson –
Crowell’s

< �
�
�
Cube Root
Law
KHC
R2
-0.005
0.773
-0.009
0.922
-0.020
0.970
-0.062
0.921
-0.021
0.971
-0.031
0.950
-0.029
0.877
-0.024
0.958
Korsmeyer –
Peppas
K
n
R2
6.012
0.620
0.861
3.499
0.953
0.906
1.109
1.704
0.877
6.124
1.280
0.815
1.279
1.673
0.870
1.549
1.733
0.864
4.395
1.283
0.800
4.159
1.183
0.907
3.3: Uniformity of weight of Diclofenac Sodium

< ��
�
�
The average weight for batches DS 1, DS 2, DS 2’, DS 3, DS 4, DS 5 and DS C were 401.3mg,
403.7mg, 403.8mg, 405.6mg, 404.3mg, 403.1mg and 404.2mg respectively. None of the
respective 20 tablets weighed was outside the official range (5%).
Table 7: Uniformity of tablet weight test for batches DS 1, DS 2, DS 2’, DS 3, DS
4, DS 5 and DS 6 Tablets.
DS 1
(mg)
DS 2
(mg)
DS 2’
(mg)
DS 3
(mg)
DS 4
(mg)
DS
5(mg)
DS 6
(mg)
1
398.9 396.6 402.8 418.3 405.2 400.8 397.4
2
403.1 390.2 405.0 409.7 408.1 402.1 401.7
3
399.0 410.0 408.0 414.3 408.7 401.8 405.2
4
401.2 401.4 402.5 402.1 401.6 401.6 406.7
5
403.3 402.4 403.2 396.2 403.7 399.8 407.1
6
393.1 398.8 399.5 408.8 405.0 405.1 403.3
7
391.5 406.5 407.0 410.1 402.8 404.3 405.6
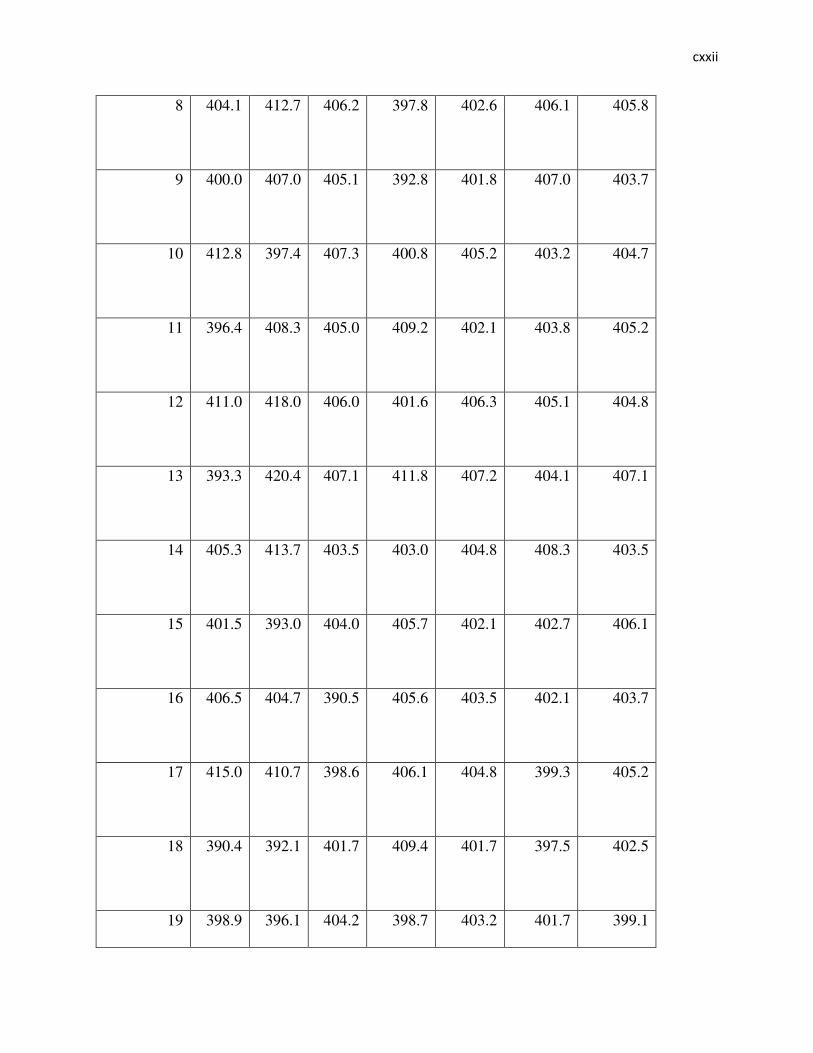
< ���
�
�
8
404.1 412.7 406.2 397.8 402.6 406.1 405.8
9
400.0 407.0 405.1 392.8 401.8 407.0 403.7
10
412.8 397.4 407.3 400.8 405.2 403.2 404.7
11
396.4 408.3 405.0 409.2 402.1 403.8 405.2
12
411.0 418.0 406.0 401.6 406.3 405.1 404.8
13
393.3 420.4 407.1 411.8 407.2 404.1 407.1
14
405.3 413.7 403.5 403.0 404.8 408.3 403.5
15
401.5 393.0 404.0 405.7 402.1 402.7 406.1
16
406.5 404.7 390.5 405.6 403.5 402.1 403.7
17
415.0 410.7 398.6 406.1 404.8 399.3 405.2
18
390.4 392.1 401.7 409.4 401.7 397.5 402.5
19 398.9 396.1 404.2 398.7 403.2 401.7 399.1
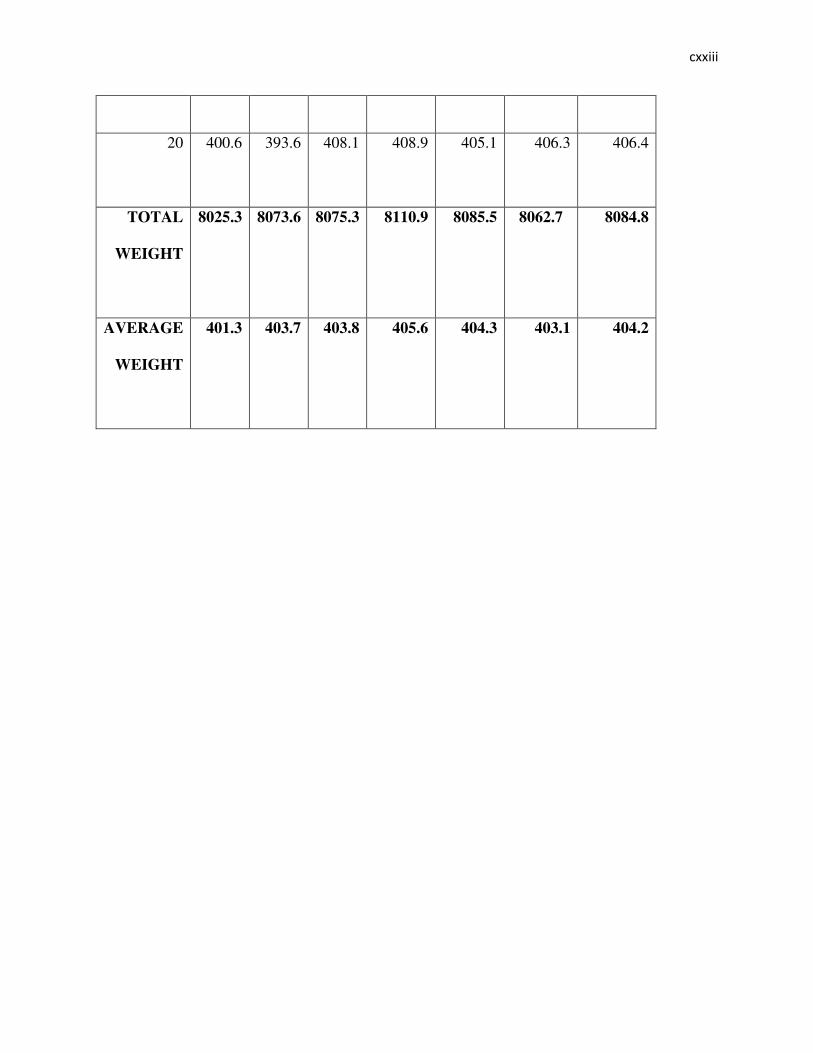
< ����
�
�
20
400.6 393.6 408.1 408.9 405.1 406.3 406.4
TOTAL
WEIGHT
8025.3 8073.6 8075.3 8110.9 8085.5 8062.7 8084.8
AVERAGE
WEIGHT
401.3 403.7 403.8 405.6 404.3 403.1 404.2
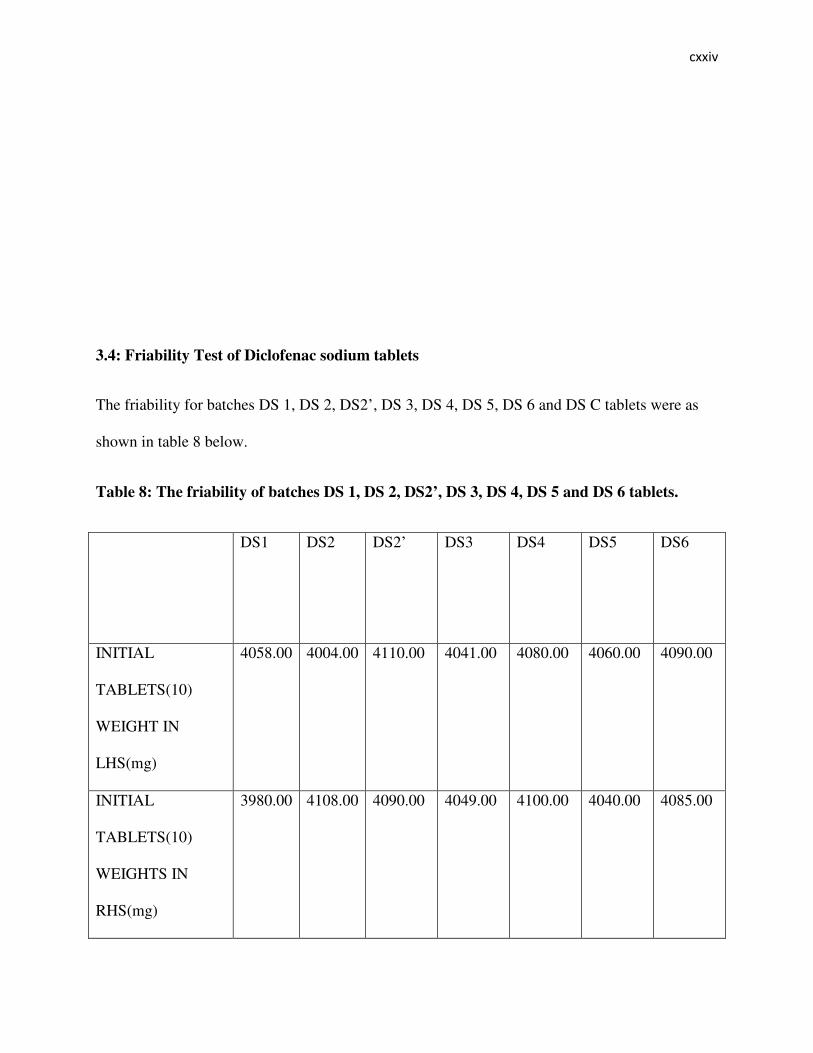
< ���
�
�
3.4: Friability Test of Diclofenac sodium tablets
The friability for batches DS 1, DS 2, DS2’, DS 3, DS 4, DS 5, DS 6 and DS C tablets were as
shown in table 8 below.
Table 8: The friability of batches DS 1, DS 2, DS2’, DS 3, DS 4, DS 5 and DS 6 tablets.
DS1 DS2 DS2’ DS3 DS4 DS5 DS6
INITIAL
TABLETS(10)
WEIGHT IN
LHS(mg)
4058.00 4004.00 4110.00 4041.00 4080.00 4060.00 4090.00
INITIAL
TABLETS(10)
WEIGHTS IN
RHS(mg)
3980.00 4108.00 4090.00 4049.00 4100.00 4040.00 4085.00
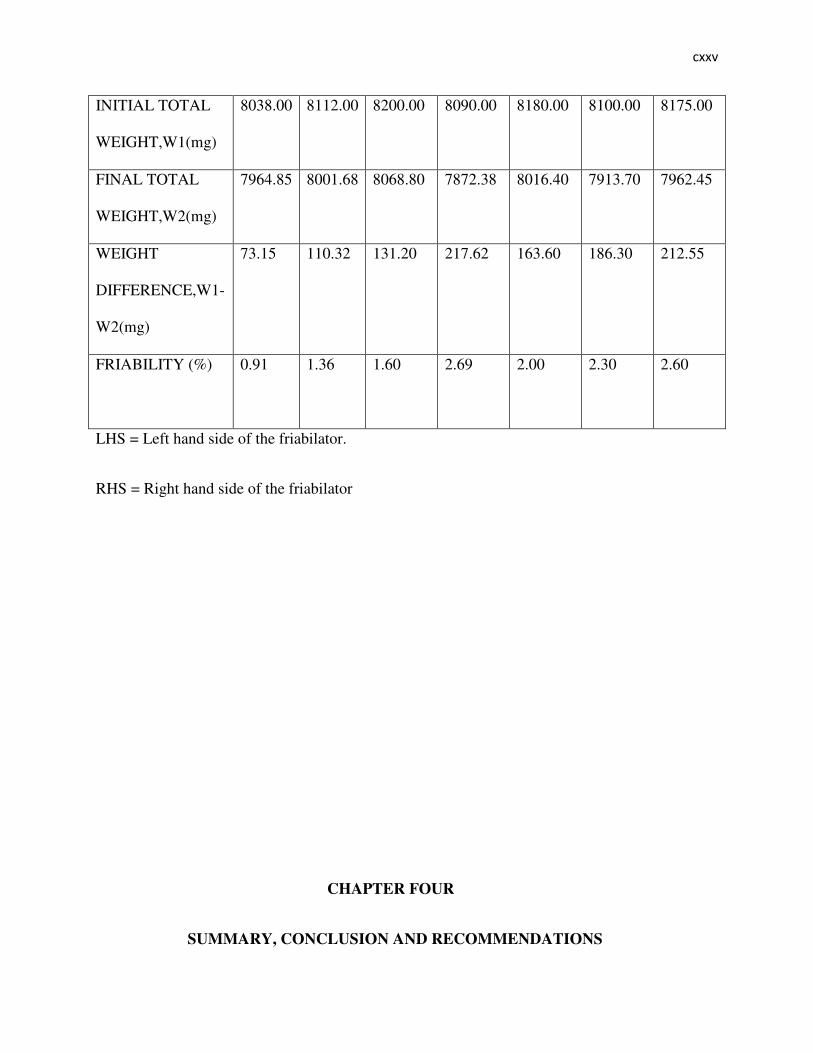
< ��
�
�
INITIAL TOTAL
WEIGHT,W1(mg)
8038.00 8112.00 8200.00 8090.00 8180.00 8100.00 8175.00
FINAL TOTAL
WEIGHT,W2(mg)
7964.85 8001.68 8068.80 7872.38 8016.40 7913.70 7962.45
WEIGHT
DIFFERENCE,W1-
W2(mg)
73.15 110.32 131.20 217.62 163.60 186.30 212.55
FRIABILITY (%) 0.91 1.36 1.60 2.69 2.00 2.30 2.60
LHS = Left hand side of the friabilator.
RHS = Right hand side of the friabilator
CHAPTER FOUR
SUMMARY, CONCLUSION AND RECOMMENDATIONS
< ���
�
�
It was discovered that Diclofenac sodium granules prepared by melt granulation can be directly
compressed into matrix tablets with sustained – released effects.
Matrix tablets from batch DS 1, prepared with high concentration of carnauba wax (75%w/w)
showed high retardation of drug release (23.86 ± 0.06% after 12 hours) both at simulated gastric
fluid pH of 1.2 and at simulated intestinal fluid pH of 6.8. If this high concentration of carnauba
wax is to be used, incorporation of a channeling agent may be needed.
Matrix tablets from batch DS 2 which contained 50%w/w carnauba wax showed good controlled
release profile; very low drug release profile (3.88 ± 0.03%) at simulated gastric fluid pH of 1.2
and moderate retardation of drug release (31.08 ± 0.10%) at simulated intestinal fluid pH of 6.8
after 12 hours.
Matrix tablets from batch DS 2’ which contained 50% w/w carnauba wax but produced with
12.5mm punch showed a drug release of 52.03 ± 0.00% after 12hours. It showed higher drug
release compared to batch DS 2 (31.08 ± 0.10%) which contained same quantity of active
ingredients and excipients but produced using an 8mm punch. The difference in tablet
dimensions, thickness (5mm), diameter (10mm) for batch DS 2 tablets and thickness (3mm),
diameter (13mm) for batch DS 2’ tablets resulted in the difference in surface area which may
account for the difference in drug release profile.
Matrix tablets from batch DS 3 containing 25%w/w of carnauba wax showed low drug release
profile (5.76 ± 0.05%) at simulated gastric fluid while 95.94 ± 0.31% of drug was released at
simulated intestinal fluid after 12 hours. This showed that most of the drug will be released
within 12 hours of administration; therefore twice daily administration will be necessary.
< ����
�
�
Matrix tablets from batches DS 4, DS 5 and DS 6 produced using 12.5mm punch showed drug
release profile of 55.09 ± 0.08%, 70.78 ± 0.93% and 73.00 ± 0.15% respectively after 12 hours.
They all showed drug release profile comparable to the control (62.28 ± 2.08%)
Matrix tablets from the batch DS C (Voltaren RetardR) showed low drug release profile (4.79 ±
2.63%) at simulated gastric fluid pH of 1.2. At simulated intestinal fluid pH of 6.8, the drug
release of 62.28 ± 2.08% was achieved after further 10 hours. This showed that a once daily
administration was achievable.
The mechanism of release of Diclofenac Sodium in simulated intestinal fluid was anomalous
(non – fickian) diffusion controlled for batch DS 1 tablets and Super Case II transport for batches
DS 2, DS 2’,DS 3, DS 4, DS 5, DS 6 and DS C. The kinetics of release were predominantly First
order for batches DS 2, DS 2’, DS 3, DS 4, DS 5, DS 6 and DS C, while Higuchi Square root law
of kinetics was for batch DS 1 tablets.
RECOMMENDATIONS
Carnauba wax is a potential material for making directly compressed hydrophobic matrix
Diclofenac sodium sustained – released tablets.
Batch DS 1 tablets which contains 75%w/w concentrations of carnauba wax can still be used but
studies on good channeling agents that can lower its drug release retardation effects should be
done.
< �����
�
�
REFERENCES
1) Rubinstein, M.H. (1999). Tablets. In Michael Aulton (editor), ‘Pharmaceutics: The Science
of Dosage Form Design. International Students Edition, Churchill Livingstone, UK. PP.315
– 317.
2) Reza, M. S., Quadir, M.A. and Haider, S.S. Comparative evaluation of plastic, hydrophilic
and hydrophilic polymers as matrices for controlled – release drug delivery. J. Pharm.
Pharmaceut. Sci. (2003) 6(2): 274 – 291.
< � �
�
�
3) Lordi, N.G. (1990), Sustained Release Dosage Forms. In Lachman L., Lieberman H.A and
Kanig J. L. (eds.).The Theory and Practice of Industrial Pharmacy. 3rd ed. Varghese
Publishing House, Bombay. PP.430 – 456.
4) Talukder, M.M., Michael, A., Rombaut, P. and Kinget, R. Comparative Study on Xanthum
Gum and Hydroxypropylmethylcellulose as Matrices for Controlled – Release Drug
Delivery. Int. J Pharm, 129: 231 – 241, 1996.
5) Higuchi T. Mechanism of sustained action medication: Theoretical analysis of rate of
release of solid drugs dispersed in solid matrices. J. Pharm. Sci. 1963; 52: 1145 – 1149.
6) Dakkuri, A., Schroeder, H.G. and Deluca, P.P. Sustained release from inert wax matrices
II: Effect of surfactants on tripellenamine hydrochloride release. J. Pharm. Sci. 67: 354 –
357, 1978b.
7) Schwartz, J.B., Simonelli, A.P. and Higuchi, W.I. Drug release from wax matrices I:
Analysis of data with first order kinetics and with the diffusion controlled model. J. Pharm.
Sci. 57: 274 – 277, 1968a.
8) Schwartz, J.B., Simonelli, A.P. and Higuchi, W.I. Drug release from wax matrices II:
Application of a mixture theory to the sulfanilamide – wax system. J Pharm. Sci. 57: 278 –
282, 1968b.
9) Goodhart, F.W., McCoy, R.H. and Ninger, F.C. Release of a water – soluble drug from a
wax matrix timed – release tablet. J. Pharm. Sci. 63: 1748 – 1751, 1974.
10) Steinle, J. Vernon, (September 1936). “Carnauba wax: an expedition to its source”.
Industrial and Engineering Chemistry 28(9): 1004 – 1008.
< �
�
�
11) Parish, Edward J., Terrence L. Boos., Shengrong Li (2002). “The Chemistry of Waxes and
Sterols”. In Casmir C. Akoh, David B. Min. Food Lipids: Chemistry, nutrition, and
biochemistry (2nd Ed.). New York: M. Dekker. P. 103. ISBN0824707494.
12) Arthritis, in WikipediaR, Wikimedia Foundation, Inc, 2011.
13) British Pharmacopoeia (B.P.) London, UK: Stationary Office London (2005). pp.631.
14) Silvina A. Bravo, Maria C. Lamas, Claudio J. Salomon. In - vitro studies of Diclofenac
sodium controlled – release from biopolymeric hydrophilic matrices. J Pharm Pharmaceut
Sci (www.ualberta.ca/~csps) 5(3): 213 – 219, 2002
15) Insel, A. Paul (1990): Analgesic – Antipyretics and Anti-inflammatory Agents; Drugs
employed in the treatment of rheumatoid arthritis and gout in Goodman and Gilman’s The
Pharmacological Basis of Therapeutics, Pergamon Press, Inc. pg 669.
16) VoltarenR, International Package Leaflet (May 2010), Novartis Pharma AG, Basel,
Switzerland.
17) Hernandez, Alicia R., Gascon, Jose Luis Pedraz.; Preparation of Sustained release
hydrophilic matrices by melt granulation in a high shear mixer. J Pharm. Pharmaceut. Sci.
8(2): 132 – 140, 2005.
18) Bertuzzi, B., Cicalini, L., Di Colo, G. Melt granulation in high shear high speed mixer:
preparation of sustained – release systems for propranolol Hydrochloride.
www.farmaonline.it/universita.
19) Uhumwangho, M.U., Okor, R.S., Effect of matrix granulation and wax coating on the
dissolution rates of paracetamol granules, African Journal of Biotechnology vol.5(9), PP.
766 – 769, 2 May 2006.
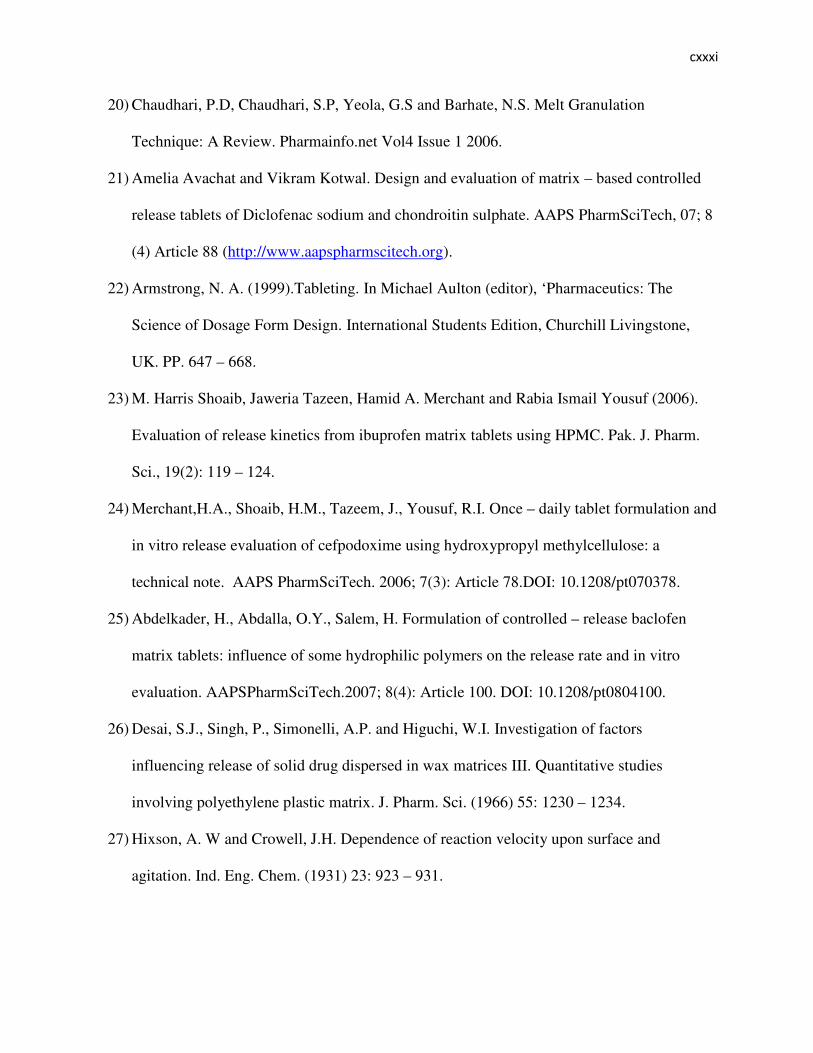
< ��
�
�
20) Chaudhari, P.D, Chaudhari, S.P, Yeola, G.S and Barhate, N.S. Melt Granulation
Technique: A Review. Pharmainfo.net Vol4 Issue 1 2006.
21) Amelia Avachat and Vikram Kotwal. Design and evaluation of matrix – based controlled
release tablets of Diclofenac sodium and chondroitin sulphate. AAPS PharmSciTech, 07; 8
(4) Article 88 (http://www.aapspharmscitech.org).
22) Armstrong, N. A. (1999).Tableting. In Michael Aulton (editor), ‘Pharmaceutics: The
Science of Dosage Form Design. International Students Edition, Churchill Livingstone,
UK. PP. 647 – 668.
23) M. Harris Shoaib, Jaweria Tazeen, Hamid A. Merchant and Rabia Ismail Yousuf (2006).
Evaluation of release kinetics from ibuprofen matrix tablets using HPMC. Pak. J. Pharm.
Sci., 19(2): 119 – 124.
24) Merchant,H.A., Shoaib, H.M., Tazeem, J., Yousuf, R.I. Once – daily tablet formulation and
in vitro release evaluation of cefpodoxime using hydroxypropyl methylcellulose: a
technical note. AAPS PharmSciTech. 2006; 7(3): Article 78.DOI: 10.1208/pt070378.
25) Abdelkader, H., Abdalla, O.Y., Salem, H. Formulation of controlled – release baclofen
matrix tablets: influence of some hydrophilic polymers on the release rate and in vitro
evaluation. AAPSPharmSciTech.2007; 8(4): Article 100. DOI: 10.1208/pt0804100.
26) Desai, S.J., Singh, P., Simonelli, A.P. and Higuchi, W.I. Investigation of factors
influencing release of solid drug dispersed in wax matrices III. Quantitative studies
involving polyethylene plastic matrix. J. Pharm. Sci. (1966) 55: 1230 – 1234.
27) Hixson, A. W and Crowell, J.H. Dependence of reaction velocity upon surface and
agitation. Ind. Eng. Chem. (1931) 23: 923 – 931.
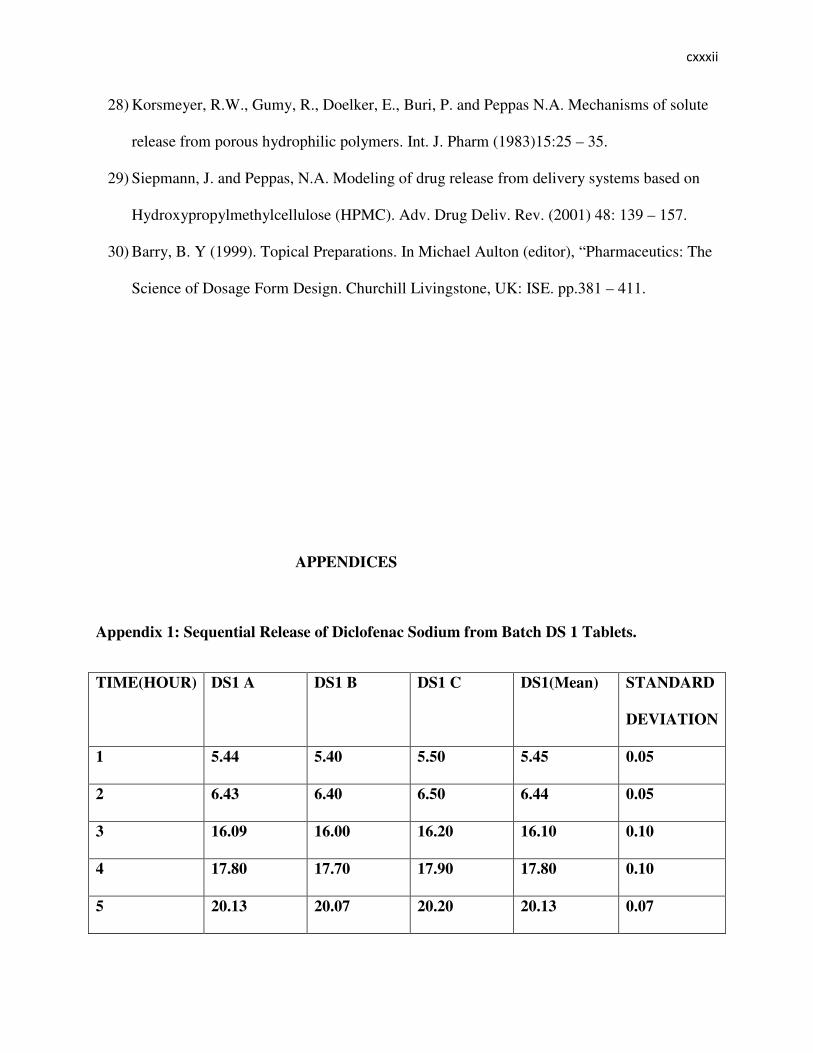
< ���
�
�
28) Korsmeyer, R.W., Gumy, R., Doelker, E., Buri, P. and Peppas N.A. Mechanisms of solute
release from porous hydrophilic polymers. Int. J. Pharm (1983)15:25 – 35.
29) Siepmann, J. and Peppas, N.A. Modeling of drug release from delivery systems based on
Hydroxypropylmethylcellulose (HPMC). Adv. Drug Deliv. Rev. (2001) 48: 139 – 157.
30) Barry, B. Y (1999). Topical Preparations. In Michael Aulton (editor), “Pharmaceutics: The
Science of Dosage Form Design. Churchill Livingstone, UK: ISE. pp.381 – 411.
APPENDICES
Appendix 1: Sequential Release of Diclofenac Sodium from Batch DS 1 Tablets.
TIME(HOUR) DS1 A DS1 B DS1 C DS1(Mean) STANDARD
DEVIATION
1 5.44 5.40 5.50 5.45 0.05
2 6.43 6.40 6.50 6.44 0.05
3 16.09 16.00 16.20 16.10 0.10
4 17.80 17.70 17.90 17.80 0.10
5 20.13 20.07 20.20 20.13 0.07
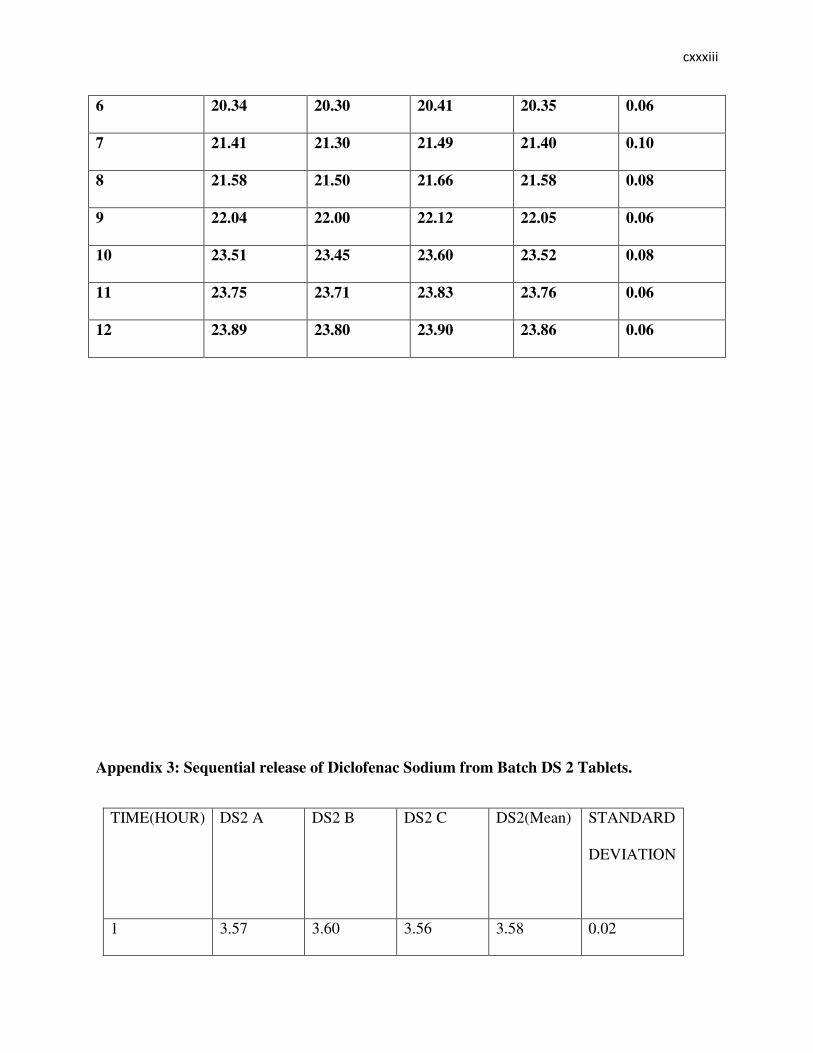
< ����
�
�
6 20.34 20.30 20.41 20.35 0.06
7 21.41 21.30 21.49 21.40 0.10
8 21.58 21.50 21.66 21.58 0.08
9 22.04 22.00 22.12 22.05 0.06
10 23.51 23.45 23.60 23.52 0.08
11 23.75 23.71 23.83 23.76 0.06
12 23.89 23.80 23.90 23.86 0.06
Appendix 3: Sequential release of Diclofenac Sodium from Batch DS 2 Tablets.
TIME(HOUR) DS2 A DS2 B DS2 C DS2(Mean) STANDARD
DEVIATION
1 3.57 3.60 3.56 3.58 0.02
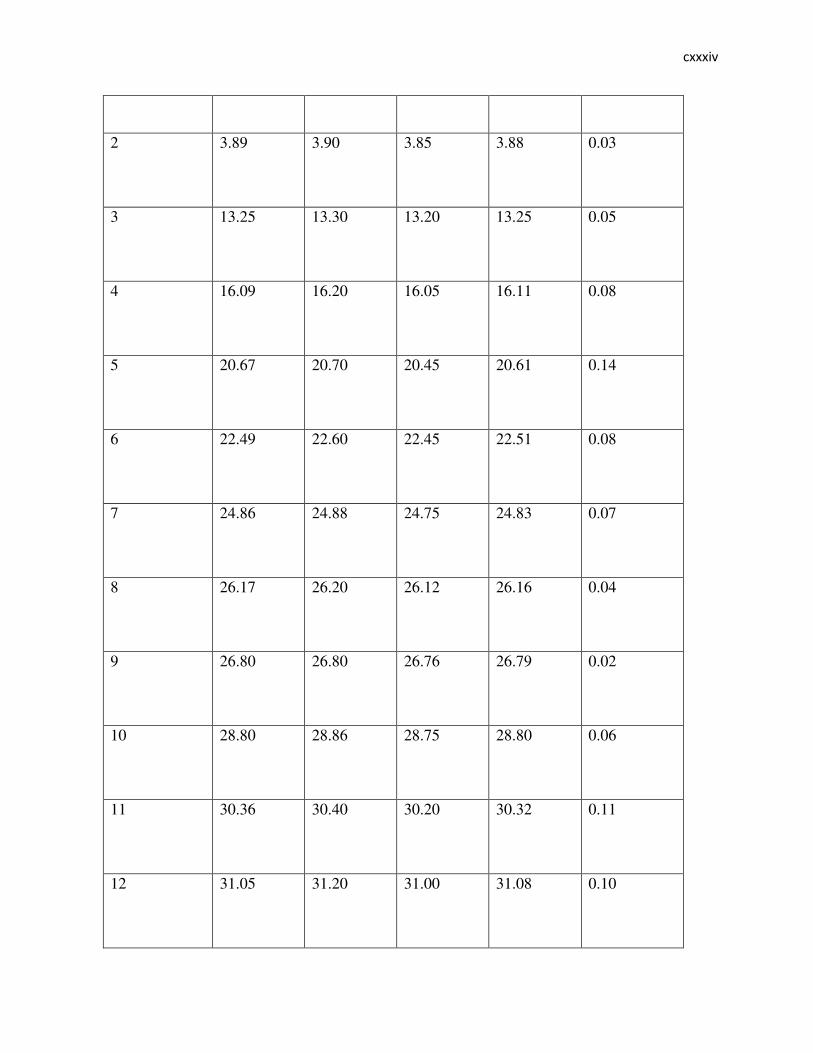
< ���
�
�
2 3.89 3.90 3.85 3.88 0.03
3 13.25 13.30 13.20 13.25 0.05
4 16.09 16.20 16.05 16.11 0.08
5 20.67 20.70 20.45 20.61 0.14
6 22.49 22.60 22.45 22.51 0.08
7 24.86 24.88 24.75 24.83 0.07
8 26.17 26.20 26.12 26.16 0.04
9 26.80 26.80 26.76 26.79 0.02
10 28.80 28.86 28.75 28.80 0.06
11 30.36 30.40 30.20 30.32 0.11
12 31.05 31.20 31.00 31.08 0.10

< ��
�
�
Appendix 4: Sequential release of Diclofenac Sodium from Batch DS 2’ Tablets.
TIME(HOUR) DS2’ A DS2’ B DS2’ C DS2’(Mean) STANDARD
DEVIATION
1 1.09 1.11 1.10 1.10 0.01
2 1.18 1.18 1.18 1.18 0.00
3 12.35 12.34 12.35 12.35 0.01
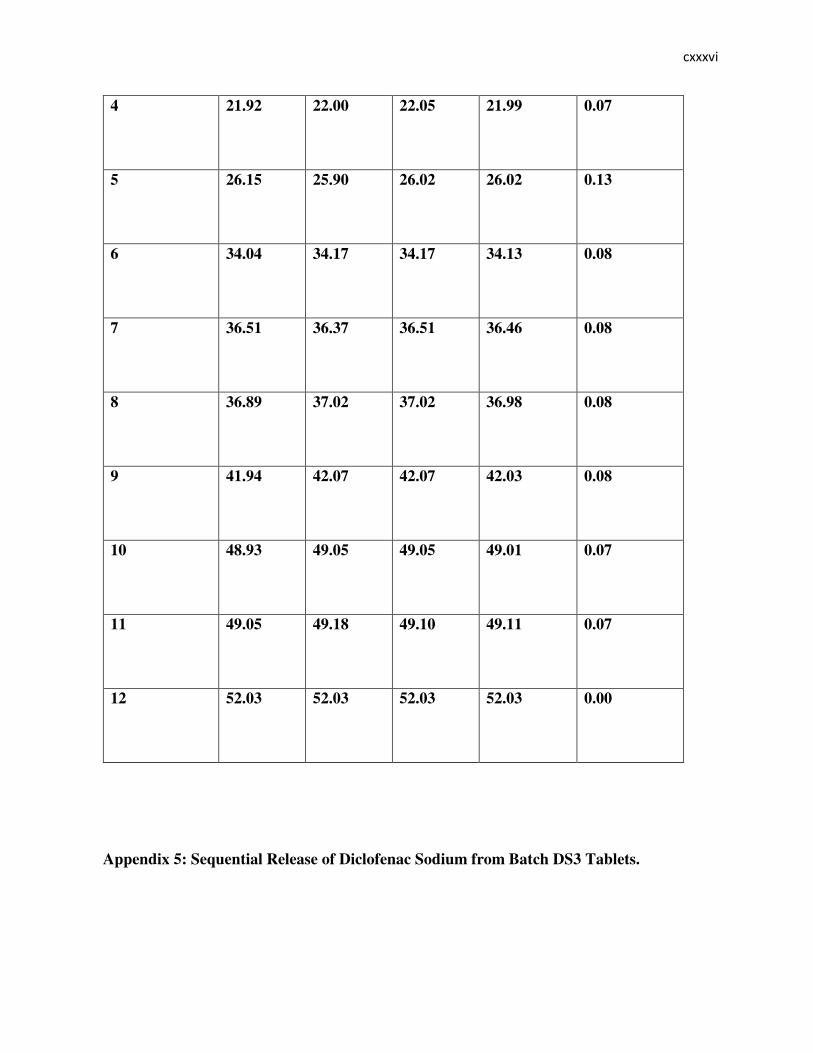
< ���
�
�
4 21.92 22.00 22.05 21.99 0.07
5 26.15 25.90 26.02 26.02 0.13
6 34.04 34.17 34.17 34.13 0.08
7 36.51 36.37 36.51 36.46 0.08
8 36.89 37.02 37.02 36.98 0.08
9 41.94 42.07 42.07 42.03 0.08
10 48.93 49.05 49.05 49.01 0.07
11 49.05 49.18 49.10 49.11 0.07
12 52.03 52.03 52.03 52.03 0.00
Appendix 5: Sequential Release of Diclofenac Sodium from Batch DS3 Tablets.
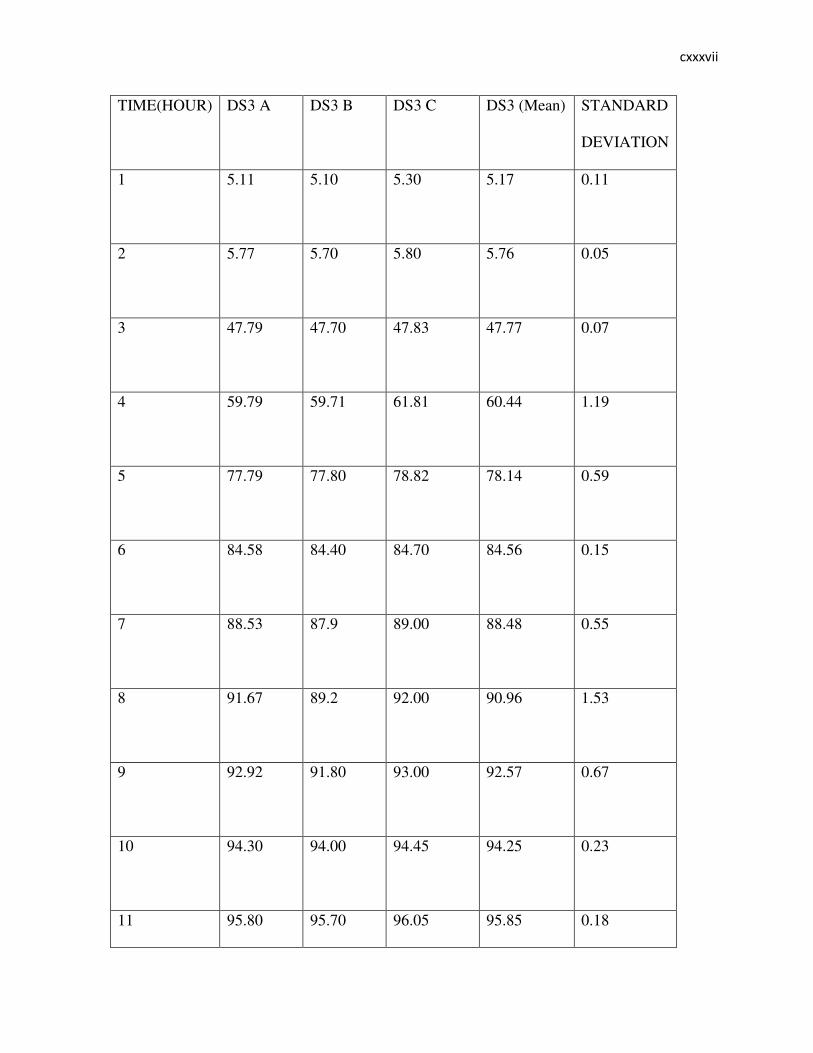
< ����
�
�
TIME(HOUR) DS3 A DS3 B DS3 C DS3 (Mean) STANDARD
DEVIATION
1 5.11 5.10 5.30 5.17 0.11
2 5.77 5.70 5.80 5.76 0.05
3 47.79 47.70 47.83 47.77 0.07
4 59.79 59.71 61.81 60.44 1.19
5 77.79 77.80 78.82 78.14 0.59
6 84.58 84.40 84.70 84.56 0.15
7 88.53 87.9 89.00 88.48 0.55
8 91.67 89.2 92.00 90.96 1.53
9 92.92 91.80 93.00 92.57 0.67
10 94.30 94.00 94.45 94.25 0.23
11 95.80 95.70 96.05 95.85 0.18

< �����
�
�
12 95.80 95.72 96.30 95.94 0.31

< � �
�
�
Appendix 6: Sequential release of Diclofenac Sodium from Batch DS 4 Tablets.
TIME(HOUR) DS4 A DS4 B DS4 C DS4
(Mean)
STANDARD
DEVIATION
1 1.20 1.20 1.21 1.20 0.01
2 1.35 1.35 1.35 1.35 0.00
3 15.14 15.14 15.14 15.14 0.00
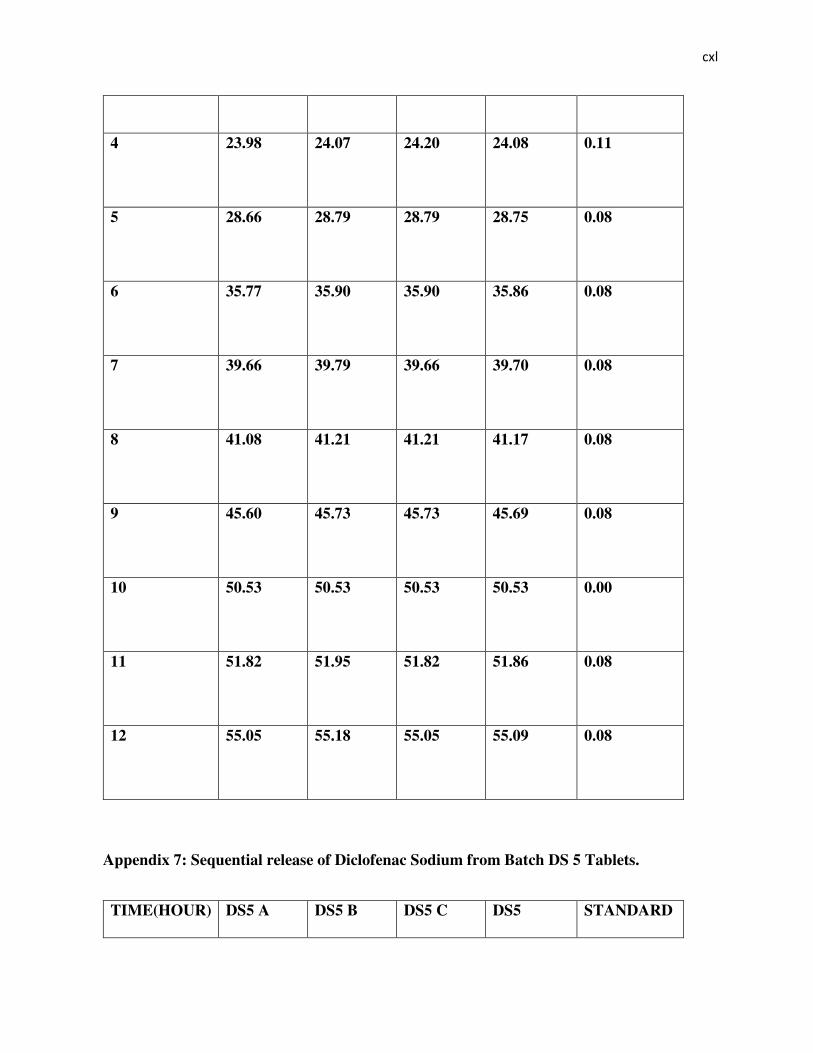
< ��
�
�
4 23.98 24.07 24.20 24.08 0.11
5 28.66 28.79 28.79 28.75 0.08
6 35.77 35.90 35.90 35.86 0.08
7 39.66 39.79 39.66 39.70 0.08
8 41.08 41.21 41.21 41.17 0.08
9 45.60 45.73 45.73 45.69 0.08
10 50.53 50.53 50.53 50.53 0.00
11 51.82 51.95 51.82 51.86 0.08
12 55.05 55.18 55.05 55.09 0.08
Appendix 7: Sequential release of Diclofenac Sodium from Batch DS 5 Tablets.
TIME(HOUR) DS5 A DS5 B DS5 C DS5 STANDARD
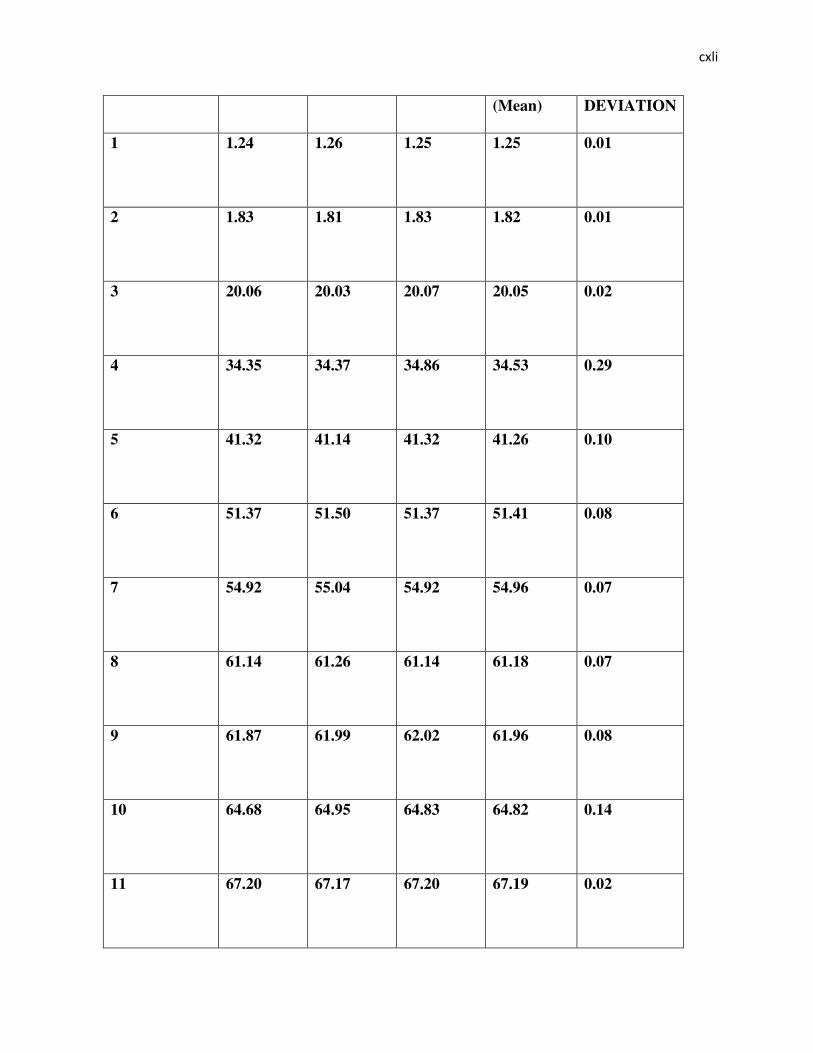
< ���
�
�
(Mean) DEVIATION
1 1.24 1.26 1.25 1.25 0.01
2 1.83 1.81 1.83 1.82 0.01
3 20.06 20.03 20.07 20.05 0.02
4 34.35 34.37 34.86 34.53 0.29
5 41.32 41.14 41.32 41.26 0.10
6 51.37 51.50 51.37 51.41 0.08
7 54.92 55.04 54.92 54.96 0.07
8 61.14 61.26 61.14 61.18 0.07
9 61.87 61.99 62.02 61.96 0.08
10 64.68 64.95 64.83 64.82 0.14
11 67.20 67.17 67.20 67.19 0.02

< ����
�
�
12 69.71 71.31 71.33 70.78 0.93
Appendix 8: Sequential release of Diclofenac Sodium from Batch DS 6 Tablets.
TIME(HOUR) DS6 A DS6 B DS6 C DSC
(Mean)
STANDARD
DEVIATION
1 3.36 3.36 3.36 3.36 0.00
2 4.23 4.23 4.23 4.23 0.00
3 41.20 41.41 41.61 41.41 0.21
4 50.12 50.73 49.82 50.22 0.46
5 52.74 52.88 52.88 52.83 0.08
6 55.84 55.70 55.84 55.79 0.08
7 58.36 58.51 58.51 58.46 0.08
8 60.73 60.87 60.87 60.82 0.08
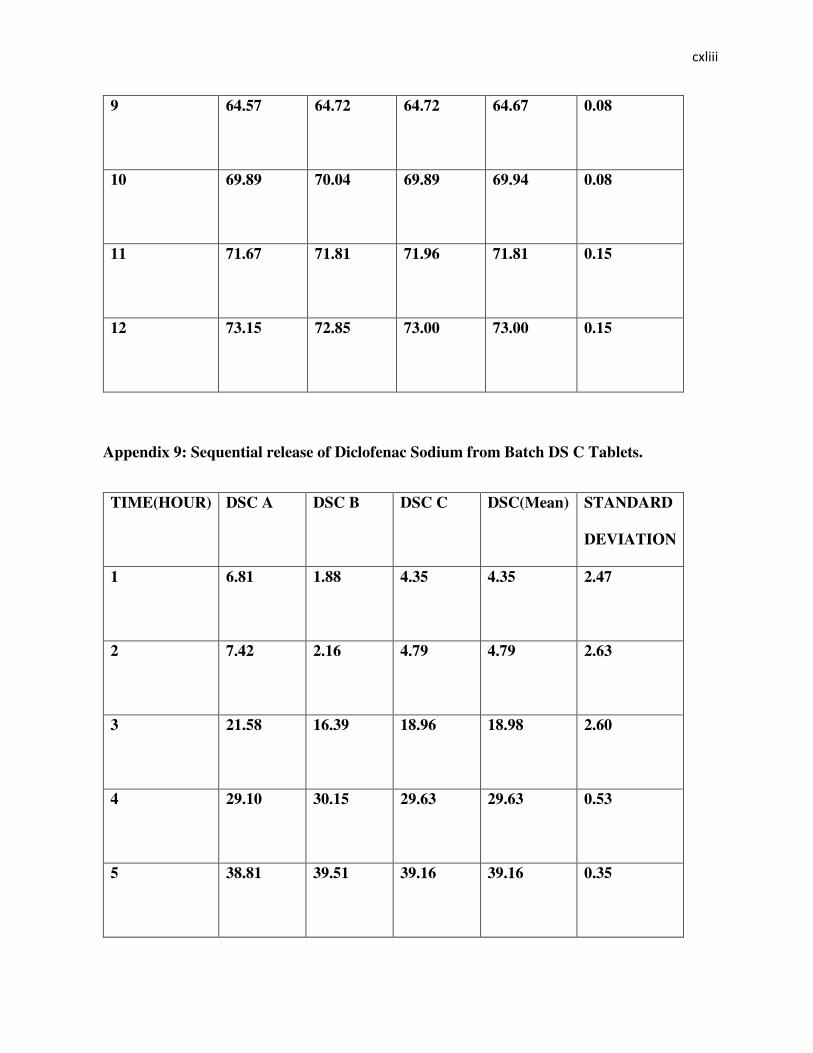
< �����
�
�
9 64.57 64.72 64.72 64.67 0.08
10 69.89 70.04 69.89 69.94 0.08
11 71.67 71.81 71.96 71.81 0.15
12 73.15 72.85 73.00 73.00 0.15
Appendix 9: Sequential release of Diclofenac Sodium from Batch DS C Tablets.
TIME(HOUR) DSC A DSC B DSC C DSC(Mean) STANDARD
DEVIATION
1 6.81 1.88 4.35 4.35 2.47
2 7.42 2.16 4.79 4.79 2.63
3 21.58 16.39 18.96 18.98 2.60
4 29.10 30.15 29.63 29.63 0.53
5 38.81 39.51 39.16 39.16 0.35
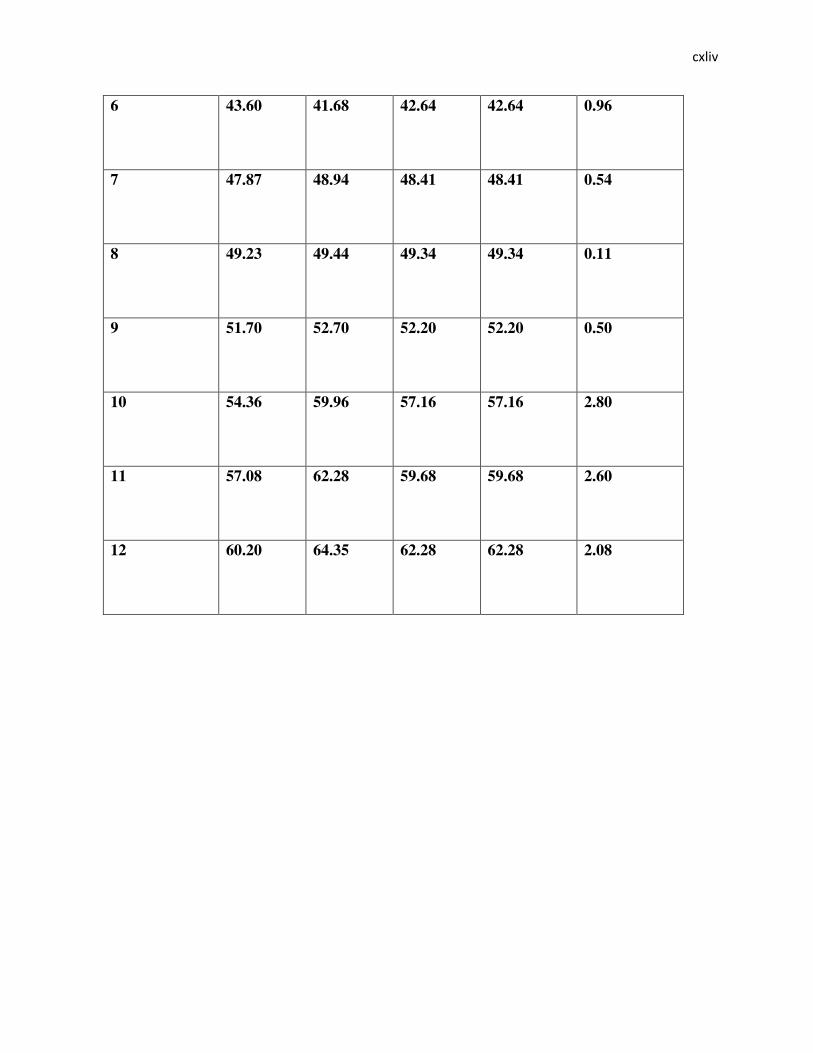
< ����
�
�
6 43.60 41.68 42.64 42.64 0.96
7 47.87 48.94 48.41 48.41 0.54
8 49.23 49.44 49.34 49.34 0.11
9 51.70 52.70 52.20 52.20 0.50
10 54.36 59.96 57.16 57.16 2.80
11 57.08 62.28 59.68 59.68 2.60
12 60.20 64.35 62.28 62.28 2.08

< ���
�
�
Appendix 10: Uniformity of weight test for batches DS 1, DS 2, DS 2’, DS 3, DS 4,
DS 5 and DS 6 Tablets.
DS 1
(mg)
DS 2
(mg)
DS 2’
(mg)
DS 3
(mg)
DS 4
(mg)
DS
5(mg)
DS 6
(mg)
1
398.9 396.6 402.8 418.3 405.2 400.8 397.4
2
403.1 390.2 405.0 409.7 408.1 402.1 401.7
3
399.0 410.0 408.0 414.3 408.7 401.8 405.2
4
401.2 401.4 402.5 402.1 401.6 401.6 406.7
5
403.3 402.4 403.2 396.2 403.7 399.8 407.1
6
393.1 398.8 399.5 408.8 405.0 405.1 403.3
7
391.5 406.5 407.0 410.1 402.8 404.3 405.6
8
404.1 412.7 406.2 397.8 402.6 406.1 405.8

< ����
�
�
9
400.0 407.0 405.1 392.8 401.8 407.0 403.7
10
412.8 397.4 407.3 400.8 405.2 403.2 404.7
11
396.4 408.3 405.0 409.2 402.1 403.8 405.2
12
411.0 418.0 406.0 401.6 406.3 405.1 404.8
13
393.3 420.4 407.1 411.8 407.2 404.1 407.1
14
405.3 413.7 403.5 403.0 404.8 408.3 403.5
15
401.5 393.0 404.0 405.7 402.1 402.7 406.1
16
406.5 404.7 390.5 405.6 403.5 402.1 403.7
17
415.0 410.7 398.6 406.1 404.8 399.3 405.2
18
390.4 392.1 401.7 409.4 401.7 397.5 402.5
19
398.9 396.1 404.2 398.7 403.2 401.7 399.1
20 400.6 393.6 408.1 408.9 405.1 406.3 406.4
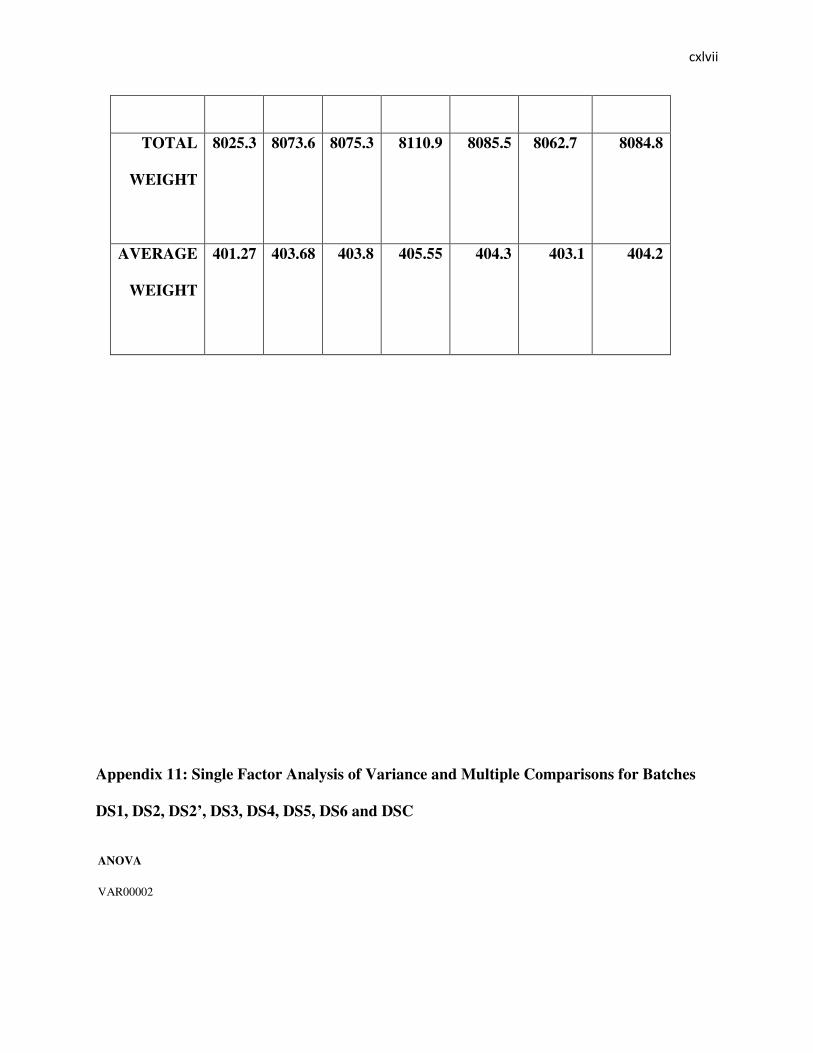
< �����
�
�
TOTAL
WEIGHT
8025.3 8073.6 8075.3 8110.9 8085.5 8062.7 8084.8
AVERAGE
WEIGHT
401.27 403.68 403.8 405.55 404.3 403.1 404.2
Appendix 11: Single Factor Analysis of Variance and Multiple Comparisons for Batches
DS1, DS2, DS2’, DS3, DS4, DS5, DS6 and DSC
ANOVA
VAR00002
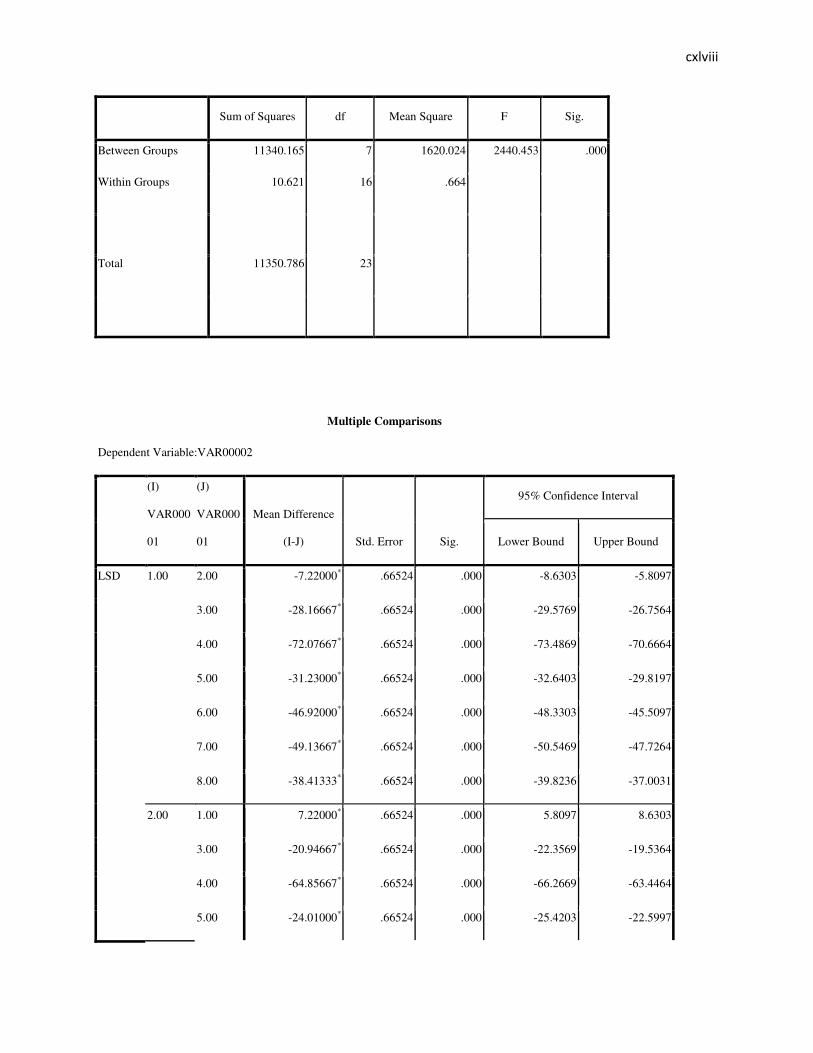
< ������
�
�
Sum of Squares df Mean Square F Sig.
Between Groups 11340.165 7 1620.024 2440.453 .000
Within Groups 10.621 16 .664
Total 11350.786 23
Multiple Comparisons
Dependent Variable:VAR00002
(I)
VAR000
01
(J)
VAR000
01
Mean Difference
(I-J) Std. Error Sig.
95% Confidence Interval
Lower Bound Upper Bound
LSD 1.00 2.00 -7.22000* .66524 .000 -8.6303 -5.8097
3.00 -28.16667* .66524 .000 -29.5769 -26.7564
4.00 -72.07667* .66524 .000 -73.4869 -70.6664
5.00 -31.23000* .66524 .000 -32.6403 -29.8197
6.00 -46.92000* .66524 .000 -48.3303 -45.5097
7.00 -49.13667* .66524 .000 -50.5469 -47.7264
8.00 -38.41333* .66524 .000 -39.8236 -37.0031
2.00 1.00 7.22000* .66524 .000 5.8097 8.6303
3.00 -20.94667* .66524 .000 -22.3569 -19.5364
4.00 -64.85667* .66524 .000 -66.2669 -63.4464
5.00 -24.01000* .66524 .000 -25.4203 -22.5997
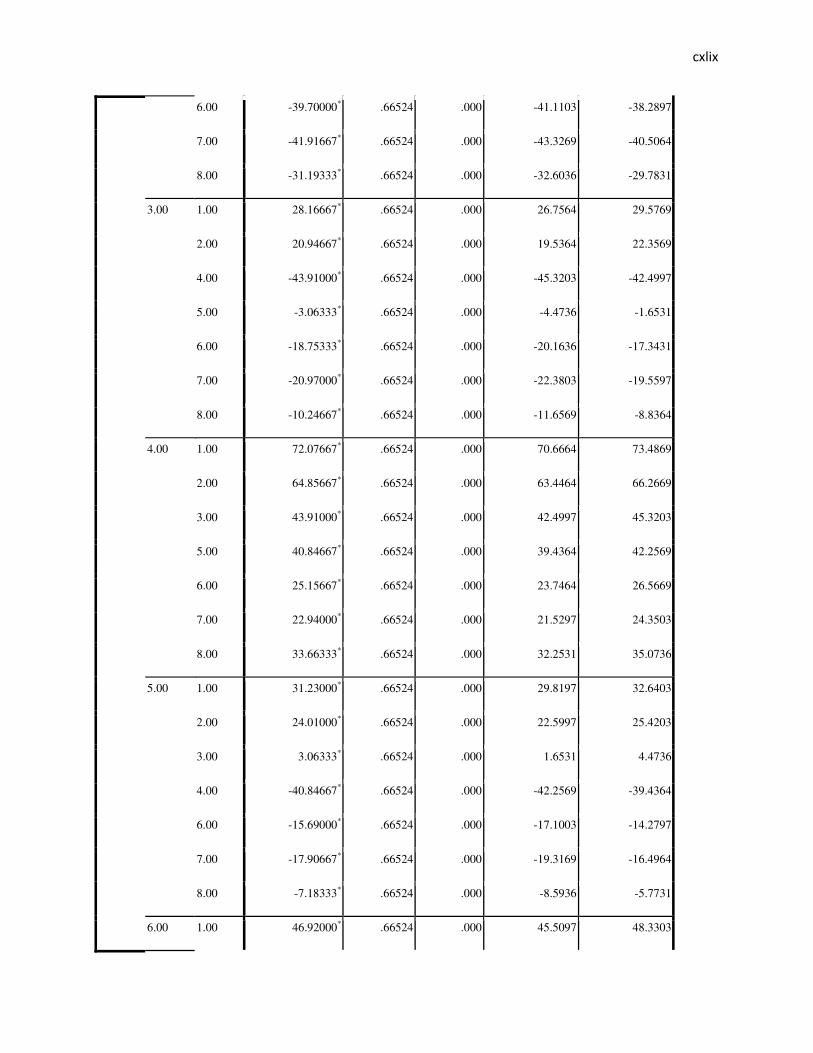
< �� �
�
�
6.00 -39.70000* .66524 .000 -41.1103 -38.2897
7.00 -41.91667* .66524 .000 -43.3269 -40.5064
8.00 -31.19333* .66524 .000 -32.6036 -29.7831
3.00 1.00 28.16667* .66524 .000 26.7564 29.5769
2.00 20.94667* .66524 .000 19.5364 22.3569
4.00 -43.91000* .66524 .000 -45.3203 -42.4997
5.00 -3.06333* .66524 .000 -4.4736 -1.6531
6.00 -18.75333* .66524 .000 -20.1636 -17.3431
7.00 -20.97000* .66524 .000 -22.3803 -19.5597
8.00 -10.24667* .66524 .000 -11.6569 -8.8364
4.00 1.00 72.07667* .66524 .000 70.6664 73.4869
2.00 64.85667* .66524 .000 63.4464 66.2669
3.00 43.91000* .66524 .000 42.4997 45.3203
5.00 40.84667* .66524 .000 39.4364 42.2569
6.00 25.15667* .66524 .000 23.7464 26.5669
7.00 22.94000* .66524 .000 21.5297 24.3503
8.00 33.66333* .66524 .000 32.2531 35.0736
5.00 1.00 31.23000* .66524 .000 29.8197 32.6403
2.00 24.01000* .66524 .000 22.5997 25.4203
3.00 3.06333* .66524 .000 1.6531 4.4736
4.00 -40.84667* .66524 .000 -42.2569 -39.4364
6.00 -15.69000* .66524 .000 -17.1003 -14.2797
7.00 -17.90667* .66524 .000 -19.3169 -16.4964
8.00 -7.18333* .66524 .000 -8.5936 -5.7731
6.00 1.00 46.92000* .66524 .000 45.5097 48.3303
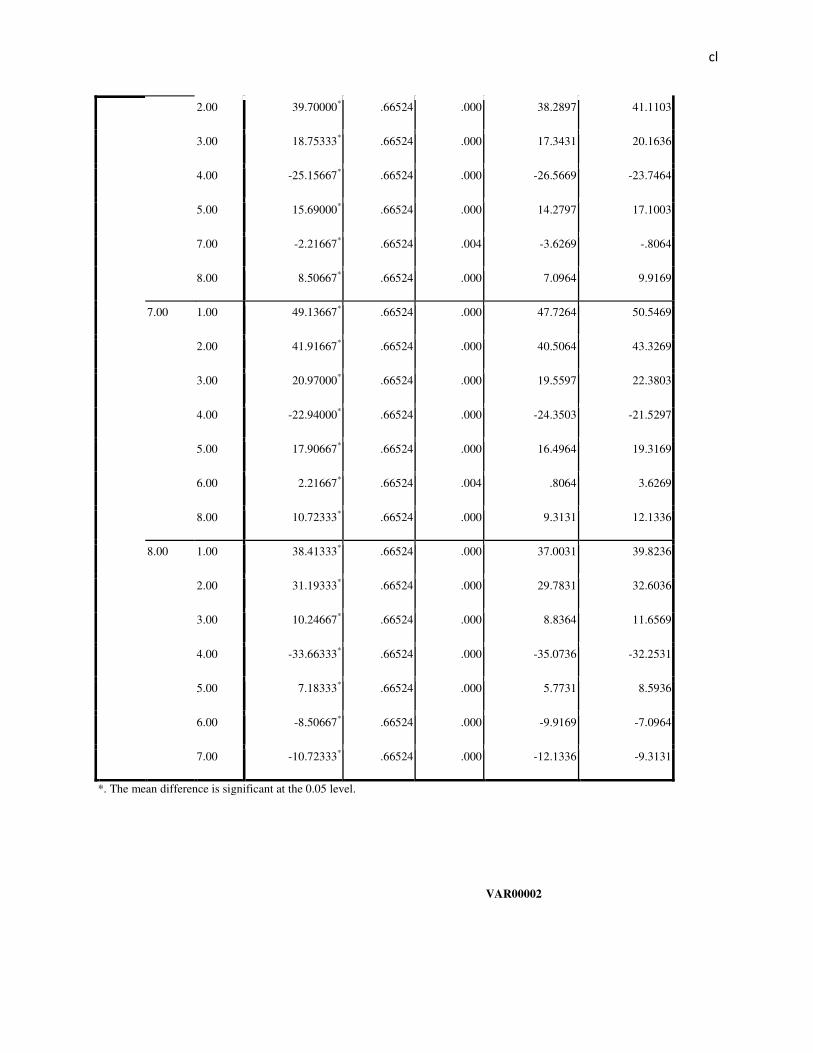
<��
�
�
2.00 39.70000* .66524 .000 38.2897 41.1103
3.00 18.75333* .66524 .000 17.3431 20.1636
4.00 -25.15667* .66524 .000 -26.5669 -23.7464
5.00 15.69000* .66524 .000 14.2797 17.1003
7.00 -2.21667* .66524 .004 -3.6269 -.8064
8.00 8.50667* .66524 .000 7.0964 9.9169
7.00 1.00 49.13667* .66524 .000 47.7264 50.5469
2.00 41.91667* .66524 .000 40.5064 43.3269
3.00 20.97000* .66524 .000 19.5597 22.3803
4.00 -22.94000* .66524 .000 -24.3503 -21.5297
5.00 17.90667* .66524 .000 16.4964 19.3169
6.00 2.21667* .66524 .004 .8064 3.6269
8.00 10.72333* .66524 .000 9.3131 12.1336
8.00 1.00 38.41333* .66524 .000 37.0031 39.8236
2.00 31.19333* .66524 .000 29.7831 32.6036
3.00 10.24667* .66524 .000 8.8364 11.6569
4.00 -33.66333* .66524 .000 -35.0736 -32.2531
5.00 7.18333* .66524 .000 5.7731 8.5936
6.00 -8.50667* .66524 .000 -9.9169 -7.0964
7.00 -10.72333* .66524 .000 -12.1336 -9.3131
*. The mean difference is significant at the 0.05 level.
VAR00002
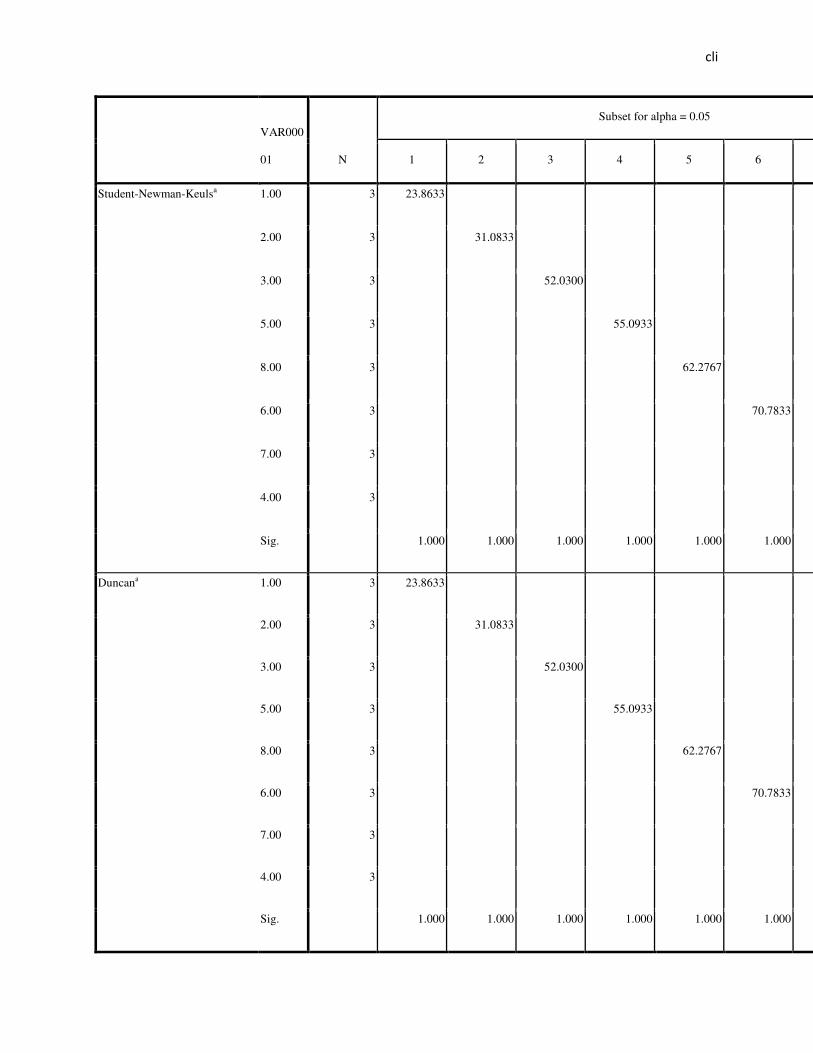
<���
�
�
VAR000
01 N
Subset for alpha = 0.05
1 2 3 4 5 6
Student-Newman-Keulsa 1.00 3 23.8633
2.00 3 31.0833
3.00 3 52.0300
5.00 3 55.0933
8.00 3 62.2767
6.00 3 70.7833
7.00 3
4.00 3
Sig. 1.000 1.000 1.000 1.000 1.000 1.000
Duncana 1.00 3 23.8633
2.00 3 31.0833
3.00 3 52.0300
5.00 3 55.0933
8.00 3 62.2767
6.00 3 70.7833
7.00 3
4.00 3
Sig. 1.000 1.000 1.000 1.000 1.000 1.000

<����
�
�
Means for groups in homogeneous subsets are displayed.
a. Uses Harmonic Mean Sample Size = 3.000.
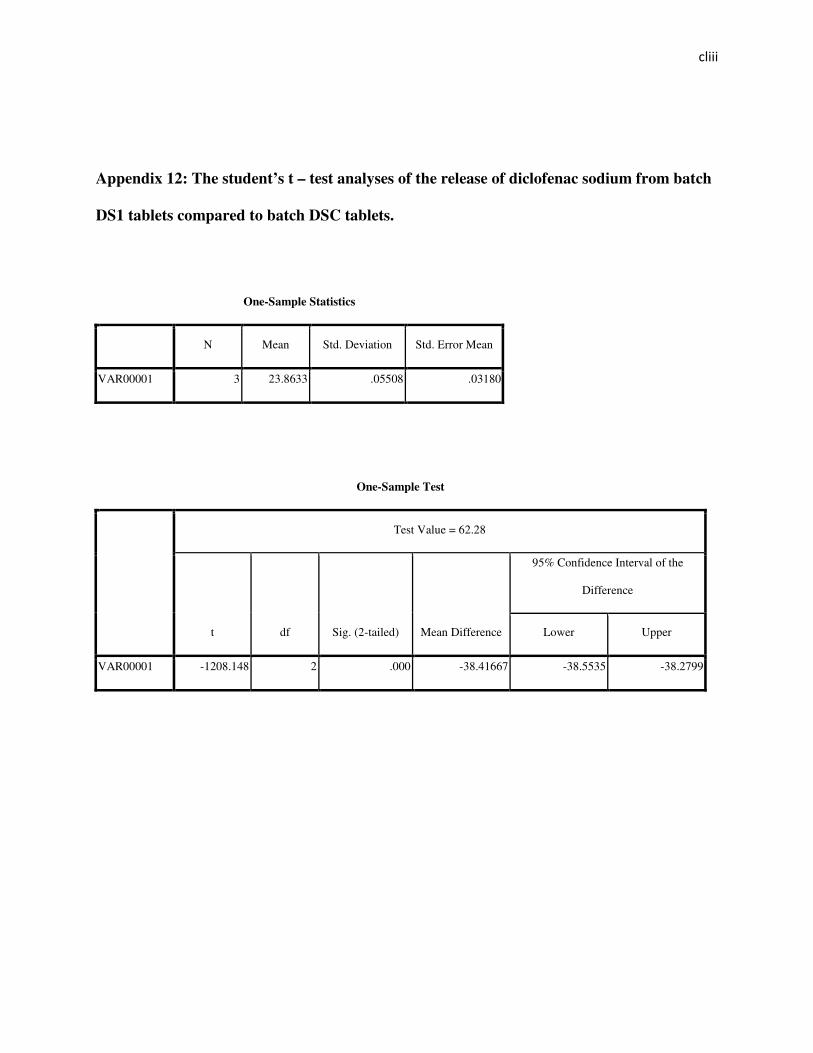
<�����
�
�
Appendix 12: The student’s t – test analyses of the release of diclofenac sodium from batch
DS1 tablets compared to batch DSC tablets.
One-Sample Statistics
N Mean Std. Deviation Std. Error Mean
VAR00001 3 23.8633 .05508 .03180
One-Sample Test
Test Value = 62.28
t df Sig. (2-tailed) Mean Difference
95% Confidence Interval of the
Difference
Lower Upper
VAR00001 -1208.148 2 .000 -38.41667 -38.5535 -38.2799
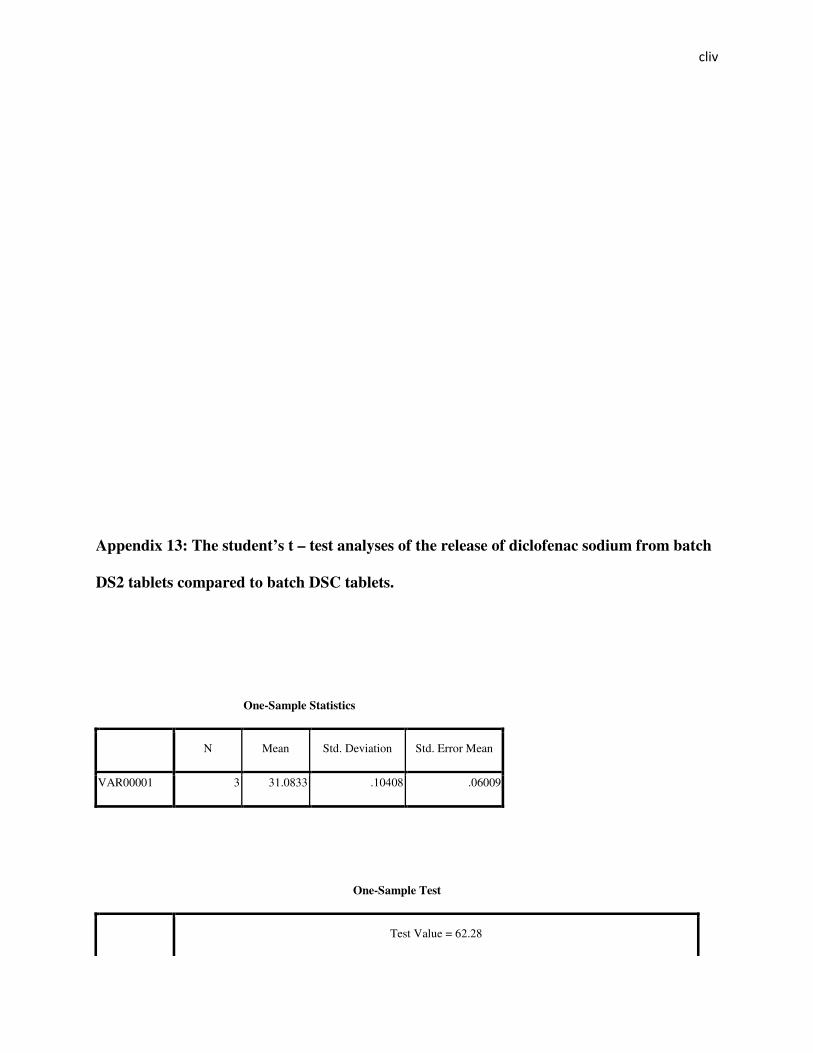
<����
�
�
Appendix 13: The student’s t – test analyses of the release of diclofenac sodium from batch
DS2 tablets compared to batch DSC tablets.
One-Sample Statistics
N Mean Std. Deviation Std. Error Mean
VAR00001 3 31.0833 .10408 .06009
One-Sample Test
Test Value = 62.28
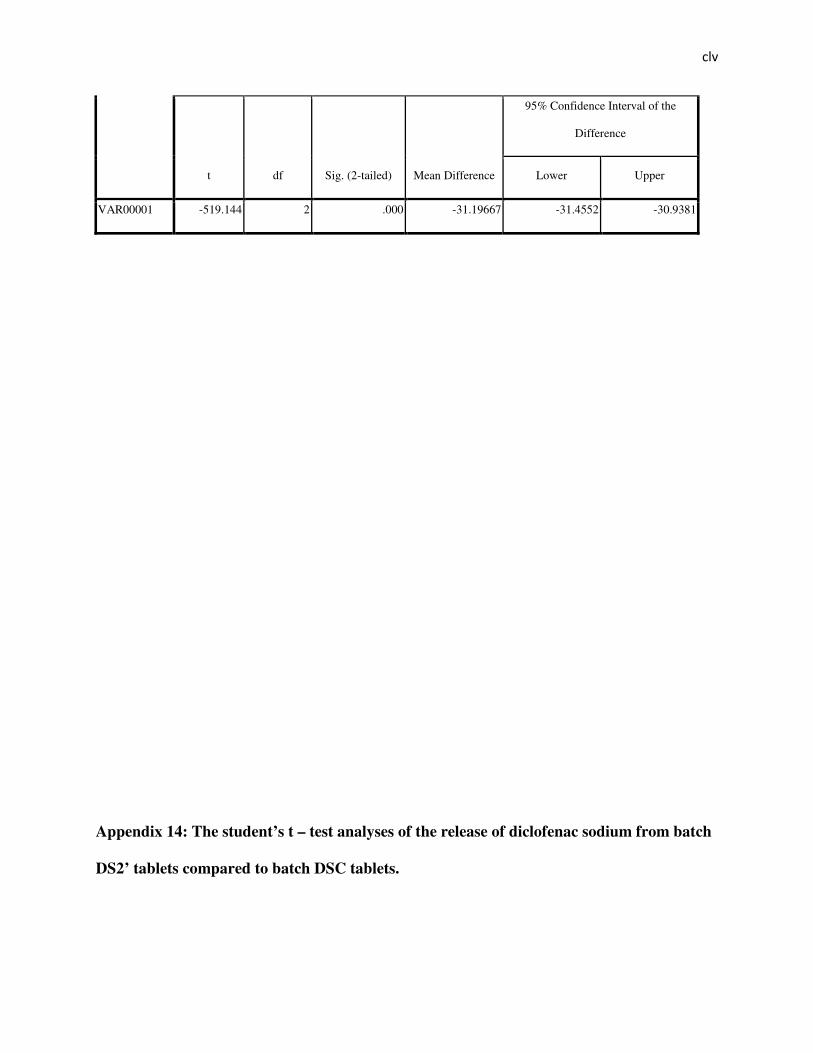
<���
�
�
t df Sig. (2-tailed) Mean Difference
95% Confidence Interval of the
Difference
Lower Upper
VAR00001 -519.144 2 .000 -31.19667 -31.4552 -30.9381
Appendix 14: The student’s t – test analyses of the release of diclofenac sodium from batch
DS2’ tablets compared to batch DSC tablets.

<����
�
�
Warnings
The One-Sample Test table is not produced.
One-Sample Statistics
N Mean Std. Deviation Std. Error Mean
VAR00001 3 52.0300 .00000a .00000
a. t cannot be computed because the standard deviation is 0.

<�����
�
�
Appendix 15: The student’s t – test analyses of the release of diclofenac sodium from batch
DS3 tablets compared to batch DSC tablets.
One-Sample Statistics
N Mean Std. Deviation Std. Error Mean
VAR00001 3 95.9400 .31432 .18148
One-Sample Test
Test Value = 62.28
t df Sig. (2-tailed) Mean Difference
95% Confidence Interval of the
Difference
Lower Upper
VAR00001 185.480 2 .000 33.66000 32.8792 34.4408
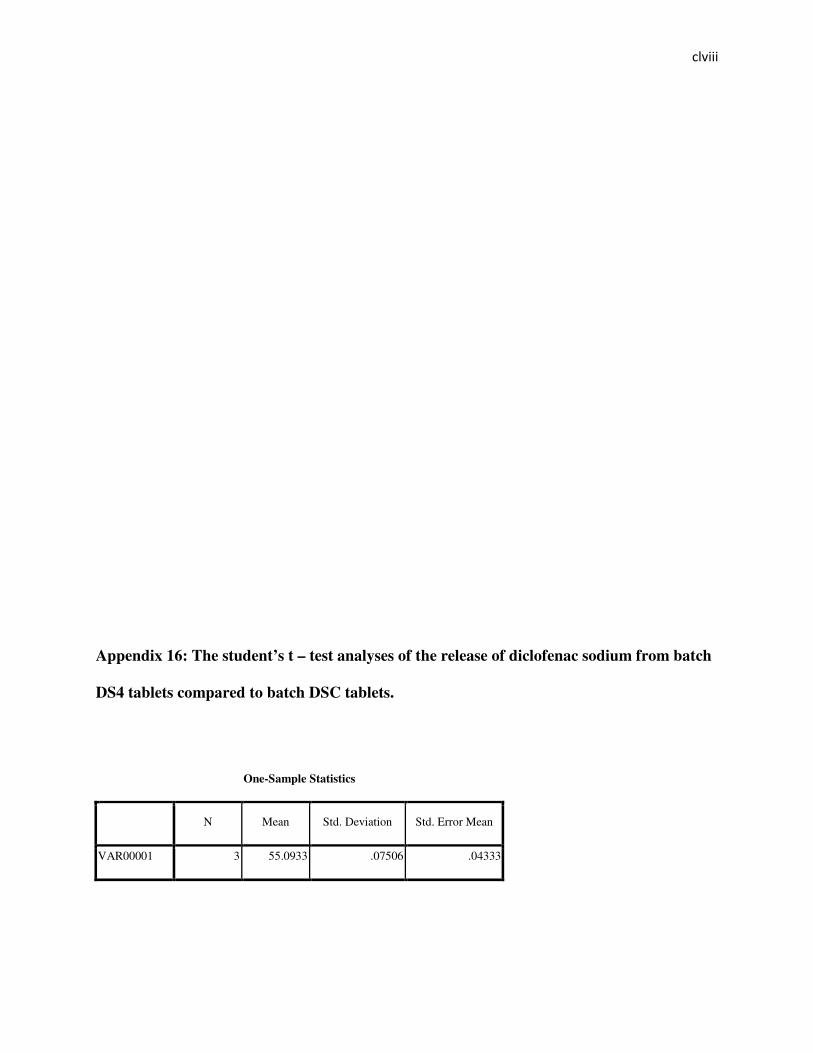
<������
�
�
Appendix 16: The student’s t – test analyses of the release of diclofenac sodium from batch
DS4 tablets compared to batch DSC tablets.
One-Sample Statistics
N Mean Std. Deviation Std. Error Mean
VAR00001 3 55.0933 .07506 .04333
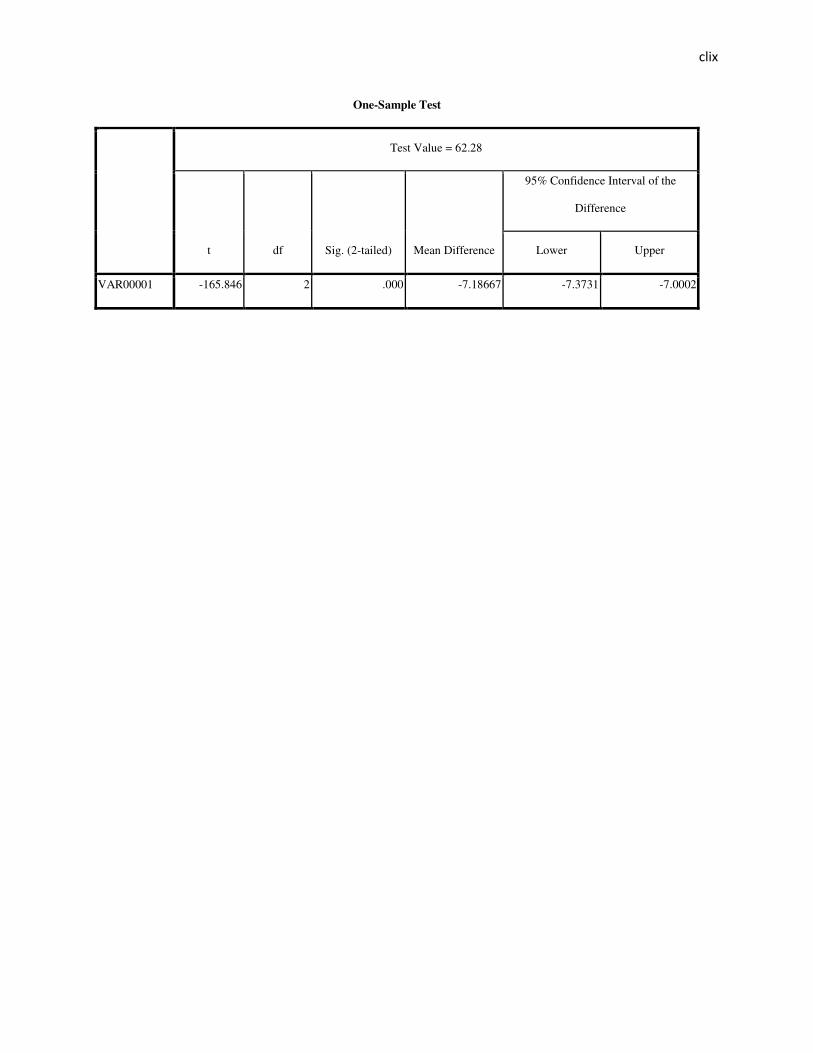
<�� �
�
�
One-Sample Test
Test Value = 62.28
t df Sig. (2-tailed) Mean Difference
95% Confidence Interval of the
Difference
Lower Upper
VAR00001 -165.846 2 .000 -7.18667 -7.3731 -7.0002
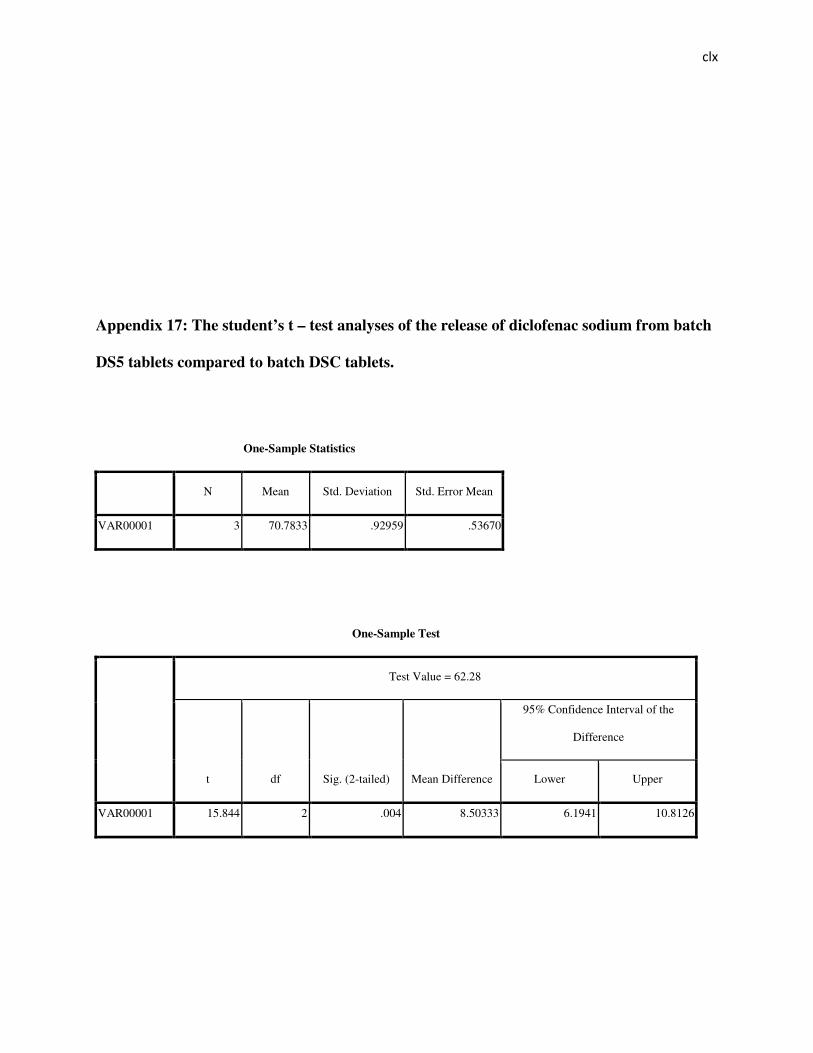
<� �
�
�
Appendix 17: The student’s t – test analyses of the release of diclofenac sodium from batch
DS5 tablets compared to batch DSC tablets.
One-Sample Statistics
N Mean Std. Deviation Std. Error Mean
VAR00001 3 70.7833 .92959 .53670
One-Sample Test
Test Value = 62.28
t df Sig. (2-tailed) Mean Difference
95% Confidence Interval of the
Difference
Lower Upper
VAR00001 15.844 2 .004 8.50333 6.1941 10.8126

<� ��
�
�
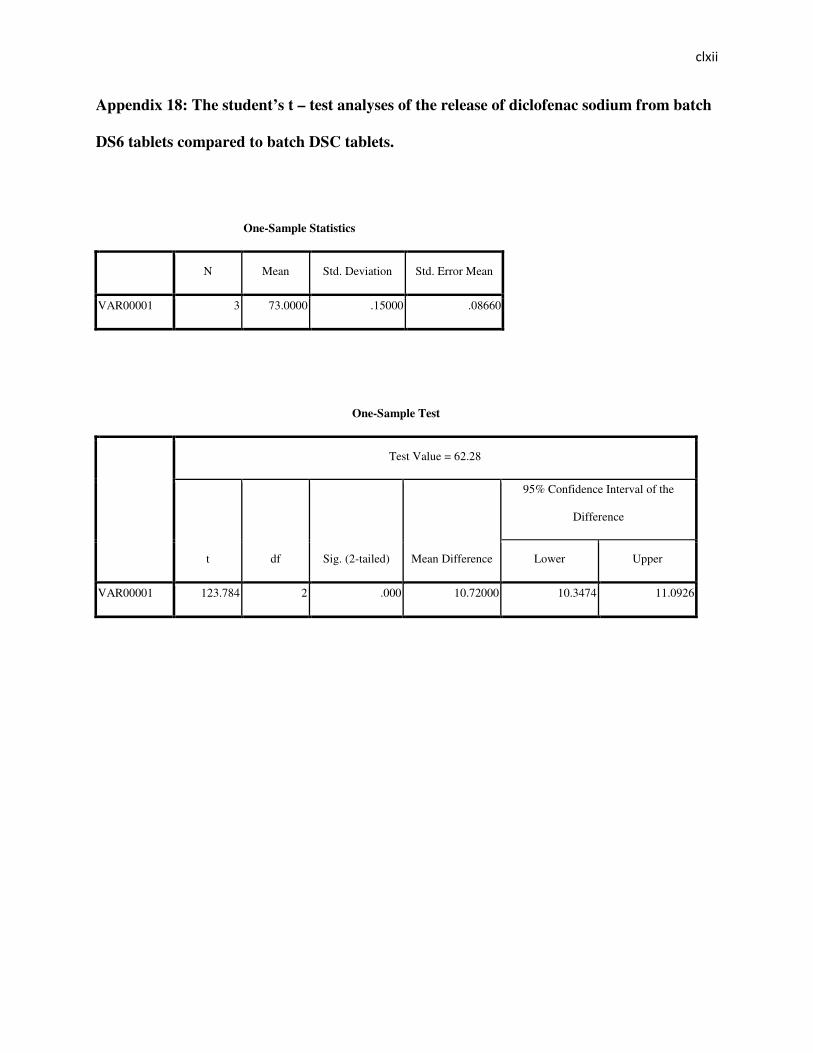
<� ���
�
�
Appendix 18: The student’s t – test analyses of the release of diclofenac sodium from batch
DS6 tablets compared to batch DSC tablets.
One-Sample Statistics
N Mean Std. Deviation Std. Error Mean
VAR00001 3 73.0000 .15000 .08660
One-Sample Test
Test Value = 62.28
t df Sig. (2-tailed) Mean Difference
95% Confidence Interval of the
Difference
Lower Upper
VAR00001 123.784 2 .000 10.72000 10.3474 11.0926
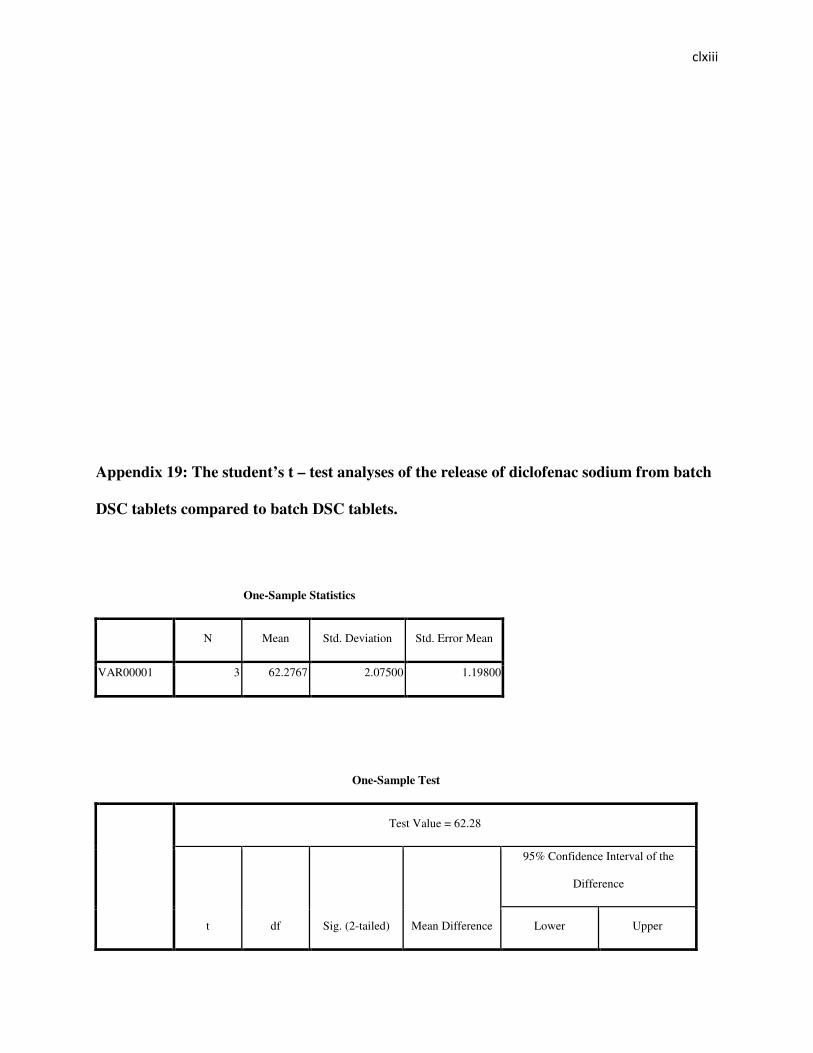
<� ����
�
�
Appendix 19: The student’s t – test analyses of the release of diclofenac sodium from batch
DSC tablets compared to batch DSC tablets.
One-Sample Statistics
N Mean Std. Deviation Std. Error Mean
VAR00001 3 62.2767 2.07500 1.19800
One-Sample Test
Test Value = 62.28
t df Sig. (2-tailed) Mean Difference
95% Confidence Interval of the
Difference
Lower Upper
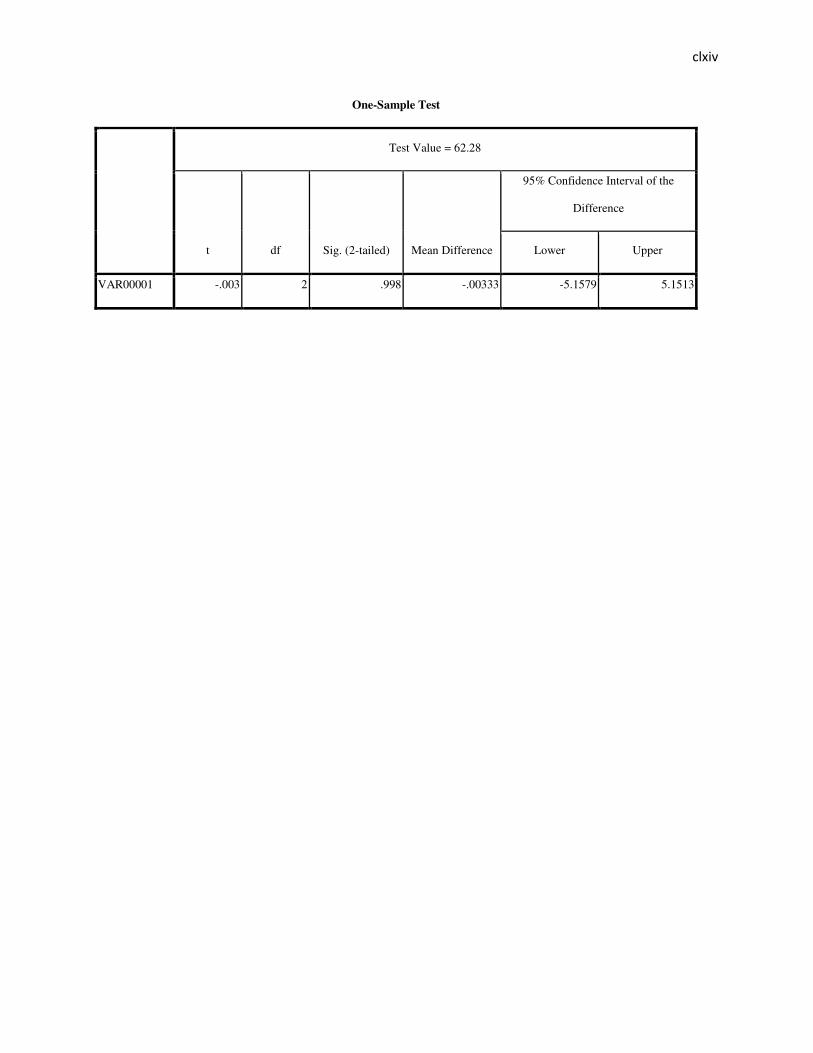
<� ���
�
�
One-Sample Test
Test Value = 62.28
t df Sig. (2-tailed) Mean Difference
95% Confidence Interval of the
Difference
Lower Upper
VAR00001 -.003 2 .998 -.00333 -5.1579 5.1513
![Index [rd.springer.com]978-94-011-1482-0/1.pdf · Cantharides 274 Capsicum 274 Carbomers 33 Carnauba wax 220 Carrageenan 75 Castor oil in lipstick 216-17 in nail enamel 251-2 Cationics,](https://img.pdfslide.us/doc/110x75/5d269df488c993e5378dcf9b/index-rd-978-94-011-1482-01pdf-cantharides-274-capsicum-274-carbomers.jpg)


![merged document 4 (1) - Amazon S3 · 40 Lake, Yellow 6 Lake, Carnauba Wax, Yellow 5 Lake, Blue 1 Lake, Red 3], Tapioca Starch, Calcium Carbonate and Sucralose. ALLERGY ALERT: This](https://img.pdfslide.us/doc/110x75/5e1beb75cccff911cc232e32/merged-document-4-1-amazon-s3-40-lake-yellow-6-lake-carnauba-wax-yellow-5.jpg)