Embed Size (px)
Citation preview

J Artif Organs (2006) 9:97–104 © The Japanese Society for Artificial Organs 2006DOI 10.1007/s10047-005-0327-7
ORIGINAL ARTICLE
Toshio Sato, PhD · Kiichi Tsuji, PhDNorimichi Kawashima, PhD · Tetsuzo Agishi, MD, PhDHiroshi Toma, MD
Evaluation of blood access dysfunction based on a wavelet transformanalysis of shunt murmurs
Abstract We investigated shunt murmurs based on wavelettransform analysis as a new method for assessing vascularaccess function. In the present study, in patients withvenous stenosis near an arteriovenous fistula (A-V fistula),a sensor was placed at different positions around the steno-sis and shunt murmur signals obtained using a measurementsystem were subjected to time–frequency analysis based onwavelet transforms. The shunt murmurs obtained from thestenotic region closely represented some features of mur-murs that are often referred to as “high-pitch” murmurs inthe clinical setting. In contrast, shunt murmurs obtainedabout 5cm downstream of the stenotic region closely repre-sented some features of murmurs that are often referred toas “low-pitch” murmurs in the clinical setting. Furthermore,with the aim of extending the lifespan of arteriovenousgrafts (A-V grafts) by detecting and treating stenotic lesionsbefore the A-V graft becomes occluded, we evaluated thepossibility of utilizing the present shunt murmur analysis formonitoring stenosis in such A-V grafts. When shunt mur-murs from patients with A-V grafts were analyzed, theresults suggested that the blood flow through the venousanastomosis of the graft was the most turbulent. Thispresent method whereby blood flow in an A-V fistula isassessed based on the frequency distribution on a time–frequency plane by wavelet transform analysis is advanta-geous because findings are not markedly affected by sensorattachment. Furthermore, because the sensor is attached
using an adhesive collar, measurements can be taken over ashort period of time before each dialysis session.
Key words Shunt murmurs · Wavelet transform · Vascularaccess · Arteriovenous fistula (A-V fistula) · Arteriovenousgraft (A-V graft)
Introduction
For the past 10 years, the number of chronic renal failurepatients has increased at an annual rate of around 7%, asanticipated, concomitantly increasing with numbers of dia-betic patients and elderly people. Recently, vascular accessproblems have become more common with the aging ofdialysis patients and elongation of the dialysis period.1,2
Adequate maintenance of vascular access is a critically im-portant issue.3 Although vascular access has to be evaluatedby angiography,4 digital subtraction angiography (DSA),three-dimensional computed tomography angiography(3D-CTA), magnetic resonance imaging (MRI), MR an-giography, or ultrasonography5 for precise decision of treat-ment modes, vascular access can be roughly assessed bycareful auscultation of the loudness and properties of vascu-lar murmurs from the blood flow around an arteriovenousfistula (A-V fistula). When a large amount of blood passesrapidly through the arteriovenous anastomosis fistula, tur-bulence is produced in the blood flow, causing the vascularwall to vibrate, thereby generating murmur-like sounds inthe vasulature. Clinically, the loudness of the murmurs re-lates to the amount of blood flow, while the frequency of thesound relates to the vascular diameter, i.e., the larger orsmaller the vessel diameter becomes, the lower or higherthe tone of the vascular murmurs. Interrupted vascularmurmurs generally indicate reduced venous wall compli-ance caused by phlebosclerosis or decreased aperture ofthe arteriovenous anastomosis caused by stenosis, becausemurmurs can hardly be heard during the diastole followingthe systole. Vascular access function can roughly be eluci-dated by clinically analyzing various combinations of these
Received: October 24, 2005 / Accepted: December 15, 2005
T. Sato (*) · K. Tsuji · N. KawashimaDepartment of Clinical Engineering, Faculty of BiomedicalEngineering, Toin University of Yokohama, 1614 Kurogane-cho,Aoba-ku, Yokohama 225-8502, JapanTel./Fax +81-45-974-5115e-mail: [email protected]
T. AgishiBlood Purification Center, Itabashi Chuo General Hospital, Tokyo,Japan
H. TomaTokyo Women’s Medical University, Tokyo, Japan

98
murmurs. However, as this auscultation assessment is sub-jective and based on experience obtained by listening tovarious murmurs that depend on different clinical symp-toms, it is neither quantitative nor objective. When differentdialysis staff members listen to the same murmur(s), theirdiagnoses may sometimes vary and it is not possible forthem to explain the diagnostic findings to other staff mem-bers. Moreover, it has been impossible to predict the onsetof vascular access problems based on chronological changesbecause vascular murmurs cannot be saved as diagnosticdata. Therefore, investigation of vascular murmurs basedon wavelet transform analysis was carried out as a newmethod for assessing vascular access function. This methodcan be performed routinely by dialysis staff members in aquantitative and objective manner and enables the data tobe stored. In addition, if venous stenosis exists downstreamof the anastomosis of an A-V fistula, different vascularmurmurs may be heard depending on the position of auscul-tation. In the present study, a sensor was placed at differentpositions around the venous stenosis in a patient, and vascu-lar murmur signals obtained from the sensor were analyzedby time–frequency analysis based on a wavelet transform.
Because the number of long-term dialysis patients, espe-cially diabetics and elderly patients requiring dialysis, hasbeen increasing, the number of patients requiring arterio-venous grafts (A-V grafts) has increased, and treatment oftheir complications is clinically important.6 A major compli-cation of such A-V grafts is thrombotic occlusion, which issecondary to a stenotic lesion in 80% of cases.7 Subse-quently, with the aim of extending the lifespan of A-V graftsby detecting and treating stenotic lesions before the A-Vgraft becomes occluded,8 the possibility of utilizing thepresent vascular murmur analysis for monitoring stenosis insuch A-V grafts was also assessed.
Methods
Figure 1 shows the vascular murmur measuring system. Acardiac sound sensor (TA-701T; Nihon Kohden, Tokyo,
Japan) was used to detect the vascular murmurs. This is afloating-type acceleration cardiac sound sensor that detectscardiac sound signals on the body surface. The size of thesensor is φ 20 × 16mm and it weighs 41g. To cover the entirewave frequency range of cardiac sounds, it has a frequencypass band of 20–1000Hz and a resonance frequency ofaround 550Hz. The sensitivity is 0.1V/(m/s2) at 150Hz. Thesensor was powered by a special battery box (SB-701S;Nihon Kohden). The vascular murmur signals detected bythe sensor were amplified using a cardiac sound coupler(AS-650H; Nihon Kohden) consisting of a high-input-impedance amplifier and a cardiac sound amplifier (AS-611H; Nihon Kohden) consisting of four bandpass filters (L,M1, M2, and H). The amplified signals were subjected to A/D conversion using a biomedical research system (LEG-1000; Nihon Kohden) and analyzed by a computer. Becausefrequency components of the vascular murmurs are ap-proximately 20–800Hz, an L filter with the lowest pass band(cutoff frequency 50Hz, roll-off 6dB/oct) was used.
Prior to measuring the vascular murmurs, three tech-niques were investigated for attaching the cardiac soundsensor: applying a double-sided adhesive collar (356125A,Nihon Kohden), taping with a surgical tape, and a combina-tion of both methods. When the measured signals werecompared with respect to these attachment methods, nomarked difference was apparent. However, a strong pressurefrom the sensor compresses and damages the A-V fistula ifthe sensor is attached with surgical tape, so the sensor wasattached with an adhesive collar in the present study.
Vascular murmurs, in general, exhibit local periodic fluc-tuations, while their frequency changes with time. More-over, the quality of blood flow through the A-V fistula forpersistent murmurs during the diastole following the systolediffers from that for short and interrupted murmurs. Inother words, time data as well as wave frequency data havea large clinical significance. Time–frequency analysis using awavelet transform is effective in analyzing the vascularmurmur signals from the standpoints of time and wave fre-quency, i.e., locally periodic signals are examined in termsof chronological changes, and time-related data are ob-
Fig. 1. The shunt murmurmeasurement system

99
tained simultaneously.9 Genex Waverober (Nihon Bussei,Tokyo, Japan) was used to analyze wavelet-transformedsignals, and Gabor’s mother wavelet based on Eq. 1 wasused as the mother wavelet ik n the wavelet transformanalysis.10
Ψ t e e
tit( ) = ⋅
− −1
2
2
2
πσσ (1)
Here, σ indicates an arbitrary real number, i is the imagi-nary unit, and t is time. As an example of a wavelet gener-ated by Eq. 1, Fig. 2 shows the shape of the mother waveletwith a σ value of 8. This signal, extracted using the wavelet,represents the position along the time axis and the localfrequency. Using a time–frequency plane consisting of thetime and frequency axes as shown in Fig. 3 and assumingthat the innermost signal in this figure is a local and periodicvascular murmur signal, it is possible to express how wavefrequency components are distributed at each positionalong the time axis based on the preceding waveletcomponents.
Using this system, the vascular murmurs from a dialysispatient with venous stenosis were measured at the BloodPurification Center, Itabashi Chuo Medical Center, Tokyo.Figure 4 shows the sensor attachment positions and a DSAimage from the patient with venous stenosis downstream ofthe arteriovenous fistula. The vessel diameter was reducedby venous stenosis to approximately 60% of the value at the
time of preparation of the A-V fistula, and the amount ofblood flow during dialysis was poor at 170ml/min. The sen-sor was placed at the following three positions: position 1, astenotic region; position 2, the immediate downstream areato the stenotic region; and position 3, approximately 5cmdownstream of the stenotic region. Because the hemody-namics of an A-V fistula cannot be analyzed accuratelyduring dialysis, the vascular murmurs were measured prior
Fig. 2. The shape of a Gabor’s mother wavelet with a σ value of 8
Fig. 3. Shunt murmur signal and wavelet components in the time–frequency plane11
Fig. 4. Digital subtraction angiography image showing sensor attach-ment positions from a patient with venous stenosis downstream of anarteriovenous anastomosis
100
to dialysis. In addition, the cardiac sound amplifier was setat 30dB to compare the amplitudes of the vascular murmursignals at each position. The sampling frequency of the A/Dconverter during measurement was set at 5kHz.
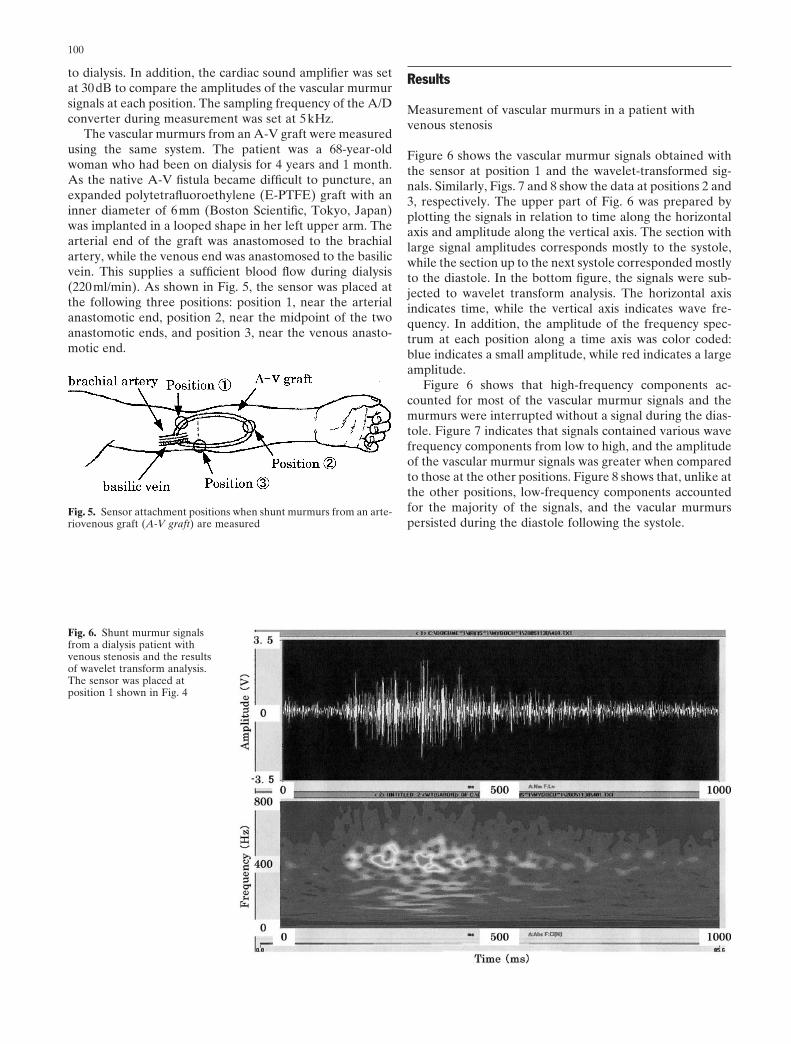
The vascular murmurs from an A-V graft were measuredusing the same system. The patient was a 68-year-oldwoman who had been on dialysis for 4 years and 1 month.As the native A-V fistula became difficult to puncture, anexpanded polytetrafluoroethylene (E-PTFE) graft with aninner diameter of 6mm (Boston Scientific, Tokyo, Japan)was implanted in a looped shape in her left upper arm. Thearterial end of the graft was anastomosed to the brachialartery, while the venous end was anastomosed to the basilicvein. This supplies a sufficient blood flow during dialysis(220ml/min). As shown in Fig. 5, the sensor was placed atthe following three positions: position 1, near the arterialanastomotic end, position 2, near the midpoint of the twoanastomotic ends, and position 3, near the venous anasto-motic end.
Results
Measurement of vascular murmurs in a patient withvenous stenosis
Figure 6 shows the vascular murmur signals obtained withthe sensor at position 1 and the wavelet-transformed sig-nals. Similarly, Figs. 7 and 8 show the data at positions 2 and3, respectively. The upper part of Fig. 6 was prepared byplotting the signals in relation to time along the horizontalaxis and amplitude along the vertical axis. The section withlarge signal amplitudes corresponds mostly to the systole,while the section up to the next systole corresponded mostlyto the diastole. In the bottom figure, the signals were sub-jected to wavelet transform analysis. The horizontal axisindicates time, while the vertical axis indicates wave fre-quency. In addition, the amplitude of the frequency spec-trum at each position along a time axis was color coded:blue indicates a small amplitude, while red indicates a largeamplitude.
Figure 6 shows that high-frequency components ac-counted for most of the vascular murmur signals and themurmurs were interrupted without a signal during the dias-tole. Figure 7 indicates that signals contained various wavefrequency components from low to high, and the amplitudeof the vascular murmur signals was greater when comparedto those at the other positions. Figure 8 shows that, unlike atthe other positions, low-frequency components accountedfor the majority of the signals, and the vacular murmurspersisted during the diastole following the systole.
Fig. 5. Sensor attachment positions when shunt murmurs from an arte-riovenous graft (A-V graft) are measured
Fig. 6. Shunt murmur signalsfrom a dialysis patient withvenous stenosis and the resultsof wavelet transform analysis.The sensor was placed atposition 1 shown in Fig. 4

101
Measurement of vascular murmurs from an A-V graft
Figure 9 shows the vascular murmur signals obtained atposition 1 near the arterial anastomotic region and the re-sults of wavelet transform analysis. Similarly, Figs. 10 and 11show the data from position 2 near the midpoint of the twoanastomotic regions and position 3 near the venous anasto-motic region, respectively.
Figure 9 also shows that at position 1, the vascular mur-mur signals consisted mostly of low-frequency components,
Fig. 7. Shunt murmur signalsfrom a dialysis patient withvenous stenosis and the resultsof wavelet transform analysis.The sensor was placed atposition 2 shown in Fig. 4
Fig. 8. Shunt murmur signalsfrom a dialysis patient withvenous stenosis and the resultsof wavelet transform analysis.The sensor was placed atposition 3 shown in Fig. 4
and furthermore, murmurs persisted during the diastolefollowing the systole, resulting in relatively continuous mur-murs. In contrast, as shown in Fig. 10, high-frequency com-ponents increased at position 2, and as shown in Fig. 11,murmurs with various wave frequency components fromlow to high frequencies coexisted at position 3. Moreover,the amplitude of the vascular murmur signals was least atposition 1, increased towards position 2, and was greatest atposition 3.

102
Fig. 9. Shunt murmur signalsfrom an A-V graft and theresults of wavelet transformanalysis. The sensor was placedat position 1 shown in Fig. 5
Fig. 10. Shunt murmur signalsfrom an A-V graft and theresults of wavelet transformanalysis. The sensor was placedat position 2 shown in Fig. 5
Discussion
The results obtained from the vascular murmur measure-ment in the patient with venous stenosis indicate that thevascular murmurs obtained from the stenotic region, shownin Fig. 6 correspond to murmurs that are often referred to as“high-pitch” murmurs in the clinical setting. The vascularmurmurs shown in Fig. 7 obtained downstream of thestenotic region had a wide range of frequency components,and the amplitude of the shunt murmur signals was largest
at this position. This indicates that the blood flow at thisposition was the most turbulent. In contrast, the vascularmurmurs obtained about 5cm downstream of the stenoticregion, shown in Fig. 8, correspond to murmurs that areoften referred to as “low-pitch” murmurs in the clinicalsetting. The amplitude of the vascular murmur signals wasthe lowest cut because the vascular murmur became smalleras the blood flow changed from turbulent to laminar withincreasing distance from the stenotic region. Also, the posi-tion of the sensor was moved back and forth along the veinshown in Fig. 4, and as long as the blood flow condition was

103
the same, the results obtained by wavelet transform analysistended to exhibit the same findings. Hence, the requirementfor sensor position reproducibility is not that strict.
For the patient with the A-V graft, when moving thesensor from the region upstream of the arterial anastomosistoward the downstream region, the amplitude of shunt mur-mur signals increased. This was because although the bloodflow near the arterial anastomotic region was mostly lami-nar, that near the venous anastomotic region was mostlyturbulent. The data obtained near the venous anastomosisshown in Fig. 11 were similar to those shown in Fig. 7,suggesting that the blood flow through the venous anasto-mosis of the graft was the most turbulent. Stenosis of thevenous anastomosis is reported to cause 90% of A-V graftocclusions.12 This results from venous intimal hyperplasia,which is related to a large shear stress applied to the vesselwall.13,14 In addition, the shear stress is related to blood flow,and a large turbulent component indicates a large shearstress.15 Therefore, the findings of the vascular murmurmeasurements obtained correspond to the clinical findings:venous stenosis as a result of venous intimal hyperplasiaoccurred because the shear stress applied to the vascularwall was large and the blood flow was most turbulent at thevenous anastomosis.
From the viewpoint of clinically useful assessment ofvascular access, the present method compares to existingmethods as follows. First, the present method is inferior toangiography in assessing the location and severity of steno-sis in terms of reproducibility and reliability. However,angiography is more invasive because a contrast mediumneeds to be administered and irradiation performed.Therefore, to minimize the number of angiographic studiesperformed, thorough screening tests are important.Consequently, we believe that the present method couldcontribute to the clinical assessment of vascular access as a
screening test with high accuracy. In terms of convenience,because the present method requires the equipment shownin Fig. 1, it is markedly inferior to auscultation. At present,we are in the process of developing a small integrateddevice consisting of a computer, A/D converter, andamplifier, and we have already constructed a test model thatcan measure shunt murmurs within a few minutes at thebedside. Therefore, we believe that the present methodwill become just as convenient as auscultation in the nearfuture.
As far as measurement of shunt murmurs by the presentmethod in A-V fistula patients is concerned, blood flowthrough the fistula was poor at around 150ml/min in tenpatients, but in all of these patients, results similar to thoseshown in Fig. 6–8 were obtained. We also confirmedthe validity of sensor positioning around angiographicallyconfirmed stenoses. Furthermore, shunt murmurs weremeasured before and after percutaneous transluminalangioplasty (PTA) that was performed to treat stenosis, andwe confirmed high-pitch murmurs as shown in Fig. 6 beforePTA, and low-pitch murmurs as shown in Fig. 8 after PTA.Similar findings were obtained in ten A-V graft patients,and although the number of patients was low, reproducibil-ity and objectivity appear to be fairly high at this point intime.
Meanwhile, another method has been proposed to ascer-tain the condition of A-V fistulas. In this method, the condi-tion of an A-V fistula is determined based on the extent ofreduction in the volume of the vascular murmurs in relationto a preset lower limit. Clinical experience suggests thatvascular murmur volume is closely correlated to the amountof blood flowing through an A-V fistula. However, our ex-perience indicated that the volume of a vascular murmur isaffected markedly by how and where the sensor is attached.In other words, the vascular murmurs change markedly
Fig. 11. Shunt murmur signalsfrom an A-V graft and theresults of wavelet transformanalysis. The sensor was placedat position 3 shown in Fig. 5

104
depending on many factors that are not directly related toblood flow in itself, e.g., the condition of the skin where thesensor is attached and sensor displacement or looseningcaused by body movements. Furthermore, it is necessary toattach a highly reproducible sensor for a long period of timewhen we wish to ascertain chronological changes in thevascular murmurs, but this requires a great deal of skill. Thepresent method whereby the blood flow in an A-V fistula isassessed based on the wave frequency distribution on atime–frequency plane by wavelet transform analysis isadvantageous because the findings thus obtained are notmarkedly affected by sensor attachment. Furthermore, as asensor is attached using an adhesive collar, measurementscan be taken over a short period of time before each dialysissession. Moreover, the present method is much less expen-sive than ultrasonography, and this diagnostic cut techniqueis superior because the results are visually presented in aneasily understandable time–frequency plane.
Conclusion
Adequate maintenance of vascular access is an importantissue for dialysis patients. We therefore investigated vascu-lar murmurs based on a wavelet transform analysis as a newmethod for assessing the condition of vascular access. Thepresent method, by which blood flow through an A-V fistulais assessed based on the frequency distribution on the time–frequency plane by wavelet transform analysis is advanta-geous because findings are not markedly affected by sensorattachment. Furthermore, as a sensor is attached using anadhesive collar, measurements can be taken over a shortperiod of time before each dialysis session. A sensor wasplaced at different positions around the stenosis in patientswith venous stenosis, and the vascular murmur signals ob-tained using a measurement system were subjected to atime–frequency analysis based on a wavelet transform. Thevascular murmurs obtained from the stenotic region closelyrepresented some features of murmurs that are often re-ferred to as “high-pitch” murmurs in the clinical setting. Incontrast, shunt murmurs obtained about 5cm downstreamof the stenotic region closely represented some features ofmurmurs that are often referred to as “low-pitch” murmursin the clinical setting.
Furthermore, with the aim of extending the lifespan ofA-V grafts by detecting and treating stenotic lesions beforethe A-V graft becomes completely occluded, we evaluatedthe possibility of utilizing the present vascular murmur
analysis for monitoring stenosis in such A-V grafts. Analysisof the vascular murmurs from the patient with an A-V graftsuggested that the blood flow through the venous anasto-mosis of the graft was the most turbulent. The vascularmurmur measurement findings matched the clinical findingswell: venous stenosis as a result of venous intimal hyperpla-sia occurred because the shear stress applied to the vascularwall was large and the blood flow was the most turbulent atthe venous anastomosis.
References
1. Wong V, Ward R, Taylor J, Selvakumar S, How TV, Bakran A.Factors associated with early failure of arteriovenous fistula forhemodialysis access. Eur J Vasc Endovasc Surg 1996;12:207–213
2. Lin SL, Huang CH, Chen HS, Hsu WA, Yen CJ, Yen TS. Effectsof age and diabetes on blood flow rate and primary outcome ofnewly created hemodialysis arteriovenous fistulas. Am J Nephrol1998;18:96–100
3. National Kidney Foundation. DOQI clinical practice guidelines forvascular access. Am J Kidney Dis 1997;30(suppl 3):s150–s191
4. Glanz S, Bashist B, Gordon DH, Butt K, Adamsons R. Angiogra-phy of upper extremity access fistulas for dialysis. Radiology 1982;143:45–52
5. Malovrh M. Non-invasive evaluation of vessels by duplex sono-graphy prior to construction of arteriovenous fistulas for hemodi-alysis. Nephrol Dial Transplant 1998;13:125–129
6. Zibari GB, Rohr MS, Landreneau MD, Bridges RM, DeVault GA,Petty FH, Costley KJ, Brown ST, McDonald JC. Complicationsfrom permanent hemodialysis vascular access. Surgery 1988;104:681–686
7. Beathard GA. Endovascular management of thrombosed dialysisaccess grafts. Am J Kidney Dis 1998;32:172–175
8. Besarab A, Sullivan KL, Ross RP, Moritz MJ. Utility of intra-access pressure monitoring in detecting and correcting venous out-let stenoses prior to thrombosis. Kidney Int 1995;47:1364–1373
9. Hayek CS, Thompson WR, Tuchinda C, Wojcik RA, LombardoJS. Wavelet processing of systolic murmurs to assist with clinicaldiagnosis of heart disease. Biomed Instrum Technol 2003;37(4):263–270
10. Daubechies I. The wavelet transform, time-frequency localizationand signal analysis. IEEE Trans Inf Theory 1990;IT-36:961–1005
11. Sakakibara S. Wavelet beginner’s guide. Tokyo: Tokyo DenkiUniversity Press, 1995
12. Palder SB, Kirkman RL, Whittemore AD, Hakim RM, LazarusJM, Tilney NL. Vascular access for hemodialysis: patency rates andresults of revision. Ann Surg 1985;202:235–239
13. Jackson ZS, Ishibashi H, Gotlieb AI, Langille BL. Effects of anas-tomotic angle on vascular tissue responses at end-to-side arterialgrafts. J Vasc Surg 2001;34:300–307
14. Kohler TR, Kirkman TR, Kraiss LW, Zierler BK, Clowes AW.Increased blood flow inhibits neointima hyperplasia in endothelia-lized vascular grafts. Circ Res 1991;69:1557–1565
15. Giddens DP, Zarins CK,Glagov S. The role of fluid mechanics inthe localization and detection of atherosclerosis. J Biomech Eng1993;115:588–594