Embed Size (px)
Citation preview
Click here to insert picture
EVALUATION OF A PILOT MBR SYSTEM OPERATED AT HIGH MLSS PROVIDED WITH A SPEECE CONE AERATION SYSTEM
AS AN ALTERNATIVE FOR SANITATION PROVISION IN EMERGENCIES
Carlos Mauricio Barreto Carvajal MSc Thesis UWS-SE-2015-15 June 2015

EVALUATION OF A PILOT MBR SYSTEM OPERATED AT
HIGH MLSS PROVIDED WITH A SPEECE CONE AERATION
SYSTEM AS AN ALTERNATIVE FOR SANITATION
PROVISION IN EMERGENCIES
Master of Science Thesis by
Carlos Mauricio Barreto Carvajal Author
SupervisorsProf. Damir Brdjdanovic, PhD, MSc (UNESCO-IHE)
MentorsHector García, PhD, MSc (UNESCO-IHE)
Tineke Hooijmans, PhD, MSc (UNESCO-IHE)
Examination committee Prof. Damir Brdjdanovic, PhD, MSc (UNESCO-IHE)
Hector García, PhD, MSc (UNESCO-IHE) Aridaí Herrera, MSc (JCI Industries, Inc. - Ext)
This research is done for the partial fulfilment of requirements for the Master of Science degree at the
UNESCO-IHE Institute for Water Education, Delft, the Netherlands
Delft June 2015


Although the author and UNESCO-IHE Institute for Water Education have made every effort to ensure thatthe information in this thesis was correct at press time, the author and UNESCO-IHE do not assume and hereby disclaim any liability to any party for any loss, damage, or disruption caused by errors or omissions,whether such errors or omissions result from negligence, accident, or any other cause. ©2015 by Author. This work is licensed under a Creative Commons Attribution-NonCommercial 4.0 International License.
i
Abstract
A size (volume) reduction for membrane bioreactor systems (MBR)s is constrained by the maximum amount of biomass that can be accommodated in the aerobic basin. The maximum achievable biomass concentration in the aerobic basin, known as the mixed liquor suspended solids (MLSS), is limited mainly by the extremely low oxygen transfer efficiency observed at MLSS concentrations higher than 20 g/L. Another limitation for achieving such high MLSS concentration in MBRs is the membrane permeability; causing limitation of the performance by membrane fouling. A pilot MBR system with a hydraulic treatment capacity of approximately 1 m³/d was located at the Harnaschpolder wastewater treatment plant in Delft, The Netherlands. The pilot MBR was operated at high MLSS concentrations (up to approximately 25 g/L). The MBR system was provided with an alternative source of oxygen supply (Speece cone system) to overcome the oxygen transfer limitations exhibited by conventional bubble diffuser systems. The MBR system showed very high COD removal efficiencies (>90%) even at hydraulic retention times (HRT) as low as 3.4 hours. The MBR performance was evaluated by monitoring the influent and effluent water quality, the membrane permeability, the sludge filterability, and the oxygen uptake rate (OUR). The Speece cone aeration system proved to be highly efficient in delivering dissolved oxygen at the evaluated MLSS. OUR values greater than 100 mg/L/h (at 14 g/L MLSS) were reported and even higher than 150 mg/L/h at MLSS above 20 g/L. The membrane permeability decreased as the MLSS increased; however, improvement in permeability values was observed between 10 to 14 g/L MLSS. Sludge filterability values in the range of "poor filterability" were observed; however, a reduction in the filtration resistance (or a filterability improvement) around the 10 g/L MLSS was noticed. The results obtained at the operational conditions of this research suggest that the existent limitations for achieving a lower footprint on MBRs can be overcome; MBRs may be designed at highly concentrated MLSS values. Operating MBR systems at such high MLSS values will allow the development of innovative MBR systems such as compact and movable MBRs to be used in an emergency sanitation context. In addition, existing treatment facilities may be upgraded by simply increasing the MLSS operational condition allowing the new system to treat a higher flow (or higher load) utilizing the same aerobic tank volume.


iii
Acknowledgements
This research work is dedicated to my family for their never ending support; each one of you made this possible in one way or another. Mom and Mimi, my personal counselors and Dad how I wish you were here. I would like to thanks very much OVIVO and the Bill and Melinda Gates foundation for providing funds to support my studies in The Netherlands. I also want to thank my mentors Hector and Tineke for being there when I needed them and my supervisor Damir Brdanovic for always trusting on me. UNESCO IHE family, thanks for making me feel I was at home all the time, you guys always do a terrific work, with a special mention to my laboratory staff friends for taking every request I made no matter what. I would also like to extend my gratitude to ECO2 for the technical and financial support. Han and Justina from Evides at the Harnaschpolder wastewater treatment plant, thanks for all of your patience and help. Thanks Maria Lousada (Delft University of Technology) for being my guardian angel, and my dearest friends Andres and Megan, for cheering me up when I needed the most, thanks boys.

v
Table of Contents
Abstract i
Acknowledgements iii
List of Figures vii
List of Tables ix
Abbreviations x
1. Introduction 12 1.1. Background 12 1.2. Problem Statement 12 1.3. Research aim and Objective 13 1.4. Research questions 14
2. Literature Review 15 2.1. Conventional Activated Sludge 15
2.1.1. Key Process Aspects 17 2.1.2. MLSS and Sludge Volumetric Index (SVI) 18
2.2. MBR technology 18 2.2.1. Process key aspects 20
2.3. CONVENTIONAL AERATION METHODS 25 2.3.1. Factors affecting oxygen transfer 26
THE SPEECE CONE 28
3. Materials and Methods 30 3.1. Worksite description 30
3.1.1. Harnaschpolder Wastewater treatment plant 30 3.1.2. Pilot Hall 32
3.2. Equipment description 32 3.2.1. Pilot MBR 32 3.2.2. Speece cone setup 35 3.2.3. The Delft Characterization Method Installation (DFCi) 37 3.2.4. Other sub-systems 39
3.3. Analytical methods 42
4. Results and Discussion 45 4.1. Startup process 45
4.1.1. Operational conditions 56 4.2. MBR Performance 59
4.2.1. Water Quality 59 4.2.2. Treatment capacity 62
4.3. Activated Sludge properties 73 4.3.1. Mixed Liquor Suspended Solids concentration 73 4.3.2. Sludge Filterability 75

vi
4.4. Oxygen Dynamics 80 4.4.1. Oxygen Uptake Rate (OUR) 80 4.4.2. Comparison with conventional systems 86 4.4.3. Oxygen transfer using the speece Cone aeration system 88
4.5. Full scale application feasibility 92 4.5.1. Supporting biomass growth 92 4.5.2. Using convention aeration systems or concentrated oxygen delivery systems 92
5. Conclusions 93
References 95
Appendices 96
vii
List of Figures Figure 2.1 Simplified process diagram of the conventional activated sludge (CAS) treatment system.
(Geilvoet, 2010). ..................................................................................................................... 16 Figure 2.2 MBR sidestream configuration. (Geilvoet, 2010) .................................................................. 19 Figure 2.3 MBR immersed configuration. (Geilvoet, 2010) .................................................................... 20 Figure 2.4 Time to filter (TTF) method to determine filterability.(Geilvoet, 2010) ............................... 21 Figure 2.5 Sludge filtration Index (SFI) to determine filterability. (Geilvoet, 2010) .............................. 22 Figure 2.6 Schematic of fouling rates in long term operation of full scale MBRs.(Drews, 2010)........... 23 Figure 2.7 Factors affecting submerged membranes fouling. (Le-Clech et al., 2006) ............................. 23 Figure 2.8 Inter relationships between MBR parameters and fouling. (Judd, 2010) ............................... 24 Figure 2.9 Simplified scheme of membrane cleaning methods. (Henze, 2008) ...................................... 25 Figure 2.10 Disc and tubular diffusers for fine bubble aeration. Stanford Scientific International LLC. .. 25 Figure 2.11 MLSS concentration and alpha factor correlation. (Ando, 2013) ........................................... 27 Figure 2.12 Oxygen transfer from gas phase to cell or solid particle. Adapted from (Garcia-Ochoa &
Gomez, 2009) ......................................................................................................................... 27 Figure 2.13 Speece cone. SOURCE: ECO2 TECH website 2014 ............................................................. 28 Figure 2.14 KLa and SOTE increase with higher discharge velocities. (Ashley et al., 2008) .................... 29 Figure 3.1 Influent and effluent water quality at Harnaschpolder WWTP .............................................. 31 Figure 3.2 General view of the secondary settlers HNP WWTP. ............................................................ 31 Figure 3.3 Harnaschpolder WWTP pilot hall view .................................................................................. 32 Figure 3.4 MBR Membrane module ........................................................................................................ 33 Figure 3.5 Low pressure blower for conventional aeration ..................................................................... 34 Figure 3.6 MBR control box. ................................................................................................................... 34 Figure 3.7 Electromagnetic flow indicator transmitter (FIT) ................................................................... 35 Figure 3.8 Variable frequency drive to control the sludge pump discharge. ........................................... 35 Figure 3.9 Positive displacement pump for the sludge closed circuit. It had to be assembled on site. .... 36 Figure 3.10 Speece cone before and after installation ............................................................................... 36 Figure 3.11 Equipment layout schematic ................................................................................................... 37 Figure 3.12 The Delft Filtration Characterization installation at the TU Delft. ......................................... 38 Figure 3.13 The DFCi at the Harnaschpolder WWTP (left). DFCi process diagram (Lousada-Ferreira,
2011) ....................................................................................................................................... 38 Figure 3.14 Gas feed system schematic for design and purchasing purposes ........................................... 39 Figure 3.15 Oxygen gas feed system components ..................................................................................... 40 Figure 3.16 Alternative carbon source feed system ................................................................................... 40 Figure 3.17 Submersible pump in the sludge basin connected to the sludge line (Up left); Sludge line
at the pilot hall connected to a reinforced hose (Up right); Reinforced hose and MBR reactor (down left); Activated sludge discharge in the MBR reactor (down right). ............... 41
Figure 3.18 DFCi output file example with the added resistance against the specific permeate production. .............................................................................................................................. 42
Figure 4.1 Electric integrity check performed by a external specialized company. ................................ 46 Figure 4.2 Broken manifold (Up) and new manifold for membrane scouring (Down) ........................... 47 Figure 4.3 Taking the membrane module out of the reactor using a forklift. .......................................... 48 Figure 4.4 First attempt to repair the broken membrane module ............................................................. 48 Figure 4.5 Second attempt to repair the membrane module. ................................................................... 49 Figure 4.6 Temporary modification for SBR operation mode. Floating decanter (Up left); Reactor in
filling stage (Up right); Reactor in decanting stage (Dow left); Control box modification (Down right). .......................................................................................................................... 50
Figure 4.7 Original flow meter filled with activated sludge (Left); New flow meter after installation. .. 51 Figure 4.8 Clean level switches (left); Blocked level switches (right) .................................................... 51

viii
Figure 4.9 Second level switch installed (floating type) .......................................................................... 52 Figure 4.10 Third level switch installed..................................................................................................... 52 Figure 4.11 Damaged stator from sludge pump. ........................................................................................ 53 Figure 4.12 Greasy slime appearing in the permeate tank when the growth and permeability decreased . 54 Figure 4.13 Membrane module chemically assisted cleaning process and sludge inoculation .................. 55 Figure 4.14 Operational conditions overview ........................................................................................... 57 Figure 4.15 Operational conditions overview and unplanned stops .......................................................... 58 Figure 4.16 Influent and effluent COD concentrations and removal efficiency for different MLSS
concentrations ......................................................................................................................... 59 Figure 4.17 Calculated MBR MLSS concentration as a function of HRT. (Yoon et al., 2004) ................ 60 Figure 4.18 Net MBR yearly cost reduction for aeration and sludge treatment at higher MLSS
concentration. (Yoon et al., 2004) .......................................................................................... 61 Figure 4.19 HRT and COD removal efficiency. ........................................................................................ 61 Figure 4.20 MBR Operational pressure profile for 20 cycles (mbar) ........................................................ 62 Figure 4.21 Pressure values example (max, min, mode) for each operational cycle (zoom in from
Figure 4.20). ......................................................................................................................... 63 Figure 4.22 TMP results at different MLSS concentrations ...................................................................... 63 Figure 4.23 Specific flux (LMH/applied pressure) .................................................................................... 64 Figure 4.24 TMP at different MLSS concentrations for a fifty cycles period. .......................................... 65 Figure 4.25 Net flux for increasing MLSS concentration. (max, min and mode values) .......................... 65 Figure 4.26 Flux for increasing MLSS concentrations (upper concentration range) during a fifty
cycles period. .......................................................................................................................... 66 Figure 4.27 Normalized Operational Permeability (OPn) for increasing MLSS concentrations. .............. 67 Figure 4.28 Normalized Operational Permeability (OPn) for a fifty cycles period. .................................. 67 Figure 4.29 Flux, TMP and Permeability for different MLSS concentrations (7.6, 8.5, 10.32, and
10.36 g/L) ............................................................................................................................... 68 Figure 4.30 Flux, TMP and Permeability for different MLSS concentrations (12.21, 12.7, 14.54 and
15.41 g/L) ............................................................................................................................... 69 Figure 4.31 Flux, TMP and Permeability for different MLSS concentrations (18.7, 23.96, 23.3 and
22.79 g/L) ............................................................................................................................... 71 Figure 4.32 Foam production after dosing sodium acetate and changes on sludge characteristics. .......... 72 Figure 4.33 Slimy substance in the permeate tank after the sodium acetate dosing. ................................. 72 Figure 4.34 Sealed vessels used to reduce the aerobic tank volume ......................................................... 73 Figure 4.35 Observed MLSS concentration (target and measured) and operational parameters for each
point. ....................................................................................................................................... 75 Figure 4.36 MBR activated sludge. Low MLSS (left). High MLSS (right) (Lousada-Ferreira, 2011) ..... 76 Figure 4.37 Measured Filterability values ................................................................................................ 77 Figure 4.38 Resistance (R), Flux (J) and Pressure (TMP). Clockwise from top left: ID#5 (7.6g/L),
ID#6 (8.57 g/L), ID#7 (10.36 g/L), and ID#8 (14.54 g/L) ..................................................... 77 Figure 4.39 Resistance (R), Flux (J) and Pressure (TMP). Clockwise from top left: ID#10 (12.21 g/L),
ID#12 (18.7 g/L), ID#15 (23.79 g/L) ..................................................................................... 78 Figure 4.40 Added resistance. Clockwise from top left: ID#5 (7.6g/L), ID#6 (8.57 g/L), ID#7 (10.36
g/L), ID#8 (14.54 g/L) ............................................................................................................ 79 Figure 4.41 Added resistance. Clockwise from top left: ID#10 (12.21 g/L), ID#12 (18.7 g/L), ID#15
(23.79 g/L) .............................................................................................................................. 80 Figure 4.42 Calculated and measured Oxygen uptake rate (OUR20) ........................................................ 84 Figure 4.43 Specific Oxygen uptake rate (SOUR20) ................................................................................. 85 Figure 4.44 Benefits of high MLSS MBR in terms of volume and HRT reduction. ................................ 87 Figure 4.45 Required volume and OUR for different influent COD concentrations ................................ 88 Figure 4.46 Speece cone manufacturer's data chart for Oxygen mass transfer ......................................... 91

ix
List of Tables Table 2.1 WWTP average treatment values and discharge standards in the Netherlands. Modified
from (Geilvoet, 2010). ............................................................................................................ 17 Table 2.2 Average treatment values and efficiency removals in Nordkanal wastewater treatment
works in Kaarst, Germany. (Henze, 2008). ............................................................................ 19 Table 3.1 Analytical methods materials and ranges ............................................................................... 44 Table 4.1 Operational conditions overview and COD values ............................................................... 57 Table 4.2 MBR possible operational states ............................................................................................ 62 Table 4.3 TSS target and measured MLSS concentration for each MBR operational point ................. 74 Table 4.4 Measured Filterability values ................................................................................................ 76 Table 4.5 MBR Operational conditions and OUR values ..................................................................... 81 Table 4.6 Required volume comparison between conventional systems and high MLSS MBR .......... 86 Table 4.7 MBR and Speece cone set up operational conditions ............................................................ 90 Table 4.8 Calculated Oxygen mass flow from MBR membrane scouring system. ............................... 91
x
Abbreviations
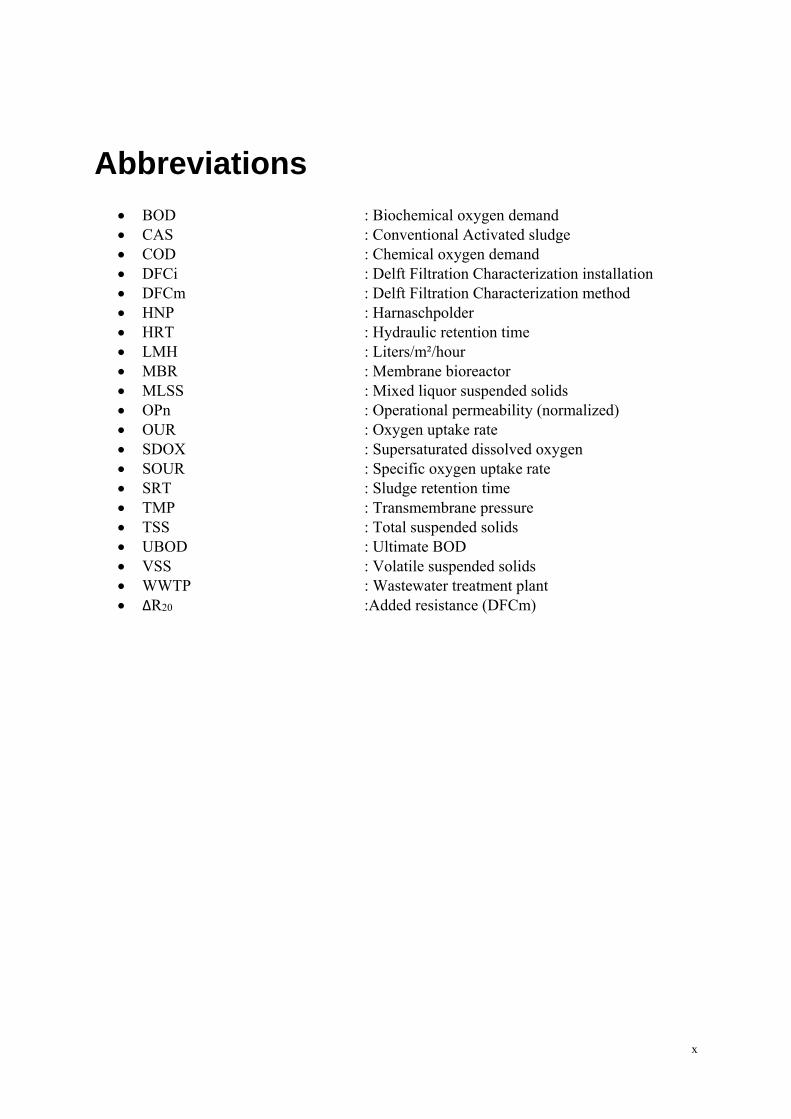
BOD : Biochemical oxygen demand CAS : Conventional Activated sludge COD : Chemical oxygen demand DFCi : Delft Filtration Characterization installation DFCm : Delft Filtration Characterization method HNP : Harnaschpolder HRT : Hydraulic retention time LMH : Liters/m²/hour MBR : Membrane bioreactor MLSS : Mixed liquor suspended solids OPn : Operational permeability (normalized) OUR : Oxygen uptake rate SDOX : Supersaturated dissolved oxygen SOUR : Specific oxygen uptake rate SRT : Sludge retention time TMP : Transmembrane pressure TSS : Total suspended solids UBOD : Ultimate BOD VSS : Volatile suspended solids WWTP : Wastewater treatment plant ΔR20 :Added resistance (DFCm)

EVALUATION OF A PILOT MBR SYSTEM OPERATED AT HIGH MLSS PROVIDED WITH A SPEECE CONE AERATION SYSTEM AS AN ALTERNATIVE FOR SANITATION PROVISION IN EMERGENCIES 11

EVALUATION OF A PILOT MBR SYSTEM OPERATED AT HIGH MLSS PROVIDED WITH A SPEECE CONE AERATION SYSTEM AS AN ALTERNATIVE FOR SANITATION PROVISION IN EMERGENCIES 12
This chapter contains background information about the topic of concern in this research, the problem statement, the objectives, and the research questions.
1.1. Background
The operation of membrane bioreactors (MBR)s at high mixed liquor suspended solids (MLSS) concentrations (higher than 20 g/L) may introduce advantages in terms of footprint and volume reduction. However, the maximum achievable MLSS concentration is currently limited due to the extremely low oxygen transfer efficiency observed when using conventional aeration methods such as fine and coarse bubble diffusers. Alternatives sources for providing dissolved oxygen in MBRs operated at high MLSS have been researched including the use of pressurized supersaturated oxygenation devices fed with pure oxygen rather than compressed air (SDOX system by BlueInGreen). Bilal, (2013) and Makgatha, (2014) operated a supersaturated dissolved oxygen delivery unit (SDOX system) manufactured by BlueInGreen at laboratory conditions. Both authors reported excellent oxygen transfer capabilities with lower alpha factor reduction effects compared to conventional bubble diffusers when conducting experiments at high MLSS concentrations (as high as 35 g/L). In addition, Makgatha, (2014) reported oxygen uptake rates (OUR) values of up to 300 mg/L-hr when operating a laboratory scale batch reactor aerated with the SDOX system at MLSS of approximately 20 g/L.
1.2. Problem Statement
Reducing footprint requirements (together with operational costs) is highly desirable for advancing on the decentralization of sanitation provision. In addition, the development of compact wastewater treatment systems (movable and easy-to-transport) may provide an excellent alternative for the provision of sanitation services in applications such as emergency situations (i.e., the provision of sanitation services in emergency camps after the occurrence of a natural or human made disaster). Considering all the existent alternatives for the provision of sanitation services, MBRs present a suitable option with some additional advantages including: the production of a high quality effluent suitable for water reuse, the reliability of the technology, and the operational flexibility to adjust to changes in loads. The achievement of a further volume reduction in MBRs is mainly constrained by the maximum attainable MLSS that can be sustain in the aerobic basin of an MBR system. The MLSS will determine the required reactor volume. MBR systems are designed to be operated at MLSS values of approximately 8-12 g/L.
CHAPTER 1
Introduction
EVALUATION OF A PILOT MBR SYSTEM OPERATED AT HIGH MLSS PROVIDED WITH A SPEECE CONE AERATION SYSTEM AS AN ALTERNATIVE FOR SANITATION PROVISION IN EMERGENCIES 13
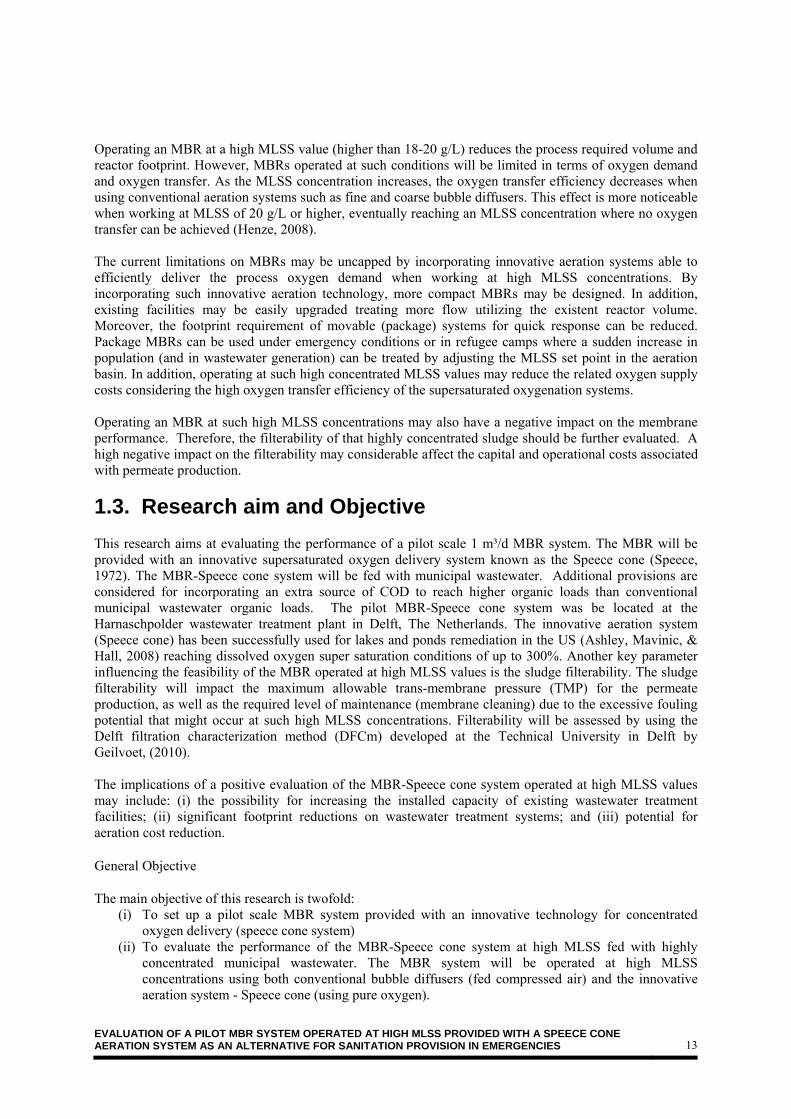
Operating an MBR at a high MLSS value (higher than 18-20 g/L) reduces the process required volume and reactor footprint. However, MBRs operated at such conditions will be limited in terms of oxygen demand and oxygen transfer. As the MLSS concentration increases, the oxygen transfer efficiency decreases when using conventional aeration systems such as fine and coarse bubble diffusers. This effect is more noticeable when working at MLSS of 20 g/L or higher, eventually reaching an MLSS concentration where no oxygen transfer can be achieved (Henze, 2008). The current limitations on MBRs may be uncapped by incorporating innovative aeration systems able to efficiently deliver the process oxygen demand when working at high MLSS concentrations. By incorporating such innovative aeration technology, more compact MBRs may be designed. In addition, existing facilities may be easily upgraded treating more flow utilizing the existent reactor volume. Moreover, the footprint requirement of movable (package) systems for quick response can be reduced. Package MBRs can be used under emergency conditions or in refugee camps where a sudden increase in population (and in wastewater generation) can be treated by adjusting the MLSS set point in the aeration basin. In addition, operating at such high concentrated MLSS values may reduce the related oxygen supply costs considering the high oxygen transfer efficiency of the supersaturated oxygenation systems. Operating an MBR at such high MLSS concentrations may also have a negative impact on the membrane performance. Therefore, the filterability of that highly concentrated sludge should be further evaluated. A high negative impact on the filterability may considerable affect the capital and operational costs associated with permeate production.
1.3. Research aim and Objective
This research aims at evaluating the performance of a pilot scale 1 m³/d MBR system. The MBR will be provided with an innovative supersaturated oxygen delivery system known as the Speece cone (Speece, 1972). The MBR-Speece cone system will be fed with municipal wastewater. Additional provisions are considered for incorporating an extra source of COD to reach higher organic loads than conventional municipal wastewater organic loads. The pilot MBR-Speece cone system was be located at the Harnaschpolder wastewater treatment plant in Delft, The Netherlands. The innovative aeration system (Speece cone) has been successfully used for lakes and ponds remediation in the US (Ashley, Mavinic, & Hall, 2008) reaching dissolved oxygen super saturation conditions of up to 300%. Another key parameter influencing the feasibility of the MBR operated at high MLSS values is the sludge filterability. The sludge filterability will impact the maximum allowable trans-membrane pressure (TMP) for the permeate production, as well as the required level of maintenance (membrane cleaning) due to the excessive fouling potential that might occur at such high MLSS concentrations. Filterability will be assessed by using the Delft filtration characterization method (DFCm) developed at the Technical University in Delft by Geilvoet, (2010). The implications of a positive evaluation of the MBR-Speece cone system operated at high MLSS values may include: (i) the possibility for increasing the installed capacity of existing wastewater treatment facilities; (ii) significant footprint reductions on wastewater treatment systems; and (iii) potential for aeration cost reduction. General Objective The main objective of this research is twofold:
(i) To set up a pilot scale MBR system provided with an innovative technology for concentrated oxygen delivery (speece cone system)
(ii) To evaluate the performance of the MBR-Speece cone system at high MLSS fed with highly concentrated municipal wastewater. The MBR system will be operated at high MLSS concentrations using both conventional bubble diffusers (fed compressed air) and the innovative aeration system - Speece cone (using pure oxygen).

EVALUATION OF A PILOT MBR SYSTEM OPERATED AT HIGH MLSS PROVIDED WITH A SPEECE CONE AERATION SYSTEM AS AN ALTERNATIVE FOR SANITATION PROVISION IN EMERGENCIES 14
Specific Objectives:
i. To set up a pilot 1 m3/d MBR in the research facilities at the Harnaschpolder wastewater treatment plant (Delft, The Netherlands).
ii. To reach steady state operational conditions in the MBR fed with municipal screened influent working at a MLSS concentration of approximately 10g/L. At this stage the MBR is operated with the conventional aeration system (fine and coarse bubble diffuser equipment). The baseline conditions regarding water and sludge characteristics will be established including treatment performance (influent vs. effluent water quality), oxygen uptake rate (OUR), filterability, and permeability.
iii. To operate the pilot system at high MLSS values and at high organic loads. At this point the MBR is operated with the innovative Speece cone aeration system using pure oxygen. The water and sludge characteristics for these specific operational conditions will be evaluated.
1.4. Research questions
The general and specific objectives previously described lead to the following general research question: What would be the performance of a pilot MBR operated at high MLSS concentrations fed with concentrated wastewater using a conventional and an innovative oxygen supply systems? Specific research questions: i. Which are the main concerns when installing and running a MBR pilot setup under the previously
described specific conditions? ii. How does the membrane permeability change as the MLSS concentration in the reactor increases? iii. Is the water quality affected by the different operational set points? iv. What are the sludge characteristics (filterability and oxygen uptake rate (OUR)) at these specific
operational conditions?

EVALUATION OF A PILOT MBR SYSTEM OPERATED AT HIGH MLSS PROVIDED WITH A SPEECE CONE AERATION SYSTEM AS AN ALTERNATIVE FOR SANITATION PROVISION IN EMERGENCIES 15
This chapter describes the characteristics of both Conventional Activated Sludge (CAS) processes and Membrane Biological Reactor (MBR) systems. Relevant design and operational parameters for both systems are discussed including sludge retention time (SRT), hydraulic retention time (HRT), permeability, filterability, and fouling mechanisms. This chapter also contains information about conventional aeration systems and innovative supersaturated oxygen delivery systems such as the Speece cone technology.
2.1. Conventional Activated Sludge
It was 1913 in Manchester sewage works England, when Adern and Lockett observed how wastewater treatment could be performed faster and with better results when using aeration and sludge recirculation in what they named the activated sludge process (Geilvoet, 2010). The Conventional Activated Sludge (CAS) process relies on the ability of many different bacteria groups to use most of the substances present in wastewater as an energy source to run their metabolism. To do so, they require a series of conditions to be present that allow growth with the subsequent conversion of the pollutant load into more "ready to work" biomass, the so called activated sludge, and carbon dioxide. Besides environmental conditions such as pH (6.5 to 9), temperature within the mesophilic range (up to 40 ºC), substrate and nutrient availability, the bacteria involved in the process use oxygen as an electron acceptor during the chemical oxygen demand (COD) breakdown. Even though the previously mentioned factors (among other factors) affect the rates at which the metabolic processes occur, it is the oxygen transfer to the active biomass the process limiting the amount of bacteria that can be accommodated in a given volume of an aerobic reactor. The content of the aerobic reactor (the mixture between wastewater and activated sludge) is commonly called the mixed liquor. The amount of microorganisms per unit of volume is frequently expressed as a concentration of suspended solids (including live biomass and inert material) in the mixed liquor; that is, the mixed liquor suspended solids (MLSS) expressed generally as (g/L) (Henze, 2008). The CAS configuration consists of an aerated biological reactor where wastewater and activated sludge interact to form the mixed liquor. The reactor is aerated to provide the required oxygen demand. There are many aeration methods and devices to supply dissolved oxygen; fine bubble aeration difussers coupled with low pressure blowers is the most widely used aeration alternative. Surface aerators are also an alternative to deliver dissolved oxygen. Energy costs related to aeration in aerobic treatment systems are of a high relevance in terms of operational expenses (OPEX).
CHAPTER 2
Literature Review

EVALUATION OF A PILOT MBR SYSTEM OPERATED AT HIGH MLSS PROVIDED WITH A SPEECE CONE AERATION SYSTEM AS AN ALTERNATIVE FOR SANITATION PROVISION IN EMERGENCIES 16
After the biological reactor, the mixed liquor enters the clarifier (or settler) unit where the flow velocity is reduced to separate by differences in density the solid phase (activated sludge) from the liquid phase (clarified water). The clarified water leaves the settler at a controlled flow rate that is calculated using hydraulic principles such as the hydraulic and solids loading (Henze, 2008). While decantation occurs, the activated sludge settles down to the bottom of the clarifier, where it is collected in a hopper and from there it is taken as two different streams:
The waste activated sludge (WAS): is the excess sludge that needs to be discarded in order to keep the reactor MLSS constant. The amount of WAS depends on both the target MLSS, as well as on the designed sludge age or sludge retention time (SRT).
(2.1)
The return activated sludge (RAS): is the rate at which the activated sludge must be returned into
the aerobic reactor in order to reach the design SRT. It is usually set at 0.25 to 3 times the design flow rate (Henze, 2008).
A general process scheme is shown in Figure 2.1 Simplified process diagram of the conventional activated sludge (CAS) treatment system. (Geilvoet, 2010). Other activated sludge process configurations may include different recycle streams, and anaerobic and anoxic chambers to allow nitrogen and phosphorous removal as well.
Figure 2.1 Simplified process diagram of the conventional activated sludge (CAS) treatment system. (Geilvoet, 2010).
Both values for removal efficiencies commonly observed in CAS treatment plants, and effluent discharge standards are shown in Table 2.1.
EVALUATION OF A PILOT MBR SYSTEM OPERATED AT HIGH MLSS PROVIDED WITH A SPEECE CONE AERATION SYSTEM AS AN ALTERNATIVE FOR SANITATION PROVISION IN EMERGENCIES 17
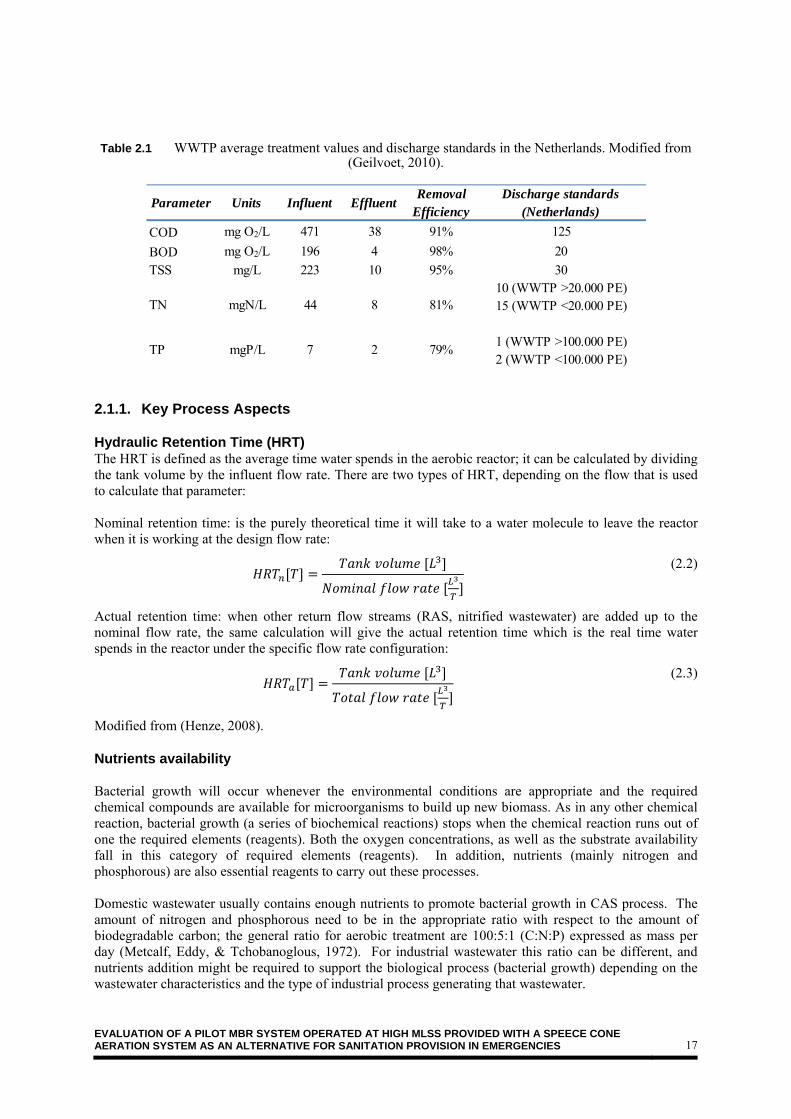
Table 2.1 WWTP average treatment values and discharge standards in the Netherlands. Modified from (Geilvoet, 2010).
2.1.1. Key Process Aspects Hydraulic Retention Time (HRT) The HRT is defined as the average time water spends in the aerobic reactor; it can be calculated by dividing the tank volume by the influent flow rate. There are two types of HRT, depending on the flow that is used to calculate that parameter: Nominal retention time: is the purely theoretical time it will take to a water molecule to leave the reactor when it is working at the design flow rate:
(2.2)
Actual retention time: when other return flow streams (RAS, nitrified wastewater) are added up to the nominal flow rate, the same calculation will give the actual retention time which is the real time water spends in the reactor under the specific flow rate configuration:
(2.3)
Modified from (Henze, 2008). Nutrients availability Bacterial growth will occur whenever the environmental conditions are appropriate and the required chemical compounds are available for microorganisms to build up new biomass. As in any other chemical reaction, bacterial growth (a series of biochemical reactions) stops when the chemical reaction runs out of one the required elements (reagents). Both the oxygen concentrations, as well as the substrate availability fall in this category of required elements (reagents). In addition, nutrients (mainly nitrogen and phosphorous) are also essential reagents to carry out these processes. Domestic wastewater usually contains enough nutrients to promote bacterial growth in CAS process. The amount of nitrogen and phosphorous need to be in the appropriate ratio with respect to the amount of biodegradable carbon; the general ratio for aerobic treatment are 100:5:1 (C:N:P) expressed as mass per day (Metcalf, Eddy, & Tchobanoglous, 1972). For industrial wastewater this ratio can be different, and nutrients addition might be required to support the biological process (bacterial growth) depending on the wastewater characteristics and the type of industrial process generating that wastewater.
Parameter Units Influent EffluentRemoval
EfficiencyDischarge standards
(Netherlands)
COD mg O2/L 471 38 91% 125
BOD mg O2/L 196 4 98% 20
TSS mg/L 223 10 95% 3010 (WWTP >20.000 PE)15 (WWTP <20.000 PE)
1 (WWTP >100.000 PE)2 (WWTP <100.000 PE)
81%
TP mgP/L 7 2 79%
TN mgN/L 44 8

EVALUATION OF A PILOT MBR SYSTEM OPERATED AT HIGH MLSS PROVIDED WITH A SPEECE CONE AERATION SYSTEM AS AN ALTERNATIVE FOR SANITATION PROVISION IN EMERGENCIES 18
Sludge Retention Time (SRT) It is the main and most relevant parameter for CAS design and operation control. Also known as sludge age, it represents the average time that solids (activated sludge) stay in the aerobic reactor. SRT defines not only the size of the reactor, but also the oxygen requirements, the amount of WAS and the removal efficiency of contaminants - especially the biological nitrogen removal processes (Geilvoet, 2010). During the design process of a CAS, a SRT value is selected to fulfill the treatment demands at a given MLSS concentration; from there, the WAS can be calculated following as in equation (2.1). Since the SRT describes the amount of biomass present in the system, the treatment efficiency will strongly depend on it. It is a numeric representation of the treatment "capacity" in a given system and conditions. The required SRT for carbon and nitrogen removal differ since different bacteria groups have different specific growth rates; therefore, they require longer or shorter SRT periods to sustain a certain amount of biomass in the system. In addition, the specific growth rates depend on the temperature. For carbon removal, usually 3 to 5 days SRT is enough; however, for nitrogen removal SRTs range from 3 to 18 days and even longer if the operation temperature is too low, or in other words nitrifying bacteria need more time to breed (Metcalf et al., 1972). 2.1.2. Sludge Volumetric Index (SVI) The SVI is an empiric parameter representing the volume occupied per sludge mass after a given settling period, it means an indication of the settling ability (or settleability) of the sludge. A good sludge settleability is crucial in CAS system since it influences the secondary clarifier performance and the effluent water quality. The SVI determination method uses an Imhoff cone to measure the settled sludge volume of a 1 liter mixed liquor sample after 30 minutes of sedimentation (the settleability test). The volume is related to the MLSS concentration to calculate the specific volume in mL/g (Geilvoet, 2010) as below.
(2.4)
2.2. MBR technology
Membrane bioreactors use a physical barrier (the membrane) to separate the treated water (the permeate) from the mixed liquor instead of a settling unit. The use of a membrane allows reaching better water quality in the effluent. The non settleable material that would escape from a secondary settler in a CAS system will be retained by the membrane. The efficiency of the phase separation will no longer rely only on hydraulic principles and the settling properties of the sludge, but instead will be dictated, among others, by the pore size of the filtration element (Geilvoet, 2010). Table 2.2 presents the achievable effluent concentrations in a MBR installation. When the settling process is not a constraint anymore, remarkably better water quality parameters at the discharge are observed; specially, regarding suspended solids concentrations.
EVALUATION OF A PILOT MBR SYSTEM OPERATED AT HIGH MLSS PROVIDED WITH A SPEECE CONE AERATION SYSTEM AS AN ALTERNATIVE FOR SANITATION PROVISION IN EMERGENCIES 19
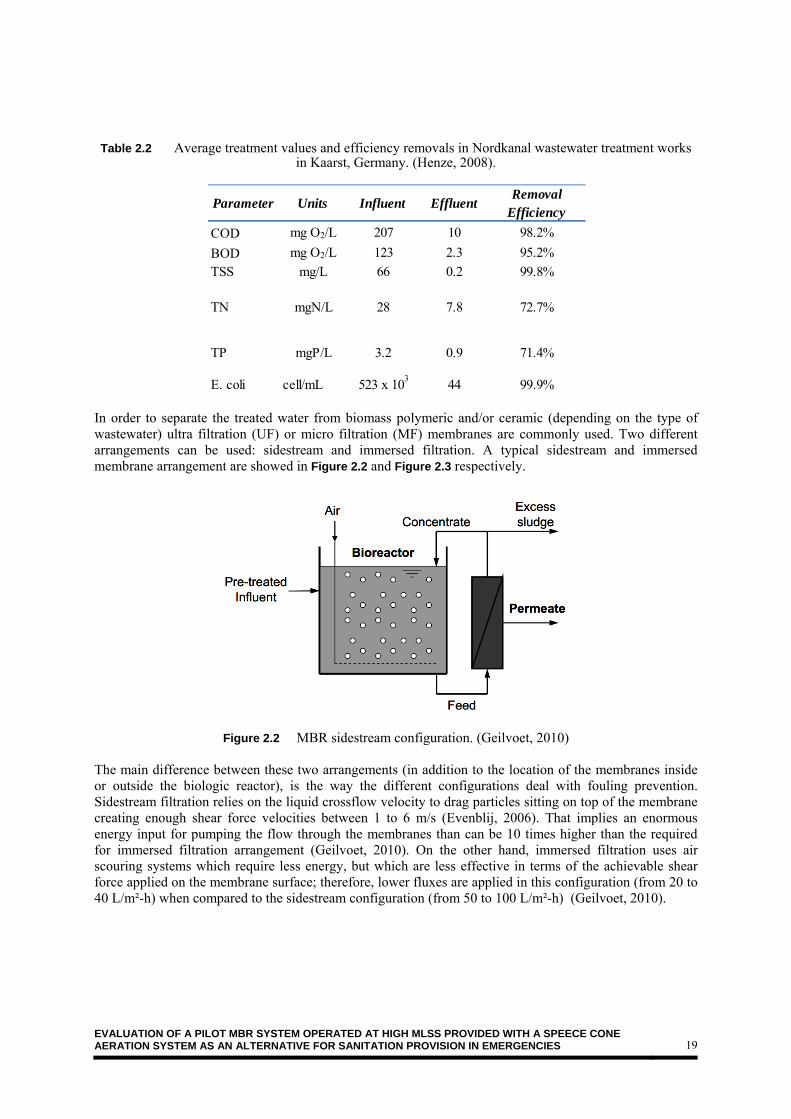
Table 2.2 Average treatment values and efficiency removals in Nordkanal wastewater treatment works in Kaarst, Germany. (Henze, 2008).
In order to separate the treated water from biomass polymeric and/or ceramic (depending on the type of wastewater) ultra filtration (UF) or micro filtration (MF) membranes are commonly used. Two different arrangements can be used: sidestream and immersed filtration. A typical sidestream and immersed membrane arrangement are showed in Figure 2.2 and Figure 2.3 respectively.
Figure 2.2 MBR sidestream configuration. (Geilvoet, 2010)
The main difference between these two arrangements (in addition to the location of the membranes inside or outside the biologic reactor), is the way the different configurations deal with fouling prevention. Sidestream filtration relies on the liquid crossflow velocity to drag particles sitting on top of the membrane creating enough shear force velocities between 1 to 6 m/s (Evenblij, 2006). That implies an enormous energy input for pumping the flow through the membranes than can be 10 times higher than the required for immersed filtration arrangement (Geilvoet, 2010). On the other hand, immersed filtration uses air scouring systems which require less energy, but which are less effective in terms of the achievable shear force applied on the membrane surface; therefore, lower fluxes are applied in this configuration (from 20 to 40 L/m²-h) when compared to the sidestream configuration (from 50 to 100 L/m²-h) (Geilvoet, 2010).
Parameter Units Influent EffluentRemoval
Efficiency
COD mg O2/L 207 10 98.2%
BOD mg O2/L 123 2.3 95.2%
TSS mg/L 66 0.2 99.8%
E. coli cell/mL 523 x 103
44 99.9%
TP mgP/L 3.2 0.9 71.4%
TN mgN/L 28 7.8 72.7%

EVALUATION OF A PILOT MBR SYSTEM OPERATED AT HIGH MLSS PROVIDED WITH A SPEECE CONE AERATION SYSTEM AS AN ALTERNATIVE FOR SANITATION PROVISION IN EMERGENCIES 20
Figure 2.3 MBR immersed configuration. (Geilvoet, 2010)
Hollow fiber and flat plate are the two most common types of membranes used on the immersed configuration. They can operate in a low pressure range (from 0.2 to 0.5 bar) considering the lower energy requirement of the immersed configuration compared to the sidestream configuration with TMP values from 2 to 6 bar (Geilvoet, 2010). 2.2.1. Process key aspects MLSS The concentration of TSS in the mixed liquor determines not only the reactor volume but also the load treatment capacity, the maximum allowable flux, and the oxygen requirements according to (Henze, 2008). Together with the SRT, the concentration of TSS is a critical design parameter usually dictated by the strength of the influent wastewater, or in other words, by the capacity of the available substrate to maintain such concentration of bacteria. The MLSS and the specific sludge properties, depending on the characteristics of the wastewater, will determine the fouling potential which affects directly the permeability, durability, and maintenance requirements for the membranes. Trans membrane pressure (TMP) The pressure drop across the membrane or in other words, the required pressure to produce a certain flux (L/m²-h) is referred as the TMP (L/m²-h-bar) as described in Equation (2.5). Considering that the fouling occurs while controlling the system to operate at a constant flux, the TMP will rise to compensate the higher resistance to filtration in the upstream side of the membrane.
L/m²/ hbar
(2.5)
Where: TMP : Trans membrane pressure (bar) J : flux (L/m²-h) P : permeability (L/m²-h-bar)
EVALUATION OF A PILOT MBR SYSTEM OPERATED AT HIGH MLSS PROVIDED WITH A SPEECE CONE AERATION SYSTEM AS AN ALTERNATIVE FOR SANITATION PROVISION IN EMERGENCIES 21
Permeability Measuring permeability values is the most popular method to both monitor membrane operation, and control cleaning cycles. Measuring permeability is relatively easy to conduct on site; however, by measuring permeability it is not possible to describe the fouling processes causing the decrease in permeate production. Permeability can be used to describe the current status in a system (the symptom). When measured continuously, permeability can be plotted to evaluate the rate at which permeate production is reduced. Permeability (P) is defined as the specific flow rate (per unit area) per unit pressure, or the flux divided by the trans membrane pressure (TMP) as it is shown in Equation (2.6) (Judd, 2010).
.
(2.6)
Filterability Filterability is a sludge property that refers to the fouling potential of an activated sludge. The method determines the resistance that the sludge opposes to be filtered under specific operational conditions (depending on the method used to measure it). The filterability determination has been the focus of attention for many researchers in the last years. As a consequence, new methods for measuring filterability have been recently developed mainly in Europe. Some of the most popular methods to determine filterability are:
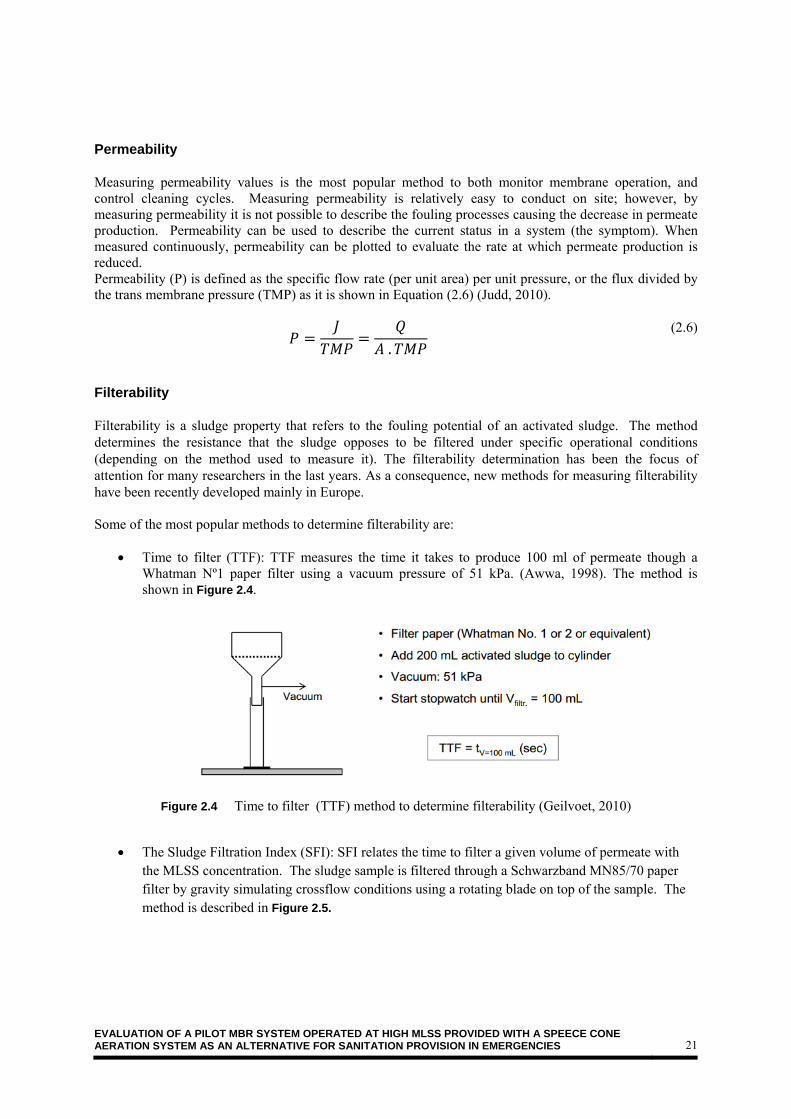
Time to filter (TTF): TTF measures the time it takes to produce 100 ml of permeate though a Whatman Nº1 paper filter using a vacuum pressure of 51 kPa. (Awwa, 1998). The method is shown in Figure 2.4.
Figure 2.4 Time to filter (TTF) method to determine filterability (Geilvoet, 2010)
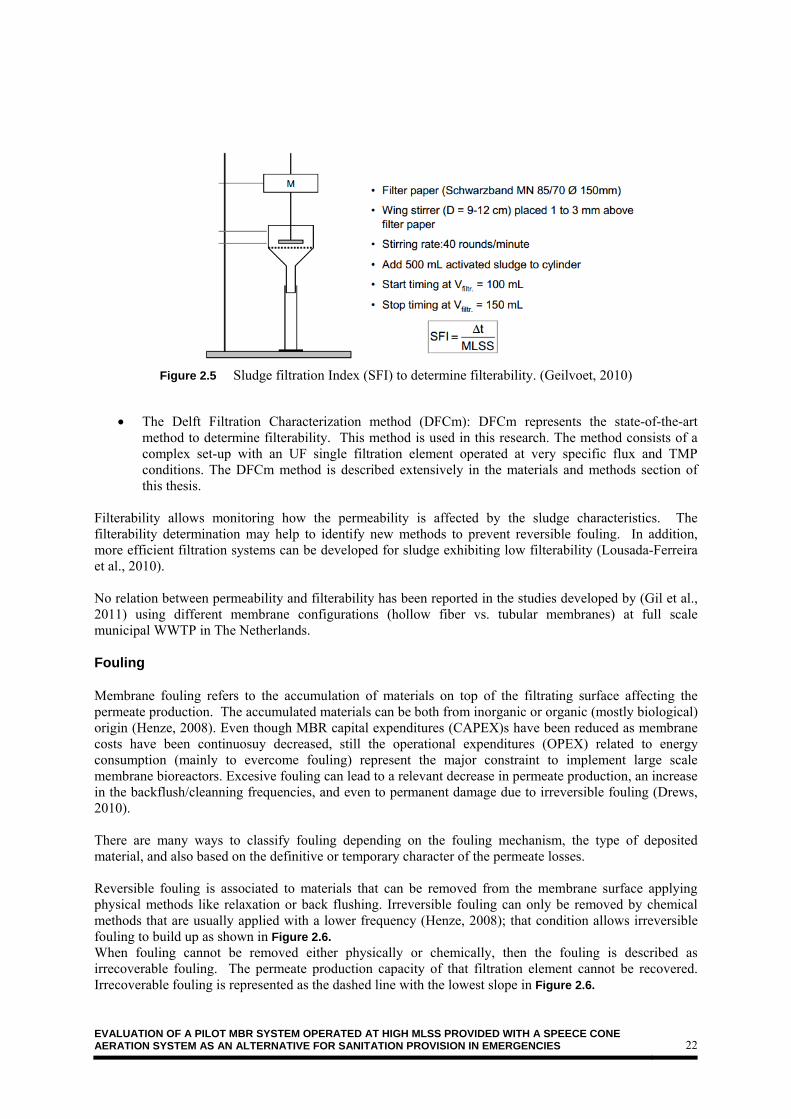
The Sludge Filtration Index (SFI): SFI relates the time to filter a given volume of permeate with the MLSS concentration. The sludge sample is filtered through a Schwarzband MN85/70 paper filter by gravity simulating crossflow conditions using a rotating blade on top of the sample. The method is described in Figure 2.5.
EVALUATION OF A PILOT MBR SYSTEM OPERATED AT HIGH MLSS PROVIDED WITH A SPEECE CONE AERATION SYSTEM AS AN ALTERNATIVE FOR SANITATION PROVISION IN EMERGENCIES 22
Figure 2.5 Sludge filtration Index (SFI) to determine filterability. (Geilvoet, 2010)
The Delft Filtration Characterization method (DFCm): DFCm represents the state-of-the-art method to determine filterability. This method is used in this research. The method consists of a complex set-up with an UF single filtration element operated at very specific flux and TMP conditions. The DFCm method is described extensively in the materials and methods section of this thesis.
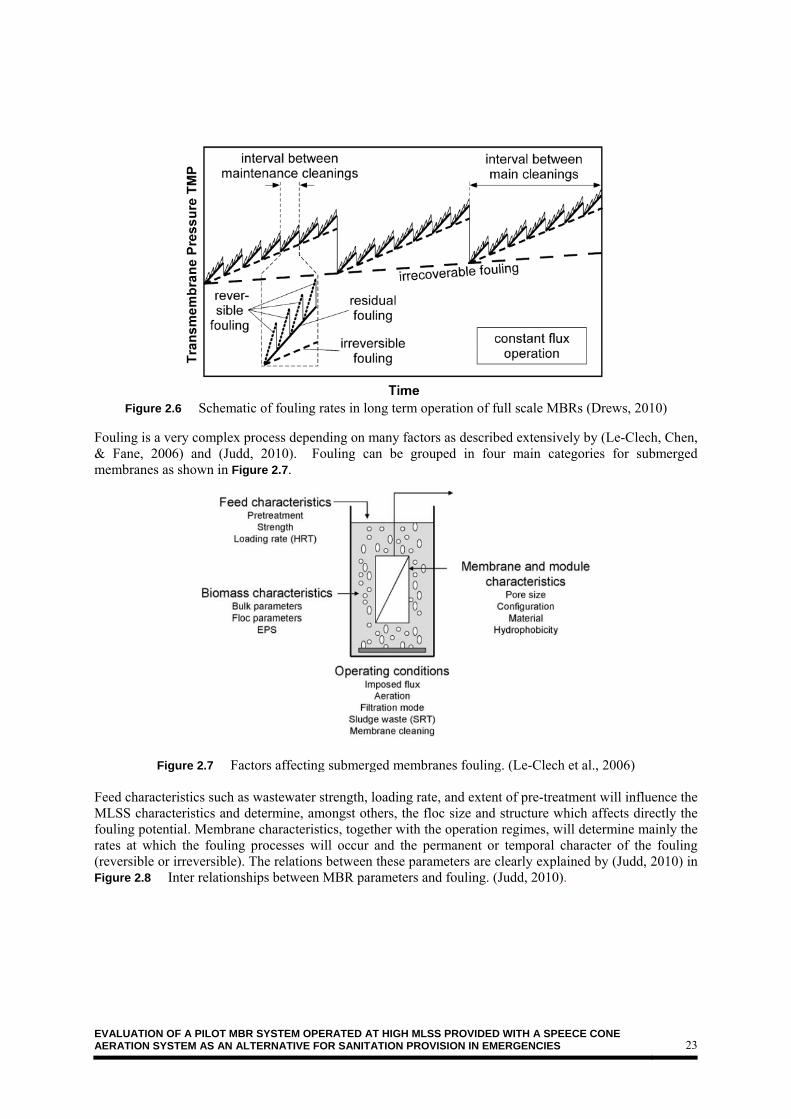
Filterability allows monitoring how the permeability is affected by the sludge characteristics. The filterability determination may help to identify new methods to prevent reversible fouling. In addition, more efficient filtration systems can be developed for sludge exhibiting low filterability (Lousada-Ferreira et al., 2010). No relation between permeability and filterability has been reported in the studies developed by (Gil et al., 2011) using different membrane configurations (hollow fiber vs. tubular membranes) at full scale municipal WWTP in The Netherlands. Fouling Membrane fouling refers to the accumulation of materials on top of the filtrating surface affecting the permeate production. The accumulated materials can be both from inorganic or organic (mostly biological) origin (Henze, 2008). Even though MBR capital expenditures (CAPEX)s have been reduced as membrane costs have been continuosuy decreased, still the operational expenditures (OPEX) related to energy consumption (mainly to evercome fouling) represent the major constraint to implement large scale membrane bioreactors. Excesive fouling can lead to a relevant decrease in permeate production, an increase in the backflush/cleanning frequencies, and even to permanent damage due to irreversible fouling (Drews, 2010). There are many ways to classify fouling depending on the fouling mechanism, the type of deposited material, and also based on the definitive or temporary character of the permeate losses. Reversible fouling is associated to materials that can be removed from the membrane surface applying physical methods like relaxation or back flushing. Irreversible fouling can only be removed by chemical methods that are usually applied with a lower frequency (Henze, 2008); that condition allows irreversible fouling to build up as shown in Figure 2.6. When fouling cannot be removed either physically or chemically, then the fouling is described as irrecoverable fouling. The permeate production capacity of that filtration element cannot be recovered. Irrecoverable fouling is represented as the dashed line with the lowest slope in Figure 2.6.
EVALUATION OF A PILOT MBR SYSTEM OPERATED AT HIGH MLSS PROVIDED WITH A SPEECE CONE AERATION SYSTEM AS AN ALTERNATIVE FOR SANITATION PROVISION IN EMERGENCIES 23
Figure 2.6 Schematic of fouling rates in long term operation of full scale MBRs (Drews, 2010)
Fouling is a very complex process depending on many factors as described extensively by (Le-Clech, Chen, & Fane, 2006) and (Judd, 2010). Fouling can be grouped in four main categories for submerged membranes as shown in Figure 2.7.
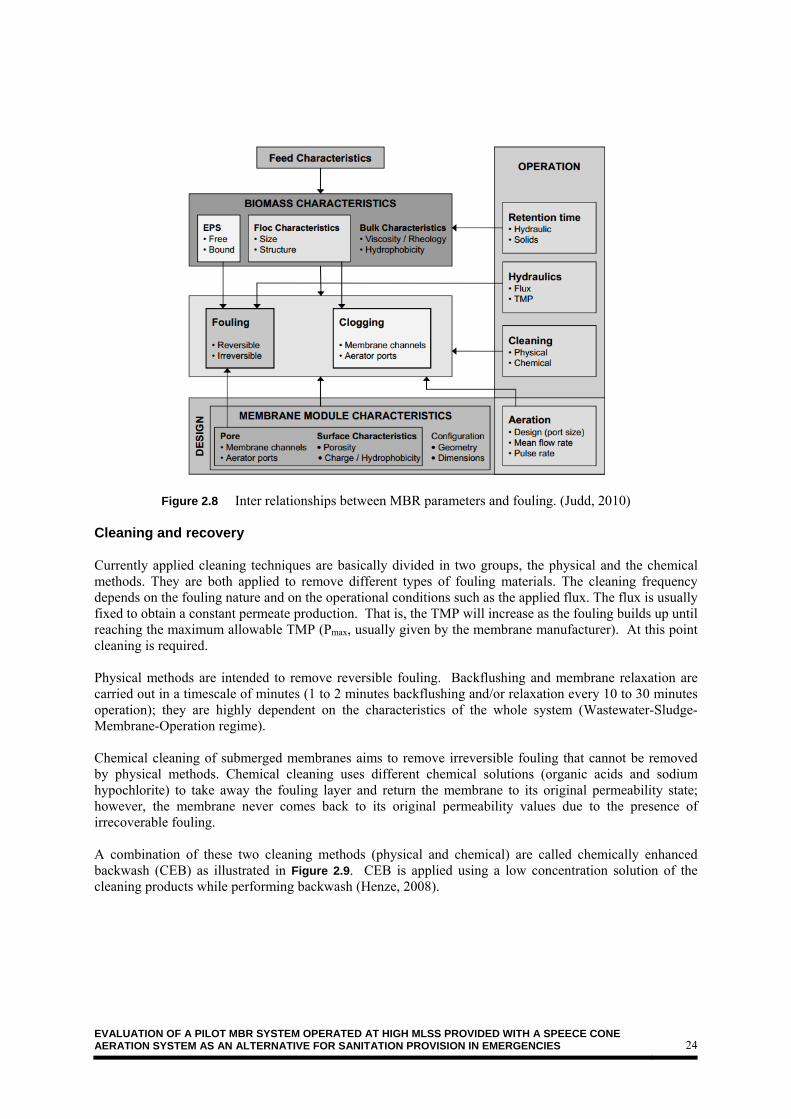
Figure 2.7 Factors affecting submerged membranes fouling. (Le-Clech et al., 2006) Feed characteristics such as wastewater strength, loading rate, and extent of pre-treatment will influence the MLSS characteristics and determine, amongst others, the floc size and structure which affects directly the fouling potential. Membrane characteristics, together with the operation regimes, will determine mainly the rates at which the fouling processes will occur and the permanent or temporal character of the fouling (reversible or irreversible). The relations between these parameters are clearly explained by (Judd, 2010) in Figure 2.8 Inter relationships between MBR parameters and fouling. (Judd, 2010).
EVALUATION OF A PILOT MBR SYSTEM OPERATED AT HIGH MLSS PROVIDED WITH A SPEECE CONE AERATION SYSTEM AS AN ALTERNATIVE FOR SANITATION PROVISION IN EMERGENCIES 24
Figure 2.8 Inter relationships between MBR parameters and fouling. (Judd, 2010)
Cleaning and recovery Currently applied cleaning techniques are basically divided in two groups, the physical and the chemical methods. They are both applied to remove different types of fouling materials. The cleaning frequency depends on the fouling nature and on the operational conditions such as the applied flux. The flux is usually fixed to obtain a constant permeate production. That is, the TMP will increase as the fouling builds up until reaching the maximum allowable TMP (Pmax, usually given by the membrane manufacturer). At this point cleaning is required. Physical methods are intended to remove reversible fouling. Backflushing and membrane relaxation are carried out in a timescale of minutes (1 to 2 minutes backflushing and/or relaxation every 10 to 30 minutes operation); they are highly dependent on the characteristics of the whole system (Wastewater-Sludge-Membrane-Operation regime). Chemical cleaning of submerged membranes aims to remove irreversible fouling that cannot be removed by physical methods. Chemical cleaning uses different chemical solutions (organic acids and sodium hypochlorite) to take away the fouling layer and return the membrane to its original permeability state; however, the membrane never comes back to its original permeability values due to the presence of irrecoverable fouling. A combination of these two cleaning methods (physical and chemical) are called chemically enhanced backwash (CEB) as illustrated in Figure 2.9. CEB is applied using a low concentration solution of the cleaning products while performing backwash (Henze, 2008).

EVALUATION OF A PILOT MBR SYSTEM OPERATED AT HIGH MLSS PROVIDED WITH A SPEECE CONE AERATION SYSTEM AS AN ALTERNATIVE FOR SANITATION PROVISION IN EMERGENCIES 25
Figure 2.9 Simplified scheme of membrane cleaning methods. (Henze, 2008) Chemical cleaning usually takes place two to four times per year, but it can be more frequent depending on the mixed liquor-membrane interactions. Cleaning in place (CIP) is the most common practice to perform chemical cleaning by filling the membrane chamber with the cleaning agent. CIP can also be performed on a separate tank.
2.3. CONVENTIONAL AERATION METHODS
Aeration is a key aspect in terms of operational expenses representing 45 to 75% of the total energy demand for aerobic treatment processes in both CAS and MBR treatment systems (Henze, 2008). Low pressure aeration with fine bubble diffusers is the most utilized popular method to deliver the system’s required oxygen demand. The bubble diffusers come in many different shapes and configurations; essentially, they are comprised of a structural part providing support to a perforated polymeric membrane that breaks down the air flow into small bubbles. Both disc and tubular diffusers are used extensively worldwide (Figure 2.10). Recently, flat panels are taking over a portion of the market due to their simplified requirements for installation and the fact that they can be easily removed from the aeration basin for either maintenance or replacement needs.
Figure 2.10 Disc and tubular diffusers for fine bubble aeration. Stanford Scientific International LLC.

EVALUATION OF A PILOT MBR SYSTEM OPERATED AT HIGH MLSS PROVIDED WITH A SPEECE CONE AERATION SYSTEM AS AN ALTERNATIVE FOR SANITATION PROVISION IN EMERGENCIES 26
The aeration efficiency depends on the temperature, the oxygen partial pressure at the site conditions, the amount and size of solids in the water, and on the effective contact area between the two phases (liquid and gas phase); therefore, the size of the bubble is relevant. The smaller the bubbles, the higher the contact area; therefore, the better the oxygen transfer. 2.3.1. Factors affecting oxygen transfer ALPHA FACTOR Sub surface aeration efficiency is often measured as the Oxygen transfer efficiency (OTE, %), As shown in Equation (2.7) the OTE is defined as the net oxygen mass flow into the water phase. (Henze, 2008).
, ,
,
(2.7)
The extent of the achievable transfer, among others, is affected by the amount and size of solids in the water (with a higher negative impact as the MLSS concentration increases). To evaluate the effects of the MLSS on the oxygen transfer, the alpha factor concept was developed. The alpha factor is defined as the ratio between the OTE on process water and the OTE on clean water as described in Equation 2.8 below (expressed for standard conditions of 20ºC and 1 atm) αSOTE and SOTE, respectively.
∝∝
(2.8)
Since the amount of oxygen transferred to the water phase is a function of a mass transfer process, the ratio between the process water mass transfer coefficient (KLa process water) and the clean water mass transfer coefficient (KLa process water) is equivalent to the same alpha factor previously defined (Henze, 2008) as described in Equation (2.9).
∝ (2.9)

EVALUATION OF A PILOT MBR SYSTEM OPERATED AT HIGH MLSS PROVIDED WITH A SPEECE CONE AERATION SYSTEM AS AN ALTERNATIVE FOR SANITATION PROVISION IN EMERGENCIES 27
The MLSS effect The alpha factor is a representation on the extent of the reduction of the oxygen transfer in process water versus clean water. Therefore, it is easy to anticipate the big influence of the MLSS on this respect. That relation has been reported by many authors as shown in Figure 2.11.
Figure 2.11 MLSS concentration and alpha factor correlation (Ando, 2013). This relation is especially relevant considering that the oxygen not only needs to get transferred through the water-liquid interphase, but also the dissolved oxygen needs to travel all the way until it reaches an active biofloc (Garcia-Ochoa & Gomez, 2009) as shown in Figure 2.12. The alpha factor is relevant for activated sludge processes, but even more relevant for membrane bioreactors where the high MLSS reduces the alpha factor introducing a big constraint to upscale the treatment capacities by increasing the applied organic load per unit volume of the biological reactor.
Figure 2.12 Oxygen transfer from gas phase to cell or solid particle. Adapted from (Garcia-Ochoa & Gomez, 2009)
Bubble Gas film
Liquid film around bubble
Bulk liquid
Liquid film around cells
Cytoplasm
Site of reaction

EVALUATION OF A PILOT MBR SYSTEM OPERATED AT HIGH MLSS PROVIDED WITH A SPEECE CONE AERATION SYSTEM AS AN ALTERNATIVE FOR SANITATION PROVISION IN EMERGENCIES 28
Oxygen Uptake Rate (OUR20) The oxygen not only needs to be dissolved in the water, but also the dissolved oxygen needs to be used by the active microorganisms to accomplish the purpose of aeration. The extent of the biological activity can be determined by the oxygen uptake rate (OUR); a parameter developed by many authors including (Sollfrank & Gujer, 1990), (Kappeler & Gujer, 1994) and (Spanjers, Vanrolleghem, Olsson, & Dold, 1998). The oxygen uptake rate (OUR20) is a measure of the oxygen depletion in a saturated sludge sample under standard conditions (20ºC, 1 atm). It can also be referred as the respirometry test for the activated sludge. When divided the OUR by the sludge volatile suspended solids leads to the specific oxygen uptake rate (SOUR20); that is, a measure of the sludge activity per mass unit. THE SPEECE CONE The Speece cone was developed in the United States in 1971 for hypolimnetic aeration of ponds and lakes for remediation purposes by Richard Speece. Dr. Speece got a US patent, (Speece, 1972) but it was only until 1990 when it was actually evaluated at the Logan Martin Dam in Alabama by the Alabama Power Company (Ashley et al., 2008). The Speece cone Figure 2.13 consists of a conic structure fed with water from the top at a high velocity (3 m/s). Pure oxygen is injected right at the inlet close to the smallest cone diameter. Once the oxygen is introduced, the gas buoyancy will lift the gas up, but the down-flow velocity of the water will keep the oxygen in the throat section of the cone. The oxygen bubbles have both enough detention time and surface contact area under mid-high pressure (from 2 to 5 bar) to get the oxygen dissolved into the water. Saturation oxygen concentrations of up to 300% can be achieved. The supersaturated flow is discharged from the bottom of the cone to either a tank or a lake (or any other water source). There are no available research publications describing the performance of this technology on MLSS for membrane bioreactors aeration applications.
Figure 2.13 Speece cone. SOURCE: ECO2 TECH website 2014 The Speece cone has shown very satisfactory oxygen transfer efficiency results regarding both the oxygen transfer coefficient (KLa), and the standard oxygen transfer rate (SOTE) when the process is controlled based on the flow discharge velocity and on the oxygen input flow rate as shown in Figure 2.14.

EVALUATION OF A PILOT MBR SYSTEM OPERATED AT HIGH MLSS PROVIDED WITH A SPEECE CONE AERATION SYSTEM AS AN ALTERNATIVE FOR SANITATION PROVISION IN EMERGENCIES 29
Figure 2.14 KLa and SOTE increase with higher discharge velocities (Ashley et al., 2008).
According to the research conducted by Ashley et al., (2008), the flow discharge velocities should be higher than 70 cm/s in order to achieve a higher transfer. In addition, the authors reported the importance of keeping the gas-liquid interphase stable at the cone's throat; otherwise, the efficiency will decrease drastically. The operation of the Speece cones on air instead of on pure oxygen is not economically feasible due to the low energetic efficiency caused by the increase in the recirculation pumping needs required to provide similar results (Ashley et al., 2008).
EVALUATION OF A PILOT MBR SYSTEM OPERATED AT HIGH MLSS PROVIDED WITH A SPEECE CONE AERATION SYSTEM AS AN ALTERNATIVE FOR SANITATION PROVISION IN EMERGENCIES 30
This chapter presents a brief introduction to the site where the pilot plant was installed. In addition, it describes the equipment that had to be assembled before the data acquisition phase started. Moreover, the analytical methods utilized on this research are described.
3.1. Worksite description
Since the Harnaschpolder wastewater treatment plant (HNP WWTP) is classified as an industrial facility, any person who works there is required to hold a special safety certification. The Veiligheids Checklist Aannemers (VCA), or safety checklist for contractors, can be obtained after an examination administered by a specialized company. The holder of this certification is considered to have enough knowledge to minimize the risks related to working in an industrial environment; that is, the worker can be responsible for his own safety. It was necessary to get the aforementioned certification before starting any kind of work at the treatment plant. 3.1.1. Harnaschpolder Wastewater treatment plant The following information has been adapted from the DELFLUENT website's description of the HNP WWTP. The Harnaschpolder Wastewater treatment plant is the newest plant in the area of South Holland. It was inaugurated in the year 2006, and it is the biggest plant in The Netherlands. In addition, the plant is amongst the largest WWTP in Europe with a treatment capacity of 1.3 million people equivalent (PE). The main relevant characteristics of this treatment plant are as follows:
Treatment capacity : 1.3 Million PE : 3 m³/s Dry Weather Flow (DWF) 9 m³/s Rain Weather Flow (RWF) Occupied Area : 25.000 m² Treatment units: : Coarse and fine screens (6mm) Primary settlers (4 units; diam: 47m; h:3.5m) Aerobic reactors (8 units) Secondary clarifiers (16 units) Sludge thickeners (2 units) Sludge anaerobic digesters (2 units)
CHAPTER 3
Materials and Methods

EVALUATION OF A PILOT MBR SYSTEM OPERATED AT HIGH MLSS PROVIDED WITH A SPEECE CONE AERATION SYSTEM AS AN ALTERNATIVE FOR SANITATION PROVISION IN EMERGENCIES 31
The plant uses a conventional activated sludge system (CAS) with coarse and fine screening followed by primary settlers. The primary influent is then pumped to the biological reactor consisting of a circular tank divided in different reaction chambers as follows: a selector, a pre denitrification chamber, and finally an aerobic section which also serves as a post denitrification basin when the aeration is turned off achieving anoxic conditions. The treatment train finishes with secondary settlers (Figure 3.2), and the treated water is pumped to a main storage facility in the proximity of the coastal area close to the treatment plant. From there, the treated wastewater is finally disposed three kilometers into the North Sea. The waste sludge is thickened and anaerobically digested to produce biogas. The biogas is used for power generation. The digested biosolids are dewatered with centrifuges and then transported by trucks to an incineration facility. Typical influent and effluent values are shown in Figure 3.1.
Figure 3.1 Influent and effluent water quality at Harnaschpolder WWTP
Figure 3.2 General view of the secondary settlers HNP WWTP.
January February March April May June July August SeptembeOctober Novembe Decembe
Q m³/d 224,226 217,828 180,786 169,456 189,603 160,677 175,062 215,437 151,883 180,177 177,835 228,907
T °C 13.5 13.1 14.3 16.2 17.0 22.4 20.2 20.4 19.4 17.9 14.6
pH 7.7 9.8 9.7 8.8 8.3 8.2 4.6 7.1 6.3 5.7 5.6 7.2
TSS mg/l 228.7 246.8 267.0 276.7 272.9 306.3 285.0 239.7 289.3 286.3 291.9 252.3
BOD5 mg/l 208.0 211.6 255.7 265.0 251.6 271.0 240.0 189.0 264.4 234.7 280.4 213.9
COD mg/l 448.0 487.2 556.3 578.8 544.8 587.5 559.3 441.0 579.1 558.3 583.3 480.8
0.46 0.43 0.46 0.46 0.46 0.46 0.43 0.43 0.46 0.42 0.48 0.44
TKN mg/l 46.3 50.2 57.4 60.3 54.6 58.3 55.1 43.0 59.8 55.7 58.0 47.2
Ntot mg/l 46.3 50.2 57.4 60.3 54.6 58.3 55.1 43.0 59.8 55.7 58.0 47.2
PT mg/l 6.5 7.3 8.1 8.6 7.9 8.6 8.1 6.3 8.8 8.1 8.3 6.8
PE 1,041,223 1,053,669 1,067,336 1,058,533 1,076,416 1,006,888 1,003,727 922,304 934,001 1,069,619 1,077,613 1,074,301
2014
influent
January February March April May June July August SeptembeOctober Novembe Decembe
TSS mg/l 5.0 <4 <4 <4 <4 <4 <4 <4 <4 <4 <4 <4
BOD5 mg/l 2.4 2.2 1.9 1.9 2.1 1.7 2.8 1.7 5.5 2.5 1.8 2.1
COD mg/l 30.0 29.0 32.0 34.0 32.0 33.0 34.0 27.0 36.0 31.0 30.0 28.0
TKN mg/l 2.3 2.1 2.3 2.3 2.2 2.2 2.7 2.1 2.0 2.5 2.1 2.3
TP mg/l 1.0 1.0 0.9 0.9 1.0 0.7 1.2 0.8 0.7 1.1 1.1 1.0
effluent
EVALUATION OF A PILOT MBR SYSTEM OPERATED AT HIGH MLSS PROVIDED WITH A SPEECE CONE AERATION SYSTEM AS AN ALTERNATIVE FOR SANITATION PROVISION IN EMERGENCIES 32
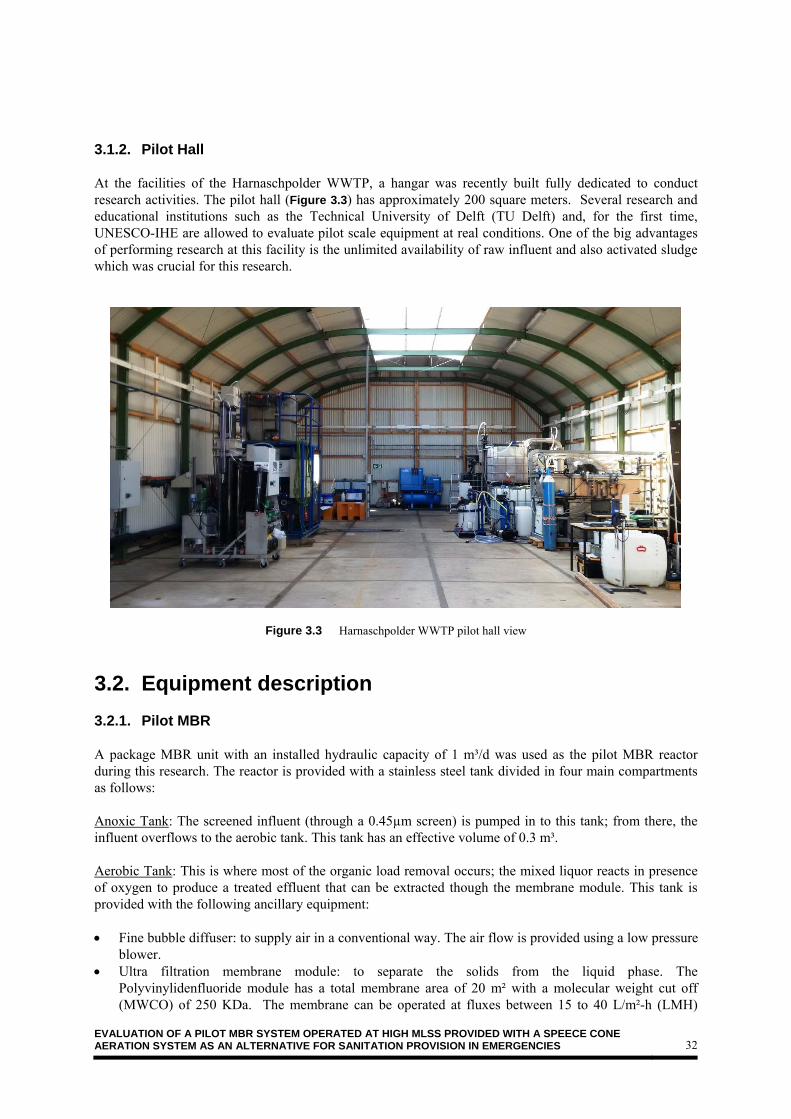
3.1.2. Pilot Hall At the facilities of the Harnaschpolder WWTP, a hangar was recently built fully dedicated to conduct research activities. The pilot hall (Figure 3.3) has approximately 200 square meters. Several research and educational institutions such as the Technical University of Delft (TU Delft) and, for the first time, UNESCO-IHE are allowed to evaluate pilot scale equipment at real conditions. One of the big advantages of performing research at this facility is the unlimited availability of raw influent and also activated sludge which was crucial for this research.
Figure 3.3 Harnaschpolder WWTP pilot hall view
3.2. Equipment description
3.2.1. Pilot MBR A package MBR unit with an installed hydraulic capacity of 1 m³/d was used as the pilot MBR reactor during this research. The reactor is provided with a stainless steel tank divided in four main compartments as follows: Anoxic Tank: The screened influent (through a 0.45µm screen) is pumped in to this tank; from there, the influent overflows to the aerobic tank. This tank has an effective volume of 0.3 m³. Aerobic Tank: This is where most of the organic load removal occurs; the mixed liquor reacts in presence of oxygen to produce a treated effluent that can be extracted though the membrane module. This tank is provided with the following ancillary equipment: Fine bubble diffuser: to supply air in a conventional way. The air flow is provided using a low pressure
blower. Ultra filtration membrane module: to separate the solids from the liquid phase. The
Polyvinylidenfluoride module has a total membrane area of 20 m² with a molecular weight cut off (MWCO) of 250 KDa. The membrane can be operated at fluxes between 15 to 40 L/m²-h (LMH)

EVALUATION OF A PILOT MBR SYSTEM OPERATED AT HIGH MLSS PROVIDED WITH A SPEECE CONE AERATION SYSTEM AS AN ALTERNATIVE FOR SANITATION PROVISION IN EMERGENCIES 33
depending on the operation mode (according to the manufacturer information – Memos). This membrane module is shown in Figure 3.4.
Figure 3.4 MBR Membrane module
Recirculation pump: It is used to recirculate the mixed liquor from the aerobic tank to the anoxic tank, for the denitrification process to occur. A fraction of the recirculated flow can be discharged as waste sludge by using a set of two ball valves. The pump runs automatically with a timed control loop controlled by the main programmable logic controller (PLC).
Permeate tank: The permeate tank receives the treated water (permeate), which is also used for the membrane backwash. The permeate tank has a free discharge inlet (θ 25mm), a drain line with a ball valve at the bottom (θ 25mm), and an outlet line (θ 25mm). Waste sludge tank: The waste sludge tank is a separate compartment built in the MBR for temporary storage of wasted sludge. The tank has a discharge line (2 inches) to the drain and a ball valve to control the discharge. Permeate Pump: A bidirectional centrifuge pump is used for both the permeate production and the backwash processes. The pump can deliver a maximum flow of 1 m³/h with a dynamic head of 10 m. The operation of the pump is conditioned by the level sensors signals controlled by the PLC to perform time controlled cycles Low pressure blower: A twin chamber diaphragm air pump (Figure 3.5) with a capacity of 205 liters per minute (Lpm) at 250 mbar. The blower runs automatically using a timed control system from the main control panel.

EVALUATION OF A PILOT MBR SYSTEM OPERATED AT HIGH MLSS PROVIDED WITH A SPEECE CONE AERATION SYSTEM AS AN ALTERNATIVE FOR SANITATION PROVISION IN EMERGENCIES 34
Figure 3.5 Low pressure blower for conventional aeration Control and instrumentation Control box: NEMA4 box with a main PLC to control the operation in automatic mode as shown in
Figure 3.6.
Figure 3.6 MBR control box. Electromagnetic flow indicator transmitter (FIT): The FIT (Figure 3.7) is an electromagnetic device to
measure the flow discharge from the sludge recirculation pump of the Speece cone system. In addition, it has a logic control to protect the pump from running dry.

EVALUATION OF A PILOT MBR SYSTEM OPERATED AT HIGH MLSS PROVIDED WITH A SPEECE CONE AERATION SYSTEM AS AN ALTERNATIVE FOR SANITATION PROVISION IN EMERGENCIES 35
Figure 3.7 Electromagnetic flow indicator transmitter (FIT) Pressure indicator transmitter (PIT): The PIT is installed in the permeate line. This instrument gives a
4-20 mA signal to the PLC. In addition, this instrument protects the membrane from over pressure. The setpoints are established at +50 and -55 Kpa when backwashing and permeating, respectively
Level switches: Double plate contact switches built in the aerobic tank wall. There are three in total
for high level (H), low level (L) and very low level (LL) to control the feed pump, permeate pump, and permeate cycles.
3.2.2. Speece cone setup A Speece cone setup is coupled to the MBR system. The Speece cone system consists of a positive displacement pump and a pressurized cone. The mixed liquor is pumped from the aerobic tank through a pressurized cone. At the pressurized cone, oxygen gas is introduced and gets dissolved in the mixed liquor. Then the mixed liquor is returned back to the aerobic tank. The process components are shown in Figure 3.11. The main components of the Speece cone system are described as follows: Sludge pump: The sludge pump (Figure 3.9) has a maximum pumping capacity of 12 m³/h at 7 bar. The pump can be controlled by using a variable frequency drive (VFD, Figure 3.8). A control loop with a flow meter was incorporated to stop the pump when the flow is too low. The control loop avoids potential damage to the stator by preventing the system to run dry.
Figure 3.8 Variable frequency drive to control the sludge pump discharge.

EVALUATION OF A PILOT MBR SYSTEM OPERATED AT HIGH MLSS PROVIDED WITH A SPEECE CONE AERATION SYSTEM AS AN ALTERNATIVE FOR SANITATION PROVISION IN EMERGENCIES 36
Figure 3.9 Positive displacement pump for the sludge closed circuit. It had to be assembled on site. Speece cone: The cone is a pressure vessel where the oxygen dissolves into the mixed liquor in a closed recirculation circuit as observed in Figure 3.10.
Figure 3.10 Speece cone before and after installation
EVALUATION OF A PILOT MBR SYSTEM OPERATED AT HIGH MLSS PROVIDED WITH A SPEECE CONE AERATION SYSTEM AS AN ALTERNATIVE FOR SANITATION PROVISION IN EMERGENCIES 37
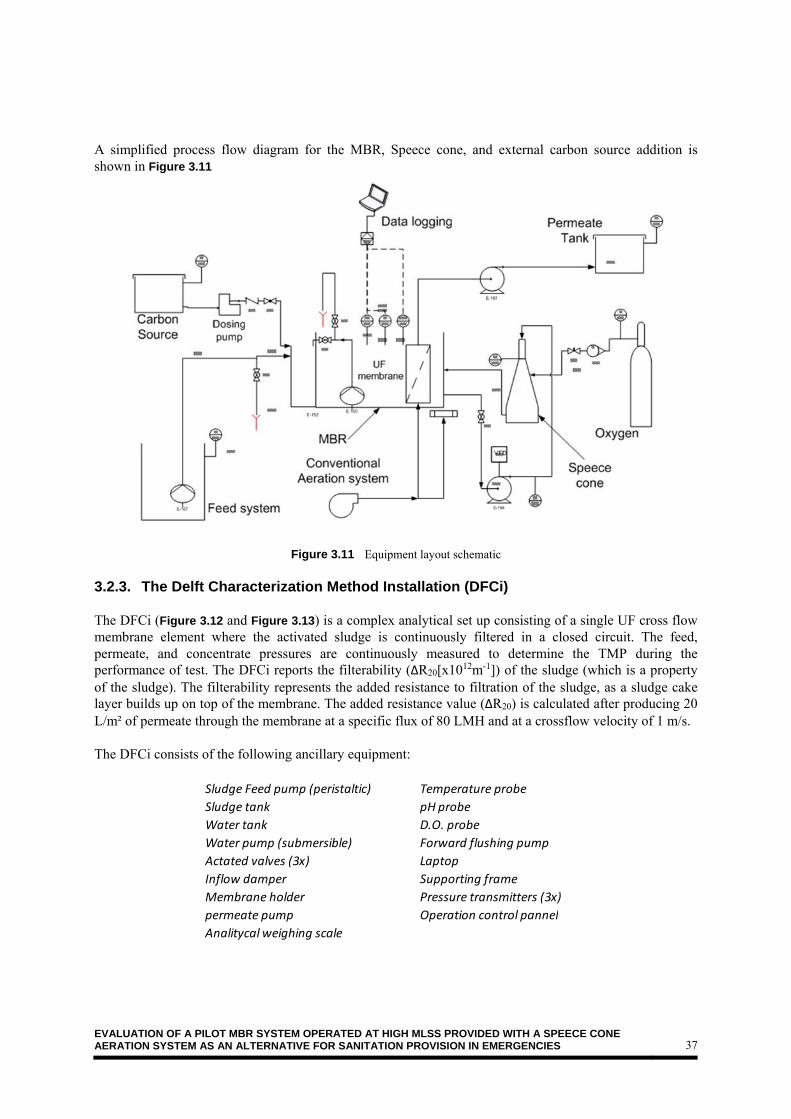
A simplified process flow diagram for the MBR, Speece cone, and external carbon source addition is shown in Figure 3.11
Figure 3.11 Equipment layout schematic 3.2.3. The Delft Characterization Method Installation (DFCi) The DFCi (Figure 3.12 and Figure 3.13) is a complex analytical set up consisting of a single UF cross flow membrane element where the activated sludge is continuously filtered in a closed circuit. The feed, permeate, and concentrate pressures are continuously measured to determine the TMP during the performance of test. The DFCi reports the filterability (ΔR20[x1012m-1]) of the sludge (which is a property of the sludge). The filterability represents the added resistance to filtration of the sludge, as a sludge cake layer builds up on top of the membrane. The added resistance value (ΔR20) is calculated after producing 20 L/m² of permeate through the membrane at a specific flux of 80 LMH and at a crossflow velocity of 1 m/s. The DFCi consists of the following ancillary equipment:
Sludge Feed pump (peristaltic) Temperature probe
Sludge tank pH probe
Water tank D.O. probe
Water pump (submersible) Forward flushing pump
Actated valves (3x) Laptop
Inflow damper Supporting frame
Membrane holder Pressure transmitters (3x)
permeate pump Operation control pannel
Analitycal weighing scale

EVALUATION OF A PILOT MBR SYSTEM OPERATED AT HIGH MLSS PROVIDED WITH A SPEECE CONE AERATION SYSTEM AS AN ALTERNATIVE FOR SANITATION PROVISION IN EMERGENCIES 38
Figure 3.12 The Delft Filtration Characterization installation at the TU Delft.
Figure 3.13 The DFCi at the Harnaschpolder WWTP (left). DFCi process diagram (Lousada-Ferreira, 2011)

EVALUATION OF A PILOT MBR SYSTEM OPERATED AT HIGH MLSS PROVIDED WITH A SPEECE CONE AERATION SYSTEM AS AN ALTERNATIVE FOR SANITATION PROVISION IN EMERGENCIES 39
3.2.4. Other sub-systems Oxygen gas feed system The setup is described in Figure 3.14 and Figure 3.15. It consists of an oxygen gas cylinder (50 L at 200 bar) followed by a pressure regulator to bring down the cylinder's pressure from 200 to 5 bar. Then, a needle valve allows regulating more precisely the pressure to values lower than 5 bar. Following the needle valve, a bypass valve for pressure release was installed. This valve also serves as an oxygen source to saturate a sample when performing the OUR determination. The system is also provided with a digital mass flow controller; this controller allows to have a steady gas feed to the injection point at the Speece cone. A gas relief valve is provided downstream the mass controller in the proximity of the gas inlet at the cone for easy depressurizing the mass flow controller. The relief valve is followed by both a ball valve and a check valve to avoid the sludge from entering the gas line.
Figure 3.14 Gas feed system schematic for design and purchasing purposes
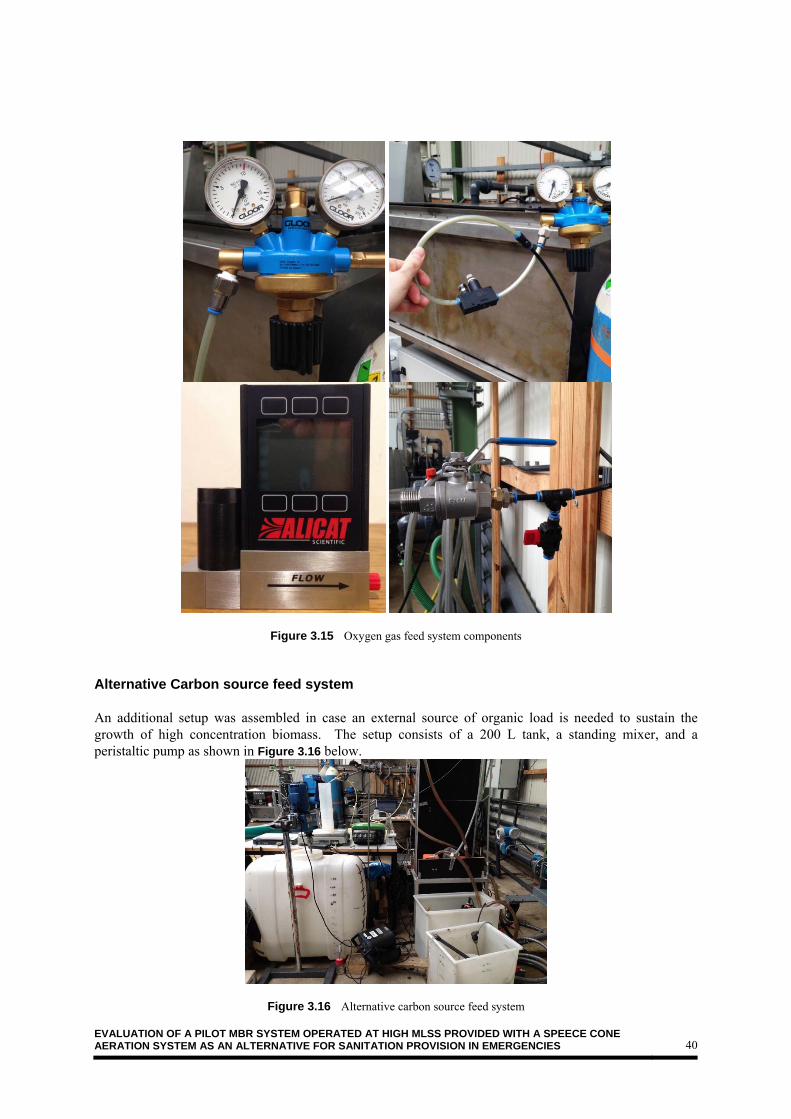
EVALUATION OF A PILOT MBR SYSTEM OPERATED AT HIGH MLSS PROVIDED WITH A SPEECE CONE AERATION SYSTEM AS AN ALTERNATIVE FOR SANITATION PROVISION IN EMERGENCIES 40
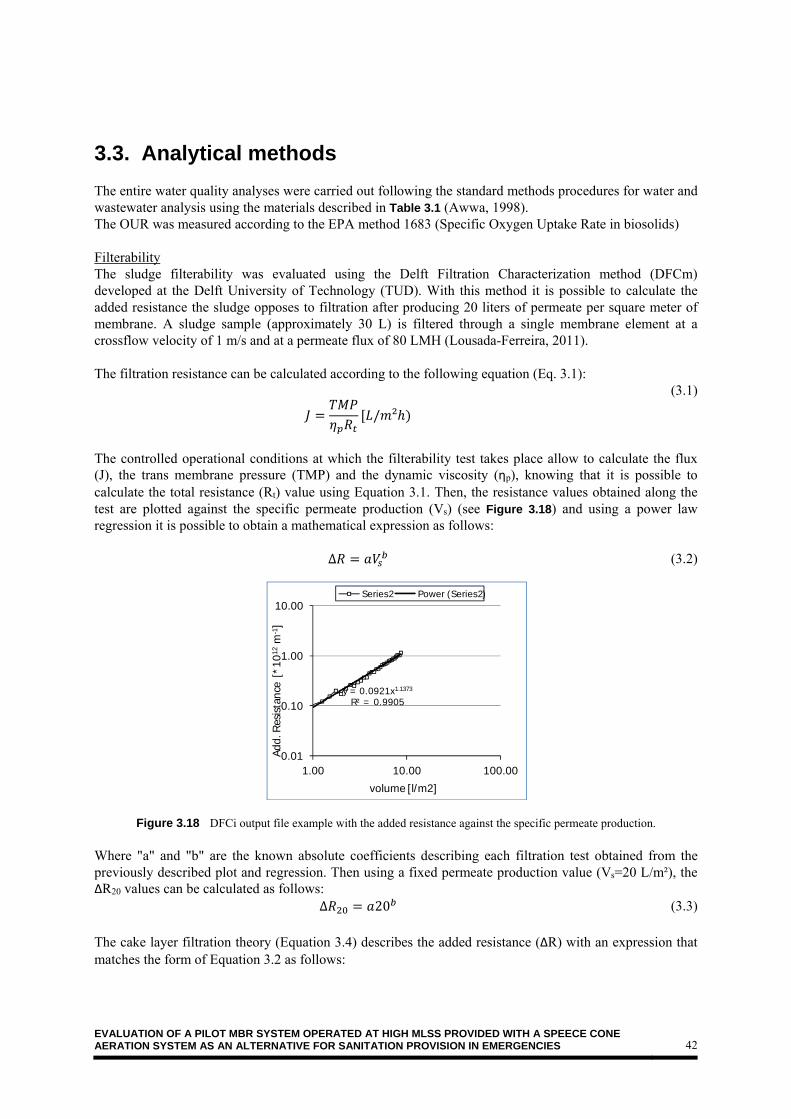
Figure 3.15 Oxygen gas feed system components Alternative Carbon source feed system An additional setup was assembled in case an external source of organic load is needed to sustain the growth of high concentration biomass. The setup consists of a 200 L tank, a standing mixer, and a peristaltic pump as shown in Figure 3.16 below.
Figure 3.16 Alternative carbon source feed system

EVALUATION OF A PILOT MBR SYSTEM OPERATED AT HIGH MLSS PROVIDED WITH A SPEECE CONE AERATION SYSTEM AS AN ALTERNATIVE FOR SANITATION PROVISION IN EMERGENCIES 41
Biological Oxygen Monitor (BOM) system A peristaltic pump takes the mixed liquor directly from the reactor and to the BOM. The BOM is sitting on a magnetic plate keeping the sample homogeneous. A dissolved oxygen probe can be introduced into the BOM to continuously measured and log the dissolved oxygen values to later calculate the oxygen uptake rate. Activated Sludge feed system Considering that large amounts of activated sludge from the WWTP will be required for seeding and starting up the 1.2 m3 MBR reactor, a feed system (Figure 3.17) was installed to bring sludge from the WWTP to the pilot MBR system. A submersible pump was installed in one of the sludge pumping stations at the HPN WWTP. This pump was placed in the activated sludge chamber of the HPN WWTP tank E30 (approximately 150 m far from the pilot hall); from there, the sludge is pumped through a HDPE piping system from the plant to the pilot hall. This installation is temporal, and the pump has to be switched on and off manually. This setup will be replaced by HPN WWTP staff for a permanent pump to make the activated sludge available at the pilot hall for research purposes.
Figure 3.17 Submersible pump in the sludge basin connected to the sludge line (Up left); Sludge line at the pilot hall connected to a reinforced hose (Up right); Reinforced hose and MBR reactor (down left); Activated sludge discharge in the
MBR reactor (down right).
EVALUATION OF A PILOT MBR SYSTEM OPERATED AT HIGH MLSS PROVIDED WITH A SPEECE CONE AERATION SYSTEM AS AN ALTERNATIVE FOR SANITATION PROVISION IN EMERGENCIES 42
3.3. Analytical methods
The entire water quality analyses were carried out following the standard methods procedures for water and wastewater analysis using the materials described in Table 3.1 (Awwa, 1998). The OUR was measured according to the EPA method 1683 (Specific Oxygen Uptake Rate in biosolids) Filterability The sludge filterability was evaluated using the Delft Filtration Characterization method (DFCm) developed at the Delft University of Technology (TUD). With this method it is possible to calculate the added resistance the sludge opposes to filtration after producing 20 liters of permeate per square meter of membrane. A sludge sample (approximately 30 L) is filtered through a single membrane element at a crossflow velocity of 1 m/s and at a permeate flux of 80 LMH (Lousada-Ferreira, 2011). The filtration resistance can be calculated according to the following equation (Eq. 3.1):
/ ²
(3.1)
The controlled operational conditions at which the filterability test takes place allow to calculate the flux (J), the trans membrane pressure (TMP) and the dynamic viscosity (ηp), knowing that it is possible to calculate the total resistance (Rt) value using Equation 3.1. Then, the resistance values obtained along the test are plotted against the specific permeate production (Vs) (see Figure 3.18) and using a power law regression it is possible to obtain a mathematical expression as follows:
∆ (3.2)
Figure 3.18 DFCi output file example with the added resistance against the specific permeate production. Where "a" and "b" are the known absolute coefficients describing each filtration test obtained from the previously described plot and regression. Then using a fixed permeate production value (Vs=20 L/m²), the ΔR20 values can be calculated as follows:
∆ 20 (3.3)
The cake layer filtration theory (Equation 3.4) describes the added resistance (ΔR) with an expression that matches the form of Equation 3.2 as follows:
y = 0.0921x1.1373
R² = 0.9905
0.01
0.10
1.00
10.00
1.00 10.00 100.00
Add.
Res
ista
nce
[*10
12m
-1]
volume [l/m2]
Series2 Power (Series2)

EVALUATION OF A PILOT MBR SYSTEM OPERATED AT HIGH MLSS PROVIDED WITH A SPEECE CONE AERATION SYSTEM AS AN ALTERNATIVE FOR SANITATION PROVISION IN EMERGENCIES 43
∆ ∝ . . (3.4)
From these two equations it is possible to identify the experimental coefficients around Vs "a" and "b" as:
∝ . 1
1
(3.5)
Where: αR :Specific cake resistance [m/Kg] ci : Concentration of fouling particles [Kg/m³] s : Compresibility coefficient [1] Following the expressions in Equation 3.5 it is possible to calculate the product (αR*ci) and the "s" coefficient to validate the measurements. Permeability The Operational permeability (OPT) represents the changes in the permeate production or flux (J, [L/m²/h]) related to the transmembrane pressure (TMP, [bar]). It can be calculated using the following expression:
². .
(3.6)
Where: Q: flow [L/h] A: membrane area [m²] Because the filtration process is highly dependent on the fluid viscosity and therefore on temperature, the permeability must be normalized at a fixed temperature as follows:
.1.793 . .
². .
(3.7)
Where: ηT : Dynamic viscosity at sample temperature [mPa.s] ηTN : Dynamic viscosity at normalized temperature [mPa.s]
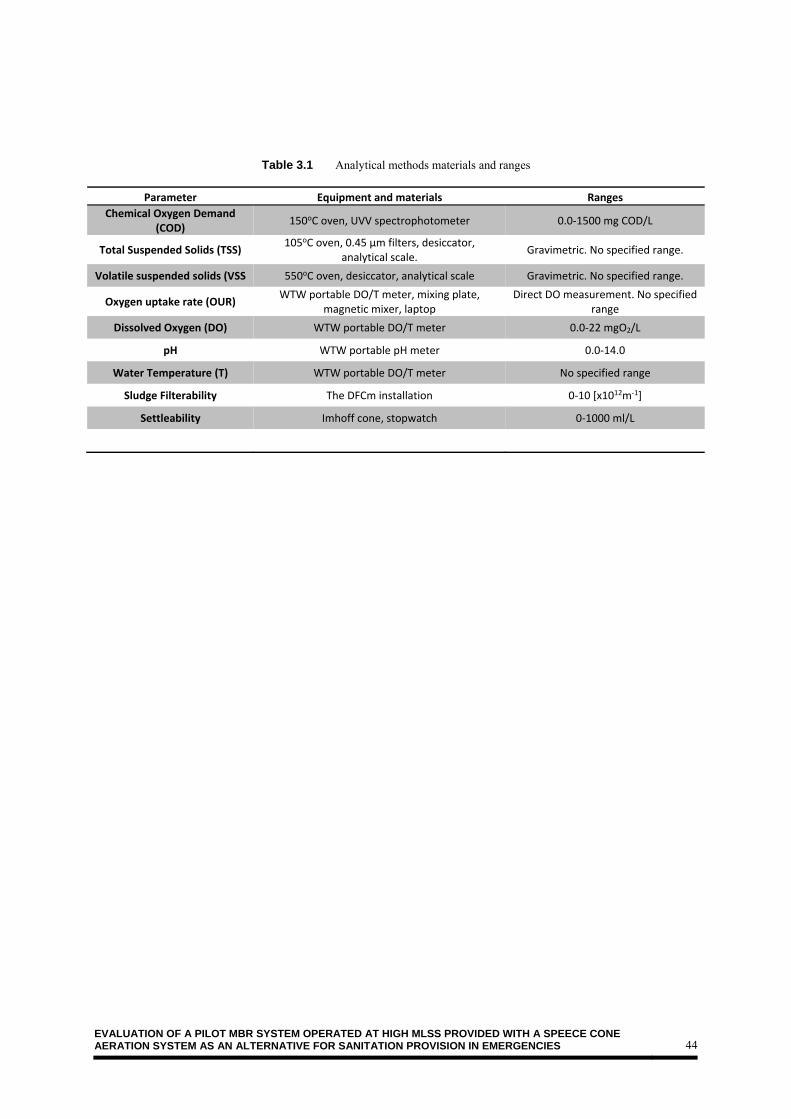
EVALUATION OF A PILOT MBR SYSTEM OPERATED AT HIGH MLSS PROVIDED WITH A SPEECE CONE AERATION SYSTEM AS AN ALTERNATIVE FOR SANITATION PROVISION IN EMERGENCIES 44
Table 3.1 Analytical methods materials and ranges
Parameter Equipment and materials Ranges
Chemical Oxygen Demand (COD)
150oC oven, UVV spectrophotometer 0.0‐1500 mg COD/L
Total Suspended Solids (TSS) 105oC oven, 0.45 µm filters, desiccator,
analytical scale. Gravimetric. No specified range.
Volatile suspended solids (VSS 550oC oven, desiccator, analytical scale Gravimetric. No specified range.
Oxygen uptake rate (OUR) WTW portable DO/T meter, mixing plate,
magnetic mixer, laptop Direct DO measurement. No specified
range
Dissolved Oxygen (DO) WTW portable DO/T meter 0.0‐22 mgO2/L
pH WTW portable pH meter 0.0‐14.0
Water Temperature (T) WTW portable DO/T meter No specified range
Sludge Filterability The DFCm installation 0‐10 [x1012m‐1]
Settleability Imhoff cone, stopwatch 0‐1000 ml/L

EVALUATION OF A PILOT MBR SYSTEM OPERATED AT HIGH MLSS PROVIDED WITH A SPEECE CONE AERATION SYSTEM AS AN ALTERNATIVE FOR SANITATION PROVISION IN EMERGENCIES 45
The results presented in this chapter correspond to the second phase of experiments started on May 7th, 2015. The data collected during the first phase was not included due to the operational inconsistencies caused primarily by equipment problems as described below in Section 4.1 Startup process. In this chapter, the data is organized in the following four main categories: Section 4.1 Startup process: Describing all the preliminary work and activities to setup the MBR system. Section 4.2 MBR performance: Including the following subsections: 4.2.1 Water quality (COD removal and HRT discussion), and 4.2.2 Treatment capacity describing the system outputs (that is, flux, TMP, and permeability). In addition, the relation of the MBR performance with the operational conditions is described. Section 4.3 The Activated sludge properties: This section describes both the achievement of the different MLSS (discussing the active fraction of biomass), as well as the sludge filterability of the MLSS. Section 4.4 Oxygen dynamics. This section deals with the evaluation of the oxygen uptake rates at the evaluated set points (MLSS), and describes the Speece cone oxygen delivery operational conditions.
4.1. Startup process
Setting up the entire MBR-Speece cone system, as well as reaching the different experimental operational conditions, was challenging. The main milestones reached during the setup are described in this section as follows. A submersible pump was needed to be installed to transfer the activated sludge from one of the pumping stations at the Harnaschpolder wastewater treatment plant to the research hall. A volume of 500 liters of 3.5 g/L sludge was used as a seed to start the MBR reactor; later on, screened influent was pumped at different flow rates to apply the required organic loads required to reach the different set points (MLSS). Due to many operational problems the startup process took much longer than expected. The pilot MBR was restarted several times (seven in total) as described below.
CHAPTER 4
Results and Discussion

EVALUATION OF A PILOT MBR SYSTEM OPERATED AT HIGH MLSS PROVIDED WITH A SPEECE CONE AERATION SYSTEM AS AN ALTERNATIVE FOR SANITATION PROVISION IN EMERGENCIES 46
Electrical Safety Check-up (UNESCO-IHE and TUD equipment) According to the Dutch regulations for safety (standard NEN3140) all of the electric equipment had to be inspected to evaluate their isolation and integrity conditions for avoiding short-circuiting risks. The electrical safety check-up certification took some time at the early stages of this research work delaying the original schedule. The electrical safety check up activities at the TUD are shown in Figure 4.1 below.
Figure 4.1 Electric integrity check performed by an external, specialized company. Damaged scouring distributor Once all the equipment was properly checked regarding electrical safety, the MBR was operated with tap water to check the operational parameters and cycles of the PLC, as well as to detect any possible damages in the ancillary equipment. It was found that the air scouring distribution pipe for the membrane module was not giving an even air distribution through the membrane module. The membrane module was taken out of the tank to perform a visual inspection, since this situation may cause excessive fouling during the operation of the pilot MBR. After the visual inspection, it was found that the air distribution manifold was broken as shown in Figure 4.2. Therefore, it was necessary to purchase new piping material and build a new manifold before starting up to operate the MBR.

EVALUATION OF A PILOT MBR SYSTEM OPERATED AT HIGH MLSS PROVIDED WITH A SPEECE CONE AERATION SYSTEM AS AN ALTERNATIVE FOR SANITATION PROVISION IN EMERGENCIES 47
Figure 4.2 Broken manifold (Up) and new manifold for membrane scouring (Down) Damaged membrane module After replacing the air distribution pipe, the MBR was started up (for the first time) with wastewater from the HPN WWTP. After operating the system for a few hours, sludge was observed in the permeate tank. This could be explained either by a leak at some point in the permeate line, or by a broken membrane element. Therefore, it was necessary to take the module out of the MBR again to conduct a visual inspection as observed in Figure 4.3 and Figure 4.4.

EVALUATION OF A PILOT MBR SYSTEM OPERATED AT HIGH MLSS PROVIDED WITH A SPEECE CONE AERATION SYSTEM AS AN ALTERNATIVE FOR SANITATION PROVISION IN EMERGENCIES 48
Figure 4.3 Taking the membrane module out of the reactor using a forklift.
Figure 4.4 First attempt to repair the broken membrane module

EVALUATION OF A PILOT MBR SYSTEM OPERATED AT HIGH MLSS PROVIDED WITH A SPEECE CONE AERATION SYSTEM AS AN ALTERNATIVE FOR SANITATION PROVISION IN EMERGENCIES 49
After conducting a visual inspection, a big crack was found on the false bottom of the module (where the membrane elements rest - the permeate collector). The entire permeate line was replaced and a sealing resin was applied. The module continued to leak even after the attempted repairs indicating that the damage was structural as shown in Figure 4.5. It is suspected that the damaged was caused during the transportation of the module. A new module had to be ordered from the manufacturer (MEMOS) in Germany. It took approximately two weeks to get the membrane module replaced.
Figure 4.5 Second attempt to repair the membrane module. During those two weeks, and in order to keep the reactor running and the biomass alive, the MBR was temporarily modified to run as a sequencing batch reactor (SBR). The operational sequence in the PLC was modified, and a floating decanter was assembled and installed in the MBR tank so the settled sub-supernatant could be extracted using the same MBR permeate pump. The control box was rewired to revert the spin direction of the permeate pump allowing to extract the treated water as shown in Figure 4.6. This temporarily modification served its purpose in keeping the system alive until the new membrane module arrived.

EVALUATION OF A PILOT MBR SYSTEM OPERATED AT HIGH MLSS PROVIDED WITH A SPEECE CONE AERATION SYSTEM AS AN ALTERNATIVE FOR SANITATION PROVISION IN EMERGENCIES 50
Figure 4.6 Temporary modification for SBR operation mode. Floating decanter (Up left); Reactor in filling stage (Up right); Reactor in decanting stage (Down left); Control box modification (Down right).
In addition, the permeate flow meter was replaced and rewired in the control box. The flow meter was completely dirty with sludge as observed in Figure 4.7; therefore, it was not transmitting the flow pulse to the PLC anymore.

EVALUATION OF A PILOT MBR SYSTEM OPERATED AT HIGH MLSS PROVIDED WITH A SPEECE CONE AERATION SYSTEM AS AN ALTERNATIVE FOR SANITATION PROVISION IN EMERGENCIES 51
Figure 4.7 Original flow meter filled with activated sludge (Left); New flow meter after installation. Stuck level switches due to excessive foam There was an excessive production of foam in the aerobic chamber of the MBR causing the level switches to get stuck in the wrong position as observed in Figure 4.8. This situation was giving a false signal to the PLC leading to one of the following situations: a. Level switch stuck in the closed position: This caused the permeate pump to keep running even when
the level was too low until the tank was completely empty. b. Level switch stuck in open position: This caused the feed pump to keep running even when the level
was too high. In this situation the tank was overflowing losing almost all the biomass which was replaced by influent wastewater making a new start up necessary.
Figure 4.8 Clean level switches (left); Blocked level switches (right)
According to the manufacturer, cleaning the level switch every day should have avoided this situation. After conducting a daily cleaning of the level switch the same issue was observed twice (second and third startups). Therefore, it was decided to replace the level switch for another type of level switch. A floating level switch was installed in the tank and wired to the control panel as shown in Figure 4.9. The floating level switch worked well for approximately one week, but after the first week (when the foam got too thick) it started to produce false signals causing again biomass losses and leading to a new (fourth) startup of the system.
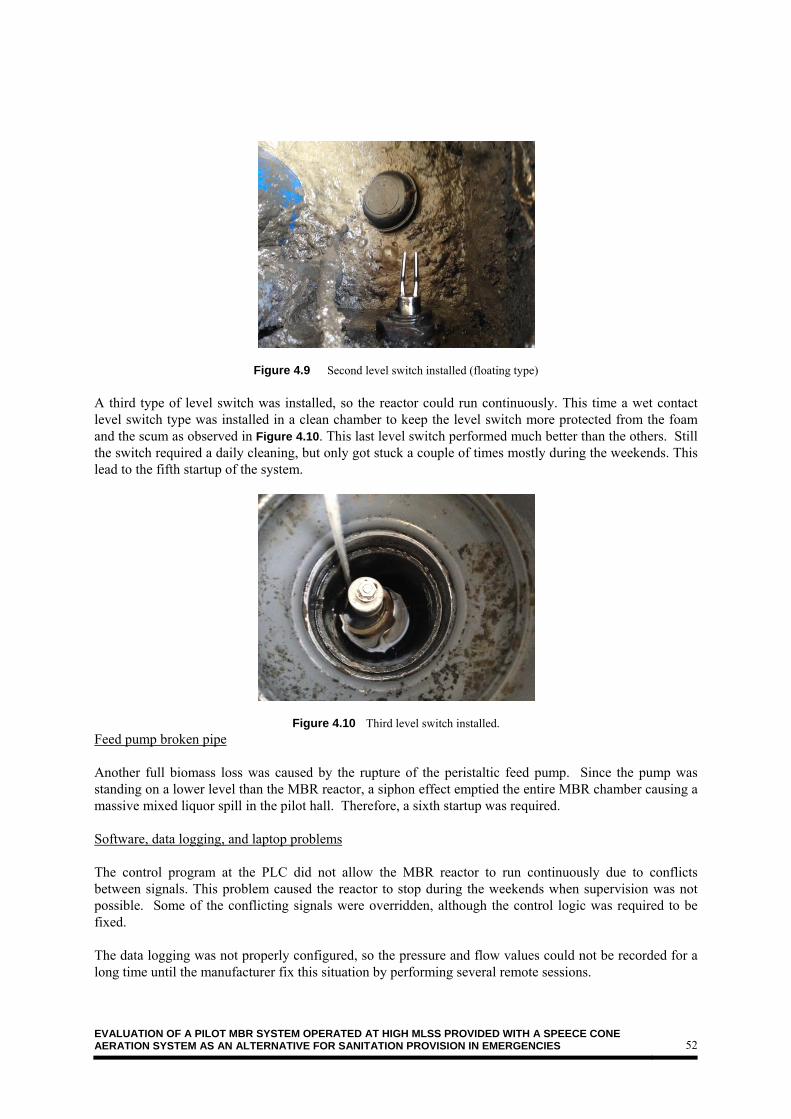
EVALUATION OF A PILOT MBR SYSTEM OPERATED AT HIGH MLSS PROVIDED WITH A SPEECE CONE AERATION SYSTEM AS AN ALTERNATIVE FOR SANITATION PROVISION IN EMERGENCIES 52
Figure 4.9 Second level switch installed (floating type) A third type of level switch was installed, so the reactor could run continuously. This time a wet contact level switch type was installed in a clean chamber to keep the level switch more protected from the foam and the scum as observed in Figure 4.10. This last level switch performed much better than the others. Still the switch required a daily cleaning, but only got stuck a couple of times mostly during the weekends. This lead to the fifth startup of the system.
Figure 4.10 Third level switch installed. Feed pump broken pipe Another full biomass loss was caused by the rupture of the peristaltic feed pump. Since the pump was standing on a lower level than the MBR reactor, a siphon effect emptied the entire MBR chamber causing a massive mixed liquor spill in the pilot hall. Therefore, a sixth startup was required. Software, data logging, and laptop problems The control program at the PLC did not allow the MBR reactor to run continuously due to conflicts between signals. This problem caused the reactor to stop during the weekends when supervision was not possible. Some of the conflicting signals were overridden, although the control logic was required to be fixed. The data logging was not properly configured, so the pressure and flow values could not be recorded for a long time until the manufacturer fix this situation by performing several remote sessions.

EVALUATION OF A PILOT MBR SYSTEM OPERATED AT HIGH MLSS PROVIDED WITH A SPEECE CONE AERATION SYSTEM AS AN ALTERNATIVE FOR SANITATION PROVISION IN EMERGENCIES 53
The pilot MBR came initially with a small notebook (laptop) as the interface to modify the operational parameters and to record the pressure and flow data. The small notebook could not cope with the data processing requirements. The notebook was crashing several times until it was replaced by a new laptop. A new laptop with better features (more powerful and robust) was brought from UNESCO IHE to the research hall. The whole data logging and configuration process was installed one more time via remote sessions with the manufacturer's control engineer. Influent feed to the pilot hall temporarily suspended One of the pumps feeding supplying the pilot hall with raw wastewater was stuck or blocked by pieces of clothing or any other materials coming with the raw influent. The whole pilot hall ran out of influent forcing all the pilot setups to stop their operations until the pump was fixed. This situation was completely out of the author's control, because that equipment is operated by HNP WWTP staff. This issue did not require the MBR reactor to be restarted, although it was required to put the system on hold until the influent flow was reestablished. Sludge pump out of service (installation of a control loop) At the same time that pilot hall feed pump was out of service (during a weekend) the MBR kept working until the sieved influent in the storage tank was fully consumed. The low level switch failed to turn off the permeate pump (which was blocked with foam and solids) causing the reactor to get empty. At that time the Speece cone system was already coupled to the MBR, and mixed liquor was continuously recirculated through the cone by the sludge pump. The MBR tank was getting empty; however, the sludge pump was working on a continuous mode. Therefore, this situation caused the sludge pump to run dry. The pump got seriously damaged and the stator had to be replaced as observed in Figure 4.11. To avoid the same situations in the future (that is to avoid the pump from dry running) a control loop was implemented between the flow indicator transmitter (FIT) and the pump variable frequency drive (VFD). The FIT 4-20 mA signal was directed to a small PLC, and a maximum and minimum set point were programmed to stop the pump whenever the flow is lower than 2 m³/h. The pump still has to be restarted manually, but dry running damage to the pump will be avoided.
Figure 4.11 Damaged stator from sludge pump. Growth slowdown and permeability problems After several operational problems and startups it was finally possible to run the reactor for approximately three weeks (without major issues) with some occasional stops due to high pressure alarms on the membrane elements or level switches getting stuck. During those three weeks the data logging and the

EVALUATION OF A PILOT MBR SYSTEM OPERATED AT HIGH MLSS PROVIDED WITH A SPEECE CONE AERATION SYSTEM AS AN ALTERNATIVE FOR SANITATION PROVISION IN EMERGENCIES 54
operational monitoring could be properly carried out. However, from analyzing the data there were some indications the system was not performing as expected; more precisely, some issues were detected related to the activity of the activated sludge. The volatile fraction of the activated sludge was too low (approximately 0.5 gVSS/gTSS). In addition, very poor and unsteady removal efficiency for COD (of approximately 40%) was observed. The MLSS concentration was increasing normally for the first week and a half starting from 3.5 g/L up to 7.2 g/L. After that point the growth stopped; the MLSS actually decreased (most likely due to unnoticed biomass losses related to level control). The MLSS remained almost fixed at approximately 5 g/L, despite the system had enough load of organic material, nutrients, and oxygen (was not limited). In addition, other symptoms were observed in the membrane performance, such as a dramatic decrease in the permeability. This decrease in permeability was also detected when performing the filterability tests by the DFCi method. The ΔR20 values were extremely high (above 1.8 [x1012m-1]) for a sludge with such low MLSS of approximately 5 g/L. Moreover, it was not possible to complete a full test since the resistance built up too fast. A load shock of some substance was suspected causing the additional fouling. In addition as observed in Figure 4.12 an unusual slimy floating substance present in the permeate tank in this period was observed.
Figure 4.12 Greasy slime appearing in the permeate tank when the growth and permeability decreased It was also suspected the DFCi membrane element was fouled, so a chemically assisted cleaning procedure was performed on the membrane element. The cleaning procedure was carried out by using a citric acid solution (at 30 g/L during 1 hour) followed by a sodium hypochlorite solution (at 1.5 g/L during one hour). After the cleaning procedure the filterability was slightly better, but the ΔR20 values were still too high.
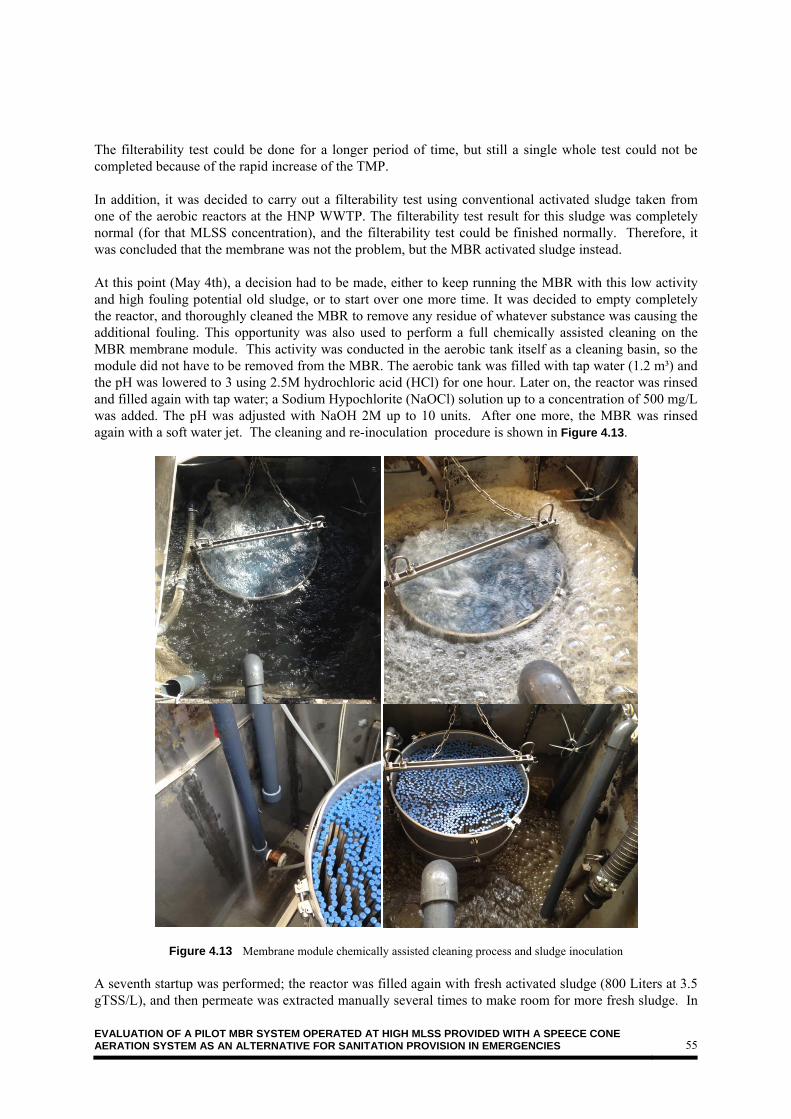
EVALUATION OF A PILOT MBR SYSTEM OPERATED AT HIGH MLSS PROVIDED WITH A SPEECE CONE AERATION SYSTEM AS AN ALTERNATIVE FOR SANITATION PROVISION IN EMERGENCIES 55
The filterability test could be done for a longer period of time, but still a single whole test could not be completed because of the rapid increase of the TMP. In addition, it was decided to carry out a filterability test using conventional activated sludge taken from one of the aerobic reactors at the HNP WWTP. The filterability test result for this sludge was completely normal (for that MLSS concentration), and the filterability test could be finished normally. Therefore, it was concluded that the membrane was not the problem, but the MBR activated sludge instead. At this point (May 4th), a decision had to be made, either to keep running the MBR with this low activity and high fouling potential old sludge, or to start over one more time. It was decided to empty completely the reactor, and thoroughly cleaned the MBR to remove any residue of whatever substance was causing the additional fouling. This opportunity was also used to perform a full chemically assisted cleaning on the MBR membrane module. This activity was conducted in the aerobic tank itself as a cleaning basin, so the module did not have to be removed from the MBR. The aerobic tank was filled with tap water (1.2 m³) and the pH was lowered to 3 using 2.5M hydrochloric acid (HCl) for one hour. Later on, the reactor was rinsed and filled again with tap water; a Sodium Hypochlorite (NaOCl) solution up to a concentration of 500 mg/L was added. The pH was adjusted with NaOH 2M up to 10 units. After one more, the MBR was rinsed again with a soft water jet. The cleaning and re-inoculation procedure is shown in Figure 4.13.
Figure 4.13 Membrane module chemically assisted cleaning process and sludge inoculation A seventh startup was performed; the reactor was filled again with fresh activated sludge (800 Liters at 3.5 gTSS/L), and then permeate was extracted manually several times to make room for more fresh sludge. In

EVALUATION OF A PILOT MBR SYSTEM OPERATED AT HIGH MLSS PROVIDED WITH A SPEECE CONE AERATION SYSTEM AS AN ALTERNATIVE FOR SANITATION PROVISION IN EMERGENCIES 56
that way, the mixed liquor was quickly concentrated. In a few days a concentration of 7.6 g/L in the MBR was reached, and from there the data logging and operation monitoring started again. This period is called the second phase in this research. 4.1.1. Operational conditions Different combinations of the main parameters influencing the concentration of MLSS were selected to set the different operational conditions at which the system was evaluated. This combination of parameters included the SRT, the applied load (considering both the influent flow rate as well as the influent concentration), and the MBR aerobic basin volume. By changing these parameters different operational conditions were achieved allowing to evaluate the performance of the system at different set points. The different selected values for the main parameters determining a specific set point were labelled with an identification number from ID#5 to ID#15. Table 4.1 and Figures below (Figure 4.14 and Figure 4.15) show the values of the main parameters determining each operational condition at the evaluated set point. The identification numbers before ID#5 were not included since these set points correspond to operational conditions (the first phase) when the MBR system experienced some problems as described earlier in this chapter. At the operational conditions established for the set point ID#5, the MBR was operated with sludge from the HPN WWTP at a SRT of 20 days. From this set point (ID#5) until the set point (ID#8), the MBR was not purged with sludge. That is, sludge was not withdrawn from the MBR until reaching the set point ID#8 (as described both in Table 4.1, Figure 4.14 and Figure 4.15). That is, from the MBR inoculation until the set point ID#8 (i.e., IDs #5, #6, #7, and #8), most of the observed increase on the MLSS took place due to the increase on the SRT. At the set point ID#5, fine bubble diffusers (fed compressed air) were used to supply dissolved oxygen to the MBR. After this set point, it was not possible to supply all the MBR oxygen needs by using the fine bubble diffusers (fed with compressed air); therefore, at the point ID#6, the dissolved oxygen was introduced by the Speece cone system (fed pure oxygen) After set point (ID #9), the SRT was fixed at 30 days. From set point ID#9 to set point ID#11, the observed increase on the concentration of MLSS was due to the increase on the applied organic load to the MBR. The increase on the applied organic load to the MBR was achieved by both increasing the influent flow rate to the MBR (e.g., from 3.5 m³/d (ID#9) up to 6 m³/d (ID#11)), and by increasing the influent COD concentration (e.g., 1,044 mg/L (ID#10))). At set point ID#12 it was noticed that the flow rate could not be increased any further; the membrane module was operating very close to its pressure limit (of -55 KPa). That is, the only option left to increase the MLSS was either (i) to reduce the reactor's volume, or (ii) to increase the organic load concentration even further by adding an external source of COD. For the first option, two sealed carboys filled with water were submerged in the aerobic tank obtaining a total volume reduction of 120 Litres for set points ID#12 to ID#15 (14% of the aerobic volume). In addition, for the second option (and only for the set point ID#15) an external carbon source was introduced to reach the last desired MLSS concentration of approximately 24 g/L. Sodium acetate was dosed as the external COD source. As explained later in this chapter (Section 4.2.2 Treatment capacity), the dosage of sodium acetate had a negative impact on the sludge properties severely affecting the membrane permeability. Table 4.1 below describes the operational conditions at each set point including the following parameters: TSS/VSS, influent flow rate to the MBR (Q), the volume of the aerobic basin of the MBR (V), SRT, HRT, temperature, dissolved oxygen concentration in the aerobic basin of the MBR (D.O.), the pH in the MBR aerobic basin, the influent organic concentration to the MBR (COD in), the effluent organic concentration in the permeate tank of the MBR (CODout), the COD that was removed by the MBR (COD removed and %), and the organic (volumetric) load to the MBR (KgCOD/m³/d).
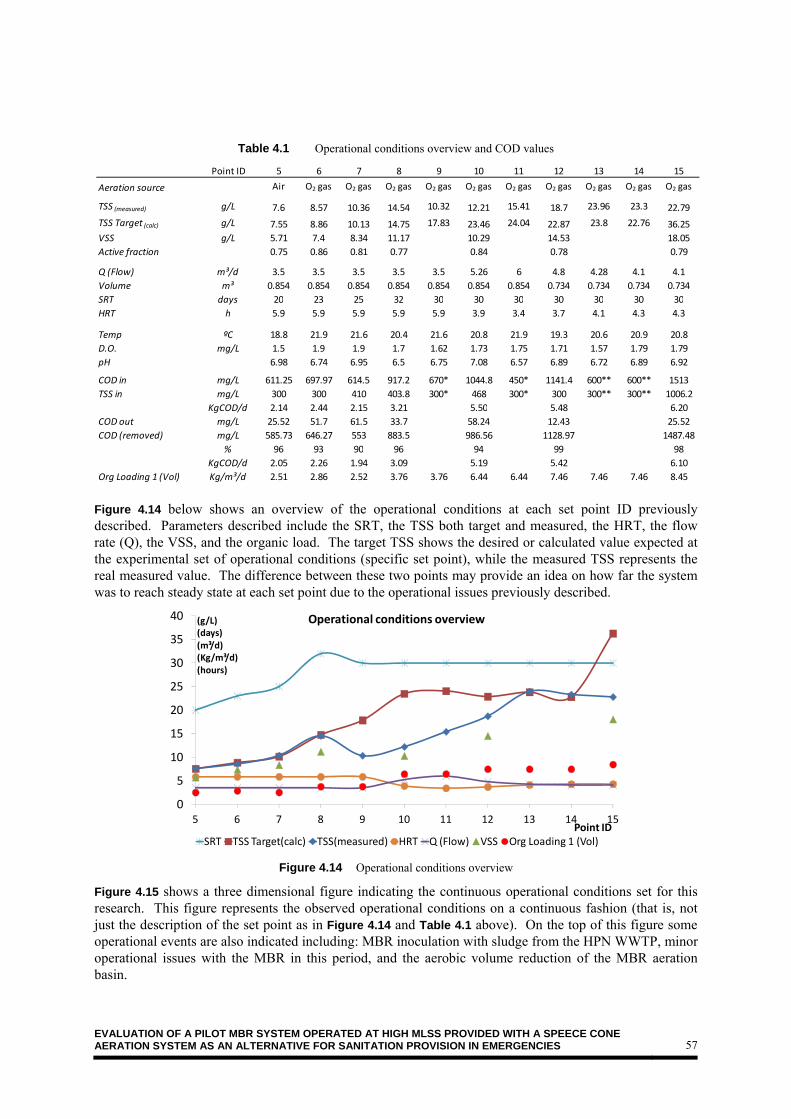
EVALUATION OF A PILOT MBR SYSTEM OPERATED AT HIGH MLSS PROVIDED WITH A SPEECE CONE AERATION SYSTEM AS AN ALTERNATIVE FOR SANITATION PROVISION IN EMERGENCIES 57
Table 4.1 Operational conditions overview and COD values
Figure 4.14 below shows an overview of the operational conditions at each set point ID previously described. Parameters described include the SRT, the TSS both target and measured, the HRT, the flow rate (Q), the VSS, and the organic load. The target TSS shows the desired or calculated value expected at the experimental set of operational conditions (specific set point), while the measured TSS represents the real measured value. The difference between these two points may provide an idea on how far the system was to reach steady state at each set point due to the operational issues previously described.
Figure 4.14 Operational conditions overview
Figure 4.15 shows a three dimensional figure indicating the continuous operational conditions set for this research. This figure represents the observed operational conditions on a continuous fashion (that is, not just the description of the set point as in Figure 4.14 and Table 4.1 above). On the top of this figure some operational events are also indicated including: MBR inoculation with sludge from the HPN WWTP, minor operational issues with the MBR in this period, and the aerobic volume reduction of the MBR aeration basin.
Point ID 5 6 7 8 9 10 11 12 13 14 15
Aeration source Air O2 gas O2 gas O2 gas O2 gas O2 gas O2 gas O2 gas O2 gas O2 gas O2 gas
TSS (measured) g/L 7.6 8.57 10.36 14.54 10.32 12.21 15.41 18.7 23.96 23.3 22.79
TSS Target (calc) g/L 7.55 8.86 10.13 14.75 17.83 23.46 24.04 22.87 23.8 22.76 36.25
VSS g/L 5.71 7.4 8.34 11.17 10.29 14.53 18.05
Active fraction 0.75 0.86 0.81 0.77 0.84 0.78 0.79
Q (Flow) m³/d 3.5 3.5 3.5 3.5 3.5 5.26 6 4.8 4.28 4.1 4.1
Volume m³ 0.854 0.854 0.854 0.854 0.854 0.854 0.854 0.734 0.734 0.734 0.734
SRT days 20 23 25 32 30 30 30 30 30 30 30
HRT h 5.9 5.9 5.9 5.9 5.9 3.9 3.4 3.7 4.1 4.3 4.3
Temp ºC 18.8 21.9 21.6 20.4 21.6 20.8 21.9 19.3 20.6 20.9 20.8
D.O. mg/L 1.5 1.9 1.9 1.7 1.62 1.73 1.75 1.71 1.57 1.79 1.79
pH 6.98 6.74 6.95 6.5 6.75 7.08 6.57 6.89 6.72 6.89 6.92
COD in mg/L 611.25 697.97 614.5 917.2 670* 1044.8 450* 1141.4 600** 600** 1513
TSS in mg/L 300 300 410 403.8 300* 468 300* 300 300** 300** 1006.2
KgCOD/d 2.14 2.44 2.15 3.21 5.50 5.48 6.20
COD out mg/L 25.52 51.7 61.5 33.7 58.24 12.43 25.52
COD (removed) mg/L 585.73 646.27 553 883.5 986.56 1128.97 1487.48
% 96 93 90 96 94 99 98
KgCOD/d 2.05 2.26 1.94 3.09 5.19 5.42 6.10
Org Loading 1 (Vol) Kg/m³/d 2.51 2.86 2.52 3.76 3.76 6.44 6.44 7.46 7.46 7.46 8.45
0
5
10
15
20
25
30
35
40
5 6 7 8 9 10 11 12 13 14 15
(g/L) (days)(m³/d) (Kg/m³/d)(hours)
Point ID
Operational conditions overview
SRT TSS Target(calc) TSS(measured) HRT Q (Flow) VSS Org Loading 1 (Vol)
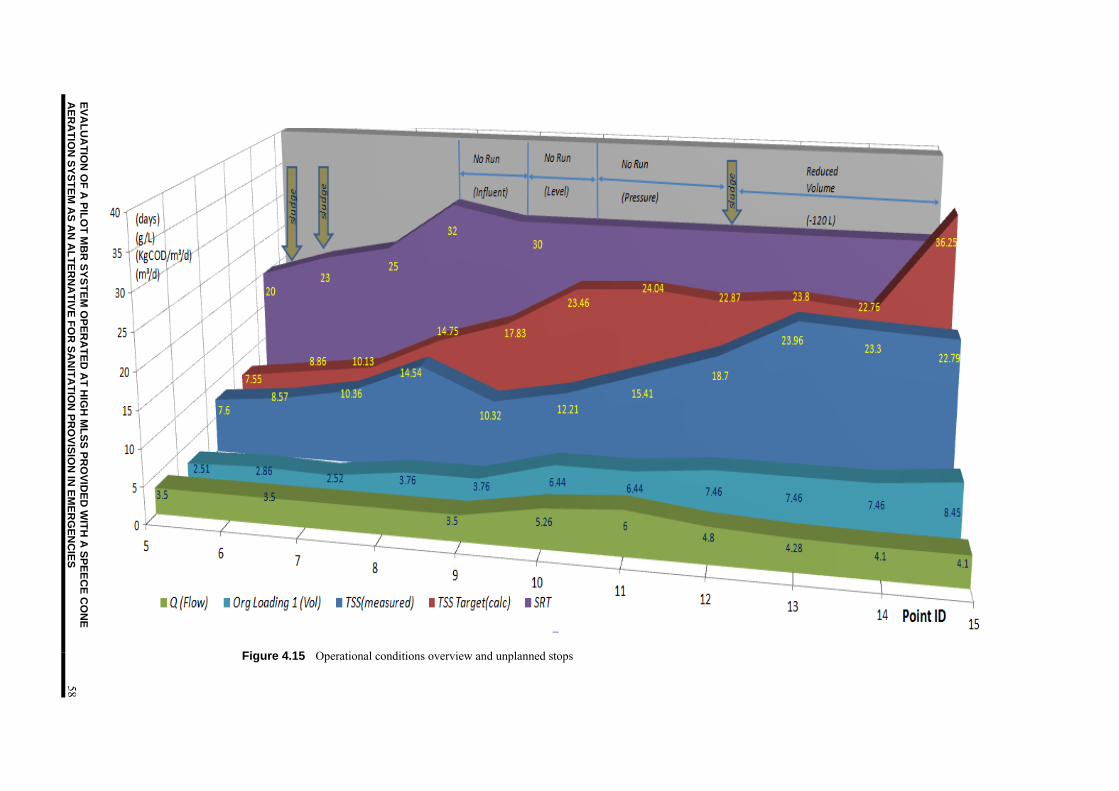
EV
AL
UA
TIO
N O
F A
PIL
OT
MB
R S
YS
TE
M O
PE
RA
TE
D A
T H
IGH
ML
SS
PR
OV
IDE
D W
ITH
A S
PE
EC
E C
ON
E
AE
RA
TIO
N S
YS
TE
M A
S A
N A
LT
ER
NA
TIV
E F
OR
SA
NIT
AT
ION
PR
OV
ISIO
N IN
EM
ER
GE
NC
IES
58
Figure 4.15 Operational conditions overview and unplanned stops
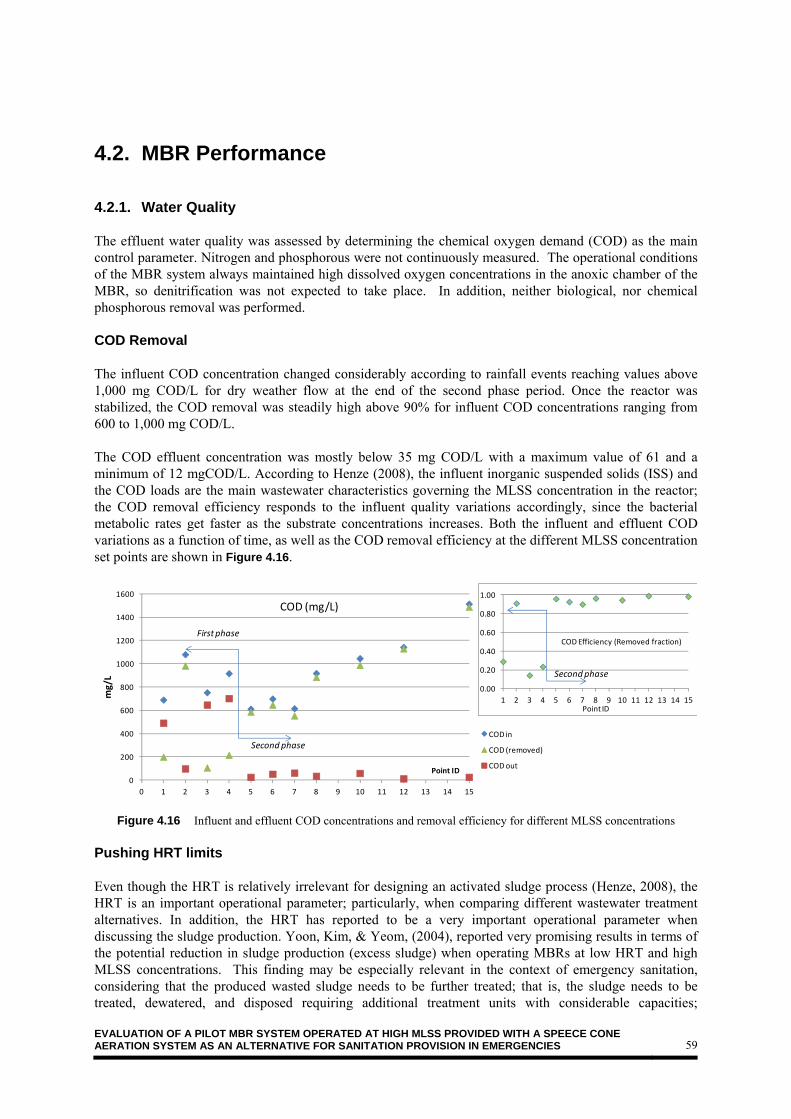
EVALUATION OF A PILOT MBR SYSTEM OPERATED AT HIGH MLSS PROVIDED WITH A SPEECE CONE AERATION SYSTEM AS AN ALTERNATIVE FOR SANITATION PROVISION IN EMERGENCIES 59
4.2. MBR Performance
4.2.1. Water Quality The effluent water quality was assessed by determining the chemical oxygen demand (COD) as the main control parameter. Nitrogen and phosphorous were not continuously measured. The operational conditions of the MBR system always maintained high dissolved oxygen concentrations in the anoxic chamber of the MBR, so denitrification was not expected to take place. In addition, neither biological, nor chemical phosphorous removal was performed. COD Removal The influent COD concentration changed considerably according to rainfall events reaching values above 1,000 mg COD/L for dry weather flow at the end of the second phase period. Once the reactor was stabilized, the COD removal was steadily high above 90% for influent COD concentrations ranging from 600 to 1,000 mg COD/L. The COD effluent concentration was mostly below 35 mg COD/L with a maximum value of 61 and a minimum of 12 mgCOD/L. According to Henze (2008), the influent inorganic suspended solids (ISS) and the COD loads are the main wastewater characteristics governing the MLSS concentration in the reactor; the COD removal efficiency responds to the influent quality variations accordingly, since the bacterial metabolic rates get faster as the substrate concentrations increases. Both the influent and effluent COD variations as a function of time, as well as the COD removal efficiency at the different MLSS concentration set points are shown in Figure 4.16.
Figure 4.16 Influent and effluent COD concentrations and removal efficiency for different MLSS concentrations Pushing HRT limits Even though the HRT is relatively irrelevant for designing an activated sludge process (Henze, 2008), the HRT is an important operational parameter; particularly, when comparing different wastewater treatment alternatives. In addition, the HRT has reported to be a very important operational parameter when discussing the sludge production. Yoon, Kim, & Yeom, (2004), reported very promising results in terms of the potential reduction in sludge production (excess sludge) when operating MBRs at low HRT and high MLSS concentrations. This finding may be especially relevant in the context of emergency sanitation, considering that the produced wasted sludge needs to be further treated; that is, the sludge needs to be treated, dewatered, and disposed requiring additional treatment units with considerable capacities;
0
200
400
600
800
1000
1200
1400
1600
0 1 2 3 4 5 6 7 8 9 10 11 12 13 14 15
mg/L
Point ID
COD (mg/L)
COD in
COD (removed)
COD out
0.00
0.20
0.40
0.60
0.80
1.00
1 2 3 4 5 6 7 8 9 10 11 12 13 14 15Point ID
COD Efficiency (Removed fraction)
Second phase
First phase
Second phase

EVALUATION OF A PILOT MBR SYSTEM OPERATED AT HIGH MLSS PROVIDED WITH A SPEECE CONE AERATION SYSTEM AS AN ALTERNATIVE FOR SANITATION PROVISION IN EMERGENCIES 60
therefore, the reduction on sludge production offers a potential for cost reduction that may lead to more sustainable and affordable sanitation alternatives. The amount of produced sludge can be calculated as a function of HRT (Yoon et al., 2004) by solving simultaneously Equations (4.1) and (4.2). The results obtained by (Yoon et al., 2004) are shown in Figure 4.17.
(4.1)
1
(4.2)
Solving these equations results in a family of curves that represent the steady state MLSS concentrations that can be achieved at different HRTs at constant SRT and influent COD concentration. A decrease on the HRT can also be interpreted as a higher applied load into the system, since less retention time means higher flow rate; hence, higher substrate mass flow. According to Yoon et al., (2004), operating at low HRT and high SRTs (therefore, high MLSS) will lead to an increase in the aeration costs (when using conventional diffusers aeration systems). However, the net operational costs (when incorporating sludge treatment into the equation) show a significant overall reduction. Sludge treatment is usually more expensive than the additional aeration costs. The cost comparison results exhibited by Yoon et al., (2004) are shown in Figure 4.18.
Figure 4.17 Calculated MBR MLSS concentration as a function of HRT. (Yoon et al., 2004)

EVALUATION OF A PILOT MBR SYSTEM OPERATED AT HIGH MLSS PROVIDED WITH A SPEECE CONE AERATION SYSTEM AS AN ALTERNATIVE FOR SANITATION PROVISION IN EMERGENCIES 61
Figure 4.18 Net MBR yearly cost reduction for aeration and sludge treatment at higher MLSS concentration. (Yoon et al., 2004)
However, there may be a practical limit for the HRT reduction, and that should be assessed. During this research work the HRT was reduced to increase the applied COD load (by increasing the influent flow rate) supporting higher MLSS concentrations. At the experimental conditions evaluated in this research, the COD removal efficiency was not affected by the low HRT values; even when the MBR was operated at a HRT as low as 3.4 hours as shown in Figure 4.19 below.
Figure 4.19 HRT and COD removal efficiency.
0.96 0.93 0.90 0.960.94 0.99 0.98
0.00
1.00
2.00
3.00
4.00
5.00
6.00
7.00
7 9 11 13 15 17 19 21 23 25
HRT (h)
TSS (g/L)
COD removal and HRT
COD eff (removed fraction) HRT (h)

EVALUATION OF A PILOT MBR SYSTEM OPERATED AT HIGH MLSS PROVIDED WITH A SPEECE CONE AERATION SYSTEM AS AN ALTERNATIVE FOR SANITATION PROVISION IN EMERGENCIES 62
4.2.2. Treatment capacity The MBR control system was programmed to log an operational point every thirty seconds. Each point was tagged with the time of the day, and it contained two values: the permeate line pressure (mbar), and the accumulated volume (L). With these data points most of the operational parameters relevant for monitoring the performance of the MBR system were calculated including: flux (J) [LMH], Transmembrane pressure (TMP) [bar], and the operational permeability (OP) [LMH/bar]. The raw data consists of a series of data points (2,880 points per day) indicating the behavior of the MBR system among four possible operational states as described in Table 4.2 below:
Table 4.2 MBR possible operational states
Operational state Value type Description Duration Frequency Suction "S" Negative pressure
(mbar) Permeate production 600 seconds Every 720 seconds
Backwash "BW" Positive pressure (mbar)
Short backwash between every "S"
60 seconds After every "S"
Long Backwash "LBW" Positive pressure (mbar)
Long backwash 300 seconds Every 50 "S"
Pause "P" No value Transition between "S"-"BW"-"LBW"
30 seconds In between every operational state
change
Each suction (S) and backwash (BW) interval will be addressed as a cycle. Figure 4.20 shows the raw data for 20 cycles including a long backwash (LBW).
Figure 4.20 MBR Operational pressure profile for 20 cycles (mbar) The parameters presented below in this section were calculated considering the minimum, maximum and most frequent (mode) pressure values as described in Figure 4.21 Raw pressure data example (max, min, mode)
for each operational cycle (zoom in from Figure 4.20).
"BW"
"S"
"LBW"

EVALUATION OF A PILOT MBR SYSTEM OPERATED AT HIGH MLSS PROVIDED WITH A SPEECE CONE AERATION SYSTEM AS AN ALTERNATIVE FOR SANITATION PROVISION IN EMERGENCIES 63
Figure 4.21 Raw pressure data example (max, min, mode) for each operational cycle (zoom in from Figure 4.20). TMP A clear trend towards higher TMP values was observed as the MLSS concentration increased at the evaluated experimental range. The TMP is a parameter developed to assess fouling (Judd, 2010). Therefore, an increase on the TMP values was expected at higher biomass concentrations. Higher biomass concentrations contributes with higher concentration of substances such as extracellular polymeric substances (EPS) and soluble microbial products (SMP) which have been recognized for their high fouling potential (Henze, 2008). TMP values showed a very similar trend as a function of the MLSS concentration for the three sets of reported TMP values (maximum, minimum, and mode). Therefore, the observed trend confirms the clear relation between the MLSS concentration and the TMP. The increase on the TMP may be due to the additional sludge resistance to filtration as the MLSS increased. A sudden reduction in the required applied pressure was observed at two different TSS intervals; the first pressure decrease was observed between 12 and 14 g/L, and the second pressure decay was observed between 22 and 24 g/L. At these two intervals, the system was working almost at the same flow rate conditions.
Figure 4.22 TMP results at different MLSS concentrations
0
10
20
30
40
50
60
7 9 11 13 15 17 19 21 23 25
(KPa)
TSS (g/L)
TMP
TMP max (Kpa) TMP min (Kpa) TMP mode (Kpa)
min
max
mode

EVALUATION OF A PILOT MBR SYSTEM OPERATED AT HIGH MLSS PROVIDED WITH A SPEECE CONE AERATION SYSTEM AS AN ALTERNATIVE FOR SANITATION PROVISION IN EMERGENCIES 64
The previously described pressure decrease can be better observed when calculating and reporting the permeate production or flux (J) as a function of the applied pressure (TMP); that is, when reporting the specific flux for a given operational point as shown in Figure 4.23. When focusing on the data series for the mode specific flux on Figure 4.23, it can be observed a maximum permeate production (flux) above approximately 9 LMH at an applied pressure (TMP) below approximately 40 KPa. This data point corresponded to the MLSS concentration range between 12.2 and 12.7 g/L. These values are highlighted and circled on Figure 4.23 below. Even though more research is needed to confirm this hypothesis, it seems that there are specific MLSS operational ranges at which the permeate conditions are more favorable in terms of energy requirements and treatment capacity.
Figure 4.23 Specific flux (LMH/applied pressure)
In addition, changes on the applied pressure at each of the evaluated MLSS set points for a 50 cycles intervals (i.e., for approximately 10 hours) were calculated. These trends are reported on Figure 4.24 below. Looking at more detail on every MLSS operational set point (that is, looking at each data series corresponding to a particular MLSS concentration) the following observations can be made. The pressure variations within a series when working at the lower MLSS concentration range (that is, below 12 g/L MLSS) were relatively smaller than the pressure variations when working at the higher MLSS concentration range (that is, above 12 g/L MLSS). Pressure variation differences lower than 5 KPa and up to 15 KPa were observed, respectively as shown in Figure 4.24. Most of the curves exhibited a similar behavior. That is, a slow increase on the applied pressure was observed as the membrane fouling started to build up after each cycle. However, the data for the 15.41 g/L MLSS set point followed a very different pattern. The first cycle started with an applied pressure of approximately 25 KPa and quickly rose up to approximately 40 KPa in a very short period of time (approximately only 12 cycles).
4
5
6
7
8
9
10
11
7 12 17 22 27 32 37 42 47 52 57
(lmh)
TMP (KPa)
J/TMP
J net max / TMP max (lmh/KPa) J net min/ TMP min (lmh/KPa) J net mode/ TMP mode (lmh/KPa)
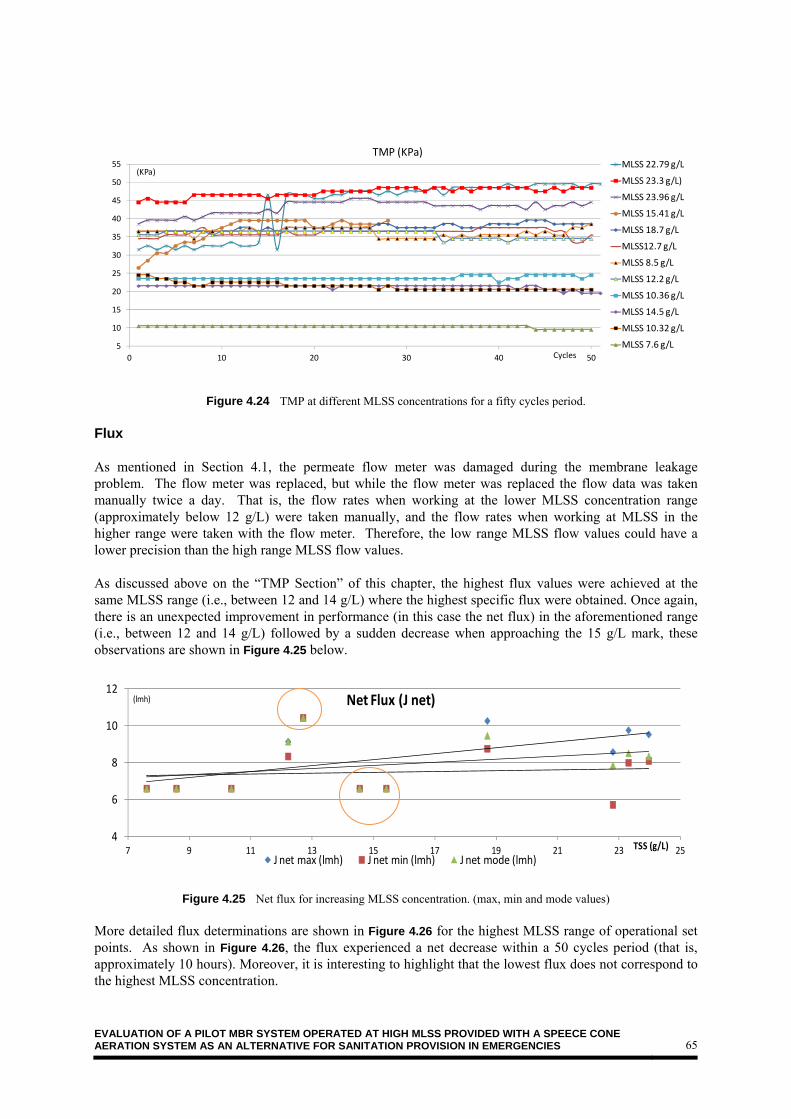
EVALUATION OF A PILOT MBR SYSTEM OPERATED AT HIGH MLSS PROVIDED WITH A SPEECE CONE AERATION SYSTEM AS AN ALTERNATIVE FOR SANITATION PROVISION IN EMERGENCIES 65
Figure 4.24 TMP at different MLSS concentrations for a fifty cycles period. Flux As mentioned in Section 4.1, the permeate flow meter was damaged during the membrane leakage problem. The flow meter was replaced, but while the flow meter was replaced the flow data was taken manually twice a day. That is, the flow rates when working at the lower MLSS concentration range (approximately below 12 g/L) were taken manually, and the flow rates when working at MLSS in the higher range were taken with the flow meter. Therefore, the low range MLSS flow values could have a lower precision than the high range MLSS flow values. As discussed above on the “TMP Section” of this chapter, the highest flux values were achieved at the same MLSS range (i.e., between 12 and 14 g/L) where the highest specific flux were obtained. Once again, there is an unexpected improvement in performance (in this case the net flux) in the aforementioned range (i.e., between 12 and 14 g/L) followed by a sudden decrease when approaching the 15 g/L mark, these observations are shown in Figure 4.25 below.
Figure 4.25 Net flux for increasing MLSS concentration. (max, min and mode values) More detailed flux determinations are shown in Figure 4.26 for the highest MLSS range of operational set points. As shown in Figure 4.26, the flux experienced a net decrease within a 50 cycles period (that is, approximately 10 hours). Moreover, it is interesting to highlight that the lowest flux does not correspond to the highest MLSS concentration.
5
10
15
20
25
30
35
40
45
50
55
0 10 20 30 40 50
(KPa)
Cycles
TMP (KPa)MLSS 22.79 g/L
MLSS 23.3 g/L)
MLSS 23.96 g/L
MLSS 15.41 g/L
MLSS 18.7 g/L
MLSS12.7 g/L
MLSS 8.5 g/L
MLSS 12.2 g/L
MLSS 10.36 g/L
MLSS 14.5 g/L
MLSS 10.32 g/L
MLSS 7.6 g/L
4
6
8
10
12
7 9 11 13 15 17 19 21 23 25
(lmh)
TSS (g/L)
Net Flux (J net)
J net max (lmh) J net min (lmh) J net mode (lmh)
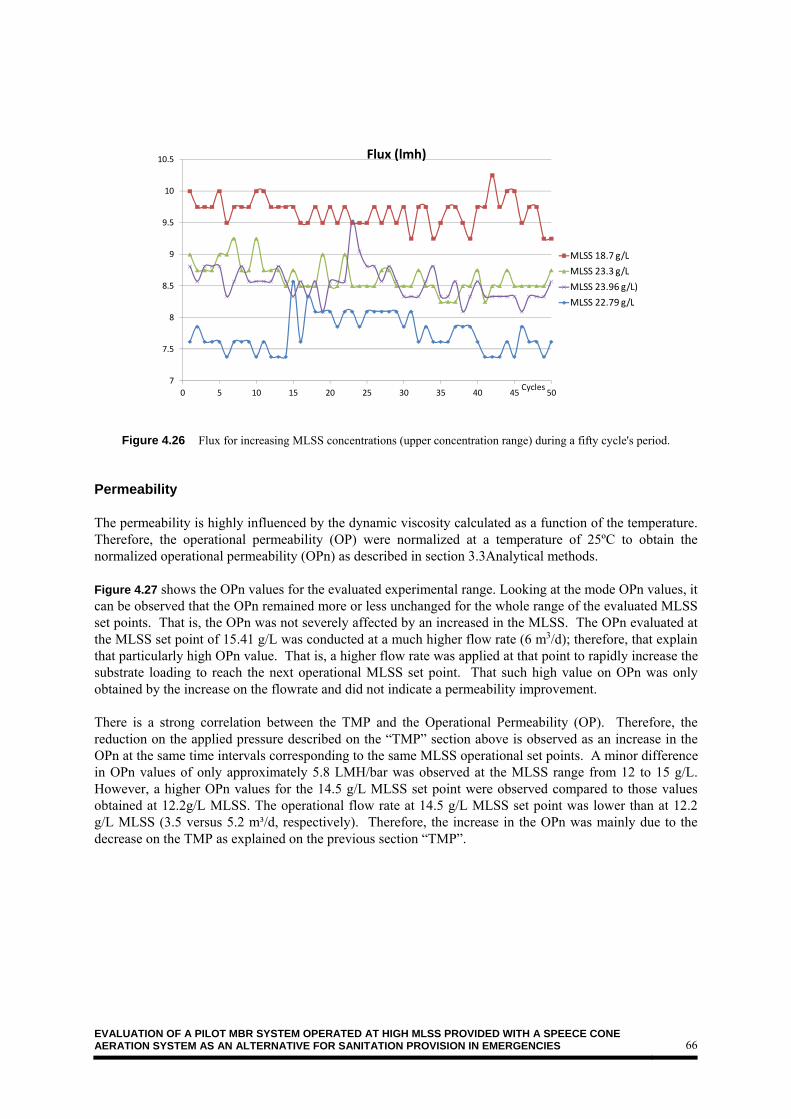
EVALUATION OF A PILOT MBR SYSTEM OPERATED AT HIGH MLSS PROVIDED WITH A SPEECE CONE AERATION SYSTEM AS AN ALTERNATIVE FOR SANITATION PROVISION IN EMERGENCIES 66
Figure 4.26 Flux for increasing MLSS concentrations (upper concentration range) during a fifty cycle's period. Permeability The permeability is highly influenced by the dynamic viscosity calculated as a function of the temperature. Therefore, the operational permeability (OP) were normalized at a temperature of 25ºC to obtain the normalized operational permeability (OPn) as described in section 3.3Analytical methods. Figure 4.27 shows the OPn values for the evaluated experimental range. Looking at the mode OPn values, it can be observed that the OPn remained more or less unchanged for the whole range of the evaluated MLSS set points. That is, the OPn was not severely affected by an increased in the MLSS. The OPn evaluated at the MLSS set point of 15.41 g/L was conducted at a much higher flow rate (6 m3/d); therefore, that explain that particularly high OPn value. That is, a higher flow rate was applied at that point to rapidly increase the substrate loading to reach the next operational MLSS set point. That such high value on OPn was only obtained by the increase on the flowrate and did not indicate a permeability improvement. There is a strong correlation between the TMP and the Operational Permeability (OP). Therefore, the reduction on the applied pressure described on the “TMP” section above is observed as an increase in the OPn at the same time intervals corresponding to the same MLSS operational set points. A minor difference in OPn values of only approximately 5.8 LMH/bar was observed at the MLSS range from 12 to 15 g/L. However, a higher OPn values for the 14.5 g/L MLSS set point were observed compared to those values obtained at 12.2g/L MLSS. The operational flow rate at 14.5 g/L MLSS set point was lower than at 12.2 g/L MLSS (3.5 versus 5.2 m³/d, respectively). Therefore, the increase in the OPn was mainly due to the decrease on the TMP as explained on the previous section “TMP”.
7
7.5
8
8.5
9
9.5
10
10.5
0 5 10 15 20 25 30 35 40 45 50Cycles
Flux (lmh)
MLSS 18.7 g/L
MLSS 23.3 g/L
MLSS 23.96 g/L)
MLSS 22.79 g/L
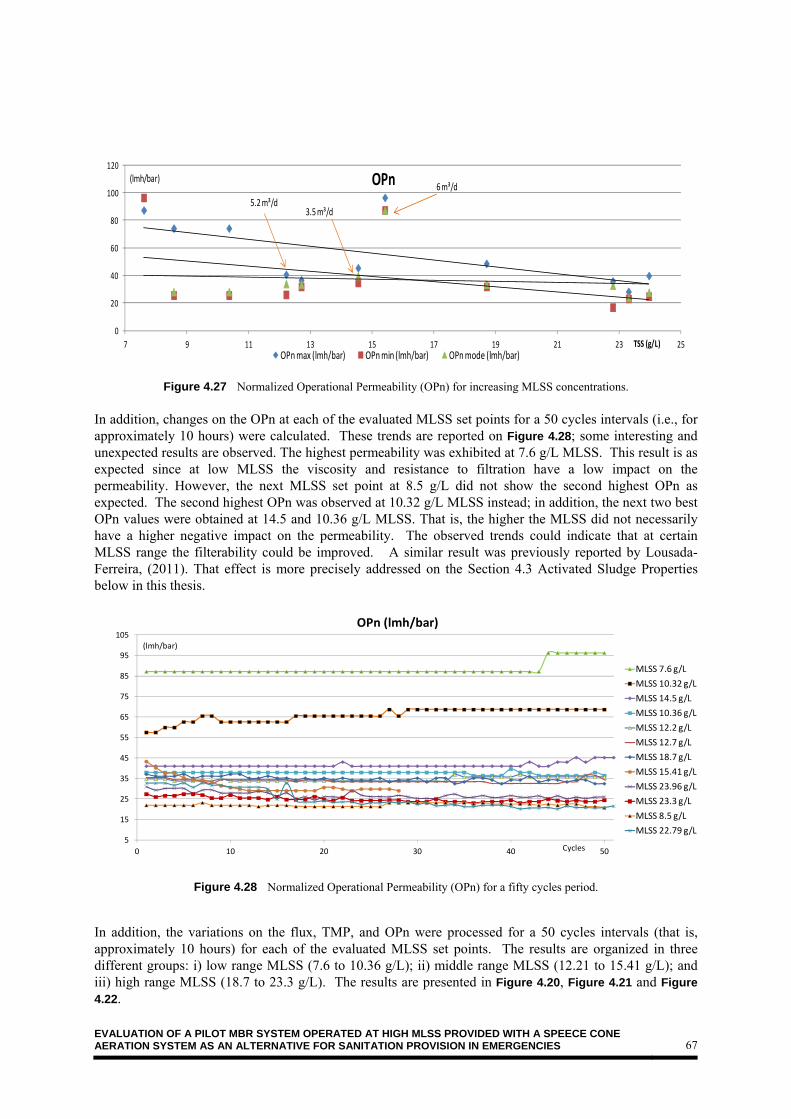
EVALUATION OF A PILOT MBR SYSTEM OPERATED AT HIGH MLSS PROVIDED WITH A SPEECE CONE AERATION SYSTEM AS AN ALTERNATIVE FOR SANITATION PROVISION IN EMERGENCIES 67
Figure 4.27 Normalized Operational Permeability (OPn) for increasing MLSS concentrations. In addition, changes on the OPn at each of the evaluated MLSS set points for a 50 cycles intervals (i.e., for approximately 10 hours) were calculated. These trends are reported on Figure 4.28; some interesting and unexpected results are observed. The highest permeability was exhibited at 7.6 g/L MLSS. This result is as expected since at low MLSS the viscosity and resistance to filtration have a low impact on the permeability. However, the next MLSS set point at 8.5 g/L did not show the second highest OPn as expected. The second highest OPn was observed at 10.32 g/L MLSS instead; in addition, the next two best OPn values were obtained at 14.5 and 10.36 g/L MLSS. That is, the higher the MLSS did not necessarily have a higher negative impact on the permeability. The observed trends could indicate that at certain MLSS range the filterability could be improved. A similar result was previously reported by Lousada-Ferreira, (2011). That effect is more precisely addressed on the Section 4.3 Activated Sludge Properties below in this thesis.
Figure 4.28 Normalized Operational Permeability (OPn) for a fifty cycles period.
In addition, the variations on the flux, TMP, and OPn were processed for a 50 cycles intervals (that is,approximately 10 hours) for each of the evaluated MLSS set points. The results are organized in threedifferent groups: i) low range MLSS (7.6 to 10.36 g/L); ii) middle range MLSS (12.21 to 15.41 g/L); and iii) high range MLSS (18.7 to 23.3 g/L). The results are presented in Figure 4.20, Figure 4.21 and Figure 4.22.
0
20
40
60
80
100
120
7 9 11 13 15 17 19 21 23 25
(lmh/bar)
TSS (g/L)
OPn
OPn max (lmh/bar) OPn min (lmh/bar) OPn mode (lmh/bar)
5.2 m³/d
6m³/d
3.5 m³/d
5
15
25
35
45
55
65
75
85
95
105
0 10 20 30 40 50
(lmh/bar)
Cycles
OPn (lmh/bar)
MLSS 7.6 g/L
MLSS 10.32 g/L
MLSS 14.5 g/L
MLSS 10.36 g/L
MLSS 12.2 g/L
MLSS 12.7 g/L
MLSS 18.7 g/L
MLSS 15.41 g/L
MLSS 23.96 g/L
MLSS 23.3 g/L
MLSS 8.5 g/L
MLSS 22.79 g/L

EVALUATION OF A PILOT MBR SYSTEM OPERATED AT HIGH MLSS PROVIDED WITH A SPEECE CONE AERATION SYSTEM AS AN ALTERNATIVE FOR SANITATION PROVISION IN EMERGENCIES 68
As observed in Figure 4.29, along the low MLSS concentration range both the observed variations in TMP and OPn were very mild. The viscosity and resistance to filtration at such low MLSS could explain that minor change in TMP and OPn. At the 7.6 g/L MLSS set point, the permeability value is remarkably high (85 LMH/bar). At this set point concentration the system is working at conventional operational MBR conditions. The OPn decreased dramatically in the next MLSS set point (8.5 g/L) to approximately 25 LMH/bar. That is, a 70% reduction was observed with a MLSS increase of just one g TSS/L. However, the most interesting trend was observed at the next two MLSS set points (at 10.32 and 10.36 g/L). Undersimilar flow rate conditions, the OPn values increased (improved). That can only be explained by a reduction on the applied pressure; that is, an improvement on the filtration characteristics of the system. The trends can be observed in Figure 4.29. The same effect was observed with the TMP values. As observed in Figure 4.29, at the 7.6 g/L MLSS set point the TMP values were very low (approximately 14 KPa). At the next MLSS set point (8.5 g/L) the TMP increased up to approximately 37 KPa. Later on, at the next evaluated MLSS set points, the TMP values decreased. At these later set points the TMP values stabilized at approximately 25 KPa.
Figure 4.29 Flux, TMP and Permeability for different MLSS concentrations (7.6, 8.5, 10.32, and 10.36 g/L)
5.0
15.0
25.0
35.0
45.0
55.0
65.0
75.0
85.0
95.0
105.0
0 10 20 30 40 50Cycles
MLSS 7.6 g/L
Flux (lmh) Opn (lmh/bar) TMP (Kpa)
0.0
5.0
10.0
15.0
20.0
25.0
30.0
35.0
40.0
45.0
50.0
0 10 20 30 40 50Cycles
MLSS 8.5 g/L
Flux (lmh) Opn (lmh/bar) TMP (Kpa)
0.0
5.0
10.0
15.0
20.0
25.0
30.0
35.0
40.0
45.0
50.0
0 10 20 30 40 50Cycles
MLSS 10.36 g/L
Flux (lmh) Opn (lmh/bar) TMP (Kpa)
5.0
15.0
25.0
35.0
45.0
55.0
65.0
75.0
0 10 20 30 40 50Cycles
MLSS 10.32 g/L
Flux (lmh) Opn (lmh/bar) TMP (Kpa)

EVALUATION OF A PILOT MBR SYSTEM OPERATED AT HIGH MLSS PROVIDED WITH A SPEECE CONE AERATION SYSTEM AS AN ALTERNATIVE FOR SANITATION PROVISION IN EMERGENCIES 69
As observed in Figure 4.30, within the middle range concentration a general performance improvement on TMP and OPn was observed followed by a performance decrease. The first two figures at top of Figure 4.30 show the results for the MLSS set points at 12.21 (left) and 12.7 g/L (right). Applied pressure and OPn values of approximately 35 KPa and 35 LMH/bar were reported, respectively. However, at the next operational set point (14.54 g/L MLSS), the OPn was increased from 35 to 40 LMH/bar. The increased on the OPn permeability was observed even when the flux was reduced from 9 to 6 LMH due to a decrease in the flow rate. That is, a higher permeability was obtained with a lower flow, indicating an improvement on the filterability properties of the system. A lower applied pressure is required to obtain either the same or a higher amount of treated water. The latest set point at a 15.41 g/L MLSS exhibited a decreased in the performance of the system. The applied pressure increased from 25 to 40 KPa, and the OPn decreased from 44 to 30 LMH/bar. Moreover, differences in the variations of the evaluated parameters were observed during (and at the end) of the 50 cycles reported period (approximately 10 hours of continuous operation of the system). As observed in Figure 4.30, both the OPn and the TMP values remain almost unchanged for the whole 50 cycles period for the 12.21 and 12.7 g/L MLSS set points. However, the latest reported MLSS set point (15.41 g/L) exhibited noticeable changes on the OPn and TMP even after 30 cycles of operation, indicating a decrease on the system performance at this MLSS concentration set point.
Figure 4.30 Flux, TMP and Permeability for different MLSS concentrations (12.21, 12.7, 14.54 and 15.41 g/L)
5.0
10.0
15.0
20.0
25.0
30.0
35.0
40.0
0 10 20 30 40 50 60Cycles
MLSS 12.21 g/L
Flux (lmh) Opn (lmh/bar) TMP (Kpa)
5.0
10.0
15.0
20.0
25.0
30.0
35.0
40.0
0 10 20 30 40 50Cycles
MLSS 12.7 g/L
Flux (lmh) Opn (lmh/bar) TMP (Kpa)
0.0
5.0
10.0
15.0
20.0
25.0
30.0
35.0
40.0
45.0
50.0
35 55 75 95 Cycles
MLSS 14.54 g/L
2 Flux (lmh) 2 Opn (lmh/bar) 2 TMP (Kpa)
5.0
10.0
15.0
20.0
25.0
30.0
35.0
40.0
45.0
0 5 10 15 20 25 30Cycles
MLSS 15.41 g/L
Flux (lmh) Opn (lmh/bar) TMP (Kpa)

EVALUATION OF A PILOT MBR SYSTEM OPERATED AT HIGH MLSS PROVIDED WITH A SPEECE CONE AERATION SYSTEM AS AN ALTERNATIVE FOR SANITATION PROVISION IN EMERGENCIES 70
Figure 4.31 shows the OPn and TMP values for the high range concentration. During the last days of the system operation, to operate the system at the highest possible MLSS, the flow rate was gradually decreased as the MLSS concentration and filtration resistance increased; as a consequence, a reduction on both the flux and the OPn values can be observed. When operating the system at this operational condition a continuous increase on the TMP was observed; even the "high pressure" alarm (at -55 KPa) was triggered at some occasions, particularly at night. As a consequence of these unplanned stops (for a few hours each), the MLSS concentration in the MBR decreased from 23.96 g/L to 23.3 to 22.79 g/L. Therefore, the results in Figure 4.31 are presented on a time basis, rather than on a MLSS concentration basis to appreciate better the previously discussed MLSS decrease. The applied pressure values were steady below 40 KPa for the 18.7 g/L MLSS set point. Then, the applied pressure was increased both at the 23.96 and 23.3 g/L MLSS set points reaching TMP values as high as 48 KPa. Moreover, for the same MLSS range, the OPn was reduced proportionally from 35 to 25 LMH/bar. In addition, the flux was also reduced from 10 LMH (at 18.7 g/L MLSS) to approximately 8 LMH (at 23.3 g/L MLSS). At this point (23.2 g/L MLSS) the reactor was running very close to its limits, so it was not possible to increase the flow rate (and the applied organic loading) any further to achieve the next desired MLSS set points. Therefore, the only alternative to increase the organic load was to add an extra carbon source. As a consequence, sodium acetate solution was added as the external source of COD. However, the addition of acetate (a rapidly biodegradable and completely soluble substrate) completely changed the microorganism dynamics. The systems produced excessive foam, and dramatic losses on permeability were observed (from 33 to 20 LMH/bar). In addition, an associated increased on the applied pressure from 32 to 50 KPa and higher was observed. Last figure at bottom right on Figure 4.31 exhibited the TMP and OPn values at this operational conditions.

EVALUATION OF A PILOT MBR SYSTEM OPERATED AT HIGH MLSS PROVIDED WITH A SPEECE CONE AERATION SYSTEM AS AN ALTERNATIVE FOR SANITATION PROVISION IN EMERGENCIES 71
Figure 4.31 Flux, TMP and Permeability for different MLSS concentrations (18.7, 23.96, 23.3 and 22.79 g/L) In addition, the images in Figure 4.32 illustrate the extent of the foam generation (top of the figure) and the changes in the sludge characteristics (bottom of the figure). Last two images at the bottom on Figure 4.32 show the colour difference between the sludge in the reactor (left bottom side) and fresh sludge (right bottom side) added in a final attempt to keep the system alive and reach higher MLSS concentrations. However, due to time limitations and since the sludge properties had changed so drastically, it was decided to finish the second stage, to perform a full chemically assisted membrane cleaning, and to start up the system one more time for further research (results not included in this thesis work).
5.0
10.0
15.0
20.0
25.0
30.0
35.0
40.0
45.0
50.0
0 10 20 30 40 50
Cycles
MLSS 18.7 g/L
Flux (lmh) Opn (lmh/bar) TMP (Kpa)
5
10
15
20
25
30
35
40
45
50
0 20 40Cycles
MLSS 23.96 g/L
Flux (lmh) Opn (lmh/bar) TMP (Kpa)
5.0
10.0
15.0
20.0
25.0
30.0
35.0
40.0
45.0
50.0
0 10 20 30 40 50Cycles
MLSS 23.3 g/L
Flux (lmh) Opn (lmh/bar) TMP (Kpa)
5.0
10.0
15.0
20.0
25.0
30.0
35.0
40.0
45.0
50.0
55.0
0 20 40 60Cycles
MLSS 22.79 g/L (After Acetate)
2 Flux (lmh) 2 Opn (lmh/bar) 2 TMP (Kpa)
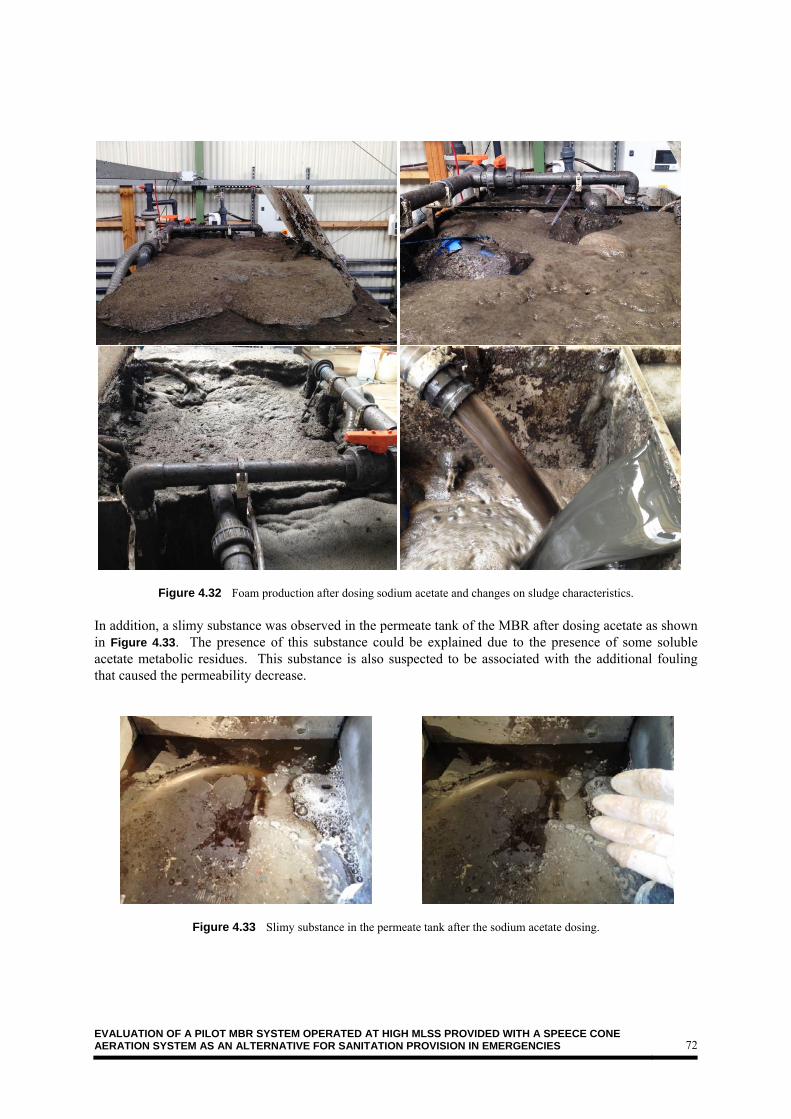
EVALUATION OF A PILOT MBR SYSTEM OPERATED AT HIGH MLSS PROVIDED WITH A SPEECE CONE AERATION SYSTEM AS AN ALTERNATIVE FOR SANITATION PROVISION IN EMERGENCIES 72
Figure 4.32 Foam production after dosing sodium acetate and changes on sludge characteristics. In addition, a slimy substance was observed in the permeate tank of the MBR after dosing acetate as shown in Figure 4.33. The presence of this substance could be explained due to the presence of some soluble acetate metabolic residues. This substance is also suspected to be associated with the additional fouling that caused the permeability decrease.
Figure 4.33 Slimy substance in the permeate tank after the sodium acetate dosing.

EVALUATION OF A PILOT MBR SYSTEM OPERATED AT HIGH MLSS PROVIDED WITH A SPEECE CONE AERATION SYSTEM AS AN ALTERNATIVE FOR SANITATION PROVISION IN EMERGENCIES 73
4.3. Activated Sludge properties
4.3.1. Mixed Liquor Suspended Solids concentration One of the main objectives during this research was to evaluate the performance of the MBR system at high MLSS concentrations. Therefore, it was necessary to modify the operational conditions that govern the mixed liquor in an MBR to reach the desired MLSS concentrations such as the SRT, the applied load, and the reactor volume. The MBR operational conditions are shown in Table 4.3. The reactor was inoculated with sludge from the HPN WWTP at a SRT of 20 days. For the achievement of the first set points (ID#5 to ID#8), as indicated in Table 4.3, the MBR was operated without wasting any sludge. That is, the SRT was continuously increased until reaching a SRT of 30 days. From there, the SRT was kept constant at 30 days by wasting a calculated volume of sludge at each operational point concentration. During this stage the influent flow rate was fixed at 3.5 m³/d. Once the SRT was fixed at 30 days (ID#8), the influent flow rate (that is, the applied load) was increased up to the highest flow (6 m³/d) corresponding to the lowest HRT (3.4 hours). As the flow rate increased (ID#9 to ID#11), also the applied membrane operational pressure increased; therefore, and to avoid high pressure alarms for subsequent set point it was decided to reduce back the flow rate. At this point, (ID#11), the membrane was running at its maximum capacity; it was not possible to increase the flow anymore. Therefore, and in order to reach higher MLSS concentrations, it was decided to reduce the volume of the reactor starting at the set point ID#12. To do that, both the MBR high level switch was lowered, and two carboys were filled with water and submerged into the aerobic tank as observed in Figure 4.34. A total volume reduction of 120 liters (14% volume reduction from the original volume) was achieved. At the last set point (ID#15), sodium acetate was added to increase the influent COD concentration and reached the highest MLSS set point.
Figure 4.34 Sealed vessels used to reduce the aerobic tank volume
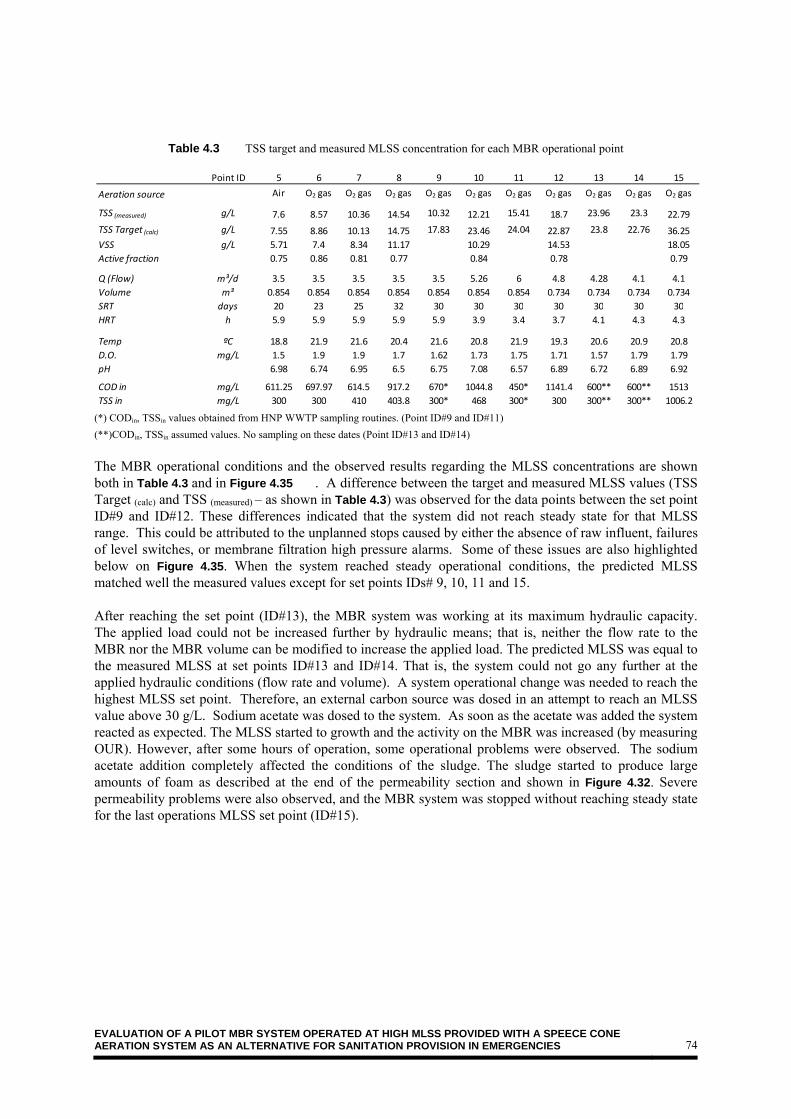
EVALUATION OF A PILOT MBR SYSTEM OPERATED AT HIGH MLSS PROVIDED WITH A SPEECE CONE AERATION SYSTEM AS AN ALTERNATIVE FOR SANITATION PROVISION IN EMERGENCIES 74
Table 4.3 TSS target and measured MLSS concentration for each MBR operational point
(*) CODin, TSSin values obtained from HNP WWTP sampling routines. (Point ID#9 and ID#11)
(**)CODin, TSSin assumed values. No sampling on these dates (Point ID#13 and ID#14)
The MBR operational conditions and the observed results regarding the MLSS concentrations are shown both in Table 4.3 and in Figure 4.35 . A difference between the target and measured MLSS values (TSS Target (calc) and TSS (measured) – as shown in Table 4.3) was observed for the data points between the set point ID#9 and ID#12. These differences indicated that the system did not reach steady state for that MLSS range. This could be attributed to the unplanned stops caused by either the absence of raw influent, failures of level switches, or membrane filtration high pressure alarms. Some of these issues are also highlighted below on Figure 4.35. When the system reached steady operational conditions, the predicted MLSS matched well the measured values except for set points IDs# 9, 10, 11 and 15. After reaching the set point (ID#13), the MBR system was working at its maximum hydraulic capacity. The applied load could not be increased further by hydraulic means; that is, neither the flow rate to the MBR nor the MBR volume can be modified to increase the applied load. The predicted MLSS was equal to the measured MLSS at set points ID#13 and ID#14. That is, the system could not go any further at the applied hydraulic conditions (flow rate and volume). A system operational change was needed to reach the highest MLSS set point. Therefore, an external carbon source was dosed in an attempt to reach an MLSS value above 30 g/L. Sodium acetate was dosed to the system. As soon as the acetate was added the system reacted as expected. The MLSS started to growth and the activity on the MBR was increased (by measuring OUR). However, after some hours of operation, some operational problems were observed. The sodium acetate addition completely affected the conditions of the sludge. The sludge started to produce large amounts of foam as described at the end of the permeability section and shown in Figure 4.32. Severe permeability problems were also observed, and the MBR system was stopped without reaching steady state for the last operations MLSS set point (ID#15).
Point ID 5 6 7 8 9 10 11 12 13 14 15
Aeration source Air O2 gas O2 gas O2 gas O2 gas O2 gas O2 gas O2 gas O2 gas O2 gas O2 gas
TSS (measured) g/L 7.6 8.57 10.36 14.54 10.32 12.21 15.41 18.7 23.96 23.3 22.79
TSS Target (calc) g/L 7.55 8.86 10.13 14.75 17.83 23.46 24.04 22.87 23.8 22.76 36.25
VSS g/L 5.71 7.4 8.34 11.17 10.29 14.53 18.05
Active fraction 0.75 0.86 0.81 0.77 0.84 0.78 0.79
Q (Flow) m³/d 3.5 3.5 3.5 3.5 3.5 5.26 6 4.8 4.28 4.1 4.1
Volume m³ 0.854 0.854 0.854 0.854 0.854 0.854 0.854 0.734 0.734 0.734 0.734
SRT days 20 23 25 32 30 30 30 30 30 30 30
HRT h 5.9 5.9 5.9 5.9 5.9 3.9 3.4 3.7 4.1 4.3 4.3
Temp ºC 18.8 21.9 21.6 20.4 21.6 20.8 21.9 19.3 20.6 20.9 20.8
D.O. mg/L 1.5 1.9 1.9 1.7 1.62 1.73 1.75 1.71 1.57 1.79 1.79
pH 6.98 6.74 6.95 6.5 6.75 7.08 6.57 6.89 6.72 6.89 6.92
COD in mg/L 611.25 697.97 614.5 917.2 670* 1044.8 450* 1141.4 600** 600** 1513
TSS in mg/L 300 300 410 403.8 300* 468 300* 300 300** 300** 1006.2
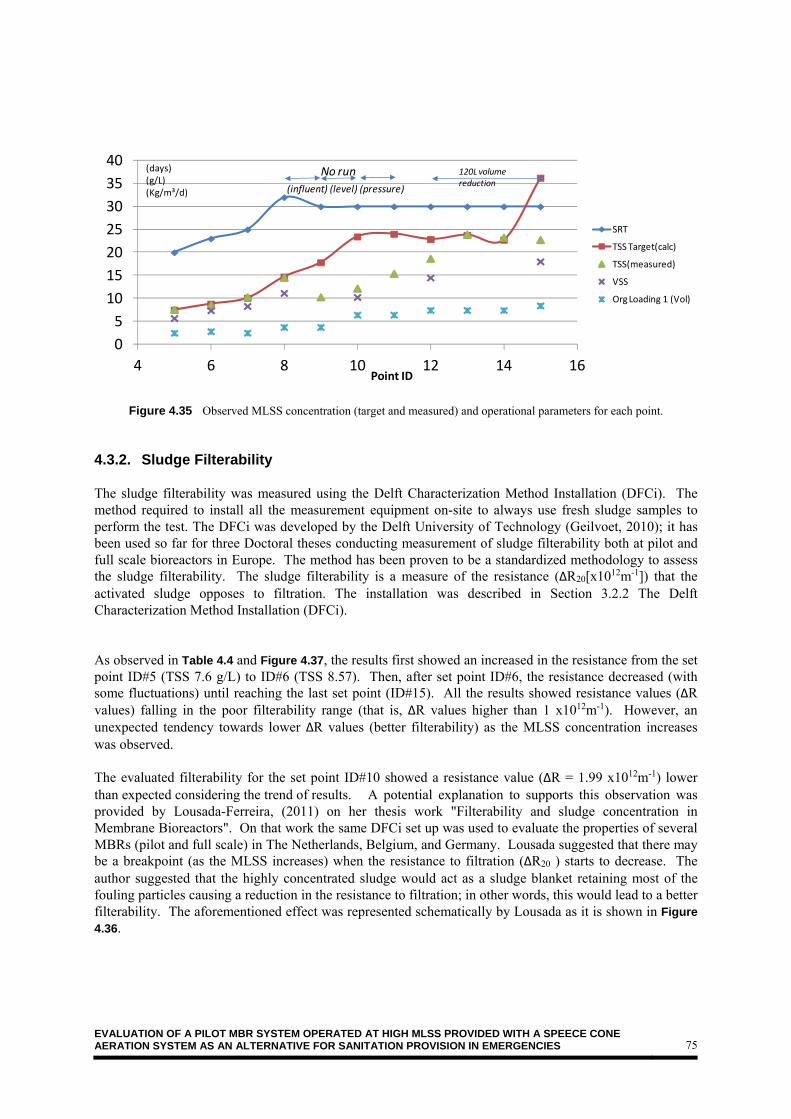
EVALUATION OF A PILOT MBR SYSTEM OPERATED AT HIGH MLSS PROVIDED WITH A SPEECE CONE AERATION SYSTEM AS AN ALTERNATIVE FOR SANITATION PROVISION IN EMERGENCIES 75
Figure 4.35 Observed MLSS concentration (target and measured) and operational parameters for each point. 4.3.2. Sludge Filterability The sludge filterability was measured using the Delft Characterization Method Installation (DFCi). The method required to install all the measurement equipment on-site to always use fresh sludge samples to perform the test. The DFCi was developed by the Delft University of Technology (Geilvoet, 2010); it has been used so far for three Doctoral theses conducting measurement of sludge filterability both at pilot and full scale bioreactors in Europe. The method has been proven to be a standardized methodology to assess the sludge filterability. The sludge filterability is a measure of the resistance (ΔR20[x1012m-1]) that the activated sludge opposes to filtration. The installation was described in Section 3.2.2 The Delft Characterization Method Installation (DFCi). As observed in Table 4.4 and Figure 4.37, the results first showed an increased in the resistance from the set point ID#5 (TSS 7.6 g/L) to ID#6 (TSS 8.57). Then, after set point ID#6, the resistance decreased (with some fluctuations) until reaching the last set point (ID#15). All the results showed resistance values (ΔR values) falling in the poor filterability range (that is, ΔR values higher than 1 x10¹²m-1). However, an unexpected tendency towards lower ΔR values (better filterability) as the MLSS concentration increases was observed. The evaluated filterability for the set point ID#10 showed a resistance value (ΔR = 1.99 x10¹²m-1) lower than expected considering the trend of results. A potential explanation to supports this observation was provided by Lousada-Ferreira, (2011) on her thesis work "Filterability and sludge concentration in Membrane Bioreactors". On that work the same DFCi set up was used to evaluate the properties of several MBRs (pilot and full scale) in The Netherlands, Belgium, and Germany. Lousada suggested that there may be a breakpoint (as the MLSS increases) when the resistance to filtration (ΔR20 ) starts to decrease. The author suggested that the highly concentrated sludge would act as a sludge blanket retaining most of the fouling particles causing a reduction in the resistance to filtration; in other words, this would lead to a better filterability. The aforementioned effect was represented schematically by Lousada as it is shown in Figure 4.36.
0
5
10
15
20
25
30
35
40
4 6 8 10 12 14 16
(days) (g/L) (Kg/m³/d)
Point ID
SRT
TSS Target(calc)
TSS(measured)
VSS
Org Loading 1 (Vol)
No run 120L volume reduction
(influent) (level) (pressure)
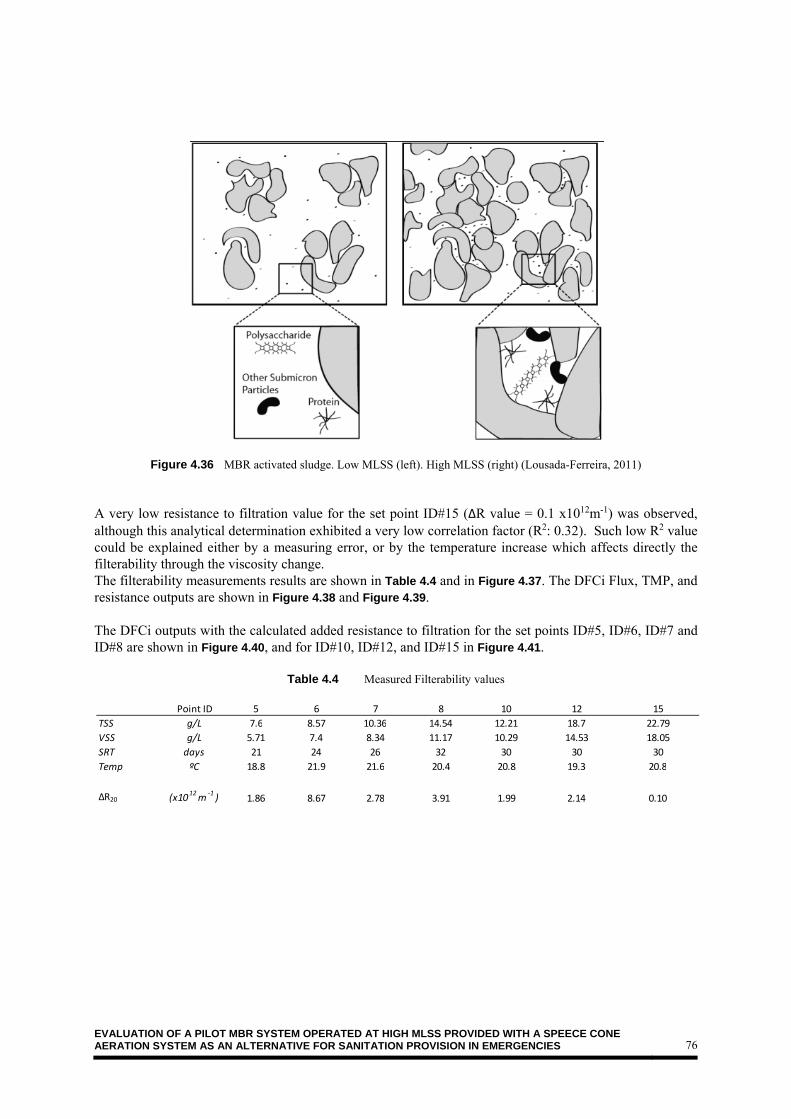
EVALUATION OF A PILOT MBR SYSTEM OPERATED AT HIGH MLSS PROVIDED WITH A SPEECE CONE AERATION SYSTEM AS AN ALTERNATIVE FOR SANITATION PROVISION IN EMERGENCIES 76
Figure 4.36 MBR activated sludge. Low MLSS (left). High MLSS (right) (Lousada-Ferreira, 2011) A very low resistance to filtration value for the set point ID#15 (ΔR value = 0.1 x10¹²m-1) was observed, although this analytical determination exhibited a very low correlation factor (R2: 0.32). Such low R2 value could be explained either by a measuring error, or by the temperature increase which affects directly the filterability through the viscosity change. The filterability measurements results are shown in Table 4.4 and in Figure 4.37. The DFCi Flux, TMP, and resistance outputs are shown in Figure 4.38 and Figure 4.39. The DFCi outputs with the calculated added resistance to filtration for the set points ID#5, ID#6, ID#7 and ID#8 are shown in Figure 4.40, and for ID#10, ID#12, and ID#15 in Figure 4.41.
Table 4.4 Measured Filterability values
Point ID 5 6 7 8 10 12 15
TSS g/L 7.6 8.57 10.36 14.54 12.21 18.7 22.79
VSS g/L 5.71 7.4 8.34 11.17 10.29 14.53 18.05
SRT days 21 24 26 32 30 30 30
Temp ºC 18.8 21.9 21.6 20.4 20.8 19.3 20.8
ΔR20 (x1012m
‐1) 1.86 8.67 2.78 3.91 1.99 2.14 0.10

EVALUATION OF A PILOT MBR SYSTEM OPERATED AT HIGH MLSS PROVIDED WITH A SPEECE CONE AERATION SYSTEM AS AN ALTERNATIVE FOR SANITATION PROVISION IN EMERGENCIES 77
Figure 4.37 Measured Filterability values
Figure 4.38 Resistance (R), Flux (J) and Pressure (TMP). Clockwise from top left: ID#5 (7.6g/L), ID#6 (8.57 g/L), ID#7
(10.36 g/L), and ID#8 (14.54 g/L)
0
5
10
15
20
25
5 7 9 11 13 15
ºC g/L
(x1012m‐1)
Point ID
ΔR20 (x1012m‐1)
Temp
TSS
ΔR20
0
25
50
75
100
125
0
1
2
3
4
5
35 40 45
Resi
stan
ce [*
1012
m-1]
volume [l/m2]
R TMP J
0
25
50
75
100
125
0
1
2
3
4
5
0 2 4 6 8
Resi
stan
ce [*
1012
m-1]
volume [l/m2]
R TMP J
0
25
50
75
100
125
0
1
2
3
4
5
0 5 10 15
Resi
stan
ce [*
1012
m-1]
volume [l/m2]
R TMP J
0
25
50
75
100
125
0
1
2
3
4
5
0 2 4 6 8 10
Resi
stan
ce [*
1012
m-1]
volume [l/m2]
R TMP J
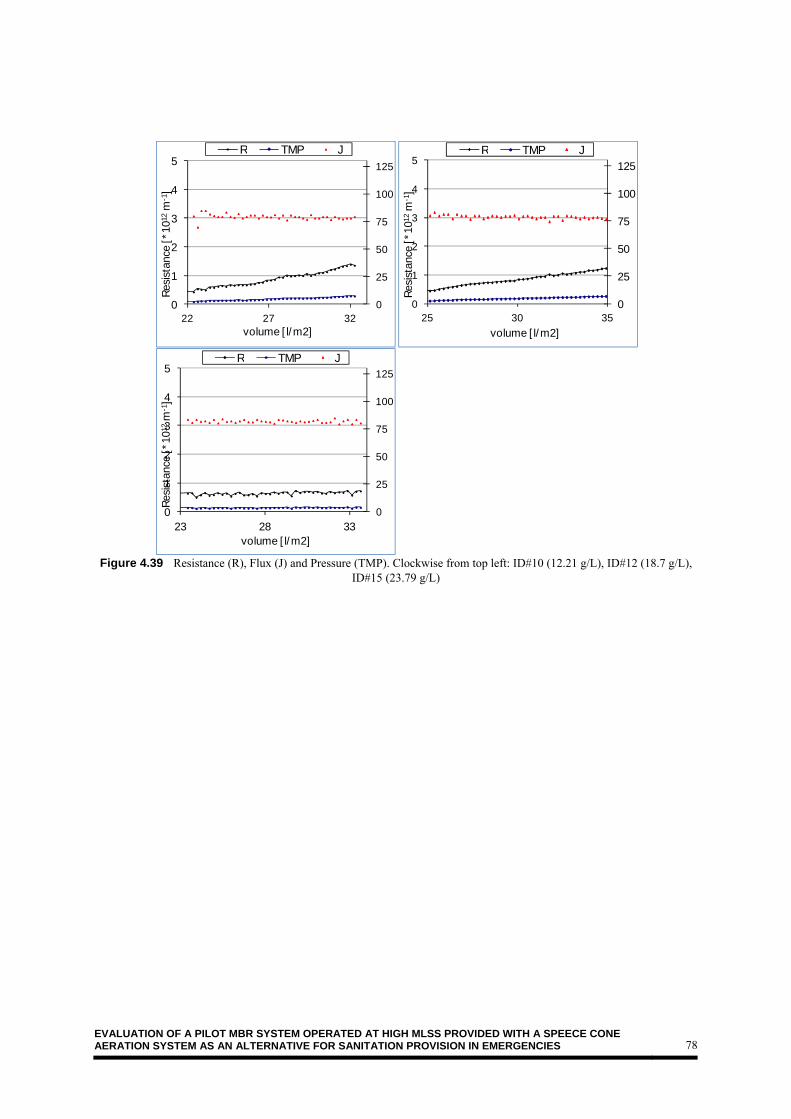
EVALUATION OF A PILOT MBR SYSTEM OPERATED AT HIGH MLSS PROVIDED WITH A SPEECE CONE AERATION SYSTEM AS AN ALTERNATIVE FOR SANITATION PROVISION IN EMERGENCIES 78
Figure 4.39 Resistance (R), Flux (J) and Pressure (TMP). Clockwise from top left: ID#10 (12.21 g/L), ID#12 (18.7 g/L), ID#15 (23.79 g/L)
0
25
50
75
100
125
0
1
2
3
4
5
22 27 32
Resi
stan
ce [*
1012
m-1]
volume [l/m2]
R TMP J
0
25
50
75
100
125
0
1
2
3
4
5
25 30 35
Resi
stan
ce [*
1012
m-1]
volume [l/m2]
R TMP J
0
25
50
75
100
125
0
1
2
3
4
5
23 28 33
Resi
stan
ce [*
1012
m-1]
volume [l/m2]
R TMP J

EVALUATION OF A PILOT MBR SYSTEM OPERATED AT HIGH MLSS PROVIDED WITH A SPEECE CONE AERATION SYSTEM AS AN ALTERNATIVE FOR SANITATION PROVISION IN EMERGENCIES 79
Figure 4.40 Added resistance. Clockwise from top left: ID#5 (7.6g/L), ID#6 (8.57 g/L), ID#7 (10.36 g/L), ID#8 (14.54
g/L)
0.01
0.10
1.00
10.00
10.00 100.00
Add.
Res
ista
nce
[*10
12m
-1]
volume [l/m2]
Series2 Power (Series2)
y = 0,082x1,0428
R² = 0,9681
y = 0.1635x1.3256
R² = 0.998
0.01
0.10
1.00
10.00
1.00 10.00 100.00
Add.
Res
ista
nce
[*10
12m
-1]
volume [l/m2]
Series2 Power (Series2)
y = 0.0921x1.1373
R² = 0.9905
0.01
0.10
1.00
10.00
1.00 10.00 100.00
Add.
Res
ista
nce
[*10
12m
-1]
volume [l/m2]
Series2 Power (Series2)
y = 0.1053x1.2067
R² = 0.9933
0.01
0.10
1.00
10.00
1.00 10.00 100.00
Add.
Res
ista
nce
[*10
12m
-1]
volume [l/m2]
Series2 Power (Series2)

EVALUATION OF A PILOT MBR SYSTEM OPERATED AT HIGH MLSS PROVIDED WITH A SPEECE CONE AERATION SYSTEM AS AN ALTERNATIVE FOR SANITATION PROVISION IN EMERGENCIES 80
Figure 4.41 Added resistance. Clockwise from top left: ID#10 (12.21 g/L), ID#12 (18.7 g/L), ID#15 (23.79 g/L)
4.4. Oxygen Dynamics
4.4.1. Oxygen Uptake Rate (OUR) The MBR worked on a semi-batch operational condition regarding the influent feed of wastewater. The influent was not coming into the reactor at a constant flow, but rather as a semi batch mode. As the permeate production lowered the MBR level (reaching the low level setpoint), the influent pump turned on and brought approximately 200 L of influent wastewater into the MBR (that is, approximately 20% of the reactor's volume). Due to this particular condition, and considering the large amount of wastewater that was loaded in every feed "batch", the soluble substrate concentration in the MBR aerobic tank fluctuated. The substrate concentration is related to the bacterial specific growth rate; and therefore, to the OUR. Consequently, this condition was considered when performing the OUR determinations as follows. The "active" OUR was determined by adding a specific volume of influent to the vessel where the OUR was being measured to obtain OUR values closer to the actual MBR operational conditions. The OUR results are showed in Table 4.5; they are classified in different groups as follows: Group 1: Operational conditions: Aeration source, Flow (Q), Hydraulic retention time (HRT),
Solids retention time (SRT), Total suspended solids (TSS), Volatile suspended solids (VSS), Temperature, Dissolved oxygen (D.O)
Group 2: Substrate fractionation: Chemical oxygen demand (COD) influent (CODin), effluent (CODout), removed (CODremoved). Calculated ultimate BOD (UBOD(calc)), calculated
y = 0.0725x1.1069
R² = 0.9718
0.01
0.10
1.00
10.00
1.00 10.00 100.00
Add.
Res
ista
nce
[*10
12m
-1]
volume [l/m2]
Series2
y = 0.0795x1.0012
R² = 0.9902
0.01
0.10
1.00
10.00
1.00 10.00 100.00
Add.
Res
ista
nce
[*10
12m
-1]
volume [l/m2]
Series2
y = 0.001x1.548
R² = 0.3201
0.01
0.10
1.00
10.00
10.00 100.00
Add.
Res
ista
nce
[*10
12m
-1]
volume [l/m2]
Series2

EVALUATION OF A PILOT MBR SYSTEM OPERATED AT HIGH MLSS PROVIDED WITH A SPEECE CONE AERATION SYSTEM AS AN ALTERNATIVE FOR SANITATION PROVISION IN EMERGENCIES 81
biologic oxygen demand (BOD5(calc)) Unbiodegradable particulate (Unbio(calc)), Volumetric loading (applied and removed).
Group 3: Calculated oxygen flux (FOc) for: removed COD (FOc1(removedCOD)), Ultimate BOD (FOc2(UBOD)), biologic oxygen demand (FOc3(BOD5))
Group 4: Oxygen uptake rates normalized at 20ºC (OUR20) calculated using: Removed COD
(OUR201), Ultimate BOD (OUR202), Biological oxygen demand (OUR203). Measured OUR (OUR20 M1(measured)).
Group 5: Specific Oxygen uptake rates normalized at 20ºC (SOUR20) calculated using: Removed
COD (SOUR201), Ultimate BOD (SOUR202), Biological oxygen demand (SOUR203) and the measured OUR20 M1 (SOUR20 M1(measured)).
In Table 4.5, the operational points corresponding to set points IDs #9, #11, #13, and #14 are not reported because the COD was not determined for these set points.
Table 4.5 MBR Operational conditions and OUR values
Point ID 5 6 7 8 10 12 15
G1: Operational conditions
Aeration source Air O2 gas O2 gas O2 gas O2 gas O2 gas O2 gas
TSS g/L 7.60 8.57 10.36 14.54 12.21 18.70 22.79
VSS g/L 5.71 7.40 8.34 11.17 10.29 14.53 18.05
Q m³/d 3.50 3.50 3.50 3.50 5.26 4.80 4.10
Volume m³ 0.85 0.85 0.85 0.85 0.85 0.73 0.73
SRT days 20.00 23.00 25.00 32.00 30.00 30.00 30.00
HRT h 5.86 5.86 5.86 5.86 3.90 3.67 4.30
Temp ºC 18.8 21.9 21.6 20.4 20.8 19.3 20.8
D.O. mg/L 1.5 1.9 1.9 1.7 1.73 1.71 1.79
G2: Substrate fractionation
COD in mg/L 611.25 697.97 614.50 917.20 1044.80 1141.40 1513.00
COD out mg/L 25.52 51.70 61.50 33.70 58.24 12.43 25.52
COD (removed) mg/L 585.73 646.27 553.00 883.50 986.56 1128.97 1487.48
% 0.96 0.93 0.90 0.96 0.94 0.99 0.98
UBOD(calc) mg/L 382.03 436.23 384.06 573.25 653.00 713.38 945.63
(Biodeg(soluble+particulate))
BOD5 (calc) mg/L 244.50 279.19 245.80 366.88 417.92 456.56 605.20
Unbio (Particulate) (calc) mg/L 203.70 210.04 168.94 310.25 333.56 415.60 541.86
Volumetric Loading 1 (applied) KgCOD/m³/d 2.51 2.86 2.52 3.76 6.44 7.46 8.45
Volumetric Loading 2 (removed) KgCOD/m³/d 2.40 2.65 2.27 3.62 6.08 7.38 8.31
G3: Daily oxygen flux
FOc 1 (Removed COD) KgO/d 2.01 2.21 1.96 2.91 4.80 4.92 5.63
FOc 2 (UBOD) KgO/d 1.46 1.63 1.49 2.04 3.39 3.32 3.77
FOc 3 (BOD5) KgO/d 1.08 1.19 1.10 1.46 2.40 2.33 2.60
G4: Oxygen uptake rates
OUR20 1 (removed COD) mg/L/h 90.4 118.0 103.2 145.0 243.5 266.2 332.2
OUR20 2 (UBOD) mg/L/h 65.7 87.0 78.5 101.4 172.0 179.7 222.2
OUR20 3 (BOD5) mg/L/h 48.7 63.8 58.2 72.4 121.7 126.3 153.2
OUR20 M1 (measured) mg/L/h 59.7 106.2 76.7 206.0 157.6 180.8 332.3
G5: Specific oxygen uptake rates
SOUR20 1 (removed COD) mg/g/h 15.8 16.0 12.4 13.0 23.7 18.3 18.4
SOUR20 2 (UBOD) mg/g/h 11.5 11.8 9.4 9.1 16.7 12.4 12.3
SOUR203(BOD5) mg/g/h 8.5 8.6 7.0 6.5 11.8 8.7 8.5
SOUR20 M1 (measured) mg/g/h 10.5 14.4 9.2 18.4 15.3 12.4 18.4
EVALUATION OF A PILOT MBR SYSTEM OPERATED AT HIGH MLSS PROVIDED WITH A SPEECE CONE AERATION SYSTEM AS AN ALTERNATIVE FOR SANITATION PROVISION IN EMERGENCIES 82
The theoretical OUR in order to achieve the observed organic load removal is shown in Figure 4.42 as OUR201(removed OUR). It corresponds to the theoretical mass of oxygen required to degrade the removed load at each operational point. However, that is not fully correct because not the entire influent load to the MBR is fully biodegradable and some removal happens via floc adsorption. Therefore, the theoretical OUR corresponding to the biodegradable fraction (soluble+particulate) of the influent COD is better described when considering the ultimate BOD (UBOD fraction) in the calculations. These OUR values are shown in Figure 4.42 and Table 4.5 as OUR202(UBOD). The influent wastewater contains both a soluble unbiodegradable (CODout) and a particulate unbiodegradable fraction (Unbio Particulate). The later can be calculated by subtracting the soluble unbiodegradable fraction (CODout) and the UBOD to the influent COD (CODin). The theoretical OUR values corresponding to the biodegradable COD as previously determined are shown in Figure 4.42 as OUR20 UBOD. The aforementioned calculation process is explained step by step for (Point ID#5) in the following example: Influent wastewater fractionation: In 1972, Metcalf proposed a simplified expression to estimate the ultimate BOD (UBOD) dividing the COD by 1.6 (Metcalf, 1972). That is roughly 62.5% of the influent COD for typical domestic wastewater as follows:
1.6
(4.3)
In the case of Point ID#5,
611.25 /1.6
382.03 / (4.4)
This UBOD value represents all of the biodegradable content of the influent wastewater including soluble and particulate material. Since no biological oxygen demand (BOD5) measurements were performed, it was calculated based on a one year data series from HNP WWTP monitoring routines. This data series contained daily COD and BOD5 measures over one year that allowed establishing the influent BOD as an average reliable factor of 0.4 the influent COD value. In the case of Point ID#5:
0.4
0.4 611.25 / 244.5 /
(4.5)
Knowing the influent COD (the total incoming substrate), the effluent COD (the soluble unbiodegradable fraction) and also the UBOD (both the soluble and particulate biodegradable fraction) it is possible to calculate the unbiodegradable particulate fraction (Unbiopart) to complete the influent fractionation as follows:
611.25 25.52 382.03 203.7 /
(4.6)
EVALUATION OF A PILOT MBR SYSTEM OPERATED AT HIGH MLSS PROVIDED WITH A SPEECE CONE AERATION SYSTEM AS AN ALTERNATIVE FOR SANITATION PROVISION IN EMERGENCIES 83
Daily oxygen flux: The carbonaceous oxygen demand for BOD5 can be calculated using the following expression (Henze, 2008):
1 11
(4.7)
Where:
FOC: Daily flux of oxygen utilised [gO2/d] Q: Influent flow [m3/d] Sbi: Influent biodegradable COD [mgCOD/L] fcv: COD/VSS ratio [mgCOD/mgVSS] YHv: VSS yield (OHO) [mgVSS/mgCOD] fH: Unbiodegradable fraction (OHO) [1] bHT: Rate of endogenous mass loss [d-1] SRT: Sludge retention time [d] Oxygen demand from ammonia oxidation:
4.3 (4.8)
Where:
FONH4: Daily flux of oxygen (for NH4) [gO2/d] Q: Influent flow [m3/d] Nti: Influent total TKN [mgN/L] The total oxygen demand can be found by adding the values obtained from equations 4.9 and 4.10, for Point ID#5 that is:
3.5 244.5 1 1.48 0.45 1.48 1 0.2
0.230.45 20
1 0.23 20
660.9
(4.9)
3.5³
28 4.3 421.4 (4.10)
660.9 421.4 1082.3 1.08 (4.11)
Oxygen uptake rate:
100024
1.08 /0.854 ³
10 124
1 ³10
52.69
(4.12)
Normalizing OUR to 20ºC:
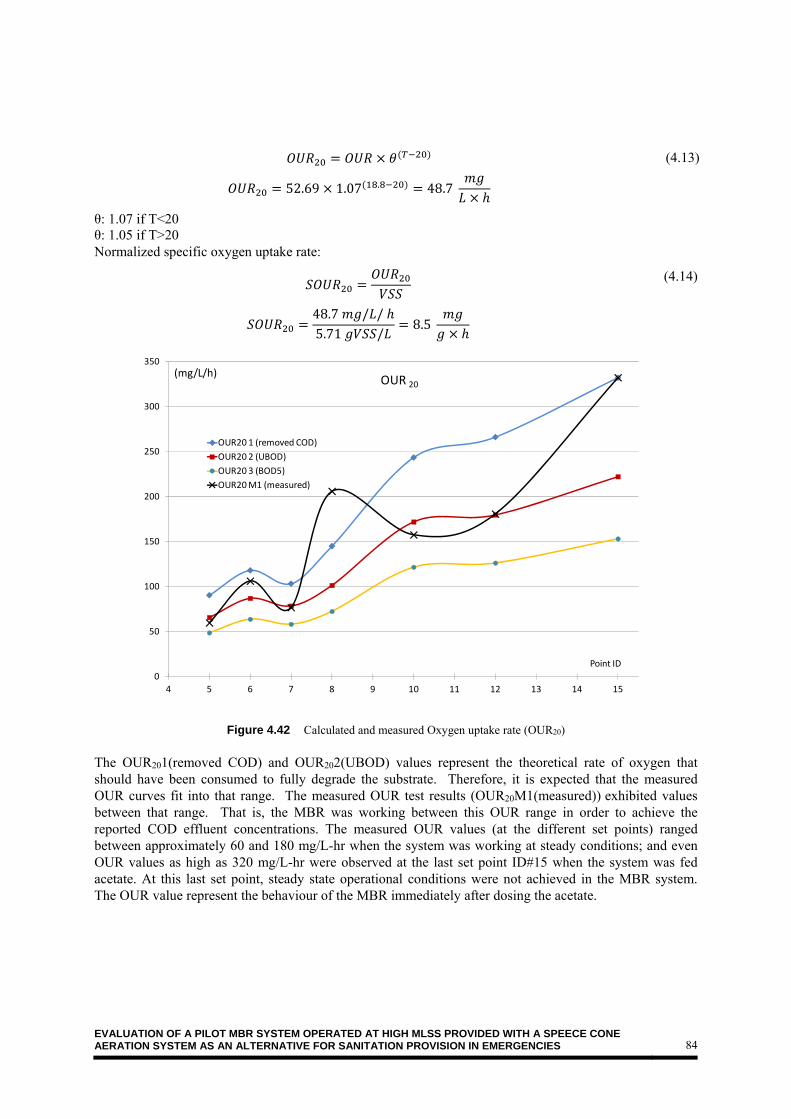
EVALUATION OF A PILOT MBR SYSTEM OPERATED AT HIGH MLSS PROVIDED WITH A SPEECE CONE AERATION SYSTEM AS AN ALTERNATIVE FOR SANITATION PROVISION IN EMERGENCIES 84
52.69 1.07 . 48.7
θ: 1.07 if T<20 θ: 1.05 if T>20
(4.13)
Normalized specific oxygen uptake rate:
48.7 / /5.71 /
8.5
(4.14)
Figure 4.42 Calculated and measured Oxygen uptake rate (OUR20) The OUR201(removed COD) and OUR202(UBOD) values represent the theoretical rate of oxygen that should have been consumed to fully degrade the substrate. Therefore, it is expected that the measured OUR curves fit into that range. The measured OUR test results (OUR20M1(measured)) exhibited values between that range. That is, the MBR was working between this OUR range in order to achieve the reported COD effluent concentrations. The measured OUR values (at the different set points) ranged between approximately 60 and 180 mg/L-hr when the system was working at steady conditions; and even OUR values as high as 320 mg/L-hr were observed at the last set point ID#15 when the system was fed acetate. At this last set point, steady state operational conditions were not achieved in the MBR system. The OUR value represent the behaviour of the MBR immediately after dosing the acetate.
0
50
100
150
200
250
300
350
4 5 6 7 8 9 10 11 12 13 14 15
(mg/L/h)
Point ID
OUR 20
OUR20 1 (removed COD)
OUR20 2 (UBOD)
OUR20 3 (BOD5)
OUR20 M1 (measured)

EVALUATION OF A PILOT MBR SYSTEM OPERATED AT HIGH MLSS PROVIDED WITH A SPEECE CONE AERATION SYSTEM AS AN ALTERNATIVE FOR SANITATION PROVISION IN EMERGENCIES 85
The SOUR values were calculated dividing the OURs by the corresponding VSS concentration. These and the measured SOUR curves are shown in Figure 4.43. The same nomenclature as explained for Table 4.5 and Figure 4.42 was used. The measured SOUR values followed the very same trends and values as the theoretical SOUR values. That is, as the load to the MBR system increased (and therefore, the MLSS increased), the OUR values increased proportionally to the increased load in the reactor. That is, the OUR values (at the reported range) increased proportionally to the MLSS and were not negatively affected by the increase on the MLSS. That is, the measured SOUR values were relatively similar to the expected (theoretical) SOUR values as show in Figure 4.43.
Figure 4.43 Specific Oxygen uptake rate (SOUR20)
5
7
9
11
13
15
17
19
21
4 5 6 7 8 9 10 11 12 13 14 15
(mg/g/h)
Point ID
SOUR 20
SOUR20 2 (UBOD)
SOUR20 (BOD5)
SOUR20 M1 (measured)

EVALUATION OF A PILOT MBR SYSTEM OPERATED AT HIGH MLSS PROVIDED WITH A SPEECE CONE AERATION SYSTEM AS AN ALTERNATIVE FOR SANITATION PROVISION IN EMERGENCIES 86
4.4.2. Comparison with conventional systems One of the main advantages when operating an MBR at high MLSS is the volume reduction. A comparison between conventional (low MLSS) MBR systems and high MLSS MBRs is shown in Table 4.6. To establish that comparison, the same operational conditions (Q, SRT, Temp, COD) were considered for all the scenarios. The only parameter that was changed was the MLSS concentration. The theoretical required biomass to degrade the applied organic load was the same in all the scenarios. Therefore, changes on the biomass concentration (MLSS) were reflected on changes on the required volume (and HRT) necessarily to achieve that particular MLSS. The information provided below support the main ideas behind this research as follows: (i) demonstrating that is possible to operate an MBR at high MLSS, and (ii) showing the potential advantages of operating MBR systems at such high MLSS (such as the associated capital expenses reduction). On Table 4.6 is possible to observe the volume reduction that can be achieved by operating a high MLSS MBR at different MLSS compared to both a CAS system operated at 3 g/L MLSS and to a conventional (low MLSS) MBR operated at 9 g/L MLSS. Volume reductions (and/or HRT reductions) as large as 90% and 70% compared to CAS and conventional MBRs can be obtained, respectively. The values presented in Table 4.6 can be better observed in Figure 4.44.
Table 4.6 Required volume comparison between conventional systems and high MLSS MBR
CAS low MLSS MBR
Q m³/d 4.1 4.1 4.1 4.1 4.1 4.1 4.1
SRT days 20 20 20 20 20 20 20
Temp ºC 20 20 20 20 20 20 20
COD in m³/d 800 800 800 800 800 800 800
UBOD mg/L 500 500 500 500 500 500 500
MLSS g/L 3 9 12.21 14.54 18.7 22.79 35
FOc KgO/d 2.08 2.08 2.08 2.08 2.08 2.08 2.08
OUR (UBOD=500) mg/L/h 22.22 66.67 90.28 108.33 139.78 166.67 254.90
SOUR mg/g/h 9.26 9.26 9.24 9.31 9.34 9.14 9.10
Volume (UBOD=500) m³ 3.9 1.3 0.96 0.8 0.62 0.52 0.34
HRT h 22.8 7.6 5.6 4.7 3.6 3.0 2.0
Org Loading (vol) Kg/m³/d 0.53 1.58 2.14 2.56 3.31 3.94 6.03
high MLSS MBR

EVALUATION OF A PILOT MBR SYSTEM OPERATED AT HIGH MLSS PROVIDED WITH A SPEECE CONE AERATION SYSTEM AS AN ALTERNATIVE FOR SANITATION PROVISION IN EMERGENCIES 87
Figure 4.44 Benefits of high MLSS MBR in terms of volume and HRT reduction.
The calculated OUR and required volume for different BOD load values (500, 1000 and 1500 mg BOD/L) are shown in Figure 4.45. At the high MLSS MBR zone (MLSS: 12 to 35 g/L), OURs higher than 100 mg/L/h are required to fully degrade the influent load. This research confirmed that such OUR values can be achieved in practice. As discussed in this chapter, an MBR can be operated at high MLSS MBR exhibiting a good performance in terms of the effluent quality even at HRT as low as 3.4 hours. The oxygen transfer limitations can be solved by using an alternative aeration method like the Speece cone. However, the maximum MLSS at which the MBR can be operated will depend on the membrane permeability and membrane capital cost.

EVALUATION OF A PILOT MBR SYSTEM OPERATED AT HIGH MLSS PROVIDED WITH A SPEECE CONE AERATION SYSTEM AS AN ALTERNATIVE FOR SANITATION PROVISION IN EMERGENCIES 88
Figure 4.45 Required volume and OUR for different influent COD concentrations
4.4.3. Oxygen transfer using the Speece Cone aeration system The oxygen transfer in activated sludge processes decreases rapidly as the MLSS concentration increases. This issue has been addressed by many authors; they described the impact of the MLSS on the transfer efficiency coefficient (alpha (α) factor) demonstrating that the alpha factor decreases to almost zero at MLSS concentrations of approximately 20 g/L and higher (Henze, 2008). The MBR system was provided with both a fine bubble diffuser fed compress air and with the Speece cone fed pure oxygen. In addition a coarse bubble diffuser was placed at the bottom of the membrane submerged module for membrane scouring. The operational conditions of both the MBR and the Speece cone system are described in Table 4.7. The first set of data shown in Table 4.7 corresponds to the operational conditions at each set point ID for the MBR. In addition to the previously reported MBR operational conditions, the measured dissolved oxygen concentration in the aerobic chamber (D.O. AE) and in the anoxic chamber (D.O. AX) are also included in this table. The second set of data shown in Table 4.7 describes the aeration source operational conditions. Conventional fine bubble diffuser aeration was only used for the first operational point from the "second phase" (set point ID #5). The aeration method was immediately changed to the Speece cone starting at set point ID#6 since the aeration capacity was not enough to cope with the high dissolved oxygen demand at the specific operational conditions. The row labelled "O2 transferred by cone" in Table 4.7 represents the theoretical calculated oxygen transfer to the liquid phase by the Speece cone system. That is, the theoretical amount of O2 mass that is being introduced by the Speece cone to the MBR system for bacterial growth. The theoretical oxygen mass transfer calculations were conducted based on the information provided by the Speece cone manufacturer (ECO2). This information is shown in Figure 4.46 bellow.
EVALUATION OF A PILOT MBR SYSTEM OPERATED AT HIGH MLSS PROVIDED WITH A SPEECE CONE AERATION SYSTEM AS AN ALTERNATIVE FOR SANITATION PROVISION IN EMERGENCIES 89
The Speece cone transfer efficiency depends on two main operational parameters: the flow velocity at the cone's inlet section, and the pressure in the cone. These two conditions determine the rate at which the oxygen (gas phase) gets dissolved inside the cone into the mixed liquor stream (liquid phase). These two conditions at each operational set point ID are provided in the two rows above the “oxygen transferred by cone” row in Table 4.7. Once the flow velocity and the pressure at the cone are known, the amount of oxygen that was theoretically transferred can be determined by using the data contained in Figure 4.46 below provided by ECO2. The two rows below the oxygen transferred row correspond to the theoretical oxygen demand when considering the removed COD (FOc1) and when considering the oxygen demand for the UBOD (FOC2) as it was explained in section 4.4.1Oxygen Uptake Rate (OUR) above. The FOc1 represents the total theoretical oxygen demand even assuming that the non-biodegradable particulate COD fraction was biologically degraded. However, to establish the Speece cone operational conditions of flow velocity and pressure, the FOc2 was used based on the UBOD. The Speece cone was set to deliver (theoretically) a higher amount of the oxygen demand calculated using the FOc2 to make sure the system was not oxygen limited at any moment. Then, the third group of parameters shown in Table 4.7 describes the oxygen gas feed line operational conditions at each operational point ID. It shows the oxygen gas feed line to the cone flow rate, temperature and pressure. The last set of data shown in Table 4.7 describes the COD in, out and removed in the reactor for a better understanding of the overall system performance.
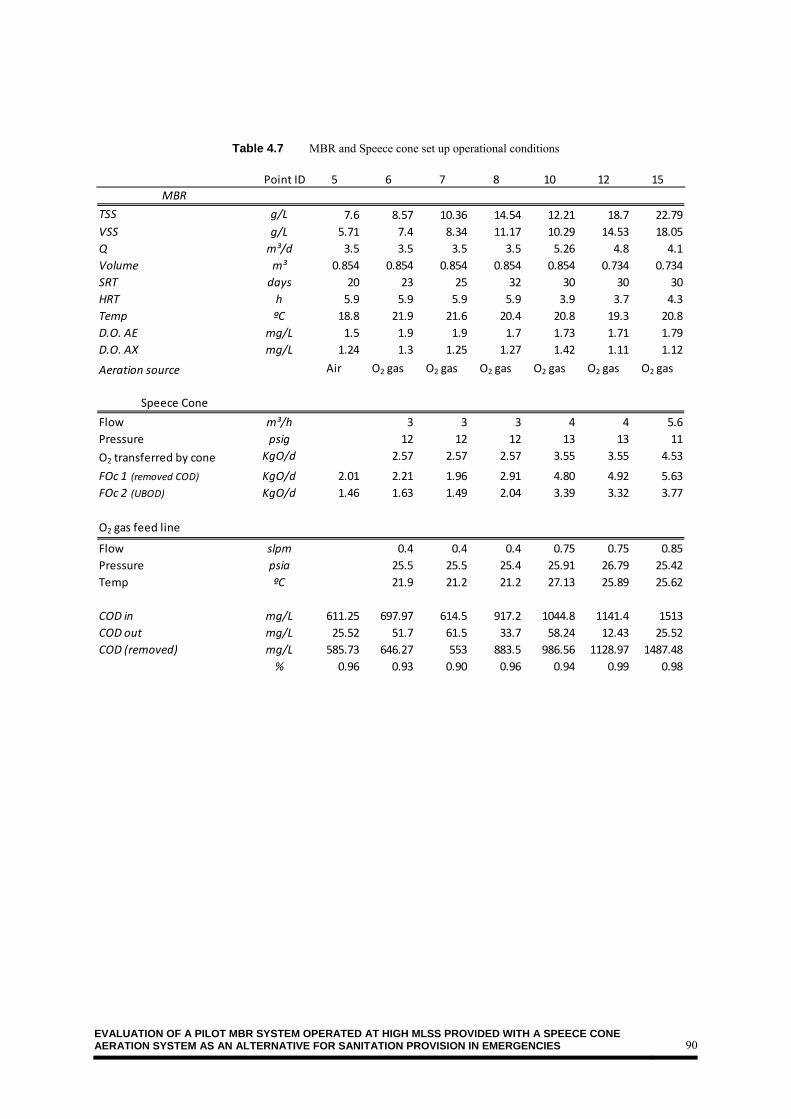
EVALUATION OF A PILOT MBR SYSTEM OPERATED AT HIGH MLSS PROVIDED WITH A SPEECE CONE AERATION SYSTEM AS AN ALTERNATIVE FOR SANITATION PROVISION IN EMERGENCIES 90
Table 4.7 MBR and Speece cone set up operational conditions
5 6 7 8 10 12 15
MBR
TSS g/L 7.6 8.57 10.36 14.54 12.21 18.7 22.79
VSS g/L 5.71 7.4 8.34 11.17 10.29 14.53 18.05
Q m³/d 3.5 3.5 3.5 3.5 5.26 4.8 4.1
Volume m³ 0.854 0.854 0.854 0.854 0.854 0.734 0.734
SRT days 20 23 25 32 30 30 30
HRT h 5.9 5.9 5.9 5.9 3.9 3.7 4.3
Temp ºC 18.8 21.9 21.6 20.4 20.8 19.3 20.8
D.O. AE mg/L 1.5 1.9 1.9 1.7 1.73 1.71 1.79
D.O. AX mg/L 1.24 1.3 1.25 1.27 1.42 1.11 1.12
Aeration source Air O2 gas O2 gas O2 gas O2 gas O2 gas O2 gas
Speece Cone
Flow m³/h 3 3 3 4 4 5.6
Pressure psig 12 12 12 13 13 11
O2 transferred by cone KgO/d 2.57 2.57 2.57 3.55 3.55 4.53
FOc 1 (removed COD) KgO/d 2.01 2.21 1.96 2.91 4.80 4.92 5.63
FOc 2 (UBOD) KgO/d 1.46 1.63 1.49 2.04 3.39 3.32 3.77
O2 gas feed line
Flow slpm 0.4 0.4 0.4 0.75 0.75 0.85
Pressure psia 25.5 25.5 25.4 25.91 26.79 25.42
Temp ºC 21.9 21.2 21.2 27.13 25.89 25.62
COD in mg/L 611.25 697.97 614.5 917.2 1044.8 1141.4 1513
COD out mg/L 25.52 51.7 61.5 33.7 58.24 12.43 25.52
COD (removed) mg/L 585.73 646.27 553 883.5 986.56 1128.97 1487.48
% 0.96 0.93 0.90 0.96 0.94 0.99 0.98
Point ID

EVALUATION OF A PILOT MBR SYSTEM OPERATED AT HIGH MLSS PROVIDED WITH A SPEECE CONE AERATION SYSTEM AS AN ALTERNATIVE FOR SANITATION PROVISION IN EMERGENCIES 91
Figure 4.46 Speece cone manufacturer's data chart for Oxygen mass transfer The amount of dissolved oxygen supplied by the coarse bubble diffusers of the membrane scouring system was calculated. The calculations are shown in Table 4.8. The amount of dissolved oxygen supplied by the scouring system was approximately equal to 0.08 KgO/d. That is, the amount of dissolve oxygen supplied by the scouring system can be considered negligible compared to the total dissolved oxygen requirements.
Table 4.8 Calculated Oxygen mass flow from MBR membrane scouring system.
In addition to the advantages shown by the Speece cone system on dissolved oxygen transfer, the amount of foam produced by the MBR system was considerably reduced when switching the aeration systems from conventional fine bubble aeration to the Speece cone which was crucial for conducting this research. The foam severely affected the level sensors in this particular setup disrupting the MBR system early operation.
0
2
4
6
8
10
12
0.00
0.14
0.28
0.41
0.55
0.69
0.83
0.97
1.10
1.24
1.38
1.52
1.66
1.79
1.93
2.07
Oxygen Addition (kg/day)
Cone Pressure (bar g)
ECO2 Speece Cone Oxygen Dissolution Capacity vs Cone Pressure
7 m3/h
6.5 m3/h
6 m3/h
5 m3/h
4 m3/h
3 m3/h
2 m3/h
Nominal Air discharge @ 250mbar lpm 205
Dynamic Air discharge @147mbar lpm 275
O 2 /Air 0.21
Diffuser eff % 5
Alpha 0.2
O2 lpm 0.5775
Transferred O 2 mol/min 0.003
Temp ºC 20
Oxygen mass flow KgO/d 0.08

EVALUATION OF A PILOT MBR SYSTEM OPERATED AT HIGH MLSS PROVIDED WITH A SPEECE CONE AERATION SYSTEM AS AN ALTERNATIVE FOR SANITATION PROVISION IN EMERGENCIES 92
4.5. Full scale application feasibility
4.5.1. Supporting biomass growth Operating a MBR system at high MLSS concentrations shows several advantages in terms of treatment capacity. In addition, there may be a MLSS concentration range at which the permeability improves and the required pressure for a given flux is lower than at lower MLSS. However, the system needs to be fed with a high strength influent wastewater to support such biomass growth up to the desired high MLSS. Industrial effluents or even black water produced in post emergency settlements appear to be very good options for this application. In addition, the required applied load can be compensated by increasing the flow rate (reducing the HRT). According to the results obtained in this research, high COD removal efficiencies were observed at HRT as low as approximately 3 hours. When working at high flow rates the membrane capabilities (especially in terms of achievable fluxes) may be a limiting factor. The maximum allowable flux and membrane pressure need to be better determined when operating at such high MLSS range (above 15 g/L). 4.5.2. Using convention aeration systems or concentrated oxygen delivery systems For the lower range of MLSS concentrations the conventional aeration methods might be the best option for supplying dissolved oxygen. The required oxygen mass flow can be delivered using either mechanical aerators or low pressure blowers. In the middle to high MLSS range the concentrated oxygen delivery systems such as the Speece cone may become economically feasible as an aeration method for wastewater treatment. The alpha factor decreases almost to zero at MLSS concentrations of approximately 20g/L and higher using conventional aeration methods (Henze, 2008). In terms of mechanical complexity, the Speece cone configuration is not very different from a low pressure blower. The Speece cone system requires a positive displacement pump to run the sludge recycle stream and an oxygen source that can be either oxygen gas from cylinders or enriched oxygen from air filters (nitrogen filters). Naturally, using pure oxygen can be more expensive than pumping just atmospheric air. However, an extra power input for a conventional blower is required for supplying the required mass of oxygen since air is only approximately 21% oxygen. That is, a larger air volume has to be pumped (compressed) increasing the blower power needs. There are some additional advantages for operating an MBR at high MLSS including reduction on the required system volume (CapEx), the possible reduction on power needs (of a sludge pump compared to a blower), and reduction on subsequent sludge treatment and disposal costs (OpEx). These possible cost reductions may compensate for the additional oxygen costs. Another scenario where the concentrated oxygen delivery system may show great potential is on upgrading existing wastewater treatment facilities. Whenever the treatment capacity needs to be increased in a CAS or MBR system, the high MLSS MBR fed with pure oxygen may be a very attractive option. In this scenario most of the required infrastructure (CapEx) would be already in place. The treatment capacity can be easily increased by providing additional membranes, moving up in the MLSS range (and modifying the aeration method) investing probably less compared to the cost of building a whole new additional treatment train or even a new treatment system to cope with the increased treatment demand.

EVALUATION OF A PILOT MBR SYSTEM OPERATED AT HIGH MLSS PROVIDED WITH A SPEECE CONE AERATION SYSTEM AS AN ALTERNATIVE FOR SANITATION PROVISION IN EMERGENCIES 93
Operating a pilot scale MBR systems at high MLSS provided with a Speece cone system as an alternative aeration method demonstrated not only to be feasible, but also more favorable for special conditions such as when dealing with high strength wastewater (as for instance in emergency sanitation provision). The pilot MBR showed high COD removal efficiency (>90%) even at HRT as low as 3.4 hours. High MLSS MBRs present a good alternative for high strength wastewater treatment (as in emergency sanitation provision) due to the lower volume requirements and better operational flexibility compared to existing and conventional wastewater treatment systems. Variations on incoming flow and substrate concentration can be easily handled. The treatment capacity can be increased by just increasing the operational set point at higher MLSS. When running at high MLSS and short HRT (and at a long SRT), less amount of waste sludge is produced. This is particularly attractive for movable applications such as in emergency sanitation since there is less subsequent sludge treatment and disposal requirements. The measured OUR matched well with the theoretical calculated values as the MLSS increased. OUR values as high as 150 mg/L/h were reported at steady operation and even higher than 300 mg/L/hr at the last set point ID. The observed high COD removal efficiencies also supports the high OUR results. The filterability in general was poor for all the measured range with ΔR20values always above 1x10¹² m-1. However, a decreasing tendency for ΔR20 was observed with increasing MLSS starting at 10 g/L MLSS where the sludge filterability starts to improve. Sodium acetate addition at high concentrations (>900 mg/L) is not recommended as an external carbon source since it disrupts the sludge properties and drastically affect the membrane permeability. It is recommended to explore other membrane capabilities from different manufacturers and models in the MLSS range above 15 g/L. The membrane capabilities will determine the future limits for applications of the high MLSS MBR concept. The Speece cone set up proved to be an effective technology for delivering the required oxygen mass flow to the reactor. In fact, the observed transfer efficiency was so high that extra attention was needed to avoid unnecessary increases in the dissolved oxygen concentration.
CHAPTER 5
Conclusions

EVALUATION OF A PILOT MBR SYSTEM OPERATED AT HIGH MLSS PROVIDED WITH A SPEECE CONE AERATION SYSTEM AS AN ALTERNATIVE FOR SANITATION PROVISION IN EMERGENCIES 94
This aeration system coupled to the high MLSS MBR concept exhibits a great potential for existing treatment facilities upgrades. That is, together with a membrane and hydraulic upgrade, higher organic loads can be treated using the existing aerobic reaction volumes.

EVALUATION OF A PILOT MBR SYSTEM OPERATED AT HIGH MLSS PROVIDED WITH A SPEECE CONE AERATION SYSTEM AS AN ALTERNATIVE FOR SANITATION PROVISION IN EMERGENCIES 95
References Ando, V. (2013). Influence of suspended solids concentration on oxygen transfer in a membrane bioreactor
operated at short solids retention time. Unesco-IHE, Delft. Available from http://worldcat.org /z-wcorg/ database.
Ashley, K., Mavinic, D., & Hall, K. (2008). Oxygenation performance of a laboratory-scale Speece Cone hypolimnetic aerator: preliminary assessment. Canadian Journal of Civil Engineering, 35(7), 663-675.
Awwa, A. (1998). Standard methods for the examination of water and wastewater. Washington, DC Standard Methods for the Examination of Water and Wastewater, 20.
Bilal, Z. (2013). Novel alternative for aeration in the treatment of wastewater by membrane bioreactors operated at high biomass concentrations in the context of emergency sanitation. Unesco-IHE, Delft. Available from http://worldcat.org /z-wcorg/ database.
Drews, A. (2010). Membrane fouling in membrane bioreactors—Characterisation, contradictions, cause and cures. Journal of Membrane Science, 363(1–2), 1-28. doi: http://dx.doi.org/10.1016/j.memsci.2010.06.046
Evenblij, H. (2006). Filtration characteristics in membrane bioreactors. Garcia-Ochoa, F., & Gomez, E. (2009). Bioreactor scale-up and oxygen transfer rate in microbial processes: an
overview. Biotechnology advances, 27(2), 153-176. Geilvoet, S. P. (2010). The Delft Filtration Characterisation method: Assessing membrane bioreactor activated
sludge filterability. Gil, J. A., Krzeminski, P., van Lier, J. B., van der Graaf, J. H. J. M., Wijffels, T., & Prats, D. (2011). Analysis of
the filterability in industrial MBRs. Influence of activated sludge parameters and constituents on filterability. Journal of Membrane Science, 385–386(0), 96-109. doi: http://dx.doi.org/10.1016/j.memsci.2011.09.030
Henze, M. (2008). Biological wastewater treatment: principles, modelling and design: IWA publishing. Judd, S. (2010). The MBR book: principles and applications of membrane bioreactors for water and wastewater
treatment: Elsevier. Kappeler, J., & Gujer, W. (1994). Development of a mathematical model for “aerobic bulking”. Water Research,
28(2), 303-310. Le-Clech, P., Chen, V., & Fane, T. A. (2006). Fouling in membrane bioreactors used in wastewater treatment.
Journal of Membrane Science, 284(1), 17-53. Lousada-Ferreira, M., Geilvoet, S., Moreau, A., Atasoy, E., Krzeminski, P., van Nieuwenhuijzen, A., & van der
Graaf, J. (2010). MLSS concentration: still a poorly understood parameter in MBR filterability. Desalination, 250(2), 618-622.
Makgatha, C. (2014). Evaluating a supersaturated aeration system for treatment of highly concentrated blackwater in emergency settings. UNESCO-IHE.
Metcalf, L., Eddy, H. P., & Tchobanoglous, G. (1972). Wastewater engineering: treatment, disposal, and reuse: McGraw-Hill.
Sollfrank, U., & Gujer, W. (1990). Simultaneous determination of oxygen uptake rate and oxygen transfer coefficient in activated sludge systems by an on-line method. Water Research, 24(6), 725-732.
Spanjers, H., Vanrolleghem, P., Olsson, G., & Dold, P. (1998). Respirometry in control of the activated sludge process: Principles: International Association on Water Quality.
Speece, R. E. (1972). DOWNFLOW BUBBLE CONTACT AERATION APPARATUS AND METHOD: Google Patents.
Yoon, S.-H., Kim, H.-S., & Yeom, I.-T. (2004). The optimum operational condition of membrane bioreactor (MBR): cost estimation of aeration and sludge treatment. Water Research, 38(1), 37-46. doi: http://dx.doi.org/10.1016/j.watres.2003.09.001

EVALUATION OF A PILOT MBR SYSTEM OPERATED AT HIGH MLSS PROVIDED WITH A SPEECE CONE AERATION SYSTEM AS AN ALTERNATIVE FOR SANITATION PROVISION IN EMERGENCIES 96
Appendices