Embed Size (px)
Citation preview
EVALUATION OF A NEW JERSEY SAFETY
SHAPE, SEGMENTED CONCRETE BARRIER FOR
USE ON COMPOSITE PANEL BRIDGE DECKS
Submitted by
Cody S. StolleUndergraduate Research Assistant
Karla A. Polivka, M.S.M.E., E.I.T.Research Associate Engineer
Ronald K. Faller, Ph.D., P.E.Research Assistant Professor
John R. Rohde, Ph.D., P.E.Associate Professor
Dean L. Sicking, Ph.D., P.E.Professor and MwRSF Director
MIDWEST ROADSIDE SAFETY FACILITYUniversity of Nebraska-Lincoln
527 Nebraska HallLincoln, Nebraska 68588-0529
(402) 472-6864
Submitted to
MIDWEST STATES REGIONAL POOLED FUND PROGRAMNebraska Department of Roads
1500 Nebraska Highway 2Lincoln, Nebraska 68502
MwRSF Research Report No. TRP-03-181-07
June 5, 2007
Technical Report Documentation Page1. Report No. 2. 3. Recipient’s Accession No.
TRP-03-181-074. Title and Subtitle 5. Report Date
EVALUATION OF A NEW JERSEY SAFETY SHAPE,SEGMENTED CONCRETE BARRIER FOR USE ONCOMPOSITE PANEL BRIDGE DECKS
June 5, 20076.
7. Author(s) 8. Performing Organization Report No.
Stolle, C.S., Polivka, K.A., Faller, R.K., Rohde, J.R., andSicking, D.L.
TRP-03-181-07
9. Performing Organization Name and Address 10. Project/Task/Work Unit No.
Midwest Roadside Safety Facility (MwRSF)University of Nebraska-Lincoln527 Nebraska HallLincoln, NE 68588-0529
11. Contract © or Grant (G) No.
12. Sponsoring Organization Name and Address 13. Type of Report and Period Covered
Kansas Department of TransportationBureau of Materials and Research2300 S.W. Van Buren StreetTopeka, Kansas 66611-1195
Final Report 1999-200714. Sponsoring Agency Code
15. Supplementary Notes
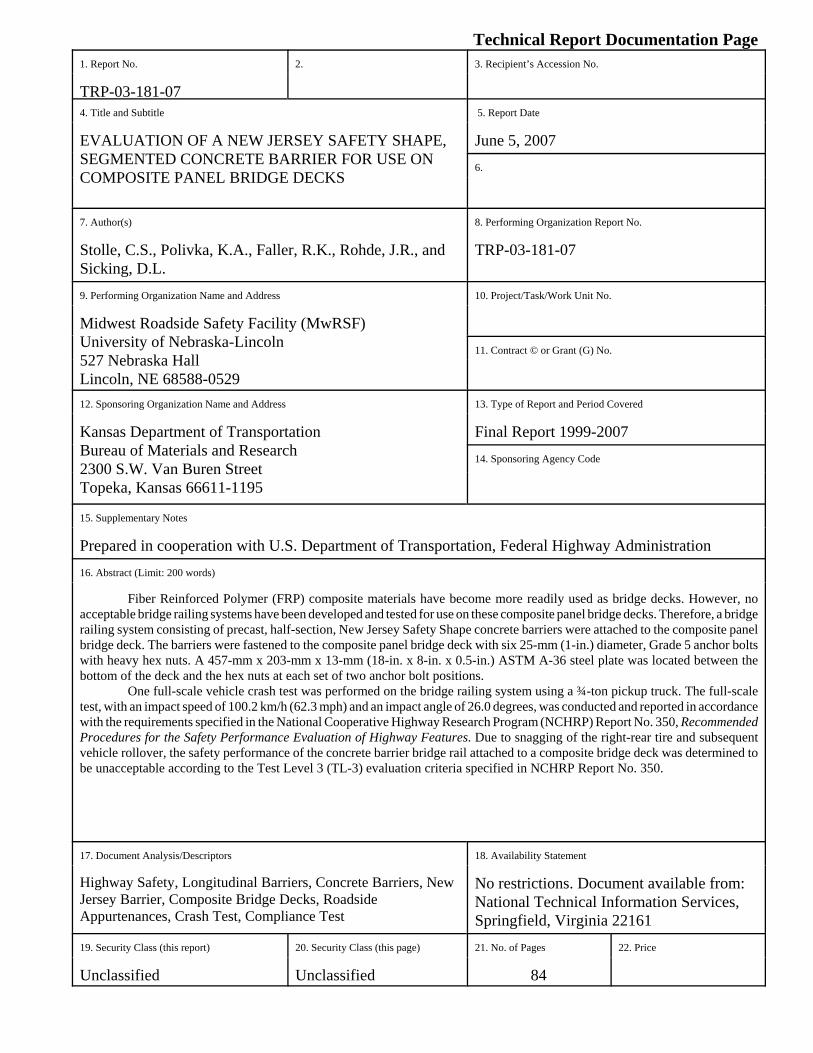
Prepared in cooperation with U.S. Department of Transportation, Federal Highway Administration16. Abstract (Limit: 200 words)
Fiber Reinforced Polymer (FRP) composite materials have become more readily used as bridge decks. However, noacceptable bridge railing systems have been developed and tested for use on these composite panel bridge decks. Therefore, a bridgerailing system consisting of precast, half-section, New Jersey Safety Shape concrete barriers were attached to the composite panelbridge deck. The barriers were fastened to the composite panel bridge deck with six 25-mm (1-in.) diameter, Grade 5 anchor boltswith heavy hex nuts. A 457-mm x 203-mm x 13-mm (18-in. x 8-in. x 0.5-in.) ASTM A-36 steel plate was located between thebottom of the deck and the hex nuts at each set of two anchor bolt positions.
One full-scale vehicle crash test was performed on the bridge railing system using a ¾-ton pickup truck. The full-scaletest, with an impact speed of 100.2 km/h (62.3 mph) and an impact angle of 26.0 degrees, was conducted and reported in accordancewith the requirements specified in the National Cooperative Highway Research Program (NCHRP) Report No. 350, RecommendedProcedures for the Safety Performance Evaluation of Highway Features. Due to snagging of the right-rear tire and subsequentvehicle rollover, the safety performance of the concrete barrier bridge rail attached to a composite bridge deck was determined tobe unacceptable according to the Test Level 3 (TL-3) evaluation criteria specified in NCHRP Report No. 350.
17. Document Analysis/Descriptors 18. Availability Statement
Highway Safety, Longitudinal Barriers, Concrete Barriers, NewJersey Barrier, Composite Bridge Decks, RoadsideAppurtenances, Crash Test, Compliance Test
No restrictions. Document available from:National Technical Information Services,Springfield, Virginia 22161
19. Security Class (this report) 20. Security Class (this page) 21. No. of Pages 22. Price
Unclassified Unclassified 84

ii
DISCLAIMER STATEMENT
The contents of this report reflect the views of the authors who are responsible for the facts
and the accuracy of the data presented herein. The contents do not necessarily reflect the official
views nor policies of the Kansas Department of Transportation nor the Federal Highway
Administration. This report does not constitute a standard, specification, or regulation.
iii
ACKNOWLEDGMENTS
The authors wish to acknowledge several sources that made a contribution to this project:
(1) the Kansas Department of Transportation for sponsoring this project and supplying the concrete
parapets; (2) Kansas Structural Composites, Inc. (KSCI) of Russell, Kansas for supplying the FRP
deck panels, installing the girders and panels, and providing guidance; (3) BG Consultants, Inc. of
Manhattan, Kansas for design guidance and project support; and (4) MwRSF personnel for
conducting the crash test.
A special thanks is also given to the following individuals who made a contribution to the
completion of this research project.
Midwest Roadside Safety Facility
J.D. Reid, Ph.D., Associate ProfessorJ.C. Holloway, M.S.C.E., E.I.T., Research ManagerB.W. Bielenberg, M.S.M.E., E.I.T.C.L. Meyer, B.S.M.E., E.I.T., Research Engineer IIA.T. Russell, Laboratory MechanicK.L. Krenk, B.S.M.A., Field Operations ManagerUndergraduate and Graduate Assistants
Kansas Department of Transportation
David E. Meggers, P.E., Research Development Engineer
Kansas Structural Composites, Inc. (KSCI)
Jerry D. Plunkett, Ph.D., President, CEO
BG Consultants, Inc.
Moni G. El-Aasar, Ph.D., P.E., Vice President
Dunlap Photography
James Dunlap, President and Owner
iv
TABLE OF CONTENTSPage
TECHNICAL REPORT DOCUMENTATION PAGE . . . . . . . . . . . . . . . . . . . . . . . . . . . . . . . . . I
DISCLAIMER STATEMENT . . . . . . . . . . . . . . . . . . . . . . . . . . . . . . . . . . . . . . . . . . . . . . . . . . ii
ACKNOWLEDGMENTS . . . . . . . . . . . . . . . . . . . . . . . . . . . . . . . . . . . . . . . . . . . . . . . . . . . . . . iii
TABLE OF CONTENTS . . . . . . . . . . . . . . . . . . . . . . . . . . . . . . . . . . . . . . . . . . . . . . . . . . . . . . . ivList of Figures . . . . . . . . . . . . . . . . . . . . . . . . . . . . . . . . . . . . . . . . . . . . . . . . . . . . . . . . . viList of Tables . . . . . . . . . . . . . . . . . . . . . . . . . . . . . . . . . . . . . . . . . . . . . . . . . . . . . . . . . viii
1 INTRODUCTION . . . . . . . . . . . . . . . . . . . . . . . . . . . . . . . . . . . . . . . . . . . . . . . . . . . . . . . . . . . 11.1 Problem Statement . . . . . . . . . . . . . . . . . . . . . . . . . . . . . . . . . . . . . . . . . . . . . . . . . . . . 11.2 Objective . . . . . . . . . . . . . . . . . . . . . . . . . . . . . . . . . . . . . . . . . . . . . . . . . . . . . . . . . . . 11.3 Scope . . . . . . . . . . . . . . . . . . . . . . . . . . . . . . . . . . . . . . . . . . . . . . . . . . . . . . . . . . . . . . 2
2 TEST REQUIREMENTS AND EVALUATION CRITERIA . . . . . . . . . . . . . . . . . . . . . . . . . . 32.1 Test Requirements . . . . . . . . . . . . . . . . . . . . . . . . . . . . . . . . . . . . . . . . . . . . . . . . . . . . 32.2 Evaluation Criteria . . . . . . . . . . . . . . . . . . . . . . . . . . . . . . . . . . . . . . . . . . . . . . . . . . . . 3
3 DESIGN DETAILS . . . . . . . . . . . . . . . . . . . . . . . . . . . . . . . . . . . . . . . . . . . . . . . . . . . . . . . . . . 6
4 TEST CONDITIONS . . . . . . . . . . . . . . . . . . . . . . . . . . . . . . . . . . . . . . . . . . . . . . . . . . . . . . . . 264.1 Test Facility . . . . . . . . . . . . . . . . . . . . . . . . . . . . . . . . . . . . . . . . . . . . . . . . . . . . . . . . 264.2 Vehicle Tow and Guidance System . . . . . . . . . . . . . . . . . . . . . . . . . . . . . . . . . . . . . . 264.3 Test Vehicles . . . . . . . . . . . . . . . . . . . . . . . . . . . . . . . . . . . . . . . . . . . . . . . . . . . . . . . 264.4 Data Acquisition Systems . . . . . . . . . . . . . . . . . . . . . . . . . . . . . . . . . . . . . . . . . . . . . 29
4.4.1 Accelerometers . . . . . . . . . . . . . . . . . . . . . . . . . . . . . . . . . . . . . . . . . . . . . . 294.4.2 Rate Transducers . . . . . . . . . . . . . . . . . . . . . . . . . . . . . . . . . . . . . . . . . . . . . 314.4.3 High-Speed Photography . . . . . . . . . . . . . . . . . . . . . . . . . . . . . . . . . . . . . . 314.4.4 Pressure Tape Switches . . . . . . . . . . . . . . . . . . . . . . . . . . . . . . . . . . . . . . . 32
5 CRASH TEST . . . . . . . . . . . . . . . . . . . . . . . . . . . . . . . . . . . . . . . . . . . . . . . . . . . . . . . . . . . . . . 345.1 Test KSC-1 . . . . . . . . . . . . . . . . . . . . . . . . . . . . . . . . . . . . . . . . . . . . . . . . . . . . . . . . . 345.2 Test Description . . . . . . . . . . . . . . . . . . . . . . . . . . . . . . . . . . . . . . . . . . . . . . . . . . . . . 345.3 Barrier Damage . . . . . . . . . . . . . . . . . . . . . . . . . . . . . . . . . . . . . . . . . . . . . . . . . . . . . 365.4 Vehicle Damage . . . . . . . . . . . . . . . . . . . . . . . . . . . . . . . . . . . . . . . . . . . . . . . . . . . . . 385.5 Occupant Risk Values . . . . . . . . . . . . . . . . . . . . . . . . . . . . . . . . . . . . . . . . . . . . . . . . 395.6 Discussion . . . . . . . . . . . . . . . . . . . . . . . . . . . . . . . . . . . . . . . . . . . . . . . . . . . . . . . . . 40
6 SUMMARY, DISCUSSION, AND CONCLUSIONS . . . . . . . . . . . . . . . . . . . . . . . . . . . . . . . 66
v
7 RECOMMENDATIONS . . . . . . . . . . . . . . . . . . . . . . . . . . . . . . . . . . . . . . . . . . . . . . . . . . . . . 69
8 REFERENCES . . . . . . . . . . . . . . . . . . . . . . . . . . . . . . . . . . . . . . . . . . . . . . . . . . . . . . . . . . . . . 70
9 APPENDICES . . . . . . . . . . . . . . . . . . . . . . . . . . . . . . . . . . . . . . . . . . . . . . . . . . . . . . . . . . . . . 71APPENDIX A - Test Summary Sheet in English Units . . . . . . . . . . . . . . . . . . . . . . . . . 72APPENDIX B - Occupant Compartment Deformation Data, Test KSC-1 . . . . . . . . . . . 74APPENDIX C - Accelerometer and Rate Transducer Data Analysis, Test KSC-1 . . . . 77
vi
List of FiguresPage
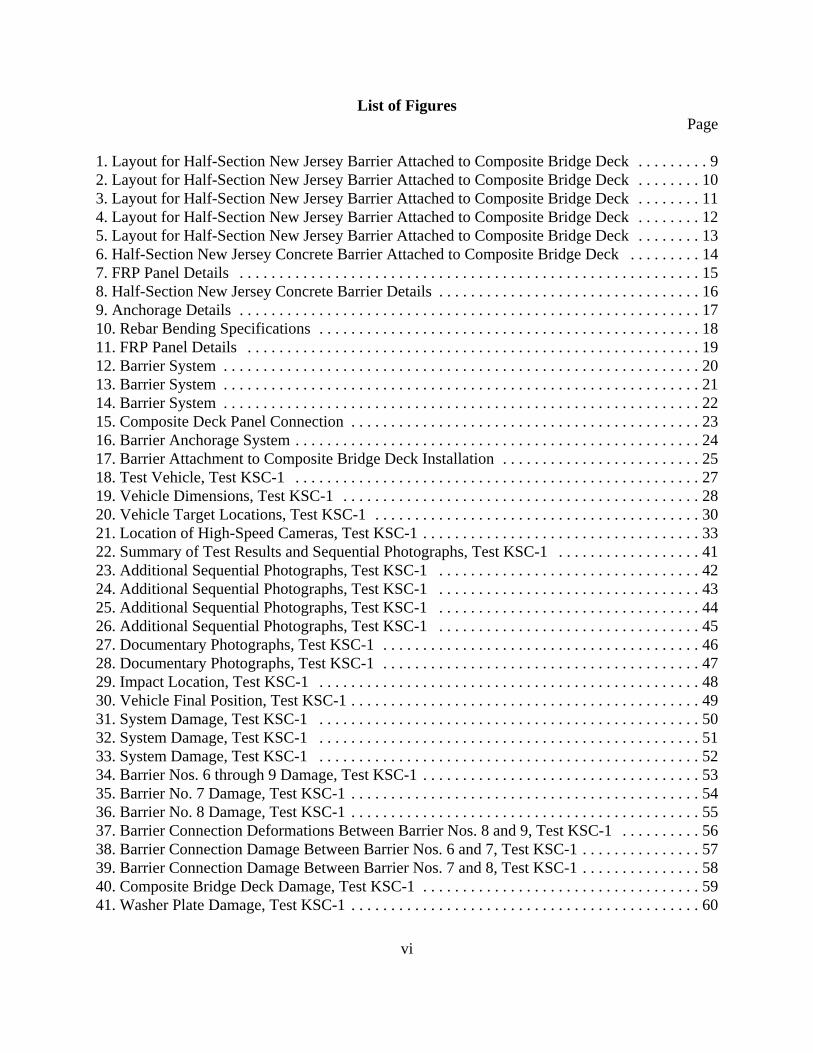
1. Layout for Half-Section New Jersey Barrier Attached to Composite Bridge Deck . . . . . . . . . 92. Layout for Half-Section New Jersey Barrier Attached to Composite Bridge Deck . . . . . . . . 103. Layout for Half-Section New Jersey Barrier Attached to Composite Bridge Deck . . . . . . . . 114. Layout for Half-Section New Jersey Barrier Attached to Composite Bridge Deck . . . . . . . . 125. Layout for Half-Section New Jersey Barrier Attached to Composite Bridge Deck . . . . . . . . 136. Half-Section New Jersey Concrete Barrier Attached to Composite Bridge Deck . . . . . . . . . 147. FRP Panel Details . . . . . . . . . . . . . . . . . . . . . . . . . . . . . . . . . . . . . . . . . . . . . . . . . . . . . . . . . . 158. Half-Section New Jersey Concrete Barrier Details . . . . . . . . . . . . . . . . . . . . . . . . . . . . . . . . . 169. Anchorage Details . . . . . . . . . . . . . . . . . . . . . . . . . . . . . . . . . . . . . . . . . . . . . . . . . . . . . . . . . . 1710. Rebar Bending Specifications . . . . . . . . . . . . . . . . . . . . . . . . . . . . . . . . . . . . . . . . . . . . . . . . 1811. FRP Panel Details . . . . . . . . . . . . . . . . . . . . . . . . . . . . . . . . . . . . . . . . . . . . . . . . . . . . . . . . . 1912. Barrier System . . . . . . . . . . . . . . . . . . . . . . . . . . . . . . . . . . . . . . . . . . . . . . . . . . . . . . . . . . . . 2013. Barrier System . . . . . . . . . . . . . . . . . . . . . . . . . . . . . . . . . . . . . . . . . . . . . . . . . . . . . . . . . . . . 2114. Barrier System . . . . . . . . . . . . . . . . . . . . . . . . . . . . . . . . . . . . . . . . . . . . . . . . . . . . . . . . . . . . 2215. Composite Deck Panel Connection . . . . . . . . . . . . . . . . . . . . . . . . . . . . . . . . . . . . . . . . . . . . 2316. Barrier Anchorage System . . . . . . . . . . . . . . . . . . . . . . . . . . . . . . . . . . . . . . . . . . . . . . . . . . . 2417. Barrier Attachment to Composite Bridge Deck Installation . . . . . . . . . . . . . . . . . . . . . . . . . 2518. Test Vehicle, Test KSC-1 . . . . . . . . . . . . . . . . . . . . . . . . . . . . . . . . . . . . . . . . . . . . . . . . . . . 2719. Vehicle Dimensions, Test KSC-1 . . . . . . . . . . . . . . . . . . . . . . . . . . . . . . . . . . . . . . . . . . . . . 2820. Vehicle Target Locations, Test KSC-1 . . . . . . . . . . . . . . . . . . . . . . . . . . . . . . . . . . . . . . . . . 3021. Location of High-Speed Cameras, Test KSC-1 . . . . . . . . . . . . . . . . . . . . . . . . . . . . . . . . . . . 3322. Summary of Test Results and Sequential Photographs, Test KSC-1 . . . . . . . . . . . . . . . . . . 4123. Additional Sequential Photographs, Test KSC-1 . . . . . . . . . . . . . . . . . . . . . . . . . . . . . . . . . 4224. Additional Sequential Photographs, Test KSC-1 . . . . . . . . . . . . . . . . . . . . . . . . . . . . . . . . . 4325. Additional Sequential Photographs, Test KSC-1 . . . . . . . . . . . . . . . . . . . . . . . . . . . . . . . . . 4426. Additional Sequential Photographs, Test KSC-1 . . . . . . . . . . . . . . . . . . . . . . . . . . . . . . . . . 4527. Documentary Photographs, Test KSC-1 . . . . . . . . . . . . . . . . . . . . . . . . . . . . . . . . . . . . . . . . 4628. Documentary Photographs, Test KSC-1 . . . . . . . . . . . . . . . . . . . . . . . . . . . . . . . . . . . . . . . . 4729. Impact Location, Test KSC-1 . . . . . . . . . . . . . . . . . . . . . . . . . . . . . . . . . . . . . . . . . . . . . . . . 4830. Vehicle Final Position, Test KSC-1 . . . . . . . . . . . . . . . . . . . . . . . . . . . . . . . . . . . . . . . . . . . . 4931. System Damage, Test KSC-1 . . . . . . . . . . . . . . . . . . . . . . . . . . . . . . . . . . . . . . . . . . . . . . . . 5032. System Damage, Test KSC-1 . . . . . . . . . . . . . . . . . . . . . . . . . . . . . . . . . . . . . . . . . . . . . . . . 5133. System Damage, Test KSC-1 . . . . . . . . . . . . . . . . . . . . . . . . . . . . . . . . . . . . . . . . . . . . . . . . 5234. Barrier Nos. 6 through 9 Damage, Test KSC-1 . . . . . . . . . . . . . . . . . . . . . . . . . . . . . . . . . . . 5335. Barrier No. 7 Damage, Test KSC-1 . . . . . . . . . . . . . . . . . . . . . . . . . . . . . . . . . . . . . . . . . . . . 5436. Barrier No. 8 Damage, Test KSC-1 . . . . . . . . . . . . . . . . . . . . . . . . . . . . . . . . . . . . . . . . . . . . 5537. Barrier Connection Deformations Between Barrier Nos. 8 and 9, Test KSC-1 . . . . . . . . . . 5638. Barrier Connection Damage Between Barrier Nos. 6 and 7, Test KSC-1 . . . . . . . . . . . . . . . 5739. Barrier Connection Damage Between Barrier Nos. 7 and 8, Test KSC-1 . . . . . . . . . . . . . . . 5840. Composite Bridge Deck Damage, Test KSC-1 . . . . . . . . . . . . . . . . . . . . . . . . . . . . . . . . . . . 5941. Washer Plate Damage, Test KSC-1 . . . . . . . . . . . . . . . . . . . . . . . . . . . . . . . . . . . . . . . . . . . . 60
vii
42. Vehicle Damage, Test KSC-1 . . . . . . . . . . . . . . . . . . . . . . . . . . . . . . . . . . . . . . . . . . . . . . . . 6143. Vehicle Damage, Test KSC-1 . . . . . . . . . . . . . . . . . . . . . . . . . . . . . . . . . . . . . . . . . . . . . . . . 6244. Tire Damage, Test KSC-1 . . . . . . . . . . . . . . . . . . . . . . . . . . . . . . . . . . . . . . . . . . . . . . . . . . . 6345. Vehicle Undercarriage Damage, Test KSC-1 . . . . . . . . . . . . . . . . . . . . . . . . . . . . . . . . . . . . 6446. Occupant Compartment Deformations, Test KSC-1 . . . . . . . . . . . . . . . . . . . . . . . . . . . . . . . 65A-1. Summary of Test Results and Sequential Photographs (English), Test KSC-1 . . . . . . . . . 73B-1. Occupant Compartment Deformation Data, Test KSC-1 . . . . . . . . . . . . . . . . . . . . . . . . . . 74B-2. Occupant Compartment Deformation Index (OCDI), Test KSC-1 . . . . . . . . . . . . . . . . . . . 74C-1. Graph of Longitudinal Deceleration, Test KSC-1 . . . . . . . . . . . . . . . . . . . . . . . . . . . . . . . . 78C-2. Graph of Longitudinal Occupant Impact Velocity, Test KSC-1 . . . . . . . . . . . . . . . . . . . . . 79C-3. Graph of Longitudinal Occupant Displacement, Test KSC-1 . . . . . . . . . . . . . . . . . . . . . . . 80C-4. Graph of Lateral Deceleration, Test KSC-1 . . . . . . . . . . . . . . . . . . . . . . . . . . . . . . . . . . . . 81C-5. Graph of Lateral Occupant Impact Velocity, Test KSC-1 . . . . . . . . . . . . . . . . . . . . . . . . . . 82C-6. Graph of Lateral Occupant Displacement, Test KSC-1 . . . . . . . . . . . . . . . . . . . . . . . . . . . 83C-7. Graph of Roll, Pitch, and Yaw Angular Displacements, Test KSC-1 . . . . . . . . . . . . . . . . . 84
viii
List of TablesPage
1. NCHRP Report No. 350 Test Level 3 Crash Test Conditions . . . . . . . . . . . . . . . . . . . . . . . . . . 42. NCHRP Report No. 350 Evaluation Criteria for Crash Tests . . . . . . . . . . . . . . . . . . . . . . . . . . 53. Summary of Safety Performance Evaluation Results . . . . . . . . . . . . . . . . . . . . . . . . . . . . . . . 68
1
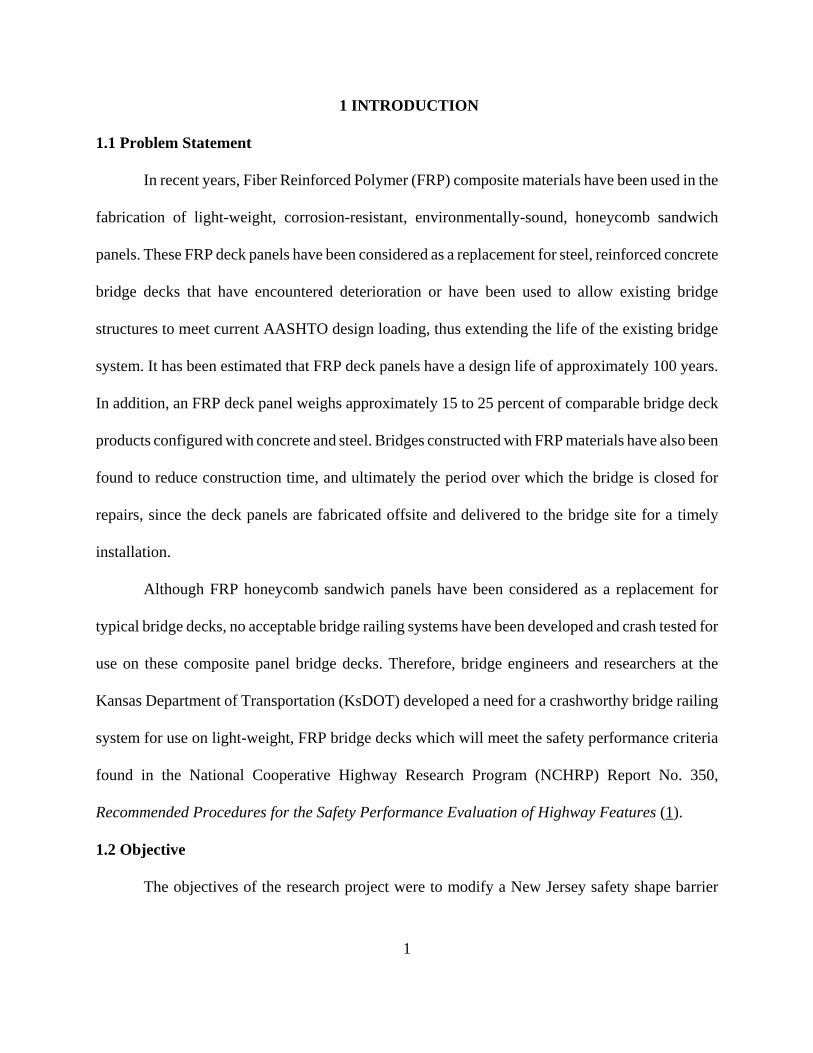
1 INTRODUCTION
1.1 Problem Statement
In recent years, Fiber Reinforced Polymer (FRP) composite materials have been used in the
fabrication of light-weight, corrosion-resistant, environmentally-sound, honeycomb sandwich
panels. These FRP deck panels have been considered as a replacement for steel, reinforced concrete
bridge decks that have encountered deterioration or have been used to allow existing bridge
structures to meet current AASHTO design loading, thus extending the life of the existing bridge
system. It has been estimated that FRP deck panels have a design life of approximately 100 years.
In addition, an FRP deck panel weighs approximately 15 to 25 percent of comparable bridge deck
products configured with concrete and steel. Bridges constructed with FRP materials have also been
found to reduce construction time, and ultimately the period over which the bridge is closed for
repairs, since the deck panels are fabricated offsite and delivered to the bridge site for a timely
installation.
Although FRP honeycomb sandwich panels have been considered as a replacement for
typical bridge decks, no acceptable bridge railing systems have been developed and crash tested for
use on these composite panel bridge decks. Therefore, bridge engineers and researchers at the
Kansas Department of Transportation (KsDOT) developed a need for a crashworthy bridge railing
system for use on light-weight, FRP bridge decks which will meet the safety performance criteria
found in the National Cooperative Highway Research Program (NCHRP) Report No. 350,
Recommended Procedures for the Safety Performance Evaluation of Highway Features (1).
1.2 Objective
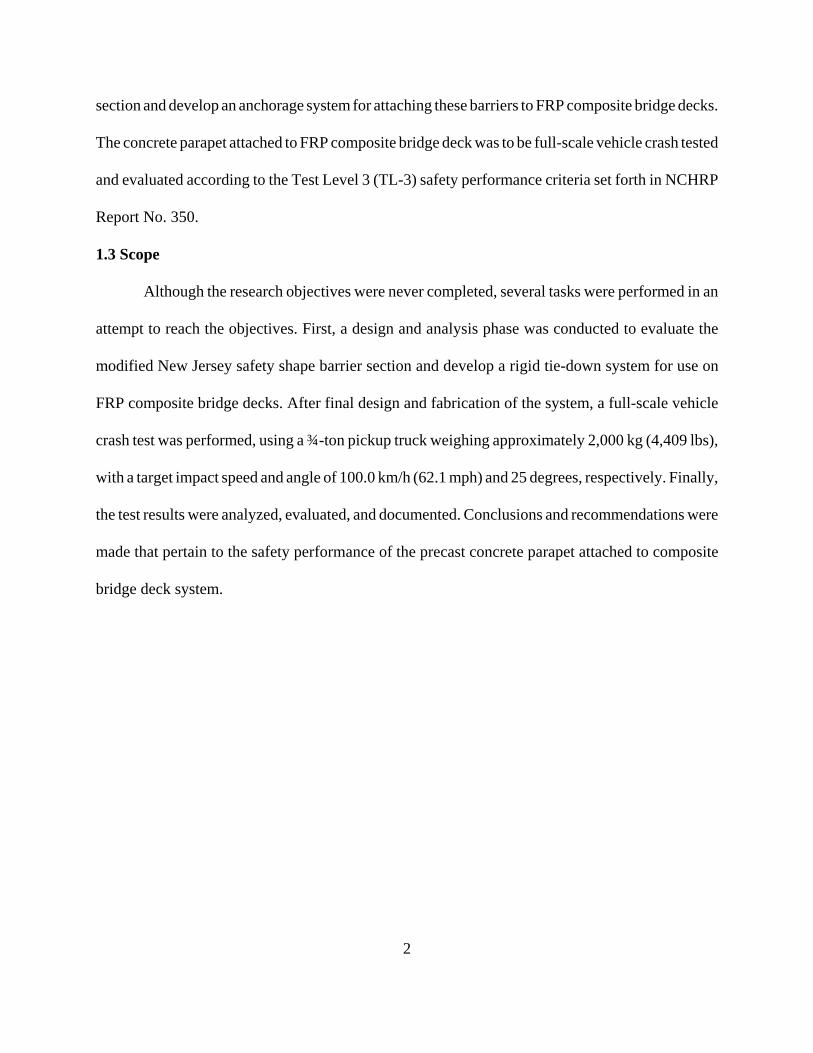
The objectives of the research project were to modify a New Jersey safety shape barrier
2
section and develop an anchorage system for attaching these barriers to FRP composite bridge decks.
The concrete parapet attached to FRP composite bridge deck was to be full-scale vehicle crash tested
and evaluated according to the Test Level 3 (TL-3) safety performance criteria set forth in NCHRP
Report No. 350.
1.3 Scope
Although the research objectives were never completed, several tasks were performed in an
attempt to reach the objectives. First, a design and analysis phase was conducted to evaluate the
modified New Jersey safety shape barrier section and develop a rigid tie-down system for use on
FRP composite bridge decks. After final design and fabrication of the system, a full-scale vehicle
crash test was performed, using a ¾-ton pickup truck weighing approximately 2,000 kg (4,409 lbs),
with a target impact speed and angle of 100.0 km/h (62.1 mph) and 25 degrees, respectively. Finally,
the test results were analyzed, evaluated, and documented. Conclusions and recommendations were
made that pertain to the safety performance of the precast concrete parapet attached to composite
bridge deck system.
3
2 TEST REQUIREMENTS AND EVALUATION CRITERIA
2.1 Test Requirements
Longitudinal barriers, such as bridge rails attached to FRP bridge decks, must satisfy the
requirements provided in NCHRP Report No. 350 to be accepted for use on National Highway
System (NHS) construction projects or as a replacement for existing systems not meeting current
safety standards. According to TL-3 of NCHRP Report No. 350, the longitudinal barriers must be
subjected to two full-scale vehicle crash tests. The two crash tests are as follows:
1. Test Designation 3-10, consisting of an 820-kg (1,808-lb) small carimpacting the bridge rail system at a nominal speed and angle of 100.0 km/h(62.1 mph) and 20 degrees, respectively.
2. Test Designation 3-11, consisting of a 2,000-kg (4,409-lb) pickup truckimpacting the bridge rail system at a nominal speed and angle of 100.0 km/h(62.1 mph) and 25 degrees, respectively.
Rigid New Jersey safety shape barriers struck by small cars have been shown to meet safety
performance standards (3-4). Furthermore, temporary New Jersey safety shape concrete median
barriers have encountered only slight barrier deflections when impacted by small cars (5). Thus, the
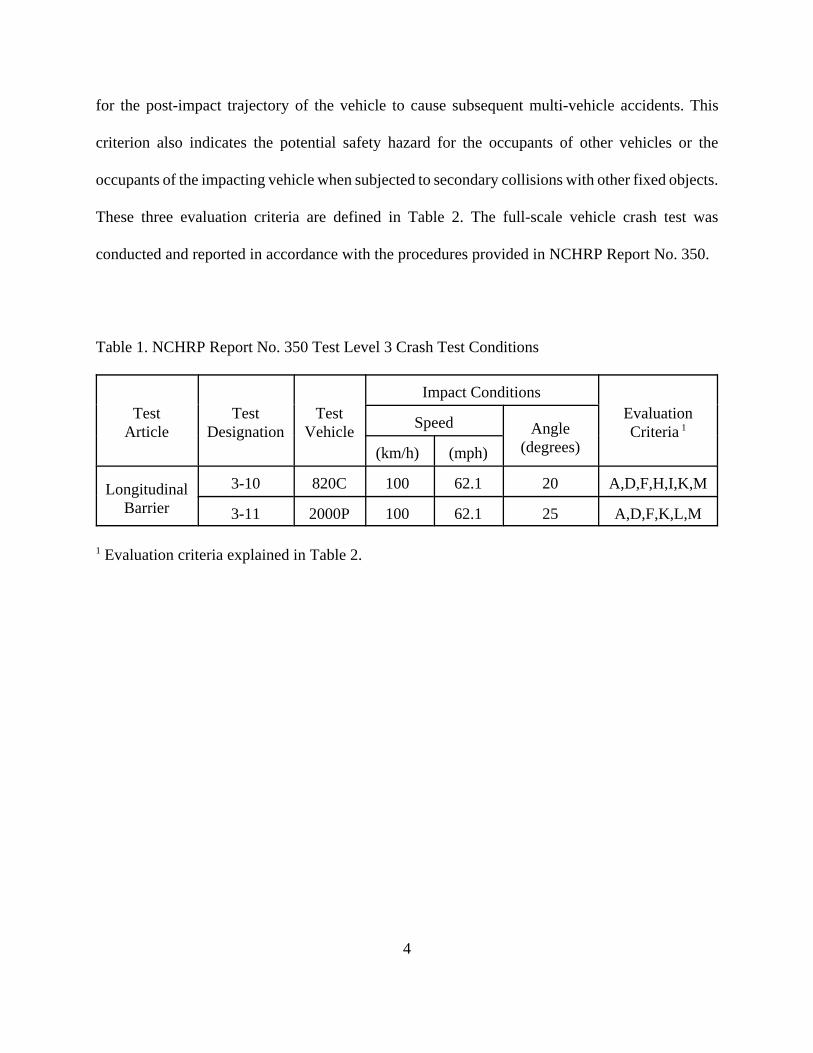
820-kg (1,808-lb) small car test was deemed unnecessary for this project. The test conditions for
TL-3 longitudinal barriers are summarized in Table 1.
2.2 Evaluation Criteria
Evaluation criteria for full-scale vehicle crash testing are based on three appraisal areas: (1)
structural adequacy; (2) occupant risk; and (3) vehicle trajectory after collision. Criteria for
structural adequacy are intended to evaluate the ability of the barrier to contain, redirect, or allow
controlled vehicle penetration in a predictable manner. Occupant risk evaluates the degree of hazard
to occupants in the impacting vehicle. Vehicle trajectory after collision is a measure of the potential
4
for the post-impact trajectory of the vehicle to cause subsequent multi-vehicle accidents. This
criterion also indicates the potential safety hazard for the occupants of other vehicles or the
occupants of the impacting vehicle when subjected to secondary collisions with other fixed objects.
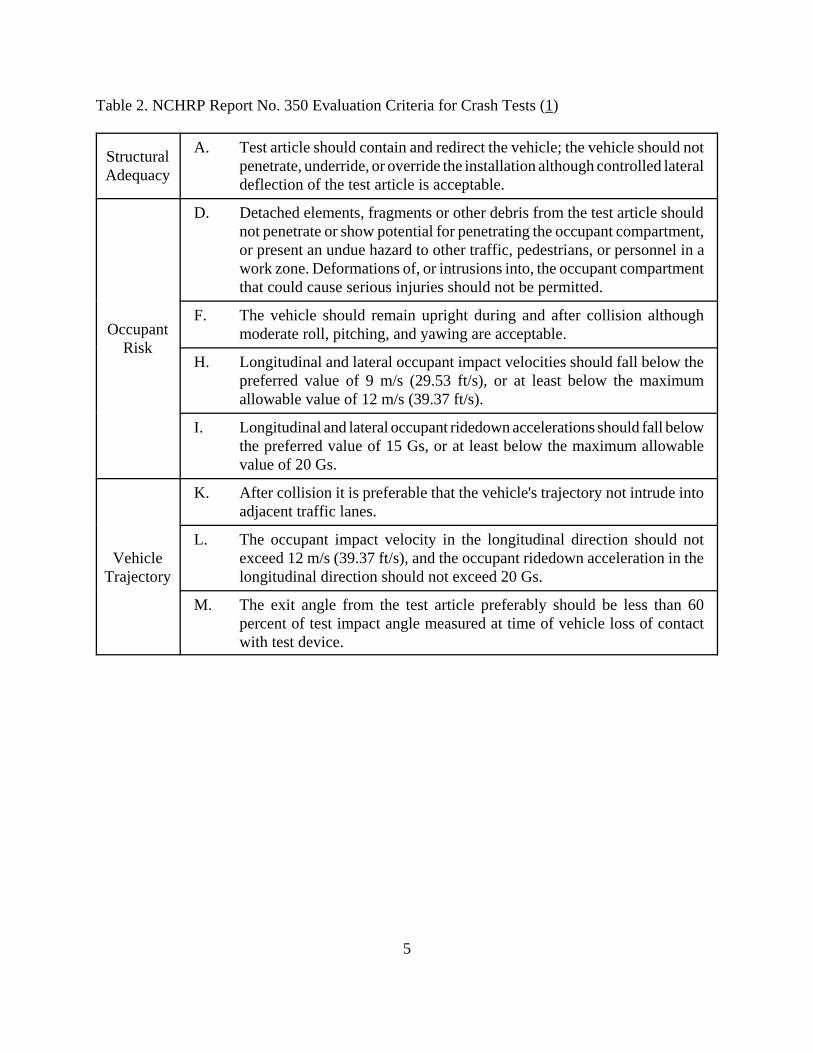
These three evaluation criteria are defined in Table 2. The full-scale vehicle crash test was
conducted and reported in accordance with the procedures provided in NCHRP Report No. 350.
Table 1. NCHRP Report No. 350 Test Level 3 Crash Test Conditions
TestArticle
TestDesignation
TestVehicle
Impact ConditionsEvaluationCriteria 1Speed Angle
(degrees)(km/h) (mph)
LongitudinalBarrier
3-10 820C 100 62.1 20 A,D,F,H,I,K,M
3-11 2000P 100 62.1 25 A,D,F,K,L,M
1 Evaluation criteria explained in Table 2.
5
Table 2. NCHRP Report No. 350 Evaluation Criteria for Crash Tests (1)
StructuralAdequacy
A. Test article should contain and redirect the vehicle; the vehicle should notpenetrate, underride, or override the installation although controlled lateraldeflection of the test article is acceptable.
OccupantRisk
D. Detached elements, fragments or other debris from the test article shouldnot penetrate or show potential for penetrating the occupant compartment,or present an undue hazard to other traffic, pedestrians, or personnel in awork zone. Deformations of, or intrusions into, the occupant compartmentthat could cause serious injuries should not be permitted.
F. The vehicle should remain upright during and after collision althoughmoderate roll, pitching, and yawing are acceptable.
H. Longitudinal and lateral occupant impact velocities should fall below thepreferred value of 9 m/s (29.53 ft/s), or at least below the maximumallowable value of 12 m/s (39.37 ft/s).
I. Longitudinal and lateral occupant ridedown accelerations should fall belowthe preferred value of 15 Gs, or at least below the maximum allowablevalue of 20 Gs.
VehicleTrajectory
K. After collision it is preferable that the vehicle's trajectory not intrude intoadjacent traffic lanes.
L. The occupant impact velocity in the longitudinal direction should notexceed 12 m/s (39.37 ft/s), and the occupant ridedown acceleration in thelongitudinal direction should not exceed 20 Gs.
M. The exit angle from the test article preferably should be less than 60percent of test impact angle measured at time of vehicle loss of contactwith test device.
6
3 DESIGN DETAILS
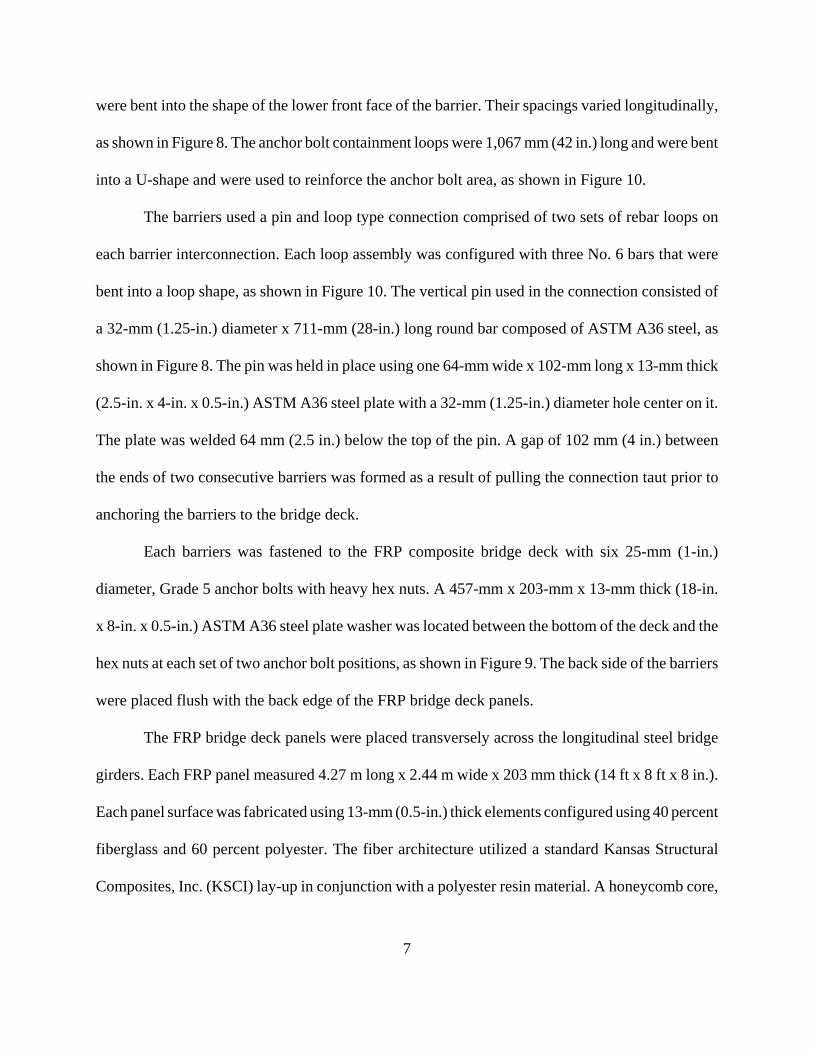
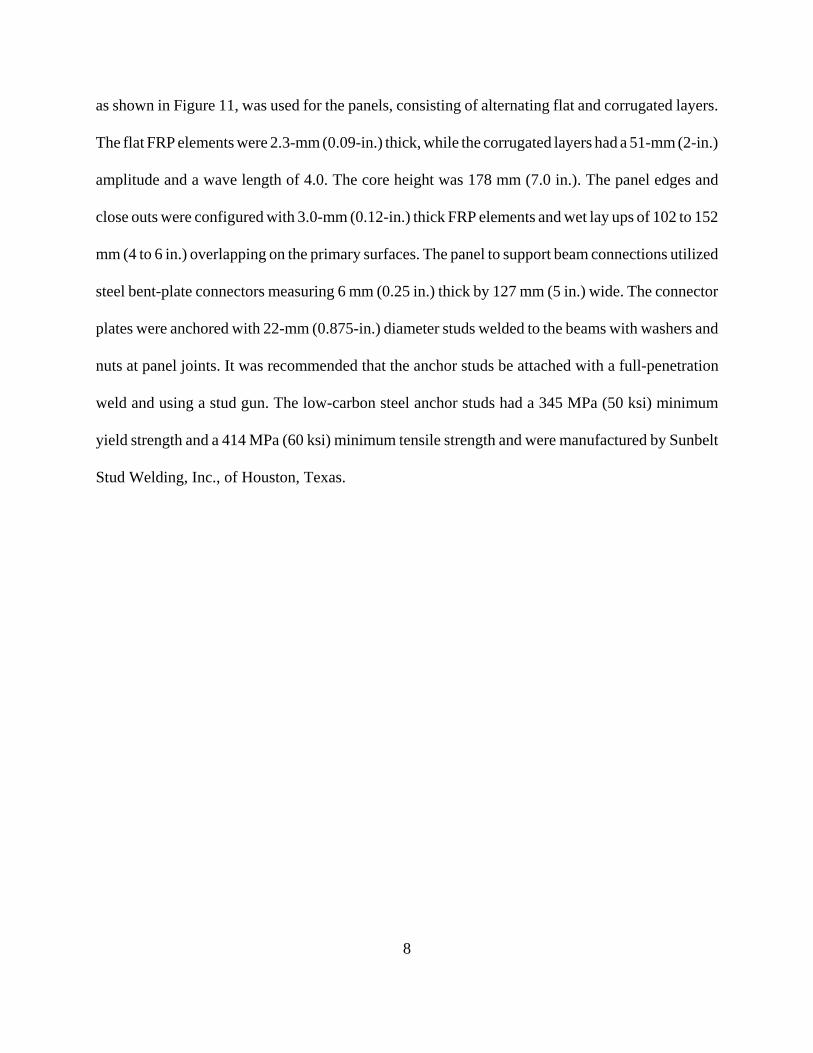
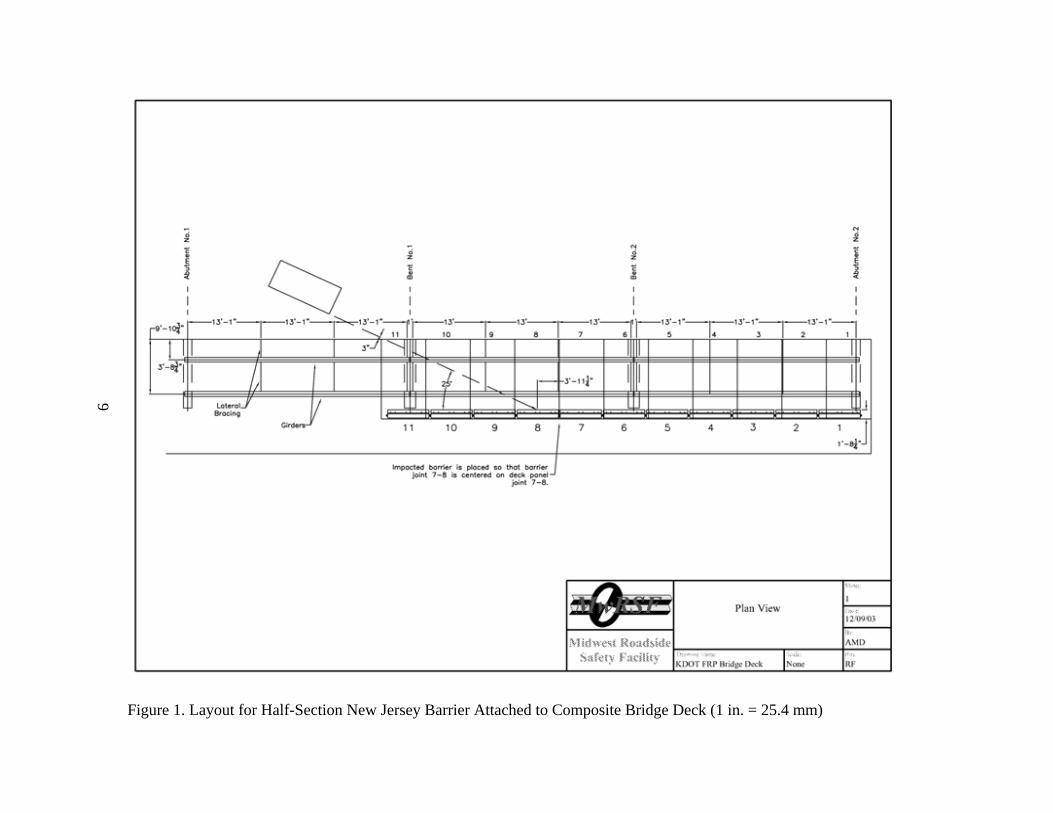
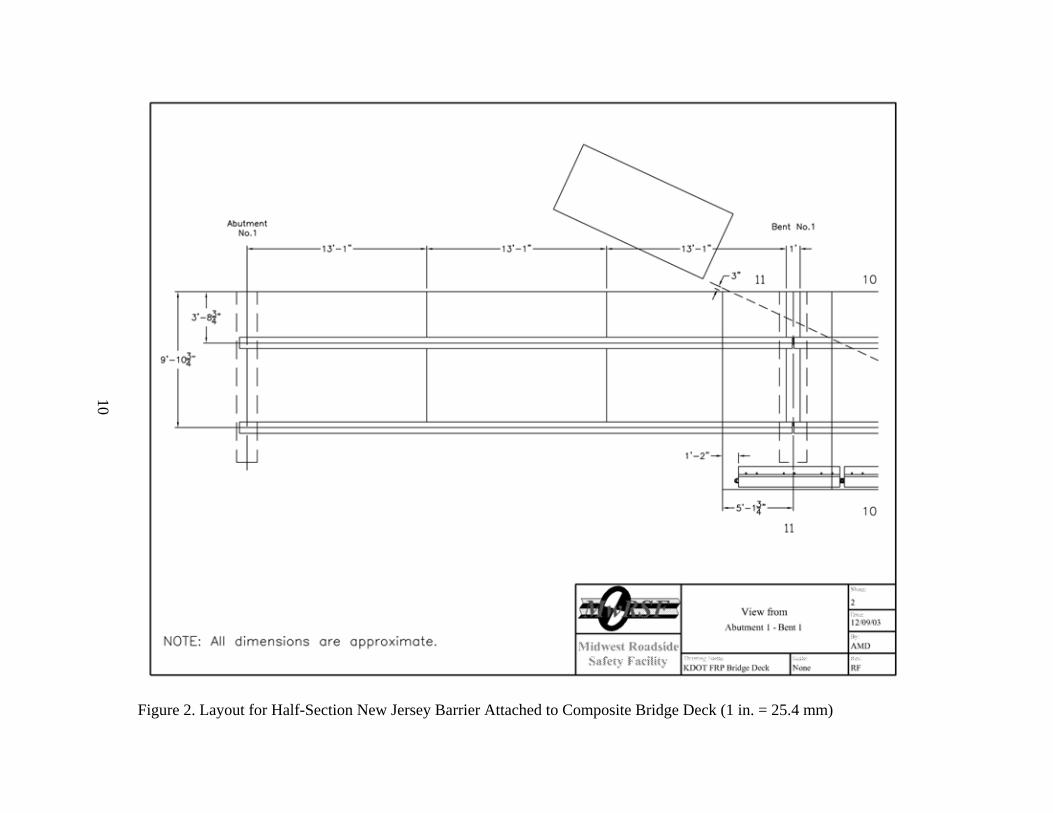
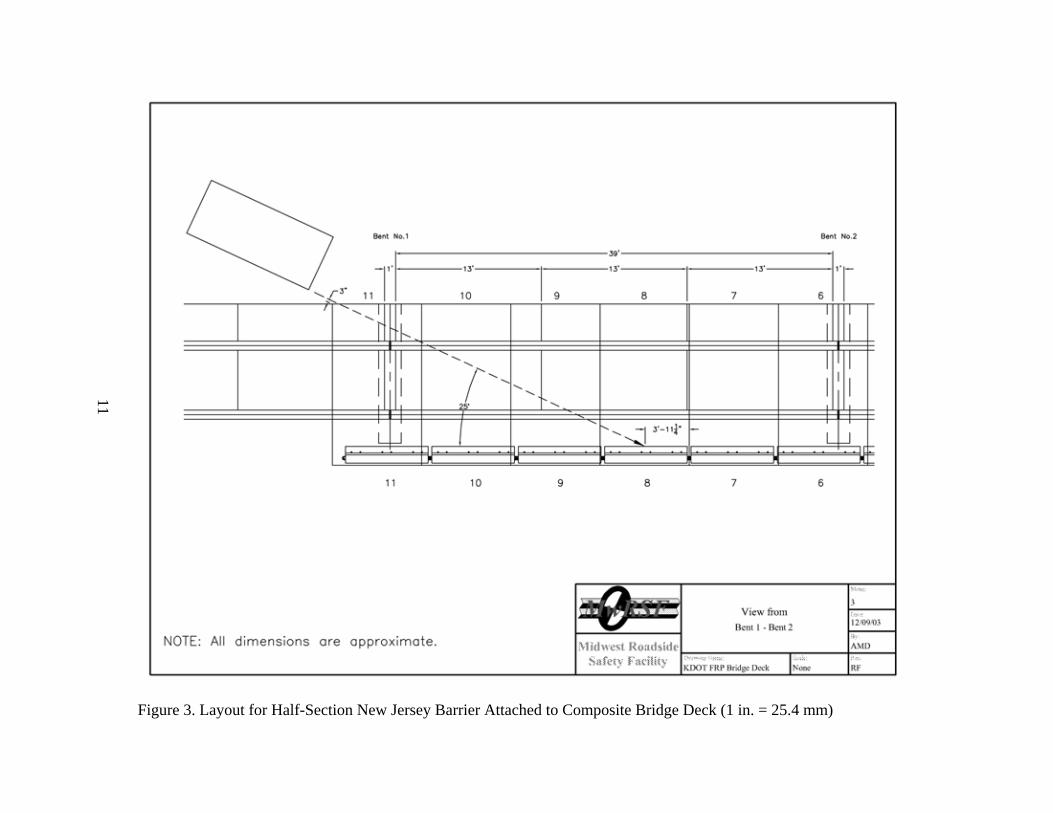
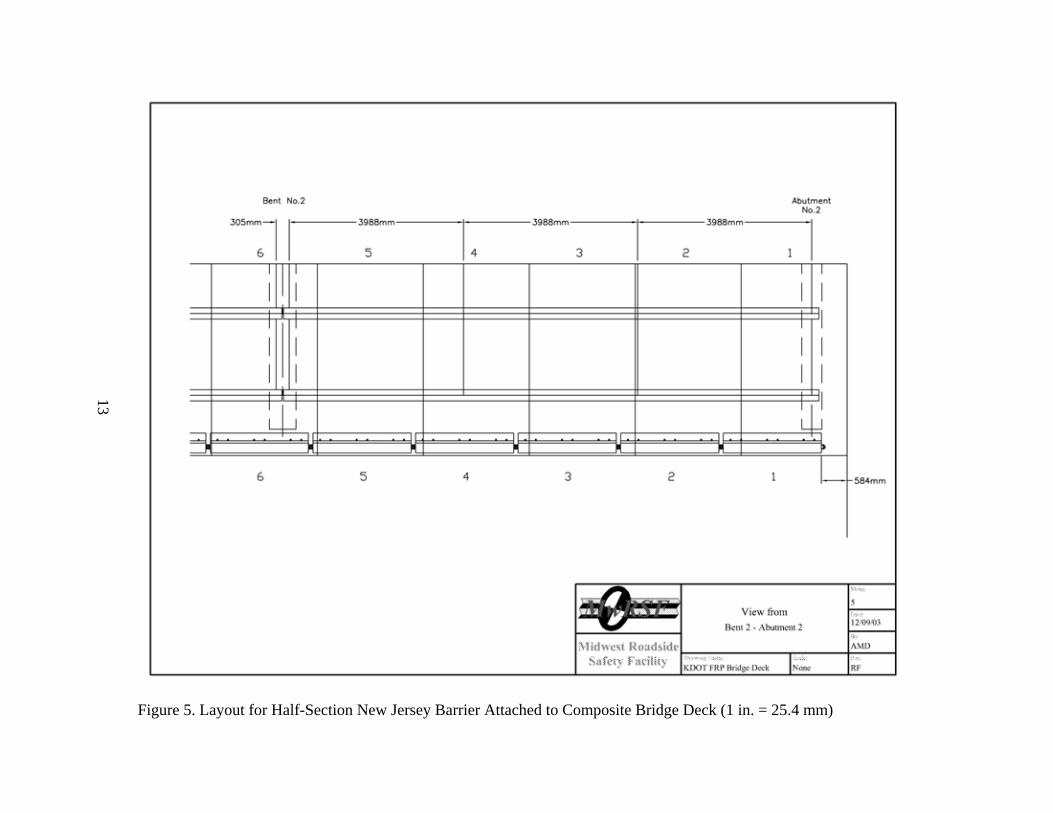
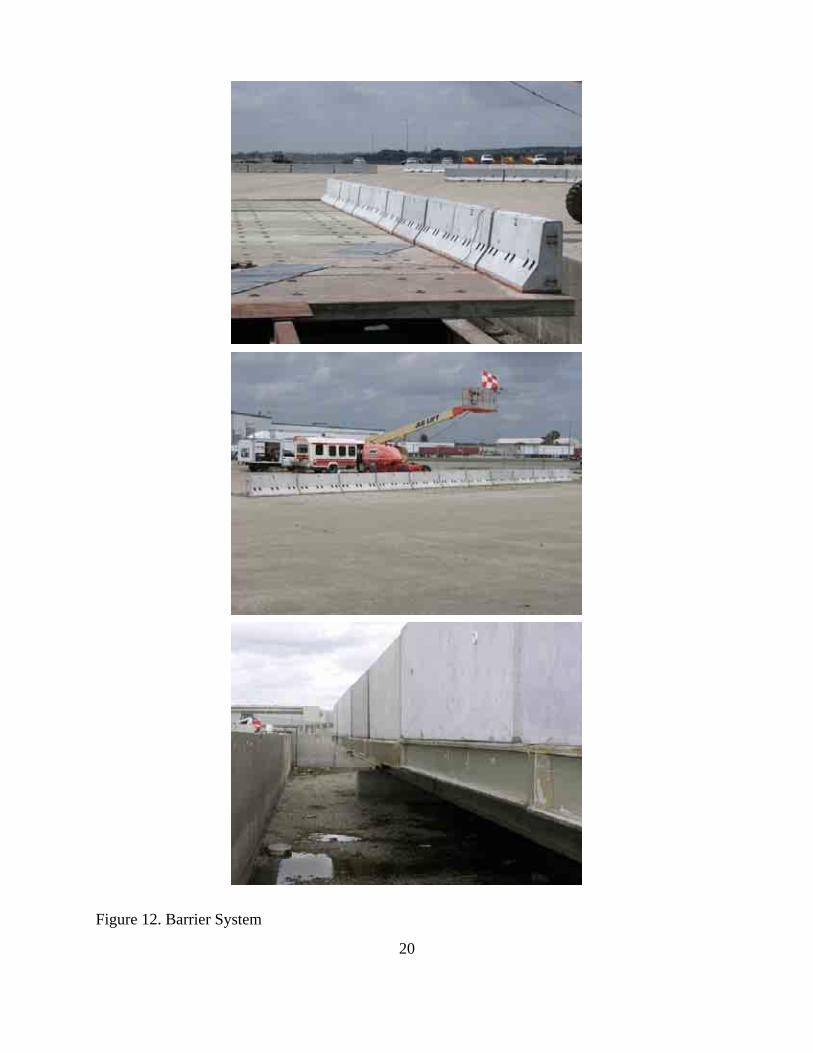
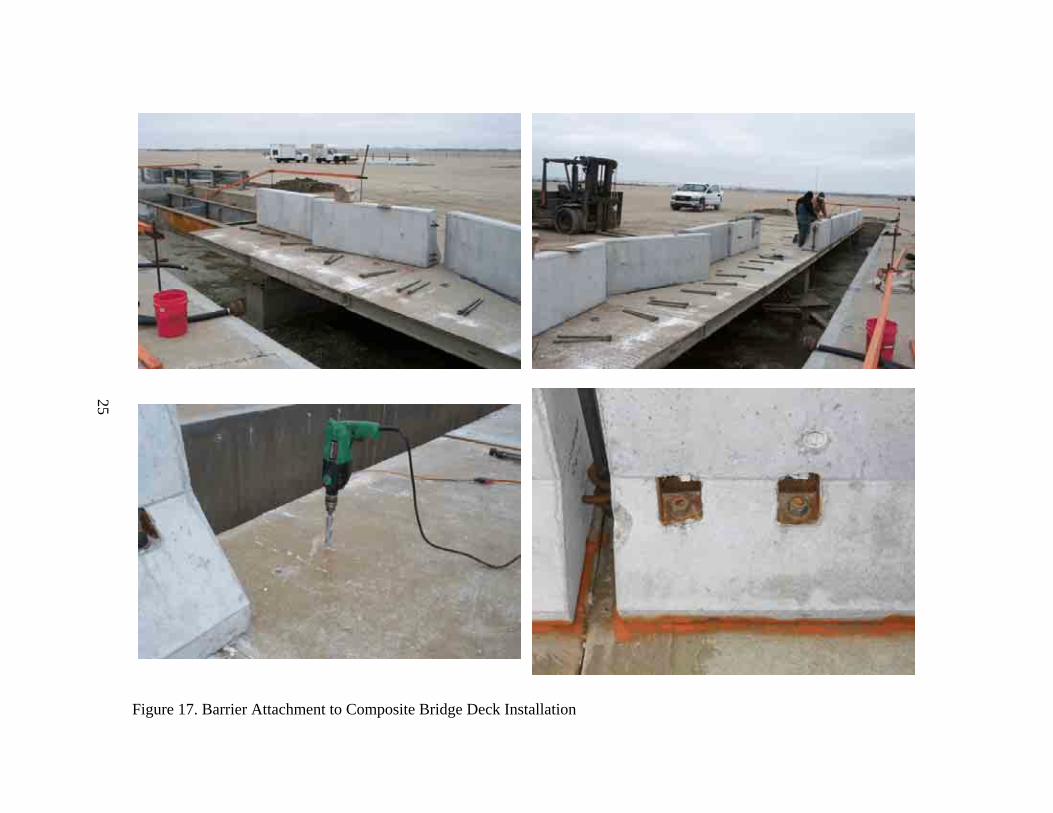
The 25.91-m (85-ft) test installation consisted of New Jersey safety shape barriers attached
to FRP composite bridge deck panels, as shown in Figures 1 through 11. The eleven 2,248-mm (7-ft
4.5-in.) long, half-section New Jersey shape barriers were 457 mm and 229 mm (18 in. and 9 in.)
wide at the base and the top, respectively, with an 813-mm (32-in.) top mounting height, as
measured from the top of the FRP composite bridge deck to the top of the barrier. Photographs of
the test installation are shown in Figures 12 through 17.
The concrete used for the barriers consisted of air entrained concrete, with a minimum 28-
day concrete compressive strength of 34.5 MPa (5,000 psi). A minimum concrete cover of 38 mm
(1.5 in.) was used for all steel reinforcement. All steel reinforcement consisted of ASTM A615
Grade 60 rebar, except for the loop bars. The steel loop bars were required to have a minimum yield
strength of 414 MPa (60 ksi), a tensile strength of at least 1.25 times the yield strength but a
minimum of 552 MPa (80 ksi), a minimum 14% elongation in 203 millimeters (8 in.), and pass a 180
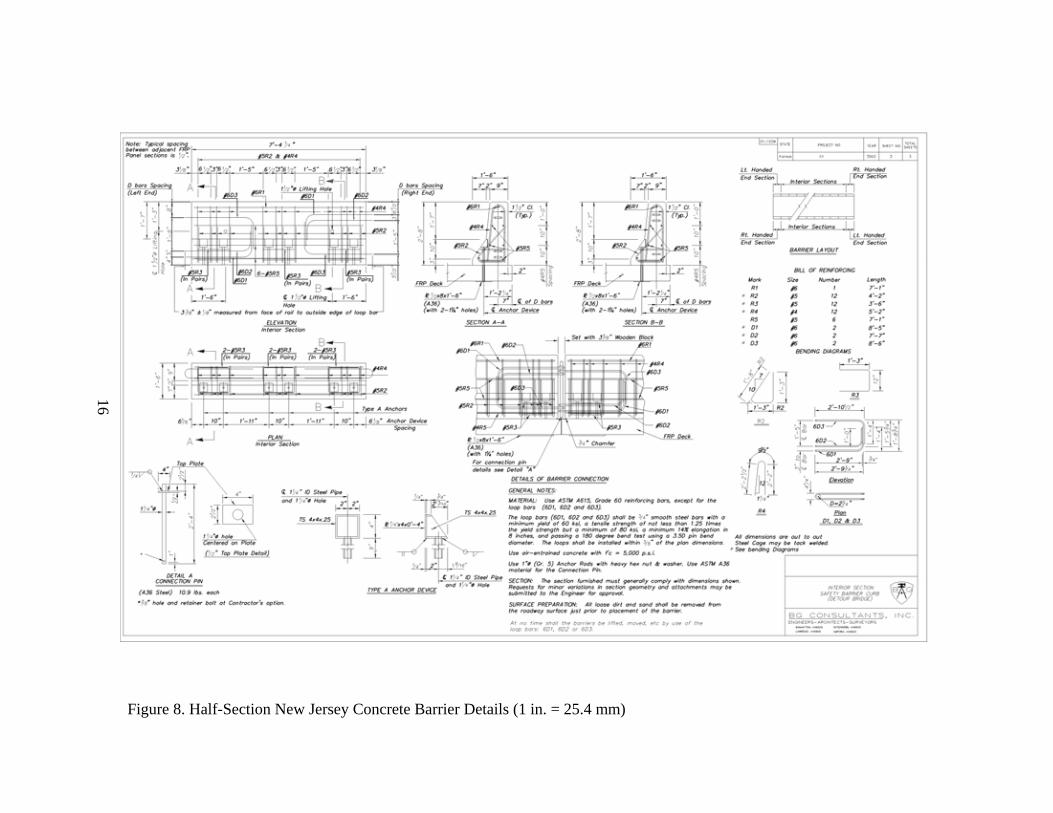
degree bend test using a 89-mm (3.5-in.) diameter pin bend. The barrier reinforcement details are
shown in Figure 8.
Barrier reinforcement consisted of six No. 5 and one No. 6 longitudinal bars, twelve No. 4
and twelve No. 5 bars for the vertical stirrups, and twelve No. 5 bars for the anchor bolt block
reinforcement loops. Each of the seven longitudinal rebar was 2.16 m (7 ft-1 in.) long. The vertical
spacings of the lower, lower-middle, upper-middle, and upper longitudinal bars were 76 mm (3 in.),
254 mm (10 in.), 508 mm (20 in.), and 752 mm (29.625 in.) from the ground to their centers,
respectively. The No. 4 vertical stirrups were 1,575 mm (62 in.) long and were bent into the shape
of the upper front face of the barrier. The No. 5 vertical stirrups were 1,270 mm (50 in.) long and
7
were bent into the shape of the lower front face of the barrier. Their spacings varied longitudinally,
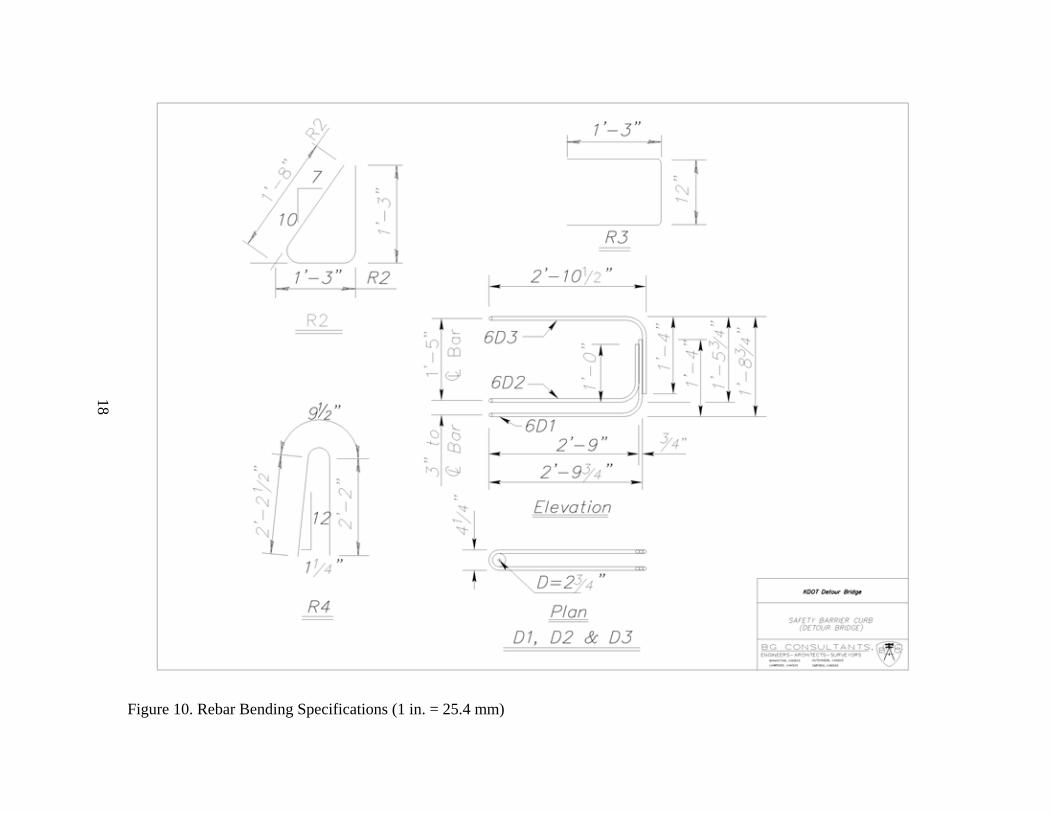
as shown in Figure 8. The anchor bolt containment loops were 1,067 mm (42 in.) long and were bent
into a U-shape and were used to reinforce the anchor bolt area, as shown in Figure 10.
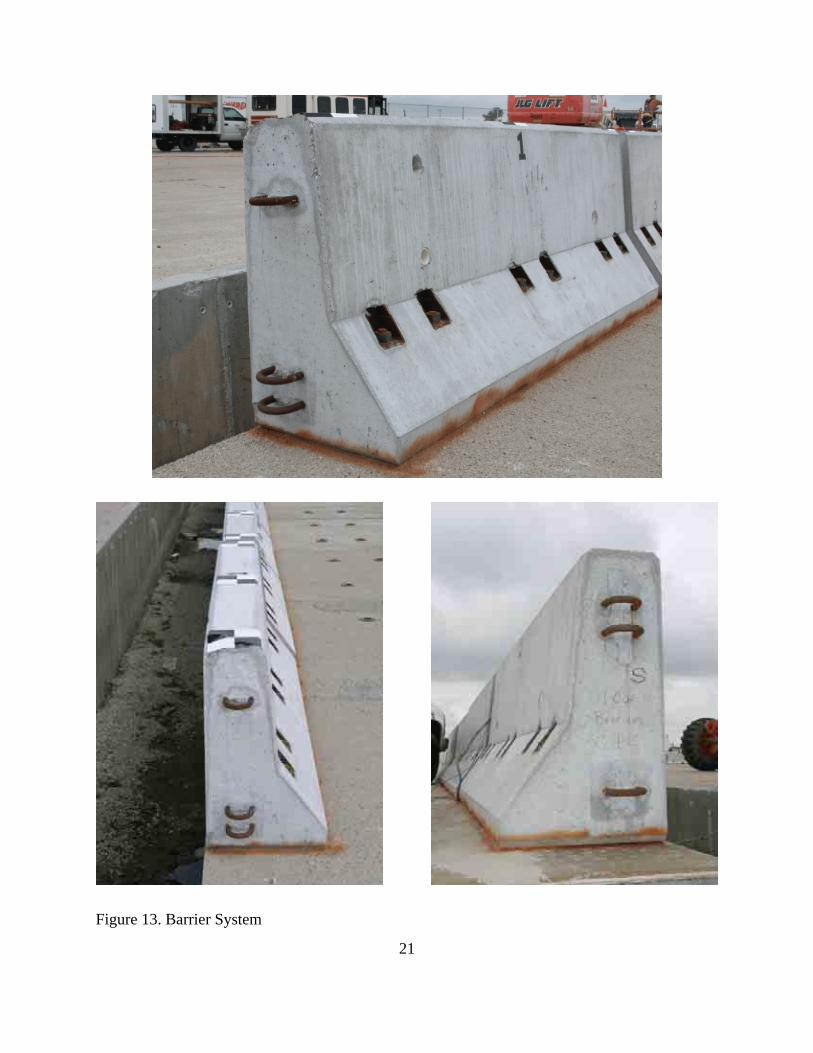
The barriers used a pin and loop type connection comprised of two sets of rebar loops on
each barrier interconnection. Each loop assembly was configured with three No. 6 bars that were
bent into a loop shape, as shown in Figure 10. The vertical pin used in the connection consisted of
a 32-mm (1.25-in.) diameter x 711-mm (28-in.) long round bar composed of ASTM A36 steel, as
shown in Figure 8. The pin was held in place using one 64-mm wide x 102-mm long x 13-mm thick
(2.5-in. x 4-in. x 0.5-in.) ASTM A36 steel plate with a 32-mm (1.25-in.) diameter hole center on it.
The plate was welded 64 mm (2.5 in.) below the top of the pin. A gap of 102 mm (4 in.) between
the ends of two consecutive barriers was formed as a result of pulling the connection taut prior to
anchoring the barriers to the bridge deck.
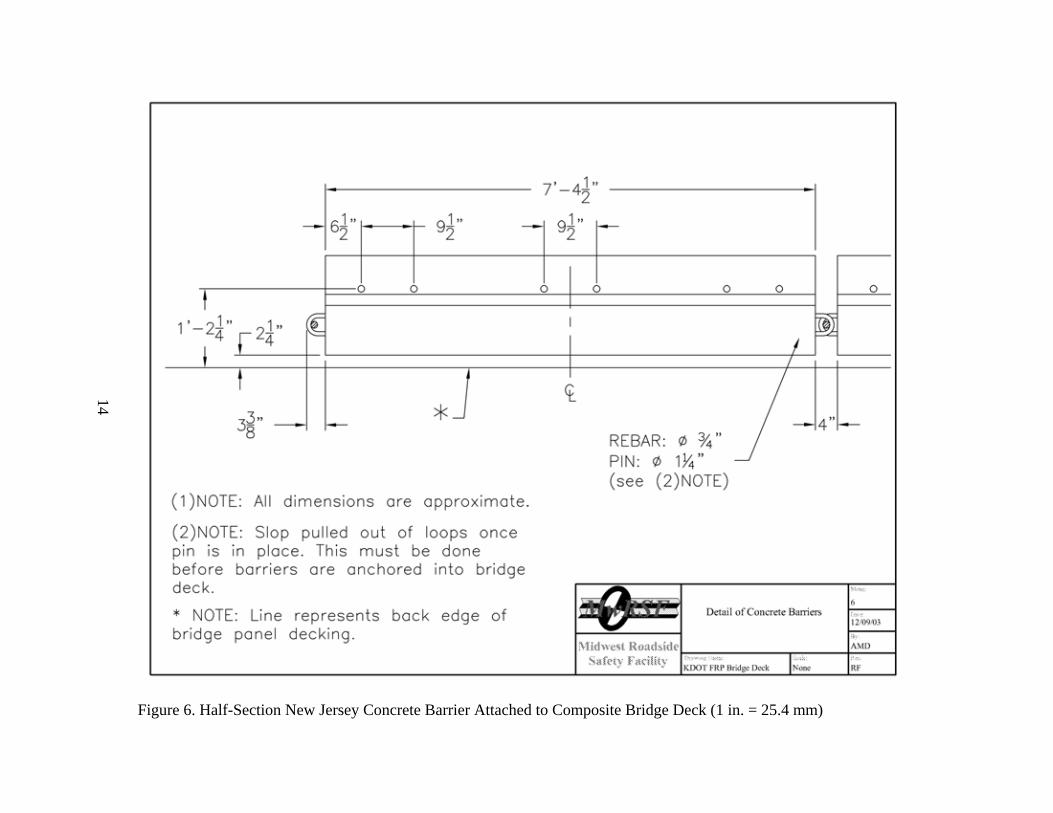
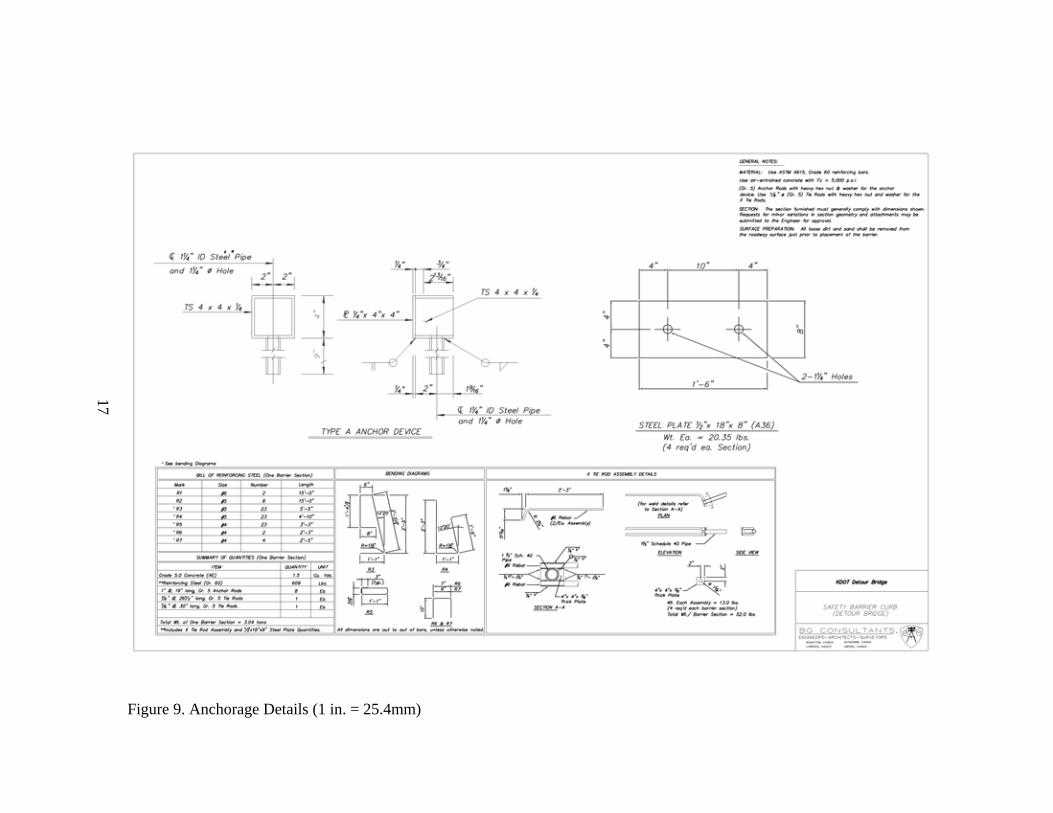
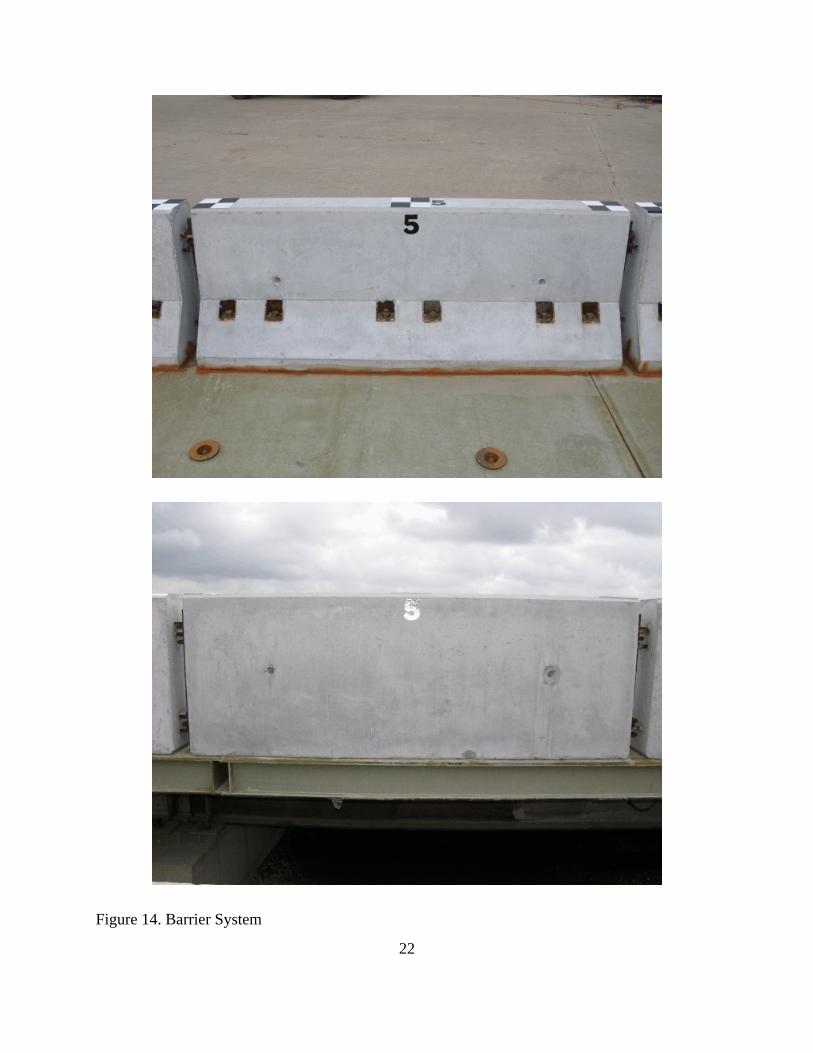
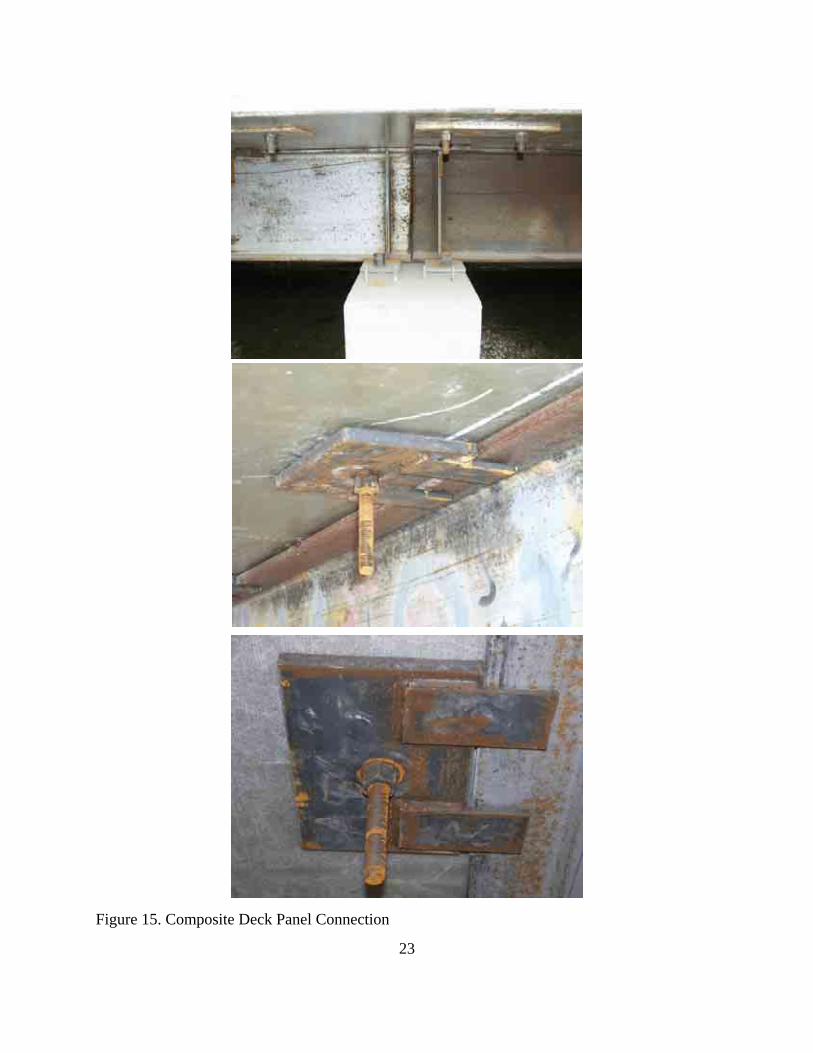
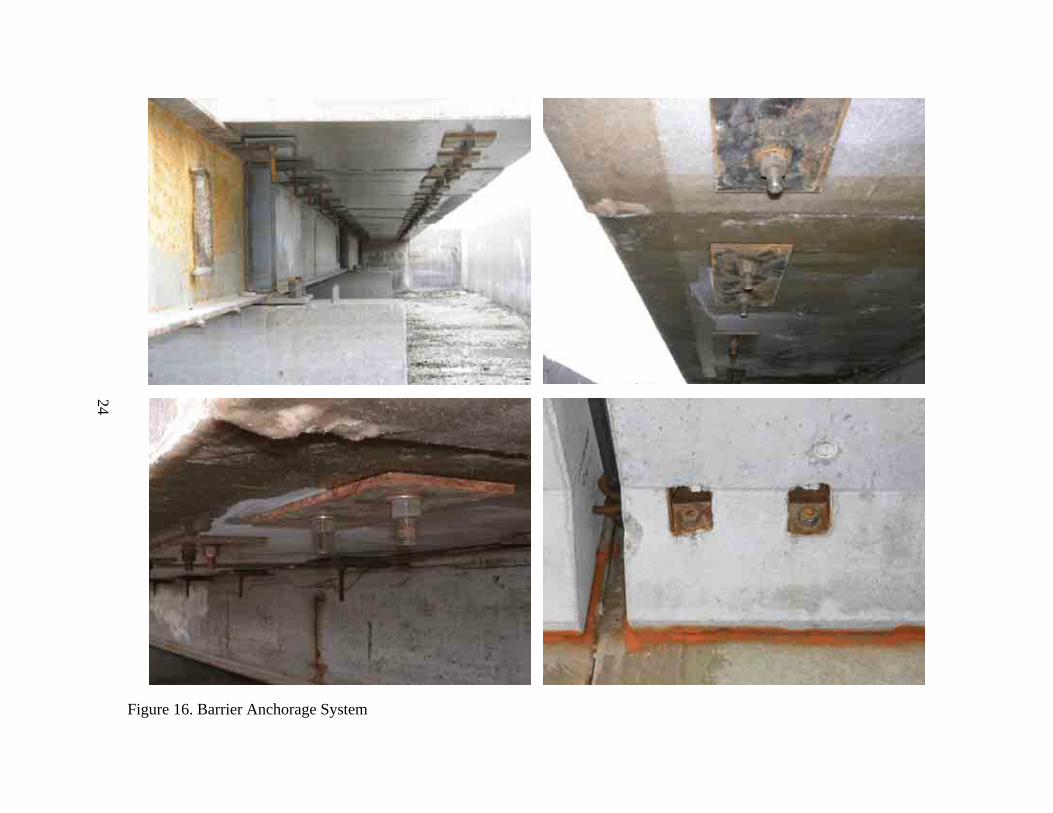
Each barriers was fastened to the FRP composite bridge deck with six 25-mm (1-in.)
diameter, Grade 5 anchor bolts with heavy hex nuts. A 457-mm x 203-mm x 13-mm thick (18-in.
x 8-in. x 0.5-in.) ASTM A36 steel plate washer was located between the bottom of the deck and the
hex nuts at each set of two anchor bolt positions, as shown in Figure 9. The back side of the barriers
were placed flush with the back edge of the FRP bridge deck panels.
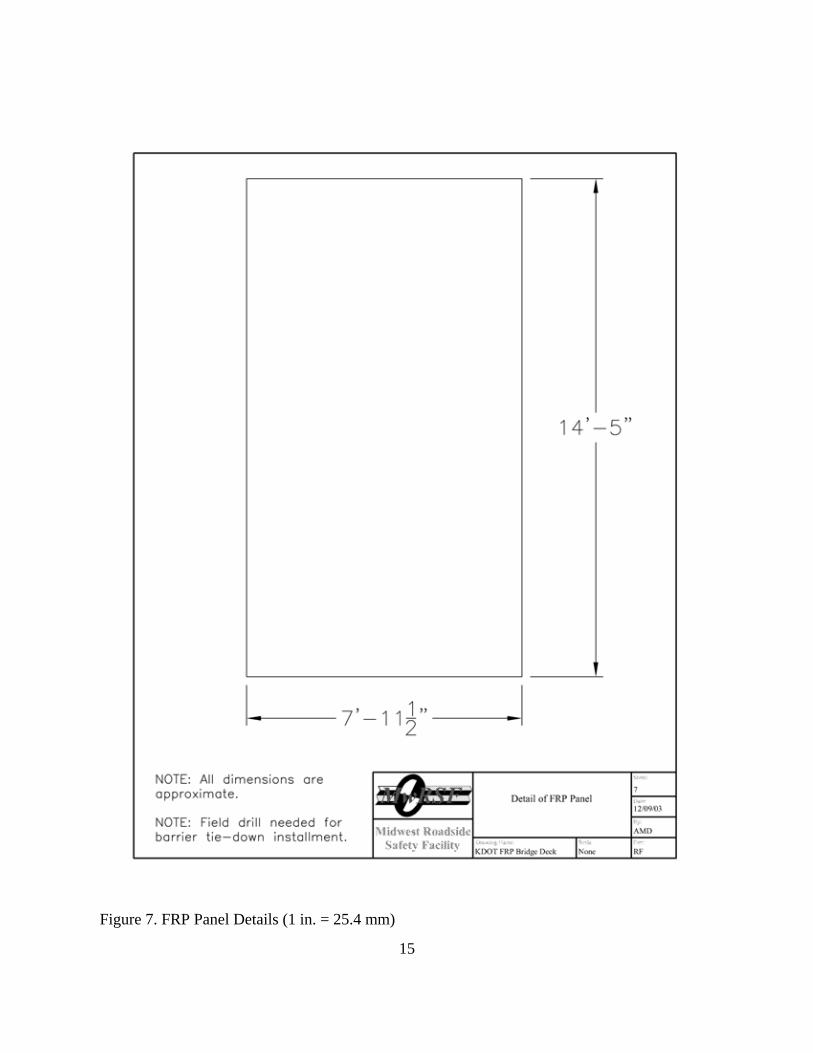
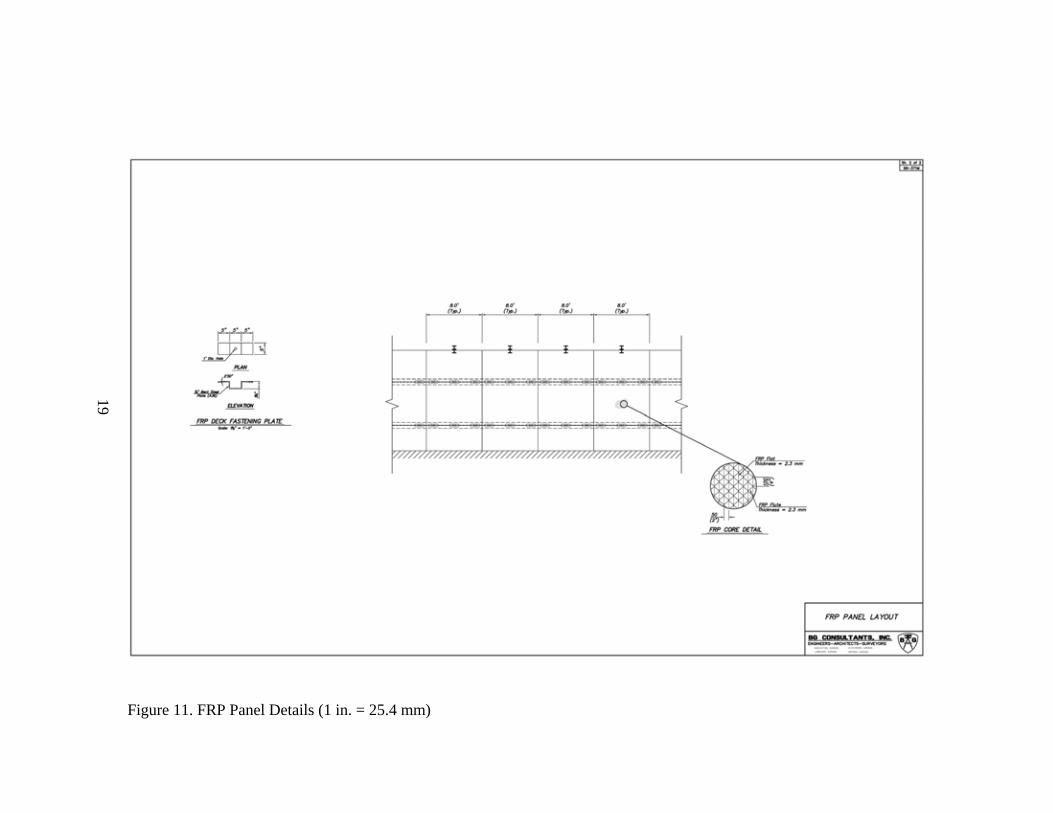
The FRP bridge deck panels were placed transversely across the longitudinal steel bridge
girders. Each FRP panel measured 4.27 m long x 2.44 m wide x 203 mm thick (14 ft x 8 ft x 8 in.).
Each panel surface was fabricated using 13-mm (0.5-in.) thick elements configured using 40 percent
fiberglass and 60 percent polyester. The fiber architecture utilized a standard Kansas Structural
Composites, Inc. (KSCI) lay-up in conjunction with a polyester resin material. A honeycomb core,
8
as shown in Figure 11, was used for the panels, consisting of alternating flat and corrugated layers.
The flat FRP elements were 2.3-mm (0.09-in.) thick, while the corrugated layers had a 51-mm (2-in.)
amplitude and a wave length of 4.0. The core height was 178 mm (7.0 in.). The panel edges and
close outs were configured with 3.0-mm (0.12-in.) thick FRP elements and wet lay ups of 102 to 152
mm (4 to 6 in.) overlapping on the primary surfaces. The panel to support beam connections utilized
steel bent-plate connectors measuring 6 mm (0.25 in.) thick by 127 mm (5 in.) wide. The connector
plates were anchored with 22-mm (0.875-in.) diameter studs welded to the beams with washers and
nuts at panel joints. It was recommended that the anchor studs be attached with a full-penetration
weld and using a stud gun. The low-carbon steel anchor studs had a 345 MPa (50 ksi) minimum
yield strength and a 414 MPa (60 ksi) minimum tensile strength and were manufactured by Sunbelt
Stud Welding, Inc., of Houston, Texas.
9
Figure 1. Layout for Half-Section New Jersey Barrier Attached to Composite Bridge Deck (1 in. = 25.4 mm)
10
Figure 2. Layout for Half-Section New Jersey Barrier Attached to Composite Bridge Deck (1 in. = 25.4 mm)
11
Figure 3. Layout for Half-Section New Jersey Barrier Attached to Composite Bridge Deck (1 in. = 25.4 mm)
12
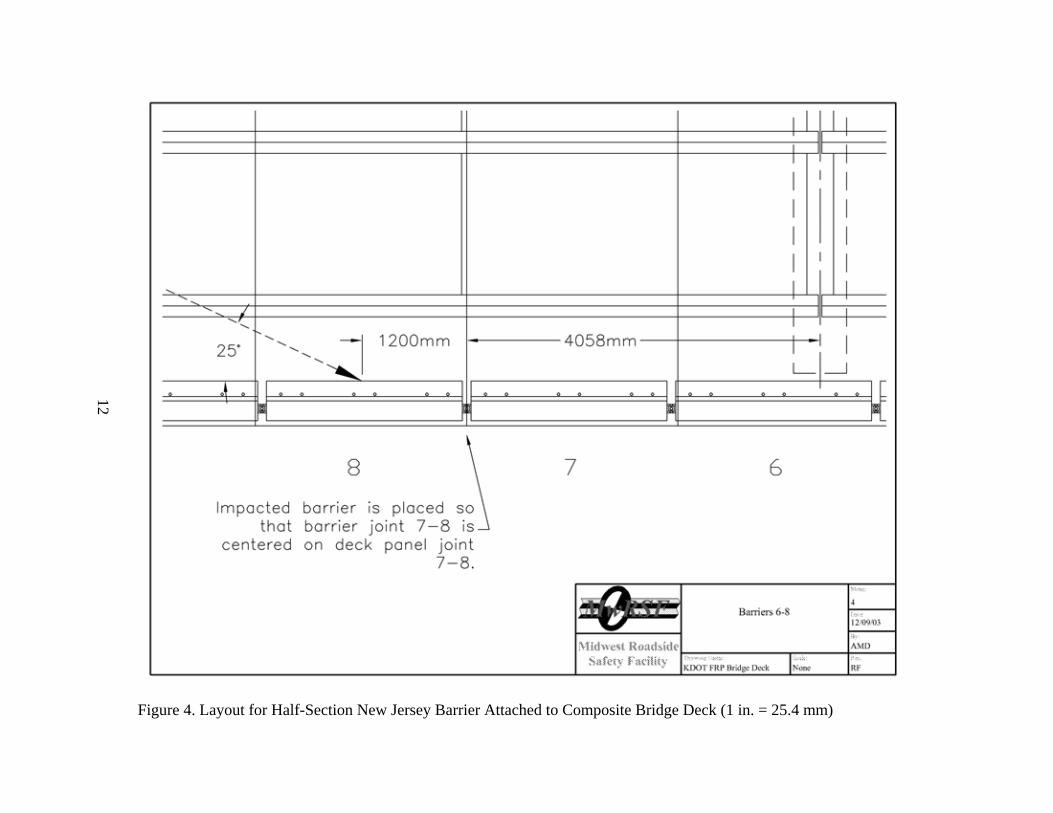
Figure 4. Layout for Half-Section New Jersey Barrier Attached to Composite Bridge Deck (1 in. = 25.4 mm)
13
Figure 5. Layout for Half-Section New Jersey Barrier Attached to Composite Bridge Deck (1 in. = 25.4 mm)
14
Figure 6. Half-Section New Jersey Concrete Barrier Attached to Composite Bridge Deck (1 in. = 25.4 mm)
15
Figure 7. FRP Panel Details (1 in. = 25.4 mm)
16
Figure 8. Half-Section New Jersey Concrete Barrier Details (1 in. = 25.4 mm)
17
Figure 9. Anchorage Details (1 in. = 25.4mm)
18
Figure 10. Rebar Bending Specifications (1 in. = 25.4 mm)
19
Figure 11. FRP Panel Details (1 in. = 25.4 mm)
20
Figure 12. Barrier System
21
Figure 13. Barrier System
22
Figure 14. Barrier System
23
Figure 15. Composite Deck Panel Connection
24
Figure 16. Barrier Anchorage System
25
Figure 17. Barrier Attachment to Composite Bridge Deck Installation
26
4 TEST CONDITIONS
4.1 Test Facility
The testing facility is located at the Lincoln Air-Park on the northwest side of the Lincoln
Municipal Airport and is approximately 8.0 km (5 mi.) northwest of the University of Nebraska-
Lincoln.
4.2 Vehicle Tow and Guidance System
A reverse cable tow system with a 1:2 mechanical advantage was used to propel the test
vehicle. The distance traveled and the speed of the tow vehicle were one-half that of the test vehicle.
The test vehicle was released from the tow cable before impact with the bridge railing system. A
digital speedometer was located on the tow vehicle to increase the accuracy of the test vehicle
impact speed.
A vehicle guidance system developed by Hinch (6) was used to steer the test vehicle. A
guide-flag, attached to the front-right wheel and the guide cable, was sheared off before impact with
the guardrail system. The 9.5-mm (0.375-in.) diameter guide cable was tensioned to approximately
15.6 kN (3,500 lbf), and supported laterally and vertically every 30.48 m (100 ft) by hinged
stanchions. The hinged stanchions stood upright while holding up the guide cable, but as the vehicle
was towed down the line, the guide-flag struck and knocked each stanchion to the ground. For test
KSC-1, the vehicle guidance system was approximately 335-m (1,100-ft) long.
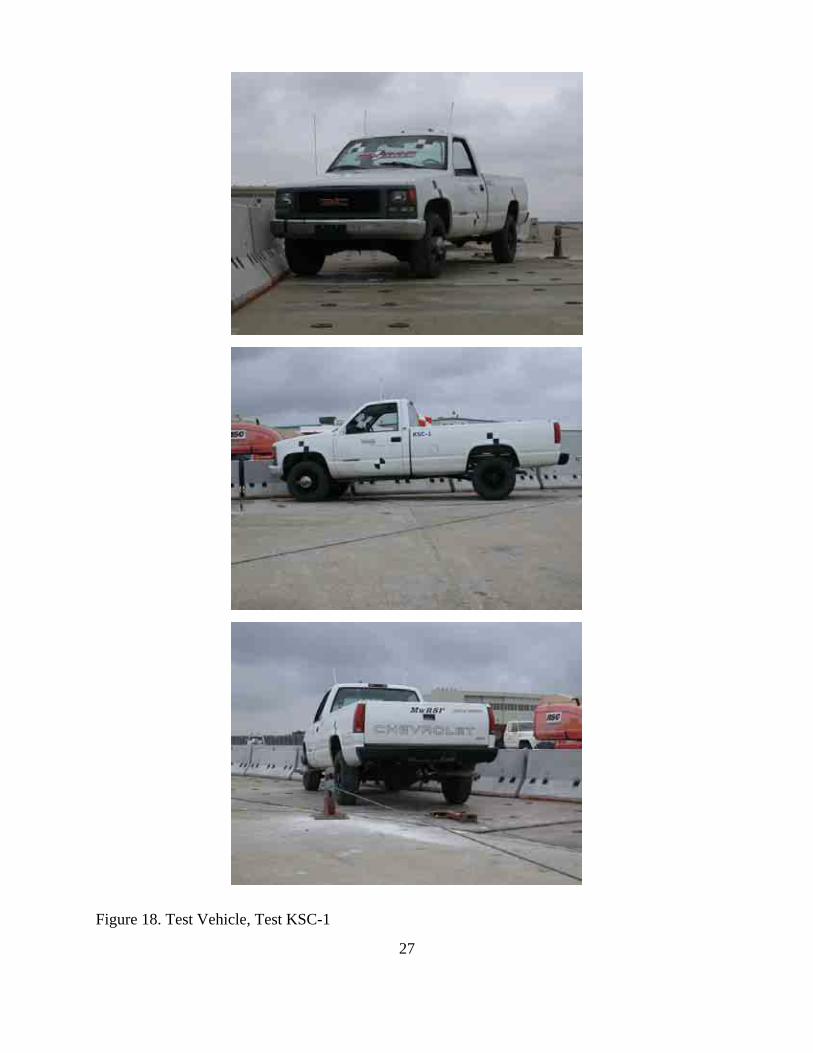
4.3 Test Vehicles
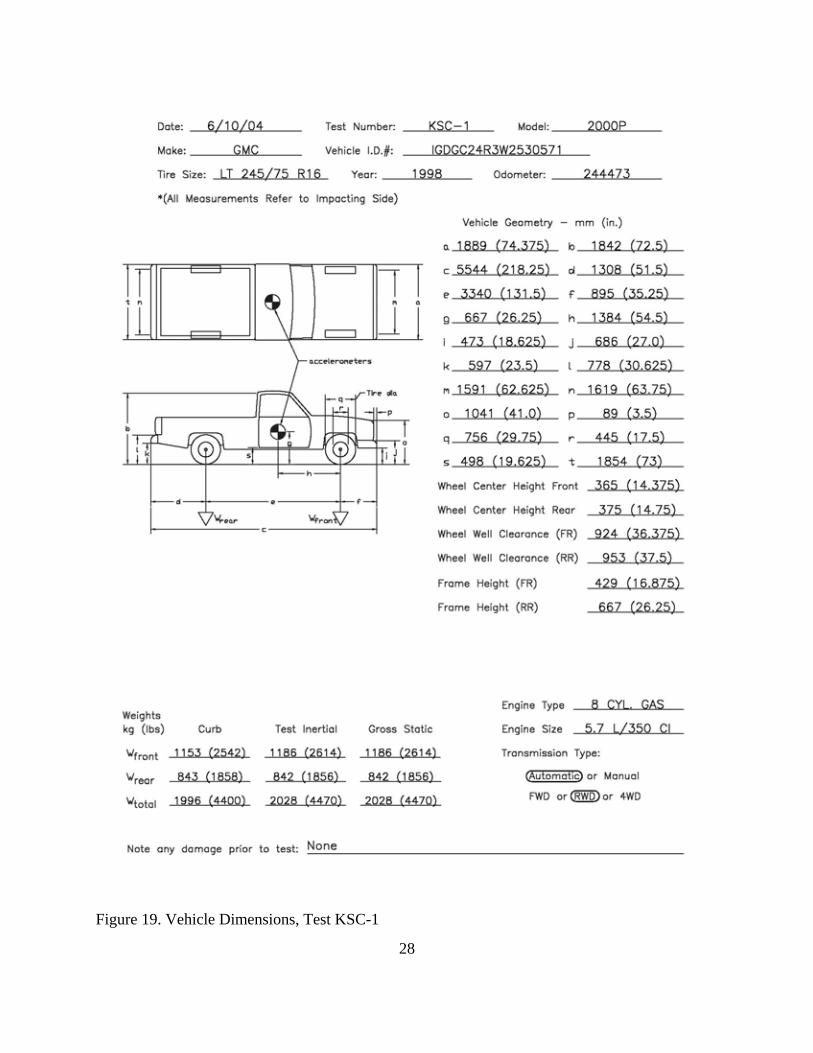
For test KSC-1, a 1998 GMC 2500 ¾-ton pickup truck was used as the test vehicle. The test
inertial and gross static weights were 2,028 kg (4,470 lbs). The test vehicle is shown in Figure 18,
and vehicle dimensions are shown in Figure 19.
27
Figure 18. Test Vehicle, Test KSC-1
28
Figure 19. Vehicle Dimensions, Test KSC-1
29
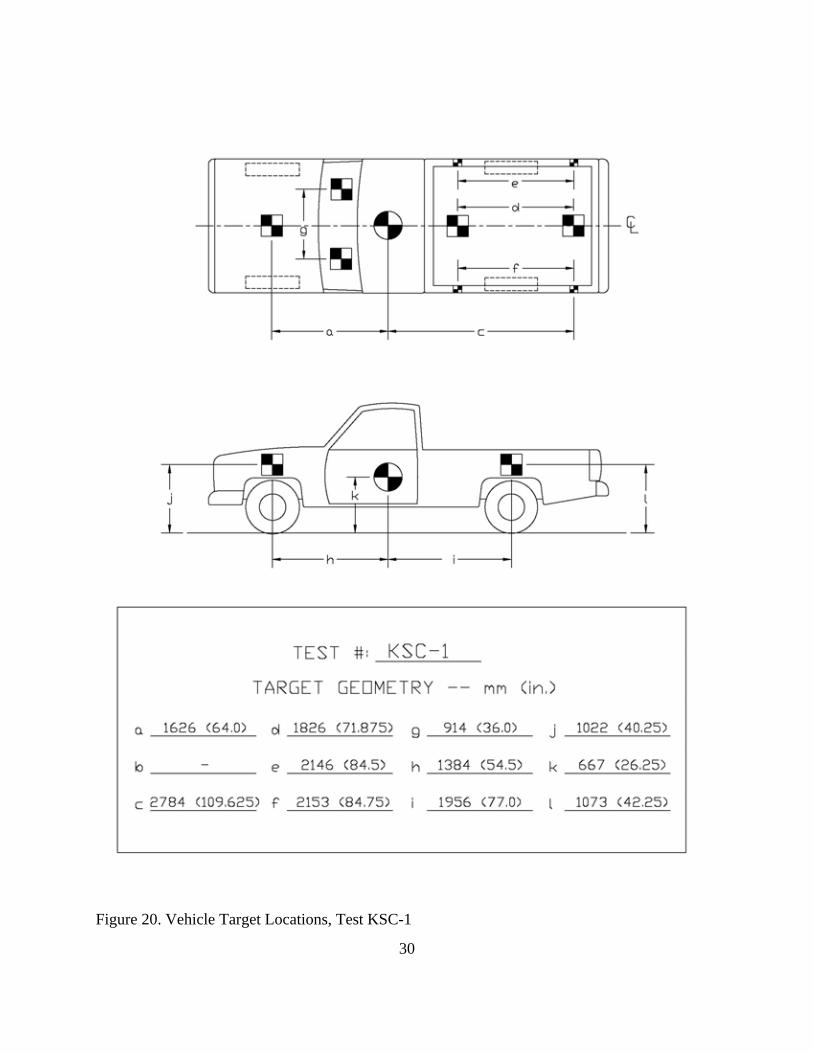
The longitudinal component of the center of gravity was determined using the measured axle
weights. The location of the final center of gravity is shown in Figures 19 and 20.
Square black and white-checkered targets were placed on the vehicle to aid in the analysis
of the high-speed film and Photron and E/cam video, as shown in Figure 20. Round, checkered
targets were placed on the center of gravity, on the left-side door, on the right-side door, and on the
roof of the vehicle. The remaining targets were located for reference so that they could be viewed
from the high-speed cameras for film analysis.
The front wheels of the test vehicle were aligned for camber, caster, and toe-in values of zero
so that the vehicle would track properly along the guide cable. Two 5B flash bulbs were mounted
on both the hood and roof of the vehicle to pinpoint the time of impact with the bridge rail on the
high-speed film and Photron and E/cam videos. The flash bulbs were fired by a pressure tape switch
mounted on the front face of the bumper. A remote-controlled brake system was installed in the test
vehicle so the vehicle could be brought safely to a stop after the test.
4.4 Data Acquisition Systems
4.4.1 Accelerometers
One triaxial piezoresistive accelerometer system with a range of ±200 Gs was used to
measure the acceleration in the longitudinal, lateral, and vertical directions at a sample rate of 10,000
Hz. The environmental shock and vibration sensor/recorder system, Model EDR-4M6, was
developed by Instrumented Sensor Technology (IST) of Okemos, Michigan and includes three
differential channels as well as three single-ended channels. The EDR-4 was configured with 6 MB
of RAM memory and a 1,500 Hz lowpass filter. Computer software, “DynaMax 1 (DM-1)” and
“DADiSP”, was used to analyze and plot the accelerometer data.
30
Figure 20. Vehicle Target Locations, Test KSC-1
31
A backup triaxial piezoresistive accelerometer system with a range of ±200 Gs was also used
to measure the acceleration in the longitudinal, lateral, and vertical directions at a sample rate of
3,200 Hz. The environmental shock and vibration sensor/recorder system, Model EDR-3, was
developed by Instrumental Sensor Technology (IST) of Okemos, Michigan. The EDR-3 was
configured with 256 kB of RAM memory and a 1,120 Hz lowpass filter. Computer software,
“DynaMax 1 (DM-1)” and “DADiSP”, was used to analyze and plot the accelerometer data.
4.4.2 Rate Transducers
An Analog Systems 3-axis rate transducer with a range of 1,200 degrees/sec in each of the
three directions (pitch, roll, and yaw) was used to measure the rates of motion of the test vehicle.
The rate transducer was mounted inside the body of the EDR-4M6 and recorded data at 10,000 Hz
to a second data acquisition board inside the EDR-4M6 housing. The raw data measurements were
then downloaded for analysis and plotted. Computer software, “DynaMax 1 (DM-1)” and
“DADiSP”, was used to analyze and plot the rate transducer data.
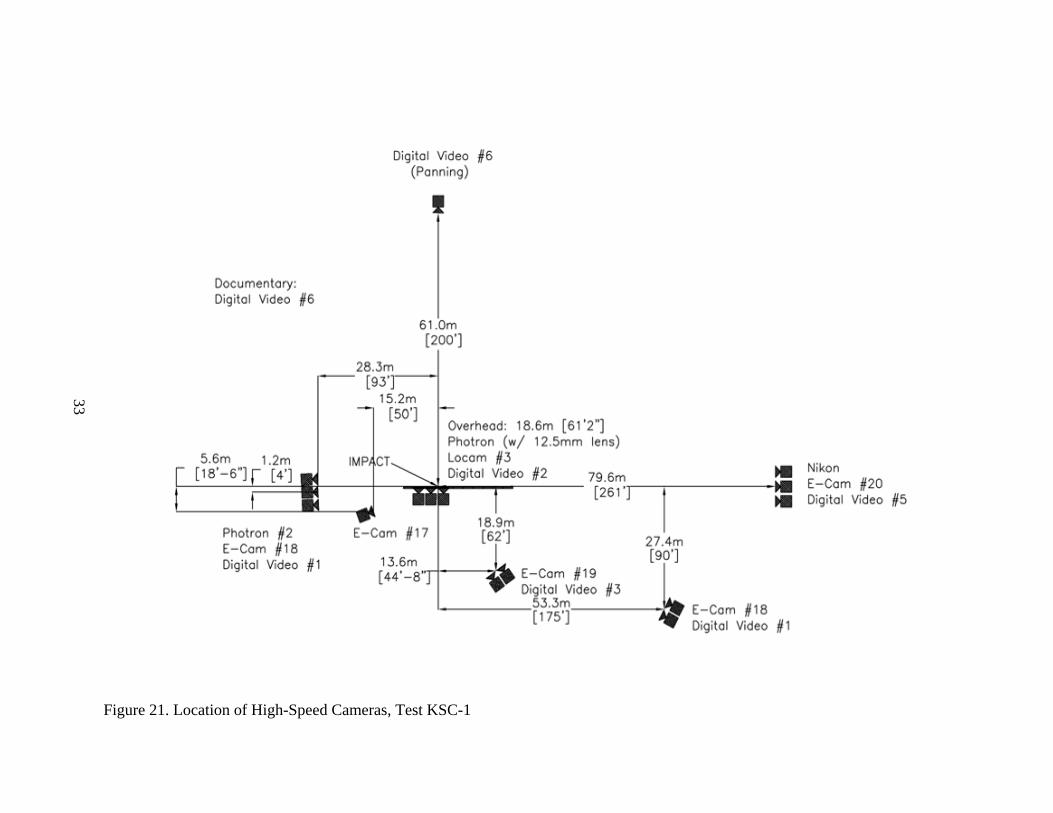
4.4.3 High-Speed Photography
For test KSC-1, one high-speed 16-mm Red Lake Locam camera, with an operating speed
of approximately 500 frames/sec, was used to film the crash test. Five high-speed Red Lake E/cam
video cameras and one high-speed Photron video camera, with operating speeds of 500 frames/sec,
were also used to film the crash test. Six Canon digital video cameras, with a standard operating
speed of 29.97 frame/sec, were also used to film the crash test. A Photron, with a wide-angle 12.5-
mm lens, one high-speed Locam, with a wide-angle 12.5-mm lens, and one Canon digital video
camera were placed above the test installation to provide a field of view perpendicular to the ground.
A high-speed E/cam, a Nikon 8700 digital 35-mm camera, and a Canon digital video camera were
32
placed downstream from the impact point and had a field of view parallel to the barrier. A high-
speed E/cam video camera and a Canon digital video camera were placed downstream from the
impact point and behind the barrier. Another high-speed E/cam video camera and Canon digital
video camera were placed downstream from the impact point and behind the barrier, but closer to
the impact point. A high-speed E/cam video camera, a Photron video camera, and a Canon digital
video camera were placed upstream from the impact point and had a field of view parallel to the
barrier. A high-speed E/cam video camera was placed upstream from the point of impact and behind
the barrier. A Canon digital video camera, with a panning view, was placed on the traffic side of the
barrier and had a field of view perpendicular to the barrier. A schematic of all fifteen camera
locations for test KSC-1 is shown in Figure 21.
The Photron video and E/cam videos were analyzed using the ImageExpress MotionPlus
Software and the Redlake Motion Scope software, respectively. Actual camera speeds and
divergence factors were considered in the analysis of the high-speed video. It should be noted that
the high-speed Locam 16-mm films were not developed nor analyzed for test KSC-1.
4.4.4 Pressure Tape Switches
For test KSC-1, five pressure-activated tape switches, spaced at 2-m (6.56-ft) intervals, were
used to determine the speed of the vehicle before impact. Each tape switch fired a strobe light which
sent an electronic timing signal to the data acquisition system as the right-front tire of the test
vehicle passed over it. Test vehicle speed was determined from electronic timing mark data recorded
using Test Point software. Strobe lights and high-speed film analysis are used only as a backup in
the event that vehicle speed cannot be determined from the electronic data.
33
Figure 21. Location of High-Speed Cameras, Test KSC-1
34
5 CRASH TEST
5.1 Test KSC-1
The 2,028-kg (4,470-lb) pickup truck impacted the bridge railing system attached to a
composite panel bridge deck at a speed of 100.2 km/h (62.3 mph) and at an angle of 26.0 degrees.
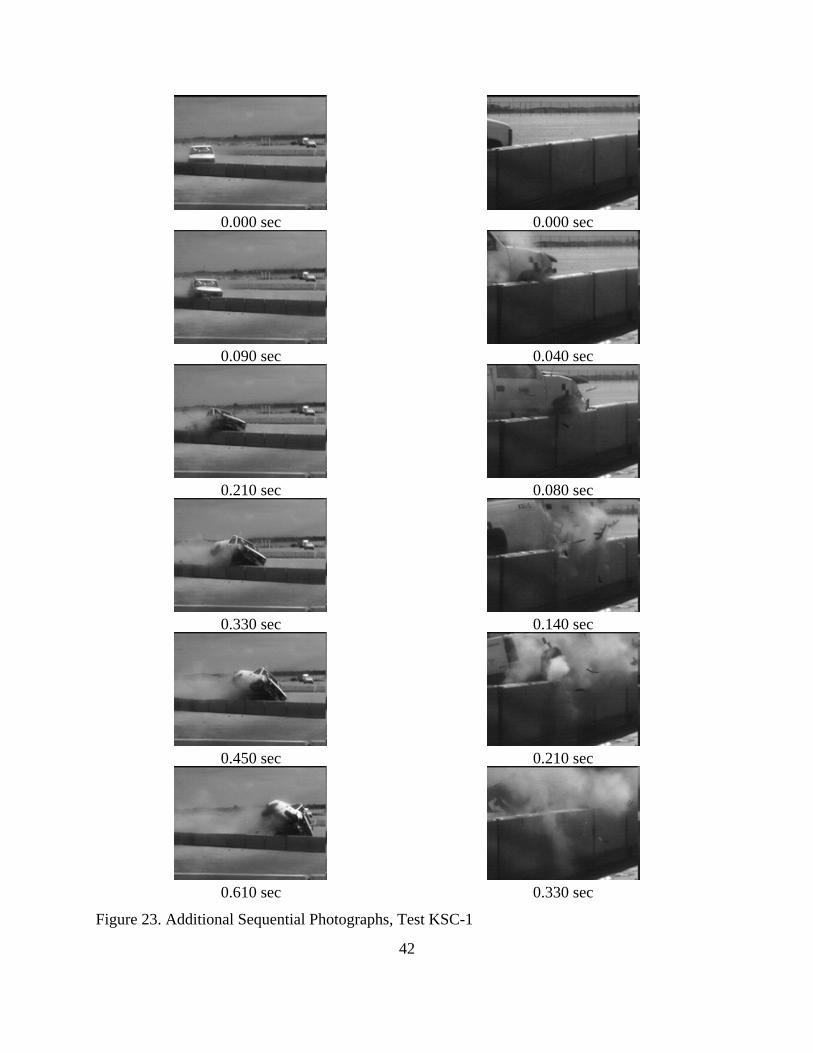
A summary of the test results and the sequential photographs is shown in Figure 22. The summary
of the test results and sequential photographs in English units is shown in Appendix A. Additional
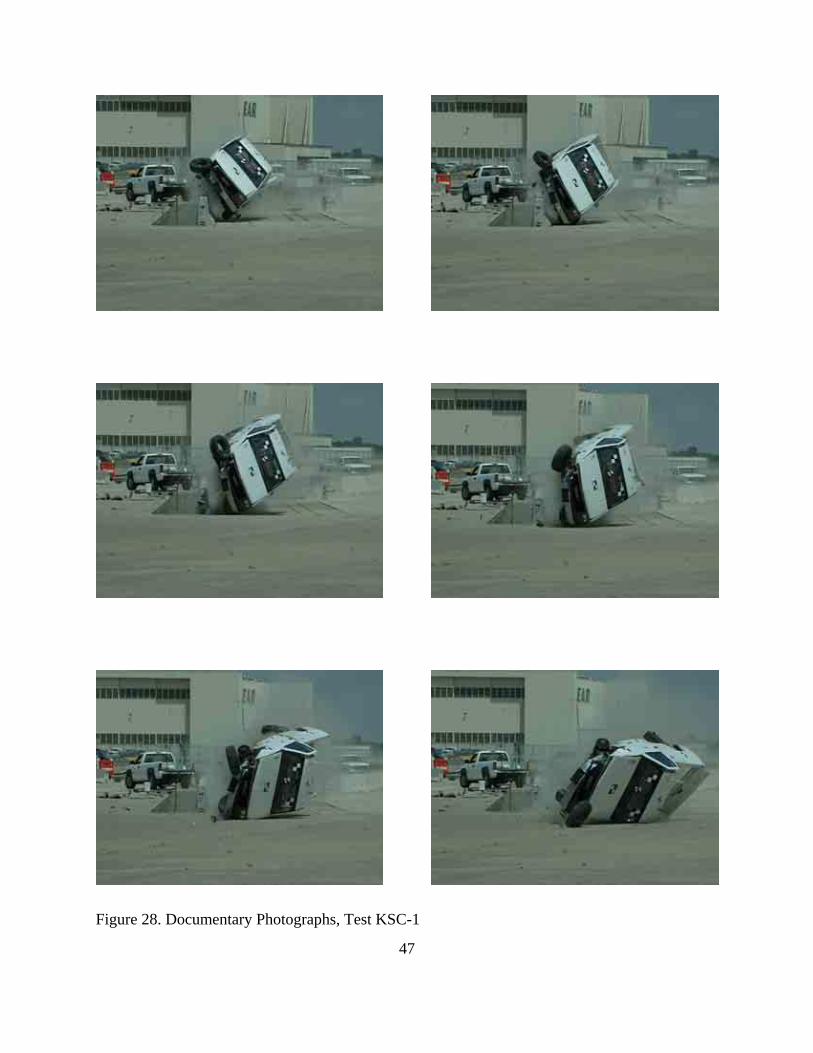
sequential photographs are shown in Figures 23 through 26. Documentary photographs of the crash
test are shown in Figures 27 and 28.
5.2 Test Description
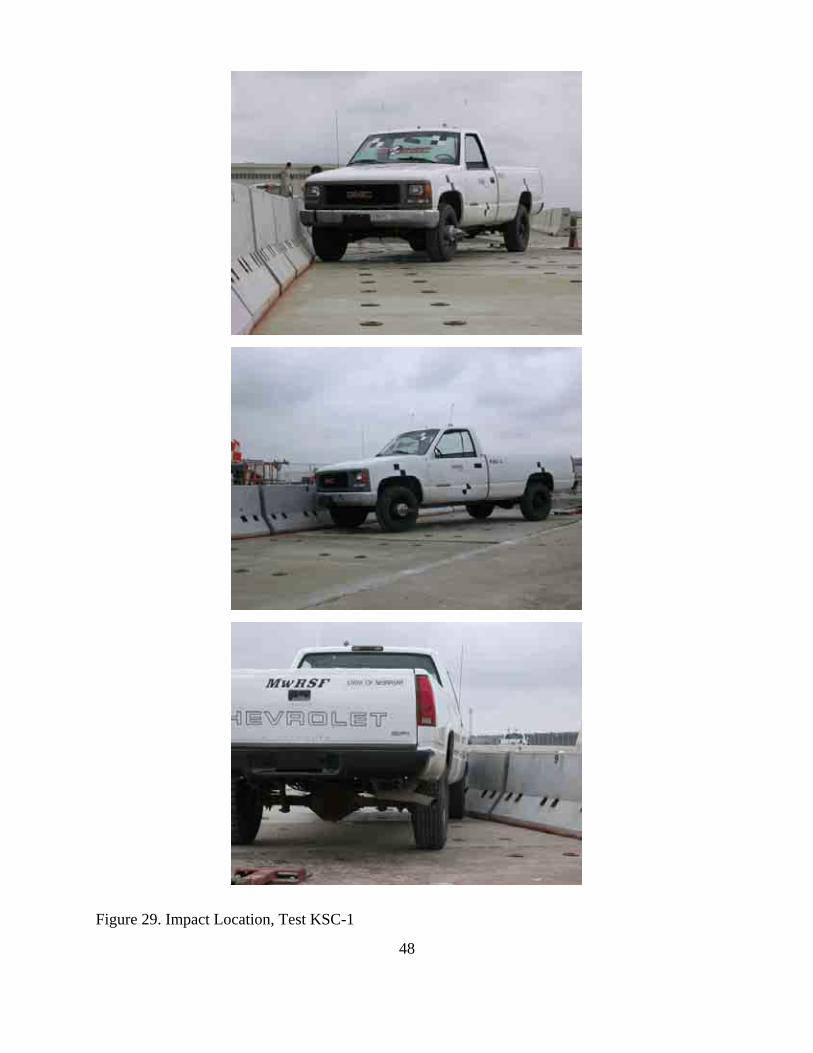
Initial impact was to occur 1,200 mm (47 in.) upstream from the center of the gap between
barrier nos. 7 and 8, as shown in Figure 29. Actual vehicle impact occurred at the targeted impact.
Immediately following impact, the right-front corner of the bumper crushed inward. At 0.004 sec,
the plastic trim around the right-front headlight fractured as the right-front quarter panel deformed
inward toward the right-front tire. At 0.008 sec, a buckle appeared in the right-front quarter panel.
At this same time, the bumper deformed due to contact with the barrier, and the hood extended over
the top of barrier no. 8. At 0.010 sec, the right-front quarter panel continued to buckle, and the hood
separated from the right-front quarter panel. At 0.018 sec, the right-front tire contacted barrier no.
8, which deflected downward and backward. During this same time, the right-front corner of the
bumper and the right-front quarter panel crushed into the right-front wheel well. At 0.024 sec, the
right-front quarter panel and the right-front corner of the hood protruded over the top of barrier no.
8 as the right-front tire began to climb the barrier. At 0.036 sec, the gap between the hood and the
right-front quarter panel increased as barrier no. 8 reached its maximum rearward and downward
35
deflection. At 0.040 sec, the right-side door contacted barrier no. 8 and became ajar at the top. At
this same time, the right-front quarter panel and corner of the front bumper continued to deform into
the wheel well, and the right-front corner of the grill was located at the upstream anchor of barrier
no. 7. At 0.048 sec, barrier no. 7 and the composite bridge deck deflected backward and downward.
At this same time, the front of the vehicle pitched upward and rotated away from the system. At
0.060 sec, barrier no. 8 continued to deflect downward, and the right-front tire climbed the front face
of barrier no. 7. At 0.070 sec, the gap increased at the top of the right-side door, and the right-front
corner of the vehicle sustained extensive deformation and crush. At 0.090 sec, the vehicle rolled
away from the barrier towards the left. At 0.108 sec, the front half of the right-side of the vehicle
was in contact with the barrier. At this same time, the vehicle continued to redirect away from the
system. At 0.120 sec, the box portion of the vehicle twisted away from the system. At 0.142 sec, the
left-front tire became airborne. At 0.168 sec, the right-rear tire contacted barrier no. 8. At 0.200 sec,
the right-rear corner of the box contacted the top edge of barrier no. 8. At 0.214 sec, the system
rebounded from contact with the vehicle, and the rear end of the vehicle pitched upward. At 0.276
sec, the front of the vehicle pitched downward. At 0.290 sec, the truck box of the vehicle lost contact
with the barrier. At 0.300 sec, as the right-front tire lost contact with the system, the vehicle exited
the system with extensive roll and a speed of 69.0 km/h (42.9 mph) and at a trajectory angle of 7.2
degrees. At 0.330 sec, the right-front corner of the box portion separated slightly from the vehicle.
At this same time, all four tires were airborne, and the vehicle continued to roll toward its left side.
At 0.370 sec, the vehicle descended toward the ground, and the tailgate on the box disengaged. At
0.406 sec, the vehicle continued to roll onto its left side. At 0.530 sec, the box portion of the vehicle
deflected away from the barrier system. At this same time, the vehicle reached a roll angle of 70
36
degrees and continued to descend toward the ground. At 0.616 sec, the left-front tire contacted the
ground. At 0.662 sec, the entire left side of the vehicle was in contact with the ground and was
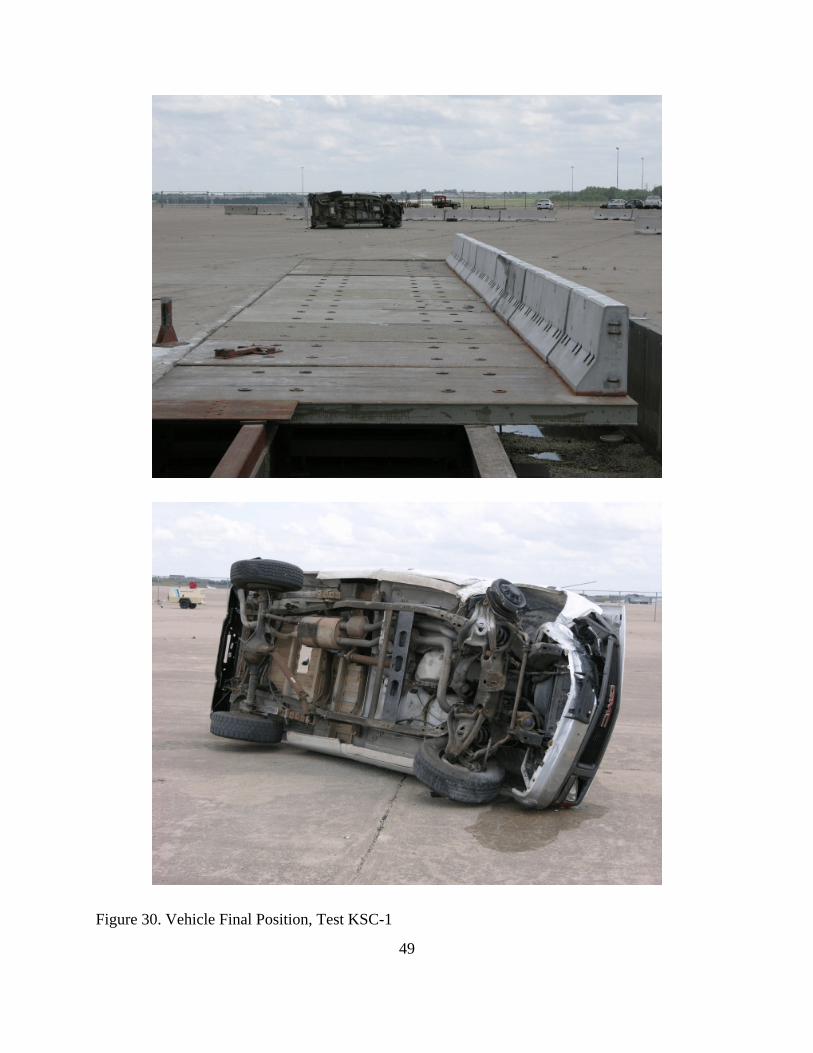
crushed. At 0.800 sec, the vehicle slid along the ground on its left side. At 2.254 sec, the vehicle
came to rest 54.41 m (178 ft - 6 in.) downstream from impact and 3.72 m (12 ft - 3 in.) laterally
away from the traffic-side of the barrier. The trajectory and final position of the pickup truck are
shown in Figures 22 and 30.
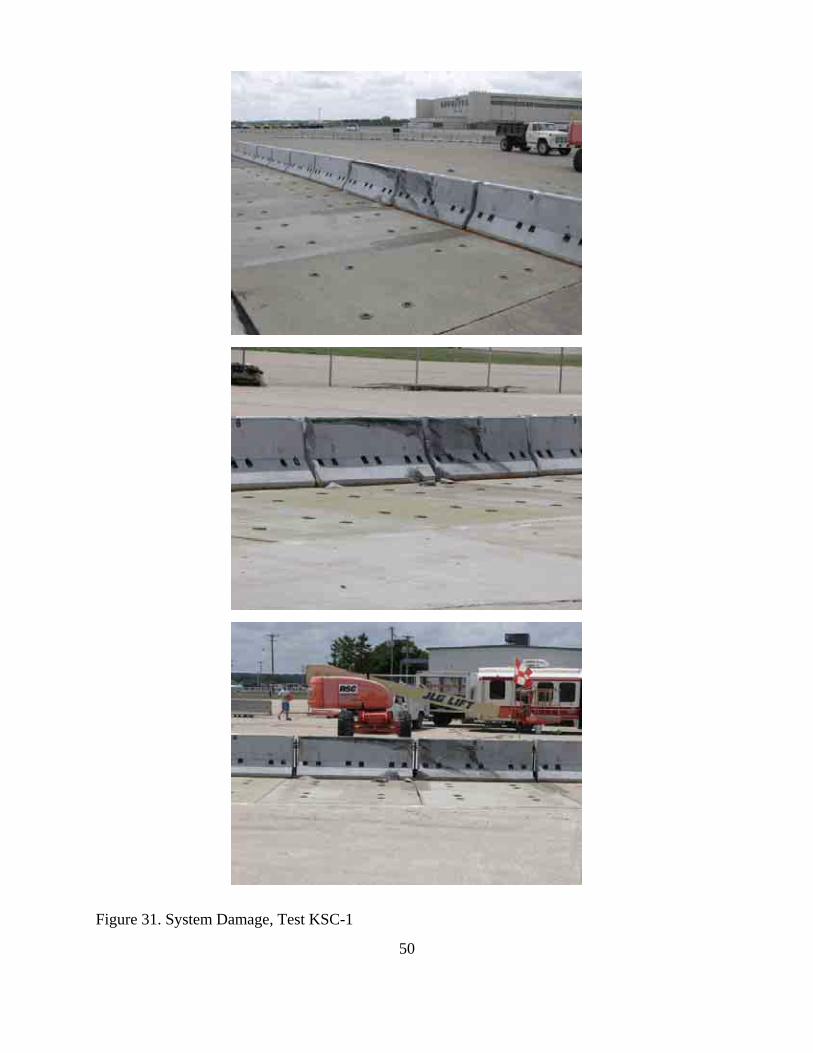
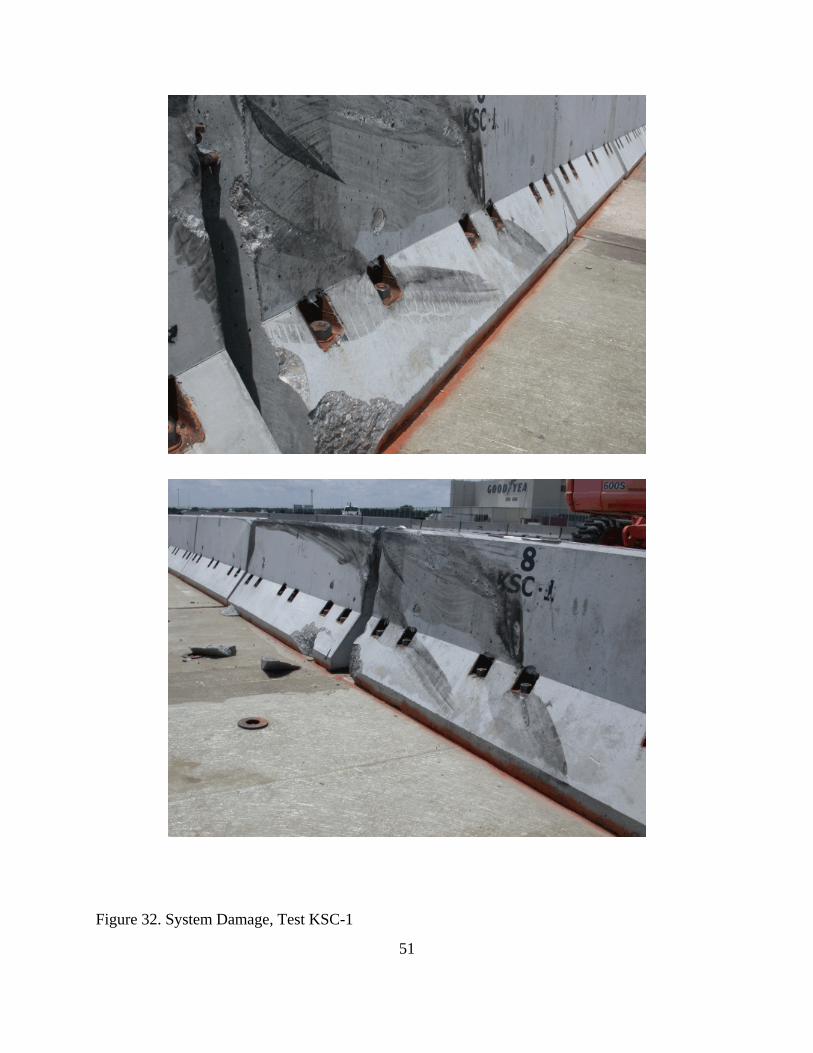
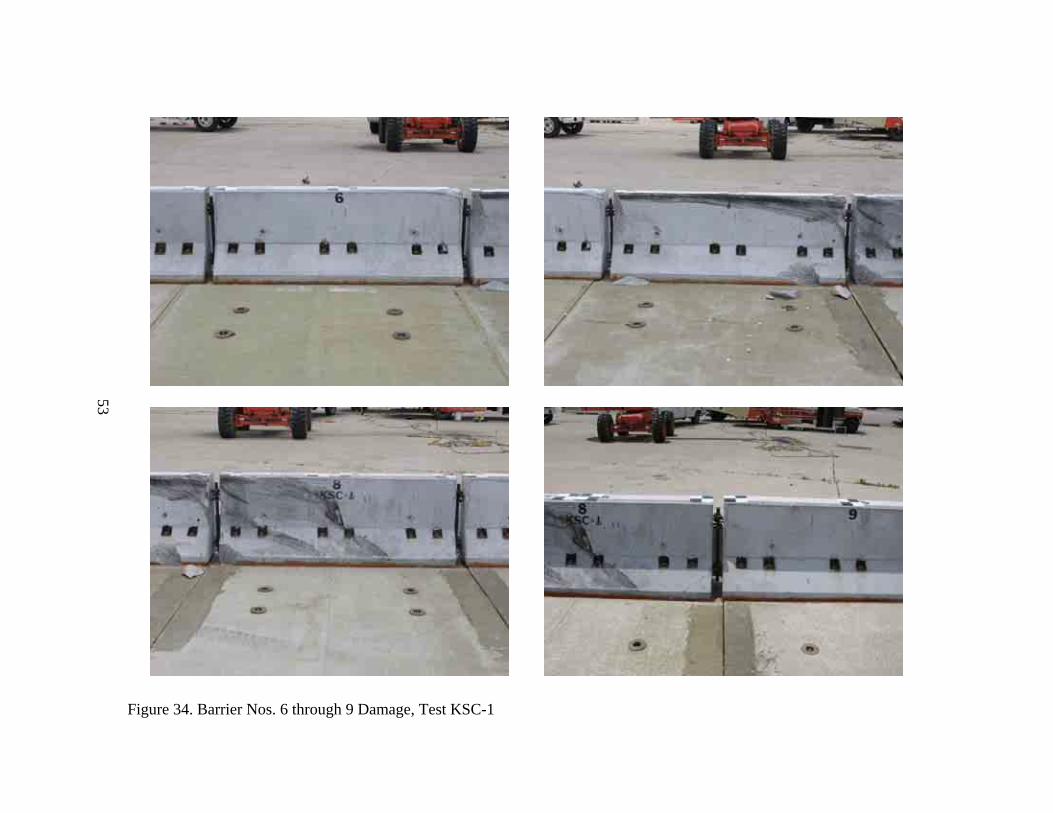
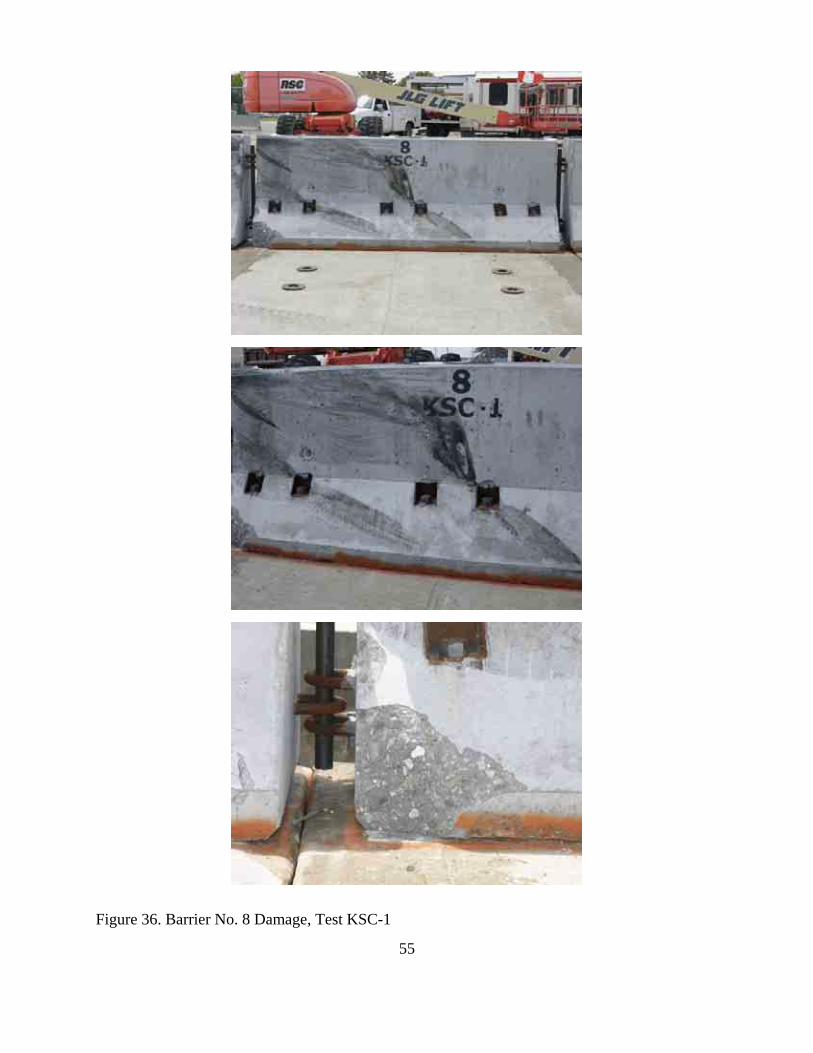
5.3 Barrier Damage
Damage to the barrier was moderate, as shown in Figures 31 through 41. Barrier damage
consisted of contact marks on the front face of the concrete barriers, spalling of the concrete, and
concrete cracking and failure. The length of vehicle contact along the barrier was approximately 5.1
m (16.7 ft) which spanned from 1,619 mm (63.75 in.) upstream from the center of the joint between
barrier nos. 7 and 8 to the center of barrier no. 6.
Tire marks were visible on the front face of barrier nos. 7 and 8 and the top edge of barrier
no. 6. Concrete failure occurred at both upstream and downstream bottom corners of barrier nos. 6
through 8. A 191-mm (7.5-in.) wide by 254-mm (10-in.) long piece of concrete was removed from
the downstream end of barrier no. 8. A 279-mm (11 in.) wide by 216-mm (8.5-in.) long piece of
concrete was fractured from the upstream corner of barrier no. 8, but remained attached to the
barrier. A 610-mm (24 in.) wide by 229-mm (9-in.) long piece of concrete, beginning 1,270 mm (50
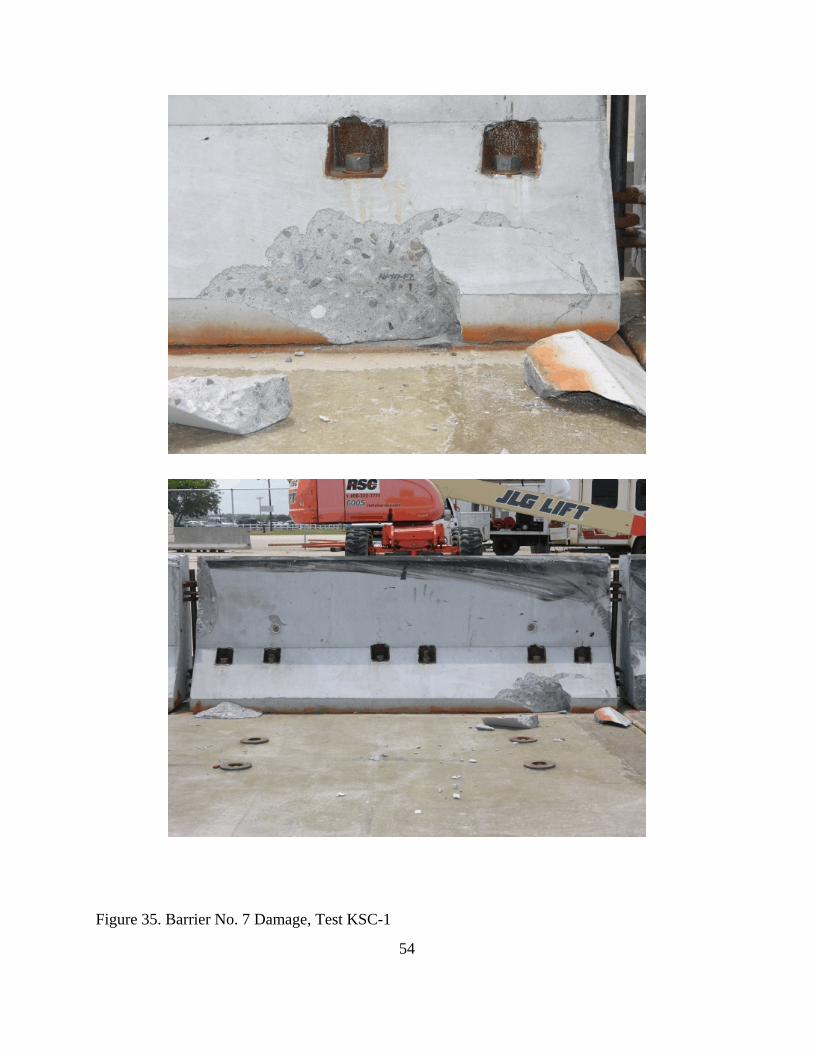
in.) downstream of impact, was removed from the front-bottom face of barrier no. 7. A 121-mm
(4.75 in.) wide by 451-mm (17.75-in.) long piece of concrete was removed from the front face of
barrier no. 7 at the downstream end. A 229-mm (9.0 in.) wide x 610-mm (24.0 in.) long x 55-mm
(2.125 in.) deep piece of concrete was removed from the downstream end of barrier no. 7. A 70-mm
37
(2.75 in.) wide x 76-mm (3-in.) long x 19-mm (0.75-in.) deep piece of concrete was removed from
the top-upstream corner of barrier no. 7. A 171-mm (6.75-in.) deep x 216-mm (8.5-in.) long x 76-
mm (3-in.) wide piece of concrete was removed from the top-upstream corner of barrier no. 6.
Small gouges were located across the faces of barrier nos. 7 and 8. A 127-mm (5-in.) long
x 25-mm (1-in.) wide gouge began 381 mm (15 in.) up from the ground and 1,048 mm (41.25 in.)
downstream from the upstream end of barrier no. 8. A 229-mm (9-in.) long x 51-mm (2-in.) wide
gouge was located 508 mm (20 in.) up from the ground and 1,200 mm (47.25 in.) downstream from
the upstream end of barrier no. 8. A 267-mm (10.5-in.) long x 38-mm (1.5-in.) wide gouge was
located 635 mm (25 in.) up from the ground and 1,683 mm (66.25 in.) downstream from the
upstream end of barrier no. 8. A 483-mm (19-in.) long gouge was located 749 mm (29.5 in.) up from
the ground and 1,708 mm (67.25 in.) downstream from the upstream end of barrier no. 8. A 64-mm
(2.5-in.) long x 102-mm (4-in.) wide gouge was located 457 mm (18 in.) up from the ground and 108
mm (4.25 in.) upstream from the downstream end of barrier no. 8. A 508-mm (20-in.) long x 13-mm
(0.5-in.) wide gouge was located 584 mm (23 in.) up from the ground and 25 mm (1 in.) downstream
from the upstream end of barrier no. 7. A 1,003-mm (39.5-in.) long gouge began at the upstream end
of barrier no. 7 and 508 mm (20 in.) up from the ground. A 127-mm (5-in.) long x 19-mm (0.75-in.)
wide gouge was located 762 mm (30 in.) up from the ground and 1,660 mm (65.375 in.) downstream
from the upstream end of barrier no. 7.
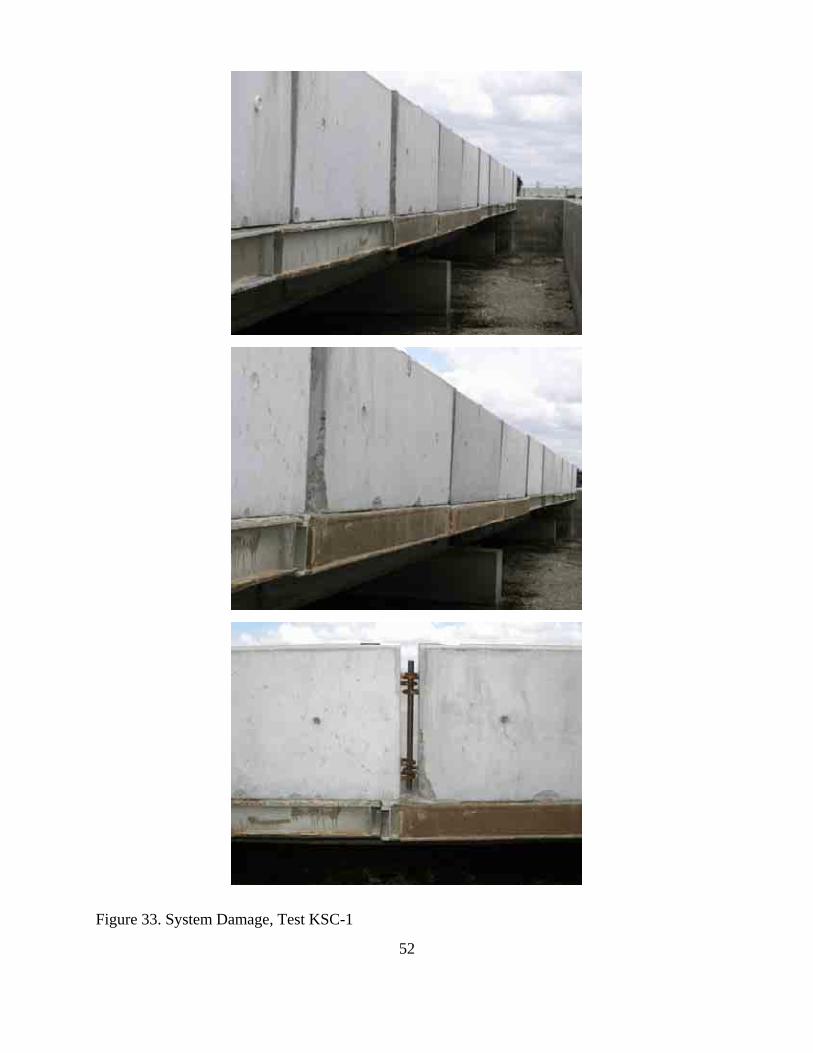
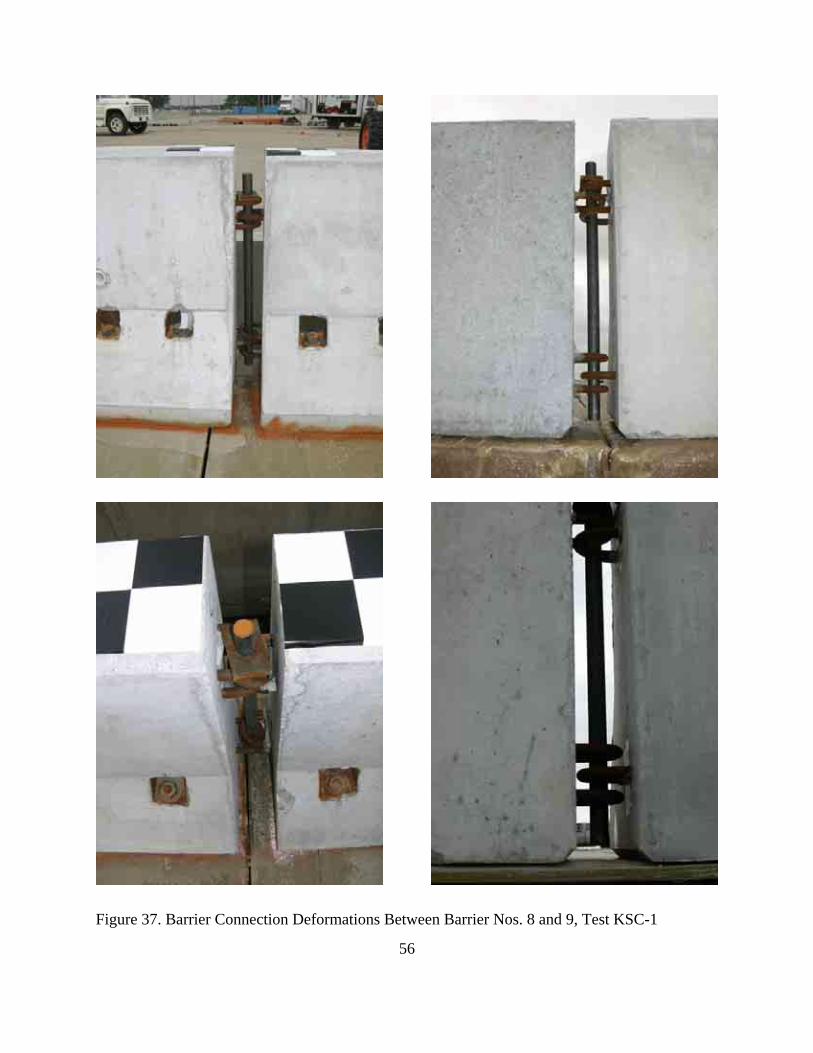
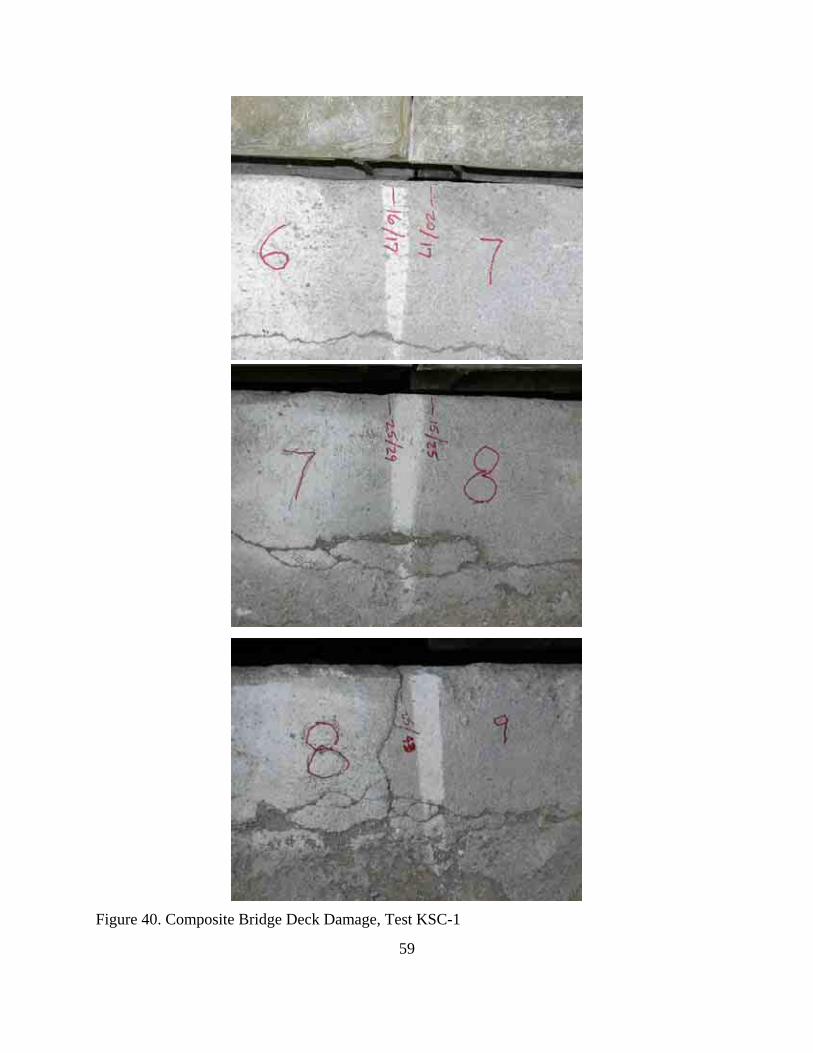
Composite deck failure did not occur at any of the anchor locations. Photographs of the
bridge deck cracking and displacement are shown in Figures 40 and 41. Deck panel nos. 7 through
9 encountered resin coating delaminating and random bubbling of the resin coating. The vertical C-
beam of panel no. 9 separated from the top layer of the deck. Panel no. 9 was displaced backward
38
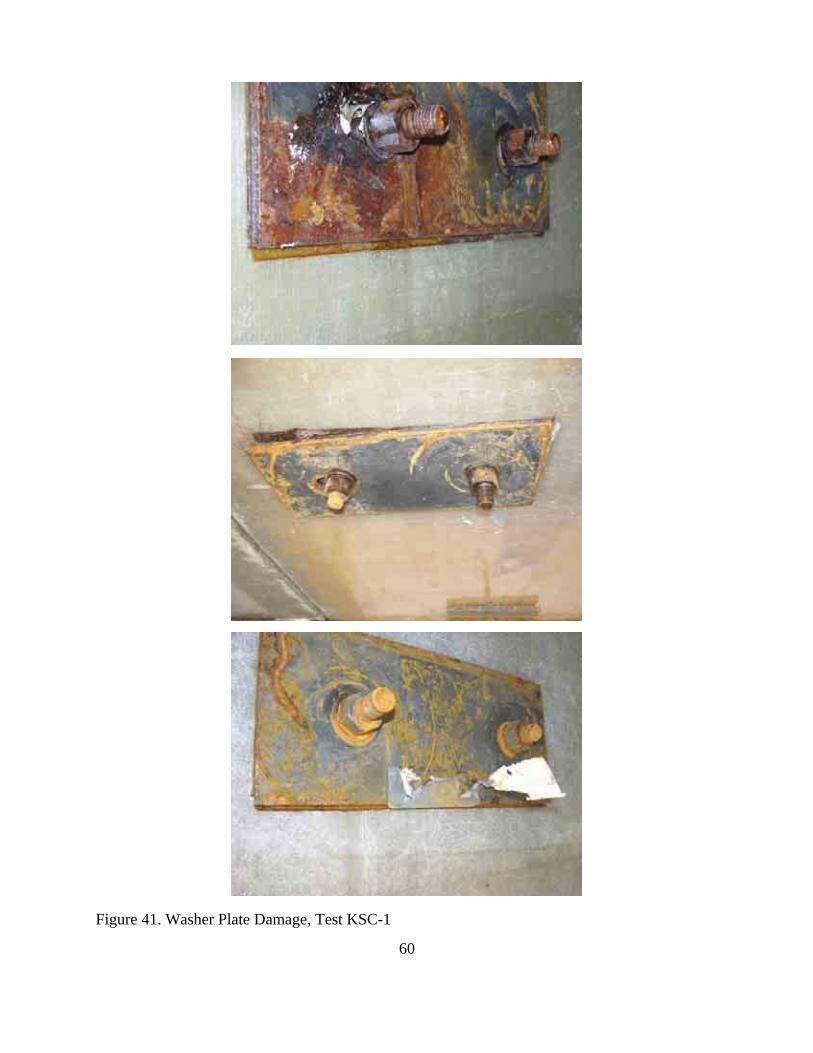
6 mm (0.25 in.) and panel no. 8 was displaced 13 mm (0.5 in.) upward. The barrier attachment
anchor plates on deck panel nos. 7 and 9 shifted downstream and were no longer flush with the
underside of the deck panels. The upstream barrier attachment anchor plate on deck panel no. 8 was
severely twisted.
The permanent set of the barrier system was negligible. The maximum lateral dynamic
barrier deflection, including tipping of the barrier along the top surface, was 109 mm (4.3 in.) at the
center of barrier no. 8, as determined from high-speed film analysis. The working width of the
system was found to be 732 mm (28.8 in.).
5.4 Vehicle Damage
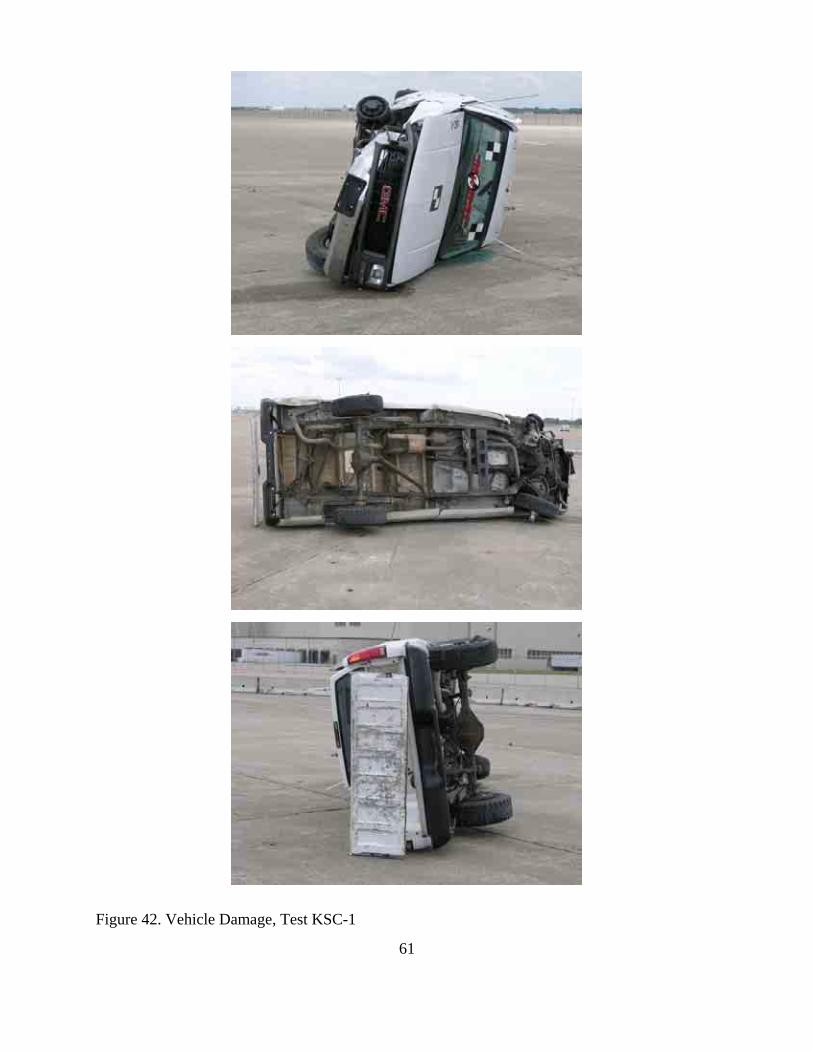
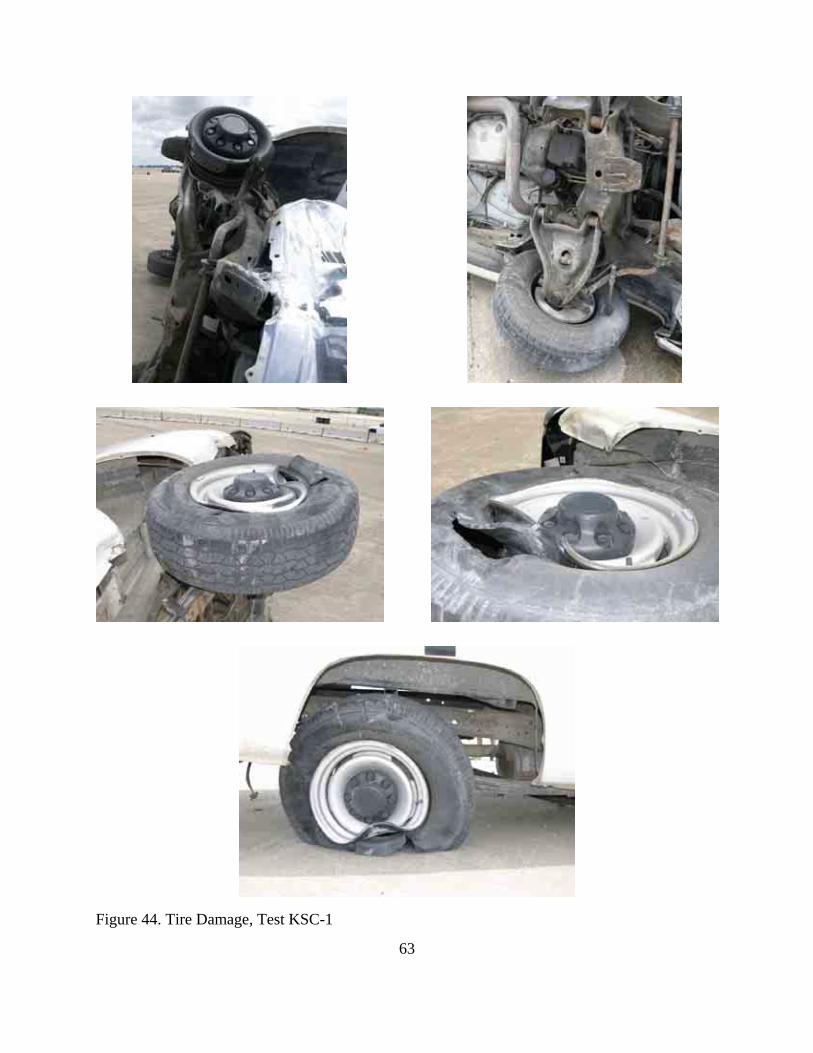
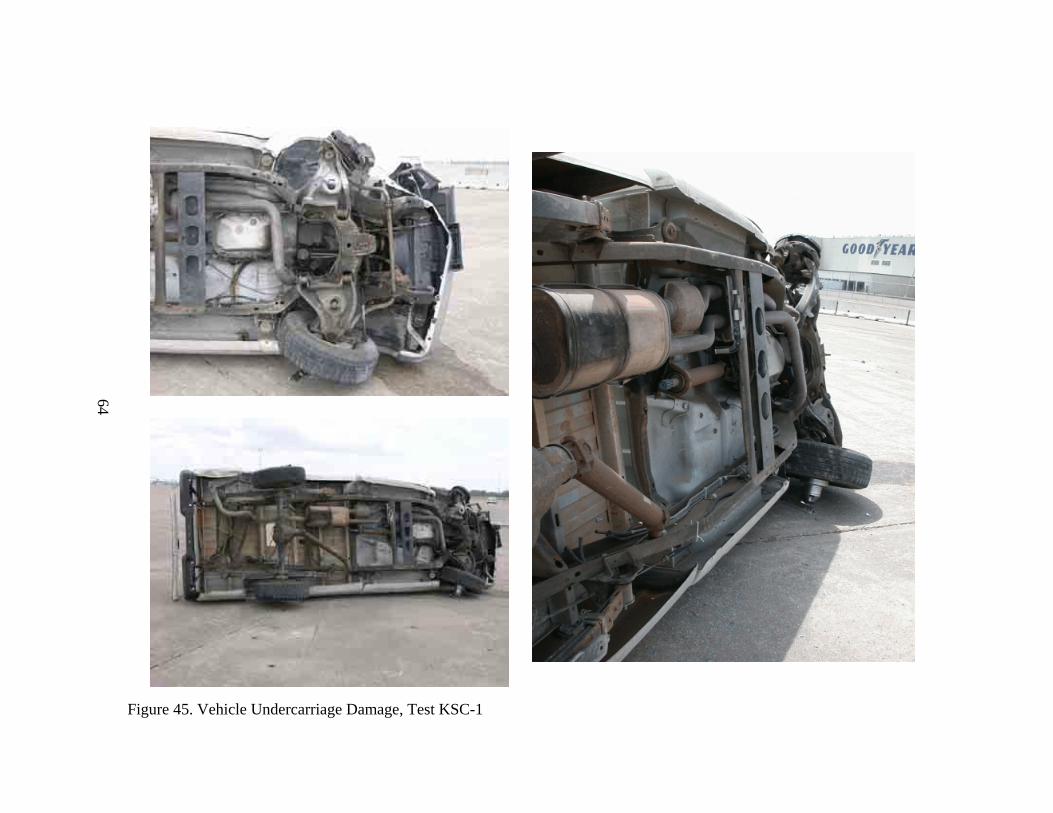
Exterior vehicle damage was extensive, as shown in Figures 42 through 46. The majority of
the damage was concentrated on the right-front corner and right side of the vehicle where the impact
occurred, as well as the left side where the vehicle rolled over. The right-front corner of the vehicle
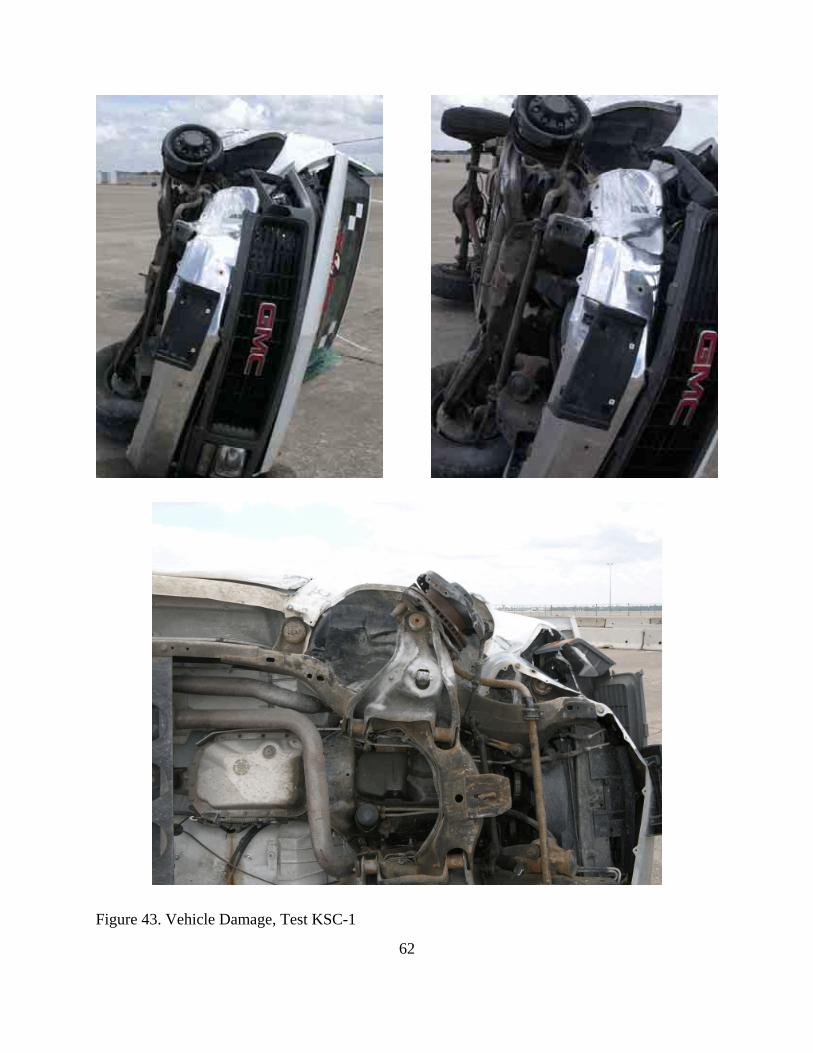
was crushed inward and back, including the fender, bumper, and frame rail. Buckling points were
found at the center and the right-front edge of the front bumper. Major frame damage was observed,
including fracture of the flange at the right-front box attachment. The lower-right control arm was
bent upwards. The right-rear leaf spring bracket was deformed, and the right-rear leaf spring was
fractured. The exhaust pipe was bent. The starter housing, starter, and rear axle housing were
fractured. The drive shaft disengaged at the yoke. Both right-side and left-side tie rod connections
failed with bent and fractured tie rods. The right-front and right-rear steel rims were severely
deformed. All four tires encountered scuff and scrape marks. Denting and scraping were observed
between the right-front quarter panel and the door. The top of the right-side door was ajar with a
133-mm (5.25-in.) gap. Minor scrapes and dents were also observed on both the right and left sides
39
of the vehicle due to contact with the barrier and vehicle rollover, respectively. The A-pillar and top
of the door frame on the left side were deformed inward. The grill was broken around the right-side
headlight assembly. The truck’s box twisted and produced an inconsistent gap between the box and
cab portions. The hood locking mechanism was deformed. The tailgate hinges fractured, but it
remained attached to the vehicle. Minor dents were found at the left-front corner of the roof. The
left-side window was shattered and removed, while the left side of the windshield encountered
severe cracking. The roof, the box, and remaining window glass remained undamaged.
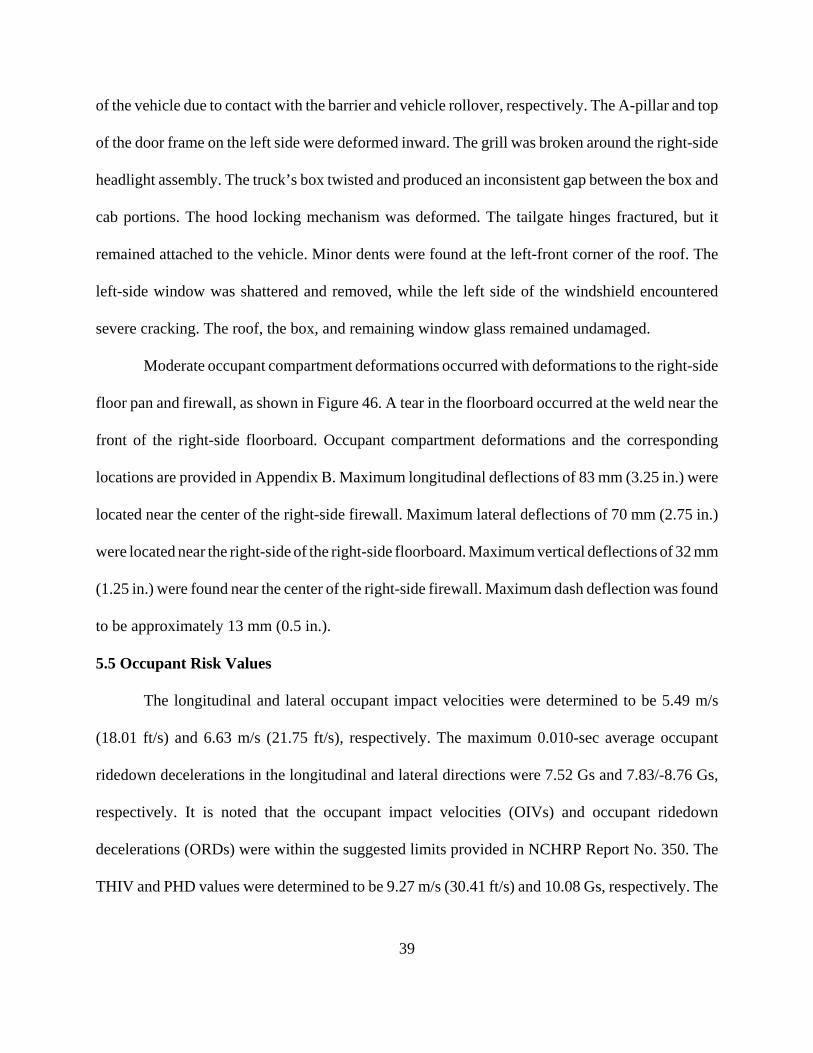
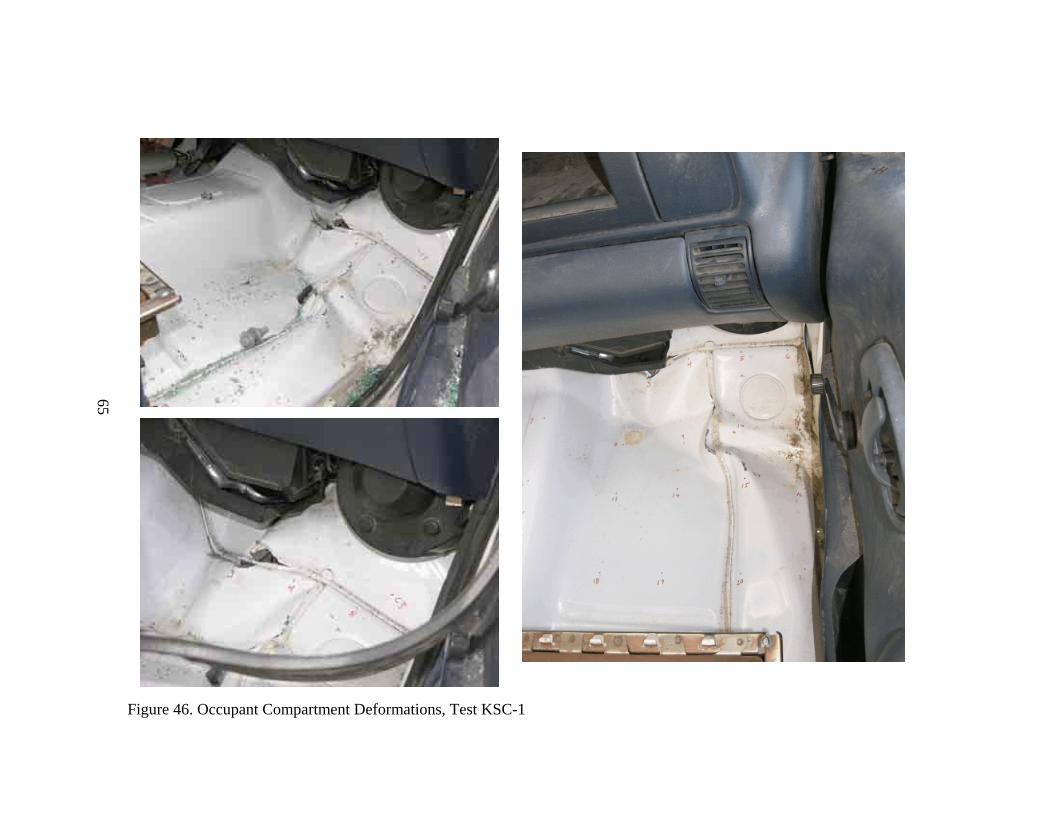
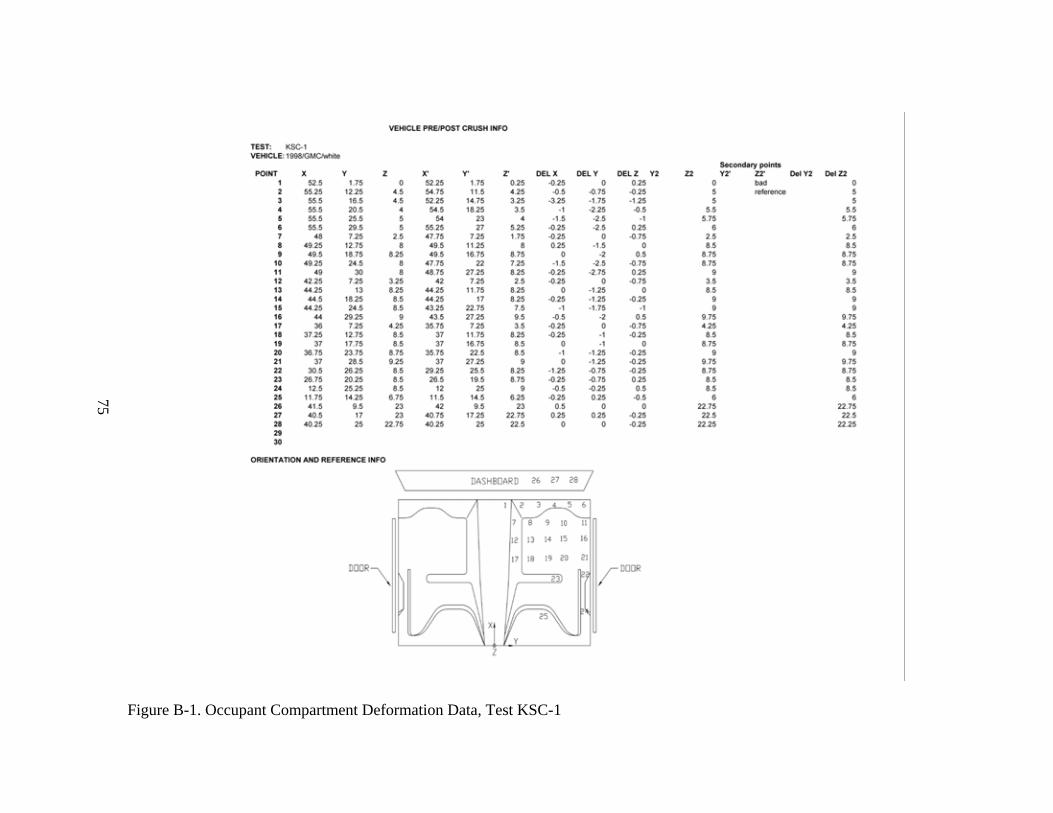
Moderate occupant compartment deformations occurred with deformations to the right-side
floor pan and firewall, as shown in Figure 46. A tear in the floorboard occurred at the weld near the
front of the right-side floorboard. Occupant compartment deformations and the corresponding
locations are provided in Appendix B. Maximum longitudinal deflections of 83 mm (3.25 in.) were
located near the center of the right-side firewall. Maximum lateral deflections of 70 mm (2.75 in.)
were located near the right-side of the right-side floorboard. Maximum vertical deflections of 32 mm
(1.25 in.) were found near the center of the right-side firewall. Maximum dash deflection was found
to be approximately 13 mm (0.5 in.).
5.5 Occupant Risk Values
The longitudinal and lateral occupant impact velocities were determined to be 5.49 m/s
(18.01 ft/s) and 6.63 m/s (21.75 ft/s), respectively. The maximum 0.010-sec average occupant
ridedown decelerations in the longitudinal and lateral directions were 7.52 Gs and 7.83/-8.76 Gs,
respectively. It is noted that the occupant impact velocities (OIVs) and occupant ridedown
decelerations (ORDs) were within the suggested limits provided in NCHRP Report No. 350. The
THIV and PHD values were determined to be 9.27 m/s (30.41 ft/s) and 10.08 Gs, respectively. The
40
results of the occupant risk, determined from the accelerometer data, are summarized in Figure 22.
Results are shown graphically in Appendix C. The results from the rate transducer are shown
graphically in Appendix C.
5.6 Discussion
The analysis of the test results for test no. KSC-1 showed that the bridge railing system
attached to a composite panel bridge deck adequately contained the impacting pickup truck.
However, it did not safely redirect the vehicle since the vehicle did not remain upright after collision
with the barrier. There were no detached elements nor fragments which showed potential for
penetrating the occupant compartment nor presented undue hazard to other traffic. Deformations of,
or intrusion into, the occupant compartment that could have caused serious injury did not occur.
After collision, the vehicle’s trajectory revealed minimum intrusion into adjacent traffic lanes, but
rollover of the vehicle was unacceptable. In addition, the vehicle’s exit angle was less than 60
percent of the impact angle. Therefore, test no. KSC-1 conducted on the bridge railing system
attached to a composite panel bridge deck was determined to be unacceptable for use according to
the TL-3 safety performance criteria found in NCHRP Report No. 350.
41
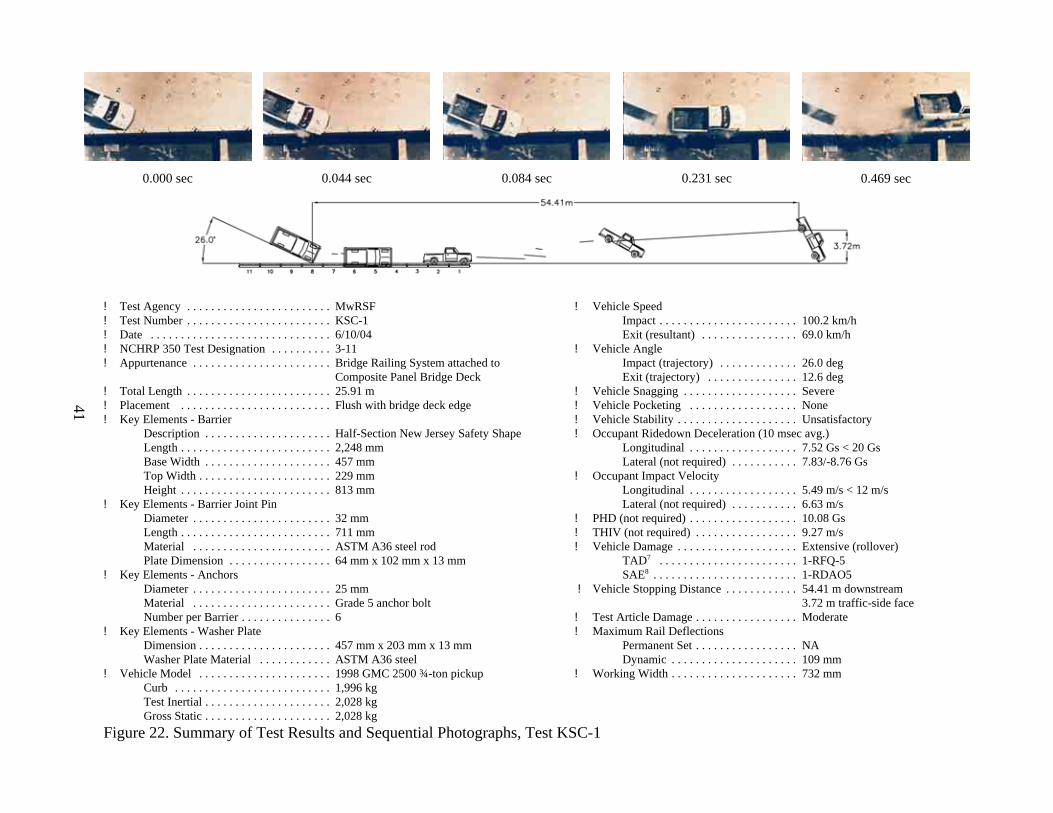
0.044 sec 0.084 sec 0.231 sec 0.469 sec0.000 sec
! Test Agency . . . . . . . . . . . . . . . . . . . . . . . . MwRSF! Test Number . . . . . . . . . . . . . . . . . . . . . . . . KSC-1! Date . . . . . . . . . . . . . . . . . . . . . . . . . . . . . . 6/10/04! NCHRP 350 Test Designation . . . . . . . . . . 3-11! Appurtenance . . . . . . . . . . . . . . . . . . . . . . . Bridge Railing System attached to
Composite Panel Bridge Deck! Total Length . . . . . . . . . . . . . . . . . . . . . . . . 25.91 m! Placement . . . . . . . . . . . . . . . . . . . . . . . . . Flush with bridge deck edge! Key Elements - Barrier
Description . . . . . . . . . . . . . . . . . . . . . Half-Section New Jersey Safety ShapeLength . . . . . . . . . . . . . . . . . . . . . . . . . 2,248 mmBase Width . . . . . . . . . . . . . . . . . . . . . 457 mmTop Width . . . . . . . . . . . . . . . . . . . . . . 229 mmHeight . . . . . . . . . . . . . . . . . . . . . . . . . 813 mm
! Key Elements - Barrier Joint PinDiameter . . . . . . . . . . . . . . . . . . . . . . . 32 mmLength . . . . . . . . . . . . . . . . . . . . . . . . . 711 mmMaterial . . . . . . . . . . . . . . . . . . . . . . . ASTM A36 steel rodPlate Dimension . . . . . . . . . . . . . . . . . 64 mm x 102 mm x 13 mm
! Key Elements - AnchorsDiameter . . . . . . . . . . . . . . . . . . . . . . . 25 mmMaterial . . . . . . . . . . . . . . . . . . . . . . . Grade 5 anchor boltNumber per Barrier . . . . . . . . . . . . . . . 6
! Key Elements - Washer PlateDimension . . . . . . . . . . . . . . . . . . . . . . 457 mm x 203 mm x 13 mmWasher Plate Material . . . . . . . . . . . . ASTM A36 steel
! Vehicle Model . . . . . . . . . . . . . . . . . . . . . . 1998 GMC 2500 ¾-ton pickupCurb . . . . . . . . . . . . . . . . . . . . . . . . . . 1,996 kgTest Inertial . . . . . . . . . . . . . . . . . . . . . 2,028 kgGross Static . . . . . . . . . . . . . . . . . . . . . 2,028 kg
! Vehicle SpeedImpact . . . . . . . . . . . . . . . . . . . . . . . 100.2 km/hExit (resultant) . . . . . . . . . . . . . . . . 69.0 km/h
! Vehicle AngleImpact (trajectory) . . . . . . . . . . . . . 26.0 degExit (trajectory) . . . . . . . . . . . . . . . 12.6 deg
! Vehicle Snagging . . . . . . . . . . . . . . . . . . . Severe! Vehicle Pocketing . . . . . . . . . . . . . . . . . . None! Vehicle Stability . . . . . . . . . . . . . . . . . . . . Unsatisfactory! Occupant Ridedown Deceleration (10 msec avg.)
Longitudinal . . . . . . . . . . . . . . . . . . 7.52 Gs < 20 GsLateral (not required) . . . . . . . . . . . 7.83/-8.76 Gs
! Occupant Impact VelocityLongitudinal . . . . . . . . . . . . . . . . . . 5.49 m/s < 12 m/sLateral (not required) . . . . . . . . . . . 6.63 m/s
! PHD (not required) . . . . . . . . . . . . . . . . . . 10.08 Gs! THIV (not required) . . . . . . . . . . . . . . . . . 9.27 m/s! Vehicle Damage . . . . . . . . . . . . . . . . . . . . Extensive (rollover)
TAD7 . . . . . . . . . . . . . . . . . . . . . . . 1-RFQ-5SAE8 . . . . . . . . . . . . . . . . . . . . . . . . 1-RDAO5
! Vehicle Stopping Distance . . . . . . . . . . . . 54.41 m downstream3.72 m traffic-side face
! Test Article Damage . . . . . . . . . . . . . . . . . Moderate! Maximum Rail Deflections
Permanent Set . . . . . . . . . . . . . . . . . NADynamic . . . . . . . . . . . . . . . . . . . . . 109 mm
! Working Width . . . . . . . . . . . . . . . . . . . . . 732 mm
Figure 22. Summary of Test Results and Sequential Photographs, Test KSC-1
42
0.000 sec
0.090 sec
0.210 sec
0.330 sec
0.450 sec
0.610 sec
0.000 sec
0.040 sec
0.140 sec
0.080 sec
0.210 sec
0.330 sec
Figure 23. Additional Sequential Photographs, Test KSC-1
43
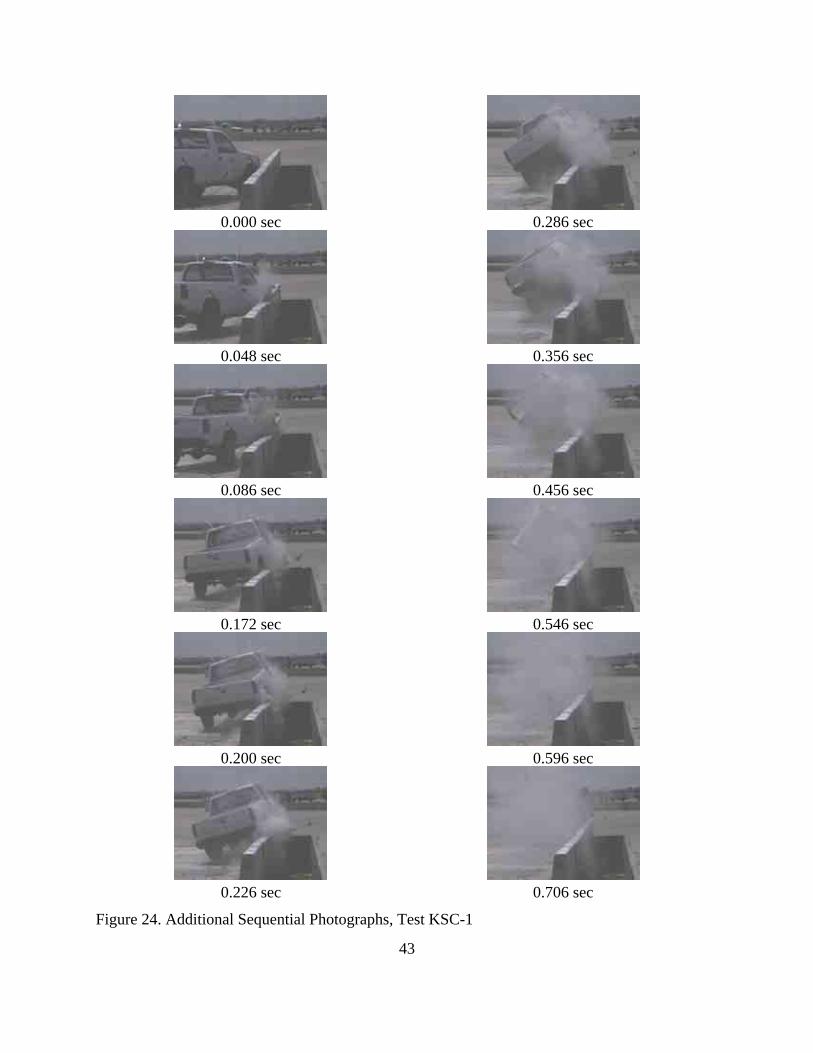
0.048 sec
0.000 sec
0.086 sec
0.172 sec
0.200 sec
0.226 sec
0.286 sec
0.356 sec
0.546 sec
0.456 sec
0.596 sec
0.706 sec
Figure 24. Additional Sequential Photographs, Test KSC-1
44
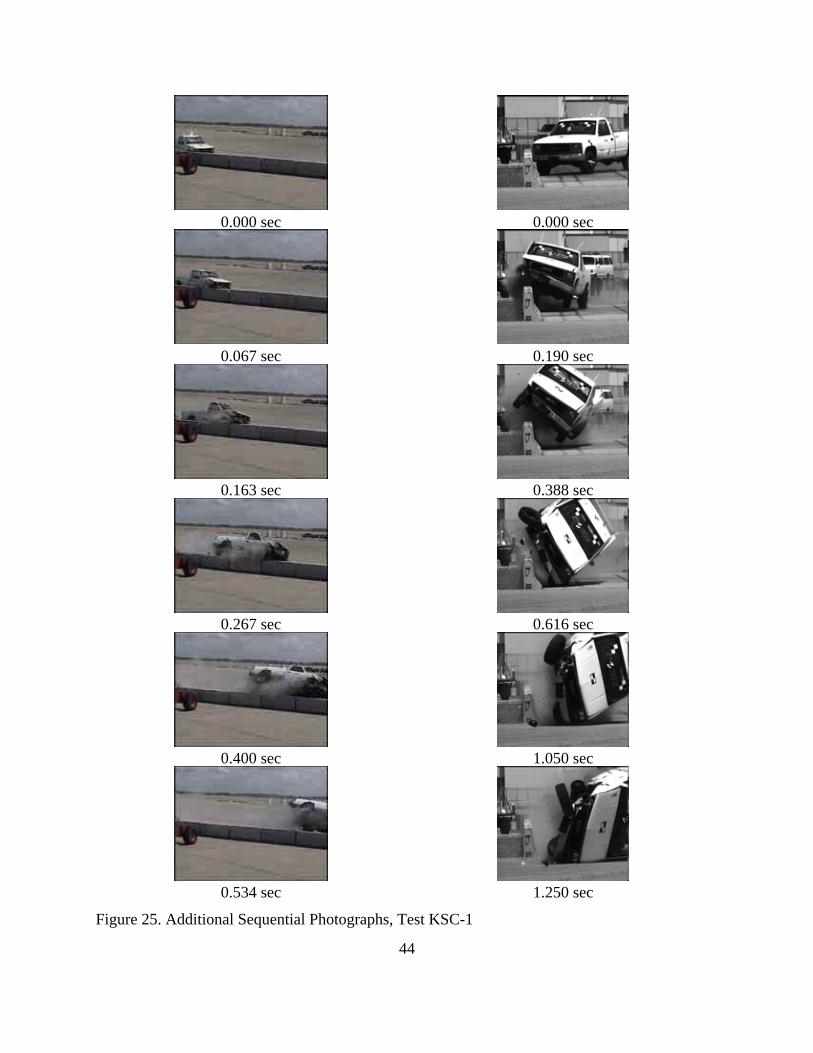
0.000 sec
0.067 sec
0.163 sec
0.267 sec
0.400 sec
0.534 sec
0.000 sec
0.190 sec
0.616 sec
0.388 sec
1.050 sec
1.250 sec
Figure 25. Additional Sequential Photographs, Test KSC-1
45
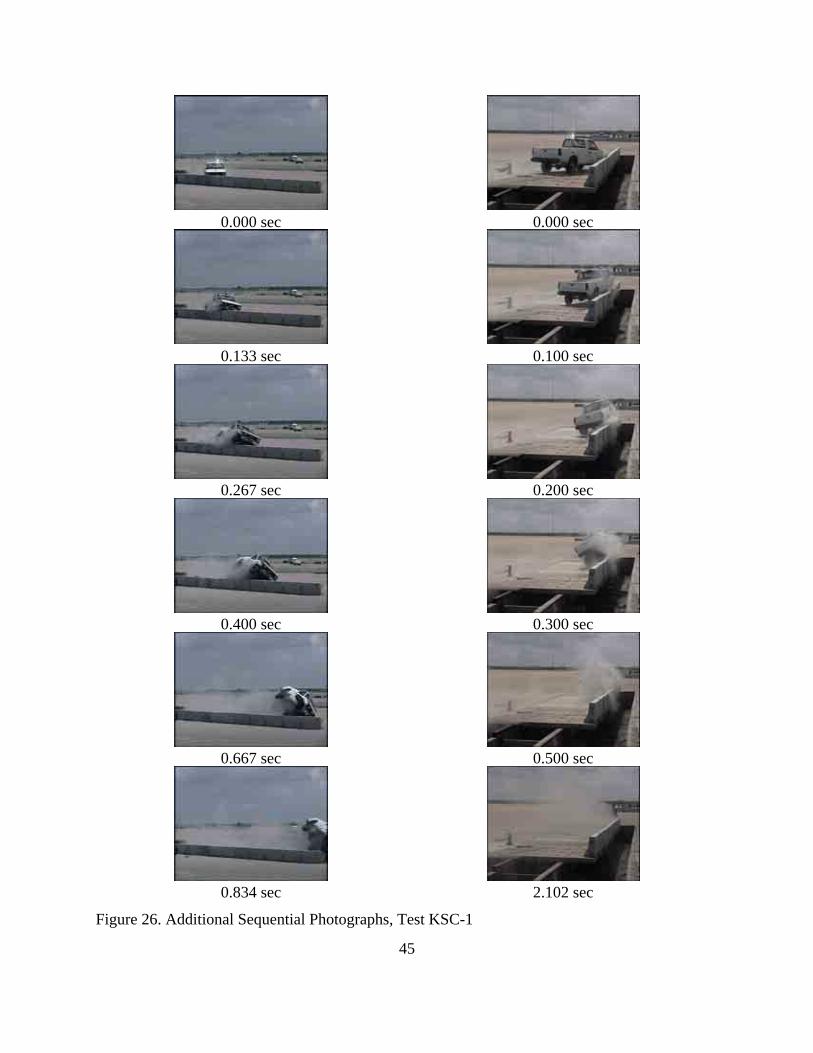
0.000 sec
0.133 sec
0.267 sec
0.400 sec
0.667 sec
0.834 sec
0.000 sec
0.100 sec
0.300 sec
0.200 sec
0.500 sec
2.102 sec
Figure 26. Additional Sequential Photographs, Test KSC-1
46
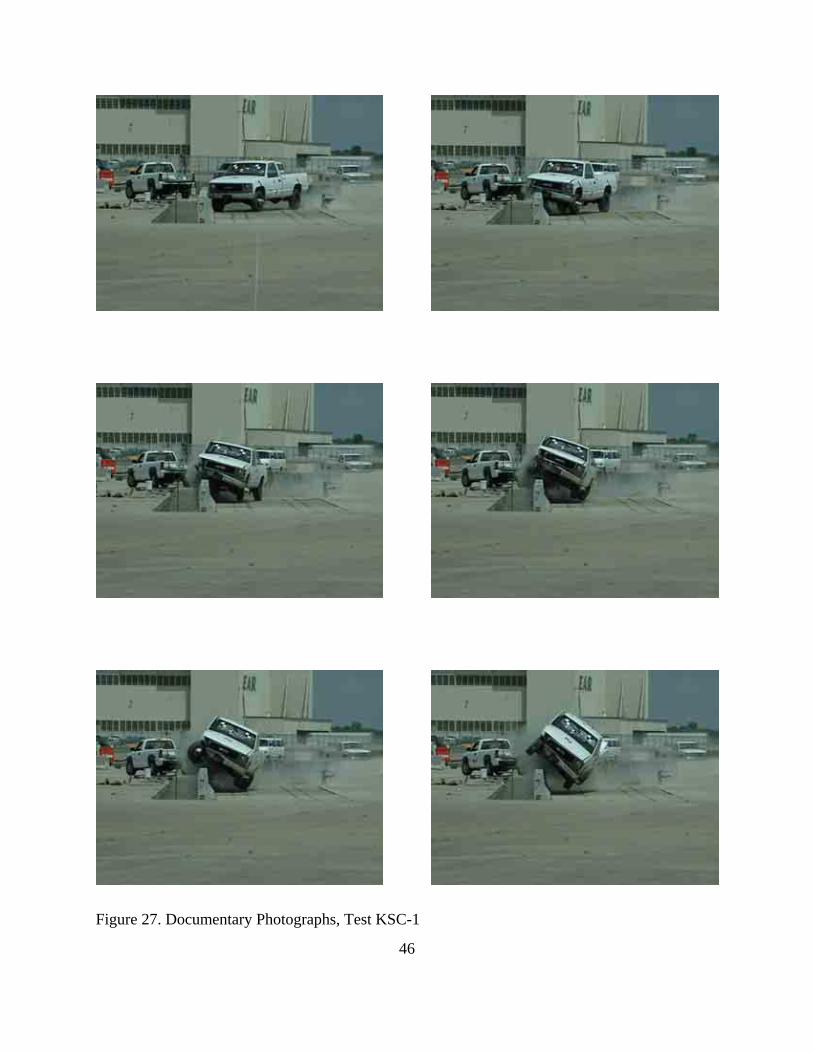
Figure 27. Documentary Photographs, Test KSC-1
47
Figure 28. Documentary Photographs, Test KSC-1
48
Figure 29. Impact Location, Test KSC-1
49
Figure 30. Vehicle Final Position, Test KSC-1
50
Figure 31. System Damage, Test KSC-1
51
Figure 32. System Damage, Test KSC-1
52
Figure 33. System Damage, Test KSC-1
53
Figure 34. Barrier Nos. 6 through 9 Damage, Test KSC-1
54
Figure 35. Barrier No. 7 Damage, Test KSC-1
55
Figure 36. Barrier No. 8 Damage, Test KSC-1
56
Figure 37. Barrier Connection Deformations Between Barrier Nos. 8 and 9, Test KSC-1
57
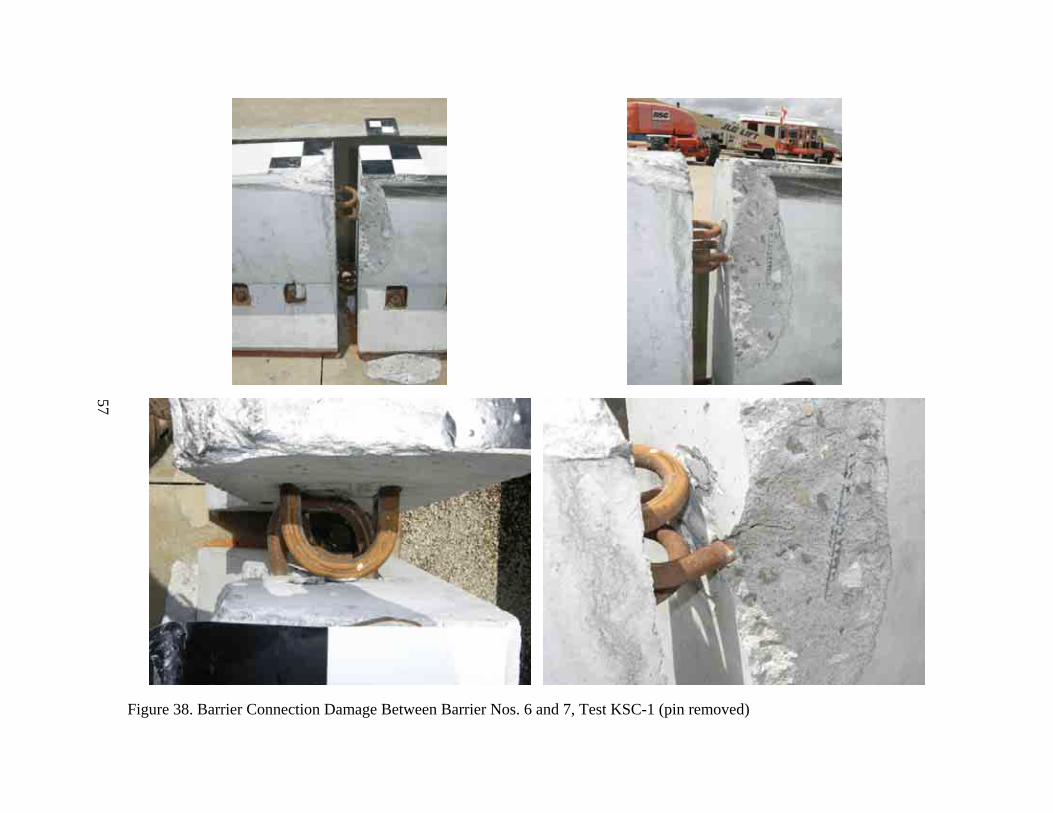
Figure 38. Barrier Connection Damage Between Barrier Nos. 6 and 7, Test KSC-1 (pin removed)
58
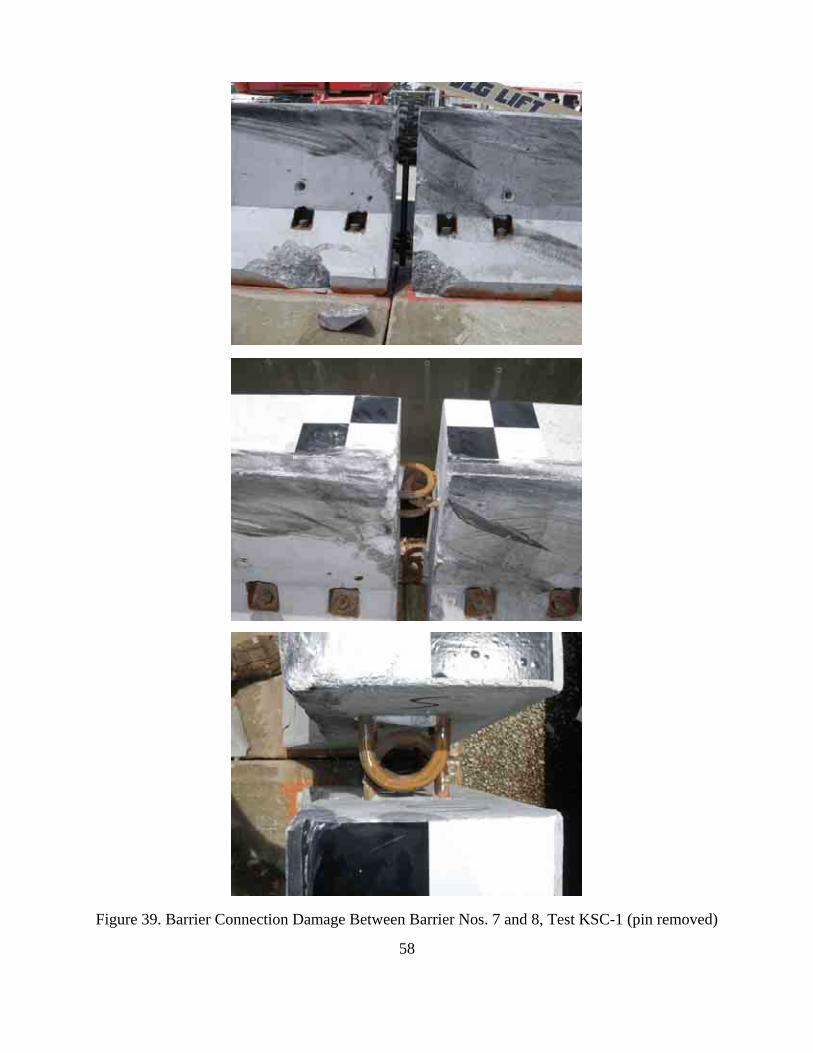
Figure 39. Barrier Connection Damage Between Barrier Nos. 7 and 8, Test KSC-1 (pin removed)
59
Figure 40. Composite Bridge Deck Damage, Test KSC-1
60
Figure 41. Washer Plate Damage, Test KSC-1
61
Figure 42. Vehicle Damage, Test KSC-1
62
Figure 43. Vehicle Damage, Test KSC-1
63
Figure 44. Tire Damage, Test KSC-1
64
Figure 45. Vehicle Undercarriage Damage, Test KSC-1
65
Figure 46. Occupant Compartment Deformations, Test KSC-1
66
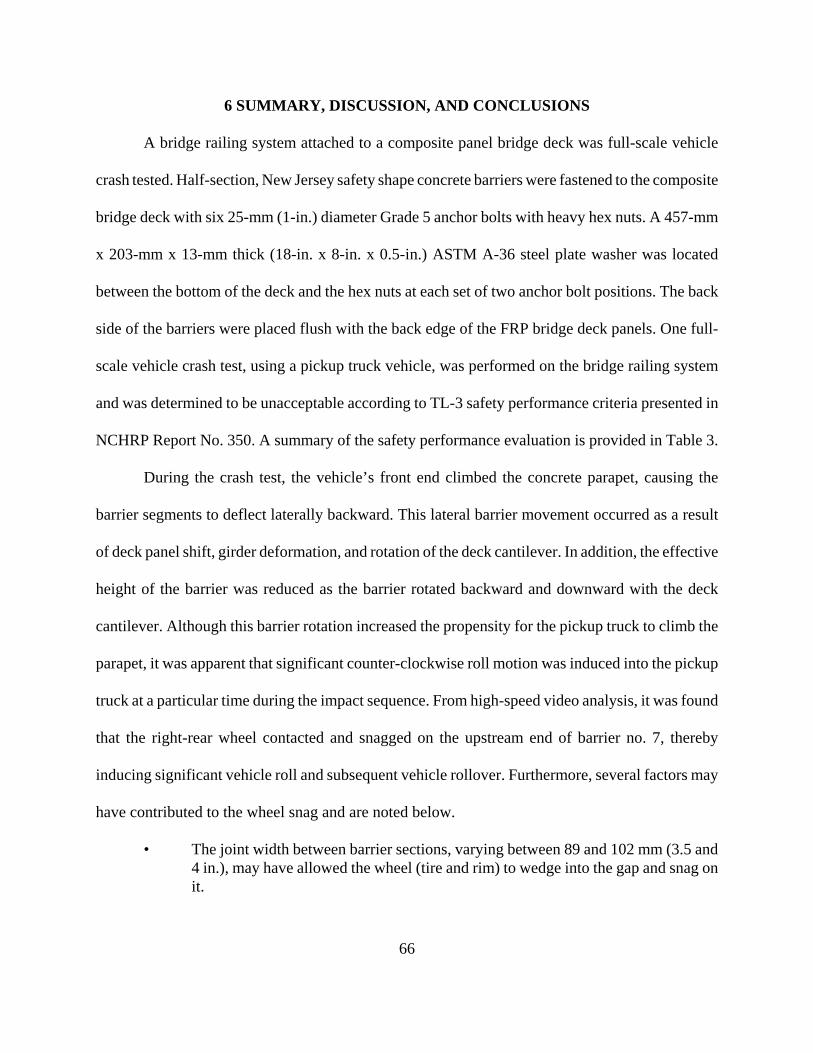
6 SUMMARY, DISCUSSION, AND CONCLUSIONS
A bridge railing system attached to a composite panel bridge deck was full-scale vehicle
crash tested. Half-section, New Jersey safety shape concrete barriers were fastened to the composite
bridge deck with six 25-mm (1-in.) diameter Grade 5 anchor bolts with heavy hex nuts. A 457-mm
x 203-mm x 13-mm thick (18-in. x 8-in. x 0.5-in.) ASTM A-36 steel plate washer was located
between the bottom of the deck and the hex nuts at each set of two anchor bolt positions. The back
side of the barriers were placed flush with the back edge of the FRP bridge deck panels. One full-
scale vehicle crash test, using a pickup truck vehicle, was performed on the bridge railing system
and was determined to be unacceptable according to TL-3 safety performance criteria presented in
NCHRP Report No. 350. A summary of the safety performance evaluation is provided in Table 3.
During the crash test, the vehicle’s front end climbed the concrete parapet, causing the
barrier segments to deflect laterally backward. This lateral barrier movement occurred as a result
of deck panel shift, girder deformation, and rotation of the deck cantilever. In addition, the effective
height of the barrier was reduced as the barrier rotated backward and downward with the deck
cantilever. Although this barrier rotation increased the propensity for the pickup truck to climb the
parapet, it was apparent that significant counter-clockwise roll motion was induced into the pickup
truck at a particular time during the impact sequence. From high-speed video analysis, it was found
that the right-rear wheel contacted and snagged on the upstream end of barrier no. 7, thereby
inducing significant vehicle roll and subsequent vehicle rollover. Furthermore, several factors may
have contributed to the wheel snag and are noted below.
• The joint width between barrier sections, varying between 89 and 102 mm (3.5 and4 in.), may have allowed the wheel (tire and rim) to wedge into the gap and snag onit.
67
• The transverse slack between the inner loops and the drop pin may have allowed thedownstream end of barrier no. 8 to be pushed back before the upstream edge ofbarrier no. 7 began to move back, thus creating a larger surface/edge to snag against.Additional movement may have occurred as a result of plastic deformation of theloops during loading,
• The barriers were attached to the bridge deck panels using a configuration whichallowed one barrier to be anchored to one deck panel instead of anchoring to multipledeck panels. This attachment configuration likely: (1) increased the potential forrelative barrier shift at a joint; (2) increased lateral barrier movement; (3) increasedbarrier and deck cantilever rotation; and (4) allowed for greater downward movementof the effective barrier height, which all may have increased vehicle climbing andwheel snag.
• The steel plate detail used to attach the deck panels to the girders may have allowedadditional panel shift for the laterally loaded panels, thus resulting in an increasedexposure for wheel snag at the barrier gap locations.
68
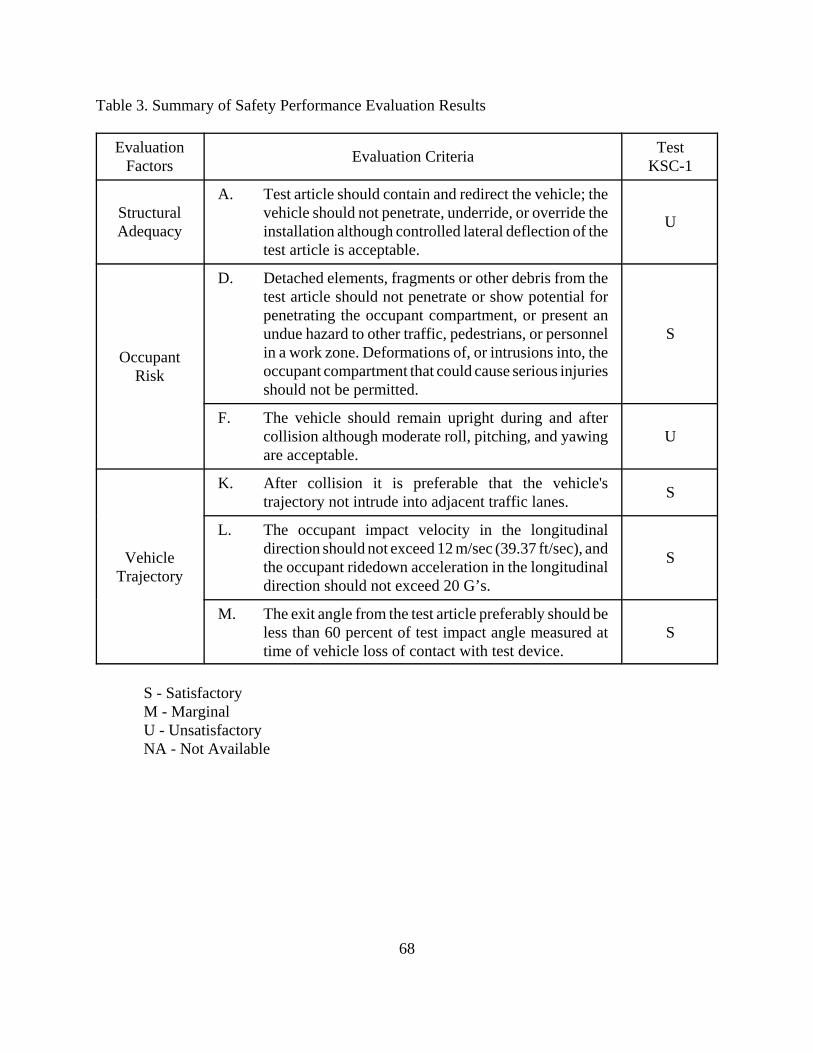
Table 3. Summary of Safety Performance Evaluation Results
EvaluationFactors Evaluation Criteria Test
KSC-1
StructuralAdequacy
A. Test article should contain and redirect the vehicle; thevehicle should not penetrate, underride, or override theinstallation although controlled lateral deflection of thetest article is acceptable.
U
OccupantRisk
D. Detached elements, fragments or other debris from thetest article should not penetrate or show potential forpenetrating the occupant compartment, or present anundue hazard to other traffic, pedestrians, or personnelin a work zone. Deformations of, or intrusions into, theoccupant compartment that could cause serious injuriesshould not be permitted.
S
F. The vehicle should remain upright during and aftercollision although moderate roll, pitching, and yawingare acceptable.
U
VehicleTrajectory
K. After collision it is preferable that the vehicle'strajectory not intrude into adjacent traffic lanes. S
L. The occupant impact velocity in the longitudinaldirection should not exceed 12 m/sec (39.37 ft/sec), andthe occupant ridedown acceleration in the longitudinaldirection should not exceed 20 G’s.
S
M. The exit angle from the test article preferably should beless than 60 percent of test impact angle measured attime of vehicle loss of contact with test device.
S
S - SatisfactoryM - MarginalU - UnsatisfactoryNA - Not Available
69
7 RECOMMENDATIONS
A bridge railing system attached to a composite panel bridge deck, as described in this report,
was unsuccessfully crash tested according to the criteria found in NCHRP Report No. 350. The test
results indicate that this design is not suitable for use on Federal-aid highways.
However, following an analysis of the unsuccessful test results and the identification of the
wheel snag problem, it was determined that modifications could be made to the system in order to
increase its chances of successfully meeting the requirements specified in NCHRP Report No. 350.
One change may include decreasing the gap width by incorporating a recessed region at the barrier
ends in a manner similar to that used by the Oregon DOT. Another change may include minimizing
lateral joint slack either by increasing the connection pin size, inserting a pipe sleeve, or some other
joint detail providing improved load transfer across the gap (i.e., moment and/or shear plates across
joint on the back side, double plate cap system at joint in combination with alternative drop in and/or
end connection detail). A third change may include utilizing longer barrier segments and/or
attachment of barriers across the deck panel joints in order to engage more than one panel at a time.
A fourth change may entail attaching a structural beam member to the bottom of the deck panels that
runs parallel to the barrier and which traverses the joints between panels. A final change may
include modifying the composite deck in the cantilevered region in order to reduce rotations and
engage more panels when the barrier is loaded (i.e., deck stiffening and/or the addition of a keyway
detail to engage adjacent panels). However, any significant modifications made to the bridge railing
system would require additional analysis and can only be verified through the use of full-scale crash
testing.
70
8 REFERENCES
1. Ross, H.E., Sicking, D.L., Zimmer, R.A., and Michie, J.D., Recommended Procedures forthe Safety Performance Evaluation of Highway Features, National Cooperative ResearchProgram (NCHRP) Report No. 350, Transportation Research Board, Washington, D.C.,1993.
2. Buth, C.E., Hirsch, T.J., and McDevitt, C.F., Performance Level 2 Bridge Railings,Transportation Research Record No. 1258, Transportation Research Board, NationalResearch Council, Washington, D.C., 1990.
3. Bronstad, M.E., Calcote, L.R., and Kimball, C.E., Jr., Concrete Median Barrier Research-Vol.2 Research Report, Report No. FHWA-RD-77-4, Submitted to the Office of Researchand Development, Federal Highway Administration, Performed by Southwest ResearchInstitute, San Antonio, TX, March 1976.
4. Buth, C.E., Campise, W.L., Griffin III, L.I., Love, M.L., and Sicking, D.L., PerformanceLimits of Longitudinal Barrier Systems-Volume I: Summary Report, FHWA/RD-86/153,Final Report to the Federal Highway Administration, Office of Safety and Traffic OperationsR&D, Performed by Texas Transportation Institute, Texas A&M University, CollegeStation, TX, May 1986.
5. Fortuniewicz, J.S., Bryden, J.E., and Phillips, R.G., Crash Tests of Portable ConcreteMedian Barrier for Maintenance Zones, Report No. FHWA/NY/RR-82/102, Final Reportto the Office of Research, Development, and Technology, Federal Highway Administration,Performed by the Engineering Research and Development Bureau, New York StateDepartment of Transportation, December 1982.
6. Hinch, J., Yang, T.L., and Owings, R., Guidance Systems for Vehicle Testing, ENSCO, Inc.,Springfield, VA, 1986.
7. Vehicle Damage Scale for Traffic Investigators, Second Edition, Technical Bulletin No. 1,Traffic Accident Data (TAD) Project, National Safety Council, Chicago, Illinois, 1971.
8. Collision Deformation Classification - Recommended Practice J224 March 1980, HandbookVolume 4, Society of Automotive Engineers (SAE), Warrendale, Pennsylvania, 1985.

71
9 APPENDICES

72
APPENDIX A
Test Summary Sheet in English Units
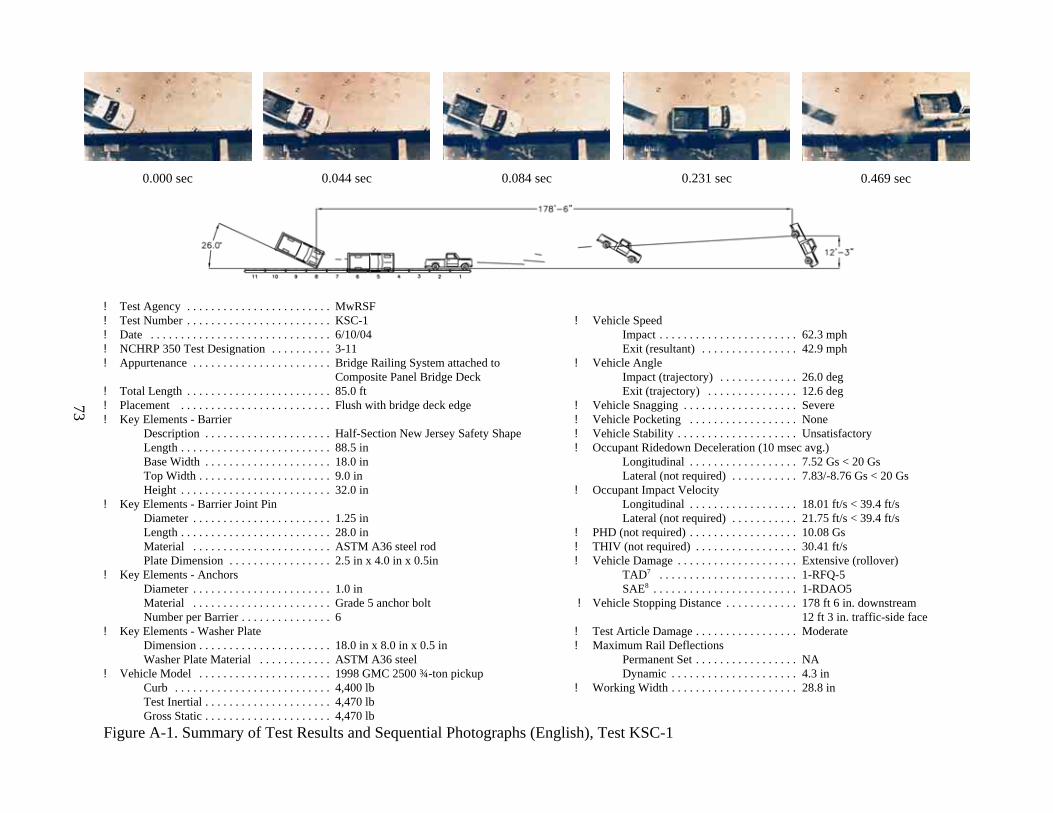
Figure A-1. Summary of Test Results and Sequential Photographs (English), Test KSC-1
73
0.044 sec 0.084 sec 0.231 sec 0.469 sec0.000 sec
! Test Agency . . . . . . . . . . . . . . . . . . . . . . . . MwRSF! Test Number . . . . . . . . . . . . . . . . . . . . . . . . KSC-1! Date . . . . . . . . . . . . . . . . . . . . . . . . . . . . . . 6/10/04! NCHRP 350 Test Designation . . . . . . . . . . 3-11! Appurtenance . . . . . . . . . . . . . . . . . . . . . . . Bridge Railing System attached to
Composite Panel Bridge Deck! Total Length . . . . . . . . . . . . . . . . . . . . . . . . 85.0 ft! Placement . . . . . . . . . . . . . . . . . . . . . . . . . Flush with bridge deck edge! Key Elements - Barrier
Description . . . . . . . . . . . . . . . . . . . . . Half-Section New Jersey Safety ShapeLength . . . . . . . . . . . . . . . . . . . . . . . . . 88.5 inBase Width . . . . . . . . . . . . . . . . . . . . . 18.0 inTop Width . . . . . . . . . . . . . . . . . . . . . . 9.0 inHeight . . . . . . . . . . . . . . . . . . . . . . . . . 32.0 in
! Key Elements - Barrier Joint PinDiameter . . . . . . . . . . . . . . . . . . . . . . . 1.25 inLength . . . . . . . . . . . . . . . . . . . . . . . . . 28.0 inMaterial . . . . . . . . . . . . . . . . . . . . . . . ASTM A36 steel rodPlate Dimension . . . . . . . . . . . . . . . . . 2.5 in x 4.0 in x 0.5in
! Key Elements - AnchorsDiameter . . . . . . . . . . . . . . . . . . . . . . . 1.0 inMaterial . . . . . . . . . . . . . . . . . . . . . . . Grade 5 anchor boltNumber per Barrier . . . . . . . . . . . . . . . 6
! Key Elements - Washer PlateDimension . . . . . . . . . . . . . . . . . . . . . . 18.0 in x 8.0 in x 0.5 inWasher Plate Material . . . . . . . . . . . . ASTM A36 steel
! Vehicle Model . . . . . . . . . . . . . . . . . . . . . . 1998 GMC 2500 ¾-ton pickupCurb . . . . . . . . . . . . . . . . . . . . . . . . . . 4,400 lbTest Inertial . . . . . . . . . . . . . . . . . . . . . 4,470 lbGross Static . . . . . . . . . . . . . . . . . . . . . 4,470 lb
! Vehicle SpeedImpact . . . . . . . . . . . . . . . . . . . . . . . 62.3 mphExit (resultant) . . . . . . . . . . . . . . . . 42.9 mph
! Vehicle AngleImpact (trajectory) . . . . . . . . . . . . . 26.0 degExit (trajectory) . . . . . . . . . . . . . . . 12.6 deg
! Vehicle Snagging . . . . . . . . . . . . . . . . . . . Severe! Vehicle Pocketing . . . . . . . . . . . . . . . . . . None! Vehicle Stability . . . . . . . . . . . . . . . . . . . . Unsatisfactory! Occupant Ridedown Deceleration (10 msec avg.)
Longitudinal . . . . . . . . . . . . . . . . . . 7.52 Gs < 20 GsLateral (not required) . . . . . . . . . . . 7.83/-8.76 Gs < 20 Gs
! Occupant Impact VelocityLongitudinal . . . . . . . . . . . . . . . . . . 18.01 ft/s < 39.4 ft/sLateral (not required) . . . . . . . . . . . 21.75 ft/s < 39.4 ft/s
! PHD (not required) . . . . . . . . . . . . . . . . . . 10.08 Gs! THIV (not required) . . . . . . . . . . . . . . . . . 30.41 ft/s! Vehicle Damage . . . . . . . . . . . . . . . . . . . . Extensive (rollover)
TAD7 . . . . . . . . . . . . . . . . . . . . . . . 1-RFQ-5SAE8 . . . . . . . . . . . . . . . . . . . . . . . . 1-RDAO5
! Vehicle Stopping Distance . . . . . . . . . . . . 178 ft 6 in. downstream12 ft 3 in. traffic-side face
! Test Article Damage . . . . . . . . . . . . . . . . . Moderate! Maximum Rail Deflections
Permanent Set . . . . . . . . . . . . . . . . . NADynamic . . . . . . . . . . . . . . . . . . . . . 4.3 in
! Working Width . . . . . . . . . . . . . . . . . . . . . 28.8 in
Figure A-1. Summary of Test Results and Sequential Photographs (English), Test KSC-1

74
APPENDIX B
Occupant Compartment Deformation Data, Test KSC-1
Figure B-1. Occupant Compartment Deformation Data, Test KSC-1
Figure B-2. Occupant Compartment Deformation Index (OCDI), Test KSC-1
75
Figure B-1. Occupant Compartment Deformation Data, Test KSC-1
76
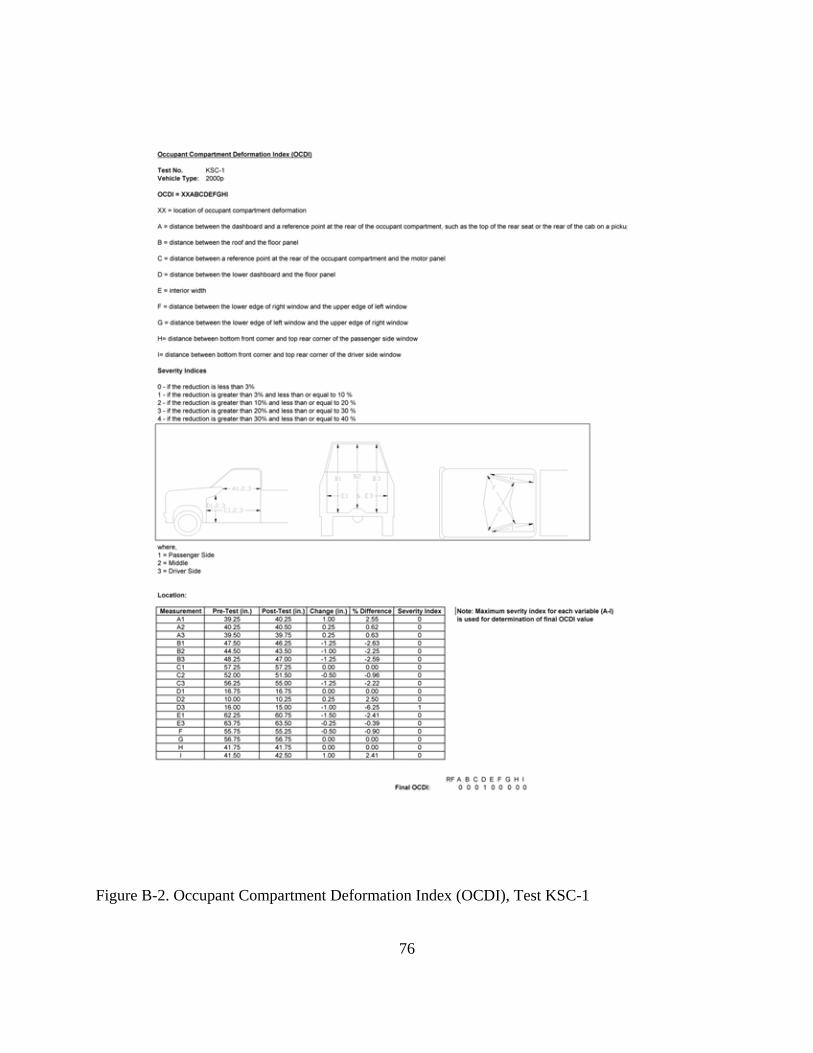
Figure B-2. Occupant Compartment Deformation Index (OCDI), Test KSC-1
77
APPENDIX C
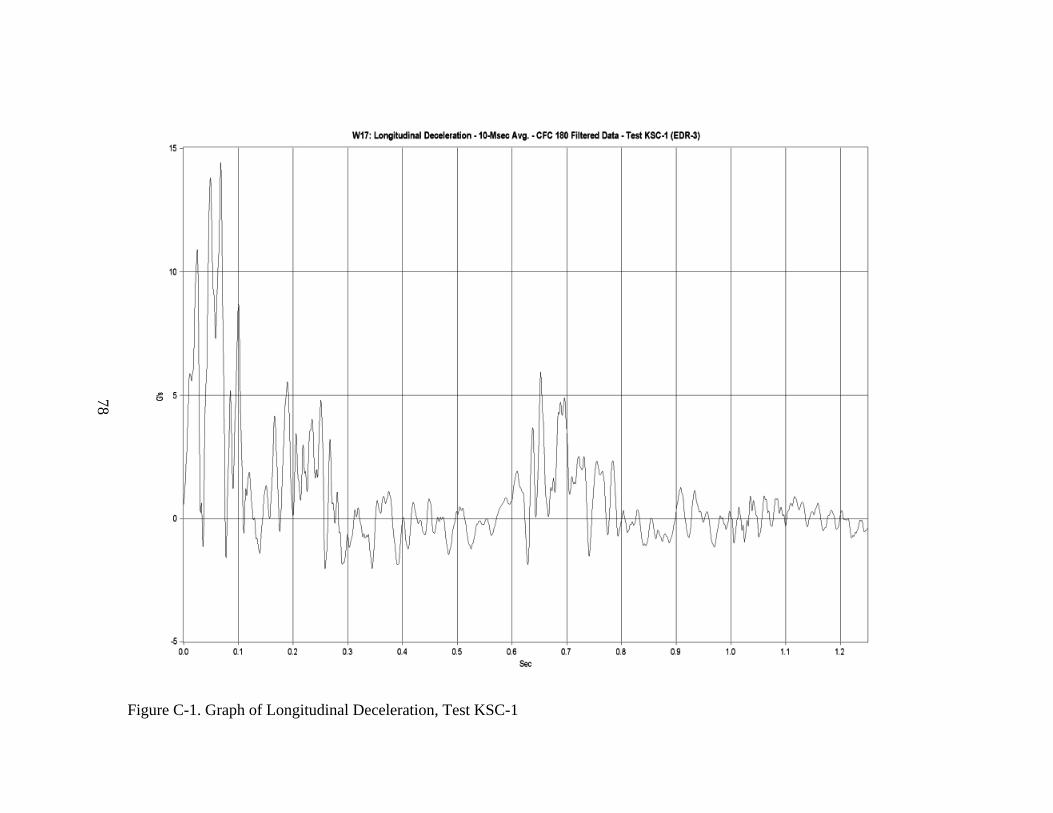
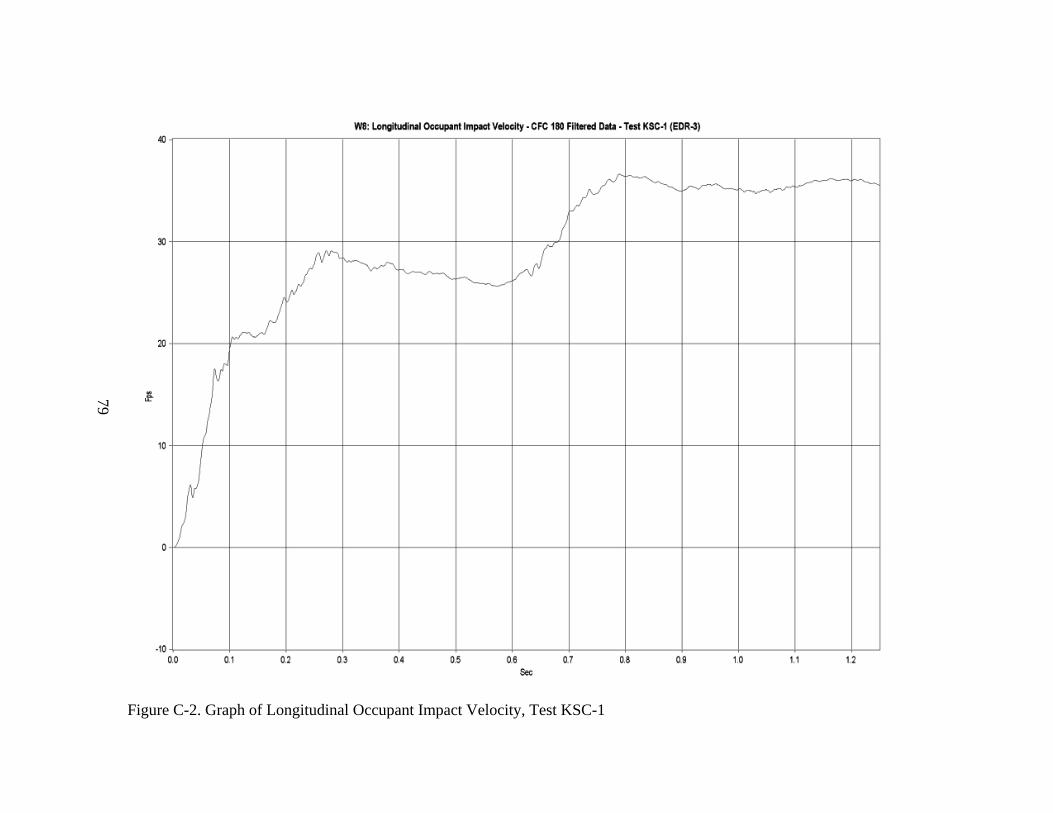
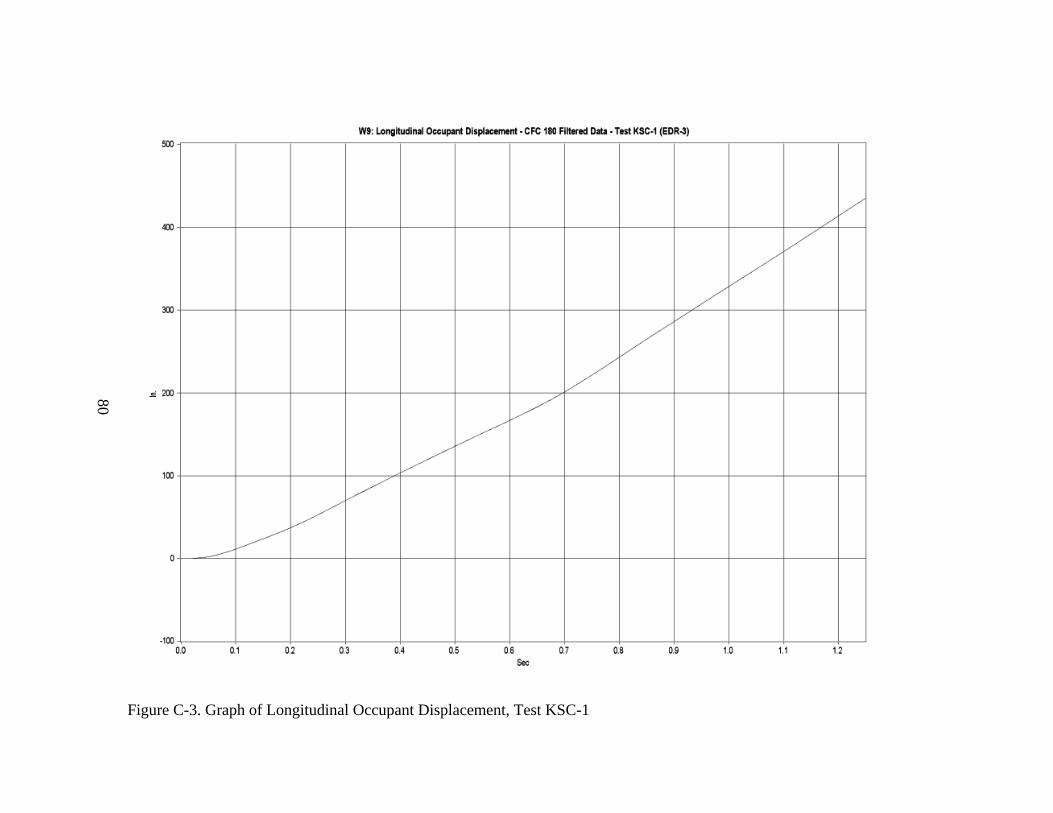
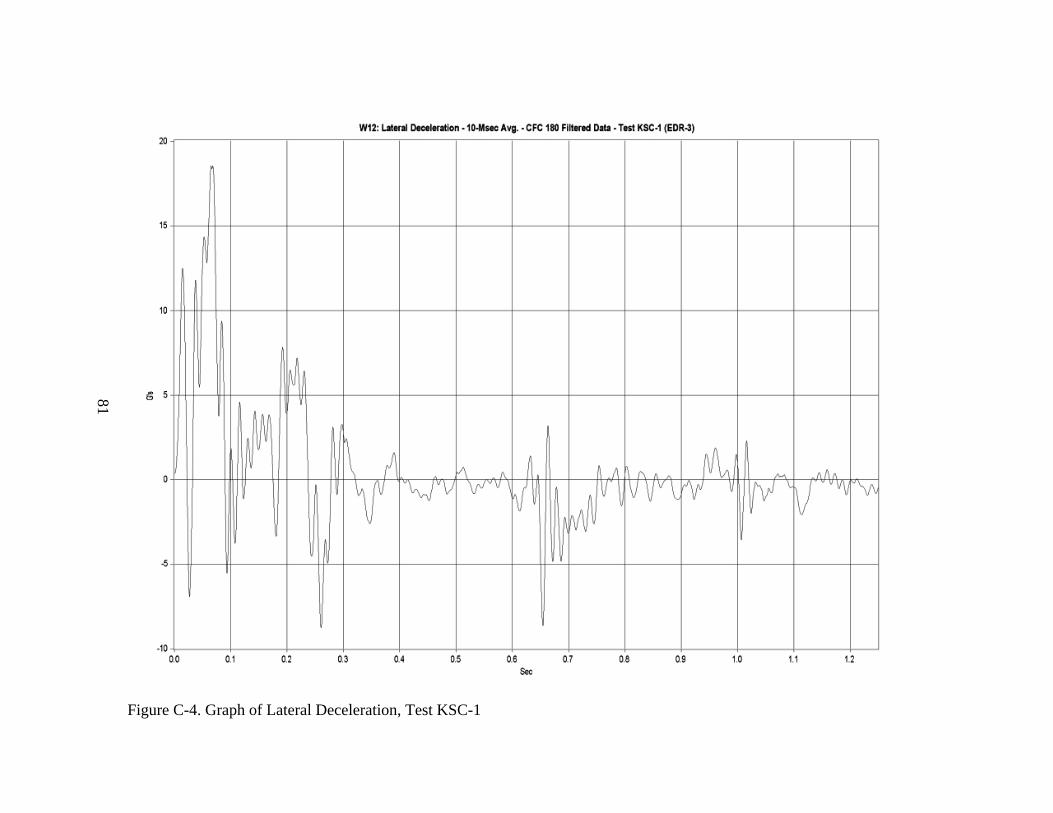
Accelerometer and Rate Transducer Data Analysis, Test KSC-1
Figure C-1. Graph of Longitudinal Deceleration, Test KSC-1
Figure C-2. Graph of Longitudinal Occupant Impact Velocity, Test KSC-1
Figure C-3. Graph of Longitudinal Occupant Displacement, Test KSC-1
Figure C-4. Graph of Lateral Deceleration, Test KSC-1
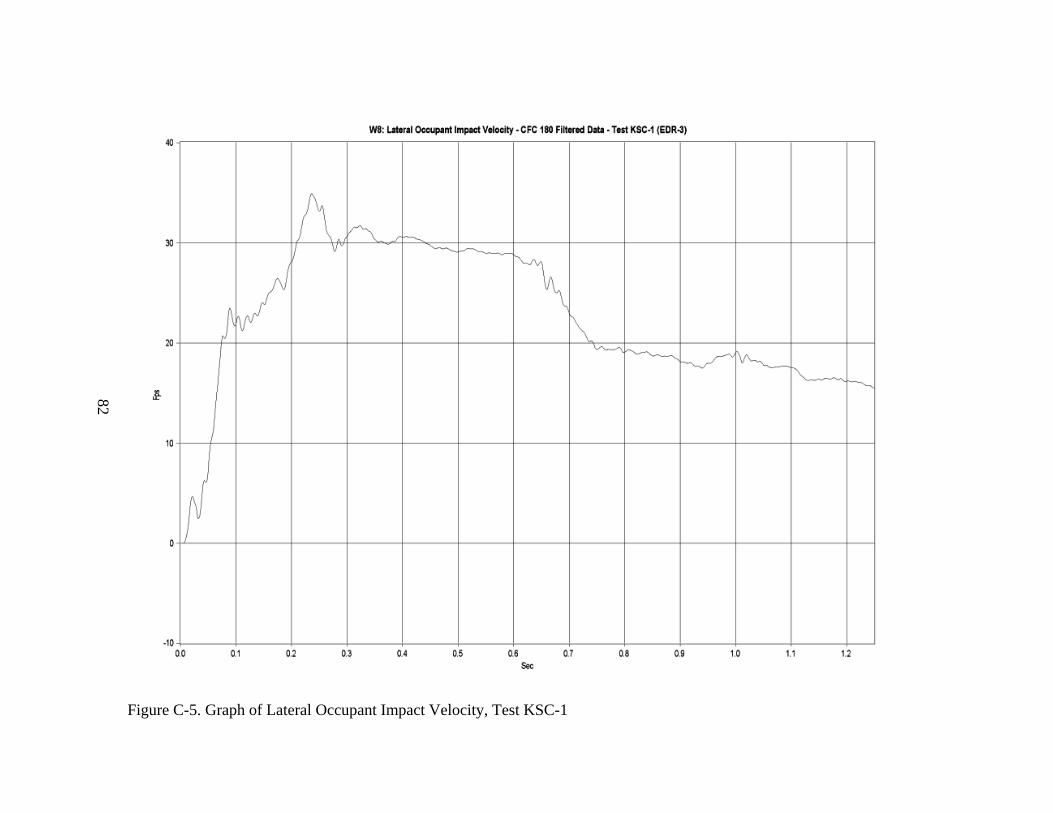
Figure C-5. Graph of Lateral Occupant Impact Velocity, Test KSC-1
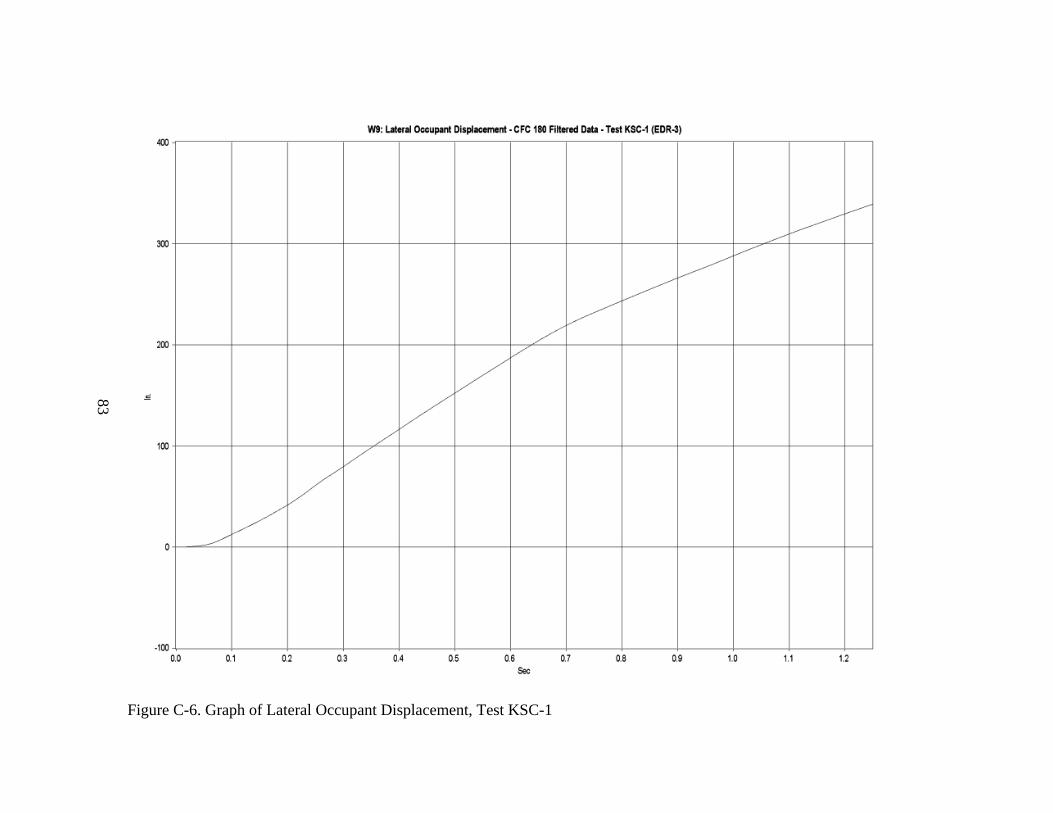
Figure C-6. Graph of Lateral Occupant Displacement, Test KSC-1
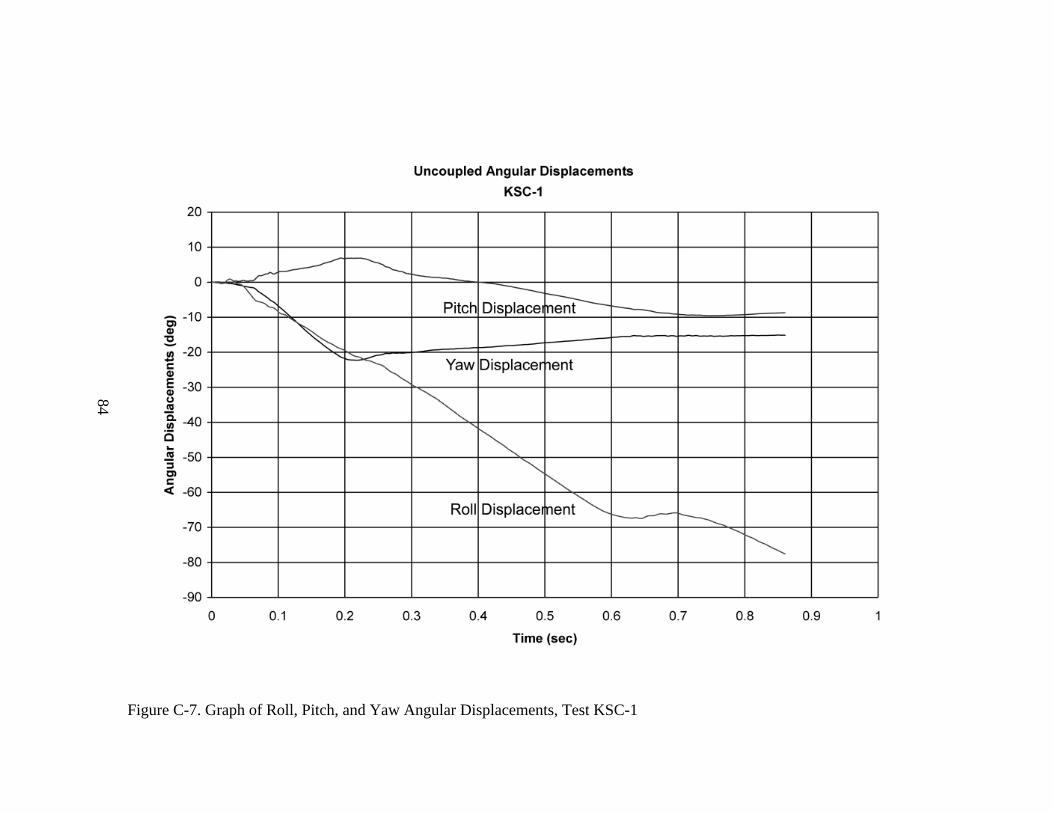
Figure C-7. Graph of Roll, Pitch, and Yaw Angular Displacements, Test KSC-1
78
Figure C-1. Graph of Longitudinal Deceleration, Test KSC-1
79
Figure C-2. Graph of Longitudinal Occupant Impact Velocity, Test KSC-1
80
Figure C-3. Graph of Longitudinal Occupant Displacement, Test KSC-1
81
Figure C-4. Graph of Lateral Deceleration, Test KSC-1
82
Figure C-5. Graph of Lateral Occupant Impact Velocity, Test KSC-1
83
Figure C-6. Graph of Lateral Occupant Displacement, Test KSC-1
84
Figure C-7. Graph of Roll, Pitch, and Yaw Angular Displacements, Test KSC-1