Embed Size (px)
Citation preview

LAPPEENRANTA UNIVERSITY OF TECHNOLOGYFACULTY OF TECHNOLOGY MANAGEMENTDEPARTMENT OF INFORMATION TECHNOLOGY
EVALUATING THE SUCCESS OF SOFTWAREDEVELOPMENT PROJECTS IN RUSSIA, UKRAINE,
AND BELARUS
The topic of the master’s thesis has been accepted in the departmental council of theDepartment of Information Technology, 09.12.2009
Supervisors: Professor Kari SmolanderUolevi Nikula D.Sc. (Tech.)
Andrey MaglyasKalliopellonkatu 10 A 153850 LappeenrantaTel. + 358 466 155 [email protected]
ABSTRACT
Lappeenranta University of TechnologyFaculty of Technology ManagementDepartment of Information Technology
Thesis for the Degree of Master of Science in Technology
2010
95 pages, 33 figures, 13 tables and 2 appendices.
Examiners: Professor Kari SmolanderUolevi Nikula D.Sc. (Tech.)
Keywords: success factors, evaluating the success, success models comparison, successprediction, distributed projects, communication problems.
The size and complexity of projects in the software development are growing very fast.At the same time, the proportion of successful projects is still quite low according tothe previous research. Although almost every project’s team knows main areas of re-sponsibility which would help to finish project on time and on budget, this knowledgeis rarely used in practice. So it is important to evaluate the success of existing softwaredevelopment projects and to suggest a method for evaluating success chances which canbe used in the software development projects.
The main aim of this study is to evaluate the success of projects in the selected geograph-ical region (Russia-Ukraine-Belarus). The second aim is to compare existing models ofsuccess prediction and to determine their strengths and weaknesses.
Research was done as an empirical study. A survey with structured forms and theme-based interviews were used as the data collection methods. The information gatheringwas done in two stages. At the first stage, project manager or someone with similarresponsibilities answered the questions over Internet. At the second stage, the participantwas interviewed; his or her answers were discussed and refined. It made possible to getaccurate information about each project and to avoid errors.
It was found out that there are many problems in the software development projects.These problems are widely known and were discussed in literature many times. Theresearch showed that most of the projects have problems with schedule, requirements,architecture, quality, and budget. Comparison of two models of success prediction pre-sented that The Standish Group overestimates problems in project. At the same time,McConnell’s model can help to identify problems in time and avoid troubles in future.A framework for evaluating success chances in distributed projects was suggested. Theframework is similar to The Standish Group model but it was customized for distributedprojects.
ii
PREFACE
The research was carried out at Lappeenranta University of Technology (LUT) duringthe period from November 2009 to April 2010. I would like to express my sincereappreciation to the people who made this work possible.
At first, I want to thank you my supervisors Professor Kari Smolander and D.Sc. UoleviNikula for the possibility to work under your leadership, valuable suggestions and yourscientific guidance. Our cooperation was very pleasant and beneficial. It was an honorfor me to work with you.
I would like to thank you Alexander Orlov who made this work possible and helped tofind people for participation in the study. Thank you to all participants who spent theirtime.
I am indebted to my friends and colleges for uncountable discussions and ideas. Withoutyou the work might not have been finished on time.
Finally I want to thank my family. I could not have made this without support of myparents. You have always believed in me, even when I have had doubts. Thank you.
Lappeenranta, April 2010
Andrey Maglyas
iii

Contents
1 INTRODUCTION 7
2 RELATED RESEARCH 9
2.1 Existing success definitions . . . . . . . . . . . . . . . . . . . . . . . . 10
2.2 Organizational structures . . . . . . . . . . . . . . . . . . . . . . . . . 12
2.3 Distributed projects . . . . . . . . . . . . . . . . . . . . . . . . . . . . 14
2.4 Communication problems . . . . . . . . . . . . . . . . . . . . . . . . . 18
2.5 Standish Model overview . . . . . . . . . . . . . . . . . . . . . . . . . 21
2.6 McConnell model overview . . . . . . . . . . . . . . . . . . . . . . . . 24
3 RESEARCH PROCESS 28
3.1 First phase — Questions development . . . . . . . . . . . . . . . . . . 29
3.2 Second phase — Gathering information . . . . . . . . . . . . . . . . . 31
3.3 Third phase — Analyzing information . . . . . . . . . . . . . . . . . . 32
4 RESEARCH RESULTS 34
4.1 Success definition . . . . . . . . . . . . . . . . . . . . . . . . . . . . . 34
4.2 Statistical results . . . . . . . . . . . . . . . . . . . . . . . . . . . . . 35
4.3 Development process . . . . . . . . . . . . . . . . . . . . . . . . . . . 40
4.4 Distributed projects . . . . . . . . . . . . . . . . . . . . . . . . . . . . 48
4.5 Standish Group model of success . . . . . . . . . . . . . . . . . . . . . 50
4.6 McConnell model of success . . . . . . . . . . . . . . . . . . . . . . . 53
4.7 Success metrics . . . . . . . . . . . . . . . . . . . . . . . . . . . . . . 55
5 DISCUSSION 60
5.1 Major problems in the software development identified during the study 60
5.2 Success prediction in the distributed projects . . . . . . . . . . . . . . . 62
5.3 Comparison of models for success prediction . . . . . . . . . . . . . . 64
6 CONCLUSION 67
1

REFERENCES 70
A APPENDICES 80
A.1 Survey form . . . . . . . . . . . . . . . . . . . . . . . . . . . . . . . . 80
A.2 Questions for the interview . . . . . . . . . . . . . . . . . . . . . . . . 90
2

List of Figures
1 Projectized organization (Project Management Institute, 2004) . . . . . 12
2 Functional organization (Project Management Institute, 2004) . . . . . 13
3 Matrix organization (Project Management Institute, 2004) . . . . . . . . 14
4 Distributedness dimensions (Evaristo and Scudder, 2000) . . . . . . . . 15
5 Modes of communication (Cockburn, 1999) . . . . . . . . . . . . . . . 19
6 Growing number of communication links . . . . . . . . . . . . . . . . 20
7 Software project need hierarchy (McConnell, 1997) . . . . . . . . . . . 25
8 Jenkins’ model (Jarvinen, 2004) . . . . . . . . . . . . . . . . . . . . . 28
9 Phase 1 — Questions development . . . . . . . . . . . . . . . . . . . 30
10 Phase 2 — Gathering information . . . . . . . . . . . . . . . . . . . . 31
11 Phase 3 — Analyzing information . . . . . . . . . . . . . . . . . . . . 33
12 Projects results . . . . . . . . . . . . . . . . . . . . . . . . . . . . . . 35
13 Project team size . . . . . . . . . . . . . . . . . . . . . . . . . . . . . 37
14 Positions of participants . . . . . . . . . . . . . . . . . . . . . . . . . . 39
15 IT experience of participants . . . . . . . . . . . . . . . . . . . . . . . 40
16 Organizational structure . . . . . . . . . . . . . . . . . . . . . . . . . . 41
17 Number of projects with selected software development process . . . . 42
18 Initial requirements modeling . . . . . . . . . . . . . . . . . . . . . . . 43
19 Initial architecture modeling . . . . . . . . . . . . . . . . . . . . . . . 44
20 Initial estimation effort modeling . . . . . . . . . . . . . . . . . . . . . 46
21 Initial scheduling effort . . . . . . . . . . . . . . . . . . . . . . . . . . 47
22 Deadline . . . . . . . . . . . . . . . . . . . . . . . . . . . . . . . . . . 47
23 Distributed projects statistic . . . . . . . . . . . . . . . . . . . . . . . 48
24 Distributed projects statistics (normalized) . . . . . . . . . . . . . . . . 49
25 Standish success criteria for studied projects . . . . . . . . . . . . . . . 51
26 Standish model of success prediction for studied projects . . . . . . . . 52
27 McConnell project distribution of the studied projects . . . . . . . . . . 53
28 McConnell chart for the studied projects . . . . . . . . . . . . . . . . . 54
29 Importance of the metrics . . . . . . . . . . . . . . . . . . . . . . . . . 55
3
30 Which is most important? TIME . . . . . . . . . . . . . . . . . . . . . 56
31 Which is most important? MONEY . . . . . . . . . . . . . . . . . . . 57
32 Which is most important? QUALITY . . . . . . . . . . . . . . . . . . 58
33 Which is most important? FUNCTIONALITY . . . . . . . . . . . . . . 58
4
List of Tables
1 Organizational structure influences on projects . . . . . . . . . . . . . . 14
2 Standish project benchmarks over the years (Eveleens and Verhoef, 2010) 21
3 Top five success factors (Ikonen and Kurhila, 2009) . . . . . . . . . . . 23
4 Customer’s Bill of Rights (McConnell, 1997) . . . . . . . . . . . . . . 26
5 Project team’s Bill of Rights (McConnell, 1997) . . . . . . . . . . . . . 26
6 Scoring guideline (McConnell, 1997) . . . . . . . . . . . . . . . . . . 27
7 General statistic about the research . . . . . . . . . . . . . . . . . . . . 36
8 Projects involved in research . . . . . . . . . . . . . . . . . . . . . . . 36
9 Ranked dimensions of distributed projects . . . . . . . . . . . . . . . . 50
10 Distribution of answers by criteria . . . . . . . . . . . . . . . . . . . . 52
11 Average values for the importance of metrics . . . . . . . . . . . . . . 55
12 Dimensions of distributed projects with their scores . . . . . . . . . . . 64
13 McConnell model and empirical results comparison . . . . . . . . . . . 66
5

ABBREVIATIONS
CSF Critical Success Factors
FM Functional manager
IC Intercommunication
IT Information Technology
PM Project manager
ROI Return on investment
SC Success chances
SPI Software Process Improvement
SSDP Success score for distributed project
6

1 INTRODUCTION
Nowadays software development market is growing very fast (MarketResearch, 2009).
Projects require more and more resources and complexity becomes a problem (Saremi
et al., 2007). In the last thirty years technologies have changed considerably. New
programming languages, devices, microprocessors were invented and reinvented many
times (Mahoney, 1988) but management methodologies have not changed substantially
(McCarthy and Matthern, 1999). It leads to a high ratio of unsuccessful projects even
with good financial support. Economic situation requires new effective methods for man-
aging software development projects (Lu and Zhang, 2005). So we should evaluate the
success of existing software development projects and define a baseline which describes
current situation. Later we will be able to compare new results with this baseline. The
purpose of this study is to:
1. collect information about software development projects in one geographical re-
gion which covers Russia, Ukraine, and Belarus;
2. analyze collected information;
3. evaluate the success of these projects.
Russia is one of the largest outsourcing region in the world. Every year Russian soft-
ware development market shows a modest growth (MarketResearch, 2009). This re-
search evaluates the main factors that affect the success of software development prjects.
These factors are management (development process, resource estimation, project plan-
ning) and peopleware (communication problems inside the team, team size, organiza-
tional structures) according to Belbin (1981), DeMarco and Lister (1999), respectively.
Other factors such as political situation (Stribrny and Mackin, 2006), economic situation
(Aoyama, 1997), and risk management (Hua et al., 2006) are not evaluated here. An-
other purpose is to compare two existing models which allow us to predict chances for
success based on the prevailing situation in project. Knowledge of these chances will
7

help companies to save money (Hui and Liu, 2004). The last purpose is to share infor-
mation about the causes of software development projects failures. The importance of
this task cannot be underestimated as nobody likes to tell about failures. In the software
development industry failures are covered up, ignored and rationalized (Boehm, 2000).
As a result, this leads to a constantly repeating mistakes.
The study was designed to answer three research questions:
1. What are the main reasons for success or failure of the software development
projects in the selected geographical region (Russia-Ukraine-Belarus)?
2. How to predict the success chances in the distributed projects?
3. Which of the two models (Standish vs. McConnell) is better for success predic-
tion?
The research was done in Lappeenranta University of Technology (LUT) during the
period from November 2009 to April 2010 in collaboration with Russian consulting
firm which specialized in IT management and has a connection with IT senior and top
managers. Interviews were conducted in a period from January 2010 to February 2010.
The work is organized as follows. Questions about project management background
are briefly described in Chapter 2. This chapter covers questions about existing success
definitions, organizational structures, distributed projects, and communication problems
inside the companies. Also two success prediction models (The Standish Group and
McConnell model) are presented. In Chapter 3 research method which consists of three
phases are introduced. Results of the research are presented in Chapter 4. Discussion
and conclusion of the thesis are in Chapter 5 and 6 respectively. Additional materials
(questions for survey and interview) are presented in Appendix.
8
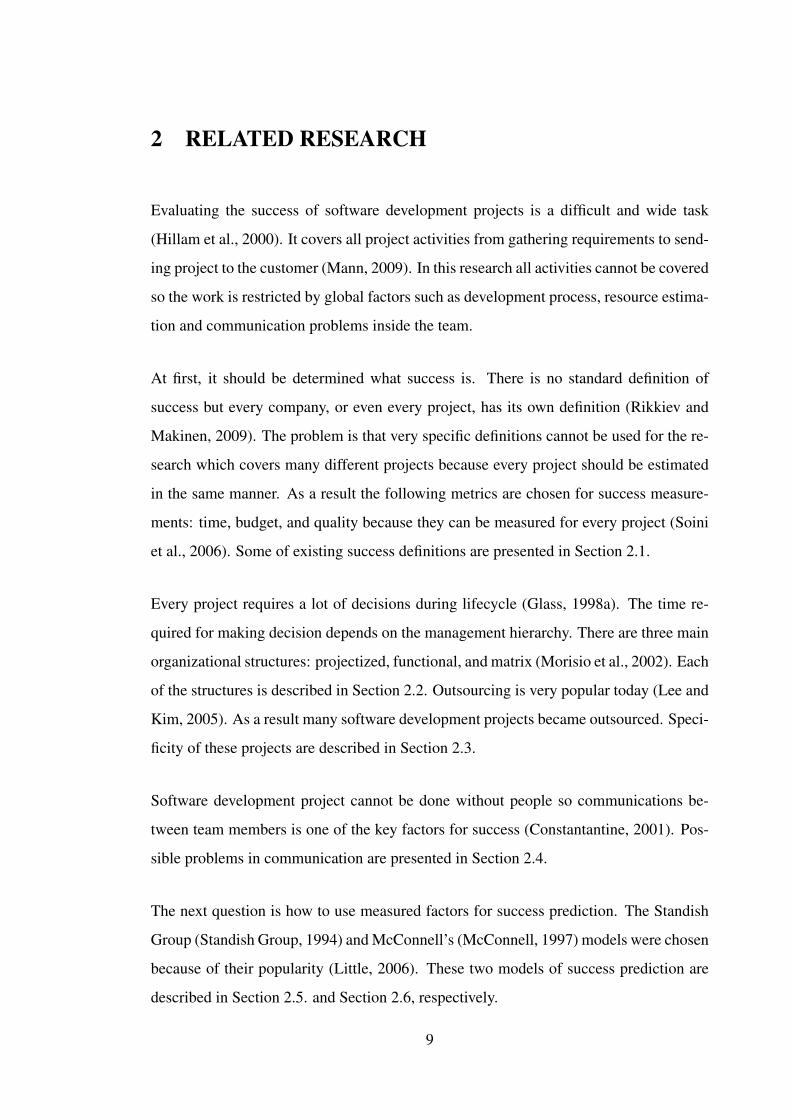
2 RELATED RESEARCH
Evaluating the success of software development projects is a difficult and wide task
(Hillam et al., 2000). It covers all project activities from gathering requirements to send-
ing project to the customer (Mann, 2009). In this research all activities cannot be covered
so the work is restricted by global factors such as development process, resource estima-
tion and communication problems inside the team.
At first, it should be determined what success is. There is no standard definition of
success but every company, or even every project, has its own definition (Rikkiev and
Makinen, 2009). The problem is that very specific definitions cannot be used for the re-
search which covers many different projects because every project should be estimated
in the same manner. As a result the following metrics are chosen for success measure-
ments: time, budget, and quality because they can be measured for every project (Soini
et al., 2006). Some of existing success definitions are presented in Section 2.1.
Every project requires a lot of decisions during lifecycle (Glass, 1998a). The time re-
quired for making decision depends on the management hierarchy. There are three main
organizational structures: projectized, functional, and matrix (Morisio et al., 2002). Each
of the structures is described in Section 2.2. Outsourcing is very popular today (Lee and
Kim, 2005). As a result many software development projects became outsourced. Speci-
ficity of these projects are described in Section 2.3.
Software development project cannot be done without people so communications be-
tween team members is one of the key factors for success (Constantantine, 2001). Pos-
sible problems in communication are presented in Section 2.4.
The next question is how to use measured factors for success prediction. The Standish
Group (Standish Group, 1994) and McConnell’s (McConnell, 1997) models were chosen
because of their popularity (Little, 2006). These two models of success prediction are
described in Section 2.5. and Section 2.6, respectively.
9
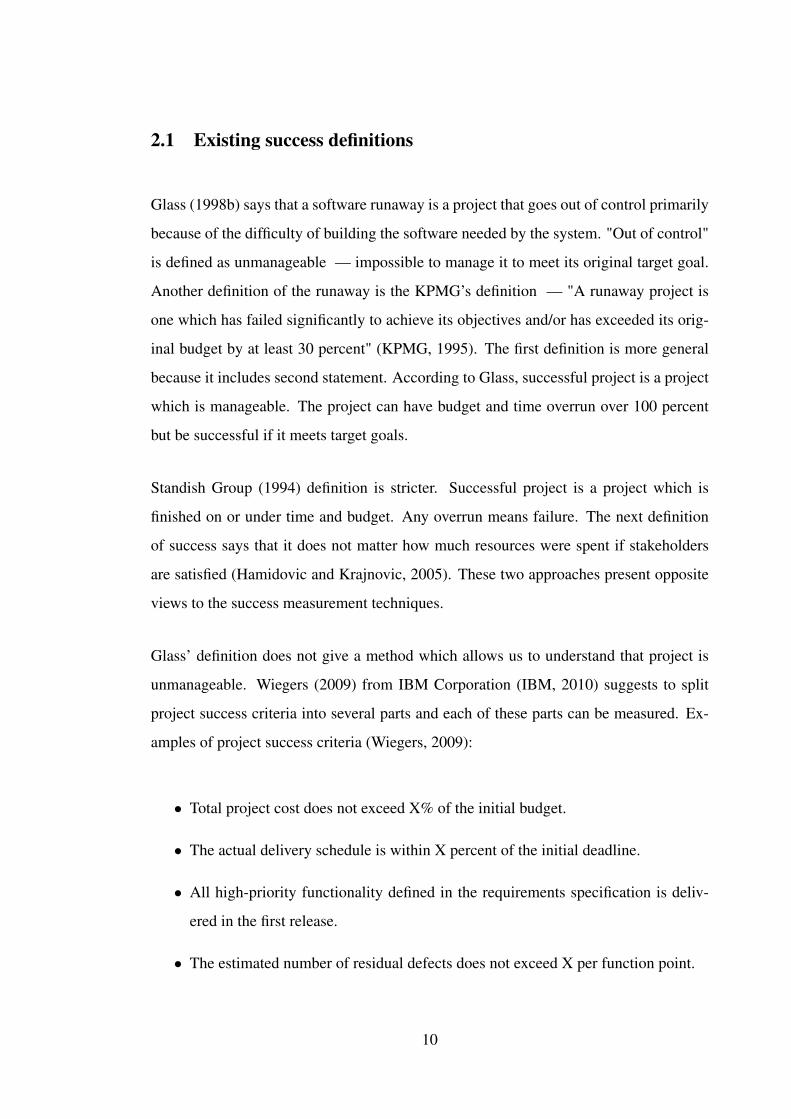
2.1 Existing success definitions
Glass (1998b) says that a software runaway is a project that goes out of control primarily
because of the difficulty of building the software needed by the system. "Out of control"
is defined as unmanageable — impossible to manage it to meet its original target goal.
Another definition of the runaway is the KPMG’s definition — "A runaway project is
one which has failed significantly to achieve its objectives and/or has exceeded its orig-
inal budget by at least 30 percent" (KPMG, 1995). The first definition is more general
because it includes second statement. According to Glass, successful project is a project
which is manageable. The project can have budget and time overrun over 100 percent
but be successful if it meets target goals.
Standish Group (1994) definition is stricter. Successful project is a project which is
finished on or under time and budget. Any overrun means failure. The next definition
of success says that it does not matter how much resources were spent if stakeholders
are satisfied (Hamidovic and Krajnovic, 2005). These two approaches present opposite
views to the success measurement techniques.
Glass’ definition does not give a method which allows us to understand that project is
unmanageable. Wiegers (2009) from IBM Corporation (IBM, 2010) suggests to split
project success criteria into several parts and each of these parts can be measured. Ex-
amples of project success criteria (Wiegers, 2009):
• Total project cost does not exceed X% of the initial budget.
• The actual delivery schedule is within X percent of the initial deadline.
• All high-priority functionality defined in the requirements specification is deliv-
ered in the first release.
• The estimated number of residual defects does not exceed X per function point.
10

• Load testing confirms successful scale-up to X concurrent users, with page down-
load times no longer than Y seconds over a 56K dial-up connection.
• All unauthorized network intrusions are intercepted, prevented, logged, and re-
ported.
• The mean time to failure under specified load conditions is at least X hours.
• The average installation time of the product is less than X minutes, with Y% of
installations being error-free and requiring no support call.
• At least X% of software components were reused from previous applications.
• Prerelease development rework does not exceed ten percent of total development
effort.
The problem of this approach is that most of the criteria look like requirements. These
"requirements" can be used only in a concrete project in a concrete company. It be-
comes impossible to compare various projects because there is no standardized criterion
which is suitable for every project. It means that universal metrics should be chosen for
investigation (Boehm, 1994).
The main customer’s business goal is to get a product in time by using allocated re-
sources and with appropriate level of quality (Atlee and Wieringa, 2006). Time, bud-
get and quality metrics are popular and widely used because they are associated with
business objectives of customers (Nan and Harter, 2009). Some research of successful
projects, such as Standish Group (1994) and McConnell (1997), are using these metrics
too. So if new research results are based on these metrics, they can be compared with
other results.
11

2.2 Organizational structures
Project Management Institute (2004) divides organizational structure types into three
groups. Gray boxes in Figures 1 –3 represent staff engaged in project activities.
1. Projectized (Figure 1)
• team members are often collocated
• most of the organization’s resources are involved in project work
• project managers have a great deal of independence and authority
• departments report directly to the project managers or provide support ser-
vices to the various projects
Chief executive
Project manager
Staff
Staff
Staff
Project manager
Staff
Staff
Staff
Project manager
Staff
Staff
Staff
Project coordination
Figure 1: Projectized organization (Project Management Institute, 2004)
2. Functional (Figure 2)
• each employee has one clear superior
12

• staff members are grouped by specialty such as production, marketing, ac-
counting, etc.
• scope of the project is usually limited to the boundaries of the function
• engineering department will do its work independent of the manufacturing
or marketing departments
Chief executive
Functional manager
Staff
Staff
Staff
Functional manager
Staff
Staff
Staff
Functional manager
Staff
Staff
Staff
Project coordination
Figure 2: Functional organization (Project Management Institute, 2004)
3. Matrix (Figure 3)
• blend of functional and projectized characteristics
• recognizes the need for a project manager but do not provide the project
manager with the full authority over the project and project funding
Adapted from Project Management Institute (2004) Table 1 shows main characteristics
of each organizational structure. In the table PM and FM are abbreviations for Project
Manager and Functional Manager respectively.
13

Chief executive
Functional manager
Staff
Staff
Project manager
Functional manager
Staff
Staff
Staff
Functional manager
Staff
Staff
Staff
Project coordination
Figure 3: Matrix organization (Project Management Institute, 2004)
Table 1: Organizational structure influences on projectsFunctional Matrix Projectized
PM’s Authority little or none from limited to high high to almost totalResource Availability little or none from limited to high high to almost totalBudget controller FM FM and/or PM PMPM’s role part-time part-time or full-time full-timeManagement staff part-time part-time or full-time full-time
2.3 Distributed projects
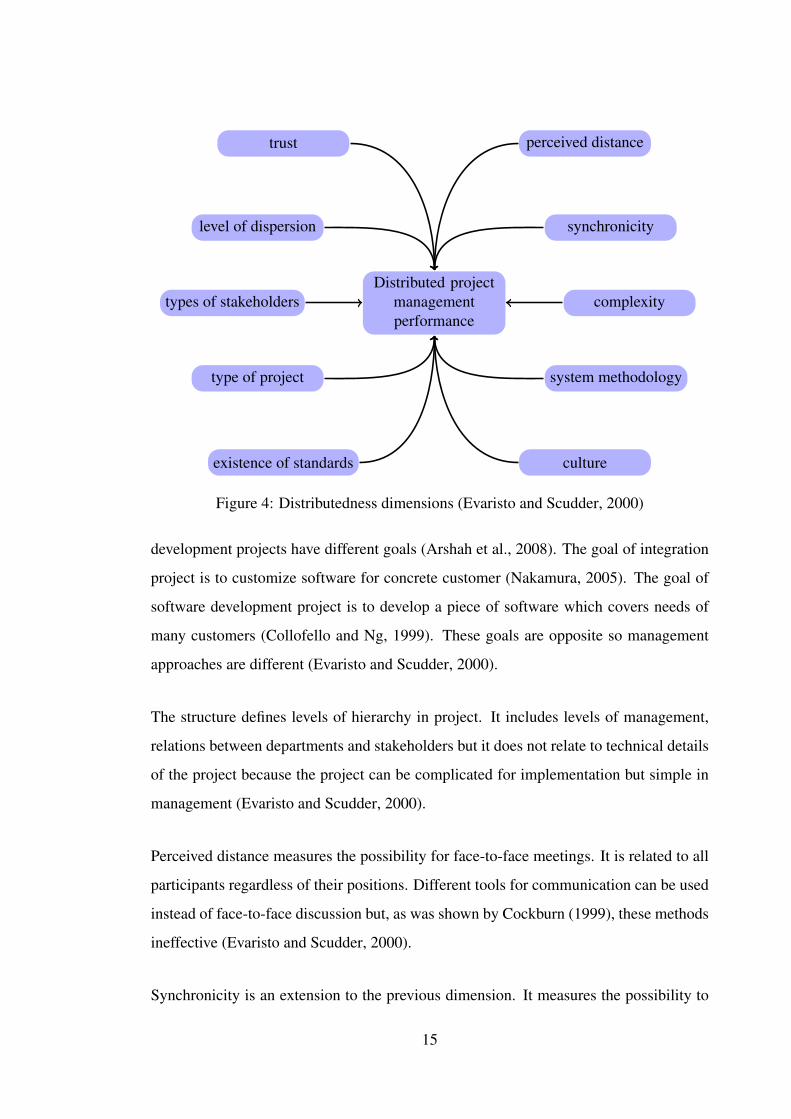
A theoretical framework for studying distributed projects was suggested by Roberto
Evaristo and Richard Scudder (Evaristo and Scudder, 2000). They identified 10 dimen-
sions of "distributedness". Distributedness means that distributed projects have many
different factors affecting their success or failure so they should be analyzed as an mul-
tidimensional entity. Dimensions are presented in Figure 4.
Project’s type defines the way it should be managed. Usually integration and software
14
.
.Distributed project
managementperformance
.types of stakeholders
.type of project
.existence of standards .culture
.system methodology
.complexity
.level of dispersion
.trust .perceived distance
.synchronicity
Figure 4: Distributedness dimensions (Evaristo and Scudder, 2000)
development projects have different goals (Arshah et al., 2008). The goal of integration
project is to customize software for concrete customer (Nakamura, 2005). The goal of
software development project is to develop a piece of software which covers needs of
many customers (Collofello and Ng, 1999). These goals are opposite so management
approaches are different (Evaristo and Scudder, 2000).
The structure defines levels of hierarchy in project. It includes levels of management,
relations between departments and stakeholders but it does not relate to technical details
of the project because the project can be complicated for implementation but simple in
management (Evaristo and Scudder, 2000).
Perceived distance measures the possibility for face-to-face meetings. It is related to all
participants regardless of their positions. Different tools for communication can be used
instead of face-to-face discussion but, as was shown by Cockburn (1999), these methods
ineffective (Evaristo and Scudder, 2000).
Synchronicity is an extension to the previous dimension. It measures the possibility to
15
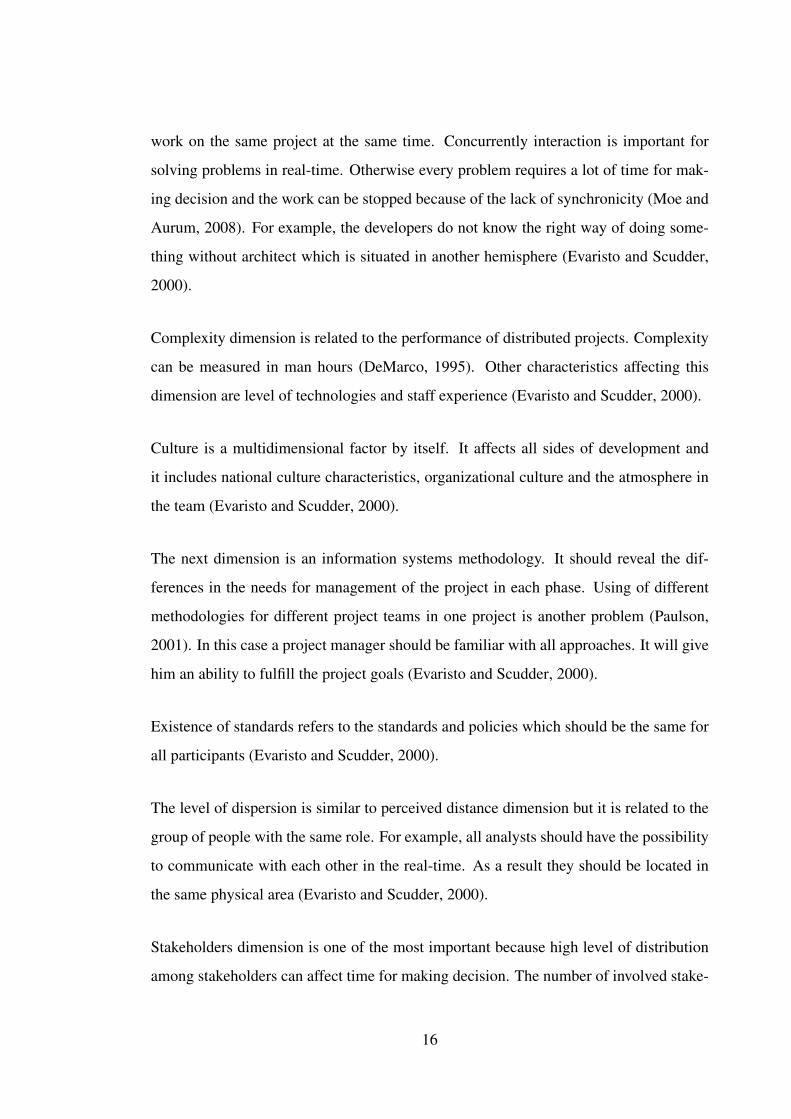
work on the same project at the same time. Concurrently interaction is important for
solving problems in real-time. Otherwise every problem requires a lot of time for mak-
ing decision and the work can be stopped because of the lack of synchronicity (Moe and
Aurum, 2008). For example, the developers do not know the right way of doing some-
thing without architect which is situated in another hemisphere (Evaristo and Scudder,
2000).
Complexity dimension is related to the performance of distributed projects. Complexity
can be measured in man hours (DeMarco, 1995). Other characteristics affecting this
dimension are level of technologies and staff experience (Evaristo and Scudder, 2000).
Culture is a multidimensional factor by itself. It affects all sides of development and
it includes national culture characteristics, organizational culture and the atmosphere in
the team (Evaristo and Scudder, 2000).
The next dimension is an information systems methodology. It should reveal the dif-
ferences in the needs for management of the project in each phase. Using of different
methodologies for different project teams in one project is another problem (Paulson,
2001). In this case a project manager should be familiar with all approaches. It will give
him an ability to fulfill the project goals (Evaristo and Scudder, 2000).
Existence of standards refers to the standards and policies which should be the same for
all participants (Evaristo and Scudder, 2000).
The level of dispersion is similar to perceived distance dimension but it is related to the
group of people with the same role. For example, all analysts should have the possibility
to communicate with each other in the real-time. As a result they should be located in
the same physical area (Evaristo and Scudder, 2000).
Stakeholders dimension is one of the most important because high level of distribution
among stakeholders can affect time for making decision. The number of involved stake-
16

holders of different types is a good scale for measurement this characteristic (Evaristo
and Scudder, 2000).
Distributed project can be categorized along enumerated dimensions. It is an significant
step in evaluating of this phenomenon because suggested framework allows us to study
distributed projects as a multidimensional entity.
Evaristo and Scudder (2000) also suggested to use transaction cost (Coase, 1937) and
agency theory (Klepper, 1990) as a model for distributed development.
Transaction cost theory was presented by Ronald Coase (1937). Coase defined trans-
action cost as "the cost of using the price mechanism". It means that the product can
be developed in the enterprise or in the market. In the both cases a company tries to
minimize the sum of production and transaction costs. This approach can be applied for
software development. Distributed project is a good solution for reducing development
costs using outsourcing mechanism (Menzies and Di Stefano, 2003). At the same time,
saved money will be spent on communication, integration process and trainings. At the
end, the total cost will be equal.
In the agency theory Evaristo and Scudder (2000) agents work independently and try to
maximize their own profit even if it conflicts with customer’s interests. The agency the-
ory is a good example of integration process in distributed projects. In the processes of
such kind each company develops own part of the entire system (Hofmann and Lehner,
2001). The problem is that companies do not worry about the success of the entire
project. They are responsible for the small part of the project. Usually these parts work
right independently and the customer gets some pieces of software which cannot be put
together because of incompatibility (Daihani et al., 1993).
As was mentioned above, one of the most important problem in distributed projects
is communication between people. A theoretical framework of Evaristo and Scudder
(2000) does not include this dimension and should be expanded by adding new one.
17

This dimension is people and communications between people (DeMarco and Lister,
1999). Communication problem will be discussed in the next chapter.
2.4 Communication problems
Alistair Cockburn (1999) presented four characteristics of people:
1. people are communicating beings, doing best face-to-face, in person, with real-
time question and answer;
2. people have trouble acting consistently over time;
3. people are highly variable, varying from day to day and place to place;
4. people generally want to be good citizens, are good at looking around, taking
initiative, and doing "whatever is needed" to get the project to work.
Cockburn (1999) proposed a model which describes how communication effectiveness
depends on the mode of communication.
There are four communication characteristics which can be lost:
• physical proximity
• multiple modalities (gestures, raising an eyebrow, pointing)
• vocal inflection and timing (speeding up, slowing down, changing tones)
• real-time question-and-answer
When one of the listed characteristics is removed, communication effectiveness de-
creased. (Figure 5). The x axis shows different types of communication. The most
18

..
.
.
.2pe
ople
atw
hite
boar
d.2
peop
leon
vide
oph
one
.2pe
ople
one-
mai
l
.vide
otap
e
.audi
otap
e
.pape
r
.
.
.
.
.
.
.
.
.Types of communication
.Com
mun
icat
ion
effe
ctiv
enes
s
Figure 5: Modes of communication (Cockburn, 1999)
effective way of communication is face-to-face meeting, for example, 2 people at white-
board. Then we can remove enumerated characteristics one by one. When we remove
physical proximity, we switch from face-to-face communication to the communication
over the video phone. Then, we remove visual gestures with visual timing. E-mail is
a good example of communication of such kind. The next step is to remove possibility
to ask questions (e.g. videotape and audiotape). The last step is to remove all charac-
teristics (physical proximity, possibility to ask questions, visual and audio contact) and
we get communication through paper. The model shows that such methods of com-
19
munication as e-mail and paper are not effective (Cockburn, 1999). According to this
model, in the distributed projects we are not able to achieve high level of communication
effectiveness. As a result, the level of the various misunderstandings will increase.
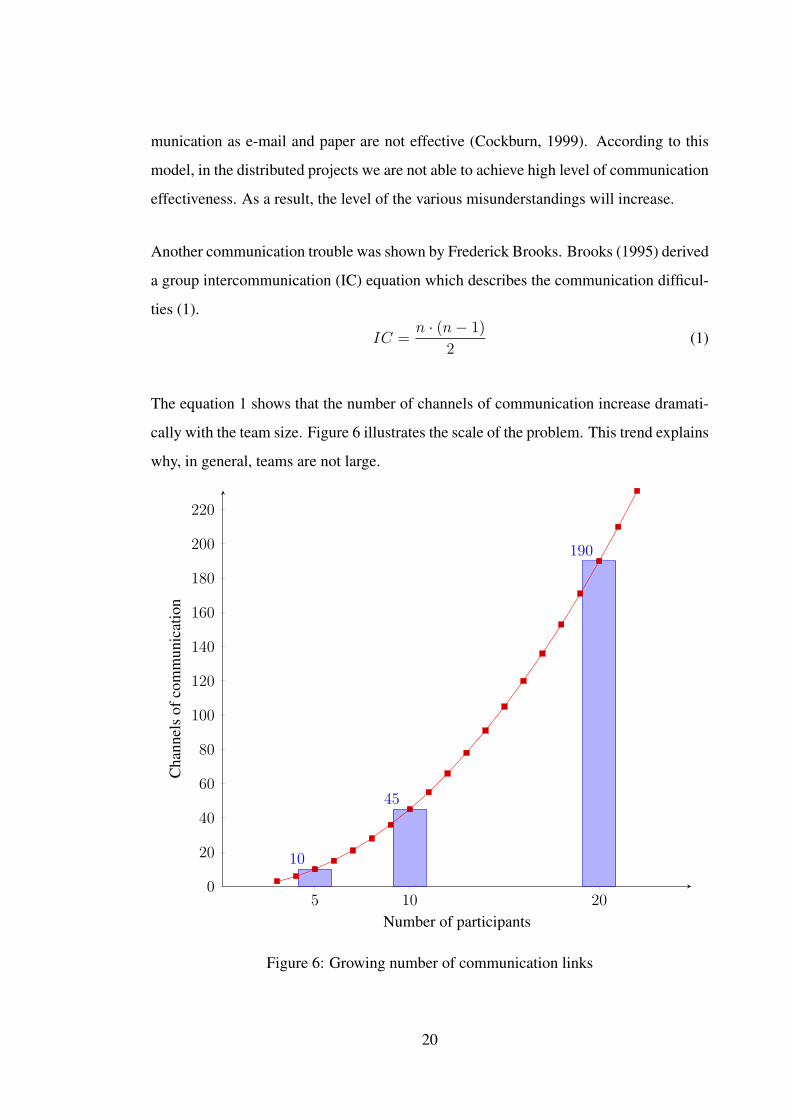
Another communication trouble was shown by Frederick Brooks. Brooks (1995) derived
a group intercommunication (IC) equation which describes the communication difficul-
ties (1).
IC =n · (n− 1)
2(1)
The equation 1 shows that the number of channels of communication increase dramati-
cally with the team size. Figure 6 illustrates the scale of the problem. This trend explains
why, in general, teams are not large.
..
.
..5 .10 .20
.0
.20
.40
.60
.80
.100
.120
.140
.160
.180
.200
.220
.10
.45
.190
.Number of participants
.Cha
nnel
sof
com
mun
icat
ion
Figure 6: Growing number of communication links
20

2.5 Standish Model overview
The Standish Group has made research about current situation in software development
since 1994. In 1994 Standish Group reported a shocking 16 percent project success
rate, 53 percent of the projects were challenged, and 31 percent failed outright (Standish
Group, 1994). Later the results were improved but still remained very dramatic for
industry. The Standish Group divides all projects into three resolution types (Standish
Group, 1994):
• Resolution Type 1, or successful: The project is completed on-time and on-budget,
with all features and functions as initially specified.
• Resolution Type 2, or challenged: The project is completed and operational but
over-budget, over the time estimate, and offers fewer features and functions than
originally specified.
• Resolution Type 3, or failed: The project is canceled at some point during the
development cycle.
Standish benchmarks for the last fifteen years are presented in Table 2.
Table 2: Standish project benchmarks over the years (Eveleens and Verhoef, 2010)Year Successful(%) Challenged(%) Failed(%)1994 16 53 311996 27 33 401998 26 46 282000 28 49 232004 29 53 182006 35 46 192009 32 44 24
The Standish Group chose ten criteria for success measurement (Standish Group, 1994):
21

1. user involvement
2. executive management support
3. clear statement of requirements
4. proper planning
5. realistic expectations
6. smaller project milestones
7. competent staff
8. ownership
9. clear vision and objectives
10. hard-working, focused staff
Using these criteria we can calculate success chances (SC) by equation 2:
SC =10∑i=1
wi · Ai, (2)
where w = (19, 16, 15, 11, 10, 9, 8, 6, 3, 3) is a set of weighting coefficients, Ai ∈ {0, 1}
is an answer to the question with number i. If respondent says that the criterion can be
applied to the project Ai = 1, otherwise Ai = 0. For example, project manager says
that only executive management support, realistic expectations, and competent staff are
proper characteristics of his project. Then A2 = 1, A5 = 1, and A7 = 1.
A = (0, 1, 0, 0, 1, 0, 1, 0, 0, 0) (3)
SC = 19 · 0 + 16 · 1 + 15 · 0 + 11 · 0 + 10 · 1 + 9 · 0 + 8 · 1 + 6 · 0 + 3 · 0 + 3 · 0 = 34
SC = 34 (4)
22

Estimated scale of the project success assessment (Standish Group, 1994):
• 10 success points - project has virtually no chance of success
• 29 success points - project has little chance of success
• 85 success points - project has high success probability
• 100 success points - project has all the right ingredients for success
As can be seen from the scale even 100 success points do not guarantee the success.
The Standish Group says that project can be successful, that all necessary conditions are
met but this may not be enough. The project from the example with 34 success scores
has little chance for success but this project has an important component for success
(executive management support).
Ikonen and Kurhila (2009) made an investigation of the top five success factors which
were listed in the recent Chaos reports of The Standish Group. These success factors for
the period since 1994 to 2004 are presented in Table 3. According to The Standish Group
research, user involvement and executive management support play the most important
role for success. Other factors vary but these two are stable.
Table 3: Top five success factors (Ikonen and Kurhila, 2009)1995 1999 2001 2004
1st user involvement user involvement executive man-agement support
user involvement
2nd executive man-agement support
executive man-agement support
user involvement executive man-agement support
3rd clear statement ofrequirements
smaller projectmilestones
competent staff smaller projectmilestones
4th proper planning competent staff smaller projectmilestones
hard-working, fo-cused staff
5th realistic expecta-tions
ownership clear vision andobjectives
clear vision andobjectives
23

Although The Standish Group report is one of the most frequently cited report about
software project statistics, this report has been critiqued because of the method for de-
termining the success of the project (Jorgensen and Molokken, 2006). Glass (2005)
emphasizes that project result cannot be binary. He gives an example of project that is
functionally brilliant but misses its cost or schedule targets by 10 percent. According to
The Standish Group it is failure but most of the people will say that it is success. So the
result depends on our definition of success. The Standish Group has very strict definition
so failure rate is so high.
Another reason for the high failure rate is a people nature (Glass, 2005). Glass says that
people like to write about failures instead of successes so failure stories can be found
more easily than success stories. Many authors published results from the Chaos report
in their articles (Hartman, 2006) so it looks like troubles in IT industry. However, it is a
myth, for example, Info World published "Six myth of IT" (InfoWorld, 2004) where the
myth 5 is "Most IT Project Fail" (Schwartz, 2004).
The definitions of the Standish Group are only about estimation deviation (Eveleens and
Verhoef, 2010). Their definitions do not relate to project context and project goals such
as usefulness, profit, and user satisfaction. These definitions are good for measurement
of success of estimation prediction. Chaos reports cover problems with initial and ac-
tual estimates. Techniques which allow us to measure the deviation between initial and
actual estimates are important because it helps to do properly estimates in the future
(Wasmund, 1993). On the other hand, success prediction, which is based on how good
initial estimation was, does not say anything.
2.6 McConnell model overview
McConnell compares software projects and human needs. Abraham Maslow observed
that people respond to a hierarchy of needs (Maslow, 1943). The lowest level needs
are called “survival needs” because they address physical needs that must be satisfied
24

for a human being to exist at all. A similar hierarchy can be applied to the software
projects (Figure 7). The higher levels of the pyramid are where dramatic improvements
in quality and productivity take place. Successful projects are situated on the two top
levels of this hierarchy. His survey test measures success chances and helps to under-
stand where project is situated (McConnell’s questions are presented in Appendix 1, set
of questions 26). He also explains how to improve software development process for
increasing success chances (McConnell, 1997).
.
.Self-
Actualization(ongoing
professionaldevelopment)
.Self-Esteem (feeling productive,belief in project’s importance)
.Belongingness and Love(healthy team dynamics)
.Safety Needs (meeting personal
promises for schedule and functionality)
.Survival Needs (project not canceled, team not fired,
adequate physical working conditions, and so on)
Figure 7: Software project need hierarchy (McConnell, 1997)
McConnell suggests to use two Bills of Rights which are similar to United States Bill
of Rights (Table 4 and Table 5). These two Bills describe main conditions which should
be observed by customer and project team in successful project. One person’s software
project rights are another person’s software project responsibilities so both sides are
25

responsible for the success. He provides an example that customers must pay for their
rights by respecting the project team’s rights which are listed in Table 5.
Table 4: Customer’s Bill of Rights (McConnell, 1997)I have the right:
1. To set objectives for the project and have them followed2. To know how long the software project will take and how much it will
cost3. To decide which features are in and which are out of the software4. To make reasonable changes to requirements throughout the course of
the project and to know the costs of making those changes5. To know the project’s status clearly and confidently6. To be apprised regularly of risks that could affect cost, schedule, or
quality, and to be provided with options for addressing potential prob-lems
7. To have ready access to project deliverables throughout the project
Table 5: Project team’s Bill of Rights (McConnell, 1997)I have the right:
1. To know the project objectives and to clarify priorities2. To know in detail what product I am supposed to build and to clarify the
product definition if it is unclear3. To have ready access to the customer, manager, marketer, or other per-
son responsible for making decisions about the software’s functionality4. To work each phase of the project in a technically responsible way, es-
pecially to not be forced to start coding too early in the project5. To approve effort and schedule estimates for any work that I will be
asked to perform. This includes the right to provide only the kinds ofcost and schedule estimates that are theoretically possible at each stageof the project; to take the time needed to create meaningful estimates;and to revise estimates whenever the project’s requirements change
6. To have my project’s status reported accurately to customers and uppermanagement
7. To work in a productive environment free from frequent interruptionsand distractions, especially during critical parts of the project.
McConnell developed a test which covers main management activities in software de-
velopment: requirements, planning, project control, risk management, and personnel.
The test can be used for measurement project’s health at any phase of development.
McConnell emphasizes that it is a challenging test for most of the projects and most of
26

them will score less than 50 points. If the test indicates troubles, project’s conditions can
be improved by taking steps which were described by McConnell (McConnell, 1997).
But the experience gained in one project can be easily transferred to another project.
McConnell’s scoring guideline is shown in Table 6.
Table 6: Scoring guideline (McConnell, 1997)Score Comments90+ (Outstanding) A project with this score is virtually guaranteed to succeed
in all respects, meeting its schedule, budget, quality, andother targets. Such a project is fully "self-actualized".
80-89 (Excellent) A project at this level is performing much better than aver-age. Such a project has a high probability of delivering itssoftware close to its schedule, budget, and quality targets.
60-79 (Good) A score in this range represents a better-than-average levelof software development effectiveness. Such a projectstands a fighting chance of meeting either its schedule orits budget target, but it probably will not meet both.
40-59 (Fair) This score is typical. A project with this score will likelyexperience high stress and shaky team dynamics, and thesoftware will ultimately be delivered with less functionalitythan desired at greater cost and with a longer schedule.
less than 40 (At risk) A project with this score has significant weaknesses in themajor areas of requirements, planning, project control, riskmanagement, and personnel. The primary concern of aproject in this category should be whether it will finish atall.
27

3 RESEARCH PROCESS
According to Jarvinen (2004), Jenkins (1985) model of the research consists of 8 steps
which are presented in Figure 8. Jenkins says that his model is general and every research
has many other steps. In addition, Jenkins underlines that the model is oversimplification
because research process is iterative. In this research Jenkin’s model was used as a base
but it was tailored for the current study and eight sequential steps were replaced by three
phases. The first phase covers Jenkin’s steps from 1 to 4; the second covers steps 5 and
6; and the last two steps of Jenkin’s model were covered by the third phase.
..1. idea
.2. library research
.3. research topic
.4. research strategy
.5. experimental design
.6. data capture
.7. data analysis
.8. publish result
Figure 8: Jenkins’ model (Jarvinen, 2004)
In the Introduction three research questions were presented:
1. What are the main reasons for success or failure of IT projects in the selected
geographical region (Russia-Ukraine-Belarus)?
2. How to predict the success chances in the distributed projects?
3. Which of two models (Standish vs. McConnell) is better for success prediction?
28
To answer these questions it is necessary to collect data from different projects. So the
research should be done as an empirical study (Basili, 2006). Two methods of gathering
information were chosen: survey with structured forms and theme-based interviews. The
research was divided into three phases which are shown in Figures 9 –11.
The research started from the discussions with top managers and IT directors about the
relevance of the topic. After the conversation it was obvious that the study of such kind
is useful. The second phase started with searching people who are ready to participate.
The third phase was dedicated to summarizing and analyzing the information which were
collected during previous two phases. The phases of the research which are presented in
Figures 9 –11 are described in more detail in sections 3.1 – 3.3.
3.1 First phase — Questions development
The idea of the research is not arisen by chance. Although Russia is a young country in
the software development, the number of projects is growing very fast (Terekhov, 2001).
Many international companies outsource their projects in Russia, Ukraine, and Belarus
where IT sector is based on very inexpensive labour (Galkin and Efimov, 2005). In the
last few years the market of the own projects has been growing too. So it should be
useful for the future to evaluate these project’s success chances and define a baseline for
future research.
The literature study (Figure 9) showed that European and American companies did not
include Russia in their studies of success projects (Stelzer et al., 1996) so the main
purpose of this research is to fill the space and to evaluate the main factors which affect
the success of software development projects in the selected geographical region. In
addition, field study was conducted. Researchers, consultants and managers agreed that
success factors identification and evaluation is an appropriate topic for the investigation.
Then, the questions for the interview were developed. Interview form is presented in
29

..Idea
.Idea discussion .Library research
.Questions for interview
.Forming questionnaires
Figure 9: Phase 1 — Questions development
Appendix 2. The questions are mainly based on the Software Process Improvement
(SPI) and Critical Success Factors (CSF) which are discussed in Reel (1999), Niazi et al.
(2006), Dyba (2005), and Berntsson (2006).
The next part of the interview form is "success" and "failure" stories. This part contains
a set of questions and the interviewee should answer to these questions twice: one story
about success project and one story about failure project. There is no criterion for the
success here but it is a subjective point of view of each interviewee. In addition, infor-
mation of any kind can be provided by the interviewee at the end of the interview. It can
be anything from the own experience to the feedback about research.
The survey form is presented in Appendix 1. The questionnaire contains several groups:
• Questions about the interviewee (contact information, experience, job title).
• Questions about the company where the person are/were working (the size of the
company, specialization).
• Questions about the project (project type, approaches and tools which are/were
used)
• Questions which are used by McConnell’s test (McConnell, 1997).
30

• Questions which are used by The Standish Group for Chaos report (Standish
Group, 1994).
The Standish Group focuses on the scope of the software project failures, but the project
failures is an opposite side of the project successes. So The Standish Group and Mc-
Connell sets of questions were added to the questionnaire together.
3.2 Second phase — Gathering information
The second phase consists of five steps (Figure 10). The first step was to find people
who could find time for participation in the research. Each respondent can fill the form
as many times as he or she wants for different projects. It allows us to get more in-
formation for the analysis. Also the information about this research was published in
several blogs, invitations were sent by e-mail to the managers of the IT companies in
Saint-Petersburg, Moscow, Kiev and Minsk and many other cities. Unfortunately, the
participation requires a lot of time (about 3 hours) so not all of the invited people were
able to find the time to answer the questions.
..Searching for participants
.Filling questionnaires
.Checking the answers
.Interview
.Checking the interview results
Figure 10: Phase 2 — Gathering information
31

A letter with a link to the online survey was sent to all people who expressed a desire
to participate. The questions are available in Russian and English languages but most
of the participants preferred Russian version. In the letter instructions about filling the
form were given. My contact information was provided and everybody was welcomed
to ask any questions about this work.
When the form was filled I went through the answers. If something was not clear or some
fields were not filled I made a remark for the interview. The interview is not necessary
but useful part of the study. Everybody was given a few alternative ways to participate
in the interview:
• Face-to-face interview in the office.
• Skype interview. Interview of this type is suitable for the companies which are
situated far away from Saint-Petersburg and unavailable for face-to-face meeting.
• Recorded interview. Some people preferred to record their answers and sent audio
records back. It is suitable for people who have not enough time for meeting. If I
was uncertain about what they meant, we clarified it over e-mail.
All interviews were recorded by using audio recorder or computer program which allows
making audio records of Skype conversations. After that, I put all collected information
together and checked that everything was clear for me and that I did not miss something
important.
3.3 Third phase — Analyzing information
The third phase is presented in Figure 11.
The last phase introduces analyzing information and results of the research. In general,
it consists of several steps:
32

..Analysis of raw data
.Statistical results
.Correlated results
.Models comparison
.Reporting
Figure 11: Phase 3 — Analyzing information
• Make a statistical analysis which is based on raw facts.
• Identify correlation between the main characteristics of the IT projects: which
methods, tools, processes were used; which criteria were most important; how
projects distributed by size and budget.
• Compare the two models of success prediction (Standish Group, 1994), (Mc-
Connell, 1997) and identify the strengths and weaknesses of each model.
The last step is to write a report which includes all necessary information about current
research. Results of the data analysis are presented in details in the following chapters.
33

4 RESEARCH RESULTS
4.1 Success definition
All studied projects were divided into 6 categories:
1. Project finished without budget and time overhead.
2. Project finished with time overhead.
3. Project finished with budget overhead.
4. Project finished with budget and time overhead.
5. Project not finished yet.
6. Project cancelled.
There is no limit for time or budget overrun. In that way this research is similar to The
Standish Group study. Only the fact of overrun was taken into account.
3 cancelled and 14 unfinished projects were studied. Unfinished projects give a good
possibility for project’s observation during lifecycle. But it requires more time in data
collection phase because lifecycle of average project is about two years (Jones, 1994). So
these projects were excluded from success estimation because their result is not known.
Cancelled projects were excluded from the results too. There were many reasons for
cancellation. For example, business goals were not defined correctly, technologies were
not chosen right, team did not have proper experience. According to the interviews,
these projects were cancelled on the early stages so success evaluation approach is not
suitable for them. These projects and reasons for cancellation should be studied in an
separate research.
34

In this research project was successful if it has finished without budget and time overhead
(totally successful) or finished with time overrun. In general, time overrun does not mean
that project cannot be successful (Brebner, 1998). It only shows that initial resource
estimation was not done properly. When the addition of time does not help, the next step
for saving project is to provide extra money for the project (Sneed and Brossler, 2003).
Usually it is a second warning that project is failing.
Figure 12 shows that 29% of all projects were finished without time and budget overrun
but most of the projects (42%) had time overrun. In total, about 70% of projects were
finished successfully, according to our definitions. 13% of projects were finished with
budget overrun. 16% of projects failed in both (time and budget) metrics.
.
..Without budget and time overhead
.29%
..With time overhead .42%
..With budget overhead
.13%
..With budget and time overhead
.16%
Figure 12: Projects results
4.2 Statistical results
In this chapter statistical results will be described. It is an information which can be
extracted directly from the raw data set. General statistic is presented in Table 7.
48 projects were involved into this research. In the beginning of the research six types
of software projects were chosen (Table 8). The basis for classification is a specificity
35

Table 7: General statistic about the researchNumber of projects 48Number of companies 42Number of interviews 19The biggest budget >800 000 euroThe smallest budget 4 000 euro
Table 8: Projects involved in researchProject type Number of projects PercentsSoftware development 25 52.1%Telecommunication software 3 6.3%Financial software 4 8.3%Outsourcing software 8 16.7%Software for eCommerce 2 4.2%Integration project 4 8.4%Total: 46 95.8%Missing: 2 4.2%
of projects of each type. For example, telecommunication software requires a high-level
of QoS (Quality of Service) and possibility to work under high load (Hac, 1991). Fi-
nancial software is critical to the response time. So it should be real-time systems with
low reaction time (Lotvin and Nemes, 1991). Transaction costs in outsourcing projects
are higher than in local, so these projects were divided into separate group (Lacity and
Rottman, 2008). Very often eCommerce systems are complex and distributed so they
should be studied independently (Yarom et al., 2003). Integration project’s goal is to
customize large software system (for example, by writing several new modules for SAP
(2010)) for concrete customer’s needs (Salaka and Prabhu, 2006). This approach differs
from the development from scratch so these projects were divided into another group.
Other projects such as development from scratch, embedded projects, system program-
ming projects were classified as software development projects. Analyzing of the results
shows that there is no big difference between projects within these groups. All projects
have similar problems which will be described in the following chapters.
Figure 13 presents the number of people involved in the project teams. All teams were
36

divided into several groups depending on the size:
• tiny teams (1-5 people);
• small teams (6-10 people);
• medium teams (11-20 people);
• large teams (21-50 people);
• very large teams (51-100 people);
..
.
..1-5 .6-10 .11-20 .21-50 .51-100
.0
.2
.4
.6
.8
.10
.12
.14
.16
.13
.15
.16
.3
.1
.Team size
Figure 13: Project team size
As can be seen from the bar chart (Figure 13) team size varies but small and medium
sized teams dominate. People in small and medium sized teams can communicate and
work effectively because number of communication channels is low (Figure 6). In large
37

and very large teams people spend a lot of time for communication instead of working
so these teams require additional level of hierarchy for achieving efficiency (Xuezhong
et al., 2008) as described in Section 2.4.
I wanted to give a possibility to answer to the questions to every person who wanted
to participate. At the same time I preferred people from management because they have
more experience in the topic and are able to explain current situation in the project and/or
what was good/wrong in the previous projects. In addition, they have a "bird eye view"
(Khan et al., 2009) to the project and understand the main business goals of the customer.
All these characteristics together give an objective point of view to the project. It was
project managers, IT managers and IT directors. These three positions may look similar
so definitions of each position are presented to avoid misunderstandings. According to
our definitions:
• Project manager is a person assigned by the performing organization to achieve
the project objectives (Project Management Institute, 2004).
• IT manager is a person who plans and coordinates activities such as installing and
upgrading software and hardware, analyzes the computer and information needs of
their organizations from an operational and strategic perspective and determines
immediate and long-range personnel and equipment requirements. They assign
and review the work of their subordinates and stay abreast of the latest technology
to ensure that the organization remains competitive (Statistics, 2001).
• IT director is a person who is responsible for planning, organizing and directing
all the operations within the Information Technology (Alonso et al., 2009).
Figure 14 presents positions of participants. About 2/3 of all participants were from top
and middle management. Participants were experienced persons and most of them had
worked in the Information Technology industry from 5 to 20 years (Figure 15). It gives
a possibility to collect reliable information about projects.
38

..
.
.
.Proj
ect m
anag
er.IT
man
ager
.ITdi
rect
or.Pr
ogra
mm
er.Bu
sines
s ana
lyst
.Arc
hite
ct.Q
A/T
est
.Prod
uct o
wne
r.U
nkno
wn
.0
.2
.4
.6
.8
.10
.12
.14
.16
.18
.19
.10
.4 .4.3 .3 .3
.1 .1
Figure 14: Positions of participants
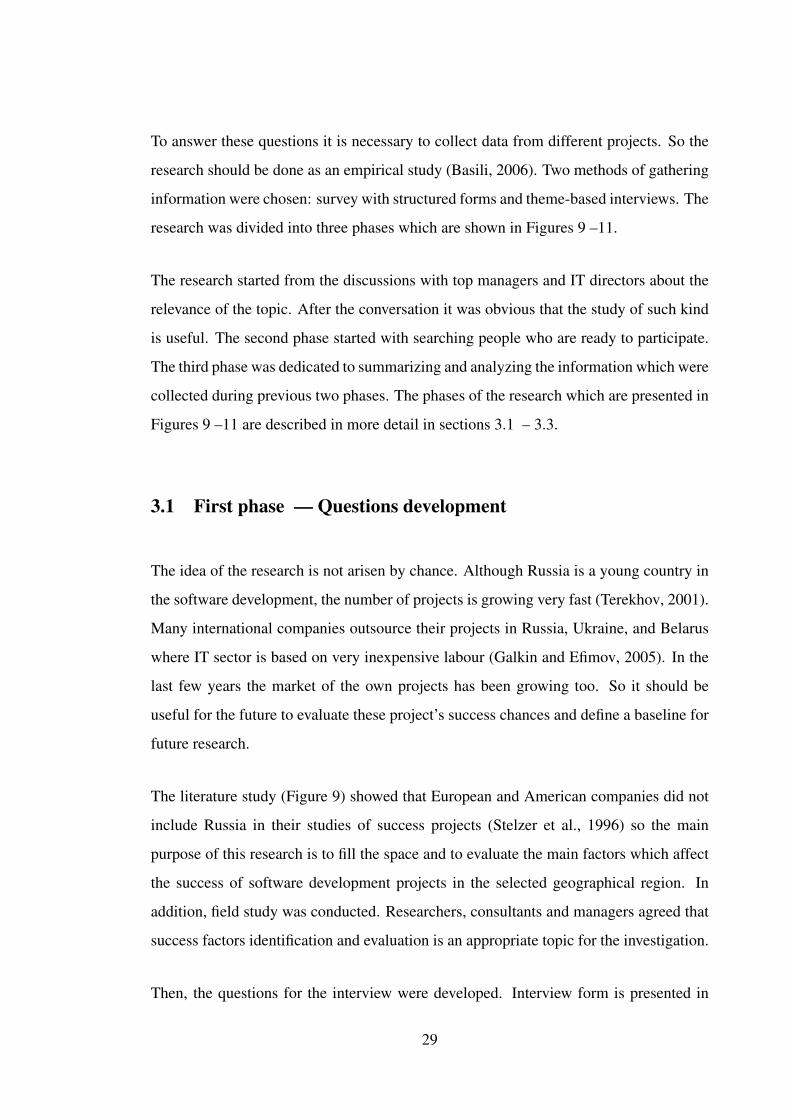
As was mentioned above, there are three ways to organize company: matrix organiza-
tion, projectized organization, and functional organization (Section 2.2). Each partici-
pant was asked about organizational structure in his company. The results are presented
in Figure 16. The most popular organization structure is projectized. Matrix and func-
tional structures are less popular but also used in the software development companies.
Projectized organization gives the project manager many opportunities in making deci-
sions (Andersen, 2001). But in the case of failure the blame lies on the project manager
because he is responsible for the success. The problem of such projects is that success
depends on project manager’s skills. Functional and matrix organization distribute re-
sponsibility among many people. The other side of such organizational structures is that
39

..
.
.
.less
than
2ye
ars
.2-5
year
s
.5-10
year
s
.10-2
0ye
ars
.mor
e tha
n20
year
s
.0
.2
.4
.6
.8
.10
.12
.14
.16
.1
.14
.17
.15
.1
Figure 15: IT experience of participants
the process of making decisions requires a lot of time.
4.3 Development process
In this research a set of development processes was provided to participants. Five the
most popular processes in descending order are:
• Iterative (Cockburn, 2008) – 13 users
40
..
.
..Projectized Organization .Matrix Organization .Functional Management
.0
.2
.4
.6
.8
.10
.12
.14
.16
.18
.20
.22
.24.
24
.12
.9
Figure 16: Organizational structure
• RUP (Krebs, 2007) – 6 users
• Nothing (Wei and Meimei, 2009) – 6 users
• Agile (Cohen et al., 2004) – 5 users
• Chaos (Hao et al., 2008) – 4 users
Such processes as Cleanroom (Prowell et al., 1999), TDD (Beck, 2003), FDD (Felsing
and Palmer, 2002), Lean (Gilpatrick and Furlong, 2006), RAD (McConnell, 1996), V-
Model (Hoffman and Beaumont, 1997), and some other were included into the set too
but nobody chose them.
Pure processes are rare (Bhandari et al., 1993) so participants were asked to choose
a base process which was tailored for project’s needs. For example, both RUP and
41

Iterative process models suggest iterative development during lifecycle. Participants
chose Iterative model if they used only iterative approach and other techniques suggested
by RUP model were not implemented in organization so Iterative model is the best choice
for the base process. It explains why Iterative process is so popular (Figure 17).
Chaos and Nothing are similar processes, so if we sum up them, they will get second
place in that rating (Figure 17). It shows that defined development processes are not
popular in the selected geographical region.
..
.
.
.Itera
tive
.Chao
s +N
othi
ng.RU
P
.Wat
erfa
ll
.Agi
le
.Spira
l
.Scru
m .XP
.0
.2
.4
.6
.8
.10
.12
.13
.10
.6
.5 .5
.3 .3
.1
Figure 17: Number of projects with selected software development process
Cancelled projects used RUP (Jacobson et al., 2000), XP (Beck, 1999) and Iterative
model as a development process. It is obvious that the success does not depend on the
42

development process directly because projects without any process can be successful
too. The problem is that it is difficult to predict the result for the project with chaos or
no process (Stokke, 1998). At the same time, everybody wants to know how to evaluate
chances for success so these "processes" are not suitable for manageable projects.
In this research I did not collect enough data for computing correlation between project
result and development process but some elements of the development process such as
requirements management, architecture design, and resource estimation were studied in
details.
..Requirements
.No modeling atall: 6 (∼12%)
.High-level
modeling usingwhiteboards andpaper: 5 (∼10%)
.High-level
modeling usingWord or Excelor other similar
programs:14 (∼29%)
.Detailed
modeling usingwhiteboards andpaper: 1 (∼2%).
Detailedmodeling usingWord or Excelor other similar
programs:10 (∼21%)
.Detailedmodeling
using CASEtools: 2 (∼4%)
.Initial require-
ments wereprovided to
us: 10 (∼21%)
Figure 18: Initial requirements modeling
Some facts which were investigated about requirements (Figure 18):
• 12% of all projects had no requirements at all. It means that there is no develop-
ment process in the company or, in other words, that the process is chaos.
• For every fifth project requirements were provided by customer or another organi-
zation.
43

• Every fourth project had detailed requirements
• 1 of 25 projects had special tools for requirements management
• 40% of participants preferred high-level modeling
These facts show that situation with requirements is critical. During interviews every-
body says that requirements are important for the success but requirements management
is a uncommon thing in practice.
..Architecture
.No modeling at
all: 3 (∼7%)
.High-level
modeling usingwhiteboardsand paper:14 (∼31%)
.Detailed
modeling usingWord or Excelor other similar
programs:3 (∼7%)
.High-level
modeling usingWord or Excelor other similar
programs:12 (∼27%) .
Detailedmodeling usingwhiteboards andpaper: 6 (∼13%)
.Initial archi-
tecture modelswere provided
to us: 3 (∼7%)
.Detailedmodeling
using CASEtools: 4 (∼9%)
Figure 19: Initial architecture modeling
The similar situation can be seen in the architecture design. Some facts about architec-
ture design are presented in Figure 19:
• 7% of all projects did not document architecture at all.
44

• For another 7% of projects architecture design was provided by other company or
customer
• About 60% of projects preferred high level architecture which was developed by
using whiteboard or programs like Word, Excel and similar tools.
• 30% of projects developed detailed architecture during development
• Only 10% of projects used a special tool for an architecture development.
As it can be seen, the situation with the architecture design is similar to the situation
with requirements except the fact that properly developed architecture can be met more
often than properly developed requirements.
It is important to plan work for the manager who wants to finish project on time and bud-
get. Figure 20 shows that the right estimation is even more rare than properly developed
requirements and architecture:
• 20% of projects did not use effort estimation practices.
• 50% of projects used high-level effort estimation which is based on reasonable
estimate of experienced persons.
• 35% of projects developed detailed estimate but only half of them used a special
technique for that purpose.
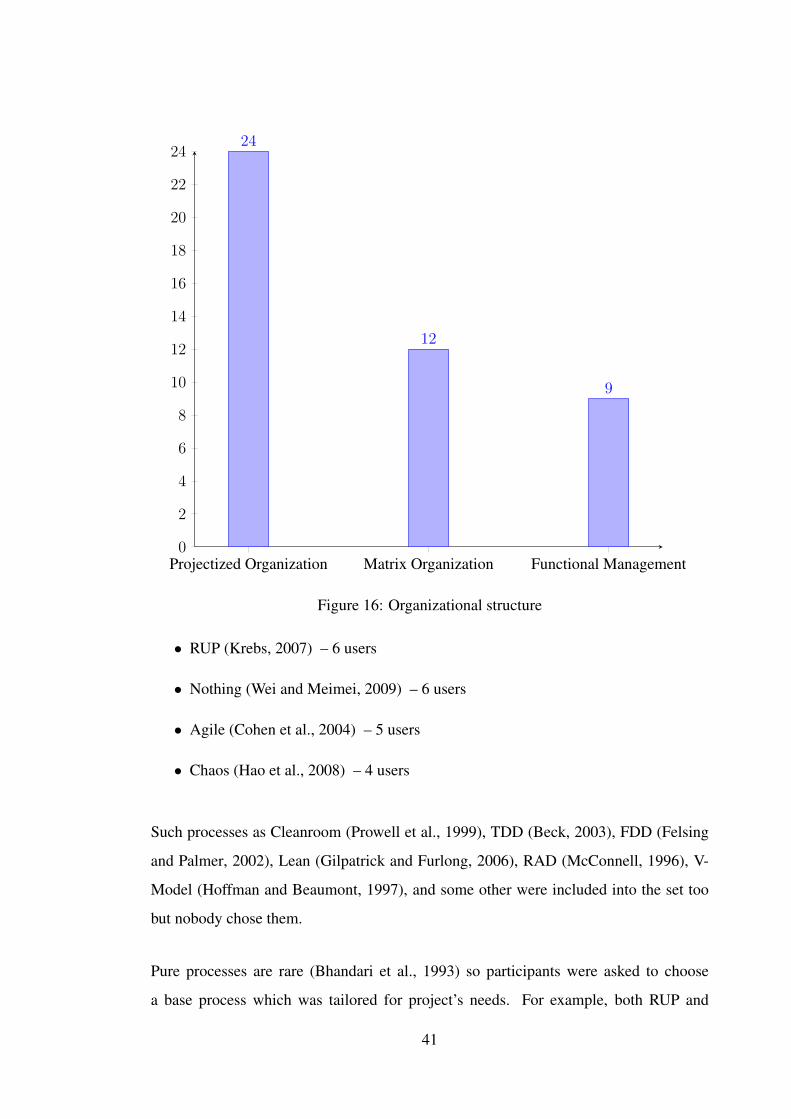
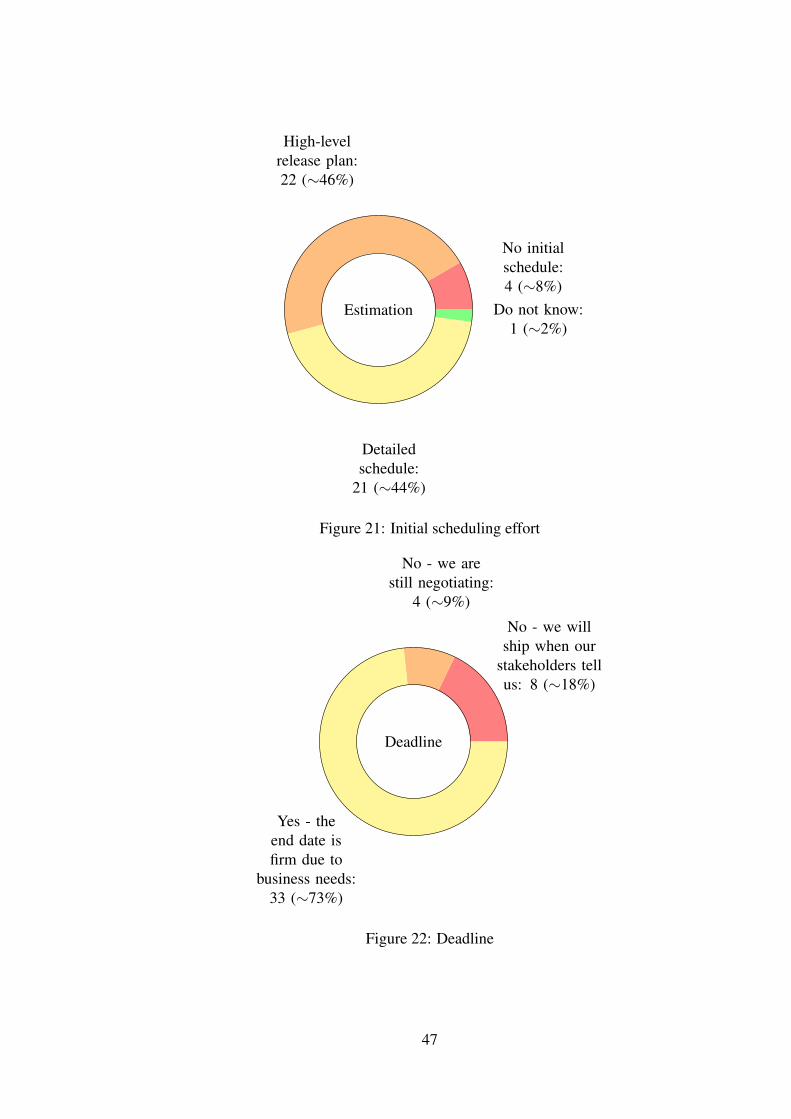
Figure 21 shows initial scheduling effort results. Ten percent of projects do not worry
about the schedule at all. High-level and detailed schedules were divided equally among
the remaining projects.
At the end, the situation with deadlines was studied. Every fourth project had not clear
deadline. This problem can happen when customer does not have any ideas how much
time the project requires and the manager cannot make a realistic project plan. As it was
45

..Effort estimation
.No initialestimate at
all: 9 (∼19%)
.High-levelestimate
based on agileestimationtechnique:1 (∼2%)
.High-level
estimate basedon a reasonable
guess ofexperiencepersons:
20 (∼43%)
.Detailed
estimate basedon traditional
estimationtechnique:2 (∼4%)
.Detailed estimate
based on areasonable guess
of experiencepersons: 9
(∼19%)
.Detailed estimate
based on agileestimationtechnique:5 (∼11%)
.Do not know:
1 (∼2%)
Figure 20: Initial estimation effort modeling
described, proper planning is still a problem so troubles with the deadline happen again
and again.
In the beginning of this chapter problems with development processes were shown. In
addition, most of project have problems with requirements management, architecture
design, and resource estimation. As a result, many software development project can be
labeled as out of control and the success of these projects is under the question.
46
..Estimation
.No initialschedule:4 (∼8%)
.High-level
release plan:22 (∼46%)
.Detailedschedule:
21 (∼44%)
.Do not know:
1 (∼2%)
Figure 21: Initial scheduling effort
..Deadline
.No - we will
ship when ourstakeholders tellus: 8 (∼18%)
.No - we are
still negotiating:4 (∼9%)
.Yes - the
end date isfirm due to
business needs:33 (∼73%)
Figure 22: Deadline
47

4.4 Distributed projects
In the current study 19 local and 12 distributed projects were investigated. The results are
presented in Figure 23. Six local and three distributed projects were finished successfully
without budget and time overhead. Nine local and four distributed projects were finished
with time overhead. In our research two local and two distributed projects were finished
with budget overhead and two local and three distributed projects were finished with
budget and time overhead.
..
.
..Finished without
budget andtime overhead
.Finished withtime overhead
.Finished with
budget overhead
.Finished with
time and budgetoverhead
.0
.1
.2
.3
.4
.5
.6
.7
.8
.9
.6
.9
.2 .2
.3
.4
.2
.3
.. ..local projects . ..distributed projects
Figure 23: Distributed projects statistic
At first glance, there is no dependency between local and distributed projects. That is
because the number of local project is 50 percent bigger. The normalized results are
presented in Figure 24.
48

..
.
..Finished without
budget andtime overhead
.Finished withtime overhead
.Finished with
budget overhead
.Finished with
time and budgetoverhead
.. ..local projects . ..distributed projects
Figure 24: Distributed projects statistics (normalized)
Figure 24 illustrates trends more obviously. The main trend for the local projects is
that they usually finish successfully (without budget and time overhead) or with time
overhead. The number of the local projects which are finished with budget overrun
or with time and budget overrun is small. The situation with distributed projects is
different. There are many distributed projects which are finished successfully. However
the number of projects which are finished with time and budget overrun is larger than a
number of projects which are finished with budget overrun.
The problems of distributed projects were studied during interviews. A framework for
this part was provided by Evaristo and Scudder (2000). 5 of 19 participants were asked
to rank the dimensions in order of importance. Results are presented in Table 9.
49
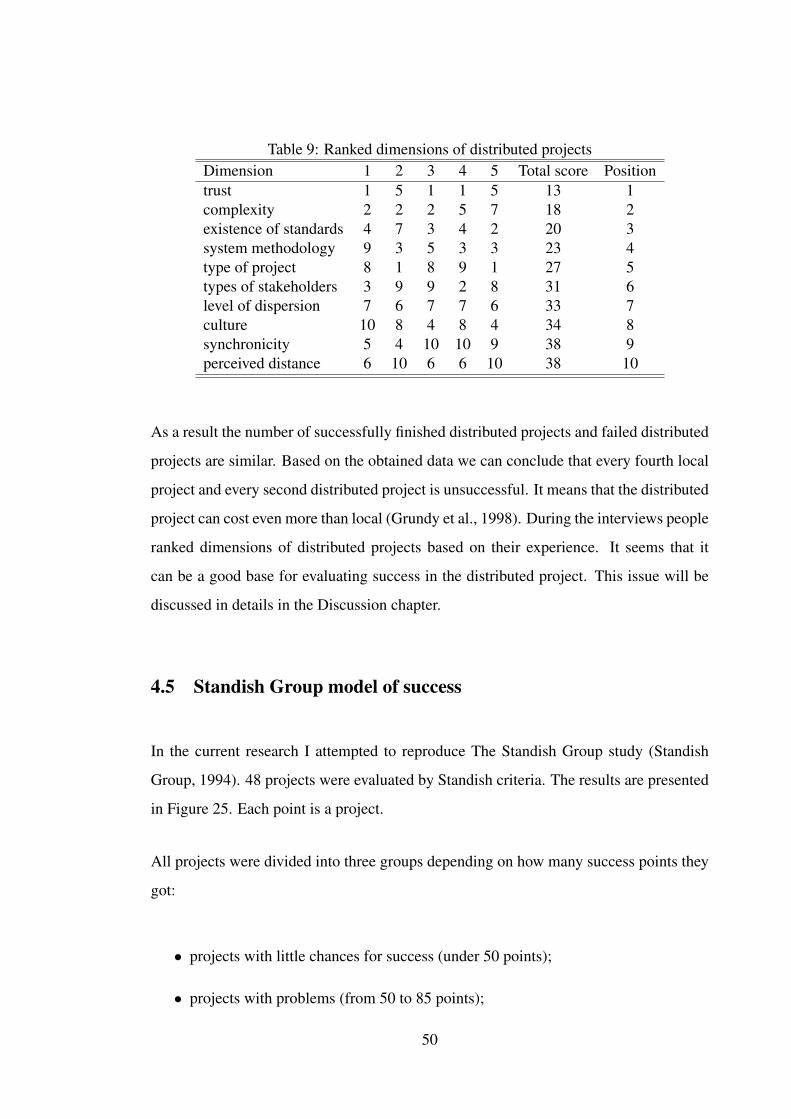
Table 9: Ranked dimensions of distributed projectsDimension 1 2 3 4 5 Total score Positiontrust 1 5 1 1 5 13 1complexity 2 2 2 5 7 18 2existence of standards 4 7 3 4 2 20 3system methodology 9 3 5 3 3 23 4type of project 8 1 8 9 1 27 5types of stakeholders 3 9 9 2 8 31 6level of dispersion 7 6 7 7 6 33 7culture 10 8 4 8 4 34 8synchronicity 5 4 10 10 9 38 9perceived distance 6 10 6 6 10 38 10
As a result the number of successfully finished distributed projects and failed distributed
projects are similar. Based on the obtained data we can conclude that every fourth local
project and every second distributed project is unsuccessful. It means that the distributed
project can cost even more than local (Grundy et al., 1998). During the interviews people
ranked dimensions of distributed projects based on their experience. It seems that it
can be a good base for evaluating success in the distributed project. This issue will be
discussed in details in the Discussion chapter.
4.5 Standish Group model of success
In the current research I attempted to reproduce The Standish Group study (Standish
Group, 1994). 48 projects were evaluated by Standish criteria. The results are presented
in Figure 25. Each point is a project.
All projects were divided into three groups depending on how many success points they
got:
• projects with little chances for success (under 50 points);
• projects with problems (from 50 to 85 points);
50

...
.
. . . . . . . . . . .
.0
.20
.40
.60
.80
.100.SC
Figure 25: Standish success criteria for studied projects
• potentially successful projects (more than 85 points);
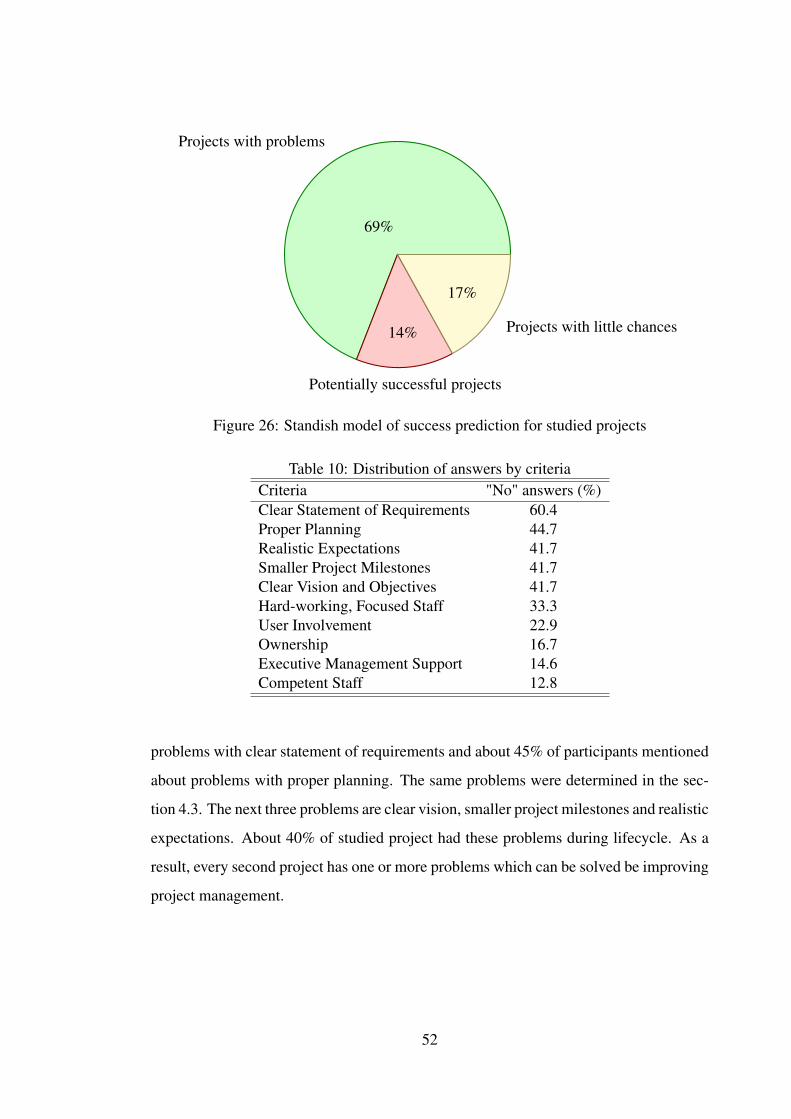
The results are presented in Figure 26. According to this pie chart only 14% of projects
had potential for the success. However, as we know, 29% of projects were finished with-
out any overrun (Figure 12). At the same time, Standish model predicted unsuccessful
projects very well: 17% of projects had little chances for success in Standish model and
16% of projects were finished with budget and time overruns in our research.
In Standish Model of success prediction most of the projects (69%) were labeled as
projects with problems. The problem is that Standish Group has very strict definition of
success so if project has a small overrun in any resource, it does not mean failure.
It is interesting to study which problems are most often encountered. Table 10 shows
frequency distribution of responses. About 60% of respondents says that they have
51
.
..Projects with problems
.69%
..Potentially successful projects
.14%
..Projects with little chances
.17%
Figure 26: Standish model of success prediction for studied projects
Table 10: Distribution of answers by criteriaCriteria "No" answers (%)Clear Statement of Requirements 60.4Proper Planning 44.7Realistic Expectations 41.7Smaller Project Milestones 41.7Clear Vision and Objectives 41.7Hard-working, Focused Staff 33.3User Involvement 22.9Ownership 16.7Executive Management Support 14.6Competent Staff 12.8
problems with clear statement of requirements and about 45% of participants mentioned
about problems with proper planning. The same problems were determined in the sec-
tion 4.3. The next three problems are clear vision, smaller project milestones and realistic
expectations. About 40% of studied project had these problems during lifecycle. As a
result, every second project has one or more problems which can be solved be improving
project management.
52

4.6 McConnell model of success
McConnell suggested a more complex approach for measuring the project state. Dur-
ing the first phase participants were asked to answer the questions developed by Steve
McConnell (McConnell, 1997). Then, scores were calculated and results are shown in
Figure 27 where each point is a project.
The four lines divided all projects into five areas. Project which is situated upper is more
successful, according to McConnell. Only one project collected 90 points. McConnell
says that this score is guarantee success in all respects, meeting its schedule, budget,
quality, and other targets. As it can be seen from the results, such projects can be met
very rarely (2% of projects).
...
.
. . . . . . . . . . .
.20
.30
.40
.50
.60
.70
.80
.90
.Scor
es
Figure 27: McConnell project distribution of the studied projects
At the same time, the project can be successful with 80 points. Such projects were
called excellent and they have a high probability to meet all goals: schedule, budget and
53
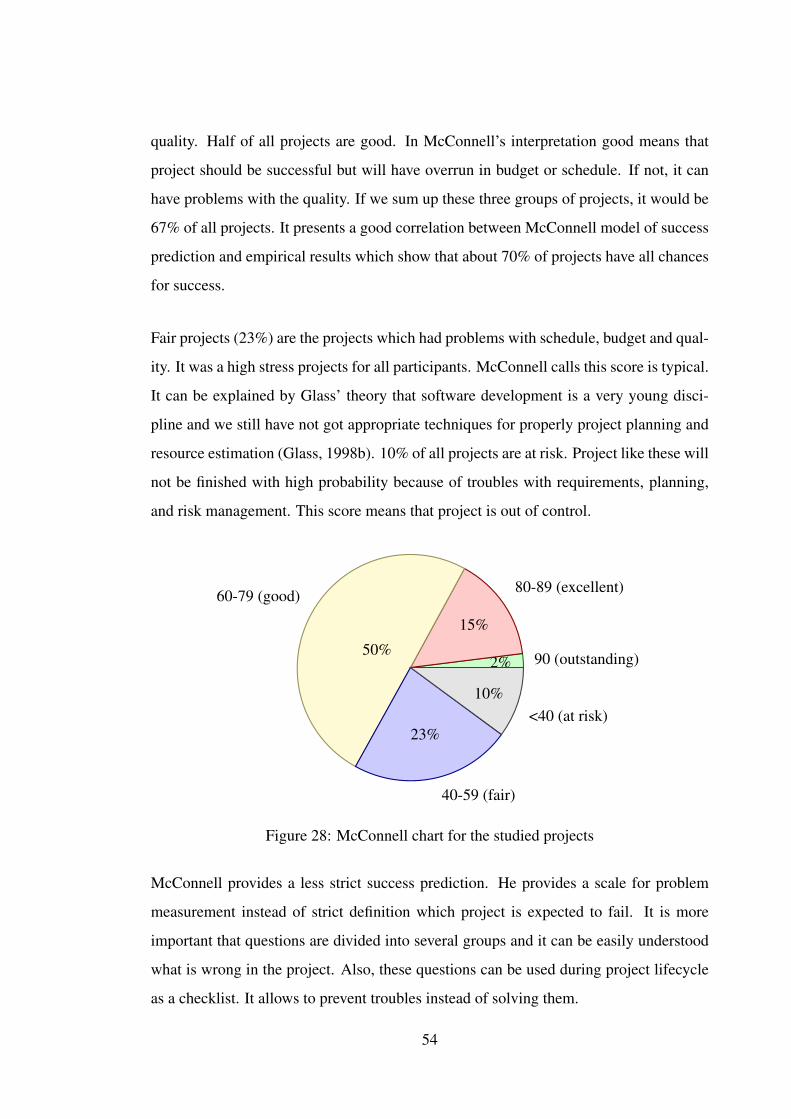
quality. Half of all projects are good. In McConnell’s interpretation good means that
project should be successful but will have overrun in budget or schedule. If not, it can
have problems with the quality. If we sum up these three groups of projects, it would be
67% of all projects. It presents a good correlation between McConnell model of success
prediction and empirical results which show that about 70% of projects have all chances
for success.
Fair projects (23%) are the projects which had problems with schedule, budget and qual-
ity. It was a high stress projects for all participants. McConnell calls this score is typical.
It can be explained by Glass’ theory that software development is a very young disci-
pline and we still have not got appropriate techniques for properly project planning and
resource estimation (Glass, 1998b). 10% of all projects are at risk. Project like these will
not be finished with high probability because of troubles with requirements, planning,
and risk management. This score means that project is out of control.
. . .90 (outstanding).2%
..80-89 (excellent)
.15%.
.60-79 (good)
.50%
..40-59 (fair)
.23%
..<40 (at risk)
.10%
Figure 28: McConnell chart for the studied projects
McConnell provides a less strict success prediction. He provides a scale for problem
measurement instead of strict definition which project is expected to fail. It is more
important that questions are divided into several groups and it can be easily understood
what is wrong in the project. Also, these questions can be used during project lifecycle
as a checklist. It allows to prevent troubles instead of solving them.
54

4.7 Success metrics
The success of any project is usually measured in three dimensions: time, budget, money
(Sultan et al., 2008). Firstly, participants were asked to rate importance of these three
metrics using the scale from 1 to 4 where 1 means the highest level of importance. The
results are presented in Figure 29 and average values are shown in Table 11.
..
.
..The most important .Very important .Important .Unimportant
.0
.2
.4
.6
.8
.10
.12
.14
.16
.18
.12.11
.10
.14
.8
.19
.12
.8.7
.15
.12 .12
.. ..TIME . ..MONEY . ..QUALITY
Figure 29: Importance of the metrics
Table 11: Average values for the importance of metricsMetric Average valueQuality 2.63Time 2.55Money 2.42
55

All metrics have similar average values. It can be concluded, that all metrics are impor-
tant but not too much. These results mean that companies have not got strict, predefined
goals and they are trying to be enough flexible for achieving business goals of their own
company and satisfy customers’ needs (Morisio et al., 2003).
In current research, questions about time, budget and quality were asked twice. The first
case was described above. In the second case participants were asked about what is the
most important in each of these dimensions.
..TIME
.Delivering ontime accordingto the schedule:
21 (∼44%)
.Delivering when
the systemis ready tobe shipped:24 (∼50%)
.It does notmatter to
me: 3 (∼6%)
Figure 30: Which is most important? TIME
Figure 30 shows that 6% of all participants do not worry about time resource at all.
And 50% are going to deliver the product when the system will be ready for it. Only
44% said that they will deliver the system according to the schedule. Although there are
many web sites, newspapers, journals and books writing about how proper planning is
important for the project success (Lyu et al., 2002), more than half of the projects did
not have delivering schedule.
56

Delivering when the system will be ready is a bad approach in the software development
because most programmers want to develop a perfect system and it does not matter how
much time they spend for that (Redig and Swanson, 1991). So the system will never be
ready for shipping.
..MONEY
.Delivering on or
under budget:27 (∼56%)
.Providing the
best returnon investment
(ROI): 16(∼33%)
.It does not
matter to me:5 (∼10%)
Figure 31: Which is most important? MONEY
The more surprising result is that 10% of people do not worry about project budget
(Figure 31). 10% of participants answered that money does not matter for them. About
33% is worrying about providing the best return on investment (ROI) and about 56%
think that their main task is to deliver the project on or under the budget.
4% of all people answered that quality does not matter to them (Figure 32). Other people
chose what is more important for them between two options: delivering systems on time
and on budget and delivering high quality systems. First option was chosen by 44% and
second was chosen by 52%.
The last question was about functionality. According to the results (Figure 33), only 21%
57

..QUALITY
.Delivering
systems on timeand on budget:
21 (∼44%)
.Delivering highquality and easy
to maintainsystems:
25 (∼52%)
.It does notmatter to
me: 2 (∼4%)
Figure 32: Which is most important? QUALITY
..FUNCTIONALITY
.Building thesystem to thespecification:10 (∼21%)
.Meeting the
actual needs ofstakeholders:37 (∼77%)
.It does notmatter to
me: 1 (∼2%)
Figure 33: Which is most important? FUNCTIONALITY
58

of participants build the systems according to the specification, and 77% try to meet
the actual needs of stakeholder. It shows us that only every fifth project has properly
developed specification which helps during implementation stage. Other projects rely
on current situation and customer’s requests about new functionality and rewrite the
specification many times during implementation phase.
Described results show management problems in the software development. The project
manager is responsible for every enumerated metrics (time, budget, quality) but the cur-
rent research showed that properly defined specifications and management methodolo-
gies are uncommon in the software development projects in Russia, Ukraine, and Be-
larus.
59

5 DISCUSSION
In this chapter the main results will be summarized and presented research questions will
be discussed. Each of the following chapters devotes to one of the research questions.
5.1 Major problems in the software development identified during
the study
The first research question was about the main reasons for success or failure of software
development projects in the selected geographical region (Russia-Ukraine-Belarus). The
current research shows that the development process is a large problem. It is a trend now
to write about importance of the process but, in practice, situation is different. As was
shown in Section 4.3, about 25% of all studied project used chaos development pro-
cess. Agile process may mean lack of process at all (Cao and Ramesh, 2007). Iterative
method is the most popular because of its simplicity (Sotirovski, 2001). The research
suggests that simple methodologies are more popular than complex. Complex and mod-
ern methodology is not a silver bullet because project manager should choose method-
ology based on existing conditions and restrictions (Spinellis, 2007). The problem is
that in the limited time and budget conditions, the process is based on increasing human
resources (developers and testers) instead of improving the process and quality.
The research also revealed problems with requirements management, architecture de-
sign, and resource estimation. The situation with requirements is critical. Requirements
management with using special tools is a rare activity (approximately 1 of 25 projects).
Even properly developed architecture can be met more often (approximately 1 of 10
projects) than correctly developed requirements. McConnell says: "Successful project
teams create their own opportunities to correct upstream problems by conducting thor-
ough, careful reviews of requirements and architecture" (McConnell, 1997). Require-
ments and architecture are foundation of the successful project according to the Mc-
60
Connell but it was established that this base is absent in the most of projects.
According to the results, right resource estimation is even more rare than properly de-
veloped requirements and architecture but it is not a large problem as it can be expected
because it is theoretically impossible to estimate a project in the early stages (McConnell,
1997). McConnell affirms that "early in the project you can have firm cost and schedule
targets or a firm feature set, but not both". The problem with resource estimation is ex-
ist and this problem can be partially solved but it is not a main factor of the successful
project. So the project manager should think about properly resource estimation when
other problems solved because the solution requires a lot of resources but impact on the
project success is limited if other problems exist.
In this research, every project was studied as an entity with three dimensions: time, bud-
get, and quality. In general, business do not require perfect product. The level of quality
should be enough and that is all what is required. The quality is expensive (Harvey,
1997) and business people are not going to pay more for the quality which they will not
use.
The gained results are quite similar to the other research (Agrawal and Chari, 2007)
so we can make a conclusion that importance of each of these metrics (time, budget,
quality) depends on current project and current situation in the company. Sometimes
you can donate additional resources to the future. For example, spending some extra
time for the product which can be easily maintained, reduces troubles in the future.
Importance of people communication was clearly illustrated in distributed projects. Lack
of effective communication decreases success chances significantly. Based on obtained
data we can conclude that every fourth local project and every second distributed project
is unsuccessful. It means that success chances in the distributed project are less than in
the local project. In distributed projects some costs (e.g. rent, salary) can be reduced,
but saved money will be spent on organizing effective communication between team
members and effective project management. As a result, distributed project will cost
61

even more than local (Lasser and Heiss, 2005).
5.2 Success prediction in the distributed projects
The second research question was how to predict the success chances in distributed
projects. The model which is based on Evaristo and Scudder (2000) framework is sug-
gested. This model is similar to The Standish Group model (Standish Group, 1994) but
it is customized for distributed projects.
As it was shown above (Section 4.4.), there is a big difference between local and dis-
tributed projects. Results show that distributed projects require a method for evaluating
and predicting their success. Evaristo and Scudder (2000) suggested a framework for
studying distributed projects but did not present a method for evaluating their success. It
seems that it should be a similar model such as Standish model or McConnell’s model.
This model should be tailored for characteristics (or dimensions) measurement of dis-
tributed projects. 10 dimensions were presented by Evaristo and Scudder (2000):
• trust
• level of dispersion
• types of stakeholders
• type of project
• existence of standards
• perceived distance
• synchronicity
• complexity
• system methodology
62

• culture
Each characteristic can be measured on scale from 0 to 4 points. Some of them such as
level of dispersion, level of synchronicity, level of complexity can be measured directly.
For example:
• 0 - no synchronicity
• 1 - low level of synchronicity
• 2 - medium level of synchronicity
• 3 - high level of synchronicity
• 4 - very high level of synchronicity
Other characteristics such as system methodology require an additional research for
defining the best and the worst system methodology which affects the success of dis-
tributed projects. These levels should be defined in an empirical way.
It seems that some dimensions are more important than others. For example, the system
methodology looks more significant for the success than the perceived distance so each
characteristic should be associated with a weighting factor.
The results of distributed project investigation are presented in Table 12 which shows
dimensions with their scores.
The dimensions with the highest total score (38) get the factor which is equal 1. The next
dimension with total score (34) gets the factor which is equal 5 (38−34 = 4; 1+4 = 5).
The final vector of weighting factors is W = (26, 21, 19, 16, 12, 8, 6, 5, 1, 1). Based on
that data, the success score for the distributed project (SSDP) can be evaluated by a
63
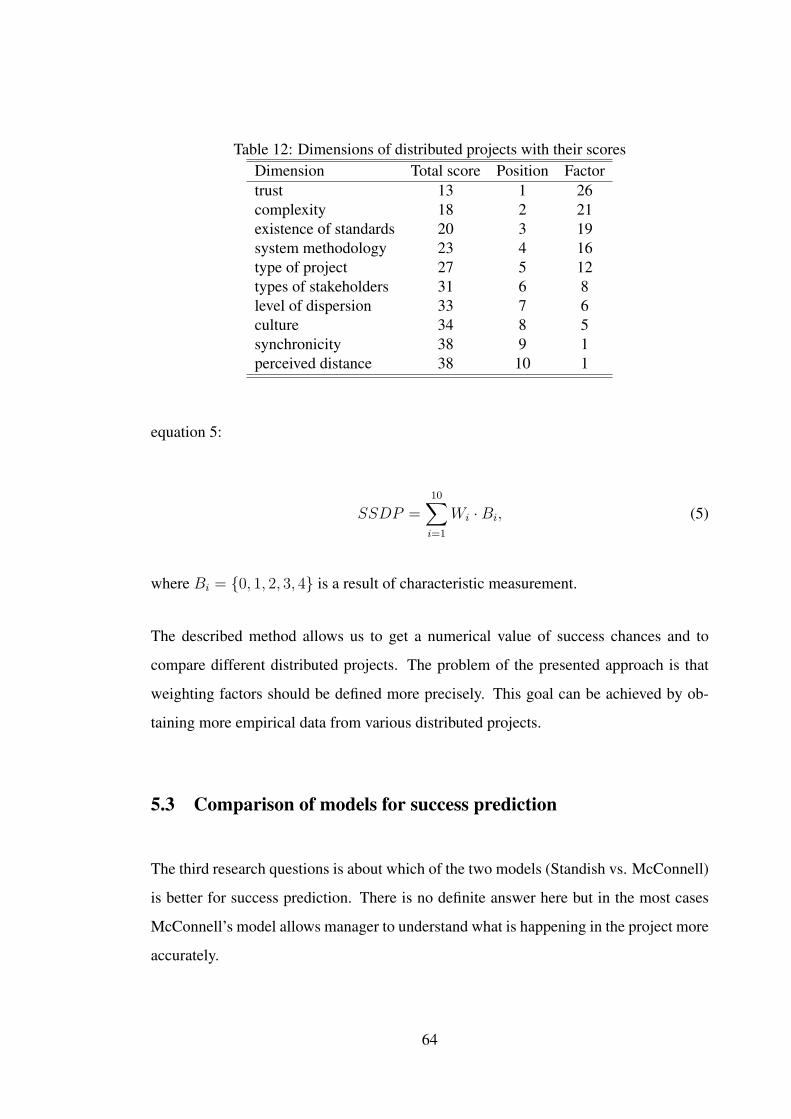
Table 12: Dimensions of distributed projects with their scoresDimension Total score Position Factortrust 13 1 26complexity 18 2 21existence of standards 20 3 19system methodology 23 4 16type of project 27 5 12types of stakeholders 31 6 8level of dispersion 33 7 6culture 34 8 5synchronicity 38 9 1perceived distance 38 10 1
equation 5:
SSDP =10∑i=1
Wi ·Bi, (5)
where Bi = {0, 1, 2, 3, 4} is a result of characteristic measurement.
The described method allows us to get a numerical value of success chances and to
compare different distributed projects. The problem of the presented approach is that
weighting factors should be defined more precisely. This goal can be achieved by ob-
taining more empirical data from various distributed projects.
5.3 Comparison of models for success prediction
The third research questions is about which of the two models (Standish vs. McConnell)
is better for success prediction. There is no definite answer here but in the most cases
McConnell’s model allows manager to understand what is happening in the project more
accurately.
64

Two models of success prediction were studied: The Standish Group and McConnell’s
model. According to The Standish Group, only 14% of studied projects are successful
but 29% of all projects were finished without time and budget overrun. It allows us to
think that this model is not suitable for precise success prediction because of strict def-
inition of success and tiny set of questions. Ten questions with two possible answers
(Yes, No) are not enough for project measurement. On the other hand, this model pre-
dicts failed projects pretty well (17% according to The Standish Group model and 16%
according to research). It can be simply explained by using ten criteria for success mea-
surement. The Standish Group says that the project with little chances is a project which
collects less than 50 of 100 points. It means that at least three of ten criteria cannot be
applied to this project. Statistic results show that lack of clear statement of requirements,
proper planning and realistic expectations are most common problems. Obviously that a
project which has all these problems is in trouble. Ten criteria suggested by The Standish
Group can be used as a checklist which shows problems from the bird eye view.
It seems that weighting coefficients which are using in The Standish Group model should
be critiqued. User involvement (weighting coefficient is 19) criteria cannot be six times
more important than clear vision or hard-working, focused staff (weighting coefficients
are 3). For example, let’s imagine two projects. First project has only one of ten criteria:
user involvement. The second project has next characteristics: competent staff, clear
vision, and hard-working, focused staff. The first project has not anything except user
involvement but The Standish Group model says that the first project has more chances
for success than the second. Clearly that it is not true. On the other hand, it is diffi-
cult to imagine project with high level of user involvement but without clear vision and
objectives.
The second model is McConnell model of success. This model is similar to The Stan-
dish Group model in the method of counting points. This model is better, according
to the research results, because the set of questions is bigger, and each question can be
answered by using scale from 0 to 3, each question has the equal weight in the results.
McConnell’s model results demonstrate a good level of success prediction with the col-
65

lected data (Table 13).
Table 13: McConnell model and empirical results comparisonProject result McConnell model Empirical resultsFinished without budget and timeoverhead
17% 29%
Finished with time overhead 50% 42%Finished with budget overhead 23% 13%Finished with time and budget over-head
10% 16%
McConnell model is more suitable for success evaluation because this model can be used
all time during project lifecycle. And the most important thing, which distinguishes this
model from The Standish Group model, is that McConnell provides guidelines about
what to do with the project with low scores. So, this model is iterative: we measure
chances for the success, distinguish problems, read possible solutions, solve problems
and measure chances again. It makes McConnell’s model more useful than The Standish
Group model which only states facts but does not give advice.
66

6 CONCLUSION
In this thesis software development projects from the selected geographical region (Russia-
Ukraine-Belarus) were studied. The purpose of the study is to share results about current
situation in the software development and attract attention to existing problems.
The research showed that the software development market has several problems. These
problems are widely known: project management and planning (section 5.1). Despite of
this fact, the situation in the software development is better than results of the Standish
Group reports.
Investigation of two models for success prediction showed that McConnell’s model is
more suitable for collected data because model allows tracking the project health (Sec-
tion 5.3). The results which were obtained by using this model are more objective than
the results from Standish model. The Standish model of success prediction can be used
only as a first step in success estimation because model provides only "bird eye view" to
the project health. Then, other models should be applied to the project.
Software is becoming more and more complicated (Lepasaar et al., 2001). The software
development costs are rising, it involves more and more people and companies. There-
fore, methods based on verbal agreements between customers, managers, developers
and other project participants do not work in the large and medium-sized projects. Large
projects require mathematical methods for development. We can compare this with the
stages of transition from small workshop to the factory, from factory to the enterprise.
Each mode of production fit their methods. It is impossible for an enterprise to apply
the same methods of production as in the home made laboratory. The same things are
happening in the IT. Small projects can be successful even without determined process
and management techniques. With growing project size these things become more and
more important for success.
Some problems such as impact of the development process to the project success were
67

not fully studied because of limited set of the projects. It can be a good topic for the
future research. Another direction of the future studies can be a project research during a
lifecycle. The set of the projects should be chosen on the early stages of the development.
Then, these projects will be measured during project progress. At the same time, in some
organizations SPI techniques can be applied. It allows measuring how they affect success
more precisely.
Evaristo and Scudder (2000) framework was extended by adding a method for measure-
ment of success scores for distributed projects but it requires more data from various
distributed projects for defining weighting factors more precisely.
Success measurements should be conducted periodically. It gives information about
current situation in the software development and about the most popular best practices.
It also can help to create community where IT and business people will be able to share
their knowledge about technical and management practices. It is not a secret that people
do not like to speak about failures but failure is a normal result. Any project can be
restarted. The main point is what lessons we have learned from the last failures. If we
know what was wrong, chances for the success in the next projects increase. Otherwise,
it is a waste of time.
As was mentioned above, The Standish Group provides the most pessimistic view to the
number of successful project in software development. At the same time, The Standish
Group reported that the number of successful project changed from 16% in 1994 to
32% in 2009 (Table 2). So we can expect that in the reality this percent is higher. For
example, the current research reports that about 70% of software development projects
are successful.
There are some different ways to continue this work:
1. Additional study which will define weighting coefficients for distributed projects
(Section 5.2) with better accuracy is required.
68
2. The research which will include success chances measurements during project
lifecycle helps to define which SPI techniques are suitable for the software devel-
opment projects in the selected geographical region.
3. The same research, as was described in this thesis, should be conducted periodi-
cally because it allows everybody who is interested in current situation in software
development to be aware of current problems and their solutions.
69

References
Agrawal, M. and Chari, K. (2007). ”Software Effort, Quality, and Cycle Time: A Study
of CMM Level 5 Projects”. IEEE Transactions on Software Engineering, 33, pp.
145 –156.
Alonso, I.; Verdun, J. and Caro, E. (2009). ”IT, Senior Executives and Board of Directors
Contribute to the Success of the Business: Implicates on the IT Demand Process–Life
Cycle”. Fourth International Conference on Computer Sciences and Convergence
Information Technology, pp. 149 –156.
Andersen, E. (2001). ”Understanding your IT project organization’s character: explor-
ing the differences between the cultures of an IT project and its base organization”.
Proceedings of the 34th Annual Hawaii International Conference on System Sciences,
pp. 9.
Aoyama, M. (1997). ”Process and economic model of component-based software de-
velopment: a study from Software CALS Next Generation Software Engineering pro-
gram”. Proceedings Fifth International Symposium on Assessment of Software Tools
and Technologies, pp. 100 –103.
Arshah, R.; Desa, M. and Hussin, A. (2008). ”The need of Information Systems (IS)
Integration Complexity Model for IS integration project”. International Symposium
on Information Technology. ITSim 2008, pp. 1 –9.
Atlee, J. and Wieringa, R. (2006). ”RE 05: Engineering Successful Products”. IEEE
Software, 23, pp. 16 –18.
Basili, V. (2006). ”The Role of Empirical Study in Software Engineering”. 30th Annual
IEEE/NASA Software Engineering Workshop. SEW ’06, pp. 3 –6.
Beck, K. (1999). Extreme Programming Explained: Embrace Change. Addison-Wesley
Professional. ISBN 978-0201616415.
Beck, K. (2003). Test-Driven Development by Example. Addison-Wesley Professional.
ISBN 978-0321146533.
70

Belbin, R. (1981). Management Teams: Why they succeed or fail. Butterworth-
Heinemann Ltd. ISBN 978-1856178075.
Berntsson, R. (2006). ”Successful Software Project and Products: An Empirical Inves-
tigation”. Methodology, 3, pp. 144 –153.
Bhandari, I.; Halliday, M.; Tarver, E.; Brown, D.; Chaar, J. and Chillarege, R. (1993). ”A
case study of software process improvement during development”. IEEE Transactions
on Software Engineering, 19, pp. 1157 –1170.
Boehm, B. (1994). ”Software architectures: critical success factors and cost drivers”.
16th International Conference on Software Engineering. ICSE-16, pp. 9.
Boehm, B. (2000). ”Project termination doesn’t equal project failure”. IEEE Computer,
33, pp. 94 –96.
Brebner, P. (1998). ”Software process improvement by example (SPIE)”. International
Conference on Software Engineering. ICSE ’98, pp. 88 –95.
Brooks, F. (1995). The mythical man-month. Addison-Wesley, 2nd edition. ISBN 978-
0201835953.
Cao, L. and Ramesh, B. (2007). ”Agile Software Development: Ad Hoc Practices or
Sound Principles?”. IT Professional, 9, pp. 41 –47.
Coase, R. (1937). ”The Nature of the Firm”. Economica, 4, pp. 386 –405.
Cockburn, A. (1999). ”Characterizing people as non-linear, first-order components in
software development.”. Humans and Technology, 3, pp. 87 –102.
Cockburn, A. (2008). ”Using Both Incremental and Iterative Development”. Humans
and Technology Technical Report, 2, pp. 134 –145.
Cohen, D.; Lindvall, M. and Costa, P. (2004). ”An introduction to agile methods”. IEEE
Software, 6, pp. 34 –42.
71

Collofello, J. and Ng, C. H. (1999). ”Assessing the process maturity utilized in software
engineering team project courses”. 29th Annual on Frontiers in Education Conference.
FIE ’99, pp. 12A9/5 – 12A9/9 vol.1.
Constantantine, L. (2001). The Peopleware papers. Prentice-Hall PTR, 2nd edition.
ISBN 978-0130601230.
Daihani, D.; Jaubert, B. and Kieffer, J.-P. (1993). ”Integration of heterogeneous software
packages in the field of production management and production control systems: a
view of generic problems and a conceptual approach”. Computers in Design, Manu-
facturing, and Production, 2, pp. 203 –217.
DeMarco, T. (1995). ”What "lean and mean" really means”. IEEE Software, 12, pp.
101 –102.
DeMarco, T. and Lister, T. (1999). Peopleware: Productive Projects and Teams. Dorset
House Publishing Company, 2nd edition. ISBN 978-0932633439.
Dyba, T. (2005). ”An Empirical Investigation of the Key Factors for Success in Software
Process Improvement”. IEEE Transactions on Software Engineering, 31, pp. 410 –
424.
Evaristo, J. and Scudder, R. (2000). ”Geographically distributed project teams: a dimen-
sional analysis”. Proceedings of the 33rd Annual Hawaii International Conference on
System Sciences, pp. 11.
Eveleens, J. L. and Verhoef, C. (2010). ”The Rise and Fall of the Chaos Report Figures”.
IEEE Software, 3, pp. 30 –36.
Felsing, J. and Palmer, S. (2002). ”A Practical Guide to Feature-Driven Development”.
IEEE Software, 7, pp. 67 –72.
Galkin, O. and Efimov, I. (2005). ”Condition and requirements to the software of Russian
public key infrastructure”. International Siberian Workshop and Tutorials on Electron
Devices and Materials, pp. 238 –239.
72

Gilpatrick, K. and Furlong, B. (2006). The Elusive Lean Enterprise. Trafford Publishing.
ISBN 978-1412031981.
Glass, R. (1998a). ”How Not To Prepare For A Consulting Assignment And Other Ugly
Consultancy Truths”. Communications of the ACM, 41, pp. 34 –39.
Glass, R. (1998b). Software Runaways: lessons learned from massive software project
failures. Prentice-Hall. ISBN 978-0136734437.
Glass, R. (2005). ”IT Failure Rates - 70% or 10-15%”. IEEE Computer Magazine, 5,
pp. 20 –22.
Grundy, J.; Hosking, J. and Mugridge, R. (1998). ”Coordinating distributed software de-
velopment projects with integrated process modelling and enactment environments”.
Seventh IEEE International Workshops on Enabling Technologies: Infrastructure for
Collaborative Enterprises. WET ICE ’98, pp. 39 –44.
Hac, A. (1991). ”Using a software reliability model to design a telecommunications
software architecture”. IEEE Transactions on Reliability, 40, pp. 488 –494.
Hamidovic, A. and Krajnovic, S. (2005). ”An example of a novel approach to mea-
suring projects success within ICT industry”. Proceedings of the 8th International
Conference on Telecommunications. ConTEL 2005, pp. 677 –682.
Hao, Z.; Tie-nan, Z.; Ji-hong, S. and Xiao-jing, L. (2008). ”Research on characteris-
tics of chaos in enterprise strategic system and chaos management”. International
Conference on Management Science and Engineering. ICMSE 2008, pp. 393 –399.
Hartman, D. (2006). ”Interview: Jim Johnson of the Standish Group”. IEEE Software,
7, pp. 112 –121.
Harvey, L. (1997). ”Quality Is NOT Free. Quality monitoring alone will not improve
quality”. Tertiary Education and Management, 3, pp. 133 –143.
Hillam, C.; Edwards, H. and Young, C. (2000). ”Successful software applications: can
they be evaluated?”. The 24th Annual International Computer Software and Applica-
tions Conference. COMPSAC 2000, pp. 528 –534.
73

Hoffman, M. and Beaumont, T. (1997). ”Application Development: Managing the
Project Life Cycle”. IEEE Transactions on Software Engineering, 19, pp. 543 –561.
Hofmann, H. and Lehner, F. (2001). ”Requirements engineering as a success factor in
software projects”. IEEE Software, 18, pp. 580 –586.
Hua, Z.; Ji-dong, S.; Xin, L. and Li-guo, S. (2006). ”An Innovative Research on the
Mechanism of Integrated Strategic Financial Risk Management in the State-Owned
Enterprise Group - Based on the Balanced Scorecard”. International Conference on
Management Science and Engineering. ICMSE ’06, pp. 1696 –1702.
Hui, A. and Liu, D. (2004). ”A Bayesian belief network model and tool to evaluate risk
and impact in software development projects”. Annual Symposium - Reliability and
Maintainability, pp. 297 –301.
IBM (2010). ”IBM. Main page”. http://www.ibm.com/us/en/ Last accessed 15.04.2010.
Ikonen, M. and Kurhila, J. (2009). ”Discovering High-Impact Success Factors in Cap-
stone Software Projects”. Information Systems, 2, pp. 235 –244.
InfoWorld (2004). ”The six myths of IT”. http://www.infoworld.com/t/application-
development/six-great-myths-it-384 Last accessed 30.03.2010.
Jacobson, I.; Booch, G. and Rumbaugh, J. (2000). The Unified Software Development
Process. Addison-Wesley Professional. ISBN 978-0201571691.
Jarvinen, P. (2004). On Research Methods. Tampere University. ISBN 978-9923317475.
Jenkins, A. (1985). ”Research methodologies and MIS research”. Conference on Re-
search Methods in Information Systems. RMIS 1985, pp. 57 –65.
Jones, C. (1994). ”Software challenges: the weakest link in the software engineering
chain”. IEEE Computer, 27, pp. 10 –11.
Jorgensen, M. and Molokken, K. (2006). ”How Large Are Software Cost Overruns? A
Review of the 1994 Chaos Report”. Information and Software Technology, 48, pp.
42 –54.
74

Khan, S.; Niazi, M. and Ahmad, R. (2009). ”Critical Success Factors for Offshore Soft-
ware Development Outsourcing Vendors: A Systematic Literature Review”. Fourth
IEEE International Conference on Global Software Engineering. ICGSE 2009, pp.
207 –216.
Klepper, R. (1990). ”An agency theory perspective on information centers”. Proceedings
of the Twenty-Third Annual Hawaii International Conference on System Sciences., 4,
pp. 251 –259.
KPMG (1995). ”Runaway Projects - Cause and Effects”. Software World (UK), 26, pp.
67 –78.
Krebs, J. (2007). ”The value of RUP certification”. IEEE Software, 5, pp. 112 –125.
Lacity, M. and Rottman, J. (2008). ”The Impact of Outsourcing on Client Project Man-
agers”. Computer, 41, pp. 100 –102.
Lasser, S. and Heiss, M. (2005). ”Collaboration maturity and the offshoring cost barrier:
the tradeoff between flexibility in team composition and cross-site communication
effort in geographically distributed development projects”. International Professional
Communication Conference. IPCC 2005, pp. 718 –728.
Lee, J.-N. and Kim, Y.-G. (2005). ”Understanding outsourcing partnership: a compar-
ison of three theoretical perspectives”. IEEE Transactions on Engineering Manage-
ment, 52, pp. 43 –58.
Lepasaar, M.; Kalja, A.; Varkoi, T. and Jaakkola, H. (2001). ”Key success factors of a
regional software process improvement programme”. Portland International Confer-
ence on Management of Engineering and Technology. PICMET ’01, pp. 432.
Little, T. (2006). ”Schedule estimation and uncertainty surrounding the cone of uncer-
tainty”. IEEE Software, 23, pp. 48 –54.
Lotvin, M. and Nemes, R. (1991). ”Patenting financial software”. First International
Conference on Artificial Intelligence on Wall Street, pp. 324 –325.
75

Lu, X. and Zhang, J. (2005). ”A new method of decision rule mining for IT project risk
management based on rough set”. International Conference on Services Systems and
Services Management. ICSSSM ’05, pp. 1022 –1026.
Lyu, M.; Rangarajan, S. and van Moorsel, A. (2002). ”Optimal allocation of test re-
sources for software reliability growth modeling in software development”. IEEE
Transactions on Reliability, 51, pp. 183 –192.
Mahoney, M. S. (1988). ”The History of Computing in the History of Technology”.
IEEE Annals of the History of Computing., 10, pp. 113 –125.
Mann, A. (2009). ”Information Technology and the Related Services Industry: Eval-
uating India’s Success Factors”. 42nd Hawaii International Conference on System
Sciences. HICSS ’09, pp. 1 –10.
MarketResearch (2009). ”Russia Information Technology Report Q2 2009”. PMR, 2,
pp. 54 –58.
Maslow, A. (1943). ”A Theory of Human Motivation”. Psychological Review, 4, pp.
43 –49.
McCarthy, J. and Matthern, G. (1999). ”Matrix management of a functional organization
during change-case history”. Portland International Conference on Management of
Engineering and Technology. PICMET ’99, pp. 315 –321.
McConnell, S. (1996). Rapid Development: Taming Wild Software Schedules. Microsoft
Press. ISBN 978-1556159008.
McConnell, S. (1997). Software Project Survival Guide. Microsoft Press. ISBN 978-
1572316218.
Menzies, T. and Di Stefano, J. (2003). ”More success and failure factors in software
reuse”. IEEE Transactions on Software Engineering, 29, pp. 474 –477.
Moe, N. and Aurum, A. (2008). ”Understanding Decision-Making in Agile Software
Development: A Case-study”. 34th Euromicro Conference on Software Engineering
and Advanced Applications. SEAA ’08, pp. 216 –223.
76

Morisio, M.; Ezran, M. and Tully, C. (2002). ”Success and failure factors in software
reuse”. IEEE Transactions on Software Engineering., 28, pp. 340 –357.
Morisio, M.; Ezran, M. and Tully, C. (2003). ”Comments on "More success and failure
factors in software reuse"”. IEEE Transactions on Software Engineering., 29, pp.
478 –487.
Nakamura, T. (2005). ”Analysis of project management reports of 49 system integration
projects”. 13th IEEE International Conference on Requirements Engineering, pp.
485 –486.
Nan, N. and Harter, D. (2009). ”Impact of Budget and Schedule Pressure on Software
Development Cycle Time and Effort”. IEEE Transactions on Software Engineering,
35, pp. 624 –637.
Niazi, M.; Wilson, D. and Zowghi, D. (2006). ”Critical success factors for software
process improvement implementation: an empirical study”. Software Process: Im-
provement and Practice, 11, pp. 193 –211.
Paulson, L. (2001). ”Adapting methodologies for doing software right”. IT Professional,
3, pp. 13 –15.
Project Management Institute (2004). Project Management Body of Knowledge. ISBN
978-1930699212.
Prowell, S. J.; Trammell, C. J.; Linger, R. C. and Poore, J. H. (1999). Cleanroom
software engineering: Technology and Process. Addison-Wesley Professional. ISBN
978-0201854800.
Redig, G. and Swanson, M. (1991). ”Total quality management for software develop-
ment”. Proceedings of the IEEE National Aerospace and Electronics Conference.
NAECON 1991, pp. 301 –306.
Reel, J. (1999). ”Critical success factors in software projects”. IEEE Software, 16, pp.
18 –23.
77

Rikkiev, A. and Makinen, S. (2009). ”Success factors for technology integration conver-
gence collaborations: Empirical assessment”. Portland International Conference on
Management of Engineering Technology. PICMET 2009, pp. 374 –382.
Salaka, V. and Prabhu, V. (2006). ”Project Management for Enterprise Integration”. 10th
IEEE International Enterprise Distributed Object Computing Conference. EDOC ’06,
pp. 284 –296.
SAP (2010). ”Main Page”. http://www.sap.com/index.epx Last accessed 30.03.2010.
Saremi, A.; Esmaeili, M. and Rahnama, M. (2007). ”Evaluation complexity problem
in agent based software development methodology”. International Conference on
Industrial and Information Systems. ICIIS 2007, pp. 577 –584.
Schwartz, E. (2004). ”Great Myth of IT”. http://www.infoworld.com/t/application-
development/six-great-myths-it-384 Last accessed 30.03.2010.
Sneed, H. and Brossler, P. (2003). ”Critical success factors in software maintenance:
a case study”. International Conference on Software Maintenance. ICSM 2003, pp.
190 –198.
Soini, J.; Keto, H. and Makinen, T. (2006). ”An Approach to Monitoring the Success
Factors in Software Business in Small and Medium Size Software Companies”. Tech-
nology Management for the Global Future. PICMET 2006, pp. 2801 –2808.
Sotirovski, D. (2001). ”Heuristics for iterative software development”. IEEE Software,
18, pp. 66 –73.
Spinellis, D. (2007). ”Silver Bullets and Other Mysteries”. IEEE Software, 24, pp.
22 –23.
Standish Group (1994). ”The Standish Group chaos report”. www.standishgroup.com
Last accessed 30.03.2010.
Statistics (2001). ”Occupational Outlook Handbook”.
http://www.bls.gov/oco/ocos258.htm Last accessed 30.03.2010.
78
Stelzer, D.; Mellis, W. and Herzwurm, G. (1996). ”Software process improvement via
ISO 9000? Results of two surveys among European software houses”. Proceedings of
the Twenty-Ninth Hawaii International Conference on System Sciences, pp. 703 –712.
Stokke, H. (1998). ”Software development process improvements by metrics-a taming
of chaos”. 24th Euromicro Conference, pp. 871 –874.
Stribrny, S. and Mackin, F. (2006). ”When Politics Overshadow Software Quality”.
IEEE Software, 23, pp. 72 –73.
Sultan, K.; En-Nouaary, A. and Hamou-Lhadj, A. (2008). ”Catalog of Metrics for As-
sessing Security Risks of Software throughout the Software Development Life Cycle”.
International Conference on Information Security and Assurance. ISA 2008, pp. 461 –
465.
Terekhov, A. (2001). ”The Russian software industry”. IEEE Software, 18, pp. 98 –101.
Wasmund, M. (1993). ”Implementing Critical Success Factors in software reuse”. IBM
Systems Journal, 32, pp. 595 –611.
Wei, C. and Meimei, X. (2009). ”Software Company Process Management and Pro-
cess Audit Research”. International Conference on Management and Service Science.
MASS ’09, pp. 1 –4.
Wiegers, K. (2009). ”Success criteria breed success”.
http://www.ibm.com/developerworks/rational/library/2950.html Last accessed
30.03.2010.
Xuezhong, C.; Na, Z. and Zhaohan, S. (2008). ”Team Social Capital and its Impact
on Team Performance”. 4th International Conference on Wireless Communications,
Networking and Mobile Computing. WiCOM ’08, pp. 1 –4.
Yarom, I.; Rosenschein, J. and Goldman, C. (2003). ”The role of middle-agents in
electronic commerce”. IEEE Intelligent Systems, 18, pp. 15 –21.
79

Appendix 1
A APPENDICES
A.1 Survey form
1. Contact information
• Name
• Company
• E-mail address
• Phone number
2. Which best describes your position?
• Architect
• Business analyst
• Business stakeholder
• IT director
• IT manager
• Product owner
• Programmer
• Project manager
• QA Engineer
• Other
3. How many years of experience do you have?
• None
• Less than 2 years
• 2 to 4 years

Appendix 1
• 5 to 10 years
• 10 to 20 years
• 20+ years
4. Which sector is your organization primary in?
• E-commerce
• Financial
• Government
• IT consulting
• IT company
• Manufacturing
• Retail
5. How many IT people are/were in the company?
• 1-5
• 6-10
• 11-20
• 21-50
• 51-100
• 101-200
• 201-500
• 500+
• Do not know
6. Information about project
• Project name
• Project budget

Appendix 1
• Number of people in the project
• Number of IT people in the project
7. What was your team’s approach to initial requirements?
• No modeling at all
• High-level modeling using white boards and paper
• High-level modeling using such tools as Word, Excel and other similar pro-
grams
• High-level modeling using modeling/CASE tools
• Detailed modeling using white boards and paper
• Detailed modeling using such tools as Word, Excel and other similar pro-
grams
• Detailed modeling using modeling/CASE tools
• Initial requirements were provided to us
8. What was your team’s approach to initial architecture modeling?
• No modeling at all
• High-level modeling using white boards and paper
• High-level modeling using such tools as Word, Excel and other similar pro-
grams
• High-level modeling using modeling/CASE tools
• Detailed modeling using white boards and paper
• Detailed modeling using such tools as Word, Excel and other similar pro-
grams
• Detailed modeling using modeling/CASE tools
• Initial models were provided to us
9. How did your team approach the initial effort for your project?
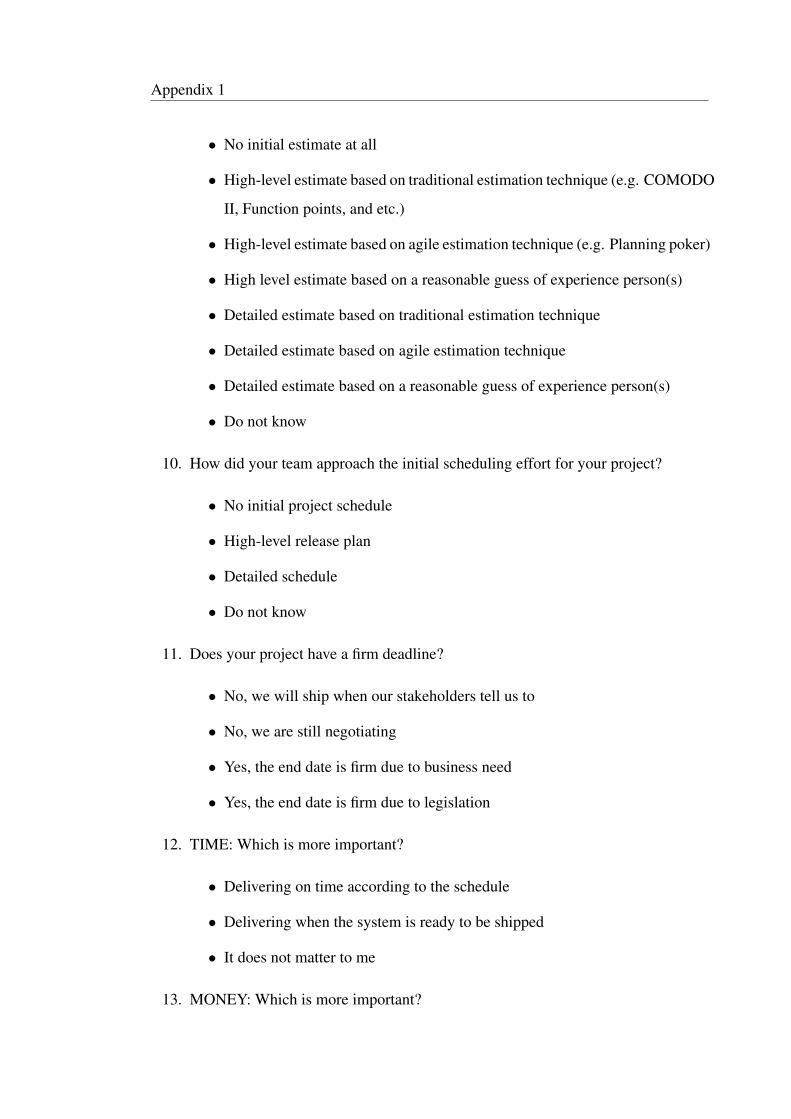
Appendix 1
• No initial estimate at all
• High-level estimate based on traditional estimation technique (e.g. COMODO
II, Function points, and etc.)
• High-level estimate based on agile estimation technique (e.g. Planning poker)
• High level estimate based on a reasonable guess of experience person(s)
• Detailed estimate based on traditional estimation technique
• Detailed estimate based on agile estimation technique
• Detailed estimate based on a reasonable guess of experience person(s)
• Do not know
10. How did your team approach the initial scheduling effort for your project?
• No initial project schedule
• High-level release plan
• Detailed schedule
• Do not know
11. Does your project have a firm deadline?
• No, we will ship when our stakeholders tell us to
• No, we are still negotiating
• Yes, the end date is firm due to business need
• Yes, the end date is firm due to legislation
12. TIME: Which is more important?
• Delivering on time according to the schedule
• Delivering when the system is ready to be shipped
• It does not matter to me
13. MONEY: Which is more important?

Appendix 1
• Delivering on or under budget
• Providing the best return on investment (ROI)
• It does not matter to me
14. FUNCTIONALITY: Which is more important?
• Building the system to the specification
• Meeting the actual needs of stakeholders
• It does not matter to me
15. QUALITY: Which is more important?
• Delivering systems on time and on budget
• Delivering high quality, easy to maintain systems
• It does not matter to me
16. Project status
• Finished without budget and time overhead
• Finished with time overhead
• Finished with budget overhead
• Finished with budget and time overhead
• Not finished
• Canceled
17. People in the project
• Amount of people (male/female) in project
• How many years of work experience do they have in average?
• Amount of managers in the project
• Who is responsible for the project?
18. Project size in people-hours

Appendix 1
19. Project type
• Local project
• Distributed project (participants from 2 organizations)
• Distributed project (participants from 3 organizations)
• Distributed project (participants from 4 organizations)
• Distributed project (participants from 5 or more organizations)
20. Software development process (select the base model for internally made process)
• Agile
• Cleanroom
• DSDM
• Iterative
• RAD
• RUP
• Spiral
• Waterfall
• XP
• Scrum
• Lean
• V-model
• FDD
• TDD
• Chaos
• Nothing
21. Which tools are/were you using/used in the project?

Appendix 1
• Management tools
• Requirements tools
• Development tools
• Testing tools
• Programming languages
22. Management type
• Matrix organization
• Project organization
• Functional management
23. Rate the factors in order of importance (write number from 1 to 4, 1 is the most
important)
• Time
• Money
• Quality
• People
24. Give the project 3 points for each "yes" answer, give it 2 points for "probably", 1
point - "disagree", and 0 - "strongly disagree" . If the project is well underway,
answer the questions based on what has actually happened on the project.
• Does the project have a clear, unambiguous vision statement or mission state-
ment?
• Do all team members believe the vision is realistic?
• Does the project have a business case that details the business benefit and
how the benefit will be measured?
• Does the project have a user interface prototype that realistically and vividly
demonstrates the functionality that the actual system will have?

Appendix 1
• Does the project have a detailed, written specification of what the software is
supposed to do?
• Did the project team interview people who will actually use the software (end
users) early in the project and continue to involve them thought the project?
• Does the project have a detailed, written Software Development Plan?
• Does the project’s task list include creation of an installation program, con-
version of data from previous version of the system, integration with third-
party software, meetings with the customer, and other minor tasks?
• Were the schedule and budget estimates officially updated at the end of the
most recently completed phase?
• Does the project have detailed, written architecture and design documents?
• Does the project have detailed, written Quality Assurance Plan that requires
design and code reviews in addition to system testing?
• Does the project have a detailed Staged Delivery Plan for the software, which
describes the stages in which the software will be implemented and deliv-
ered?
• Does the project have a detailed Staged Delivery Plan for the software, which
describes the stages in which the software will be implemented and deliv-
ered?
• Does the project’s plan include time for holidays, vacation days, sick days,
and ongoing training, and are resources allocated at less than 100 percent?
• Was the project plan, including the schedule, approved by the development
team, the quality assurance team, and the technical writing teamin other
words, the people responsible for doing the work?
• Has a single key executive who has decision-making authority been made
responsible for the project, and does the project have that person’s active
sup-port?
• Does the project manager’s workload allow him or her to devote an adequate
amount of time to the project?

Appendix 1
• Does the project have well-defined, detailed milestones ("binary milestones")
that are considered to be either 100 percent done or 100 percent not done?
• Can a project stakeholder easily find out which of these binary milestones
have been completed?
• Does the project have a feedback channel by which project members can
anonymously report problems to their own managers and upper managers?
• Does the project have a written plan for controlling changes to the software’s
specification?
• Does the project have a Change Control Board that has final authority to
accept or reject proposed changes?
• Are planning materials and status information for the project including effort
and schedule estimates, task assignments, and progress compared to the plan
thus far available to every team member?
• Is all source code placed under automated revision control?
• Does the project environment include the basic tools needed to complete the
project, including defect tracking software, source code control, and project
management software?
• Does the project plan articulate a list of current risks to the project? Has the
list been updated recently?
• Does the project have a project risk officer who is responsible for identifying
emerging risks to the project?
• If the project uses subcontractors, does it have a plan for managing each sub-
contract organization and a single person in charge of each one? (Give the
project full score if it does not use subcontractors.)
• Does the project team have all the technical expertise needed to complete the
project?
• Does the project team have expertise with the business environment in which
the software will operate?
Appendix 1
• Does the project have a technical leader capable of leading the project suc-
cessfully?
• Are there enough people to do all the work required?
• Does everyone work well together?
• Is each person committed to the project?
25. Success criteria. Answer yes if it can be applied to your project and no otherwise.
• User involvement
• Executive management support
• Clear statement of requirements
• Proper planning
• Realistic expectations
• Smaller project milestones
• Competent staff
• Ownership
• Clear vision and objectives
• Hard-working, focused staff

Appendix 2
A.2 Questions for the interview
1. Information about company:
• Company Name:
• Company Address:
2. Information about Interviewee:
• Name:
• E-mail:
• Phone:
• Job Title:
• What is your total IT experience?
3. Questions about mission of the company:
• Number of people in the company:
• Number of IT people in the company:
• Mission of the organization:
• Goals of the organization:
• What is the primary business function of your company?
• What type of products or services does your company provide?
4. Questions about projects: this questions is based on survey form (Appendix A.1).
5. Questions about Critical Success Factors (CSF) and Software Process Improve-
ment (SPI)
• Has your experience of SPI implementation been positive? Why/why not?
• What do you think about that SPI is an effective approach to improving the
quality of the software product?

Appendix 2
• Has your company attempted to improve SPI approach to software develop-
ment? How? Did you get any results? What were the results?
• How long has your process improvement program been in operation?
• How was the improvement program introduced?
• Why did your company embark on a process improvement program?
• Which of the process improvement models does your company use?
• Has your company been formally assessed against the process improvement
models? If yes, what were the results?
• Has your company been informally assessed against the process improve-
ment models? If yes, what were the results?
• Critical Success Factors (CFS) for IT projects and SPI discussion.
6. Answer the following questions for 2 projects - one of them should be successful
and one of them should be unsuccessful.
• Why was the project undertaken in the first place? Initial vision? Business
case?
• What external competitive or environmental factors were significant and why?
• What business metrics were supposed to go up or down as a result?
• What were the institutional dynamics regarding governance and funding?
• How do the project’s phases, main facts, critical events and infection points
unfold when laid out chronologically? What happened and in what sequence?
What is the factual storyboard?
• What would a trend line of the project’s momentum look like over time (+/-)?
• Evaluation of Success/Failure (time, cost, product use, learning, value)
• Lessons learned:
– common mistakes
– symptoms of success/failure

Appendix 2
– recommendations for the future
7. Additional information which interviewee wants to provide.