Embed Size (px)
Citation preview

Evaluating the Short- and Long-term Impacts of Didactic, Developmental, and Combined Approaches to
Kindergarten Teaching in Low- and High-SES Classrooms
by
Emiko Koyama
A thesis submitted in conformity with the requirements for the degree of Doctor of Philosophy
Department of Applied Psychology and Human Development University of Toronto
Ontario Institute for Studies in Education
© Copyright by Emiko Koyama 2015
ii
Evaluating the Short- and Long-term Impacts of Didactic,
Developmental, and Combined Approaches to Kindergarten
Teaching in Low- and High-SES Classrooms
Emiko Koyama
Doctor of Philosophy
Department of Applied Psychology and Human Development
University of Toronto
Ontario Institute for Studies in Education
2015
Abstract
The benefits of developmental vs. skills-based approaches to kindergarten have been debated, yet
the results of small-scale studies examining the effectiveness of high-quality programs remain
mixed. This dissertation examined the effectiveness of developmental, didactic, and combined
programs on children’s learning behaviors, reading, and math achievement from kindergarten to
Grade 5, with classroom SES as a moderator. To overcome methodological issues (e.g., lack of
control over pretreatment covariates and ignoring nested data structure) this dissertation utilized
multilevel modeling with a propensity score-based semi-parametric weighting method to remove
selection bias in the non-experimental data. The Early Childhood Longitudinal Study –
Kindergarten Cohort of 1998-1999 (ECLS-K) was used for analysis. The first question explored
the natural grouping of teachers’ classroom practice using confirmatory factor analysis and
cluster analysis. Analyses revealed four distinct groups of kindergarten programs, which differed
along the dimensions of developmental and didactic practices: developmental, didactic,
iii
combined(HI) and combined(LO) programs. The second question examined the school-, teacher-
and child-level characteristics associated with the four kindergarten programs. Notably, the
combined(HI) program teachers were more likely than the developmental program teachers to
endorse didactic practices in preschool and kindergarten. The third question explored the
interrelationships between kindergarten programs, time allocated to academic subjects, and
classroom SES. The results indicated that SES was associated with time allocation but not with
instructional approaches. Low SES classrooms spent more time on math, and high SES
classrooms spent more time on the arts. The combined(HI) programs spent the largest
proportion of time on academic subjects. The final question examined the effectiveness of the
kindergarten programs on children’s learning behaviors, reading and math outcomes from
kindergarten to Grade 5. Results showed a fairly consistent pattern in program effectiveness as a
function of SES. There were very few significant differences in effectiveness across the
programs in the high-SES classrooms. In the low SES group, interestingly, the didactic program
displayed positive sleeper effects that manifested up to Grade 5 in each of these
outcomes. Theoretical implications concerning the conceptualization of teaching practices and
practical implications of how SES affects kindergarten effectiveness are discussed. (342 words)

iv
Acknowledgments
Laudate Dominum!
I would like to express my most sincere gratitude to my thesis supervisor, Dr. Guanglei Hong,
for instilling in me the love for statistics, and for providing patient, caring, and careful
supervision throughout my Ph.D studies. My deepest gratitude goes to Dr Esther Geva. Without
her help, guidance, counsel, and provision, I would not have been able to finish my studies. I am
deeply grateful to her for taking me in as your own student. I thank Dr Michel Ferrari for his
continual support and encouragement from the beginning of my graduate studies. I thank Dr
Michal Perlman for her most helpful feedback on my dissertation work. I am grateful to Dr
Janette Pelletier for agreeing to be the back-up committee member. Special thanks to Dr Doug
Willms, who served as the external examiner for my final oral exam – I am most grateful for his
careful reading of my dissertation and for the excellent feedback and encouragement he
provided.
There are many friends that have helped me get through my dissertation process. I am most
grateful to Ljiljana Vuletic for reading over my many drafts, checking my references, and
keeping me motivated; Norman Himel for his statistical skills; Raghad Al-Khanati, Sae
Shigematsu, and Shamila Karunakaran, for their help in formatting tables. I am most grateful to
Grace Yee-Yue Luk who gave me great advice on the final presentation and kept me company
until the late hours before the final oral exam. Special thanks to Kyoko Kato, my very best friend
since elementary school, who came all the way from Ottawa to be with me on the day of my
defense. Many thanks to my former labmates Bing Yu, Yihua Hong, Marija Petaroudas, and
Natasha Jamal, for their friendship, company and encouragement. I would also like to thank the

v
students from Dr Geva’s lab, especially Dr Fataneh Farnia, Lucja Segal-Seiden, and Joyce Mak
for attending to my moc defense and giving me constructive feedback on my presentation.
I am most indebted to Fr Michael Eades for his prayers and admonitions that got me through the
toughest times, to Fr Martin Hilbert, Fr Dominic Borg, Fr Daniel Utrecht, Sr Therese of Zephyr
Carmel, and Pastor Paul Johansen for their tireless encouragement and continual prayers, and
many brothers and sisters from Knox Presbyterian Church and Holy Family Catholic Church
who prayed for me on the days leading up to my defense. I thank especially Marijka Kuzma,
Karen Williams, Carol Leeda Crawford, Chao Hu, Steven Burger and Margaret Ma (deceased)
for their prayers. Many thanks also to my dear housemates Norine Love, Heidi Love, and Mary-
Ann Stanic for their kindness, prayers, and encouragement.
Finally, I would like to thank my parents Akira and Fujino Koyama, for their patience,
encouragement and loving support. Thank you so much for giving me birth and raising me up,
and loving me so unconditionally. I am also thankful to my sister, Akiko Sakai, who always
made sure that I was staying healthy and well.
It is done! Deo Gratias!
vi
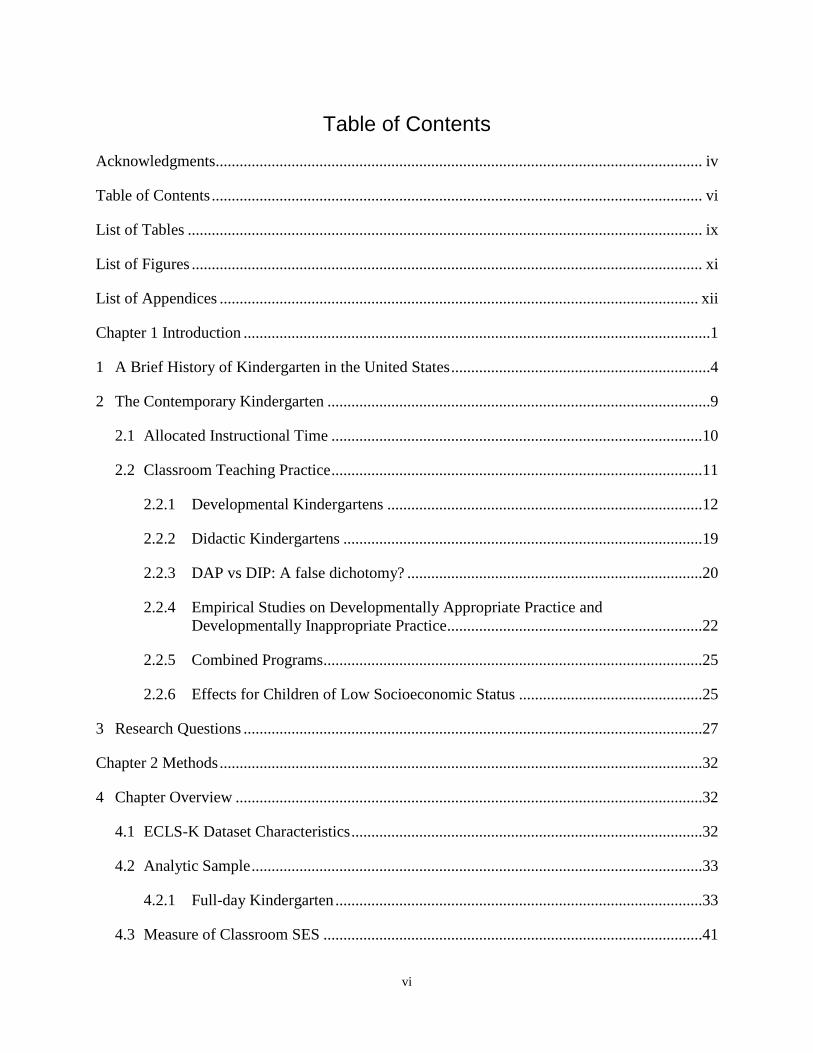
Table of Contents
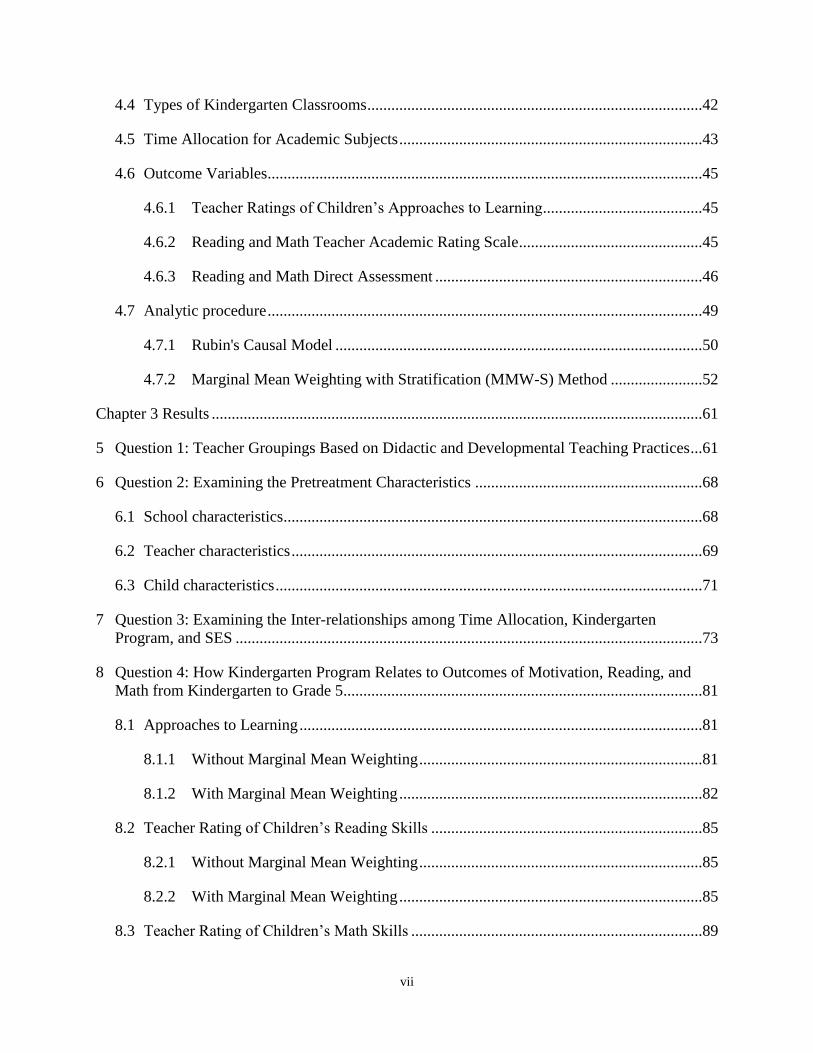
Acknowledgments.......................................................................................................................... iv
Table of Contents ........................................................................................................................... vi
List of Tables ................................................................................................................................. ix
List of Figures ................................................................................................................................ xi
List of Appendices ........................................................................................................................ xii
Chapter 1 Introduction .....................................................................................................................1
1 A Brief History of Kindergarten in the United States .................................................................4
2 The Contemporary Kindergarten ................................................................................................9
2.1 Allocated Instructional Time .............................................................................................10
2.2 Classroom Teaching Practice .............................................................................................11
2.2.1 Developmental Kindergartens ...............................................................................12
2.2.2 Didactic Kindergartens ..........................................................................................19
2.2.3 DAP vs DIP: A false dichotomy? ..........................................................................20
2.2.4 Empirical Studies on Developmentally Appropriate Practice and
Developmentally Inappropriate Practice................................................................22
2.2.5 Combined Programs...............................................................................................25
2.2.6 Effects for Children of Low Socioeconomic Status ..............................................25
3 Research Questions ...................................................................................................................27
Chapter 2 Methods .........................................................................................................................32
4 Chapter Overview .....................................................................................................................32
4.1 ECLS-K Dataset Characteristics ........................................................................................32
4.2 Analytic Sample .................................................................................................................33
4.2.1 Full-day Kindergarten ............................................................................................33
4.3 Measure of Classroom SES ...............................................................................................41
vii
4.4 Types of Kindergarten Classrooms ....................................................................................42
4.5 Time Allocation for Academic Subjects ............................................................................43
4.6 Outcome Variables.............................................................................................................45
4.6.1 Teacher Ratings of Children’s Approaches to Learning........................................45
4.6.2 Reading and Math Teacher Academic Rating Scale ..............................................45
4.6.3 Reading and Math Direct Assessment ...................................................................46
4.7 Analytic procedure .............................................................................................................49
4.7.1 Rubin's Causal Model ............................................................................................50
4.7.2 Marginal Mean Weighting with Stratification (MMW-S) Method .......................52
Chapter 3 Results ...........................................................................................................................61
5 Question 1: Teacher Groupings Based on Didactic and Developmental Teaching Practices ...61
6 Question 2: Examining the Pretreatment Characteristics .........................................................68
6.1 School characteristics.........................................................................................................68
6.2 Teacher characteristics .......................................................................................................69
6.3 Child characteristics ...........................................................................................................71
7 Question 3: Examining the Inter-relationships among Time Allocation, Kindergarten
Program, and SES .....................................................................................................................73
8 Question 4: How Kindergarten Program Relates to Outcomes of Motivation, Reading, and
Math from Kindergarten to Grade 5..........................................................................................81
8.1 Approaches to Learning .....................................................................................................81
8.1.1 Without Marginal Mean Weighting .......................................................................81
8.1.2 With Marginal Mean Weighting ............................................................................82
8.2 Teacher Rating of Children’s Reading Skills ....................................................................85
8.2.1 Without Marginal Mean Weighting .......................................................................85
8.2.2 With Marginal Mean Weighting ............................................................................85
8.3 Teacher Rating of Children’s Math Skills .........................................................................89
viii
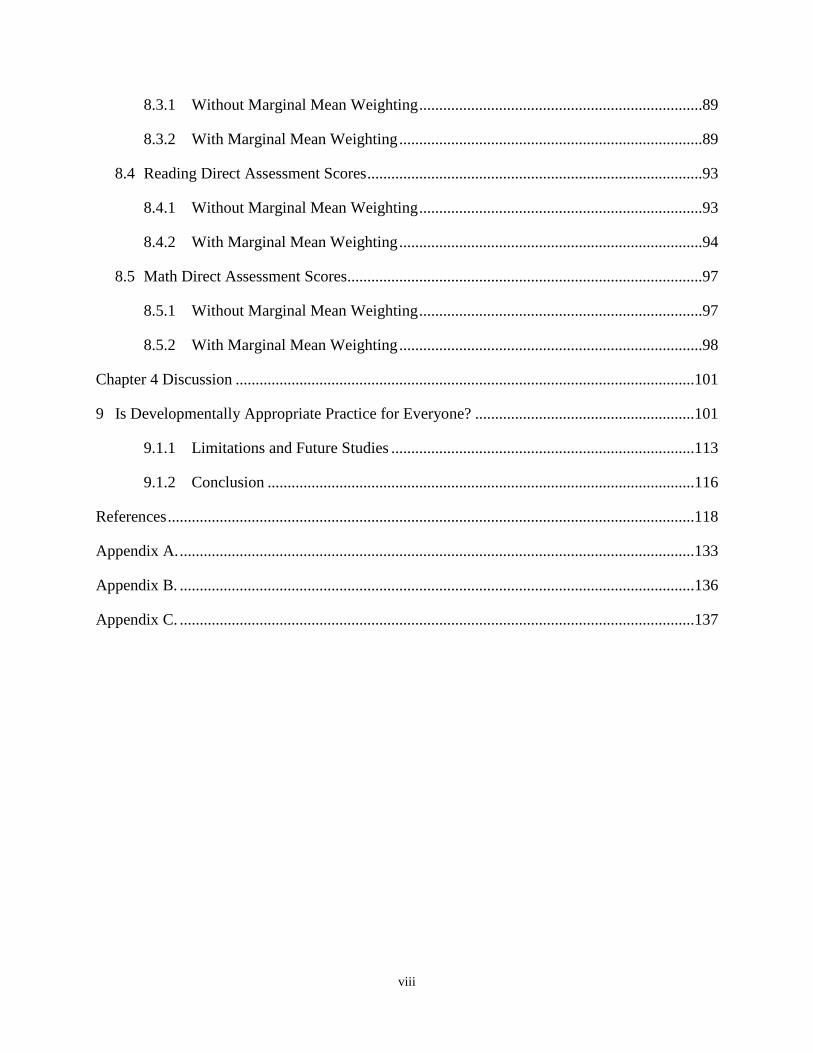
8.3.1 Without Marginal Mean Weighting .......................................................................89
8.3.2 With Marginal Mean Weighting ............................................................................89
8.4 Reading Direct Assessment Scores ....................................................................................93
8.4.1 Without Marginal Mean Weighting .......................................................................93
8.4.2 With Marginal Mean Weighting ............................................................................94
8.5 Math Direct Assessment Scores.........................................................................................97
8.5.1 Without Marginal Mean Weighting .......................................................................97
8.5.2 With Marginal Mean Weighting ............................................................................98
Chapter 4 Discussion ...................................................................................................................101
9 Is Developmentally Appropriate Practice for Everyone? .......................................................101
9.1.1 Limitations and Future Studies ............................................................................113
9.1.2 Conclusion ...........................................................................................................116
References ....................................................................................................................................118
Appendix A. .................................................................................................................................133
Appendix B. .................................................................................................................................136
Appendix C. .................................................................................................................................137
ix
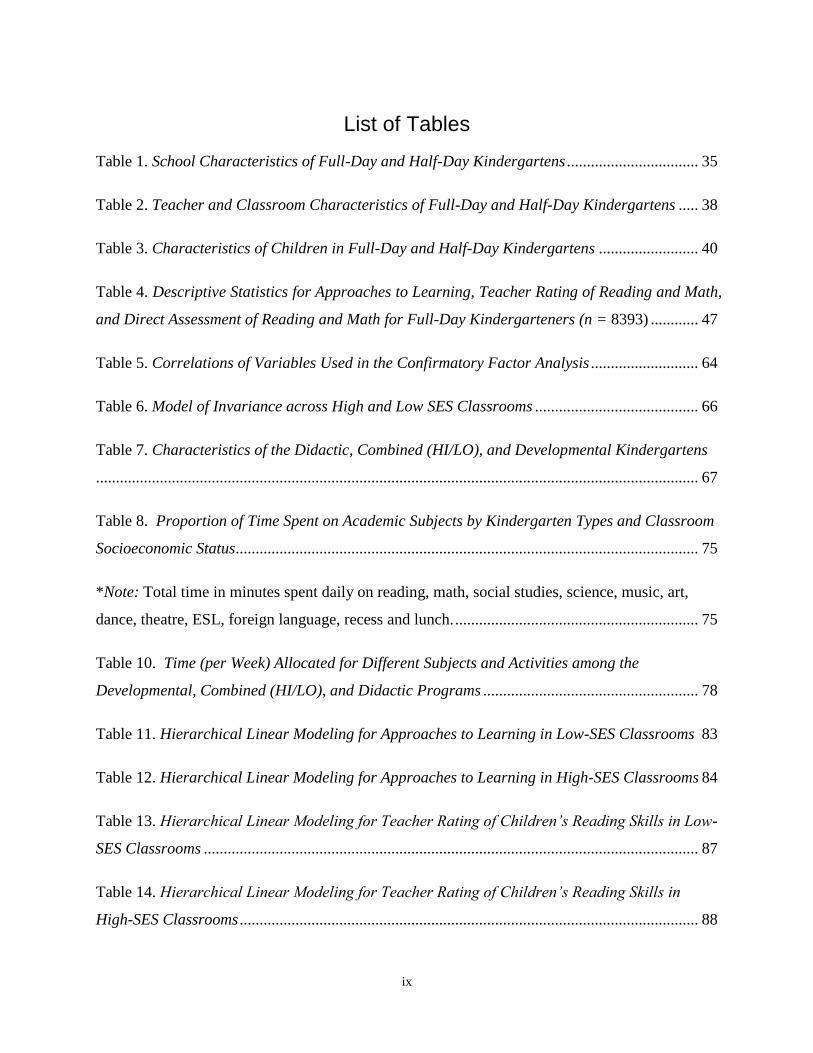
List of Tables
Table 1. School Characteristics of Full-Day and Half-Day Kindergartens ................................. 35
Table 2. Teacher and Classroom Characteristics of Full-Day and Half-Day Kindergartens ..... 38
Table 3. Characteristics of Children in Full-Day and Half-Day Kindergartens ......................... 40
Table 4. Descriptive Statistics for Approaches to Learning, Teacher Rating of Reading and Math,
and Direct Assessment of Reading and Math for Full-Day Kindergarteners (n = 8393) ............ 47
Table 5. Correlations of Variables Used in the Confirmatory Factor Analysis ........................... 64
Table 6. Model of Invariance across High and Low SES Classrooms ......................................... 66
Table 7. Characteristics of the Didactic, Combined (HI/LO), and Developmental Kindergartens
....................................................................................................................................................... 67
Table 8. Proportion of Time Spent on Academic Subjects by Kindergarten Types and Classroom
Socioeconomic Status.................................................................................................................... 75
*Note: Total time in minutes spent daily on reading, math, social studies, science, music, art,
dance, theatre, ESL, foreign language, recess and lunch. ............................................................. 75
Table 10. Time (per Week) Allocated for Different Subjects and Activities among the
Developmental, Combined (HI/LO), and Didactic Programs ...................................................... 78
Table 11. Hierarchical Linear Modeling for Approaches to Learning in Low-SES Classrooms 83
Table 12. Hierarchical Linear Modeling for Approaches to Learning in High-SES Classrooms 84
Table 13. Hierarchical Linear Modeling for Teacher Rating of Children’s Reading Skills in Low-
SES Classrooms ............................................................................................................................ 87
Table 14. Hierarchical Linear Modeling for Teacher Rating of Children’s Reading Skills in
High-SES Classrooms ................................................................................................................... 88
x
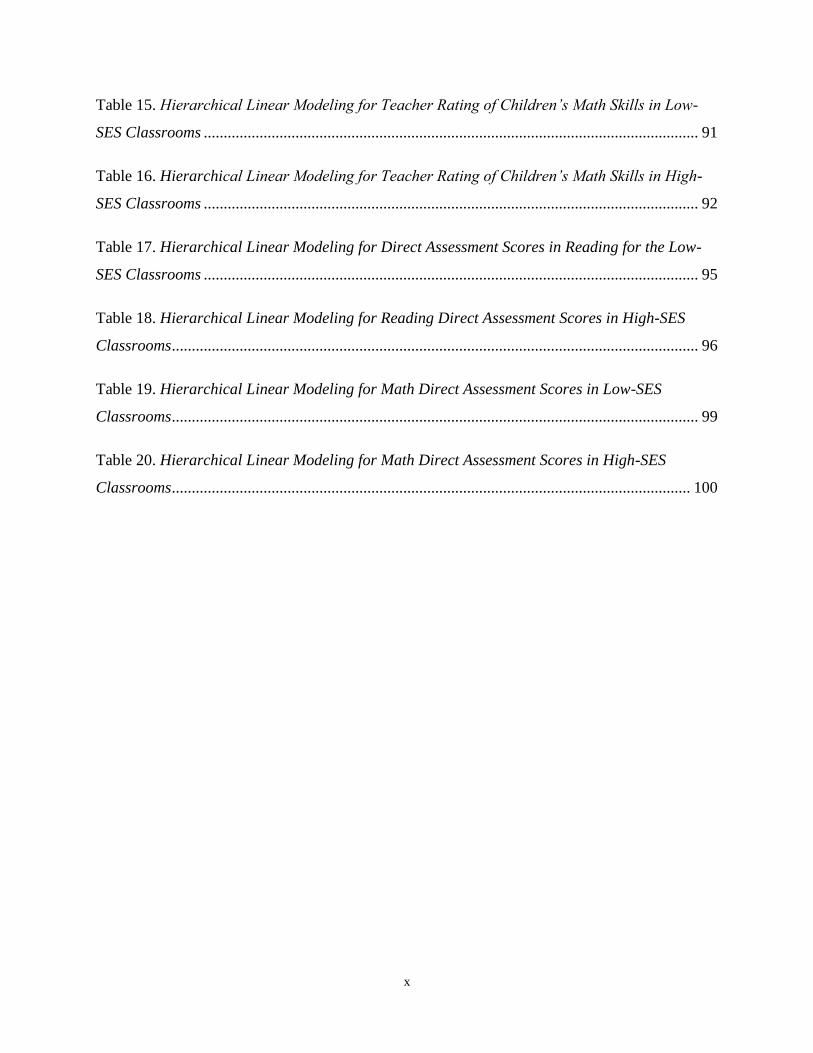
Table 15. Hierarchical Linear Modeling for Teacher Rating of Children’s Math Skills in Low-
SES Classrooms ............................................................................................................................ 91
Table 16. Hierarchical Linear Modeling for Teacher Rating of Children’s Math Skills in High-
SES Classrooms ............................................................................................................................ 92
Table 17. Hierarchical Linear Modeling for Direct Assessment Scores in Reading for the Low-
SES Classrooms ............................................................................................................................ 95
Table 18. Hierarchical Linear Modeling for Reading Direct Assessment Scores in High-SES
Classrooms .................................................................................................................................... 96
Table 19. Hierarchical Linear Modeling for Math Direct Assessment Scores in Low-SES
Classrooms .................................................................................................................................... 99
Table 20. Hierarchical Linear Modeling for Math Direct Assessment Scores in High-SES
Classrooms .................................................................................................................................. 100
xi
List of Figures
Figure 1.Confirmatory Factor Analysis of Didactic and Developmental Practices...................... 65
Figure 2. The Distribution of the Four Kindergarten Types with Reference to Developmental and
Didactic Practices…………………………………………………………………………..…….68
Figure 3. Line Graph with Error Bars for Approaches to Learning from Kindergarten to Grade
5…………………………………………………………………………………………………137
Figure 4. Line Graph with Error Bars for Teacher Ratings of Reading from Kindergarten to
Grade 5………………………………………………………………………………………….138
Figure 5. Line Graph with Error Bars for Teacher Ratings of Mathfrom Kindergarten to Grade
5…………………………………………………………………………..…………………….139
Figure 6. Line Graph with Error Bars for Reading Theta Scores from Kindergarten to Grade
5…………………………………………………………………………………………..…….140
Figure 7. Line Graph with Error Bars for Math Theta Scores from Kindergarten to Grade
5……………………………………………...………………………………………………….141
xii
List of Appendices
Appendix A. List of Potential Pretreatment Covariates ………….………………………….133
Appendix B. Marginal Mean Weights for Teachers in Low- and High-SES Groups by
Kindergarten Type …………………………………………………………………………...136
Appendix C. Graphs for the MMW-S Results from Question 4 ...….……………….………137
1
Chapter 1 Introduction
Over the past several decades, kindergarten has gone through a significant transformation (Miller
& Almon, 2009). The original kindergarten was built on the foundation of a romantic view of
childhood1, which viewed the ideal child as one growing “in the order of nature” (Rousseau,
1762/1979, p. 86), under the care and protection of the educator, without excessive interference
from sociopolitical arenas or economic pressure. Building on Rousseau’s philosophy, Freidrich
Froebel founded the first kindergarten in 1837. He offered the mission statement of his
institution as follows:
As in a garden under God’s favor, and by the care of a skilled, intelligent gardener,
growing plants are cultivated in accordance with Nature’s laws, so here in our
childgarten, our kindergarten, shall the noblest of all growing things, men (that is
children, germs and shoots of humanity), be cultivated in the accordance with the laws of
their own being, of God and Nature. (Downs, 1978, p. 42)
For many children, kindergarten was the first educational institution they encountered away from
home. In the first kindergarten, as well as in subsequent early childhood institutions that
followed the same philosophy, great care was taken by the educators to meet the children where
they are and prepare them for the demands of formal schooling, physically, socially,
psychologically and academically (Copple & Bredekamp, 2009). In recent years, the educational
philosophy that emphasizes children’s development as a basis for teachers’ decision making on
1 The agricultural metaphor of human development and spirituality has been utilized since the Biblical times, yet it
was the Renaissance scholars such as Erasmus and Comenius that systematized these thoughts and utilized them in
their educational treatises.
2
the appropriate environment, instruction, curriculum and assessment has come to be collectively
known as Developmentally Appropriate Practices (DAP). These practices were based on the
constructivist and cognitive learning theories represented by theorists such as Piaget and
Vygotsky. It emphasized child-initiated learning activities and experiential learning activities
that activate the senses, such as free play, drama, arts, music, dance and sports were
recommended. The primary role of the educators was to protect the children from danger and
facilitate and guide children’s exploration endeavors (Howes & Olenick, 1986; McCartney,
1984).
In recent years, however, the nature and purpose of kindergarten is said to have shifted to adopt a
more academic focus (Beatty, 1995; Dombkowski, 2001). With the growing number of children
attending preschools, kindergarten is no longer the first educational setting that children
encounter away from home. There are growing demands from the global economy and
educational legislation to meet national standards, prepare children for high-stakes testing, and
adopt a more academic emphasis at the kindergarten level (Bassok, 2012; Gullo & Hughes,
2011; Kagan & Kauerz, 2006). To better prepare young children for high-stakes testing in the
middle elementary grades and beyond, those that advocate for more academics-based
kindergartens maintain that children should spend more time being taught academic subjects.
Behavioral approaches such as academic skills building, worksheets, and drill activities are often
adopted to achieve this goal. To maximize time on academics, time for play was frequently
reduced or eliminated. As a result, the proportion of traditional kindergartens with abundant time
allocated to play, music, art, dance, physical education and recess have significantly decreased
(Miller & Almon, 2009). This transformation from a highly playful to a highly academic
kindergarten program is described as the “crisis in kindergarten” (Miller & Almon, 2009).
3
Both of these approaches, play-based and academics-based, have their perceived benefits and
concerns. One of the major strengths of the academics-based programs is that they tend to offer
clearly defined and measurable educational goals (Kessler & Swadener, 1992; Stone, 1995). The
increased time spent teaching academic subjects, especially on reading and language arts, may
also provide children with an increased opportunity to learn the academic content. On the other
hand, some of the major concerns expressed with regard to academics-based kindergarten
programs are that they tend to narrowly focus on academic subjects such as reading readiness
and math, sometimes together with social studies and sciences, but at the expense of other
enrichment activities such as arts, music, physical education and free play at recess. It has been
suggested that excessive time allocated to academic subjects may have adverse effects on student
outcomes such as motivation and perseverance (Carroll, 1989). Additionally, critics of the
academics-based kindergarten maintain that the didactic, behaviorist approaches may negatively
impact children’s curiosity, creativity, and motivation. A play-based, developmentally-oriented,
child-initiated program, on the other hand, may offer classroom environments that are more
holistic, self-motivating, and developmentally appropriate, and these are likely to be more
flexible in accommodating children at various maturity levels and needs. Nevertheless, it is often
difficult to assess the educational effectiveness of the spontaneous child-directed activities. In
addition, teachers generally find it difficult to implement developmentally appropriate practices
in their classrooms.
Empirical studies have shown that kindergarten teachers tend to subscribe to either one of the
dichotomized philosophies: academics-based or play-based (Copple & Bredekamp, 2009;
Gallant, 2009; Pruitt, 2011). Nevertheless, it is at least theoretically conceivable that there could
be a third group of teachers who subscribe to neither one of these two extreme philosophies, but
4
instead, try to strike a balance between both the academics and play, didactic and child-initiated
practices, and strive to integrate play-based, developmentally appropriate approaches into the
teaching of academic content. Some researchers have argued that kindergarten should adopt a
balanced model (Ray & Smith, 2010). They believe a more “balanced” approach may be more
appropriate to address both the unchanging developmental needs of the children and the
changing demands of the social, political, and economic forces (Gullo & Hughes, 2011;
Bredekamp, 1987).
An empirical question that arises is to what extent the different approaches to kindergarten
education actually impact the short- and long-term academic and motivational outcomes of the
developing child. The available research for the long-term effects of developmentally
appropriate, didactic, and the balanced kindergarten programs is limited, and the conclusions are
often extrapolated from studies on the preschool children ages 3 to 4 (Bryant, Clifford, &
Peisner, 1991). Moreover, the available research evidence suffers from methodological issues
including small sample sizes, lack of pretest scores, and not using appropriate statistical methods
for analyzing nested data. The primary objective of my dissertation, therefore, is to fill this gap
in the early childhood education literature by examining how the different program emphases
affect children’s reading, math, and motivational (approaches to learning) outcomes from the end
of kindergarten to Grade 5.
1 A Brief History of Kindergarten in the United States
During the beginning stages of the industrial revolution in the mid-18th century, Jean Jacques
Rousseau wrote his educational treatise, Emile, ou De L’education (1762/1979). Rousseau
viewed childhood as a brief period characterized by innocence. He maintained that early
5
childhood education should be guided by the natural maturation process. Rousseau
revolutionized the educational process by putting the child, and not the teacher, at the center of
education. The educators’ role was to support the children’s natural development and protect
children from harm, both from nature and from the corruptible influence of the society.
Building on Rousseau’s philosophy, and that of Heinrich Pestalozzi, Friedrich Froebel created
his kindergarten. Froebel explicitly rejected the rigidity of the teacher-directed, didactic
instruction, following Rousseau’s ideals (Fromberg, 2006). Instead of directly teaching the
children the basic academic concepts, he insisted on the value of free play and learning through
exploration. To this end, the “educational materials” that Froebel developed were presented in
the form of games and fun activities that children can engage in to discover various elementary
principles for themselves. One of the best known innovations of Froebel’s kindergarten was the
use of a set of toys called “gifts,” which consisted mostly of different geometric shapes, such as
balls, wooden blocks, tiles, and rings, and materials with varying attributes such as color, size,
and flexibility. These “gifts” were presented to the children in a sequential manner, along with
what he called “occupations,” or activities that the children engaged in to discover basic
mathematical concepts (Bryant & Clifford, 1992). Froebel’s gifts and occupations had a great
influence on education worldwide. Frank Lloyd Wright, a prominent architect in the U.S., for
example, was greatly inspired by these Froebelian “gifts” in his work (Rubin, 1989). Froebelian
gifts remain a prominent feature in the contemporary Japanese and Korean kindergartens
(Jeynes, 2006).
When kindergarten was introduced to North America, its original proponents strictly subscribed
to Froebelian approaches to early childhood education. In 1856, Margarethe Meyer Schurz, who
was trained under Froebel, founded the first German-speaking kindergarten in the U.S. In 1860,
6
Elizabeth Peabody followed suit and founded the first English speaking kindergarten. By the
late 19th century and during the progressive era, however, modifications started to be made to
the strict Froebelian methods of kindergarten education, incorporating the ideas of social
reformers and psychologists such as John Dewey and G. Stanley Hall (Finkelstein, 1988). For
example, Dewey’s idea of kindergarten incorporated the value of independence and self-
sufficiency and took a pragmatic approach including playing with real-life objects and situations
such as washing clothes and cooking their own lunches in place of Froebelian abstract play
(Dewey, 1915; Weber, 1984).
Dewey (1915) writes:
The imaginative play of the child’s mind comes through the cluster of suggestions,
reminiscences, and anticipations that gather about the things he uses […] The simple
cooking, dishwashing, dusting, etc., which children do are no more prosaic or utilitarian
to them than would be, say, the game of the Five Knights. To the children these
occupations are surcharged with a sense of the mysterious values that attach to whatever
their elders are concerned with. The materials, then, must be as “real” as direct and
straightforward, as opportunity permits. (pp. 118-119)
G. Stanley Hall emphasized the importance of building a kindergarten program based on the
understanding of the stages of child development. He also utilized methodologies from
psychological research such as questionnaires and child study to inform educational decision-
making regarding the kindergarten programs and instruction (Weber, 1984).
Before and during the 1870s, privately-funded kindergartens were predominant, mainly serving
children of immigrants and the inner-city poor. As such, kindergartens were perceived as an
7
institution for promoting social welfare (Dombkowski, 2001). In 1873, however, Susan Blow
started the first publicly-funded kindergarten in St. Louis, Missouri. After this, kindergartens
slowly started to become integrated into the public school system. At the same time, the pressure
to conform to didactic instruction increased (Cuban, 1992). Preparing the children for a
successful transition into formal schooling became one of kindergarten’s main objectives
(Beatty, 2011). As the push for kindergartens to be fully institutionalized into the public
elementary school system continued during the late 19th and early 20th centuries, tensions
started to grow among educational professionals between those who advocated the child-initiated
and didactic approaches to kindergarten (Dombkowski, 2001). External economic and
sociopolitical factors such as the Great Depression in the 1930’s and the cold war in the 1950’s
accelerated the push toward academization to win the global competition (Dombkowski, 2001).
In the 1960s, promising results from well-designed preschool studies such as the Abecedarian
(Barnett & Masse, 2007) and the High/Scope Perry School programs (Schweinhart et al., 2005)
started to draw the public’s attention (Barnett & Masse, 2007) and bring hope that early
childhood education could greatly enhance later academic achievement and narrow the
achievement gaps between the advantaged and the disadvantaged segments of society. The
popular media became the leading force for promoting the academic vision of kindergarten, and
the state policy and professional organizations followed suit (Russell, 2011). Under the
legislation of President Johnson in the mid-1960s, the Head Start program was launched to assist
children from low-income families to overcome their initial educational disadvantages (U. S.
Department of Health and Human Services, Administration for Children and Families, 2010).
In the 1990s and the beginning of the 21st century, calls for universal public preschools were
being made. As a result, kindergarten was no longer considered the first step away from home,
8
but a transitional year between preschool and elementary school. It was no longer a preparation
year before formal academic schooling, but started to be considered “the new first grade” itself
(Tyre, 2006).
The education reform of the late 20th century mainly focused on increasing students’ opportunity
to learn through the provision of additional time spent on teaching academic subjects. At the
beginning stages of this reform, educational legislators compiled a report entitled A Nation at
Risk (National Commission on Excellence in Education, 1983), which called for additional time
to be spent in schools, with longer school days and extended school years, and promoted an
increased focus on core subject matters such as English, mathematics, science, and social
studies.
At the kindergarten level, this resulted in an increase in scheduled time through the provision of
full-day kindergartens (Votruba-Drzal, Li-Grining, & Maldonado-Carreño, 2008), and an
increase in instructional time allocated to academic subjects. Correlating with the growing
number of women participating in the workforce, the proportion of young children attending full-
day kindergartens increased steadily from about 10% in the 1960s (Bruno & Adams, 1994), to
about 15% in the 1970s (Elicker & Mathur, 1997), 33% in the late 1980s (Bruno & Adams,
1994), and by the end of 1990s, the number increased to 55% (Walston & West, 2004). The
proportion of full-day kindergartens have continued to grow until the beginning of the 21st
century, in which this figure increased to roughly 63% (Ackerman, Barnett, & Robin, 2005;
Kauerz, 2005). As of 2012, eleven states and the District of Columbia offer mandatory full-day
kindergartens (Workman, 2013).
9
The tendency toward a greater academic focus was further intensified by the passage of the No
Child Left Behind Act (NCLB) in 2001, which stipulated high expectations for all students, as
well as sanctions for schools that failed to meet the Adequate Yearly Progress (AYP) based on
standardized test results. Although kindergarten is not directly the target of NCLB-mandated
high-stakes standardized testing, scholars suggest that the kindergarten teachers are nevertheless
indirectly influenced into preparing the children academically for testing in Grades 3 (Bryant et
al., 1991). A significant increase in the time spent on the core academic subjects, especially in
early literacy/reading and language arts, was observed in kindergarten and the elementary school
grades, which is attributed to the NCLB (Bassok & Rorem, 2013; Morton & Dalton,
2007). Some of the children that are more likely to be affected by the increased academic
emphasis are children attending public kindergartens, especially with a high proportion of
children at risk for academic failure, such as immigrants, children with disabilities, and children
from low socioeconomic backgrounds (Bassok & Rorem, 2013).
2 The Contemporary Kindergarten
While the contemporary educational policy generally endorses the academic emphasis in
kindergarten, teacher education institutions and professional organizations for early childhood
education continue to advocate a play-based, developmental approach to kindergarten. The effect
of such a debate have manifested itself in “what is being taught” and “how it is being taught” in
early childhood settings (Bryant, Clifford, & Peisner, 1991; Hatch, 2012). Although curriculum
and pedagogy have been considered separate areas of inquiry in the educational literature, these
two areas have often been confounded in the literature of early childhood education (Kagan &
Kauerz, 2006). I will examine this issue further, by investigating the concept of allocated
instructional time and classroom teaching practice.
10
2.1 Allocated Instructional Time
The issue of time allocation has been examined in various levels in educational research. The
most encompassing unit of instructional time during an academic year, sometimes referred to as
scheduled time, is the total time the students spend in school (Karweit & Slavin, 1981). In
general, the State education agencies determine the length of the school year, whereas the local
school districts are responsible for determining the length of the school day (Karweit & Slavin,
1981). The provision of full-day kindergartens was an attempt to extend the scheduled time with
the assumption that additional scheduled school time would increase students’ learning
outcomes.
Within the scheduled time, school principals and classroom teachers are generally responsible
for allocating instructional time within the school day (Walberg, Niemiec, & Frederick,
1994). Allocated instructional time, sometimes referred to as opportunity to learn (Carroll, 1963,
1989), is the time spent on instruction and includes organizational and housekeeping activities
such as transitional and waiting time (Berliner, 1990). The amount of time the students are
actually focusing on the lesson is called engaged time, or time on task (Scheerens & Hendriks,
2014). Allocated instructional time is the upper bound of the students’ engaged time (Berliner,
1990). Engaged time excludes the time students spend being inattentive to the learning tasks,
such as daydreaming, going outside of the classroom (such as running errands or going to the
washroom during class time), and socializing (Scheerens & Hendriks, 2014). Finally, academic
learning time refers to the portion of engaged time the students spend working on tasks that are
neither too easy nor too difficult, at the appropriate difficulty level while achieving high levels of
success (Scheerens & Hendriks, 2014). Although the more fine-grained time indicators such as
academic learning time and engaged time have generally been considered better predictors of
11
academic achievement (Berliner, 1990; Scheerens & Hendriks, 2014), policymakers have
generally been interested in the effects of allocated instructional time and scheduled time, as
these are easier to measure in large-scale assessments and can be directly manipulated by
educational legislators (Berliner, 1990; Karweit & Slavin, 1981).
Given the research evidence that suggests that giving sufficient time is especially important for
weaker students (Scheerens & Hendriks, 2014), it is conceivable that the pressure to spend more
time on academic subjects would be higher for teachers and schools with high proportions of
disadvantaged students. This increased focus on academic subjects, however, may inevitably
come at the expense of opportunities to develop skills such as creativity, problem-solving, social
skills, oral language and communication skills, self-initiative, self-control, and motivation
through enrichment activities including arts, music, physical education, dance, and free play
(Dunn & Kontos, 1997). All of these skills are necessary and important, not only for the child’s
future academic and career success, but for the child’s wellbeing and personal development
(Copple & Bredekamp, 2009). If disadvantaged students are systematically being excluded from
these learning opportunities, this could also constitute a significant equity concern that needs to
be addressed (Winfield, 1991), over and above opportunity to learn.
2.2 Classroom Teaching Practice
Criticisms regarding academic kindergartens have not only been directed toward increased time
spent on academic subjects, but also toward the classroom practices that are considered less age
appropriate for kindergarten children. For example, the major concern for the National
Association for the Education of Young Children (NAEYC), the largest early childhood
education advocacy group in the world, was the “trend toward increased emphasis on formal
instruction in academic skills” (Bredekamp, 1987, p.1). These educators were concerned that the
12
teaching practices in kindergarten and other early childhood institutions were becoming
increasingly didactic with lack of consideration to child development. Since the first adoption of
the framework in 1986, the NAEYC has continued to endorse what they called the
developmentally appropriate practice (DAP) for children from birth to age 8 (Bredekamp, 1987;
Bredekamp & Copple, 1997; Copple & Bredekamp, 2009). The original framework presented in
the first two editions of the book Developmentally Appropriate Practice in Early Childhood
Programs Serving Children from Birth through Age 8 provided a stark contrast between what
they regarded as developmentally “appropriate” and developmentally “inappropriate” practices
(Bredekamp, 1987; Bredekamp & Copple, 1997). In the third edition of the book, the term
developmentally “inappropriate” practice was replaced with the term “in contrast” practice
(Copple & Bredekamp, 2009). To avoid the value judgment associated with such terms, the
more neutral terms, “developmental” and “didactic” practices will be used to describe the
“developmentally appropriate” and “developmentally inappropriate” or “in contrast” practices,
respectively, while using DAP and DIP when discussing the NAEYC’s theory and framework.
The characteristics and theoretical underpinnings of each of these practices, as well as the
possibility of a third, balanced approach will be discussed in the following sections.
2.2.1 Developmental Kindergartens
According to the NAEYC, developmentally appropriate practice is defined as the “ways of
teaching that engage children’s interest and adapt for their age, experience, and ability to help
them meet challenging and achievable learning goals.” (Copple & Bredekamp, 2009, p. 70) Its
recommended practices heavily rely on developmental theories, especially those of Piaget,
Erikson, and Vygotsky (Bredekamp & Rosegrant, 1992; Hatch, 2012). The guidelines
recommend that the teaching materials and instructional methods be examined for their age
13
appropriateness, individual appropriateness, and cultural appropriateness. Age appropriateness is
based on the premise that there are “universal, predictable sequences of growth and change that
occur in children during the first 9 years of life” (Bredekamp, 1987, p. 8). The idea is closely
linked to developmental stage theories represented by those of Piaget and Erikson. These
universal and predictable changes occur in all domains of development, including the physical,
cognitive, emotional and social domains, and provide an overarching framework for educators to
consider the appropriateness of their lesson plans and practices.
Despite these universal sequences and stages, it is acknowledged that there is a great amount of
variations in the timing, trajectories, and patterns of development across domains. Each child is
also unique with different interests, preferences, personalities, and learning styles. While the
original 1986 guideline emphasized the age appropriateness of the teaching practices, the 1996
revision called for greater attention to the children’s individual differences within the universal
stages. It was suggested that, to support the development and learning of all the children,
teachers should take into account all that they know about each child, not just his or her stage of
development, but his or her family history, culture, and social background as well as the
individual differences such as temperament and likes and dislikes (Bredekamp & Copple, 1997).
In the original guideline, cultural appropriateness was considered part of individual
appropriateness. In the 2007 revision, however, cultural appropriateness was given its own
recognition. As the U.S. population becomes increasingly more diverse socioeconomically,
ethnically, and linguistically, teachers are facing the need to understand the variations in
sociocultural values, expectations, and experiences that exist in the classrooms. For this reason,
Vygotsky’s socio-cultural theory has become more important to the conceptualization of
developmentally appropriate practices. The next section will review how the developmental
14
theories of Piaget, Erikson, and Vygotsky contributed to the conceptualization of
developmentally appropriate practices, with a special focus on kindergarten children’s
development.
2.2.1.1 Piaget
Piaget started his career as a biologist but later spent 30 years conducting research in child
development at the faculty of science at Geneva, and was the director of the Institut Jean-
Jacques Rousseau, a pedagogical institute in Geneva with a vision of transforming educational
theory and practice into a science (Lonergan, 1988), and its associated lab school, Maison de
Petits. His overarching theoretical framework is referred to as genetic epistemology. The goal of
genetic epistemology was to examine how biological developmental processes relate to the
development of knowledge structures. Piaget’s contributions to the field of developmental
psychology and education are extensive, ranging from research in language, mathematics, moral
reasoning and judgment, and emotional development. The neo-Piagetian scholars have
expanded on Piaget’s original work (Case, 1998; Ferrari & Vuletic, 2010; Fischer, 1990), and
applied his theoretical framework to such areas as mathematics (Kamii, 1994) and early literacy
development (Ferreiro & Teberosky, 1982). Piaget also had great insight into the role of
symbolic and make-believe play in children’s cognitive development. Yet, his major theoretical
contributions to the framework of developmentally appropriate practice relate to stage theory and
to the mechanisms of cognitive development.
Piaget proposed that the human cognitive development progresses through four universal stages:
the sensorimotor, preoperational, concrete operational, and formal operational
stages. Kindergarten children will most likely be in the second, preoperational stage of
development, which lasts from approximately 2 to 7 years of age. During this period, children
15
grow rapidly physically, socially, and cognitively. Their physical growth and refined motor
skills enable them to explore their environment in new ways. Through the use of symbols and
language, children’s cognitive capacity is also greatly facilitated. In this stage, children start to
engage in symbolic play, where one object (e.g., a stone) could represent something else (e.g.,
food). Nevertheless, the preoperational children’s ability to communicate is still limited. One
characteristic of this stage is the children’s use of egocentric speech, or speech whose purpose is
not to communicate ideas to others. While various scholars have attributed different functions to
egocentric speech, Piaget viewed it primarily as evidence of the children’s self-centeredness and
immature social communication skills. In addition to the children’s language ability, their
cognitive capacities are also limited and their thinking is often considered self-centered and
illogical. For example, children in the preoperational stage lack understanding of the principle of
conservation, which is the knowledge that a certain quantity is preserved despite its arrangements
or physical appearance. A preoperational child, when presented with two balls of clay of the
same size, is capable of answering correctly that the two balls are of the same size. Nevertheless,
when the experimenter stretches out one of the balls out into an oblong shape, the child would
say that the oblong-shaped clay is larger than the ball-shaped clay. According to Piaget,
development precedes learning. Due to the preoperational children’s limited cognitive abilities,
their learning capacities are also capped.
Piaget theorized that cognitive development occurs as a result of children actively constructing
their own knowledge through interaction with the environment. According to Piaget, learning
and development occur through two distinctive cognitive processes: assimilation and
accommodation. Assimilation occurs when an activity proceeds from the child’s own pre-
existing schema of operations and new information is processed to fit the child’s pre-existing
16
cognitive schema. On the other hand, accommodation occurs when the pre-existing cognitive
scheme is modified. This happens when the existing cognitive schema does not work, and needs
to be adjusted to fit the new information (Piaget, 1973). Through trial-and-error, active
exploration, and repeated practice initiated by the children, they are able to refine their cognitive
schemas. Activities such as writing with inventive spelling may be encouraged in classrooms to
facilitate children’s schema development and knowledge of phonics and letter-sound
correspondence (Copple & Bredekamp, 2009).
Piaget’s theory contributed to the idea of developmentally appropriate practice in multiple ways.
Firstly, it contributed to the acknowledgement that children are active learners and that children
learn through interacting with their environment. In this framework, teachers are expected to
facilitate children’s learning mostly by providing a rich and stimulating environment, rather than
providing the information that the children are supposed to learn. Manipulatives and other real-
life, hands-on experience may help children to develop their cognitive schema. Secondly, the
developmental stages and universal developmental trajectories in each domain, although highly
criticized by modern scholars (Flavell, 1982; Smith, 2002; Walsh, 1991), provide a broad
framework for lesson planning and setting realistic expectations.
2.2.1.2 Erikson
Similar to Piaget’s cognitive stage theory, Erikson proposed a psychosocial stage theory for
personality development (Erikson, 1963). At each stage of Erikson’s psychosocial development,
a person is confronted with a psychosocial crisis which manifests itself as a conflict between a
person’s biological or psychological needs and the needs of the society. When these conflicting
needs between self and society are successfully negotiated, the person emerges from the stage
17
acquiring what Erikson calls a virtue. According to Erikson, each stage builds on the success of
previous stages, although a success of one stage is not required to advance to the next stage.
Erikson’s psychosocial development occurs in eight stages, which covers the whole lifespan
(Erikson, 1963). Most kindergarteners and elementary school children will be proceeding
through stage 3 of Erikson’s psychosocial stages. In stage 3, children ages 3 to 5 are confronted
with the conflict between initiative versus guilt. Building on the previous stages of the conflicts
between basic trust and mistrust (stage 1 - first year of life) and autonomy versus shame and
doubt (stage 2; 2nd and 3rd year of life), children in the third stage try to take initiative, building
on the autonomy, or “the quality of undertaking, planning, and attacking a task for the sake of
being active and on the move” (Erikson, 1963, p. 233). Children at this stage are generally very
eager to try new skills and reach new goals, and may try to act on every impulse. However, the
environment and other individuals may provide restrictions to the activities the children can
do. Therefore, the challenge for children at this stage is to maintain the zeal for activity while
understanding the limitations that sometimes they cannot get what they want. When children
successfully master this stage, they will acquire the virtue of purpose.
Erikson and Piaget’s theories both point to the importance of giving children the initiative in
their learning experience. Developmentally appropriate practice therefore recommends that
kindergarten teachers allow children to take initiative in their own learning and choose their own
learning materials such as their own books to read.
2.2.1.3 Vygotsky
Finally, Vygotsky’s theory helped educators recognize the importance of social interaction and
the mediating role of culture and society for the development of higher order thinking
18
skills. Vygotsky was a contemporary of Piaget. Piaget and Vygotsky were interested in similar
issues regarding cognitive development, although their theoretical viewpoints were distinct. For
Piaget, “learning is subordinated to development and not vice-versa” (Piaget, 1964, p. 17). In
other words, Piaget believed that development precedes learning and provides the cognitive
schema necessary for learning to occur. Vygotsky, on the other hand, believed that learning
leads to development (Hatch, 2012). In addition, while Piaget sought to examine the biological
correlates of cognitive development, Vygotsky sought to investigate the social origins of higher
psychological processes (sociogenesis). Vygotsky maintained that social interaction is
imperative to cognitive development. Vygotsky believed, following the views of psychologist
Pierre Janet, that language originally developed as a means of communicating with others and
only later became a device directed to oneself (Vygotsky, 1978). In the process of language
acquisition, therefore, the child initially develops social speech. Around ages 3 to 7, the child
begins to use egocentric speech -- speech that is said out loud but not directed toward others. For
Vygotsky, egocentric speech was not an evidence of immature social skills as Piaget considered,
but a process of internalizing external speech. Gradually, according to Vygotsky, this egocentric
speech becomes internalized, and becomes private, inner speech.
More generally, Vygotsky (1978) maintained that
Every function in the child’s development appears twice: first on the social level, and
later, on the individual level; first between people (interpsychological) and then inside the
child (intrapsychological). This applies equally to voluntary attention, to logical
memory, and to the formation of concepts. All the higher functions originate as actual
relationships between individuals. (p. 57)
19
Vygotsky, who worked as a school teacher himself before embarking on his research career,
applied this formulation to educational settings, which he called the zone of proximal
development (ZPD). Zone of proximal development refers to “the distance between the actual
developmental level as determined by independent problem solving and the level of potential
development as determined through problem solving under adult guidance, or in collaboration
with more capable peers” (Vygotsky, 1978, p. 86). This level of potential development is
considered the ideal level at which the student should be instructed. The DAP principle of
“meeting children where they are” and providing “challenging, yet achievable” goals with
sufficient support to facilitate development and learning can be said to be derived from
Vygotsky’s theory of zone of proximal development (ZPD).
Another practical application of Vygotsky’s theory for developmentally appropriate practice is to
be attentive to the diverse cultural values that exist in the classrooms and to the cultural context
in which instruction takes place. As the U.S. educational context becomes more diverse and the
developmentally appropriate practice framework becomes more recognized internationally, more
attention is being paid to what developmentally appropriate practice looks like in various
contexts, especially to support the development of children from disadvantaged backgrounds
(Burger, 2010; Brown & Lan, 2015).
2.2.2 Didactic Kindergartens
According to the DAP framework and the theoretical perspectives of Piaget and Vygotsky,
learning occurs through exploration and interaction with objects and other individuals. On the
other hand, didactic instruction, which is considered a synonym of developmentally
inappropriate practice in the NAEYC’s developmentally appropriate practice framework, is
commonly associated with behaviorist learning theories. Behaviorists define learning as
20
acquisition of new behavior through environmental conditioning. In a behaviorist classroom,
learning occurs through repeating the correct response to the teacher’s stimuli. Tasks are taught
in small sequential steps, and when errors occur, feedback is provided immediately so that the
wrong responses are not learned (Stipek, 2002). Rewards and punishments are used effectively
so that the desired responses will be rewarded and inappropriate responses will be punished and
eliminated. In many of the experiments conducted by behaviorists, animals such as rats and
pigeons were used to examine how the response is learned from a given stimuli. As such, the
behaviorists’ perspective might be considered an attempt to reduce human learning to basic
instinctive behavior shared with animals. Therefore, it can be said that their methods and
principles of learning can be universally applied, rather than being “inappropriate” for
development. Advocates of behaviorist approaches to learning include Watson (1913), Skinner
(1972) and Bandura (1986).
Some researchers have theorized that didactic approaches may be more appropriate for meeting
the needs of certain segments of the population, including economically disadvantaged children
and children from diverse cultural backgrounds. Stipek and Byler (1997) for example, suggest
that it may be more consistent with the cultural values of low-income families to emphasize
basic skills and academic outcomes. In addition, educators have insisted that the focus on active
learning and meeting individual needs may be inconsistent with the cultural values of some
ethnic groups such as the Native American (Williams, 1994) and the traditional Taiwanese
cultures (Hsue & Aldridge, 1995).
2.2.3 DAP vs DIP: A false dichotomy?
One of the criticisms against DAP relates to its implementation. While developmental practices
are advocated by most teacher education programs and early childhood organizations, several
21
studies have indicated that teachers struggle with their implementation. One classroom
observation study found that only 20 percent of the sampled U.S. kindergarten classrooms met
the criteria of DAP (Bryant et al., 1991). Further studies have found that while teachers may
hold beliefs consistent with DAP, they actually tend to engage in non-DAP practices (McMullen,
1999). The teachers often cite environmental and work-related stress, pressure from parents and
upper-grade teachers to prepare students for testing as some of the reasons for the discrepancy
between their beliefs and practices. On the other hand, the teachers who believe in didactic
teaching practice what they believe. The discrepancies between beliefs and practices for the
teachers who hold developmental beliefs may be due to the discrepancy in ideals held by the
early childhood education community and the educational policy environment of the U.S. While
it is more “politically correct” to admit to holding DAP beliefs in the community of early
childhood education, the educational policy environment may generally endorse the didactic
teaching practices.
Another criticism of the NAEYC’s framework is that DAP and DIP are depicted as completely
dichotomous, distinct and mutually exclusive concepts (Stipek, Feiler, Daniels, & Milburn,
1995). While empirical evidence tends to support the fact that teachers subscribe to either one of
the two pedagogical philosophies, Stipek et al. (1995) suggest that these two approaches are not
mutually exclusive and could be used for different goals and purposes. Indeed, some have
speculated that an integration of the two approaches would be ideal for early childhood education
(Ray & Smith, 2010). The full-day kindergarten programs in Ontario, Canada, is an example of
an initiative to integrate both developmental and didactic perspectives by having two teachers
lead the classroom -- one an academic teacher and the other an early childhood educator (Pascal,
2009). They are expected to bring complementary skills, perspectives and educational
22
backgrounds to the classroom. The academic teacher generally has at least a bachelor of
education and is trained to teach children from kindergarten to Grade 8. On the other hand, an
early childhood educator usually has a college degree and is trained in early childhood
education. The early childhood educator is expected to bring the perspective of child
development from earlier stages of development. On the other hand, the academic teacher is
expected to bring the perspectives of elementary school education.
2.2.4 Empirical Studies on Developmentally Appropriate Practice and Developmentally Inappropriate Practice
Effectiveness studies have examined how attending developmental, didactic, and sometimes the
combined programs affect children in various areas of development. These areas include stress
(Burts et al., 1992; Burts, Hart, Charlesworth, & Kirk, 1990; Love, Ryer, & Faddis, 1992),
creativity (Hirsh-Pasek, Hyson, & Rescorla, 1990), confidence (Mantzicopoulos, Neuharth-
Pritchett, & Morelock, 1994; Stipek et al., 1995), motivation (Stipek et al., 1995), and cognitive
and academic outcomes (Huffman & Speer, 2000; Stipek et al., 1995). Most studies, however,
are done in preschool settings and the conclusions about the effectiveness of kindergarten
programs are usually extrapolated from these preschool studies. In addition, the vast majority of
these studies adopt a non-experimental research design where selection bias is a major concern.
Finally, many studies suffer from significant methodological problems, including lack of pretest
(Marcon, 1999), small sample size in intervention studies, and lack of attention to the nesting
that exists in the data.
The primary concern for the NAEYC when they published the initial policy statement was that
children are being rushed into formal education too early, especially through inappropriate
classroom practices, and was experiencing considerable amount of stress. Therefore, from the
23
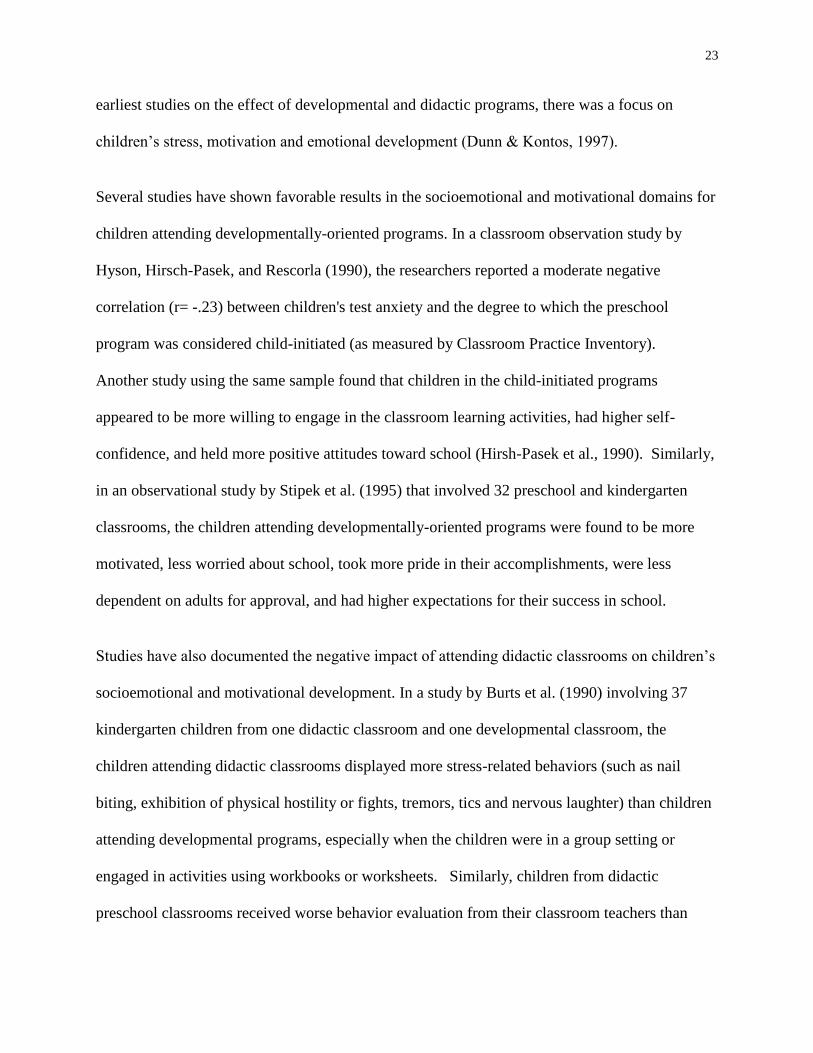
earliest studies on the effect of developmental and didactic programs, there was a focus on
children’s stress, motivation and emotional development (Dunn & Kontos, 1997).
Several studies have shown favorable results in the socioemotional and motivational domains for
children attending developmentally-oriented programs. In a classroom observation study by
Hyson, Hirsch-Pasek, and Rescorla (1990), the researchers reported a moderate negative
correlation (r= -.23) between children's test anxiety and the degree to which the preschool
program was considered child-initiated (as measured by Classroom Practice Inventory).
Another study using the same sample found that children in the child-initiated programs
appeared to be more willing to engage in the classroom learning activities, had higher self-
confidence, and held more positive attitudes toward school (Hirsh-Pasek et al., 1990). Similarly,
in an observational study by Stipek et al. (1995) that involved 32 preschool and kindergarten
classrooms, the children attending developmentally-oriented programs were found to be more
motivated, less worried about school, took more pride in their accomplishments, were less
dependent on adults for approval, and had higher expectations for their success in school.
Studies have also documented the negative impact of attending didactic classrooms on children’s
socioemotional and motivational development. In a study by Burts et al. (1990) involving 37
kindergarten children from one didactic classroom and one developmental classroom, the
children attending didactic classrooms displayed more stress-related behaviors (such as nail
biting, exhibition of physical hostility or fights, tremors, tics and nervous laughter) than children
attending developmental programs, especially when the children were in a group setting or
engaged in activities using workbooks or worksheets. Similarly, children from didactic
preschool classrooms received worse behavior evaluation from their classroom teachers than
24
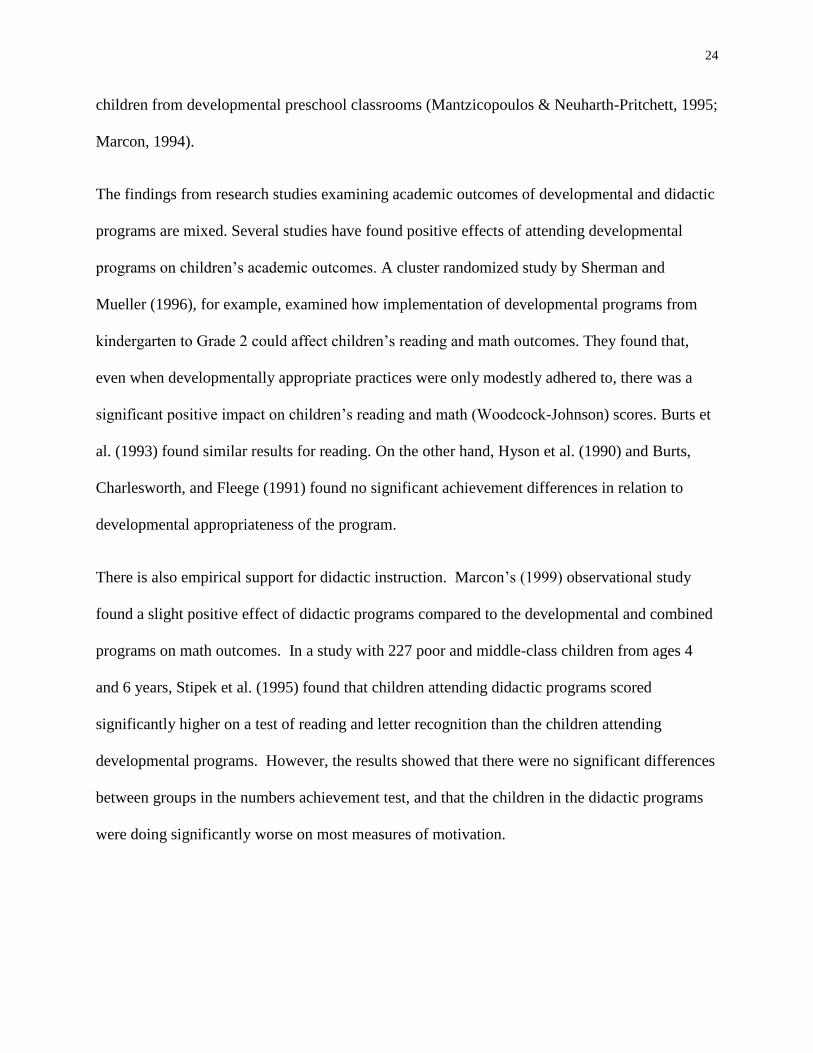
children from developmental preschool classrooms (Mantzicopoulos & Neuharth-Pritchett, 1995;
Marcon, 1994).
The findings from research studies examining academic outcomes of developmental and didactic
programs are mixed. Several studies have found positive effects of attending developmental
programs on children’s academic outcomes. A cluster randomized study by Sherman and
Mueller (1996), for example, examined how implementation of developmental programs from
kindergarten to Grade 2 could affect children’s reading and math outcomes. They found that,
even when developmentally appropriate practices were only modestly adhered to, there was a
significant positive impact on children’s reading and math (Woodcock-Johnson) scores. Burts et
al. (1993) found similar results for reading. On the other hand, Hyson et al. (1990) and Burts,
Charlesworth, and Fleege (1991) found no significant achievement differences in relation to
developmental appropriateness of the program.
There is also empirical support for didactic instruction. Marcon’s (1999) observational study
found a slight positive effect of didactic programs compared to the developmental and combined
programs on math outcomes. In a study with 227 poor and middle-class children from ages 4
and 6 years, Stipek et al. (1995) found that children attending didactic programs scored
significantly higher on a test of reading and letter recognition than the children attending
developmental programs. However, the results showed that there were no significant differences
between groups in the numbers achievement test, and that the children in the didactic programs
were doing significantly worse on most measures of motivation.
25
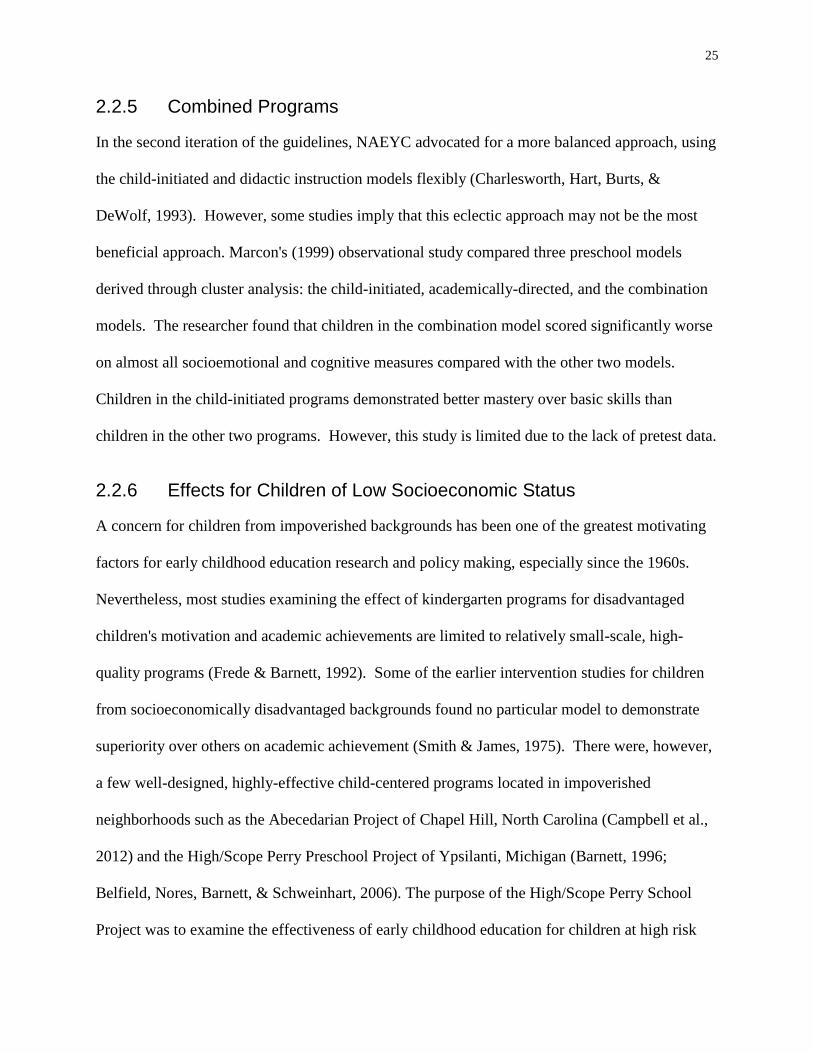
2.2.5 Combined Programs
In the second iteration of the guidelines, NAEYC advocated for a more balanced approach, using
the child-initiated and didactic instruction models flexibly (Charlesworth, Hart, Burts, &
DeWolf, 1993). However, some studies imply that this eclectic approach may not be the most
beneficial approach. Marcon's (1999) observational study compared three preschool models
derived through cluster analysis: the child-initiated, academically-directed, and the combination
models. The researcher found that children in the combination model scored significantly worse
on almost all socioemotional and cognitive measures compared with the other two models.
Children in the child-initiated programs demonstrated better mastery over basic skills than
children in the other two programs. However, this study is limited due to the lack of pretest data.
2.2.6 Effects for Children of Low Socioeconomic Status
A concern for children from impoverished backgrounds has been one of the greatest motivating
factors for early childhood education research and policy making, especially since the 1960s.
Nevertheless, most studies examining the effect of kindergarten programs for disadvantaged
children's motivation and academic achievements are limited to relatively small-scale, high-
quality programs (Frede & Barnett, 1992). Some of the earlier intervention studies for children
from socioeconomically disadvantaged backgrounds found no particular model to demonstrate
superiority over others on academic achievement (Smith & James, 1975). There were, however,
a few well-designed, highly-effective child-centered programs located in impoverished
neighborhoods such as the Abecedarian Project of Chapel Hill, North Carolina (Campbell et al.,
2012) and the High/Scope Perry Preschool Project of Ypsilanti, Michigan (Barnett, 1996;
Belfield, Nores, Barnett, & Schweinhart, 2006). The purpose of the High/Scope Perry School
Project was to examine the effectiveness of early childhood education for children at high risk
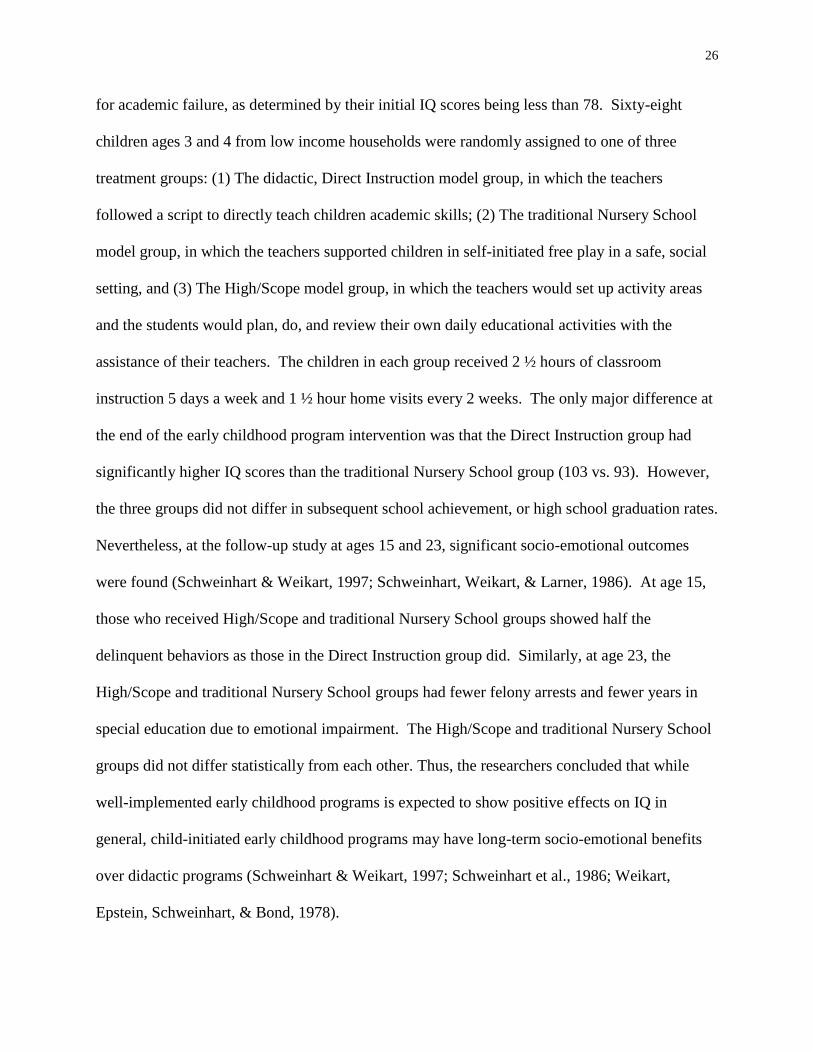
26
for academic failure, as determined by their initial IQ scores being less than 78. Sixty-eight
children ages 3 and 4 from low income households were randomly assigned to one of three
treatment groups: (1) The didactic, Direct Instruction model group, in which the teachers
followed a script to directly teach children academic skills; (2) The traditional Nursery School
model group, in which the teachers supported children in self-initiated free play in a safe, social
setting, and (3) The High/Scope model group, in which the teachers would set up activity areas
and the students would plan, do, and review their own daily educational activities with the
assistance of their teachers. The children in each group received 2 ½ hours of classroom
instruction 5 days a week and 1 ½ hour home visits every 2 weeks. The only major difference at
the end of the early childhood program intervention was that the Direct Instruction group had
significantly higher IQ scores than the traditional Nursery School group (103 vs. 93). However,
the three groups did not differ in subsequent school achievement, or high school graduation rates.
Nevertheless, at the follow-up study at ages 15 and 23, significant socio-emotional outcomes
were found (Schweinhart & Weikart, 1997; Schweinhart, Weikart, & Larner, 1986). At age 15,
those who received High/Scope and traditional Nursery School groups showed half the
delinquent behaviors as those in the Direct Instruction group did. Similarly, at age 23, the
High/Scope and traditional Nursery School groups had fewer felony arrests and fewer years in
special education due to emotional impairment. The High/Scope and traditional Nursery School
groups did not differ statistically from each other. Thus, the researchers concluded that while
well-implemented early childhood programs is expected to show positive effects on IQ in
general, child-initiated early childhood programs may have long-term socio-emotional benefits
over didactic programs (Schweinhart & Weikart, 1997; Schweinhart et al., 1986; Weikart,
Epstein, Schweinhart, & Bond, 1978).
27
Both the High/Scope and Abecedarian projects are well designed randomized control studies
with longitudinal follow-up into adulthood. However, both are limited to one neighborhood and
the effects of such programs have not yet been investigated nation-wide and across different SES
neighborhoods. Moreover, such well-designed developmental programs are not typical of the
regular kindergarten programs, and may not be considered the regular outcome of the typical
developmental programs in the U.S. Given that there have also been well-designed didactic
intervention programs that have successfully improved the achievement of children from poor
families (Becker & Gersten, 1982; Bereiter, 1986), it seems important to compare the
effectiveness of the kindergarten programs with a large-scale, national level sample.
3 Research Questions
In this dissertation, I address four main research questions. The research questions and the
hypotheses for each question are as follows:
(1) What are the natural groupings of teachers that emerge from the data based on their
didactic and developmental teaching practices?
According to the NAEYC’s developmentally appropriate practice framework, there are
two distinct practices commonly observed in early childhood and early elementary
school classrooms: the “developmentally appropriate” and the “developmentally
inappropriate” or “in contrast” practices. Most studies following this framework have
assumed the existence of these two distinct approaches and proceeded to examine the
effectiveness of teachers who adhere to either one of these practices. However, some
researchers have argued that there may be a third group of teachers who may combine
elements of both the developmental and didactic approaches (e.g., Marcon, 1999; Stipek
28
& Byler, 1997). The aim of the first research question is to empirically derive from the
national-level data the natural grouping of kindergarten teachers in the 1998-1999
school year based on their teaching practices.
(2) With reference to the kindergarten programs identified under the first research question:
a. What kinds of schools are more likely to adopt these programs?
b. What kinds of teachers are more likely to implement each of these programs in their
classrooms?
c. What are the demographic characteristics of the children attending each of these programs?
Building on the first research question, the purpose of the second research question was to
examine the school-, teacher-, and child-level characteristics associated with each type of
programs identified in question 1. From previous studies (e.g., Maxwell, McWilliam, Hemmeter,
Ault, & Schuster, 2001), it is expected that schools with more disadvantaged students will be
more likely to adopt a didactic orientation, whereas schools with more advantaged students will
be more likely to adopt a developmental orientation. Due to the lack of empirical studies, there
are no specific predictions regarding the school characteristics of programs that combine the
elements of developmental and didactic practices, if such groups were found.
Previous research indicates that teachers who adopt a developmental approach tend to have
greater knowledge about developmentally appropriate practices (Bryant et al., 1991). Therefore,
teachers who have taken more courses in child development, or have more experience teaching
preschool may be more likely to adopt a developmental approach. On the other hand, teachers
29
with more experience teaching upper grades may be more likely to adopt a didactic approach to
kindergarten. Moreover, teacher beliefs about what children should learn during kindergarten
may have an effect on teaching practices. Previous research has shown that teachers holding DIP
beliefs were more likely to adopt didactic practices, but teachers who hold DAP beliefs do not
necessarily engage in developmental practices. Therefore, I predict that teachers who believe
that learning specific academic skills is important before or in kindergarten would more likely
engage in didactic practices whereas teachers who believe in the importance of developmental
practices such as playing math games and reading stories to children may or may not engage in
developmental practices.
(3) How does the time allocation differ among the didactic, combination, and developmental
kindergartens? How does classroom SES affect time allocation?
It is often assumed that didactic instruction is used in academically-oriented programs that spend
more time on academics, and that developmental instruction is used in programs where more
time is allocated to enrichment activities and recess (Miller & Almon, 2009), yet the inter-
relationship among time allocation, kindergarten program, and SES has rarely been investigated.
I expected that didactic programs and programs that allocate more time to academic subjects will
be found in low SES classrooms, because they would be more under pressure to achieve
academically, maybe at the expense of enrichment activities and recess.
(4) How does attending didactic, combination, or developmental kindergartens affect the
children’s motivational and academic outcomes from kindergarten to Grade 5? Does the
program effectiveness depend on the SES level?
30
The lack of longitudinal studies investigating the effect of kindergarten developmental, didactic,
and combined programs on children’s academic achievement and motivational outcomes has
long been acknowledged by researchers in the field (Burts et al., 1993; Van Horn & Ramey,
2003). In addition, there is a paucity of research on how socioeconomic status affects program
effectiveness.
It is expected that advantaged children would score higher than disadvantaged children on all
measures of academic test scores, both at the end of kindergarten and longitudinally to the end of
Grade 5. From previous studies, I hypothesize that children who attended developmental
programs would receive better teacher ratings on learning-related behavior and academic
outcomes, both at the end of the kindergarten year and longitudinally, irrespective of their
socioeconomic background (Kumtepe, 2005). The standardized test scores for students attending
didactic kindergartens may be higher than those for students attending developmental
kindergartens at the end of the kindergarten year but not longitudinally. The difference may be
more pronounced for children living in poverty than those who do not.
As discussed earlier, most non-experimental studies examining the outcomes of developmental,
didactic, and combined kindergarten programs have significant methodological limitations
including potential selection bias, small sample size, lack of pretest data and lack of
consideration of the nested data structure. While a few small-scale, randomized control trials of
high-quality early childhood programs have been conducted, the results of such studies have yet
to be replicated on a larger scale. Conducting a randomized control study on the effectiveness of
developmental, didactic and combined programs on a national level is practically infeasible.
Moreover, long-term follow-up studies of kindergarten programs have rarely been conducted. In
my dissertation, I use marginal mean weighting with stratification (MMW-S) method, which is a
31
semi-parametric application of the propensity score method using Rubin’s counterfactual causal
inference framework (Hong, 2012). Using the MMW-S method on the Early Childhood
Longitudinal Study – Kindergarten Cohort of 1998-1999 (ECLS-K), a US-based, national-level,
observational dataset, allowed me to emulate a pseudo-randomized study of the effectiveness of
developmental, didactic, and combined kindergarten programs. Moreover, thanks to the
longitudinal nature of the dataset, the effectiveness of kindergarten programs can be examined
throughout the elementary school grades.
32
Chapter 2 Methods
4 Chapter Overview
In this chapter, I describe the methodology used to answer my research questions. I first describe
the characteristics of the ECLS-K dataset. Second, I provide details of how the treatment
variable was created, and describe the child- and teacher-level predictors and outcome variables
used in my analyses. Finally, I provide details of the analytic procedures used to answer my
research questions.
4.1 ECLS-K Dataset Characteristics
I used the Early Childhood Longitudinal Study, Kindergarten Class of 1998-1999 (ECLS-K),
from National Center for Education Statistics (NCES) of the U.S. Department of Education for
analysis (Najarian, Pollack, Sorongon, & Hausken, 2009) . ECLS-K was the first nationally
representative dataset to follow the educational attainment and development of a sample of
children, kindergarten through to Grade 8. Data were collected using a multistage probability
sampling design, with geographic areas of counties and groups of counties serving as Primary
Sampling Units (PSUs). In the fall of 1998, 21260 kindergarten students were sampled from
3305 public and private schools within the PSUs. The ECLS-K contains a total of seven rounds
of longitudinal data: Fall and spring of kindergarten, fall and spring of Grade 1, and spring of
Grades 3, 5, and 8 (Najarian, Pollack, Sorongon, & Hausken, 2009). The fall of Grade 1 was
excluded from my analysis because only a subsample of children was recruited to participate in
33
this round. Additionally, the Grade 8 data were not used, as some of the outcome measures were
missing (e.g., teacher ratings of approaches to learning).
4.2 Analytic Sample
The analytic sample consisted of full-day kindergarten teachers who had valid information
regarding their classroom instructional characteristics and their students.
4.2.1 Full-day Kindergarten
I utilized 3 variables from the Fall and Spring Kindergarten Teacher Questionnaires to define the
full-day kindergarten sample: (1) Whether the teachers taught full-day kindergarten in the fall
and (2) in the spring, and (3) whether the teachers taught full-day kindergartens 5 days a
week. The reason for restricting the sample to those that held daily full-day classes throughout
the academic year is to maintain consistency in the treatment condition (e.g., some classes
offered full-day kindergartens only 2 or 3 days a week and some had shortened school days
during the fall of kindergarten). Of the 3305 kindergarten teachers in the base year full sample,
377 teachers (11.4%) had missing data on at least one of the three selection variables. Of the
valid sample of 2928 kindergarten teachers, 1581 (54%) were identified as teaching full-day
kindergartens. These full-day kindergarten teachers were nested in 492 schools and were
teaching 8393 students in the sample.
Tables 1, 2, and 3 show the demographic characteristics of schools, teachers, and children
affiliated with full-day and half-day kindergartens. Full-day kindergartens were more likely than
half-day kindergartens to be located in the Southern U.S. and in a central city. Compared to the
half-day kindergartens, the full-day kindergartens were more likely to be serving disadvantaged
students. Full-day kindergartens were more likely to be receiving Title 1 funds and have a
34
higher percentage of students eligible for the federal free and reduced lunch programs than half-
day kindergartens. The principals of schools with full-day kindergartens tended to be female with
less experience as principals than the principals of schools that provided half-day kindergartens.
The class size of full-day kindergartens was larger than that of half-day kindergartens. Full-day
kindergartens tended to allocate proportionally less time to academic subjects and more time to
non-academic subjects than their half-day kindergarten counterparts. The full-day kindergarten
teachers tended to be females and Black or African Americans, and less likely to be Hispanic or
White.
Finally, the children in the sample attending full-day kindergartens were more likely to be Black,
Native American, or Pacific Islander students living below the poverty threshold but spoke
English at home. There was a higher proportion of kindergarten retainees in the full-day
programs than in the half-day programs, and the children were less likely to be White, Hispanic
and Asian.
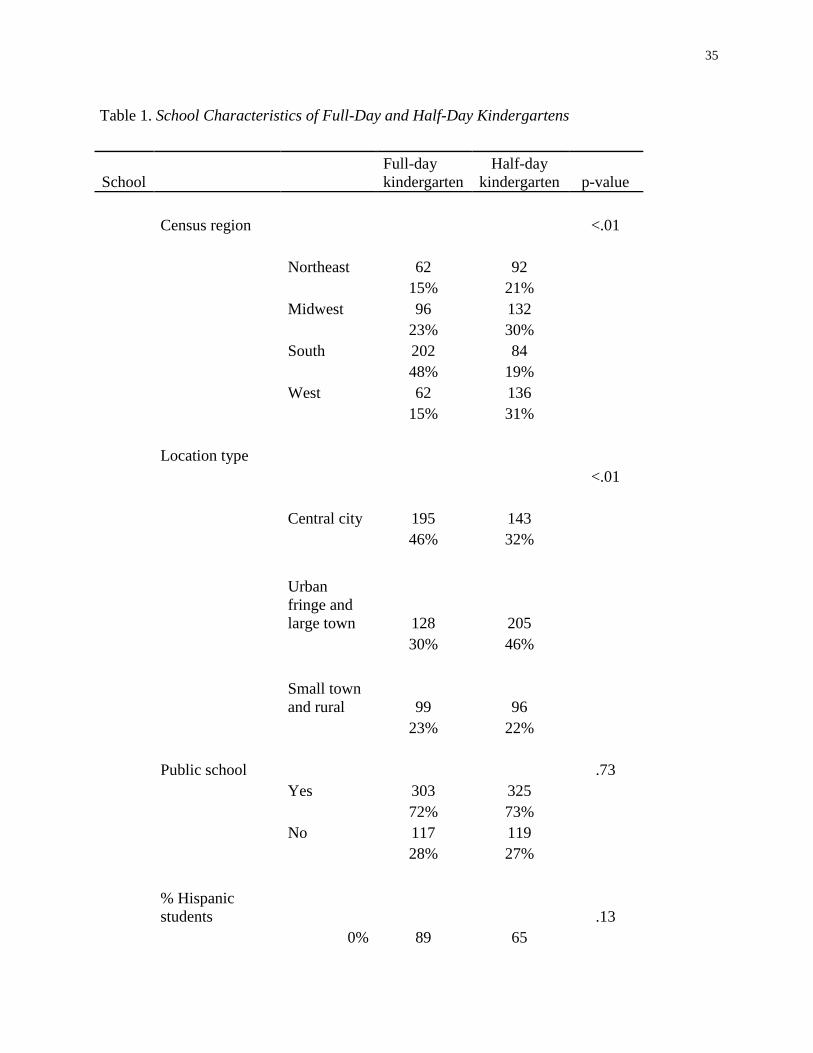
35
Table 1. School Characteristics of Full-Day and Half-Day Kindergartens
School
Full-day
kindergarten
Half-day
kindergarten p-value
Census region
<.01
Northeast 62 92
15% 21%
Midwest 96 132
23% 30%
South 202 84
48% 19%
West 62 136
15% 31%
Location type
<.01
Central city 195 143
46% 32%
Urban
fringe and
large town 128 205
30% 46%
Small town
and rural 99 96
23% 22%
Public school
.73
Yes 303 325
72% 73%
No 117 119
28% 27%
% Hispanic
students
.13
0% 89 65
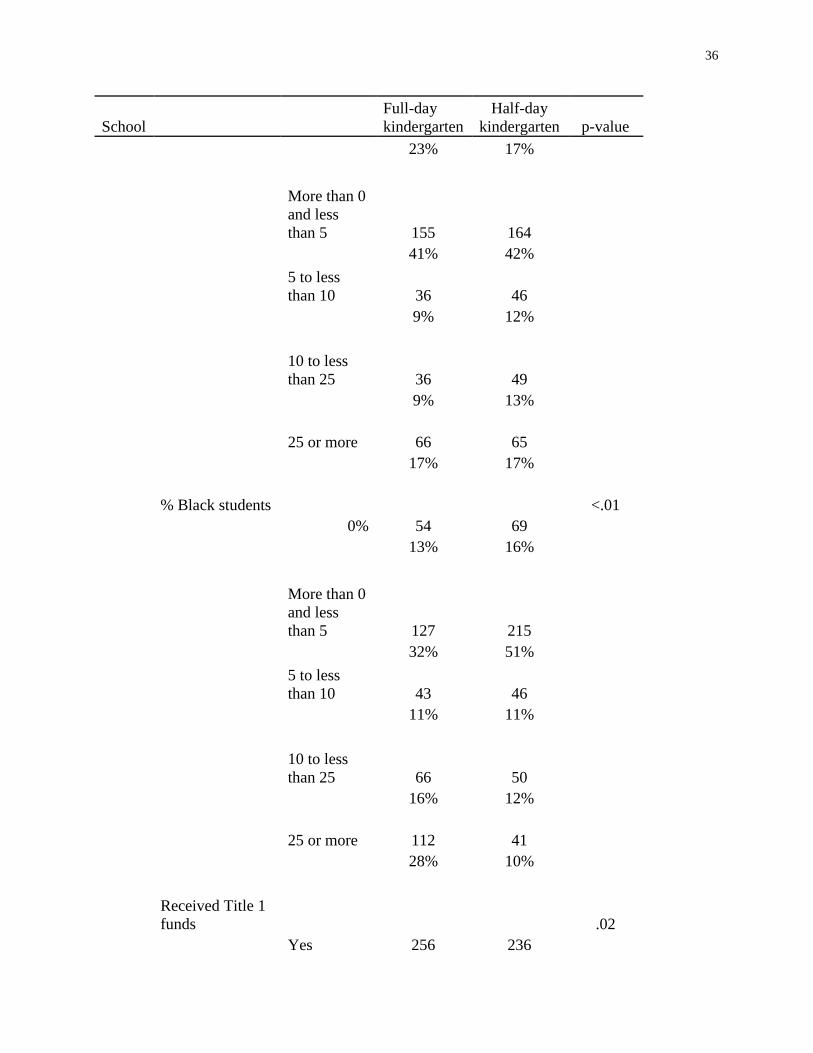
36
School
Full-day
kindergarten
Half-day
kindergarten p-value
23% 17%
More than 0
and less
than 5 155 164
41% 42%
5 to less
than 10 36 46
9% 12%
10 to less
than 25 36 49
9% 13%
25 or more 66 65
17% 17%
% Black students
<.01
0% 54 69
13% 16%
More than 0
and less
than 5 127 215
32% 51%
5 to less
than 10 43 46
11% 11%
10 to less
than 25 66 50
16% 12%
25 or more 112 41
28% 10%
Received Title 1
funds
.02
Yes 256 236
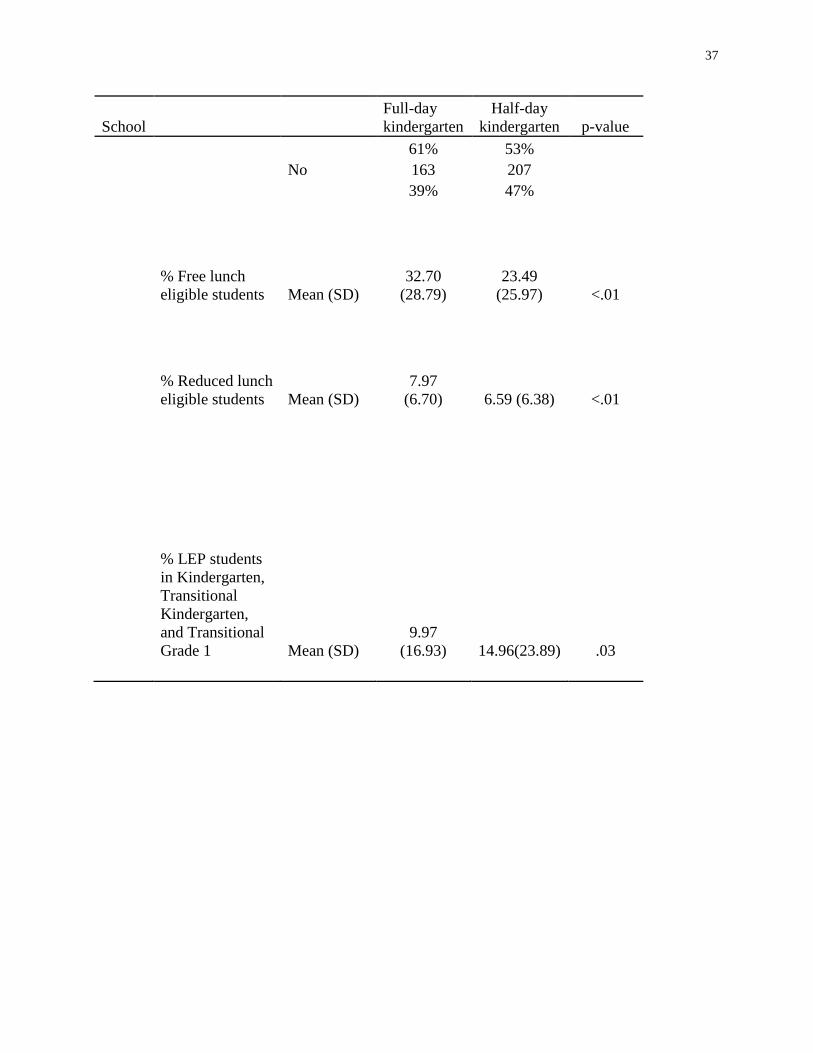
37
School
Full-day
kindergarten
Half-day
kindergarten p-value
61% 53%
No 163 207
39% 47%
% Free lunch
eligible students Mean (SD)
32.70
(28.79)
23.49
(25.97) <.01
% Reduced lunch
eligible students Mean (SD)
7.97
(6.70) 6.59 (6.38) <.01
% LEP students
in Kindergarten,
Transitional
Kindergarten,
and Transitional
Grade 1 Mean (SD)
9.97
(16.93) 14.96(23.89) .03
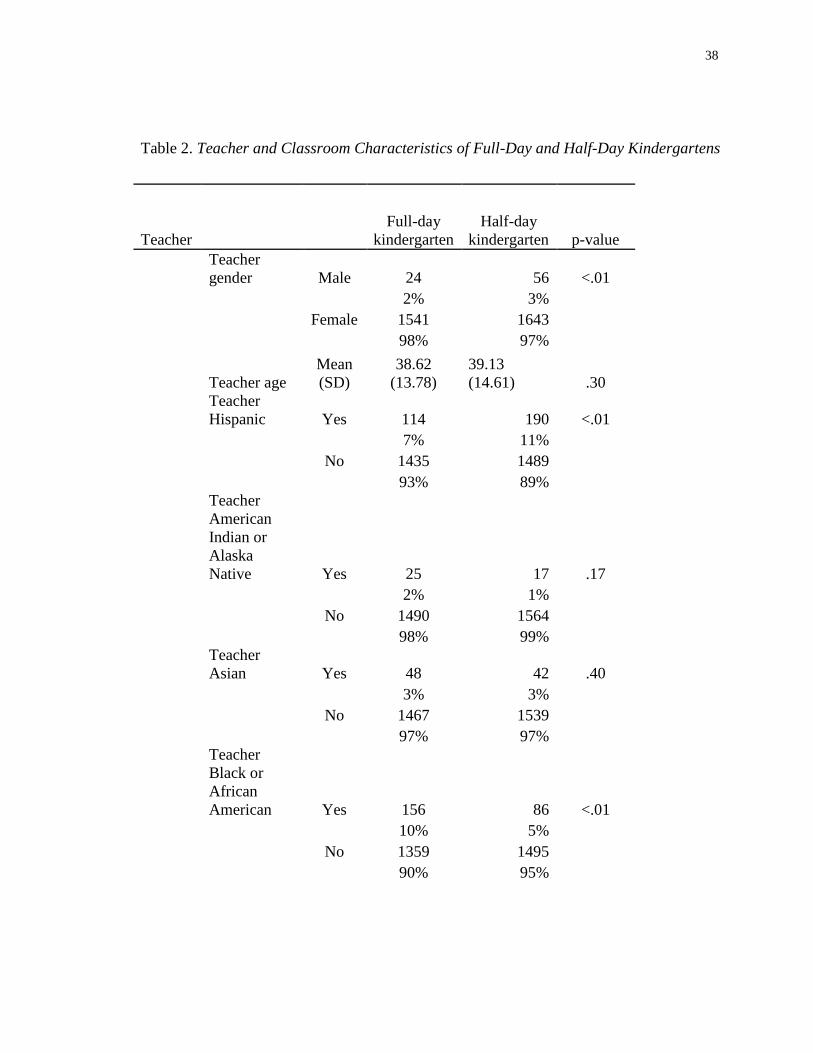
38
Table 2. Teacher and Classroom Characteristics of Full-Day and Half-Day Kindergartens
Teacher Full-day
kindergarten
Half-day
kindergarten p-value
Teacher
gender Male 24 56 <.01
2% 3%
Female 1541 1643
98% 97%
Teacher age
Mean
(SD)
38.62
(13.78)
39.13
(14.61) .30
Teacher
Hispanic Yes 114 190 <.01
7% 11%
No 1435 1489
93% 89%
Teacher
American
Indian or
Alaska
Native Yes 25 17 .17
2% 1%
No 1490 1564
98% 99%
Teacher
Asian Yes 48 42 .40
3% 3%
No 1467 1539
97% 97%
Teacher
Black or
African
American Yes 156 86 <.01
10% 5%
No 1359 1495
90% 95%
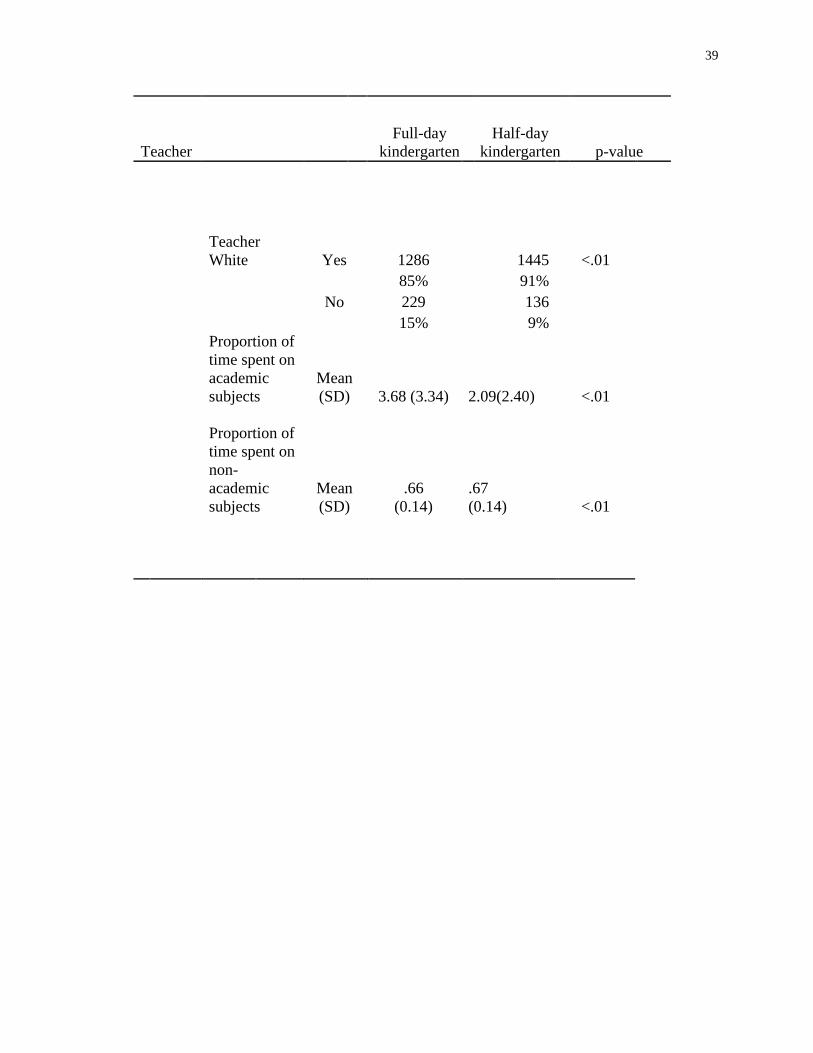
39
Teacher Full-day
kindergarten
Half-day
kindergarten p-value
Teacher
White Yes 1286 1445 <.01
85% 91%
No 229 136
15% 9%
Proportion of
time spent on
academic
subjects
Mean
(SD) 3.68 (3.34) 2.09(2.40) <.01
Proportion of
time spent on
non-
academic
subjects
Mean
(SD)
.66
(0.14)
.67
(0.14) <.01
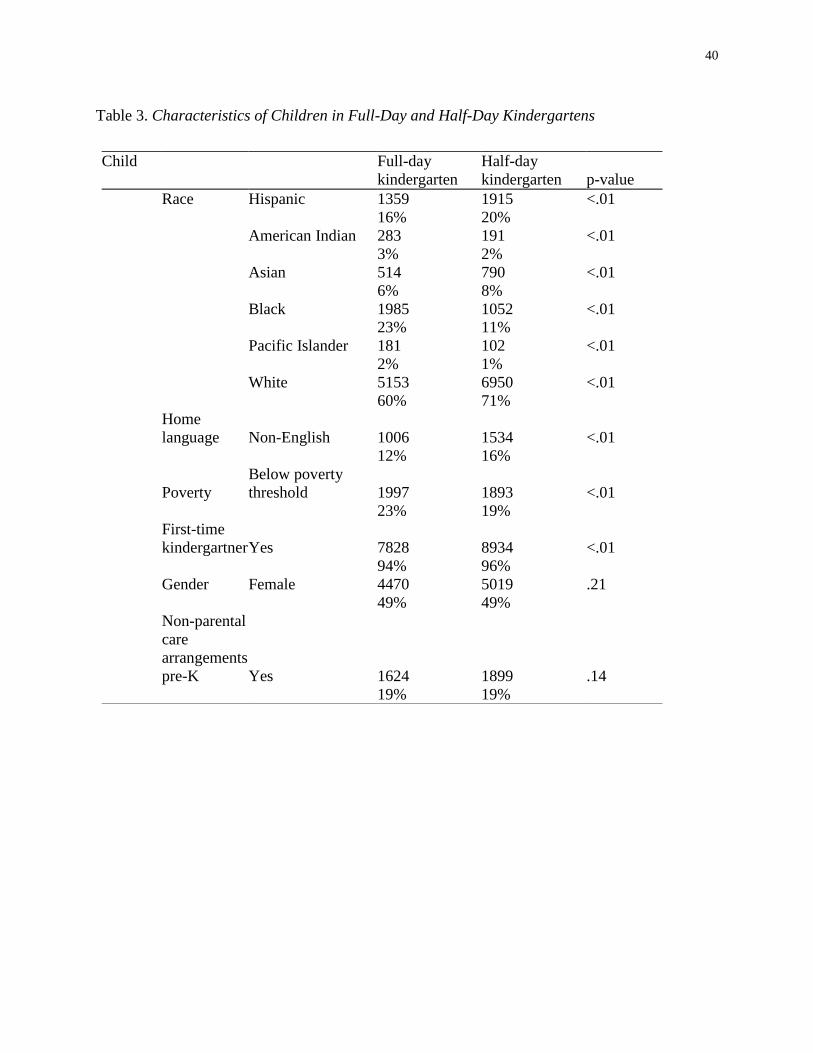
40
Table 3. Characteristics of Children in Full-Day and Half-Day Kindergartens
Child
Full-day
kindergarten
Half-day
kindergarten p-value
Race Hispanic 1359 1915 <.01
16% 20%
American Indian 283 191 <.01
3% 2%
Asian 514 790 <.01
6% 8%
Black 1985 1052 <.01
23% 11%
Pacific Islander 181 102 <.01
2% 1%
White 5153 6950 <.01
60% 71%
Home
language Non-English 1006 1534 <.01
12% 16%
Poverty
Below poverty
threshold 1997 1893 <.01
23% 19%
First-time
kindergartner Yes 7828 8934 <.01
94% 96%
Gender Female 4470 5019 .21
49% 49%
Non-parental
care
arrangements
pre-K Yes 1624 1899 .14
19% 19%
41
4.3 Measure of Classroom SES
Classroom SES was defined using the child-level household SES measure,
WKSESQ5. WKSESQ5 was a 5-level, composite SES measure which utilized information from
the parent interview regarding parental education, parental occupation prestige and household
income. Low SES households were defined as those belonging to the two lowest SES
quintiles. Of the total sample of 21409 students, 3770 students were identified as coming from
low SES households. Within the 8393 students attending full-day kindergarten, 3233 students
(40.0% of the valid sample) was identified as coming from low SES households.
By aggregating this child-level SES variable to the teacher level, I obtained the proportion of
sampled students in the classroom who came from low SES households. In a typical full-day
kindergarten classroom in the analytic sample, roughly 4 out of 10 students came from low SES
households (M = .431, SD = .346). Classrooms with more than 50% of the sampled students
coming from low SES households were defined as low-SES classrooms. Of the 1581 teachers in
the sample with valid child poverty information, 474 teachers were teaching low-SES classes.
The aggregated SES composite variable was used in the present study to reflect the students’
educational resources at home which may not be captured by household income alone. However,
due to the small number of sampled students in each classroom, there may be a considerable
amount of measurement error involved in this variable.
In an attempt to validate this SES measure (because there was no classroom level SES measure
in the dataset), the school-level percentage of free-lunch eligible students was de-aggregated to
the classroom level and used as the criterion variable. As expected, there was a significant
42
difference between high and low poverty classrooms as defined by student composite SES on the
school percentage of free-lunch eligible students, t(853.764) = -12.336, p <.001.
4.4 Types of Kindergarten Classrooms
The treatment variables were created using multi-group confirmatory factor analysis and two-
step cluster analysis. The variables that are theoretically related to child-initiated and didactic
practices were derived from the teacher questionnaire regarding classroom activities and
instructional practices.
I used two items from the Teacher Questionnaire B, question 1, which asked how much time in a
typical day the children engaged in teacher-directed whole class activities and child-selected
activities. These two items were used to represent didactic and developmental practices
respectively2. The teachers indicated how much time they spent on each activities during a
typical day. The possible responses were (1) no time, (2) half an hour or less, (3) about one
hour, (4) about two hours, and (5) three hours or more.
In addition to the classroom activities, items related to instructional activities and curricula focus
were derived from questions 28 and 31 of Teacher Questionnaire A. These questions asked how
often the children engage in specific reading and language arts (question 28) and math (question
31) activities. The items theoretically selected to represent didactic practices were (1) the use of
worksheets in reading and (2) the use of worksheets in math. The items theoretically chosen to
2 There were two other items - teacher-directed small group activities and teacher-directed individual activities – in
the teacher questionnaire B question 1. However, these two items were not included in the current analysis as it was
theorized that they could be applicable to either didactic or developmental practices. These two items were found to
have negative correlations with items related to didactic approaches and to have positive correlations with
developmental practices.
43
represent developmental practices were: (1) peer tutoring in reading, (2) peer tutoring in math,
(3) writing with inventive spelling, (4) children choosing their own books to read, (5) using
geometric manipulatives, (6) counting manipulatives, (7) playing math games, and (8) solving
real-life math. The possible alternatives for these items were (1) never, (2) once a month or less,
(3) two or three times a month, (4) once or twice a week, and (5) three or four times a week, and
(6) daily.
4.5 Time Allocation for Academic Subjects
The proportion of time allocated to academic subjects during a typical week was calculated by
multiplying the frequencies and the durations of each of the following activities or subjects:
Reading, math, social studies, science, music, art, dance, theatre, physical education, recess, and
lunch. Information regarding the frequency and duration of academic subjects, enrichment
courses, and recess was derived from a series of items in the Spring Kindergarten Teacher
Questionnaire A (Questions 10-15).
Question 10 asked the teachers how often and how much time the children in their class engage
in lessons or projects in each of the following areas: (a) reading and language arts, (b)
mathematics, (c) social studies, (d) science, (e) music, (f) art, (g) dance/creative movement, and
(h) theater/creative dramatics. The frequency of these activities/subjects was reported on a 5-
point scale: (1) Never, (2) Less than once a week, (3) 1-2 times a week, (4) 3-4 times a week, and
(5) Daily. The duration was estimated on a 4-point scale: (1) 1-30 minutes a day, (2) 31-60
minutes a day, (3) 61-90 minutes a day, and (4) More than 90 minutes a day.
Similarly, question 11 and question 12 asked the teacher how often and how much time their
classes engaged in physical education. The probes for the frequency question were (1) Never,
44
(2) Less than once a week, (3) Once or twice a week, (4) Three or four times a week, and (5)
Daily. The probes for the duration question were (1) Do not participate in physical education,
(2) 1-15 minutes / day, (3) 16-30 minutes / day, (4) 31-60 minutes / day, (5) More than 60
minutes / day.
Questions 13, 14, and 15 asked the teacher how many days a week, how many times, and how
long the children participate in recess, respectively. Question 13 asked the teacher to write the
number of days per week the children have recess. Question 14 asked how many times in a day,
between the starting bell and the dismissal bell, the children have recess: (1) Once, (2) Twice, or
(3) Three or more times. Finally, question 15 asked the duration of lunch and recess in a typical
day: (1) 1-15 minutes, (2) 16-30 minutes, (3) 31-45 minutes, or (4) longer than 45 minutes.
Utilizing this information, I calculated the proportion of time the teacher spent on academic
subjects. First, the total number of minutes per week the teacher spends on each of the activities
was calculated by assigning a middle value to each of the categorical measures and multiplying
the frequency and duration variables for each of the subjects and activities. For questions 10 and
11, the assigned values were 0 = never, 0.5 = less than once a week, 1.5 = one to two times a
week, 3.5 = three to four times a week, and 5 = daily. For the duration questions in question 10,
the following values were assigned: 15 = 1-30 minutes a day, 45 = 31 – 60 minutes a day, 75 =
61 to 90 minutes a day, and 105 = more than 90 minutes a day. For question 12 the assigned
values were 0 = do not participate in physical education, 7.5 = 1-15 minutes / day, 22.5 = 16-30
minutes / day, 52.5 = 31-60 minutes / day, 67.5 = more than 60 minutes / day. For question 13, I
used the raw number of days that the teachers reported. For question 14, the assigned values
were 1 = once, 2 = twice, and 3.5 = three or more times. Lastly, for question 15, the assigned
45
values were 7.5 = 1 – 15 minutes, 22.5 = 16-30 minutes, 37.5 = 31 – 45 minutes, and 52.5 =
longer than 45 minutes.
4.6 Outcome Variables
The outcome variables included children’s direct assessments of reading and math using IRT
theta scores, teacher ratings of the children’s reading and math ability, as well as teacher ratings
of children’s approaches to learning. All outcomes were available from kindergarten to Grade 5.
The mean and standard deviation for each of the measures for each grade are shown in Table 4.
4.6.1 Teacher Ratings of Children’s Approaches to Learning
The teacher rating of children’s approaches to learning estimated how often the sampled child
exhibited certain positive learning-related behaviors. In kindergarten and Grade 1, the following
statements were rated on a 4-point scale from 1= never to 4 = very often: (1) Keeps belongings
organized, (2) Shows eagerness to learn new things, (3) Works independently, (4) Easily adapts
to changes in routine, (5) Persists in completing tasks, and (6) Pay attention well. In Grades 3
and 5, an additional item was included to increase variance: (7) Follows classroom rules. The
children’s approaches to learning score were an average of all the items that the teacher rated on
the child’s behavior. The teachers who rated at least 4 out of 6 items in kindergarten and Grade
1, and at least 5 out of 7 items in Grades 3 and 5 were included in the analysis.
4.6.2 Reading and Math Teacher Academic Rating Scale
The advantage of using IRT theta scores was that it provided a direct measure of a child’s ability
and could be used to assess change over time. The disadvantage, on the other hand, was that
children deemed unsuitable for direct testing due to the children’s English language ability or
special needs were excluded from the testing. To augment the disadvantage of the direct
46
assessment, ECLS-K collected data from teachers of each of the sampled children, and rated
their ability in academic subjects relative to other children of the same grade level. The
advantage of using such indirect measure of child’s ability is that the researcher could gain
insight into the ability level of the children excluded from the direct testing. The disadvantage,
however, is that the rating scale is specific for that child’s grade level, and cannot be used as a
measure of change over time. While the Academic Rating Scale included math, reading, and
general knowledge at the kindergarten and Grade 1 level, and math, reading and science in
Grades, 3, 5, and 8, I use only the teacher assessment of children’s reading and math skills from
Kindergarten to Grade 5 in my analysis.
4.6.3 Reading and Math Direct Assessment
For the direct assessment measures of children’s overall ability in reading and math, I used
children’s Item Response Theory (IRT) theta scores from kindergarten to Grade 5. The IRT
theta scores are estimates of children’s underlying ability based on Item Response Theory.
These scores are vertically equated and are considered ideal measures for assessing children’s
growth over time. The IRT theta scores form a normal distribution at all assessment times and
the score distribution ranges from approximately -3 to 3 (NCES, 2009). The reliability estimates
across grades ranged from .87 to .96 for reading, and .91 to .95 for math.
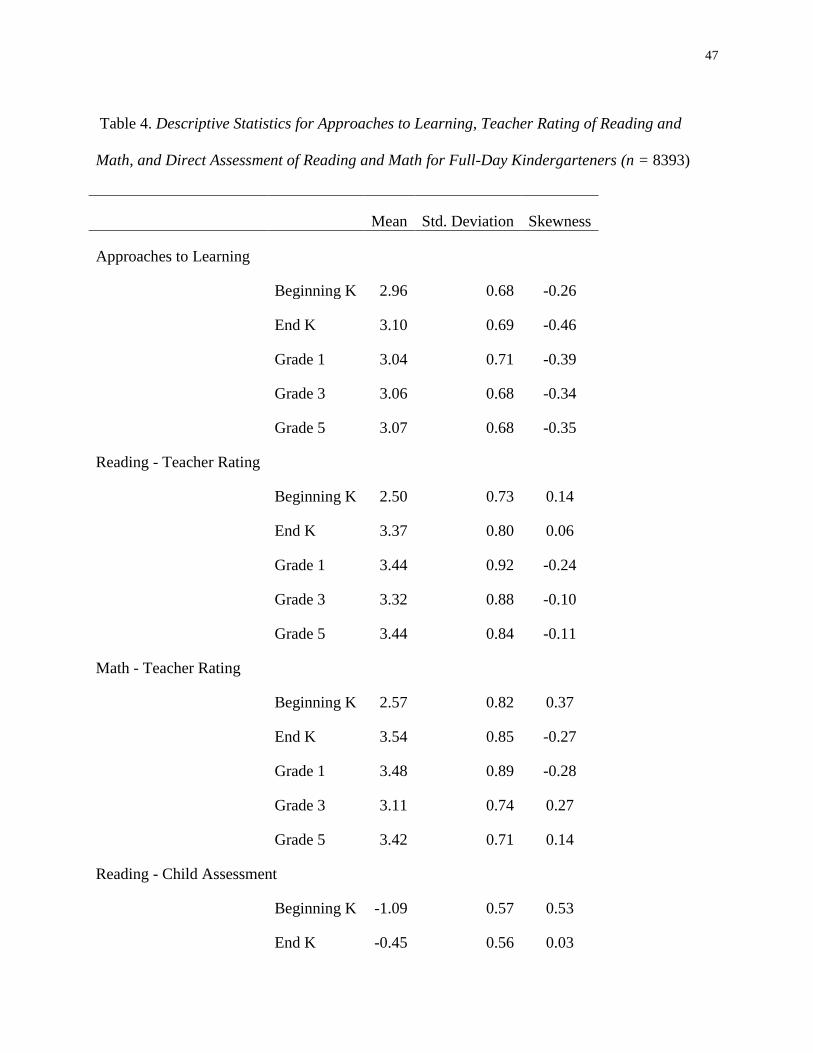
47
Table 4. Descriptive Statistics for Approaches to Learning, Teacher Rating of Reading and
Math, and Direct Assessment of Reading and Math for Full-Day Kindergarteners (n = 8393)
Mean Std. Deviation Skewness
Approaches to Learning
Beginning K 2.96 0.68 -0.26
End K 3.10 0.69 -0.46
Grade 1 3.04 0.71 -0.39
Grade 3 3.06 0.68 -0.34
Grade 5 3.07 0.68 -0.35
Reading - Teacher Rating
Beginning K 2.50 0.73 0.14
End K 3.37 0.80 0.06
Grade 1 3.44 0.92 -0.24
Grade 3 3.32 0.88 -0.10
Grade 5 3.44 0.84 -0.11
Math - Teacher Rating
Beginning K 2.57 0.82 0.37
End K 3.54 0.85 -0.27
Grade 1 3.48 0.89 -0.28
Grade 3 3.11 0.74 0.27
Grade 5 3.42 0.71 0.14
Reading - Child Assessment
Beginning K -1.09 0.57 0.53
End K -0.45 0.56 0.03
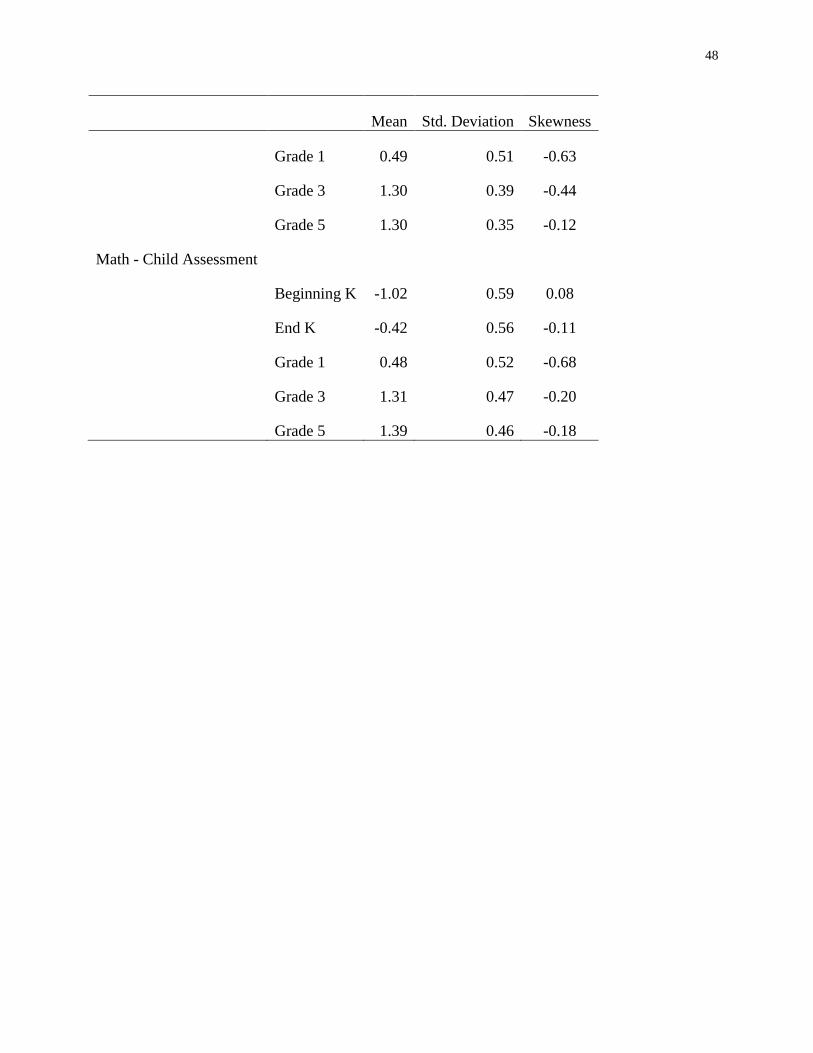
48
Mean Std. Deviation Skewness
Grade 1 0.49 0.51 -0.63
Grade 3 1.30 0.39 -0.44
Grade 5 1.30 0.35 -0.12
Math - Child Assessment
Beginning K -1.02 0.59 0.08
End K -0.42 0.56 -0.11
Grade 1 0.48 0.52 -0.68
Grade 3 1.31 0.47 -0.20
Grade 5 1.39 0.46 -0.18
49
4.7 Analytic procedure
Question 1: Items in teacher questionnaire B question 1 regarding the frequency of engaging in
teacher-directed whole class activities and child-initiated activities, and items in teacher
questionnaire A question 28 and 31 regarding the teachers’ reading and math instructional
practices were used to define the developmental and didactic teaching practices. Multigroup
confirmatory factor analysis was used to examine the dimensionality of these items across high
and low SES classrooms. After establishing the dimensionality, the latent factor scores were
extracted and used for further analysis. A two-step cluster analysis was used to examine the
natural groupings of teachers based on the factor scores.
Question 2: To examine the school, teacher, and child characteristics associated with each type
of kindergarten program, a series of bivariate analyses (chi-square for categorical variables and
ANOVA for continuous variables) were run using variables from the school and teacher
questionnaires as well as parent interviews that might theoretically explain the reasons for
adopting one approach to kindergarten over another. The list of these covariates is found in
Appendix A.
Question 3: The third research question examined the interrelationship among time allocation,
classroom practice, and SES. Firstly, to examine whether socioeconomic status was related to
the prevalence of the different types of programs, I performed a 2 x 4 contingency table analysis.
Secondly, a two-way analysis of variance was used to examine whether kindergarten program
and SES each had a main effect and jointly had an interaction effect on time allocation. Finally, a
two-way multivariate analysis of variance was used to investigate whether kindergarten program
and SES was related to the time spent on individual subjects and activities in kindergarten.
50
Question 4: For the fourth question, regarding the causal effect of receiving different types of
kindergarten program on children’s end-of-kindergarten and longitudinal outcome, I ran a series
of three-level cross-sectional hierarchical linear models with and without applying the marginal
mean weighting with stratification (MMW-S) method to adjust for the imbalance in the
pretreatment covariates associated with the treatment groups due to observational data.
The MMW-S method is based on Rubin’s causal model and is a non-parametric extension of the
propensity score stratification methods (Hong, 2012). I will describe Rubin’s causal model and
the MMW-S method, followed by the specification of the hierarchical linear models.
4.7.1 Rubin's Causal Model
The current research is based on Rubin's causal model (also known as the counterfactual model
or potential outcomes framework; Rubin, 1978), which provides a framework for examining the
causal effect of treatment using observational data. In an ideal scenario, a researcher would
have all the units participating in the study be assigned to the treatment conditions at random.
When a unit is assigned to one of the treatment conditions, the potential outcomes associated
with all other treatment conditions will become counterfactual and missing. This is known as the
“fundamental problem of causal inference” (Holland, 1986).
When units are randomly assigned to treatments, it becomes possible to draw inferences about
the average causal effect for a population of units, although it is impossible to estimate the causal
effect of a specific unit. The average causal effect can be considered equivalent to the expected
difference when all the units in the population were assigned to the treatment group and when all
the units in the population were assigned to the control group. Random assignment balances
both the observed and the unobserved pretreatment covariates across all the treatments and thus
51
eliminates alternative explanations except for the effect of the treatment (the treatment
assignment becomes independent of the potential outcomes).
Observational studies pose a unique challenge to causal inference for two reasons: First, due to
the potential influence of the unobserved pretreatment covariates, and second, due to the large
number of observed pretreatment covariates that distinguish the groups. Selection bias becomes
a concern if the groups differ in systematic ways prior to treatment assignment and the pre-
existing differences have the potential to contaminate the estimation of the treatment
effect. Rubin’s causal model provides a framework for adjusting for the imbalance in the
pretreatment covariates among the groups and thus making causal inference possible using
observational data under specific assumptions.
There are three major assumptions associated with Rubin’s causal model. The first assumption
is that each unit has a non-zero probability of being assigned to each of the treatment
conditions. The second assumption is that each unit has only one potential outcome
corresponding to each treatment, and this potential outcome is not influenced by the assignment
mechanism or the treatments the other units are assigned to. In other words, there is only one
potential outcome per treatment for each unit. This is called the stable unit treatment value
assumption, or SUTVA (Rubin, 1978). In educational settings, this assumption is frequently
violated due to the interdependence among units. For example, a child’s end of the year reading
outcome could be influenced, not only by the treatment variable, but also by who was assigned to
the same treatment (e.g., a disruptive child present in the classroom). If this was the case, the
child would have multiple outcomes within the same treatment, which would violate the
SUTVA.
52
The third assumption is that, given a set of observed pretreatment covariates, the treatment
assignment is conditionally independent of the potential outcomes. This is called the ignorability
assumption and relates to the hidden bias in the treatment assignment mechanism due to the
unobserved covariates. It assumes that the observed covariates capture all relevant information
about the treatment assignment and thus the unobserved covariates can be ignored. With a
reasonably large number of variables in the dataset, the strong ignorability assumption becomes
increasingly plausible. To assess the possibility of major unmeasured covariates affecting the
results, sensitivity analysis can be used.
Rosenbaum and Rubin (1983) devised methods for using propensity scores to adjust for a large
number of observed pretreatment covariates in observational data. A propensity score is defined
as the probability of a unit being assigned to a particular treatment given a set of pretreatment
covariates. By statistically adjusting for the propensity score, selection bias associated with the
selected set of observed pretreatment covariates could be removed. Namely, when the treatment
and control groups have the same propensity score, it is expected that the groups will have the
same joint distribution on all of the pretreatment covariates included in the propensity score
(Rosenbaum & Rubin, 1984).
4.7.2 Marginal Mean Weighting with Stratification (MMW-S) Method
For binary treatments, propensity score matching or stratification is a viable method for adjusting
for the pretreatment differences in observed covariates, thus approximating a randomized
experiment. However, propensity score matching and stratification become increasingly
cumbersome and infeasible when applied to multivalued or multiple treatments. The inverse
probability of treatment weighting (IPTW) method is sometimes used in cases of multivalued
treatments. IPTW weighs each unit with the inverse of the propensity for receiving the treatment
53
actually received (Robins, 1999; Rosenbaum, 1987). However, IPTW is known to be sensitive
to model misspecification, which will reduce precision and potentially increase bias, especially
when only a portion of the sample provides support for causal inference (Hong, 2010).
To address the issue, marginal mean weighting with stratification (MMW-S) was devised as a
nonparametric weighting method that combines the strengths of propensity score stratification
and IPTW methods (Hong, 2010, 2012). Similar to propensity score stratification, MMW-S uses
the estimated propensity score for a given treatment to stratify the sample. However, rather than
computing the treatment effect within each strata, MMW-S computes weights for each of the
treated units based on its representation within each stratum. Under the strong ignorability
assumption, the weighted mean difference between the treatment and control groups would
approximate the mean difference in outcome in a randomized experiment.
There are 7 major steps for applying the MMW-S method to observational data:
1. Creating a list of pretreatment covariates
2. Building the propensity score model
3. Identifying the analytic sample
4. Stratifying the analytic sample
5. Computing the marginal mean weight
6. Checking balance in the observed pretreatment covariates across treatment groups with
weighting, and
7. Estimating the treatment effect using the marginal mean weight.
54
Each of these steps will be described in detail below.
Step 1: Creating a List of Pretreatment Covariates
The first step of data preparation was to create a list of candidate pretreatment covariates that
would potentially predict both the treatment and the outcome (confounders) based on time
precedence and theory. These candidate pretreatment covariates and all outcomes were then
subject to multiple imputation procedures for high and low SES groups separately. One of the
imputed datasets was used for the analysis. For categorical variables, I created missing
indicators and no imputations were performed. For continuous variables, I created missing
indicators and multiple imputation procedures were performed. Upon completion of the data
imputation step, all candidate pretreatment covariates were aggregated to the teacher level and
bivariate associations between the treatment group membership and the continuous and
categorical pretreatment covariates were run.
Step 2: Building the Propensity Score Model
I used all the pretreatment covariates that were found to be significant in the series of bivariate
associations in the previous step to build the propensity score model. The list of covariates that
were entered in the propensity score model can be found in Appendix A. A multinomial logistic
regression was run to build the propensity score model for the high and low SES groups
separately. The estimated propensity scores obtained from the multinomial logistic regression
were saved and converted to the logit scale for each of the four treatment conditions.
Step 3: Identifying the Analytic Sample
55
To identify the analytic sample, I obtained the maximum and the minimum values on the
estimated logit propensity score for each of the treatment groups and added a caliper of 0.2
standard deviation of the logit propensity score to both sides of the spectrum as recommended by
Austin (2011). Teachers who had no corresponding counterparts in alternative treatment groups
were excluded from the analyses. This is because these teachers would have no counterfactual
outcomes in the observed data and, therefore, lack empirical basis for causal inferences. Teachers
who fell outside of this overlapping range on the logit propensity score were dropped from
subsequent analysis.
Step 4: Stratifying the Sample on the Estimated Logit Propensity Score
For all the teachers in the analytic sample, I sorted the estimated logit propensity scores for each
of the treatment groups in an ascending order one at a time and then divided the sample into 6
strata with equal proportion of units. For example, to calculate the weights for classes that
adopted the developmental program, the entire sample was sorted and stratified on the logit
propensity score for the developmental program. The weights for the classes adopting the other
programs were calculated in a similar fashion. In each stratum, the distribution of the observed
pretreatment covariates is expected to be equal between those who were assigned to the
particular treatment and the rest of the sample (Hong, 2012). When this was not the case, I re-
stratified the whole analytic sample until 95% of the observed pretreatment covariates were
balanced. Previous research has shown that dividing the sample into five or six strata would
typically remove 90% of the selection bias, although with larger samples, more strata may be
required (Cochran, 1968; Rosenbaum & Rubin, 1983, 1984). Six strata were sufficient for
balancing the pretreatment covariates for each of the logit propensity score corresponding to
each treatment.
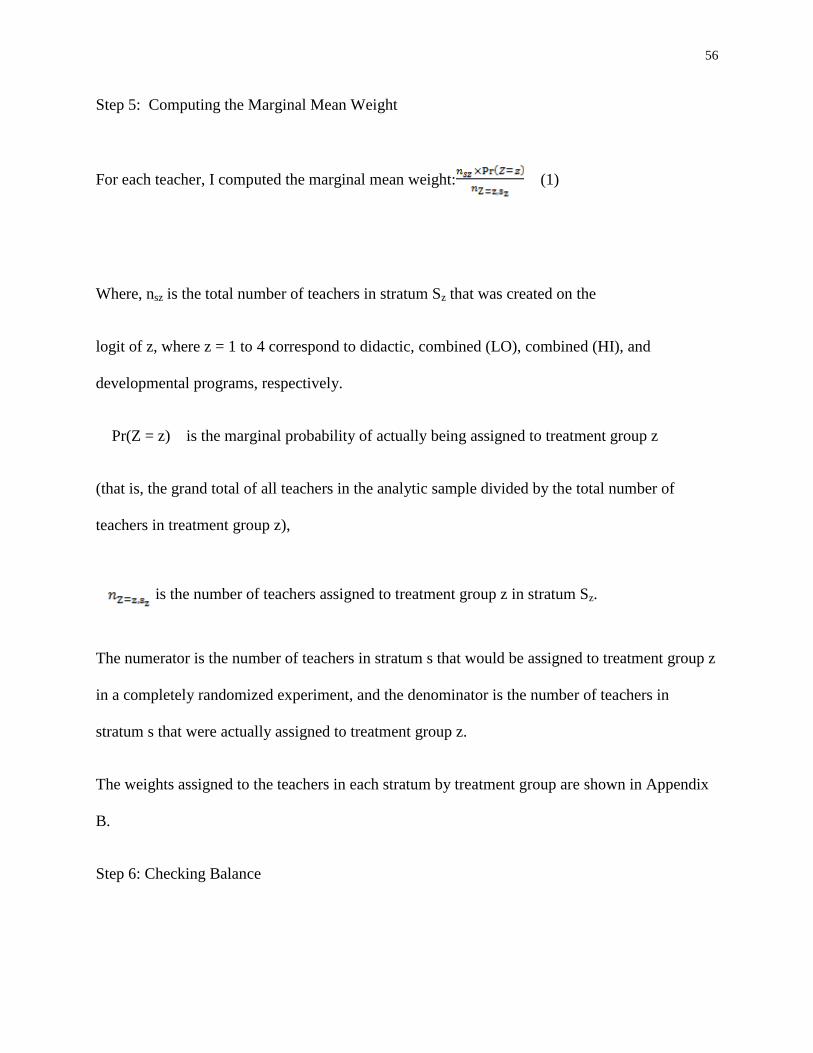
56
Step 5: Computing the Marginal Mean Weight
For each teacher, I computed the marginal mean weight: (1)
Where, nsz is the total number of teachers in stratum Sz that was created on the
logit of z, where z = 1 to 4 correspond to didactic, combined (LO), combined (HI), and
developmental programs, respectively.
Pr(Z = z) is the marginal probability of actually being assigned to treatment group z
(that is, the grand total of all teachers in the analytic sample divided by the total number of
teachers in treatment group z),
is the number of teachers assigned to treatment group z in stratum Sz.
The numerator is the number of teachers in stratum s that would be assigned to treatment group z
in a completely randomized experiment, and the denominator is the number of teachers in
stratum s that were actually assigned to treatment group z.
The weights assigned to the teachers in each stratum by treatment group are shown in Appendix
B.
Step 6: Checking Balance
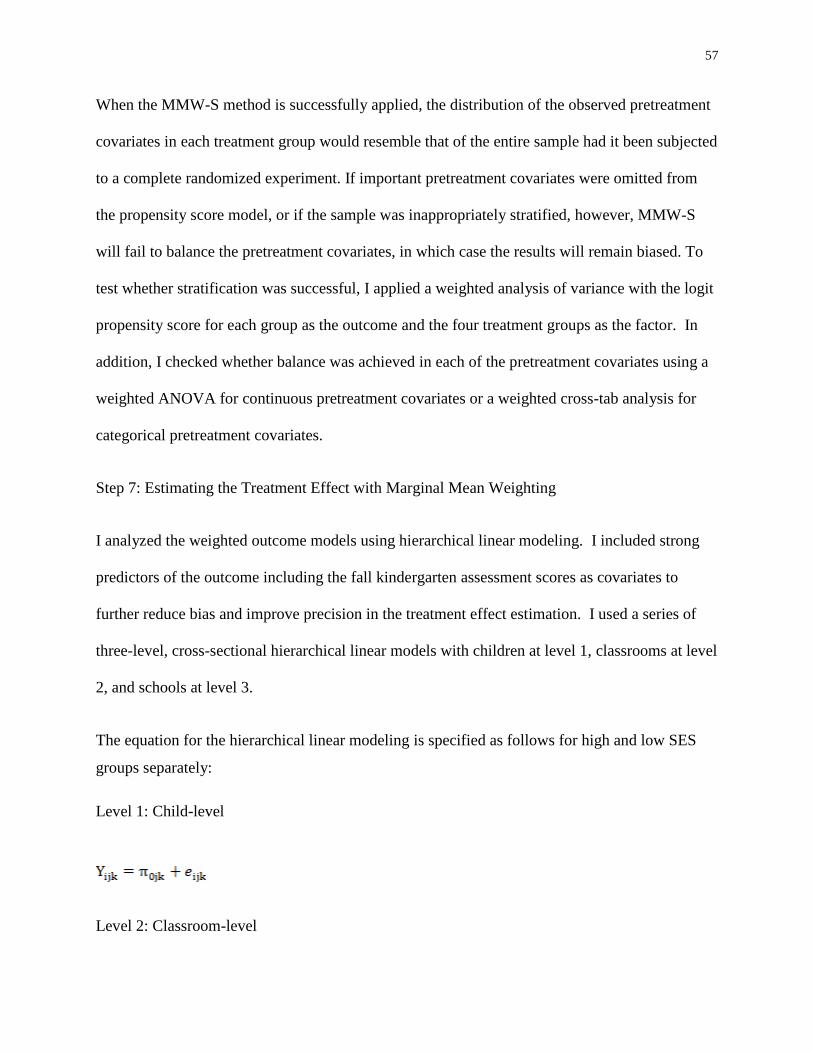
57
When the MMW-S method is successfully applied, the distribution of the observed pretreatment
covariates in each treatment group would resemble that of the entire sample had it been subjected
to a complete randomized experiment. If important pretreatment covariates were omitted from
the propensity score model, or if the sample was inappropriately stratified, however, MMW-S
will fail to balance the pretreatment covariates, in which case the results will remain biased. To
test whether stratification was successful, I applied a weighted analysis of variance with the logit
propensity score for each group as the outcome and the four treatment groups as the factor. In
addition, I checked whether balance was achieved in each of the pretreatment covariates using a
weighted ANOVA for continuous pretreatment covariates or a weighted cross-tab analysis for
categorical pretreatment covariates.
Step 7: Estimating the Treatment Effect with Marginal Mean Weighting
I analyzed the weighted outcome models using hierarchical linear modeling. I included strong
predictors of the outcome including the fall kindergarten assessment scores as covariates to
further reduce bias and improve precision in the treatment effect estimation. I used a series of
three-level, cross-sectional hierarchical linear models with children at level 1, classrooms at level
2, and schools at level 3.
The equation for the hierarchical linear modeling is specified as follows for high and low SES
groups separately:
Level 1: Child-level
Level 2: Classroom-level
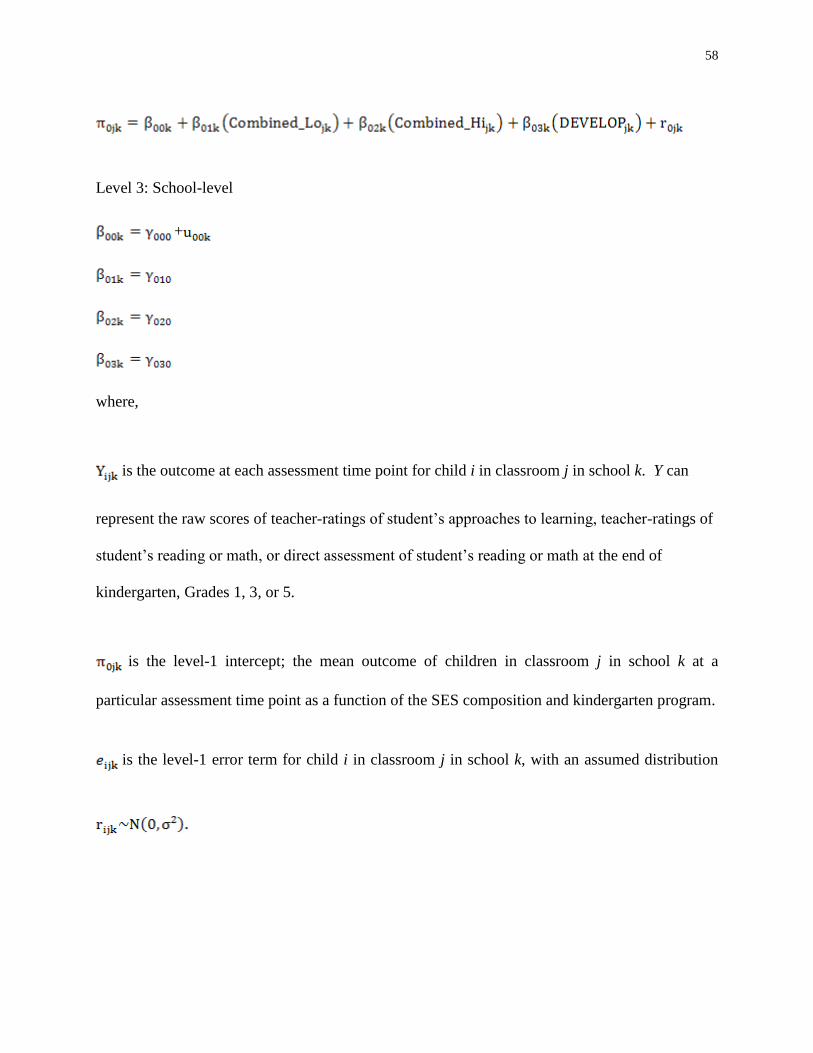
58
Level 3: School-level
+
where,
is the outcome at each assessment time point for child i in classroom j in school k. Y can
represent the raw scores of teacher-ratings of student’s approaches to learning, teacher-ratings of
student’s reading or math, or direct assessment of student’s reading or math at the end of
kindergarten, Grades 1, 3, or 5.
is the level-1 intercept; the mean outcome of children in classroom j in school k at a
particular assessment time point as a function of the SES composition and kindergarten program.
is the level-1 error term for child i in classroom j in school k, with an assumed distribution
59
is the level-2 intercept, which is the mean outcome for didactic classrooms in school k when
SES composition is given.
is the coefficient associated with the combined(LO) kindergarten classrooms in school k
when SES composition is given.
is the coefficient associated with the combined(HI) kindergarten classrooms in school k
when SES composition is given.
is the coefficient associated with the developmental kindergarten classrooms in school k
when SES composition is given.
is the level-2 error term, which is assumed to be normally distributed with a mean of 0 and
variance , i.e., .
is the level-3, school-level intercept.
is the level-3 error term, which is assumed to be normally distributed with a mean of 0 and
variance .
60
, , and represent the level-3 fixed effects associated with the level-2 coefficients
, , and respectively.
61
Chapter 3 Results
5 Question 1: Teacher Groupings Based on Didactic and Developmental Teaching Practices
The first research question examined how the U.S. kindergarten teachers of the 1998-1999
school year can be categorized based on their developmental and didactic teaching practices.
The correlations of the variables used for the confirmatory factor analysis are shown in Table 5.
The correlation matrices of the high and low SES classrooms do not appear to differ
considerably. In both SES groups, there were positive and significant, but low correlations
among the variables related to didactic instruction; namely, there were correlations among the
variables regarding how often the teachers engaged in teacher-directed whole class activities,
used reading workbooks and worksheets and used math workbooks and worksheets. There were
also positive and significant, but low correlations among the items corresponding to
developmental practices; namely, there were correlations among variables concerning child-
selected activities, reading and math peer tutoring, choosing books to read, writing with invented
spelling, handling geometric manipulatives, counting manipulatives, playing math games and
solving real-life math. There were negative correlations observed among the items
corresponding to didactic instruction and the items corresponding to developmental instruction3.
A two-factor model with developmental and didactic practices as latent factors was specified for
the multi-group confirmatory factor analysis as specified in Figure 1. A multi-group comparison
3 The reliability of the didactic and developmental dimensions were .58 and .73 respectively.
62
was performed to examine whether the same two factor model holds for both the high and low
SES classrooms. The first unconstrained model imposed no constraints to the model parameters
between the high and low SES groups. The second model constrained the measurement weights
to be equal between the two groups. Building on the second model, the third model further
constrained the structural covariances to be equal. The final model constrained the measurement
weights, structural covariances, and measurement residuals to be equal.
When evaluating model fit, the chi-square statistic is known to be very sensitive, especially with
large sample sizes, and not very practical when testing either the model fit or the relative fit of
the nested equivalence models. Thus, three model fit indices were examined alongside the chi-
square test: the Root Mean Squared Error of Approximation (RMSEA), the Comparative Fit
Index (CFI), and the Goodness of Fit Index (GFI). As a rule of thumb, RMSEA values between
0.06 and 0.08 are considered good fit, whereas values below 0.06 are considered excellent fit
(Hu & Bentler, 1999). For GFI and CFI, values greater than 0.90 are considered good model fit
and values greater than or equal to 0.95 are considered excellent fit (Bentler, 1990, Hoyle, 1995).
In addition to examining the difference in chi-squares among the nested models, the change in
CFI less than or equal to -0.01 was used as the criterion for examining the relative fit of the
nested equivalence models (Cheung & Rensvold, 2002).
The chi-square values and their degrees of freedom, the RMSEA, GFI and CFI goodness-of-fit
indices, as well as CFI change for each of the invariance models are presented in Table 6.
Although the chi-square statistic for each of the models was statistically significant, RMSEA,
GFI, and CFI demonstrate adequate fit to the data. For each of the models, RMSEA values were
below 0.03 and GFI values were approximately 0.95, indicating excellent model fit. CFI values,
although slightly lower, were all approximately 0.91, indicating good fit.
63
A comparison across the nested models shows that only one of the chi-square changes was
statistically significant. The model with measurement residuals was the only model that had a
significant chi-square change (in comparison with the structural covariances model: Δ χ²(15, N =
1581) = 30.82, p < .01). All four models showed adequate fit when using the criterion of CFI
change (i.e., Δ CFI less than or equal to -0.01), indicating that all observed parameters can be
considered invariant between the high and low SES classrooms.
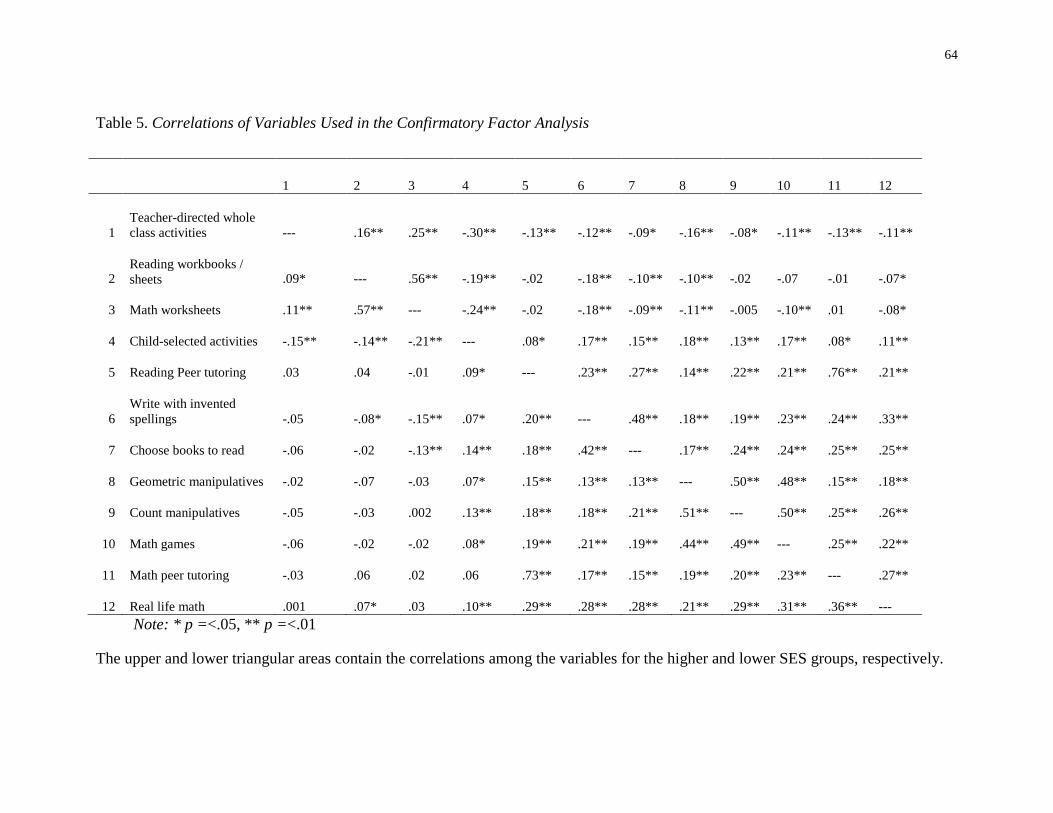
64
Table 5. Correlations of Variables Used in the Confirmatory Factor Analysis
1 2 3 4 5 6 7 8 9 10 11 12
1
Teacher-directed whole
class activities --- .16** .25** -.30** -.13** -.12** -.09* -.16** -.08* -.11** -.13** -.11**
2 Reading workbooks /
sheets .09* --- .56** -.19** -.02 -.18** -.10** -.10** -.02 -.07 -.01 -.07*
3 Math worksheets .11** .57** --- -.24** -.02 -.18** -.09** -.11** -.005 -.10** .01 -.08*
4 Child-selected activities -.15** -.14** -.21** --- .08* .17** .15** .18** .13** .17** .08* .11**
5 Reading Peer tutoring .03 .04 -.01 .09* --- .23** .27** .14** .22** .21** .76** .21**
6
Write with invented
spellings -.05 -.08* -.15** .07* .20** --- .48** .18** .19** .23** .24** .33**
7 Choose books to read -.06 -.02 -.13** .14** .18** .42** --- .17** .24** .24** .25** .25**
8 Geometric manipulatives -.02 -.07 -.03 .07* .15** .13** .13** --- .50** .48** .15** .18**
9 Count manipulatives -.05 -.03 .002 .13** .18** .18** .21** .51** --- .50** .25** .26**
10 Math games -.06 -.02 -.02 .08* .19** .21** .19** .44** .49** --- .25** .22**
11 Math peer tutoring -.03 .06 .02 .06 .73** .17** .15** .19** .20** .23** --- .27**
12 Real life math .001 .07* .03 .10** .29** .28** .28** .21** .29** .31** .36** ---
Note: * p =<.05, ** p =<.01
The upper and lower triangular areas contain the correlations among the variables for the higher and lower SES groups, respectively.
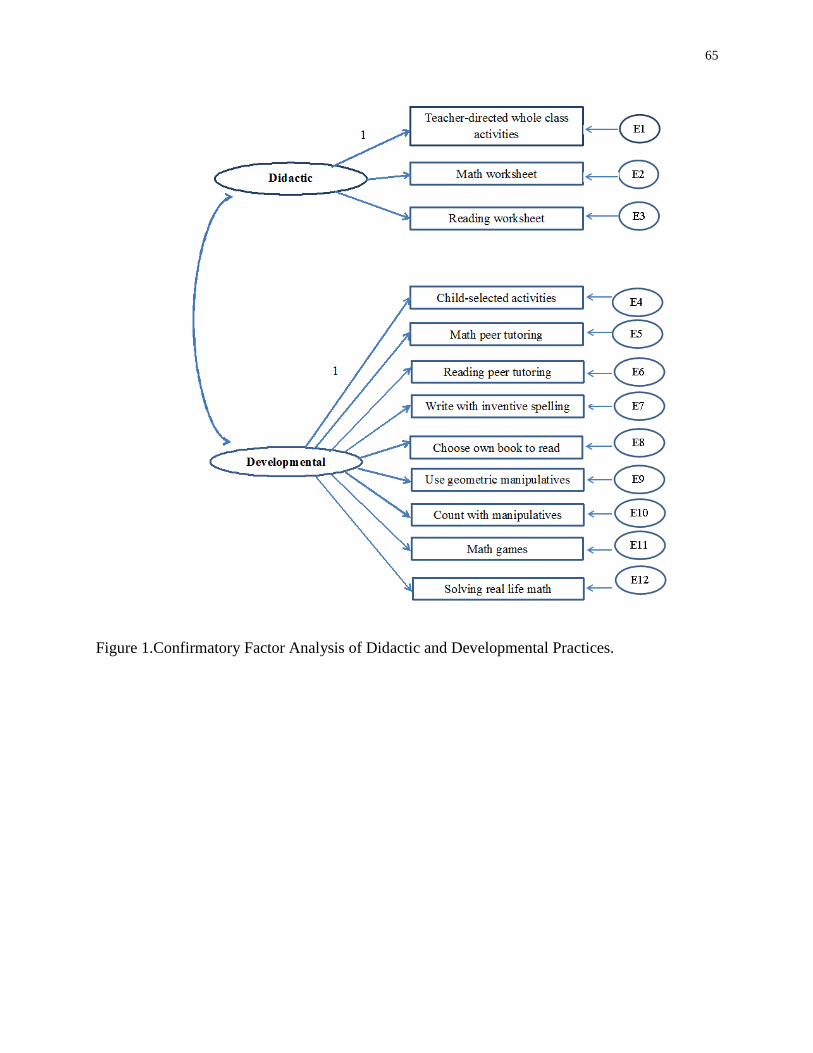
65
Figure 1.Confirmatory Factor Analysis of Didactic and Developmental Practices.
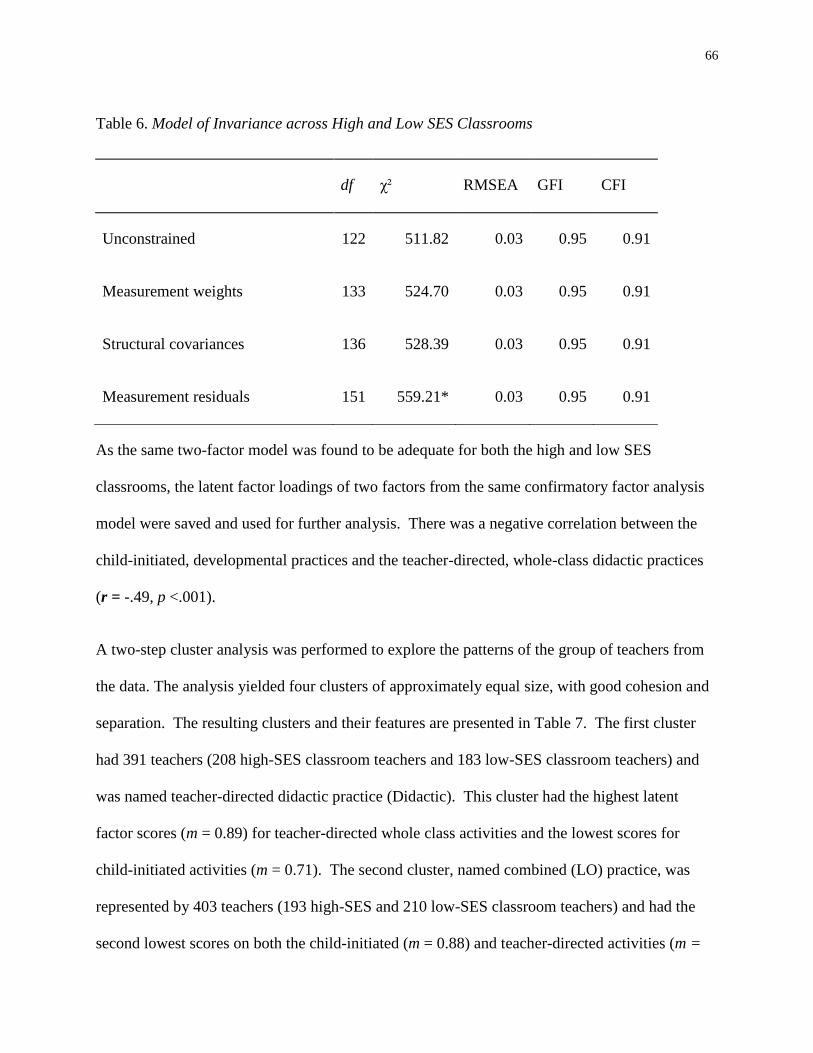
66
Table 6. Model of Invariance across High and Low SES Classrooms
df χ² RMSEA GFI CFI
Unconstrained 122 511.82 0.03 0.95 0.91
Measurement weights 133 524.70 0.03 0.95 0.91
Structural covariances 136 528.39 0.03 0.95 0.91
Measurement residuals 151 559.21* 0.03 0.95 0.91
As the same two-factor model was found to be adequate for both the high and low SES
classrooms, the latent factor loadings of two factors from the same confirmatory factor analysis
model were saved and used for further analysis. There was a negative correlation between the
child-initiated, developmental practices and the teacher-directed, whole-class didactic practices
(r = -.49, p <.001).
A two-step cluster analysis was performed to explore the patterns of the group of teachers from
the data. The analysis yielded four clusters of approximately equal size, with good cohesion and
separation. The resulting clusters and their features are presented in Table 7. The first cluster
had 391 teachers (208 high-SES classroom teachers and 183 low-SES classroom teachers) and
was named teacher-directed didactic practice (Didactic). This cluster had the highest latent
factor scores (m = 0.89) for teacher-directed whole class activities and the lowest scores for
child-initiated activities (m = 0.71). The second cluster, named combined (LO) practice, was
represented by 403 teachers (193 high-SES and 210 low-SES classroom teachers) and had the
second lowest scores on both the child-initiated (m = 0.88) and teacher-directed activities (m =
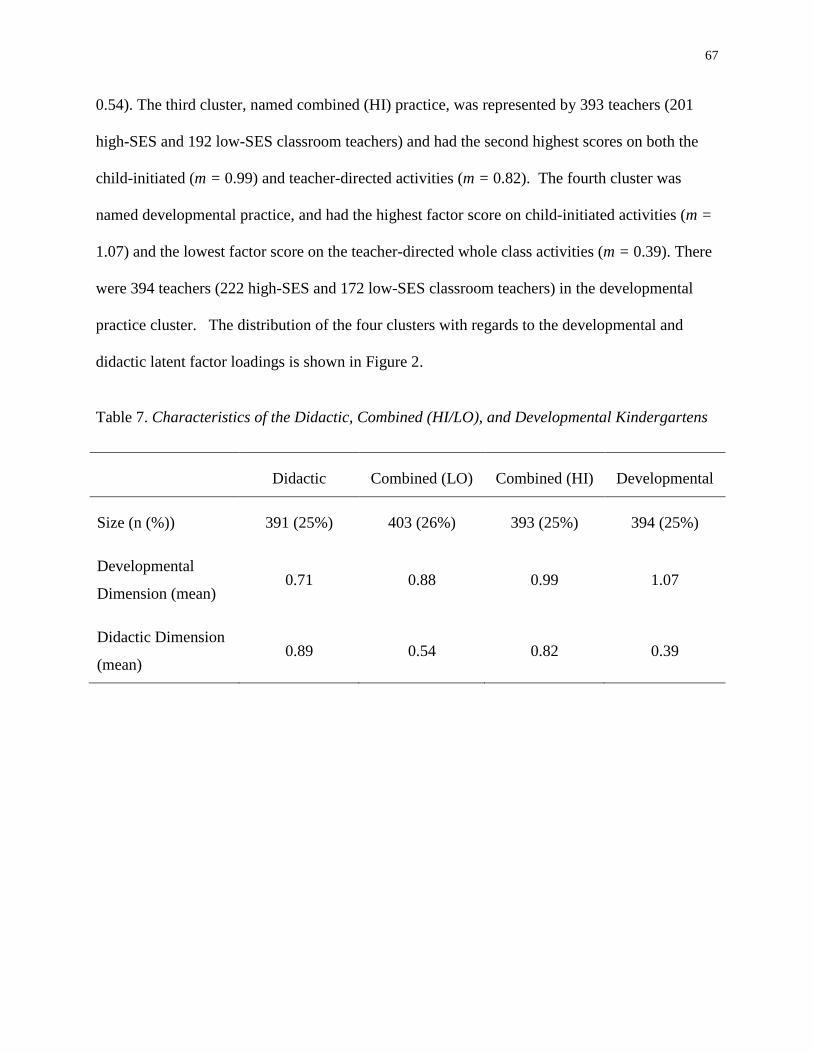
67
0.54). The third cluster, named combined (HI) practice, was represented by 393 teachers (201
high-SES and 192 low-SES classroom teachers) and had the second highest scores on both the
child-initiated (m = 0.99) and teacher-directed activities (m = 0.82). The fourth cluster was
named developmental practice, and had the highest factor score on child-initiated activities (m =
1.07) and the lowest factor score on the teacher-directed whole class activities (m = 0.39). There
were 394 teachers (222 high-SES and 172 low-SES classroom teachers) in the developmental
practice cluster. The distribution of the four clusters with regards to the developmental and
didactic latent factor loadings is shown in Figure 2.
Table 7. Characteristics of the Didactic, Combined (HI/LO), and Developmental Kindergartens
Didactic Combined (LO) Combined (HI) Developmental
Size (n (%)) 391 (25%) 403 (26%) 393 (25%) 394 (25%)
Developmental
Dimension (mean) 0.71 0.88 0.99 1.07
Didactic Dimension
(mean) 0.89 0.54 0.82 0.39
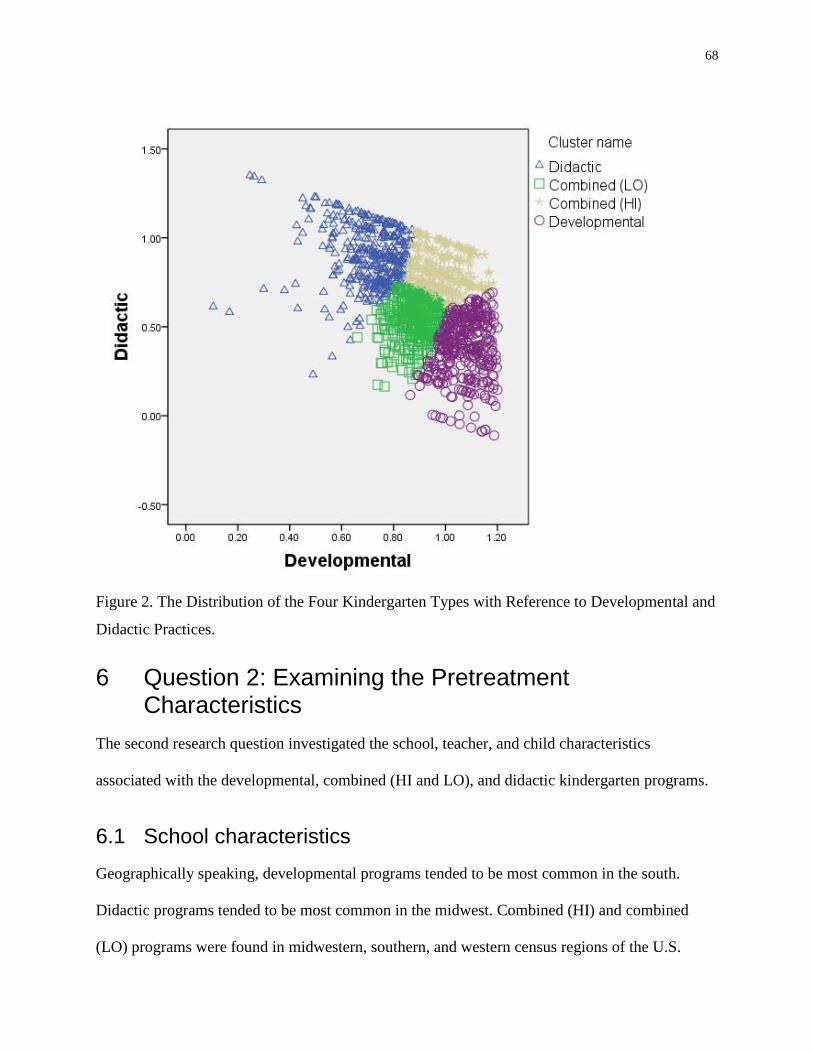
68
Figure 2. The Distribution of the Four Kindergarten Types with Reference to Developmental and
Didactic Practices.
6 Question 2: Examining the Pretreatment Characteristics
The second research question investigated the school, teacher, and child characteristics
associated with the developmental, combined (HI and LO), and didactic kindergarten programs.
6.1 School characteristics
Geographically speaking, developmental programs tended to be most common in the south.
Didactic programs tended to be most common in the midwest. Combined (HI) and combined
(LO) programs were found in midwestern, southern, and western census regions of the U.S.
69
The school principals of high SES combined (HI) programs tended to be highly educated, many
of them having a master’s degree. The schools with low-SES combined (HI) programs, on the
other hand, were more likely to be public schools located in a large city, receiving Title I funding
for the entire education program.
6.2 Teacher characteristics
As expected, teacher certification and course-taking were related to the types of kindergarten
programs the teachers adopt. The teachers who taught the developmental programs were more
likely to be certified in early childhood education and have taken more courses in child
development and early education, irrespective of classroom SES. Additionally, teachers of high-
SES developmental programs tended to have spent more years teaching preschool than teachers
of other types of programs.
The teachers of didactic programs, on the other hand, were less likely to be certified in early
childhood education and tended to have taken fewer courses in child development and early
childhood education, irrespective of classroom SES. Moreover, the teachers of low-SES didactic
programs were more likely to have spent a longer time teaching Grade 6 and above.
The teachers of combined (HI) programs were more likely to be certified in elementary school
education, and less likely to be certified in early childhood education, irrespective of classroom
SES. Compared to the teachers of didactic programs, the combined (HI) teachers were more
likely to have taken more courses in early childhood education and reading pedagogy. The
teachers of high-SES combined (LO) programs, on the other hand, were found to have taken
fewer child development and early childhood education courses, compared to the teachers of
developmental programs.
70
There were notable characteristics in the teachers’ kindergarten readiness beliefs and
expectations for what their kindergarteners should learn based on their teaching practices. There
were significant differences in the teachers’ beliefs about behavioral and academic requirements
to enter kindergarten. The teachers of the Combined (HI) programs were most likely to consider
knowing English as a prerequisite to attending kindergarten. In addition, in low SES classrooms,
Combined (HI) program teachers were more likely than other teachers to consider counting up to
20 or more and knowing the names of colors and shapes as important skills to acquire prior to
kindergarten. In both the low and high SES classrooms, there were no significant differences
among the teachers of the four kindergarten programs on the socioemotional and communicative
aspects of kindergarten readiness such as expecting their children to be able to finish tasks, take
turns, share, solve problems, be sensitive to others, follow directions, and tell teachers their
needs and thoughts.
Teacher beliefs about the benefit of preschool education and expectations of what children
should learn in kindergarten also differed among kindergarten programs. Combined (HI) teachers
tended to believe, more than other teachers, that preschool reading and math was beneficial for
school. Combined (HI) teachers were also more likely than other teachers to believe that
children should learn how to read in kindergarten and that parents should assist their children’s
schoolwork at home. Teachers of developmental programs, on the other hand, were less likely to
agree that preschool reading and math programs were beneficial for school, that the children
should know the alphabet before kindergarten, and that the children should learn to read in
kindergarten. There were no significant differences among the teachers, however, regarding
whether the parents should read to their children and play math games with their children.
71
In the high SES condition, the developmental and combined(HI) programs were more likely to
cover more advanced academic content than were the didactic and combined(LO) programs. In
reading and language arts, for example, the students in the high SES developmental and
combined(HI) programs were more likely to be taught how to read multi-syllable words, identify
the main idea of a story and make predictions, use punctuation, and compose stories during
kindergarten than the students in the high SES didactic and combined(LO) programs were.
Similarly, in math, teachers of the high SES developmental and combined(HI) programs were
more likely to cover content such as counting by 2’s, 5’s, and 10’s, how to use measurement
instruments accurately, estimating quantities, and adding two-digit numbers than were the high
SES didactic and combined(LO) programs. The teachers of the high SES didactic and
combined(LO) program indicated that these more advanced skills should be taught at a higher
grade level. In the low SES condition, however, no such differences in content coverage were
observed among the four kindergarten programs.
6.3 Child characteristics
Irrespective of socioeconomic status, children attending developmental programs showed more
readiness for academic teaching compared to the didactic, combined(LO) and combined(HI)
groups. They received higher scores in the direct assessment and teacher rating of general
knowledge at the beginning of kindergarten, and, children attending high-SES developmental
programs in particular, were rated by their teachers as being less impulsive and as having better
interpersonal relationships at the beginning of kindergarten.
On the other hand, children attending didactic classrooms seemed less ready, as they were more
likely to receive lower scores in general knowledge at the beginning of kindergarten compared to
the children attending developmental programs. In high-SES classrooms in particular, children
72
attending didactic classrooms were rated by their teachers as being more impulsive and having
lower self-control than children in developmental programs.
Similarly, children attending combined (HI) programs were more likely to score significantly
lower on general knowledge compared to children in developmental programs, irrespective of
SES. Children of high-SES combined (LO) programs also scored lower in general knowledge
and self-control at the beginning of kindergarten, compared to the children attending high-SES
developmental programs.
The Limited English Proficient (LEP) students were most likely to be assigned to didactic
programs if they were high SES, or to the combined (LO) programs if they were low SES. There
also tended to be a higher percentage of Hispanic / Latino teachers in the low-SES combined
(LO) programs. Within the low-SES condition, the developmental program had the fewest
Hispanic/Latino students. Low-SES developmental programs had about 5-10 % African
American students.
In sum, there were significant differences in the demographic characteristics at the school,
teacher, and child levels for the four types of kindergarten programs. Most notably, school
funding, teacher beliefs, teacher education, certification type, and experience, student academic
and social skills were associated with the types of kindergarten program the children will
receive. Schools that were receiving Title I funding for the entire education were more likely to
adopt a combined(HI) program that provides a high dosage of both the didactic and
developmental practices. Teachers who had taken more courses in child development, held early
childhood education certifications, and had more experience with preschool education were more
likely to choose a developmental approach to kindergarten. Teachers who held elementary
73
school education certification and had more experience with teaching Grade 6 and up, on the
other hand, were more likely to adopt a combined(HI) approach. Teachers who had taken fewer
courses in child development were more likely to provide didactic instruction. Advantaged
students with higher academic and social skills at the beginning of kindergarten were more likely
to receive the developmental approach to kindergarten, and less advantaged students were likely
to receive other types of programs including the combined(LO), combined(HI), or didactic
programs. These pre-existing differences in demographic characteristics, if not controlled for
statistically, are also likely to confound the true effects of kindergarten programs.
7 Question 3: Examining the Inter-relationships among Time Allocation, Kindergarten Program, and SES
The third research question examined the interrelationship among time allocation, kindergarten
program, and SES. Firstly, I ran a contingency table analysis to investigate whether there is a
difference in the distribution of kindergarten program types as a function of classroom
socioeconomic status. Secondly, I examined how time allocated for academic subjects differed
as a function of program types and classroom socioeconomic status using a two-way ANOVA.
Thirdly, I ran a multivariate analysis of variance to examine the relationship among kindergarten
programs, SES, and time allocation by dividing the time allocation variable into separate subjects
and activities.
The 2 (low or high SES) by 4 (kindergarten programs) contingency table analysis showed no
significant associations between SES and kindergarten program types, χ2(3, N =1581) = 6.04, p
= .11. This indicates that low and high SES classrooms were not significantly different from
each other in their choices of which of the four programs to adopt.
74
The means and standard deviations for the time allocation for academic subjects by kindergarten
type and SES are presented in Table 8. With the proportion of time allocated to academic
subjects as the outcome variable, the ANOVA showed a significant main effect for SES. Low
SES classrooms allocated significantly more time to academic subjects than did the high SES
classrooms, F (1, 1526) = 23.45, p <.001. The total time (in minutes) spent in school per day on
reading, math, social studies, science, music, art, dance, theatre, ESL, foreign language, recess
and lunch differed among the four programs. Regardless of SES, the developmental and
combined(HI) programs were more likely to spend more time on these activities than were the
didactic and combined(LO) programs. However, the variability in the developmental and
combined(HI) programs was greater than those in the didactic and combined(LO) programs.
Although this general trend was observed in both the high and low SES classrooms, statistical
significance was observed only for the high SES classrooms, (F(3, 1389) = 30.41, p <.001), and
not for the low SES classrooms (F(3, 147) = 1.97, p =.12. There was also a significant main
effect for kindergarten program types. A post-hoc test showed that the Combined (HI)
kindergartens allocated significantly more time to teaching academic subjects, compared to the
other types of kindergartens, F(3, 1526) =5.68, p =.001.
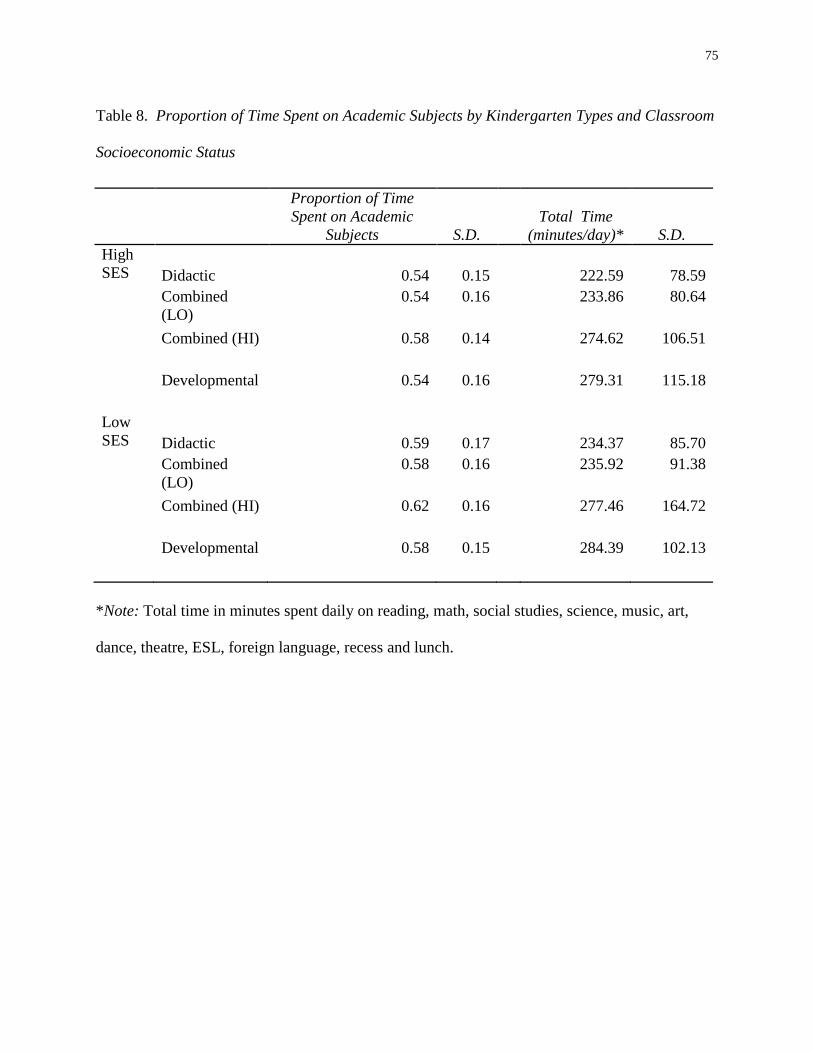
75
Table 8. Proportion of Time Spent on Academic Subjects by Kindergarten Types and Classroom
Socioeconomic Status
Proportion of Time
Spent on Academic
Subjects S.D.
Total Time
(minutes/day)* S.D.
High
SES
Didactic 0.54 0.15 222.59 78.59
Combined
(LO)
0.54 0.16 233.86 80.64
Combined (HI) 0.58 0.14 274.62 106.51
Developmental 0.54 0.16 279.31 115.18
Low
SES
Didactic 0.59 0.17 234.37 85.70
Combined
(LO)
0.58 0.16 235.92 91.38
Combined (HI) 0.62 0.16 277.46 164.72
Developmental 0.58 0.15 284.39 102.13
*Note: Total time in minutes spent daily on reading, math, social studies, science, music, art,
dance, theatre, ESL, foreign language, recess and lunch.
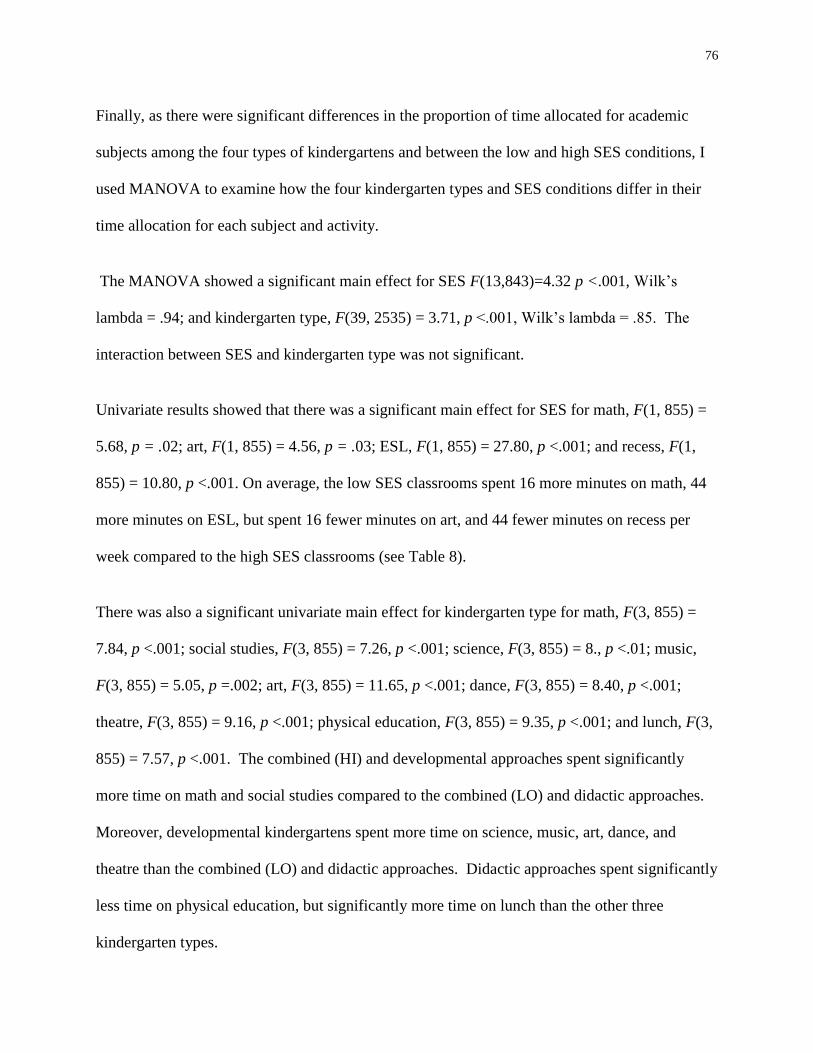
76
Finally, as there were significant differences in the proportion of time allocated for academic
subjects among the four types of kindergartens and between the low and high SES conditions, I
used MANOVA to examine how the four kindergarten types and SES conditions differ in their
time allocation for each subject and activity.
The MANOVA showed a significant main effect for SES F(13,843)=4.32 p <.001, Wilk’s
lambda = .94; and kindergarten type, F(39, 2535) = 3.71, p <.001, Wilk’s lambda = .85. The
interaction between SES and kindergarten type was not significant.
Univariate results showed that there was a significant main effect for SES for math, F(1, 855) =
5.68, p = .02; art, F(1, 855) = 4.56, p = .03; ESL, F(1, 855) = 27.80, p <.001; and recess, F(1,
855) = 10.80, p <.001. On average, the low SES classrooms spent 16 more minutes on math, 44
more minutes on ESL, but spent 16 fewer minutes on art, and 44 fewer minutes on recess per
week compared to the high SES classrooms (see Table 8).
There was also a significant univariate main effect for kindergarten type for math, F(3, 855) =
7.84, p <.001; social studies, F(3, 855) = 7.26, p <.001; science, F(3, 855) = 8., p <.01; music,
F(3, 855) = 5.05, p =.002; art, F(3, 855) = 11.65, p <.001; dance, F(3, 855) = 8.40, p <.001;
theatre, F(3, 855) = 9.16, p <.001; physical education, F(3, 855) = 9.35, p <.001; and lunch, F(3,
855) = 7.57, p <.001. The combined (HI) and developmental approaches spent significantly
more time on math and social studies compared to the combined (LO) and didactic approaches.
Moreover, developmental kindergartens spent more time on science, music, art, dance, and
theatre than the combined (LO) and didactic approaches. Didactic approaches spent significantly
less time on physical education, but significantly more time on lunch than the other three
kindergarten types.
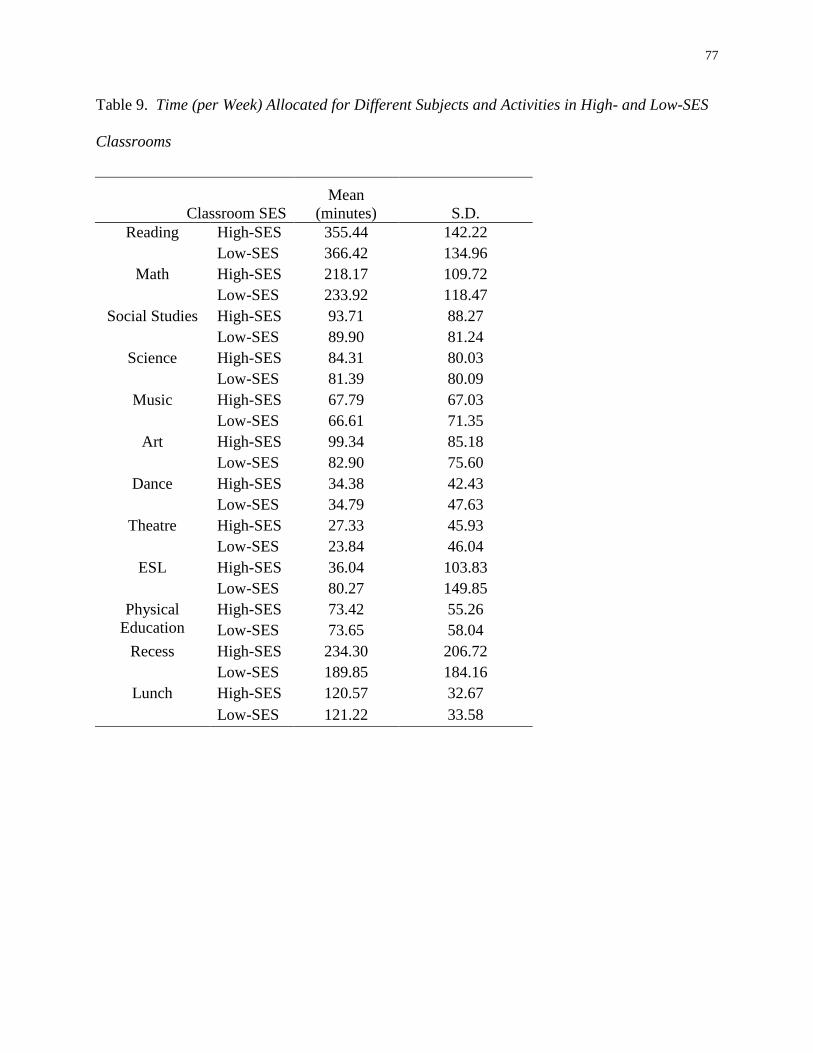
77
Table 9. Time (per Week) Allocated for Different Subjects and Activities in High- and Low-SES
Classrooms
Classroom SES
Mean
(minutes) S.D.
Reading High-SES 355.44 142.22
Low-SES 366.42 134.96
Math High-SES 218.17 109.72
Low-SES 233.92 118.47
Social Studies High-SES 93.71 88.27
Low-SES 89.90 81.24
Science High-SES 84.31 80.03
Low-SES 81.39 80.09
Music High-SES 67.79 67.03
Low-SES 66.61 71.35
Art High-SES 99.34 85.18
Low-SES 82.90 75.60
Dance High-SES 34.38 42.43
Low-SES 34.79 47.63
Theatre High-SES 27.33 45.93
Low-SES 23.84 46.04
ESL High-SES 36.04 103.83
Low-SES 80.27 149.85
Physical
Education
High-SES 73.42 55.26
Low-SES 73.65 58.04
Recess High-SES 234.30 206.72
Low-SES 189.85 184.16
Lunch High-SES 120.57 32.67
Low-SES 121.22 33.58
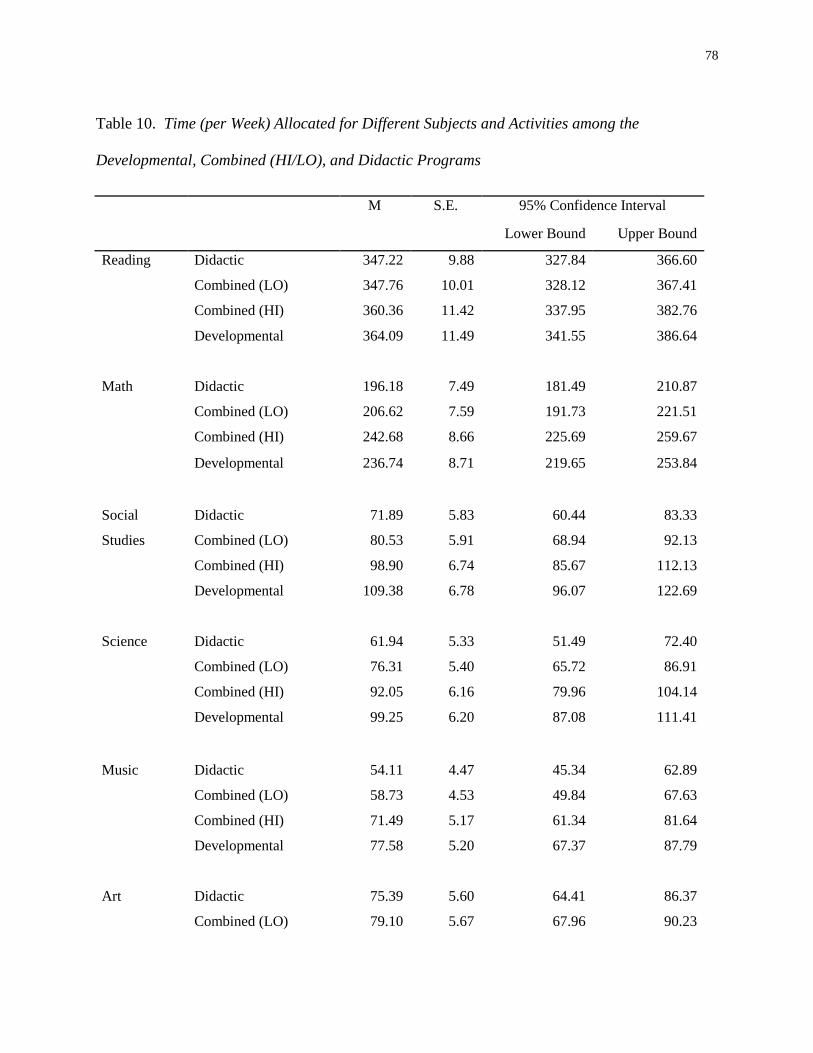
78
Table 10. Time (per Week) Allocated for Different Subjects and Activities among the
Developmental, Combined (HI/LO), and Didactic Programs
M S.E. 95% Confidence Interval
Lower Bound Upper Bound
Reading Didactic 347.22 9.88 327.84 366.60
Combined (LO) 347.76 10.01 328.12 367.41
Combined (HI) 360.36 11.42 337.95 382.76
Developmental 364.09 11.49 341.55 386.64
Math Didactic 196.18 7.49 181.49 210.87
Combined (LO) 206.62 7.59 191.73 221.51
Combined (HI) 242.68 8.66 225.69 259.67
Developmental 236.74 8.71 219.65 253.84
Social
Studies
Didactic 71.89 5.83 60.44 83.33
Combined (LO) 80.53 5.91 68.94 92.13
Combined (HI) 98.90 6.74 85.67 112.13
Developmental 109.38 6.78 96.07 122.69
Science Didactic 61.94 5.33 51.49 72.40
Combined (LO) 76.31 5.40 65.72 86.91
Combined (HI) 92.05 6.16 79.96 104.14
Developmental 99.25 6.20 87.08 111.41
Music Didactic 54.11 4.47 45.34 62.89
Combined (LO) 58.73 4.53 49.84 67.63
Combined (HI) 71.49 5.17 61.34 81.64
Developmental 77.58 5.20 67.37 87.79
Art Didactic 75.39 5.60 64.41 86.37
Combined (LO) 79.10 5.67 67.96 90.23
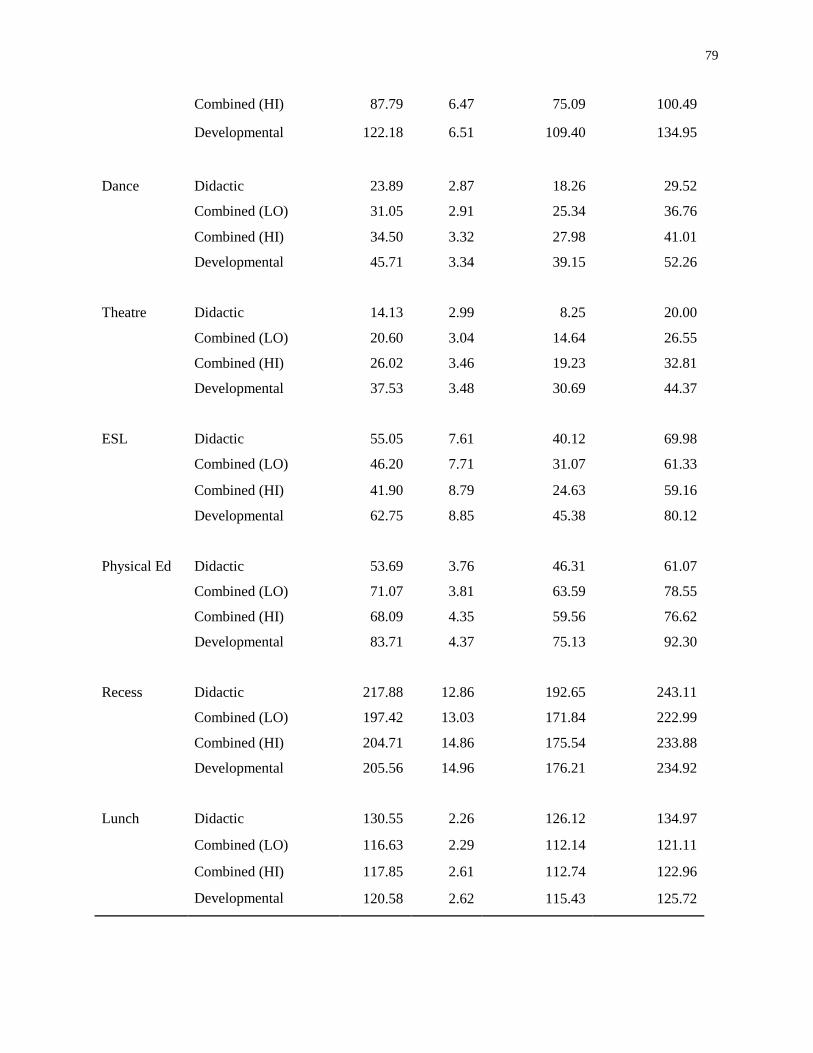
79
Combined (HI) 87.79 6.47 75.09 100.49
Developmental 122.18 6.51 109.40 134.95
Dance Didactic 23.89 2.87 18.26 29.52
Combined (LO) 31.05 2.91 25.34 36.76
Combined (HI) 34.50 3.32 27.98 41.01
Developmental 45.71 3.34 39.15 52.26
Theatre Didactic 14.13 2.99 8.25 20.00
Combined (LO) 20.60 3.04 14.64 26.55
Combined (HI) 26.02 3.46 19.23 32.81
Developmental 37.53 3.48 30.69 44.37
ESL Didactic 55.05 7.61 40.12 69.98
Combined (LO) 46.20 7.71 31.07 61.33
Combined (HI) 41.90 8.79 24.63 59.16
Developmental 62.75 8.85 45.38 80.12
Physical Ed Didactic 53.69 3.76 46.31 61.07
Combined (LO) 71.07 3.81 63.59 78.55
Combined (HI) 68.09 4.35 59.56 76.62
Developmental 83.71 4.37 75.13 92.30
Recess Didactic 217.88 12.86 192.65 243.11
Combined (LO) 197.42 13.03 171.84 222.99
Combined (HI) 204.71 14.86 175.54 233.88
Developmental 205.56 14.96 176.21 234.92
Lunch Didactic 130.55 2.26 126.12 134.97
Combined (LO) 116.63 2.29 112.14 121.11
Combined (HI) 117.85 2.61 112.74 122.96
Developmental 120.58 2.62 115.43 125.72
80
In this section, I explored the relationship among time allocation, kindergarten type, and SES.
Firstly, the analysis showed that socioeconomic status was not significantly related to the
kindergarten types but was significantly related to the proportion of time these kindergartens
allocate to academic subjects. Low SES kindergartens allocated proportionally more time to
academic subjects than high SES kindergartens. Secondly, there was a relationship between
kindergarten type and time allocation, irrespective of SES. Contrary to the expectations that
didactic kindergartens would spend proportionally more time on academic subjects than other
types of kindergartens, it was the combined(HI) kindergartens that spent proportionally the most
time on academic subjects. Thirdly, I examined what academic subjects and other activities the
kindergartens spend time on. Interestingly, among the academic subjects, the time allocated to
reading instruction was not found to be significantly different between low and high SES
classrooms, nor among the different types of kindergartens. The low SES classrooms spent 16
more minutes on math, 44 more minutes on ESL, 16 less minutes on art, and 44 less minutes on
recess than high SES classrooms. The relationship between the types of kindergarten and time
allocation was more complicated, given that the combined(HI) and developmental kindergartens
spent more time on math and social studies, and developmental kindergartens spent more time on
science, than the other types of kindergartens. As expected, however, the developmental
programs spent significantly more time on enrichment activities such as music, art, theatre, and
dance, especially compared to combined(LO) programs, and didactic programs spent less time
on physical education compared to other types of programs.
81
8 Question 4: How Kindergarten Program Relates to Outcomes of Motivation, Reading, and Math from Kindergarten to Grade 5
In the fourth research question, I examine how kindergarten programs affect children’s
motivational and academic outcomes from Kindergarten to Grade 5. The results of the cross-
sectional multilevel modeling are reported for approaches to learning, teacher ratings of reading
and math, and children’s direct assessment of reading and math. Both the results unweighted
and weighted by the marginal mean weighting with stratification (MMW-S) are reported for each
outcome. A summary table of all the significant results can be found in appendix C. There were
425 schools, 1187 classrooms, and 6882 children in the analytic sample, In the low-SES
classrooms, 97% of all candidate pretreatment covariates were balanced. In the high-SES
classrooms, 96% of all the candidate pretreatment covariates were balanced.
8.1 Approaches to Learning
The results of the unweighted and weighted three-level hierarchical models for approaches to
learning in the low-SES and the high-SES classrooms are shown in table 12 and table 13,
respectively.
8.1.1 Without Marginal Mean Weighting
There was a significant difference in the low SES condition between the combined (HI) and
didactic programs in Grade 3. In Grade 3, children who attended low-SES didactic kindergartens
were scoring higher by 0.14 points in approaches to learning than children who attended
combined (HI) programs, p =.03. There was also a significant mean difference in the high SES
condition in Grade 5 between the combined (HI) and didactic programs. The children who
82
attended high-SES didactic kindergarten programs were scoring 0.09 points higher in approaches
to learning than children who attended combined (HI) programs in Grade 5, p = .05.
8.1.2 With Marginal Mean Weighting
The weighted results of the hierarchical linear models showed no program impact on approaches
to learning, for neither the low-SES nor the high-SES groups, throughout kindergarten to Grade
5.
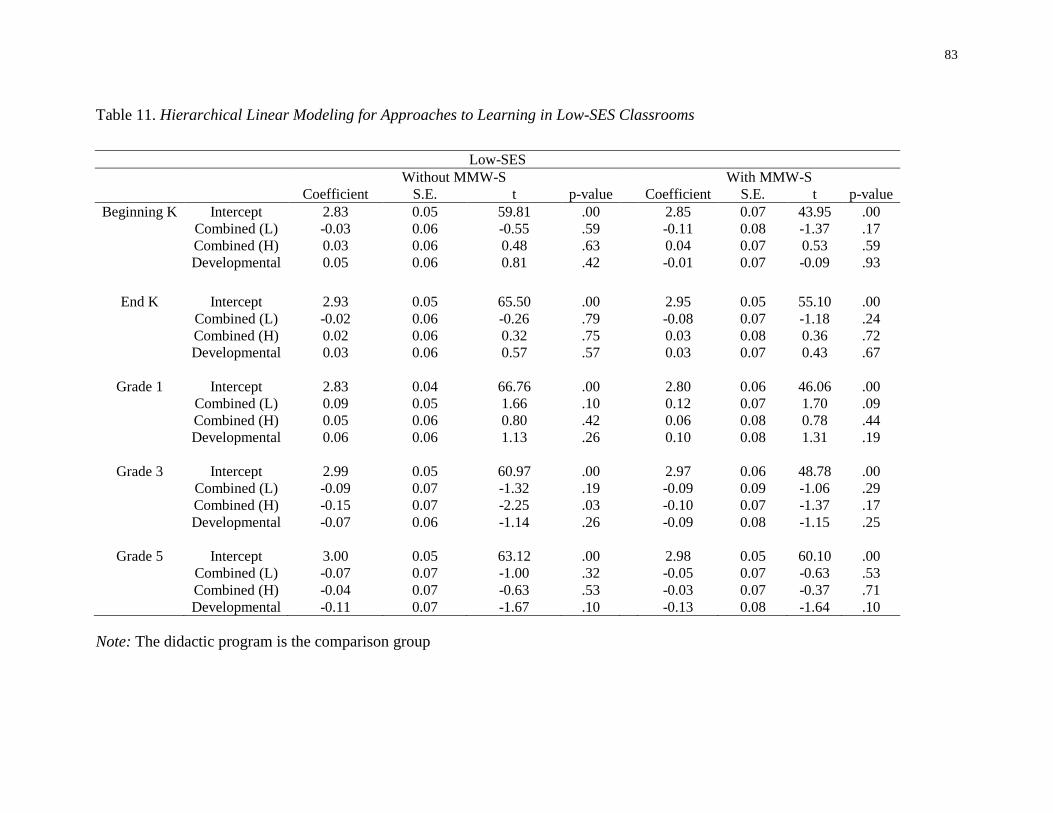
83
Table 11. Hierarchical Linear Modeling for Approaches to Learning in Low-SES Classrooms
Low-SES
Without MMW-S
With MMW-S
Coefficient S.E. t p-value Coefficient S.E. t p-value
Beginning K Intercept 2.83 0.05 59.81 .00
2.85 0.07 43.95 .00
Combined (L) -0.03 0.06 -0.55 .59
-0.11 0.08 -1.37 .17
Combined (H) 0.03 0.06 0.48 .63
0.04 0.07 0.53 .59
Developmental 0.05 0.06 0.81 .42
-0.01 0.07 -0.09 .93
End K Intercept 2.93 0.05 65.50 .00
2.95 0.05 55.10 .00
Combined (L) -0.02 0.06 -0.26 .79
-0.08 0.07 -1.18 .24
Combined (H) 0.02 0.06 0.32 .75
0.03 0.08 0.36 .72
Developmental 0.03 0.06 0.57 .57
0.03 0.07 0.43 .67
Grade 1 Intercept 2.83 0.04 66.76 .00
2.80 0.06 46.06 .00
Combined (L) 0.09 0.05 1.66 .10
0.12 0.07 1.70 .09
Combined (H) 0.05 0.06 0.80 .42
0.06 0.08 0.78 .44
Developmental 0.06 0.06 1.13 .26
0.10 0.08 1.31 .19
Grade 3 Intercept 2.99 0.05 60.97 .00
2.97 0.06 48.78 .00
Combined (L) -0.09 0.07 -1.32 .19
-0.09 0.09 -1.06 .29
Combined (H) -0.15 0.07 -2.25 .03
-0.10 0.07 -1.37 .17
Developmental -0.07 0.06 -1.14 .26
-0.09 0.08 -1.15 .25
Grade 5 Intercept 3.00 0.05 63.12 .00
2.98 0.05 60.10 .00
Combined (L) -0.07 0.07 -1.00 .32
-0.05 0.07 -0.63 .53
Combined (H) -0.04 0.07 -0.63 .53
-0.03 0.07 -0.37 .71
Developmental -0.11 0.07 -1.67 .10 -0.13 0.08 -1.64 .10
Note: The didactic program is the comparison group
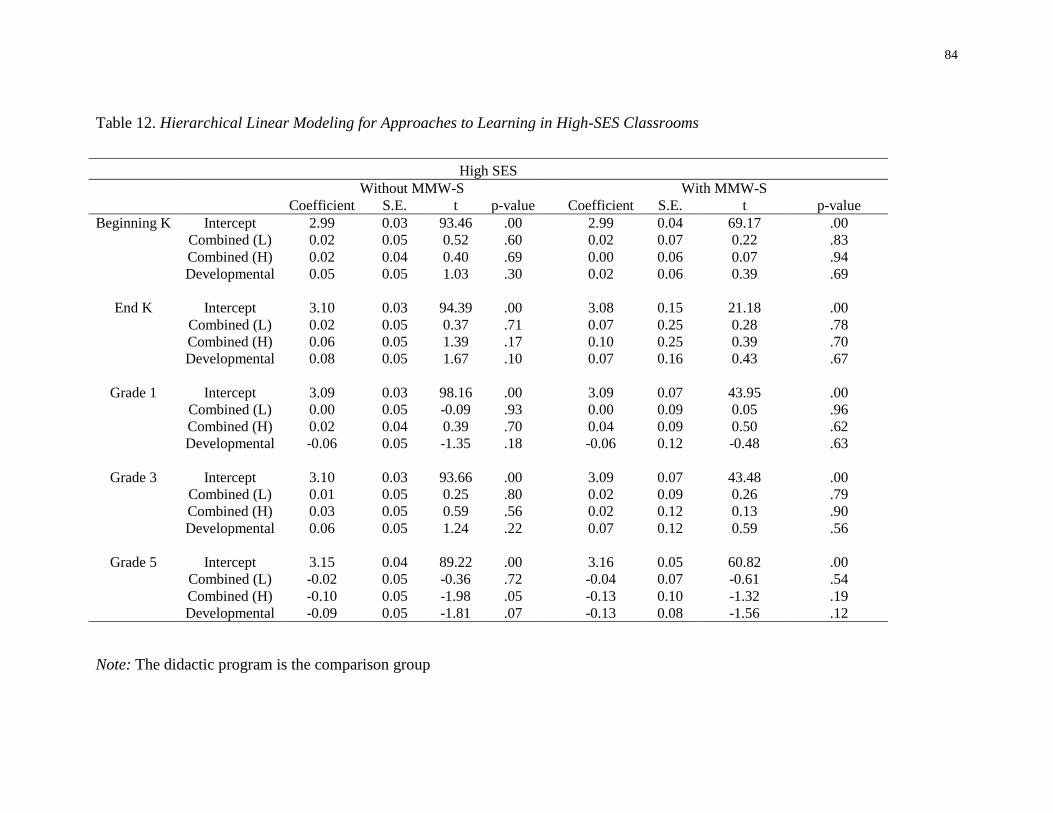
84
Table 12. Hierarchical Linear Modeling for Approaches to Learning in High-SES Classrooms
High SES
Without MMW-S
With MMW-S
Coefficient S.E. t p-value Coefficient S.E. t p-value
Beginning K Intercept 2.99 0.03 93.46 .00
2.99 0.04 69.17 .00
Combined (L) 0.02 0.05 0.52 .60
0.02 0.07 0.22 .83
Combined (H) 0.02 0.04 0.40 .69
0.00 0.06 0.07 .94
Developmental 0.05 0.05 1.03 .30
0.02 0.06 0.39 .69
End K Intercept 3.10 0.03 94.39 .00
3.08 0.15 21.18 .00
Combined (L) 0.02 0.05 0.37 .71
0.07 0.25 0.28 .78
Combined (H) 0.06 0.05 1.39 .17
0.10 0.25 0.39 .70
Developmental 0.08 0.05 1.67 .10
0.07 0.16 0.43 .67
Grade 1 Intercept 3.09 0.03 98.16 .00
3.09 0.07 43.95 .00
Combined (L) 0.00 0.05 -0.09 .93
0.00 0.09 0.05 .96
Combined (H) 0.02 0.04 0.39 .70
0.04 0.09 0.50 .62
Developmental -0.06 0.05 -1.35 .18
-0.06 0.12 -0.48 .63
Grade 3 Intercept 3.10 0.03 93.66 .00
3.09 0.07 43.48 .00
Combined (L) 0.01 0.05 0.25 .80
0.02 0.09 0.26 .79
Combined (H) 0.03 0.05 0.59 .56
0.02 0.12 0.13 .90
Developmental 0.06 0.05 1.24 .22
0.07 0.12 0.59 .56
Grade 5 Intercept 3.15 0.04 89.22 .00
3.16 0.05 60.82 .00
Combined (L) -0.02 0.05 -0.36 .72
-0.04 0.07 -0.61 .54
Combined (H) -0.10 0.05 -1.98 .05
-0.13 0.10 -1.32 .19
Developmental -0.09 0.05 -1.81 .07 -0.13 0.08 -1.56 .12
Note: The didactic program is the comparison group

85
8.2 Teacher Rating of Children’s Reading Skills
The unweighted and weighted results of the three-level hierarchical linear models for teacher
ratings of children’s reading skills in the low-SES and the high-SES classrooms are shown in
tables 14 and 15, respectively.
8.2.1 Without Marginal Mean Weighting
In the low-SES condition, the naïve, unweighted results show that the children attending
developmental programs received higher teacher ratings of reading skills than children who
attended the didactic program at the end of kindergarten, p = .009. In Grade 3, the children who
attended the combined (HI) kindergarten program received significantly lower teacher ratings of
their reading skills than children who attended the didactic kindergarten program, β = -0.21, p =
.006.
In the high-SES condition, the children who attended the didactic program received the lowest
teacher ratings of their reading skills out of the four programs at the end of the kindergarten year.
The mean teacher rating scores of the children who attended the didactic program was 0.14
points lower than that of the combined(LO) program (p = .03), 0.15 points lower than that of the
combined(HI) program (p = .01), and 0.21 points lower than that of the developmental program
(p =.001).
8.2.2 With Marginal Mean Weighting
Similar to the unweighted results, at the end of kindergarten, the children in the low-SES
developmental programs were rated higher by their teachers on their reading skills than children
86
who attended low-SES didactic programs (p = 0.04). However, this result did not carry over to
the future grades. In Grades 3 and 5, children who attended developmental kindergarten
programs were scoring significantly lower than children who attended didactic kindergarten
programs, p =.04 and p = .05, respectively. In addition, in Grade 5, children who attended
combined(HI) programs were scoring significantly lower than children who attended didactic
programs, p =.05.
In the high-SES classrooms, again similar to those of the unweighted results, at the end of
kindergarten, children in the combined(LO) program were scoring 0.21 points higher than
children in the didactic program (p = .02), and children in the developmental program were
scoring 0.17 points higher than children in the didactic program (p = .01). However, these
program benefits disappeared after kindergarten.
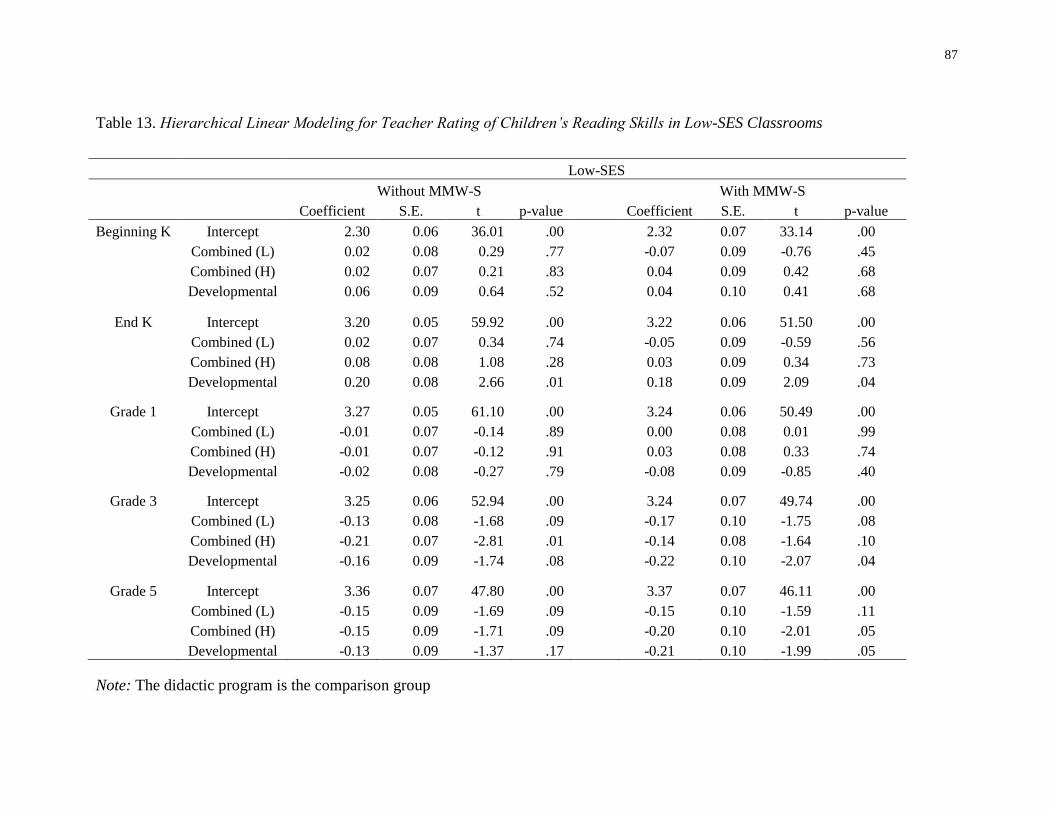
87
Table 13. Hierarchical Linear Modeling for Teacher Rating of Children’s Reading Skills in Low-SES Classrooms
Low-SES
Without MMW-S
With MMW-S
Coefficient S.E. t p-value Coefficient S.E. t p-value
Beginning K Intercept 2.30 0.06 36.01 .00
2.32 0.07 33.14 .00
Combined (L) 0.02 0.08 0.29 .77
-0.07 0.09 -0.76 .45
Combined (H) 0.02 0.07 0.21 .83
0.04 0.09 0.42 .68
Developmental 0.06 0.09 0.64 .52
0.04 0.10 0.41 .68
End K Intercept 3.20 0.05 59.92 .00
3.22 0.06 51.50 .00
Combined (L) 0.02 0.07 0.34 .74
-0.05 0.09 -0.59 .56
Combined (H) 0.08 0.08 1.08 .28
0.03 0.09 0.34 .73
Developmental 0.20 0.08 2.66 .01
0.18 0.09 2.09 .04
Grade 1 Intercept 3.27 0.05 61.10 .00
3.24 0.06 50.49 .00
Combined (L) -0.01 0.07 -0.14 .89
0.00 0.08 0.01 .99
Combined (H) -0.01 0.07 -0.12 .91
0.03 0.08 0.33 .74
Developmental -0.02 0.08 -0.27 .79
-0.08 0.09 -0.85 .40
Grade 3 Intercept 3.25 0.06 52.94 .00
3.24 0.07 49.74 .00
Combined (L) -0.13 0.08 -1.68 .09
-0.17 0.10 -1.75 .08
Combined (H) -0.21 0.07 -2.81 .01
-0.14 0.08 -1.64 .10
Developmental -0.16 0.09 -1.74 .08
-0.22 0.10 -2.07 .04
Grade 5 Intercept 3.36 0.07 47.80 .00
3.37 0.07 46.11 .00
Combined (L) -0.15 0.09 -1.69 .09
-0.15 0.10 -1.59 .11
Combined (H) -0.15 0.09 -1.71 .09
-0.20 0.10 -2.01 .05
Developmental -0.13 0.09 -1.37 .17 -0.21 0.10 -1.99 .05
Note: The didactic program is the comparison group
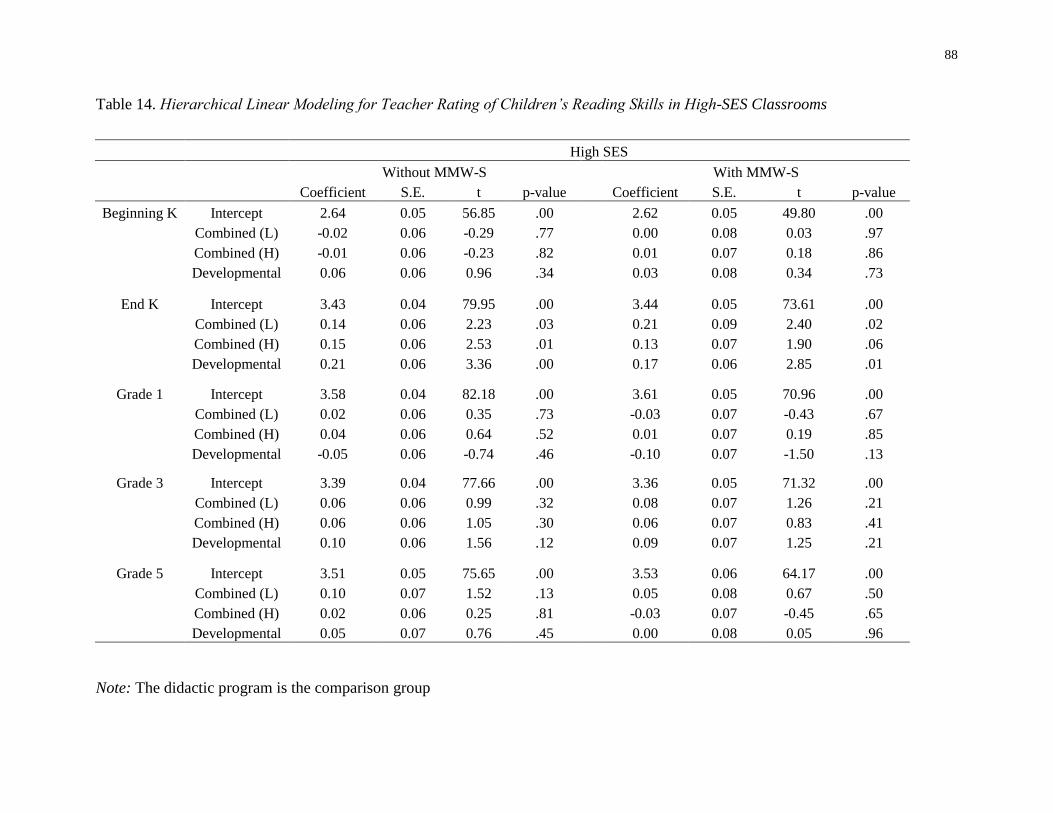
88
Table 14. Hierarchical Linear Modeling for Teacher Rating of Children’s Reading Skills in High-SES Classrooms
High SES
Without MMW-S
With MMW-S
Coefficient S.E. t p-value Coefficient S.E. t p-value
Beginning K Intercept 2.64 0.05 56.85 .00
2.62 0.05 49.80 .00
Combined (L) -0.02 0.06 -0.29 .77
0.00 0.08 0.03 .97
Combined (H) -0.01 0.06 -0.23 .82
0.01 0.07 0.18 .86
Developmental 0.06 0.06 0.96 .34
0.03 0.08 0.34 .73
End K Intercept 3.43 0.04 79.95 .00
3.44 0.05 73.61 .00
Combined (L) 0.14 0.06 2.23 .03
0.21 0.09 2.40 .02
Combined (H) 0.15 0.06 2.53 .01
0.13 0.07 1.90 .06
Developmental 0.21 0.06 3.36 .00
0.17 0.06 2.85 .01
Grade 1 Intercept 3.58 0.04 82.18 .00
3.61 0.05 70.96 .00
Combined (L) 0.02 0.06 0.35 .73
-0.03 0.07 -0.43 .67
Combined (H) 0.04 0.06 0.64 .52
0.01 0.07 0.19 .85
Developmental -0.05 0.06 -0.74 .46
-0.10 0.07 -1.50 .13
Grade 3 Intercept 3.39 0.04 77.66 .00
3.36 0.05 71.32 .00
Combined (L) 0.06 0.06 0.99 .32
0.08 0.07 1.26 .21
Combined (H) 0.06 0.06 1.05 .30
0.06 0.07 0.83 .41
Developmental 0.10 0.06 1.56 .12
0.09 0.07 1.25 .21
Grade 5 Intercept 3.51 0.05 75.65 .00
3.53 0.06 64.17 .00
Combined (L) 0.10 0.07 1.52 .13
0.05 0.08 0.67 .50
Combined (H) 0.02 0.06 0.25 .81
-0.03 0.07 -0.45 .65
Developmental 0.05 0.07 0.76 .45 0.00 0.08 0.05 .96
Note: The didactic program is the comparison group
89
8.3 Teacher Rating of Children’s Math Skills
The unweighted and weighted results of the three-level hierarchical linear models for teacher
ratings of children’s math skills in the low-SES and the high-SES classrooms are shown in tables
16 and 17, respectively.
8.3.1 Without Marginal Mean Weighting
In the low-SES condition, the results of the unweighted analyses for the teacher rating of
children’s math skills are similar to those of the unweighted analyses for the teacher rating of
children’s reading skills. At the end of kindergarten, the children in the low-SES developmental
programs were receiving significantly higher teacher ratings for their math skills than children in
the low-SES didactic programs, β = 0.27, p = .001. In Grade 3, children who attended the low-
SES combined(HI) program were rated lower than children who attended the low-SES didactic
program, β = -0.15, p = .04.
In the high-SES condition, there was only one mean difference among the kindergarten programs
that reached statistical significance. In Grade 1, children who attended the combined(LO)
program were rated by their teachers as significantly better in their math skills than children who
attended the didactic program, β = 0.12, p = .05.
8.3.2 With Marginal Mean Weighting
The weighted results at the end of kindergarten show that children in the low-SES,
developmental programs were receiving higher teacher ratings in math than children in the low-
SES didactic programs, β = 0.28, p = .002. However, this result did not carry over to the other
90
grades. In Grade 3, the children who attended low-SES developmental programs were receiving
lower teacher ratings in math than children who attended low-SES didactic programs, β = - 0.19,
p = .004. There were no significant differences in the teacher ratings of children’s math skills
among the kindergarten programs in the high-SES condition from kindergarten to Grade 5.
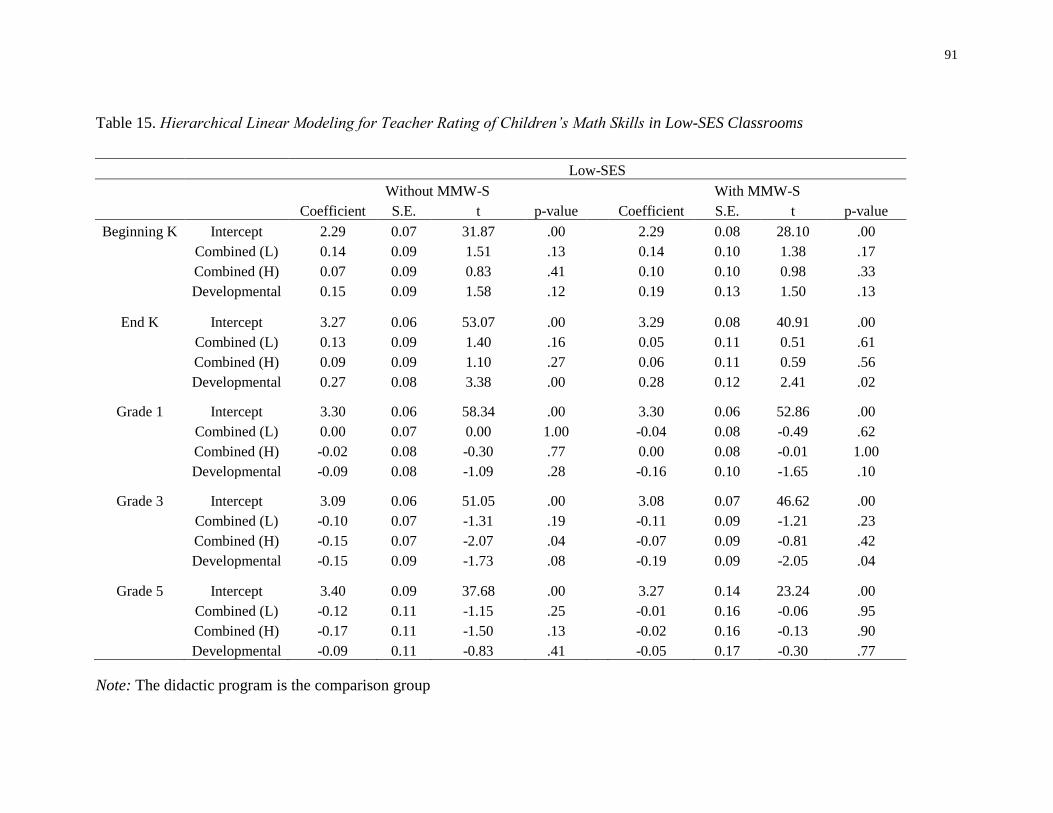
91
Table 15. Hierarchical Linear Modeling for Teacher Rating of Children’s Math Skills in Low-SES Classrooms
Low-SES
Without MMW-S
With MMW-S
Coefficient S.E. t p-value Coefficient S.E. t p-value
Beginning K Intercept 2.29 0.07 31.87 .00
2.29 0.08 28.10 .00
Combined (L) 0.14 0.09 1.51 .13
0.14 0.10 1.38 .17
Combined (H) 0.07 0.09 0.83 .41
0.10 0.10 0.98 .33
Developmental 0.15 0.09 1.58 .12
0.19 0.13 1.50 .13
End K Intercept 3.27 0.06 53.07 .00
3.29 0.08 40.91 .00
Combined (L) 0.13 0.09 1.40 .16
0.05 0.11 0.51 .61
Combined (H) 0.09 0.09 1.10 .27
0.06 0.11 0.59 .56
Developmental 0.27 0.08 3.38 .00
0.28 0.12 2.41 .02
Grade 1 Intercept 3.30 0.06 58.34 .00
3.30 0.06 52.86 .00
Combined (L) 0.00 0.07 0.00 1.00
-0.04 0.08 -0.49 .62
Combined (H) -0.02 0.08 -0.30 .77
0.00 0.08 -0.01 1.00
Developmental -0.09 0.08 -1.09 .28
-0.16 0.10 -1.65 .10
Grade 3 Intercept 3.09 0.06 51.05 .00
3.08 0.07 46.62 .00
Combined (L) -0.10 0.07 -1.31 .19
-0.11 0.09 -1.21 .23
Combined (H) -0.15 0.07 -2.07 .04
-0.07 0.09 -0.81 .42
Developmental -0.15 0.09 -1.73 .08
-0.19 0.09 -2.05 .04
Grade 5 Intercept 3.40 0.09 37.68 .00
3.27 0.14 23.24 .00
Combined (L) -0.12 0.11 -1.15 .25
-0.01 0.16 -0.06 .95
Combined (H) -0.17 0.11 -1.50 .13
-0.02 0.16 -0.13 .90
Developmental -0.09 0.11 -0.83 .41 -0.05 0.17 -0.30 .77
Note: The didactic program is the comparison group
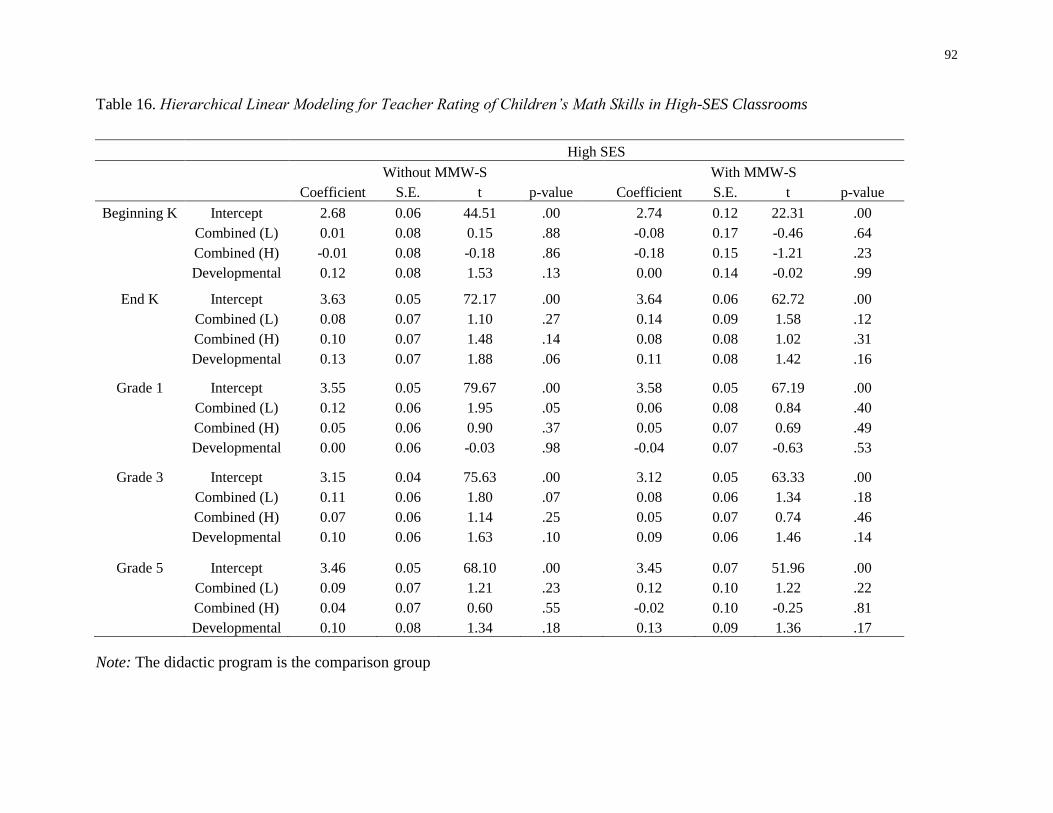
92
Table 16. Hierarchical Linear Modeling for Teacher Rating of Children’s Math Skills in High-SES Classrooms
High SES
Without MMW-S
With MMW-S
Coefficient S.E. t p-value Coefficient S.E. t p-value
Beginning K Intercept 2.68 0.06 44.51 .00
2.74 0.12 22.31 .00
Combined (L) 0.01 0.08 0.15 .88
-0.08 0.17 -0.46 .64
Combined (H) -0.01 0.08 -0.18 .86
-0.18 0.15 -1.21 .23
Developmental 0.12 0.08 1.53 .13
0.00 0.14 -0.02 .99
End K Intercept 3.63 0.05 72.17 .00
3.64 0.06 62.72 .00
Combined (L) 0.08 0.07 1.10 .27
0.14 0.09 1.58 .12
Combined (H) 0.10 0.07 1.48 .14
0.08 0.08 1.02 .31
Developmental 0.13 0.07 1.88 .06
0.11 0.08 1.42 .16
Grade 1 Intercept 3.55 0.05 79.67 .00
3.58 0.05 67.19 .00
Combined (L) 0.12 0.06 1.95 .05
0.06 0.08 0.84 .40
Combined (H) 0.05 0.06 0.90 .37
0.05 0.07 0.69 .49
Developmental 0.00 0.06 -0.03 .98
-0.04 0.07 -0.63 .53
Grade 3 Intercept 3.15 0.04 75.63 .00
3.12 0.05 63.33 .00
Combined (L) 0.11 0.06 1.80 .07
0.08 0.06 1.34 .18
Combined (H) 0.07 0.06 1.14 .25
0.05 0.07 0.74 .46
Developmental 0.10 0.06 1.63 .10
0.09 0.06 1.46 .14
Grade 5 Intercept 3.46 0.05 68.10 .00
3.45 0.07 51.96 .00
Combined (L) 0.09 0.07 1.21 .23
0.12 0.10 1.22 .22
Combined (H) 0.04 0.07 0.60 .55
-0.02 0.10 -0.25 .81
Developmental 0.10 0.08 1.34 .18 0.13 0.09 1.36 .17
Note: The didactic program is the comparison group
93
8.4 Reading Direct Assessment Scores
The unweighted and weighted results of the three-level hierarchical linear models for children’s
direct assessment scores in reading from kindergarten to Grade 5 in the low-SES and the high-
SES classrooms are shown in tables 18 and 19, respectively.
8.4.1 Without Marginal Mean Weighting
Even at the beginning of kindergarten, children in the low-SES combined(HI) program were
scoring significantly lower in reading than children in low-SES didactic programs, β = -0.07, p =
.04. This trend continued from kindergarten to Grade 5. At the end of kindergarten, children in
the low-SES combined(HI) program scored on average 0.08 points lower than children in the
low-SES didactic program, p = .05. Similarly, in Grades 3 and 5, children who attended the low-
SES combined(HI) program continued to score significantly lower in reading than children who
attended the low-SES didactic programs (β = -0.08, p = .02 and β = -0.08, p = .008 for Grades 3
and 5, respectively). Additionally, in Grades 3 and 5, children who attended the low-SES
combined(LO) programs were also scoring significantly worse in their direct assessment of
reading than the children who attended the low-SES didactic programs (β = -0.07, p = .03, and β
= -0.08, p = .01 for Grades 3 and 5, respectively).
In the high-SES condition, there was a significant mean difference among the four kindergarten
types only at the end of kindergarten. Children in the combined(LO) program scored
significantly higher than the children in the didactic program, β = 0.07, p = .04. From Grade 1 to
Grade 5, there were no significant mean differences among the kindergarten programs.
94
8.4.2 With Marginal Mean Weighting
There was a consistent pattern in the results of the low-SES condition from the end of
kindergarten to Grade 5. At the end of Kindergarten and in Grades 3 and 5, children who
attended the combined(LO) program scored significantly lower in their direct assessment of
reading than children in the didactic program β = -0.12, p = .01, β = -0.09, p = .05, and β = -0.07,
p = .04 for end of kindergarten, and Grades 3 and 5, respectively. A similar pattern emerged
between the combined(HI) and didactic programs. At the end of kindergarten and in Grade 5,
children in the combined(HI) program were scoring significantly lower in reading than children
in the didactic program, β = -0.13, p = .005 and β = -0.08, p = .03 for end of kindergarten and
Grade 5, respectively. The weighted results showed no significant differences among the
kindergarten types for the high-SES conditions from kindergarten to Grade 5.
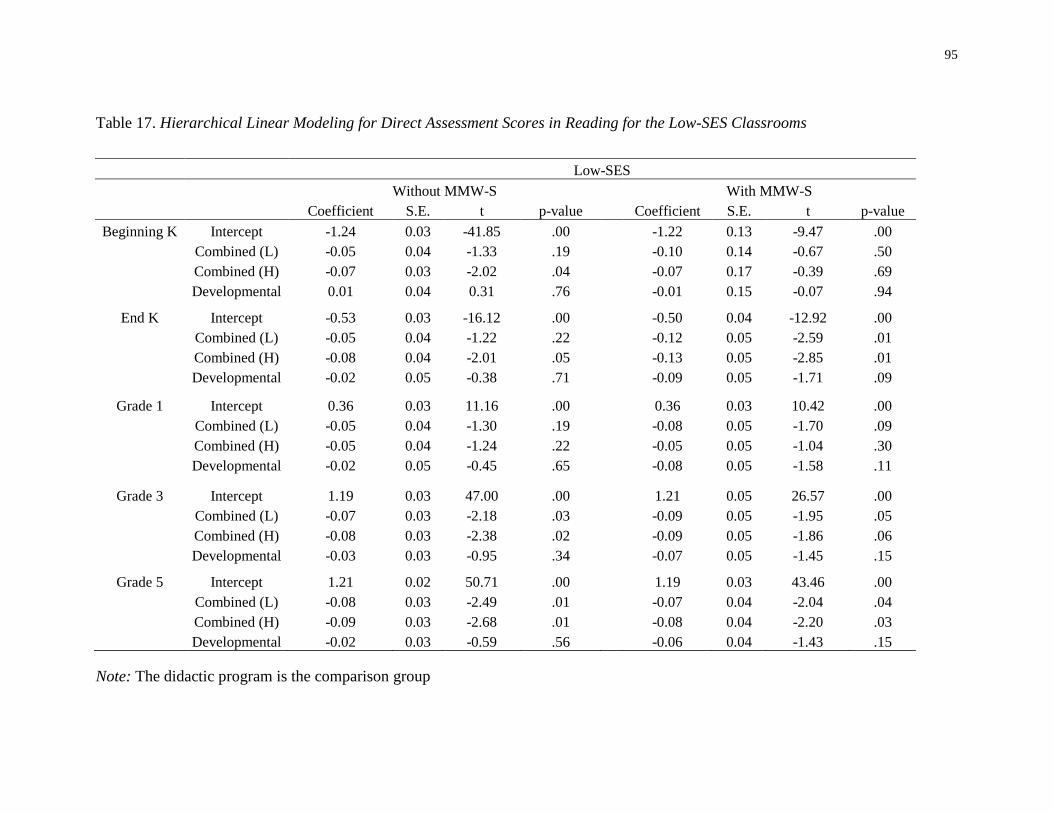
95
Table 17. Hierarchical Linear Modeling for Direct Assessment Scores in Reading for the Low-SES Classrooms
Low-SES
Without MMW-S
With MMW-S
Coefficient S.E. t p-value Coefficient S.E. t p-value
Beginning K Intercept -1.24 0.03 -41.85 .00
-1.22 0.13 -9.47 .00
Combined (L) -0.05 0.04 -1.33 .19
-0.10 0.14 -0.67 .50
Combined (H) -0.07 0.03 -2.02 .04
-0.07 0.17 -0.39 .69
Developmental 0.01 0.04 0.31 .76
-0.01 0.15 -0.07 .94
End K Intercept -0.53 0.03 -16.12 .00
-0.50 0.04 -12.92 .00
Combined (L) -0.05 0.04 -1.22 .22
-0.12 0.05 -2.59 .01
Combined (H) -0.08 0.04 -2.01 .05
-0.13 0.05 -2.85 .01
Developmental -0.02 0.05 -0.38 .71
-0.09 0.05 -1.71 .09
Grade 1 Intercept 0.36 0.03 11.16 .00
0.36 0.03 10.42 .00
Combined (L) -0.05 0.04 -1.30 .19
-0.08 0.05 -1.70 .09
Combined (H) -0.05 0.04 -1.24 .22
-0.05 0.05 -1.04 .30
Developmental -0.02 0.05 -0.45 .65
-0.08 0.05 -1.58 .11
Grade 3 Intercept 1.19 0.03 47.00 .00
1.21 0.05 26.57 .00
Combined (L) -0.07 0.03 -2.18 .03
-0.09 0.05 -1.95 .05
Combined (H) -0.08 0.03 -2.38 .02
-0.09 0.05 -1.86 .06
Developmental -0.03 0.03 -0.95 .34
-0.07 0.05 -1.45 .15
Grade 5 Intercept 1.21 0.02 50.71 .00
1.19 0.03 43.46 .00
Combined (L) -0.08 0.03 -2.49 .01
-0.07 0.04 -2.04 .04
Combined (H) -0.09 0.03 -2.68 .01
-0.08 0.04 -2.20 .03
Developmental -0.02 0.03 -0.59 .56 -0.06 0.04 -1.43 .15
Note: The didactic program is the comparison group
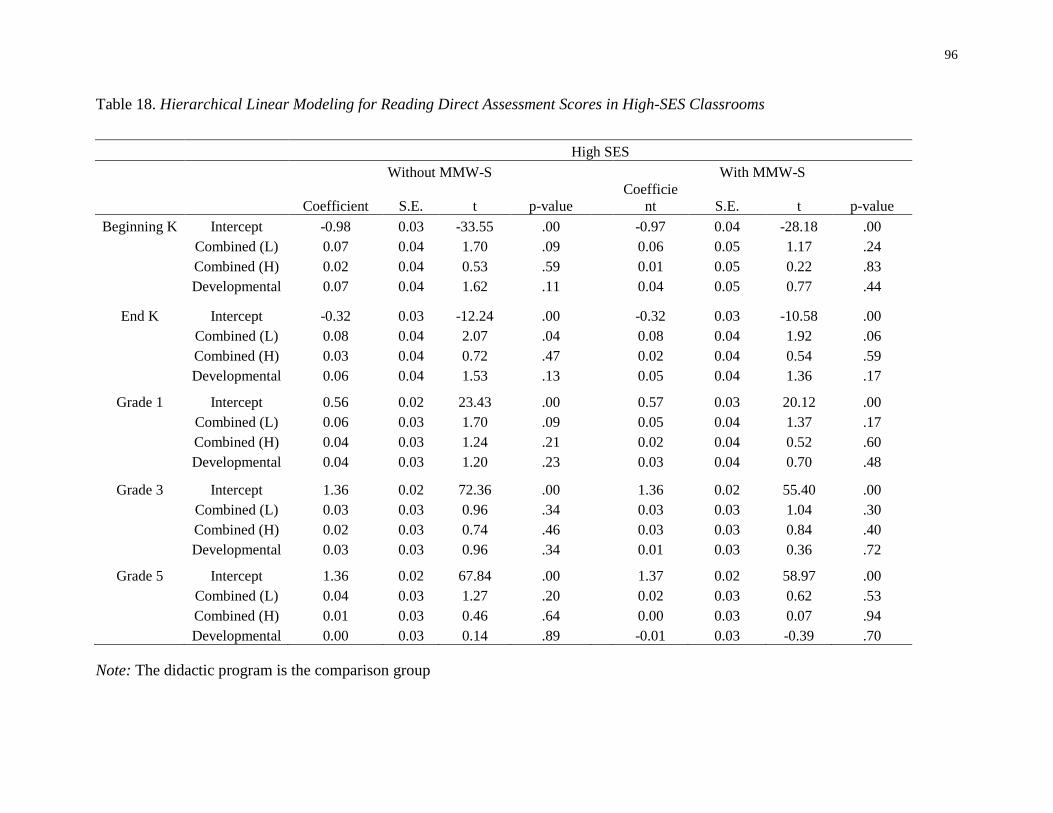
96
Table 18. Hierarchical Linear Modeling for Reading Direct Assessment Scores in High-SES Classrooms
High SES
Without MMW-S
With MMW-S
Coefficient S.E. t p-value
Coefficie
nt S.E. t p-value
Beginning K Intercept -0.98 0.03 -33.55 .00
-0.97 0.04 -28.18 .00
Combined (L) 0.07 0.04 1.70 .09
0.06 0.05 1.17 .24
Combined (H) 0.02 0.04 0.53 .59
0.01 0.05 0.22 .83
Developmental 0.07 0.04 1.62 .11
0.04 0.05 0.77 .44
End K Intercept -0.32 0.03 -12.24 .00
-0.32 0.03 -10.58 .00
Combined (L) 0.08 0.04 2.07 .04
0.08 0.04 1.92 .06
Combined (H) 0.03 0.04 0.72 .47
0.02 0.04 0.54 .59
Developmental 0.06 0.04 1.53 .13
0.05 0.04 1.36 .17
Grade 1 Intercept 0.56 0.02 23.43 .00
0.57 0.03 20.12 .00
Combined (L) 0.06 0.03 1.70 .09
0.05 0.04 1.37 .17
Combined (H) 0.04 0.03 1.24 .21
0.02 0.04 0.52 .60
Developmental 0.04 0.03 1.20 .23
0.03 0.04 0.70 .48
Grade 3 Intercept 1.36 0.02 72.36 .00
1.36 0.02 55.40 .00
Combined (L) 0.03 0.03 0.96 .34
0.03 0.03 1.04 .30
Combined (H) 0.02 0.03 0.74 .46
0.03 0.03 0.84 .40
Developmental 0.03 0.03 0.96 .34
0.01 0.03 0.36 .72
Grade 5 Intercept 1.36 0.02 67.84 .00
1.37 0.02 58.97 .00
Combined (L) 0.04 0.03 1.27 .20
0.02 0.03 0.62 .53
Combined (H) 0.01 0.03 0.46 .64
0.00 0.03 0.07 .94
Developmental 0.00 0.03 0.14 .89 -0.01 0.03 -0.39 .70
Note: The didactic program is the comparison group
97
8.5 Math Direct Assessment Scores
The unweighted and weighted results of the three-level, cross-sectional hierarchical linear
models of children’s direct assessment scores in math from kindergarten to Grade 5 in the low-
SES and the high-SES classrooms are shown in tables 20 and 21, respectively.
8.5.1 Without Marginal Mean Weighting
From the beginning of kindergarten, there was a significant difference in math scores between
children who were assigned to attend the low-SES combined(HI) program and children who
were assigned to attend the low-SES didactic program. In the low-SES condition, children in the
combined(HI) program were scoring significantly lower than children in the didactic program, β
= -0.09, p = .02. The children in the low-SES combined(HI) program continued to score lower
than the children in the low-SES didactic program in Grades 1, 3, and 5, β = -0.12, p = .004, β = -
0.10, p = .008, and β = -0.12, p = .008 for Grades 1, 3, and 5, respectively. In addition, the mean
math scores of children who attended the low-SES combined(LO) program was significantly
lower than the children who attended the low-SES didactic program in Grades 1 and 5, β = -0.08,
p = .04 and β = -0.10, p = .05 for Grades 1 and 5, respectively.
In the high-SES condition, however, the general pattern is reversed. From the end of
kindergarten to Grade 5, children in the combined(LO) program consistently scored higher than
children in the didactic program, β = 0.08, p = .03 for end of kindergarten, β = 0.08, p = .01 for
Grade 1, β = 0.07, p = .03 for Grade 3, and β = 0.07, p = .04 for Grade 5.
98
8.5.2 With Marginal Mean Weighting
In the low-SES condition, the weighted results showed significant group differences in reading in
Grades 1 and 5. In Grade 1, children who attended the didactic program scored significantly
higher than children in the combined(LO) program, β = -0.10, p = .02, the combined(HI)
program, β = -0.10, p = .02, and developmental program, β = -0.10, p = .04. Similarly, in Grade
5, children in the didactic program scored significantly higher in reading than children in the
combined(LO) program, β = -0.12, p = .03, and the combined(HI) program, β = -0.13, p = .01.
In the high-SES condition, there was only one significant group difference, which was between
the combined(LO) and didactic programs in Grade 1. Children in the combined(LO) program
were scoring significantly higher in reading than children in the didactic program, β = 0.08, p =
.04.
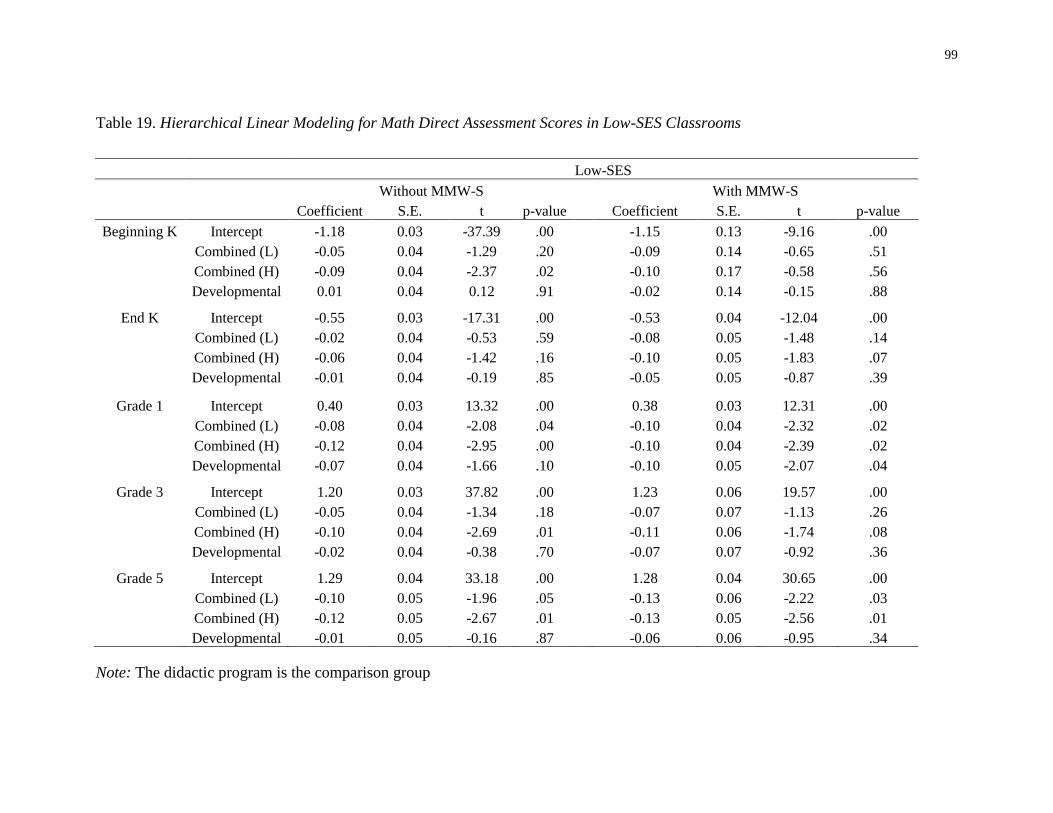
99
Table 19. Hierarchical Linear Modeling for Math Direct Assessment Scores in Low-SES Classrooms
Low-SES
Without MMW-S
With MMW-S
Coefficient S.E. t p-value Coefficient S.E. t p-value
Beginning K Intercept -1.18 0.03 -37.39 .00
-1.15 0.13 -9.16 .00
Combined (L) -0.05 0.04 -1.29 .20
-0.09 0.14 -0.65 .51
Combined (H) -0.09 0.04 -2.37 .02
-0.10 0.17 -0.58 .56
Developmental 0.01 0.04 0.12 .91
-0.02 0.14 -0.15 .88
End K Intercept -0.55 0.03 -17.31 .00
-0.53 0.04 -12.04 .00
Combined (L) -0.02 0.04 -0.53 .59
-0.08 0.05 -1.48 .14
Combined (H) -0.06 0.04 -1.42 .16
-0.10 0.05 -1.83 .07
Developmental -0.01 0.04 -0.19 .85
-0.05 0.05 -0.87 .39
Grade 1 Intercept 0.40 0.03 13.32 .00
0.38 0.03 12.31 .00
Combined (L) -0.08 0.04 -2.08 .04
-0.10 0.04 -2.32 .02
Combined (H) -0.12 0.04 -2.95 .00
-0.10 0.04 -2.39 .02
Developmental -0.07 0.04 -1.66 .10
-0.10 0.05 -2.07 .04
Grade 3 Intercept 1.20 0.03 37.82 .00
1.23 0.06 19.57 .00
Combined (L) -0.05 0.04 -1.34 .18
-0.07 0.07 -1.13 .26
Combined (H) -0.10 0.04 -2.69 .01
-0.11 0.06 -1.74 .08
Developmental -0.02 0.04 -0.38 .70
-0.07 0.07 -0.92 .36
Grade 5 Intercept 1.29 0.04 33.18 .00
1.28 0.04 30.65 .00
Combined (L) -0.10 0.05 -1.96 .05
-0.13 0.06 -2.22 .03
Combined (H) -0.12 0.05 -2.67 .01
-0.13 0.05 -2.56 .01
Developmental -0.01 0.05 -0.16 .87 -0.06 0.06 -0.95 .34
Note: The didactic program is the comparison group
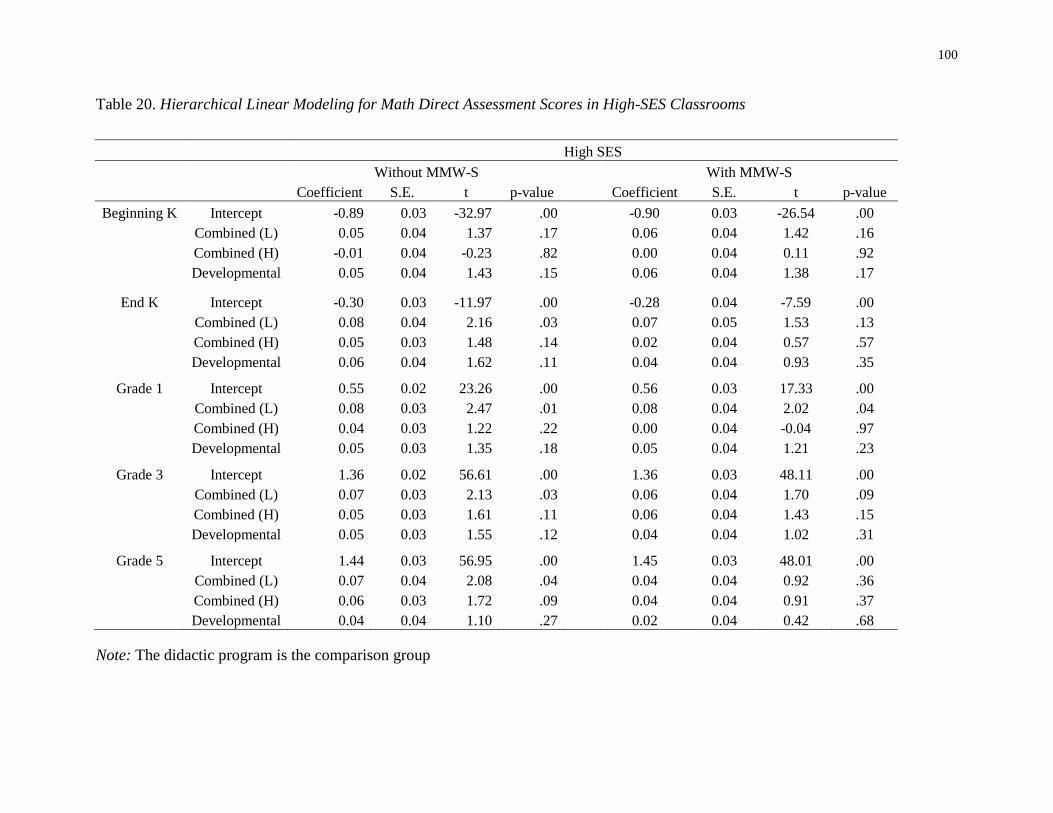
100
Table 20. Hierarchical Linear Modeling for Math Direct Assessment Scores in High-SES Classrooms
High SES
Without MMW-S
With MMW-S
Coefficient S.E. t p-value Coefficient S.E. t p-value
Beginning K Intercept -0.89 0.03 -32.97 .00
-0.90 0.03 -26.54 .00
Combined (L) 0.05 0.04 1.37 .17
0.06 0.04 1.42 .16
Combined (H) -0.01 0.04 -0.23 .82
0.00 0.04 0.11 .92
Developmental 0.05 0.04 1.43 .15
0.06 0.04 1.38 .17
End K Intercept -0.30 0.03 -11.97 .00
-0.28 0.04 -7.59 .00
Combined (L) 0.08 0.04 2.16 .03
0.07 0.05 1.53 .13
Combined (H) 0.05 0.03 1.48 .14
0.02 0.04 0.57 .57
Developmental 0.06 0.04 1.62 .11
0.04 0.04 0.93 .35
Grade 1 Intercept 0.55 0.02 23.26 .00
0.56 0.03 17.33 .00
Combined (L) 0.08 0.03 2.47 .01
0.08 0.04 2.02 .04
Combined (H) 0.04 0.03 1.22 .22
0.00 0.04 -0.04 .97
Developmental 0.05 0.03 1.35 .18
0.05 0.04 1.21 .23
Grade 3 Intercept 1.36 0.02 56.61 .00
1.36 0.03 48.11 .00
Combined (L) 0.07 0.03 2.13 .03
0.06 0.04 1.70 .09
Combined (H) 0.05 0.03 1.61 .11
0.06 0.04 1.43 .15
Developmental 0.05 0.03 1.55 .12
0.04 0.04 1.02 .31
Grade 5 Intercept 1.44 0.03 56.95 .00
1.45 0.03 48.01 .00
Combined (L) 0.07 0.04 2.08 .04
0.04 0.04 0.92 .36
Combined (H) 0.06 0.03 1.72 .09
0.04 0.04 0.91 .37
Developmental 0.04 0.04 1.10 .27 0.02 0.04 0.42 .68
Note: The didactic program is the comparison group
101
Chapter 4 Discussion
9 Is Developmentally Appropriate Practice for Everyone?
Is Developmentally Appropriate Practice for Everyone? – this was the title of an article written
by Lubeck (1998), which raised concerns whether the developmentally appropriate practice
framework was broad enough to encompass the diverse needs of the various segments of the
U.S. population. In response, Charlesworth (1998) wrote an article entitled Developmentally
Appropriate Practice is for Everyone, affirming the universal applicability of developmentally
appropriate practices. In my dissertation, I sought to examine this issue further. First, I
investigated how many natural groupings of kindergarten teachers there were based on their self-
reported didactic and developmental teaching practices. Second, I examined program
availability of each of the programs based on school, teacher, and child demographics. Third, I
examined whether there were any differences among these kindergarten programs in how they
make use of their time in kindergarten. Lastly, I investigated which kindergarten program was
the most beneficial choice for children from different socioeconomic backgrounds in their
motivational and academic development.
The finding from the cluster analysis showed that there were 4 distinctive types of kindergarten
programs in the ECLS-K dataset for the 1998-1999 school year. These programs were labeled
didactic, combined (LO), combined (HI), and developmental kindergarten programs,
respectively. In the majority of previous studies which examined the effectiveness of
developmentally appropriate practices, the comparison group entailed only the didactic
“developmentally inappropriate” or “in contrast” practice (Copple & Bredekamp, 2009; Gallant,
102
2009; Pruitt, 2011). Only rarely did it include another eclectic, intermediate “mid-way”
program that entails elements of both the didactic and developmental programs (e.g., Marcon,
1994, 1999, Stipek, Daniels, Galluzo, & Milburn, 1992). In my study, in addition to the didactic
and developmental practices commonly found in other empirical studies, I found two types of
“mid-way” combined programs – one that provides a high dosage of both the didactic and the
developmental instructions and another that provides a low dosage of both types of instructions.
The existence of these two types of combined programs has practical and theoretical
implications. Firstly, thisimplies the need to consider the existence of the “intermediate”
program in future studies, as indicated by Marcon (1994) and Stipek, Daniels, Galluzo, &
Milburn, (1992). This is especially true since roughly half of the kindergarten teachers in both
the low and high SES conditions fell into this category in naturalistic settings in the 1999-2000
school year. The existence of the combined program points to a need to further elaborate on the
NAEYC’s developmentally appropriate practice framework to reflect the complexity of real-life
early childhood teaching practices. Secondly, the existence of the high and low combined
programs implies the need to revisit the theoretical framework which conceptualizes the didactic
and developmental practices as opposite sides of a unidimensional axis of teaching practice. The
limitations of conceptualizing teaching practices as a unidimensional construct is that the
teachers could be categorized as highly developmental, highly didactic, or in between, but not
high or low on both the developmental and the didactic practices. The existence of programs
that provide high and low dosages of both the didactic and the developmental practices, however,
implies that the didactic and developmental practices may not be opposite sides of a
dichotomous, unidimensional construct, but rather may be better conceptualized as a bi-
dimensional construct on two separate axes. This finding provides support to a
103
multidimensional conceptualization of early instructional practices exemplified by Stipek &
Byler’s (2004) early childhood classroom observation measure (ECCOM). ECCOM provides
two separate scales for didactic and child-centered practices, and allows for different degrees of
practices on both scales, including low scores on both, if neither types of instruction was
predominant, as was the case for the combined (LO) program in the current thesis. These
multidimensional measures can be expected to provide a more real-to-life assessment of the
teaching practices in early childhood education and contribute to a better understanding and
theorization of how teaching practices affect child outcomes.
The findings from the second research question documented some systematic differences at the
school, teacher, and child levels associated with the developmental, didactic, combined (LO) and
combined (HI) programs. The major characteristics of the developmental program was that the
children tended to be more advantaged in their general knowledge and self-control at the
beginning of kindergarten compared to the children in other programs, and the teachers tended to
have taken more courses in child development and be certified in early childhood education. The
teachers of the didactic program, on the other hand, tended to have taken fewer courses in child
development and have more experience teaching the upper elementary grades than the
developmental program teachers. The children of the combined (LO) program tended to have
lower scores in general knowledge and self-control, and the teachers tended to have taken fewer
courses in child development compared to those in the other programs. Finally, the combined
(HI) program tended to be public schools with high kindergarten entry requirements and high
academic goals during kindergarten, despite their children scoring low on general knowledge at
the beginning of kindergarten compared to the developmental program. In the low SES
condition, schools with combined (HI) programs tended to receive Title I funds applied to the
104
entire education program. In the high SES condition, the principals of schools with combined
(HI) programs tended to be highly educated, most of whom held a master’s degree. The teachers
of the combined (HI) program were more likely to hold an elementary school education
certificate and have taken more courses in early childhood education and reading pedagogy.
Concerning the second research question, it was hypothesized that schools with more
disadvantaged students were more likely to adopt the didactic approach, whereas schools with
more advantaged students were more likely to adopt a developmental approach (Bassok &
Rorem, 2013; Maxwell et al., 2001). Consistent with this hypothesis, children who scored higher
in general knowledge and self-control at the beginning of kindergarten were more likely to be
assigned to a developmental program compared to other types of programs. Furthermore,
consistent with the hypothesis that the disadvantaged children tended to be assigned to the
didactic approach, the LEP children in the high SES condition were more likely to be assigned to
a didactic program. However, there were two notable exceptions. Firstly, in the low SES
condition, the LEP students were more likely to be assigned to a combined (LO) program rather
than a didactic program. While the reason for this is still speculative due to lack of previous
research evidence, it is possible that the assignment of LEP students to the combined (LO)
condition in the low SES condition reflects the unfavorable learning environments for these
students, especially given that the teachers in the combined (LO) program had taken the fewest
number of courses in child development, and the students tended to score low in self-control and
general knowledge at the beginning of kindergarten. One interesting question to be investigated
in future studies is whether and how the teaching approaches for LEP students have changed,
especially after the No Child Left Behind Act of 2002 mandated high expectations for all
disadvantaged students including the LEP students. While previous studies have theorized that
105
some teachers may not subscribe to either of the didactic or the developmental approaches
(Stipek & Byler, 2004), the combined (LO) program provides such real-life instances of such
programs. Further observational studies are necessary to examine the characteristics of the
combined (LO) program.
Secondly, low SES schools that received Title I funding for the entire education program tended
to adopt a combined (HI) approach rather than a didactic approach. These schools also tended to
spend more time teaching the academic subjects compared to the other kindergarten programs.
The schools receiving Title I funding for the entire educational program may have favored the
combined (HI) approach, as some theorists suggest that the balanced approach is ideal for
striking a balance between meeting the developmental needs of the children and the academic
demands imposed by educational agencies (Gullo & Hughes, 2011; Ray & Smith, 2010). More
specifically, evidence-based literacy and math programs tend to endorse practices that explicitly
teach basic skills in a meaningful and rich environment (IRA/NAEYC, 1998; NAEYC/NCTM,
2010; National Reading Panel, 2000), which may be why public schools with Title I funding
would be utilizing combined (HI) approaches.
According to a study by Maxwell et al., (2001), teacher characteristics and beliefs were the best
predictors of early childhood teaching practices, above and beyond school and classroom
demographics. Irrespective of SES, teacher characteristics such as certification type, number of
courses taken, and experience teaching different grades were associated with teaching practices
in the predictable manner. As expected from previous research (Bryant, Clifford, & Peisner,
1991), teachers with greater knowledge of developmentally appropriate practices as indirectly
demonstrated by being certified in early childhood education, taking more courses in child
development, and having spent longer years teaching preschool, were more likely to adopt a
106
developmental approach. This is consistent with Vartuli’s (1999) research which reports that
teachers with early childhood education certification were likely to believe and adopt
developmentally appropriate practices. Similarly, teachers who had more experience teaching
upper elementary grades, and teachers who took fewer courses in child development were more
likely to mention they adopted a didactic approach.
An interesting hypothesis based on McMullen’s (1999) research was that teachers who hold
highly academic beliefs were more likely to adopt a didactic approach to kindergarten, but
teachers who hold highly developmental beliefs may not necessarily engage in developmental
practices. This was because previous studies have found that teacher education institutions
generally endorse values and practices consistent with the developmental approach (Jones, Burts
Buchanan, & Jambunathan, 2000) but teachers tend to be pressured into adopting a more didactic
approach, especially when the need for educational accountability is high (McMullen, 1999).
Consistent with this hypothesis, the current study found that the developmental beliefs (e.g.,
taking turns and sharing, not being disruptive, being sensitive to others and beliefs about the
importance of parents reading to children and playing games with their children) failed to
differentiate among the four kindergarten programs. On the other hand, kindergarten readiness
beliefs regarding basic skills (e.g., counting up to 20 or more, knowing English, knowing most of
the alphabet), benefits of preschool basic skills instruction, and kindergarten academic goals
differentiated the kindergarten teachers. Interestingly, however, the main contrast was not
between didactic kindergarten teachers and developmental kindergarten teachers as previously
assumed, but rather between the combined (HI) teachers who held highly academic beliefs and
goals, and developmental kindergarten teachers who were largely resistant to direct academic
instruction before elementary school. The fact that the developmental kindergarten teachers
107
were resistant to direct instruction is not surprising, especially since the primary concern for the
early childhood educators who advocated for the NAEYC’s developmental appropriate practice
framework was that the formal academic instruction was infiltrating early childhood education.
However, the fact that the didactic kindergarten teachers were not holding the highest academic
beliefs was somewhat unexpected.
The third research question investigated how time allocation differs among the didactic,
combined (LO), combined (HI) and developmental kindergartens, and how classroom SES was
related to teaching practices and time allocation. It was often assumed that teachers who adopt
didactic practices spend more time teaching academic subjects, while teachers who adopt a
developmental approach allocate more time to enrichment activities and recess (Miller & Almon,
2009). It was also hypothesized that low SES classrooms will allocate more time to academic
subjects than the high SES classrooms due to the pressure to achieve academically.
The hypothesis that low SES classrooms will spend more time teaching academic subjects than
high SES classrooms was supported by this study. Previous research found that children from
disadvantaged backgrounds benefit from the extra time spent on academic subjects (Scheerens &
Hendricks, 2014) and therefore it is likely that the low SES classrooms tried to maximize the
time spent teaching academic subjects, especially math and ESL, at the expense of time spent on
enrichment activities and recess. On the other hand, the hypothesis that low SES classrooms
would be more likely than high SES classrooms to take a didactic approach was not supported.
In fact, teaching approaches was largely orthogonal to classroom SES. Teachers in both the high
and low SES classrooms were equally likely to adopt each of the four teaching approaches. This
finding is inconsistent with previous studies that have found that low SES classrooms were more
likely to favor didactic approaches to instruction, partly because the parents of disadvantaged
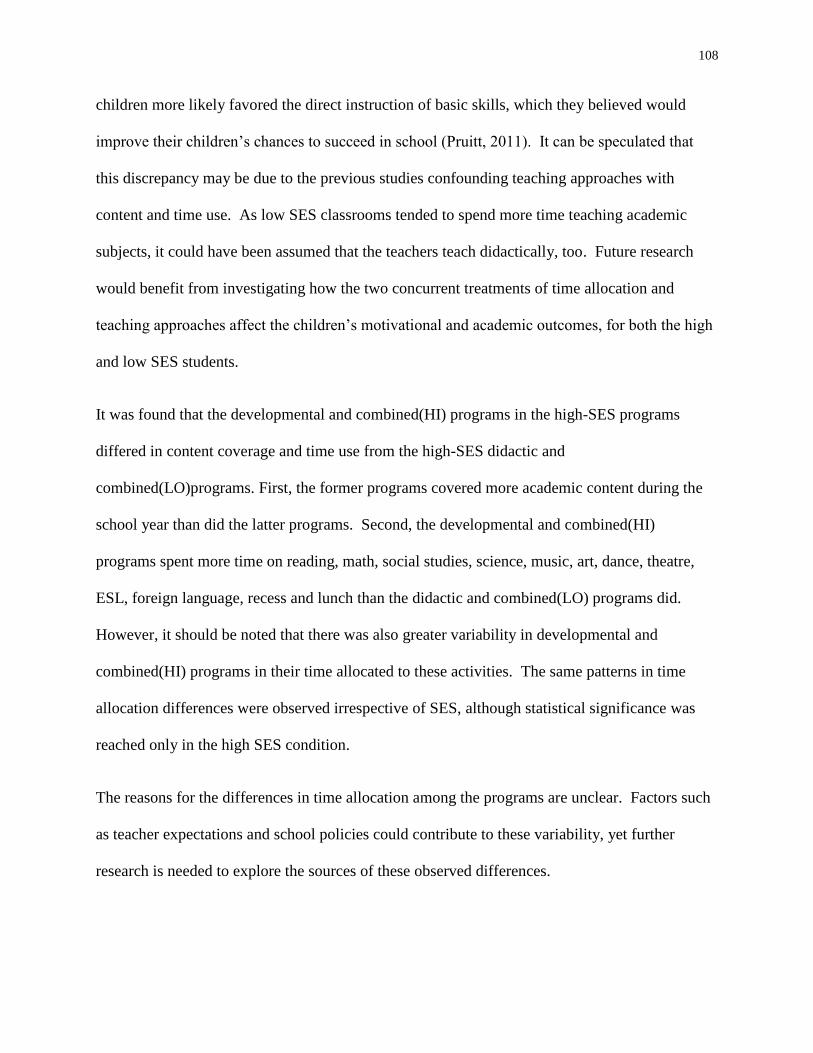
108
children more likely favored the direct instruction of basic skills, which they believed would
improve their children’s chances to succeed in school (Pruitt, 2011). It can be speculated that
this discrepancy may be due to the previous studies confounding teaching approaches with
content and time use. As low SES classrooms tended to spend more time teaching academic
subjects, it could have been assumed that the teachers teach didactically, too. Future research
would benefit from investigating how the two concurrent treatments of time allocation and
teaching approaches affect the children’s motivational and academic outcomes, for both the high
and low SES students.
It was found that the developmental and combined(HI) programs in the high-SES programs
differed in content coverage and time use from the high-SES didactic and
combined(LO)programs. First, the former programs covered more academic content during the
school year than did the latter programs. Second, the developmental and combined(HI)
programs spent more time on reading, math, social studies, science, music, art, dance, theatre,
ESL, foreign language, recess and lunch than the didactic and combined(LO) programs did.
However, it should be noted that there was also greater variability in developmental and
combined(HI) programs in their time allocated to these activities. The same patterns in time
allocation differences were observed irrespective of SES, although statistical significance was
reached only in the high SES condition.
The reasons for the differences in time allocation among the programs are unclear. Factors such
as teacher expectations and school policies could contribute to these variability, yet further
research is needed to explore the sources of these observed differences.
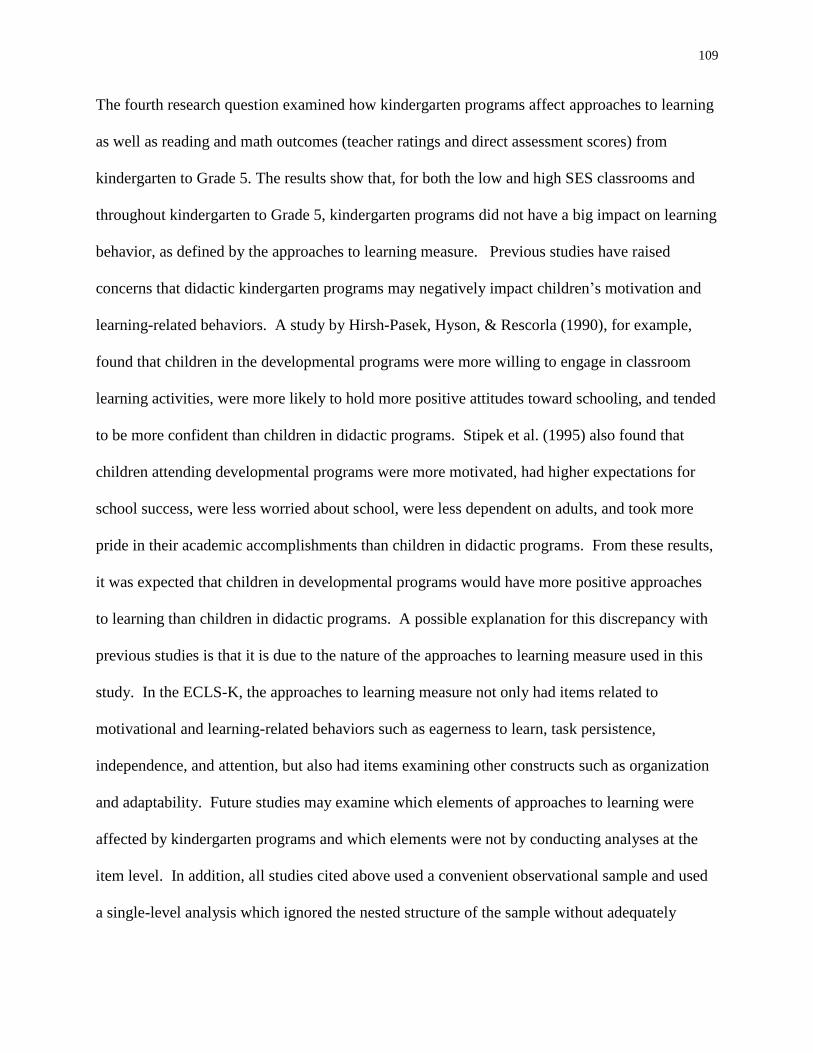
109
The fourth research question examined how kindergarten programs affect approaches to learning
as well as reading and math outcomes (teacher ratings and direct assessment scores) from
kindergarten to Grade 5. The results show that, for both the low and high SES classrooms and
throughout kindergarten to Grade 5, kindergarten programs did not have a big impact on learning
behavior, as defined by the approaches to learning measure. Previous studies have raised
concerns that didactic kindergarten programs may negatively impact children’s motivation and
learning-related behaviors. A study by Hirsh-Pasek, Hyson, & Rescorla (1990), for example,
found that children in the developmental programs were more willing to engage in classroom
learning activities, were more likely to hold more positive attitudes toward schooling, and tended
to be more confident than children in didactic programs. Stipek et al. (1995) also found that
children attending developmental programs were more motivated, had higher expectations for
school success, were less worried about school, were less dependent on adults, and took more
pride in their academic accomplishments than children in didactic programs. From these results,
it was expected that children in developmental programs would have more positive approaches
to learning than children in didactic programs. A possible explanation for this discrepancy with
previous studies is that it is due to the nature of the approaches to learning measure used in this
study. In the ECLS-K, the approaches to learning measure not only had items related to
motivational and learning-related behaviors such as eagerness to learn, task persistence,
independence, and attention, but also had items examining other constructs such as organization
and adaptability. Future studies may examine which elements of approaches to learning were
affected by kindergarten programs and which elements were not by conducting analyses at the
item level. In addition, all studies cited above used a convenient observational sample and used
a single-level analysis which ignored the nested structure of the sample without adequately
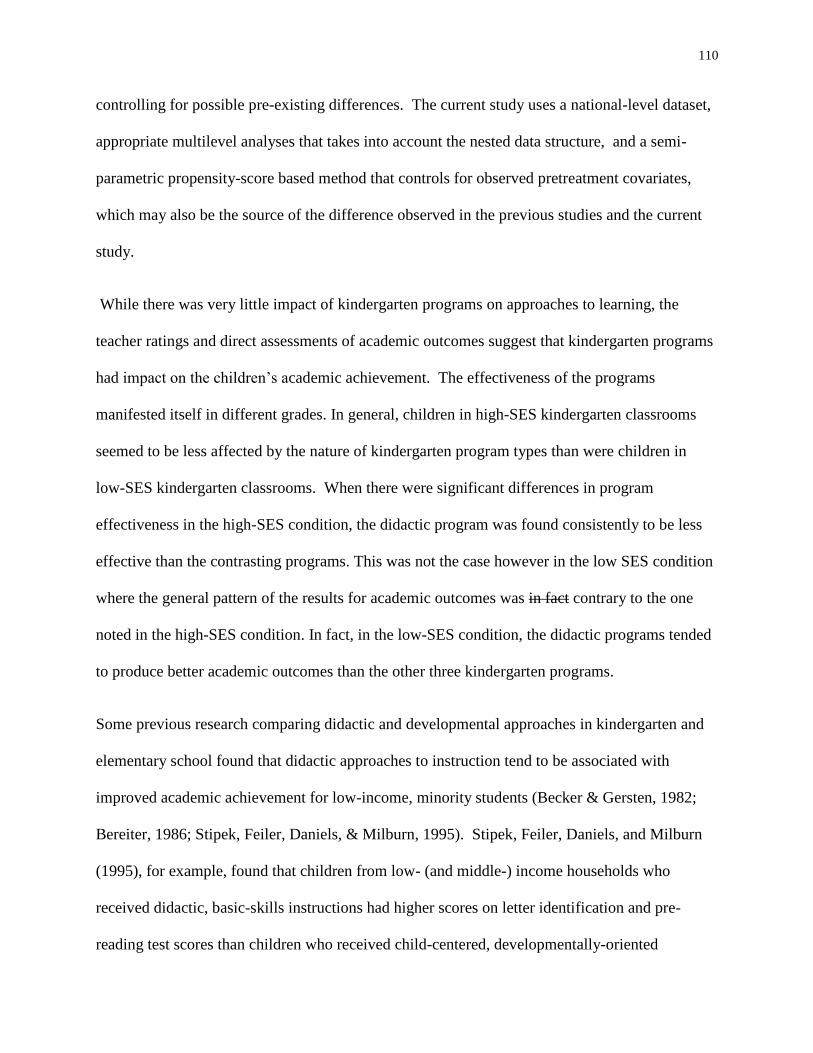
110
controlling for possible pre-existing differences. The current study uses a national-level dataset,
appropriate multilevel analyses that takes into account the nested data structure, and a semi-
parametric propensity-score based method that controls for observed pretreatment covariates,
which may also be the source of the difference observed in the previous studies and the current
study.
While there was very little impact of kindergarten programs on approaches to learning, the
teacher ratings and direct assessments of academic outcomes suggest that kindergarten programs
had impact on the children’s academic achievement. The effectiveness of the programs
manifested itself in different grades. In general, children in high-SES kindergarten classrooms
seemed to be less affected by the nature of kindergarten program types than were children in
low-SES kindergarten classrooms. When there were significant differences in program
effectiveness in the high-SES condition, the didactic program was found consistently to be less
effective than the contrasting programs. This was not the case however in the low SES condition
where the general pattern of the results for academic outcomes was in fact contrary to the one
noted in the high-SES condition. In fact, in the low-SES condition, the didactic programs tended
to produce better academic outcomes than the other three kindergarten programs.
Some previous research comparing didactic and developmental approaches in kindergarten and
elementary school found that didactic approaches to instruction tend to be associated with
improved academic achievement for low-income, minority students (Becker & Gersten, 1982;
Bereiter, 1986; Stipek, Feiler, Daniels, & Milburn, 1995). Stipek, Feiler, Daniels, and Milburn
(1995), for example, found that children from low- (and middle-) income households who
received didactic, basic-skills instructions had higher scores on letter identification and pre-
reading test scores than children who received child-centered, developmentally-oriented
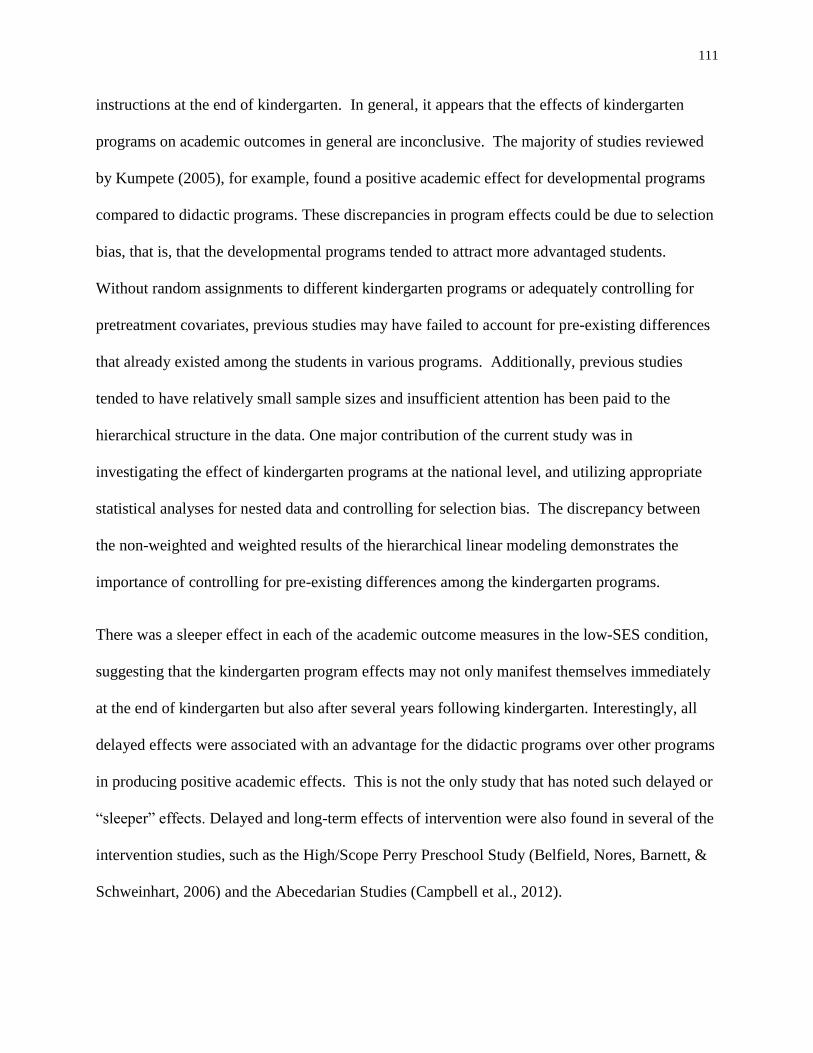
111
instructions at the end of kindergarten. In general, it appears that the effects of kindergarten
programs on academic outcomes in general are inconclusive. The majority of studies reviewed
by Kumpete (2005), for example, found a positive academic effect for developmental programs
compared to didactic programs. These discrepancies in program effects could be due to selection
bias, that is, that the developmental programs tended to attract more advantaged students.
Without random assignments to different kindergarten programs or adequately controlling for
pretreatment covariates, previous studies may have failed to account for pre-existing differences
that already existed among the students in various programs. Additionally, previous studies
tended to have relatively small sample sizes and insufficient attention has been paid to the
hierarchical structure in the data. One major contribution of the current study was in
investigating the effect of kindergarten programs at the national level, and utilizing appropriate
statistical analyses for nested data and controlling for selection bias. The discrepancy between
the non-weighted and weighted results of the hierarchical linear modeling demonstrates the
importance of controlling for pre-existing differences among the kindergarten programs.
There was a sleeper effect in each of the academic outcome measures in the low-SES condition,
suggesting that the kindergarten program effects may not only manifest themselves immediately
at the end of kindergarten but also after several years following kindergarten. Interestingly, all
delayed effects were associated with an advantage for the didactic programs over other programs
in producing positive academic effects. This is not the only study that has noted such delayed or
“sleeper” effects. Delayed and long-term effects of intervention were also found in several of the
intervention studies, such as the High/Scope Perry Preschool Study (Belfield, Nores, Barnett, &
Schweinhart, 2006) and the Abecedarian Studies (Campbell et al., 2012).
112
There was one noteworthy exception to this pattern for the low-SES condition, however. The
teacher ratings of reading and math were significantly higher for low-SES children who attended
developmental kindergartens than low-SES children who attended didactic kindergartens at the
end of kindergarten. This pattern was only observed in the teacher ratings at the end of
kindergarten and not in other grades, and was not reflected in the direct assessment of reading
and math.
It is important to note that discrepancies between the findings from the direct assessment and
teacher ratings have been also reported by Kumtepe’s (2005). Some potential reasons for this
finding include teacher bias, features of the teacher ratings measure used in the present study,
and selection bias. Studies examining the validity of teacher assessments have generally found
the correlation of the teacher ratings with standardized measures of student achievement to be
moderate to high (Hoge & Coladarci, 1989), and the reliability of the academic rating scale used
in the ECLS-K in particular was found to be very high (NCES, 2009). Some researchers
maintain that teacher ratings are more accurate than one-time direct assessments because
teachers have the opportunities to observe and interact with their children on a daily basis
(Meisels, Bickel, Nicholson, Xue, & Atkins-Burnett, 2001). However, other researchers voice
concerns about the validity of teacher ratings, arguing that teachers’ judgments could be biased
and affected by their own expectations (Hoge & Coladarci, 1989). This is especially the case
because the teachers are both the providers of the kindergarten instruction and the assessors of
their children’s progress. The discrepancy between teacher ratings and direct assessment
measures could be also attributed to the academic rating scale containing some constructs that
were not assessed in the direct cognitive assessments used in ECLS-K, such as components of
writing, speaking, listening in the reading subscale, and the use of various measuring instruments
113
in the math subscale. Therefore, the gain in the teacher rating at the end of kindergarten could
also be attributed to actual change in children’s abilities not captured in the direct assessments.
Finally, it should be noted that, even when statistical significance was observed among the
groups, the effect sizes were small. The largest observed effect was between the didactic and
combined(HI) programs in Grade 5 for the direct assessment in math, with the effect size of 0.28
(95% CI: 0.06, 0.50). Therefore, the magnitude of the group differences, even when
significant,were found to be modest.
9.1.1 Limitations and Future Studies
One of the limitations of the current study is the potential measurement error associated with the
SES variable. The SES variable used in this dissertation was a classroom-level aggregate of the
child-level compound SES variable, which was created using information from the parent
interview regarding parental education, occupation prestige and household income. This
variable was used instead of the school-level measure of free and reduced lunch, because
research shows that parental educational resources can be considered more important than mere
household income, especially for children from immigrant families. Including an SES composite
measure typically reduces measurement error compared to a single indicator of SES.
Nevertheless, the measurement error of this SES measure, when used as a measure for classroom
SES, may have increased due to the small number of students sampled from each class. An
attempt was made to validate this classroom SES measure using school-level percentage of free-
lunch eligible students, de-aggregated to the classroom level as the criterion variable. There was
a significant association between the classroom SES measure used in this study and the
114
percentage of free-lunch eligible students. Yet, future studies should examine whether the
findings from the current study can be replicated with alternate measures of SES.
A second limitation concerns the use of teachers’ self-report and teacher report of students’
performance. While large-scale studies frequently rely on self-report measures as a relatively
low-cost and efficient means of collecting information (Mayer, 1999), relatively little is known
about their validity and reliability for measuring teaching practices. Although researchers may
use survey items as proxy measures to represent certain constructs (e.g., developmental
practices) the items may not necessarily measure the intended construct (Rowan, Correnti, &
Miller, 2002). In addition, the teachers’ ratings related to their instructional practices and student
performance may reflect their ideals and expectations rather than their actual instructional
practices and student performance (Berger & Kaiser, 2007).
The third limitation relates to the latent construct for didactic practices. The didactic practices
construct relied only on 3 observed measures (teacher-directed whole-class activities, reading
workbooks / worksheets, and math workbooks / worksheets), and the reliability of the measure
was low (Cronbach’s alpha =.58). Therefore, the validity and reliability of this latent construct is
restricted.
The fourth limitation is related to the use of two-step cluster analysis for classifying teachers into
naturally-occurring, distinct groups. Cluster analysis was used in former studies examining
kindergarten teaching practices (e.g., Marcon, 1994; 1999). The two-step cluster analysis has
advantages over other conventional clustering algorithms such as k-means and hierarchical
clustering because it allows for different types of measurement to be used in one analysis, and
because the number of clusters is automatically determined (Bacher, Wenzig, & Vogler, 2004).
In the present study, the cluster analysis yielded four groups of approximately equal size, with
115
good cohesion and separation. Nevertheless, it could be argued that there are very small
differences among teachers on the borderline of each of the program types. Future studies may
conduct sensitivity analyses by removing cases at the border of each of the clusters. Moreover,
cluster analysis is less powerful than model-based techniques such as latent class or mixture
model analysis for clustering, because it is data-driven rather than based on theory. Therefore
future studies should examine whether the same cluster structure holds using model-based
techniques for determining the clusters.
The present study focused on the impact of socioeconomic status on children’s responsiveness to
kindergarten teaching practices. Other important child demographic characteristics, such as
gender, ethnicity, and limited English proficiency status, were considered merely as part of the
pretreatment covariates in the propensity model. At the same time it is important to acknowledge
that these variables have also been shown to impact kindergarten teaching effectiveness, and
therefore future studies should examine the potential impact of these covariates more explicitly
as potential moderators in the statistical model.
Relatedly, one potential direction for future research concerns the examination of the combined
programs, especially the combined(HI) programs, which were found to have limited
effectiveness in the current study, especially in the low-SES condition. There is a possibility that
the effectiveness of the combined(HI) programs depends on certain teacher and student
characteristics. Further research is necessary to examine whether certain conditions make
combined approaches more effective.
A major assumption of propensity-score based methods is that there are no major unobserved
confounders that were not included in the propensity score model. Although great care was taken
116
to control for all major pretreatment covariates, there may be some unobserved pretreatment
covariates that were not taken into account. A sensitivity analysis would have shown how
unobserved pretreatment covariates would have influenced the program effects.
Finally, some schools may be philosophically committed to certain types of teaching programs
(e.g., the Montessori programs) and this kind of commitment may have influenced the
curriculum of the entire school across multiple grades. The current study only focused on the
impact of kindergarten program on the outcome at the end of kindergarten and in subsequent
grades. Future studies could also examine the cumulative effects of receiving certain types of
programs across a longer time span.
9.1.2 Conclusion
Notwithstanding these limitations, this research makes some important contribution to the
literature, and the outcomes have important implications. Firstly, the study provided evidence of
the long-term effects of kindergarten programs on children’s academic achievement, a
connection that has long been argued by educational researchers (Burts et al., 1993; Van Horn &
Ramey, 2003). Secondly, this study overcame several methodological difficulties in this field by
using large-scale observational data, appropriate multilevel techniques and causal inference
methods to examine the effects of kindergarten teaching practices on children’s approaches to
learning, as well as on teacher ratings and direct assessments of children’s reading and math
outcomes from kindergarten to Grade 5. Thirdly, the existence of the two combined programs
points to the need to refine the current theory of developmentally appropriate teaching practices
and examine further the effects of such eclectic practices. Fourthly, the significant difference
observed in the effectiveness of teaching practices based on socioeconomic status contributes to
117
the discussions of developmentally appropriate teaching practices for children living in various
social contexts. The results suggest that “one size does not fit all”. Each of these results has
significant implications for both the theorization and the practices of early childhood instruction,
and they point to the necessity for further studies to examine the differential effectiveness of
kindergarten practices based on pivotal background characteristics.
118
References
Ackerman, D. J., Barnett, W. S., & Robin, K. B. (2005). Making the most of kindergarten:
Present trends and future issues in the provision of full-day programs. New Brunswick,
NJ: NIEER.
Bacher, J., Wenzig, K., & Vogler, M. (2004). SPSS two-step cluster–a first evaluation.
Retrieved from Social Science Open Access Repository website:
http://www.ssoar.info/ssoar/handle/document/32715
Bandura, A. (1986). Social foundations of thought and action: A social-cognitive view.
Englewood Cliffs, NJ: Prentice-Hall.
Barnett, W. S. (1996). Lives in the balance: Age-27 benefit-cost analysis of the HighScope Perry
Preschool Program (Monographs of the HighScope Educational Research Foundation,
11). Ypsilanti, MI: HighScope.
Barnett, W. S., & Masse, L. N. (2007). Comparative benefit–cost analysis of the Abecedarian
program and its policy implications. Economics of Education Review, 26(1), 113–125.
doi:10.1016/j.econedurev.2005.10.007
Bassok, D. (2012). Competition or collaboration? Head Start enrollment during the rapid
expansion of state pre-kindergarten. Educational Policy, 26(1), 96-116.
doi:10.1177/0895904811428973
Bassok, D. P., & Rorem, A. (2013). Is kindergarten the new first grade? The changing nature of
kindergarten in the age of accountability. Retrieved from University of Virginia, Curry
School of Education website:
http://curry.virginia.edu/uploads/resourceLibrary/20_Bassok__Is_Kindergarten_The_Ne
w_First_Grade.pdf
Beatty, B. (1995). Preschool education in America. New Haven, CT: Yale University.
119
Beatty, B. (2011). The dilemma of scripted instruction: Comparing teacher autonomy, fidelity,
and resistance in the Froebelian Kindergarten, Montessori, direct instruction, and success
for all. Teachers College Record, 113(3), 395-430. Retrieved from
http://www.tcrecord.org/Content.asp?ContentID=16048
Becker, W. C., & Gersten, R. (1982). A follow-up of follow through: The later effects of the
Direct Instruction Model on children in fifth and sixth grades. American Educational
Research Journal, 19(1), 75-92. doi:10.3102/00028312019001075
Belfield, C. R., Nores, M., Barnett, S., & Schweinhart, L. (2006). The High/Scope Perry
Preschool Program cost–benefit analysis using data from the age-40 followup. Journal of
Human Resources, 41(1), 162-190. doi:10.3368/jhr.XLI.1.162
Bereiter, C. (1986). ‘Mountains of evidence’ said to contradict study effects of preschool [Letter
to the editor]. Education Week, 5, 37.
Berger, J., & Kaiser, L. (2008, August). Assessment of teacher classroom instructional practices.
Poster presented at the annual meeting of the American Psychological Association,
Boston, MA.
Berliner, D. C. (1990). What’s all the fuss about instructional time? In M. Ben-Peretz & R.
Bromme (Eds.), The nature of time in schools: Theoretical concepts, practitioner
perceptions (pp. 3-35). New York: Teachers College.
Bredekamp, S. (Ed.). (1987). Developmentally appropriate practice in early childhood programs
serving children from birth through age 8. Washington, DC: NAEYC.
Bredekamp, S., & Copple, C. (Eds.). (1997). Developmentally appropriate practice in early
childhood programs. Washington, DC: National Association for the Education of Young
Children.
Bredekamp, S., & Rosegrant, T. (Eds.). (1992). Reaching potentials: Appropriate curriculum
and assessment for young children (Vol. 1). Washington, DC: National Association for
the Education of Young Children.
120
Brown, C. P., & Lan, Y.-C. (2015). A qualitative metasynthesis of how early educators in
international contexts address cultural matters that contrast with developmentally
appropriate practices. Early Education and Development, 26(1), 22–45.
doi:10.1080/10409289.2014.934176
Bruno, R., & Adams, A. (1994). School enrollment: Social and economic characteristics of
students, October, 1993. (Current Population Report P20479). Retrieved from U. S.
Bureau of the Census website: https://www.census.gov/hhes/school/data/cps/1993/p20-
479.pdf
Bryant, D. M., & Clifford, R. M. (1992). 150 years of kindergarten: How far have we come?
Early Childhood Research Quarterly, 7(2), 147-154. doi:10.1016/0885-2006(92)90001-F
Bryant, D. M., Clifford, R. M., & Peisner, E. S. (1991). Best practices for beginners:
Developmental appropriateness in kindergarten. American Educational Research
Journal, 28(4), 783–803. doi:10.3102/00028312028004783
Burger, K. (2010). How does early childhood care and education affect cognitive development?
An international review of the effects of early interventions for children from different
social backgrounds. Early Childhood Research Quarterly, 25, 140–165.
doi:10.1016/j.ecresq.2009.11.001
Burts, D. C., Charlesworth, R., & Fleege, P. O. (1991). Achievement of kindergartners in
developmentally appropriate and developmentally inappropriate classrooms.
Presentation at the Society for Research in Child Development, Seattle, WA.
Burts, D., Hart, C., Charlesworth, R., DeWolf, D. M., Ray, J., Manuel, K., & Fleege, P. (1993).
Developmental appropriateness of kindergarten programs and academic outcomes in first
grade. Journal of Research in Childhood Education, 8(1), 23–31.
doi:10.1080/02568549309594852
Burts, D. C., Hart, C. H., Charlesworth, R., Fleege, P. O., Mosley, J., & Thomasson, R. H.
(1992). Observed activities and stress behaviors of children in developmentally
121
appropriate and inappropriate kindergarten classrooms. Early Childhood Research
Quarterly, 7(2), 297–318. doi:10.1016/0885-2006(92)90010-V
Burts, D. C., Hart, C. H., Charlesworth, R., & Kirk, L. (1990). A comparison of frequencies of
stress behaviors observed in kindergarten children in classrooms with developmentally
appropriate versus developmentally inappropriate instructional practices. Early
Childhood Research Quarterly, 5(3), 407–423. doi:10.1016/0885-2006(90)90030-5
Campbell, F. A., Pungello, E. P., Burchinal, M., Kainz, K., Pan, Y., Wasik, B. H., . . . Ramey, C.
T. (2012). Adult outcomes as a function of an early childhood educational program: An
Abecedarian Project follow-up. Developmental Psychology, 48(4), 1033-1043.
doi:10.1037/a0026644
Carroll, J. (1963). A model of school learning. The Teachers College Record, 64(8), 723-723.
Carroll, J. B. (1989). The Carroll model: A 25-year retrospective and prospective view.
Educational Researcher, 18(1), 26–31. doi:10.3102/0013189X018001026
Case, R. (1998). The development of conceptual structures. In W. Damon (Series Ed.) & D.
Kuhn & R. S. Siegler (Vol. Eds.), Handbook of child psychology: Vol. 2: Cognition,
perception & language (5th ed., pp. 745-764). New York: Wiley.
Charlesworth, R. (1998). Developmentally appropriate practice is for everyone. Childhood
Education, 74(5), 274–282. doi:10.1080/00094056.1998.10521951
Charlesworth, R., Hart, C. H., Burts, D. C., & DeWolf, M. (1993). The LSU studies: Building a
research base for developmentally appropriate practice. In S. Reifel (Ed.), Advances in
early education and day care: Vol. 5. Perspectives on developmentally appropriate
practice, pp. 3-28. Greenwich, CT: JAI.
Cheung, G. W., & Rensvold, R. B. (2002). Evaluating goodness-of-fit indexes for testing
measurement invariance. Structural equation modeling, 9(2), 233-255.
doi:10.1207/S15328007SEM0902_5Cochran, W. G. (1968). The effectiveness of
122
adjustment by subclassification in removing bias in observational studies. Biometrics,
295-313. doi:10.2307/2528036
Copple, C., & Bredekamp, S. (Eds.). (2009). Developmentally appropriate practice in early
childhood programs serving children from birth through age 8 (3rd
ed.). Washington,
DC: National Association for the Education of Young Children.
Cuban, L. (1992). Why some reforms last: The case of the kindergarten. American Journal of
Education, 166-194. doi:10.1086/444013
Dewey, J. (1915). Froebel’s educational principles. In The school and society, pp. 111-127.
Chicago, IL: University of Chicago. Dombkowski, K. (2001). Will the real kindergarten
please stand up? Defining and redefining the twentieth-century US kindergarten. History
of Education, 30(6), 527-545. doi:10.1080/00467600110064762
Downs, R. B. (1978). Friedrich Froebel. Boston, MA: Twayne.
Dunn, L., & Kontos, S. (1997). What have we learned about developmentally appropriate
practice? Research in review. Young Children, 52(5), 4-13.
Elicker, J., & Mathur, S. (1997). What do they do all day? Comprehensive evaluation of a full-
day kindergarten. Early Childhood Research Quarterly, 12(4), 459-480.
doi:10.1016/S0885-2006(97)90022-3
Erikson, E. H. (1963). Childhood and society (2nd
ed.). New York, NY: Norton.
Ferrari, M., & Vuletic, L. (Eds.). (2010). Development of mind, brain, and education: Essays in
honor of Robbie Case. Amsterdam, The Netherlands: Springer.
Ferreiro, E., & Teberosky, A. (1982). Literacy before schooling. Portsmouth, NH: Heinemann.
Finkelstein, B. (1988). The revolt against selfishness: Women and the dilemmas of
professionalism in early childhood education. In B. Spodek, O. N. Saracho, & D. L.
Peters (Eds.), Professionalism and the early childhood practitioner. New York, NY:
Teachers College.
123
Fischer, K. W. (1980). A theory of cognitive development: The control and construction of
hierarchies of skills. Psychological Review, 87, 477-531. doi:10.1037/0033-
295X.87.6.477
Flavell, J. H. (1982). On cognitive development. Child Development, 53(1), 1-10.
doi:10.1111/1467-8624.ep8587504
Frede, E., & Barnett, W. S. (1992). Developmentally appropriate public school preschool: A
study of implementation of the high/scope curriculum and its effects on disadvantaged
children’s skills at first grade. Early Childhood Research Quarterly, 7(4), 483–499.
doi:10.1016/0885-2006(92)90034-V
Fromberg, D. P. (2006). Kindergarten education and early childhood teacher education in the
United States: Status at the start of the 21st Century. Journal of Early Childhood Teacher
Education, 27(1), 65-85. doi: 10.1080/10901020500527145
Gallant, P. (2009). Kindergarten teachers speak out: “Too much, too soon, too fast!” Reading
Horizons, 49(3). Retrieved from
http://scholarworks.wmich.edu/reading_horizons/vol49/iss3/3
Gullo, D. F., & Hughes, K. (2011). Reclaiming kindergarten: Part I. Questions about theory and
practice. Early Childhood Education Journal, 38(5), 323–328. doi:10.1007/s10643-010-
0429-6
Hatch, J. A. (2012). From theory to curriculum: Developmental theory and its relationship to
curriculum and instruction in early childhood education. In N. File, J. J. Mueller, & D. B.
Wisneski (Eds.), Curriculum in early childhood education: Re-examined, rediscovered,
renewed (pp. 42-53). New York, NY: Routledge.
Hirsh-Pasek, K., Hyson, M. C., & Rescorla, L. (1990). Academic environments in preschool: Do
they pressure or challenge young children. Early Education & Development, 1(6), 401–
423. doi:10.1207/s15566935eed0106_1
124
Hoge, R. D., & Coladarci, T. (1989). Teacher-based judgments of academic achievement: A
review of literature. Review of Educational Research, 59(3), 297-
313. doi:10.3102/00346543059003297
Holland, P. W. (1986). Statistics and causal inference. Journal of the American statistical
Association, 81(396), 945-960. doi:10.1080/01621459.1986.10478354
Hong, G. (2010). Marginal mean weighting through stratification: Adjustment for selection bias
in multilevel data. Journal of Educational and Behavioral Statistics, 35(5), 499–531.
doi:10.3102/1076998609359785
Hong, G. (2012). Marginal mean weighting through stratification: A generalized method for
evaluating multivalued and multiple treatments with nonexperimental data. Psychological
Methods, 17(1), 44–60. doi:10.1037/a0024918
Howes, C., & Olenick, M. (1986). Family and child care influences on toddler’s compliance.
Child Development, 57(1), 202-216. doi:10.1111/1467-8624.ep7251044
Hsue, Y., & Aldridge, J. (1995). Developmentally appropriate and traditional Taiwanese culture.
Journal of Instructional Psychology, 22(4), 320-323.
Huffman, L. R., & Speer, P. W. (2000). Academic performance among at-risk children: The role
of developmentally appropriate practices. Early Childhood Research Quarterly, 15, 167-
184. doi:10.1016/S0885-2006(00)00048-X
Hyson, M. C., Hirsh-Pasek, K., & Rescorla, L. (1990). The classroom practices inventory: An
observation instrument based on NAEYC's guidelines for developmentally appropriate
practices for 4-and 5-year-old children. Early Childhood Research Quarterly, 5(4), 475-
494. doi:10.1016/0885-2006(90)90015-S
IRA/NAEYC (1998). Learning to read and write: Developmentally appropriate practices for
young children. Young Children, 53(4), 30-46. Retrieved from
https://www.naeyc.org/files/naeyc/file/positions/PSREAD98.PDF
125
Jeynes, W. (2006). Standardized tests and Froebel’s original kindergarten model. The Teachers
College Record, 108(10), 1937–1959. Retrieved from
http://www.tcrecord.org/Content.asp?ContentId=12717
Jones, L. D., Burts, D. C., Buchanan, T. K., & Jambunathan, S. (2000). Beginning
prekindergarten and kindergarten teachers' beliefs and practices: Supports and barriers to
developmentally appropriate practices. Journal of Early Childhood Teacher Education,
21(3), 397-410. doi:10.1080/0163638000210310
Kagan, S. L., & Kauerz, K. (2006). Making the most of kindergarten: Trends and policy issues.
Retrieved from National Association for the Education of Young Children website:
http://www.naeyc.org/files/naeyc/file/Play/KTodayPolicy.pdf
Kamii, C. (1994). Young children continue to reinvent arithmetic: 3rd grade. New York, NY:
Teachers College.
Karweit, N., & Slavin, R. E. (1981). Measurement and modeling choices in studies of time and
learning. American Educational Research Journal, 18(2), 157-171.
doi:10.3102/00028312018002157
Kauerz, K. (2005). Full-day kindergarten: A study of state policies in the United States.
Retrieved from Education Commission of the States website:
http://www.ecs.org/clearinghouse/62/41/6241.pdf
Kessler, S. A., & Swadener, B. B. (Eds.). (1992). Reconceptualizing the early childhood
curriculum: Beginning the dialog. New York, NY: Teachers College.
Kumtepe, A. T. (2005). The effects of developmentally appropriate practices on children’s
reading development from kindergarten through third grade (Doctoral dissertation,
Florida State University). Retrieved from
http://diginole.lib.fsu.edu/cgi/viewcontent.cgi?article=3186&context=etd
126
Lonergan, B. (1988). Topics in education: The Cincinnati lectures of 1959 on the philosophy of
education. In R. M. Doran & F. E. Crowe (Eds.), Collected works of Bernard Lonergan,
Volume 10. Toronto, Canada: University of Toronto.
Love, J. M., Ryer, P., & Faddis, B. (1992). Caring environments: Program quality in
California's publicly funded child development programs: Report on the legislatively
mandated 1990-91 staff/child ratio study. Portsmouth, NH: RMC Research Corporation.
Lubeck, S. (1998). Is developmentally appropriate practice for everyone? Childhood Education,
74(5), 283–292. doi:10.1080/00094056.1998.10521952
Mantzicopoulos, P. Y., Neuharth-Pritchett, S., & Morelock, J. B. (1994, April). Academic
competence, social skills, and behavior among disadvantaged children in
developmentally appropriate and inappropriate classrooms. Paper presented at the
Annual Meeting of the American Educational Research Association, New Orleans.
Mantzicopoulos, P., & Neuharth-Pritchett, S. (1995). Classroom environments, parental
involvement, and children’s school achievement and adjustment: Two-year results from a
Head Start early school transition demonstration program. Paper presented at the annual
meeting of the American Education Research Association. San Francisco, CA.
Marcon, R. A. (1994). Doing the right thing for children: Research and policy reform in the
District of Columbia public schools. Young Children, 50(1), 8-20.
Marcon, R. A. (1999). Positive relationships between parent school involvement and public
school inner-city preschoolers' development and academic performance. School
Psychology Review, 28(3), 395-412.
Maxwell, K. L., McWilliam, R. A., =Hemmeter, M. L., Ault, M. J., & Schuster, J. W. (2001).
Predictors of developmentally appropriate classroom practices in kindergarten through
third grade. Early Childhood Research Quarterly, 16(4), 431–452. doi:10.1016/S0885-
2006(01)00118-1
127
Mayer, D. (1999). Measuring instructional practices: Can policymakers trust survey data?
Educational Evaluation and Policy Analysis, 21, 29-45.
McCartney, K. (1984). Effect of quality of day care environment on children's language
development. Developmental Psychology, 20(2), 244. doi:10.1037/0012-1649.20.2.244
McMullen, M. B. (1999). Characteristics of teachers who talk the DAP talk and walk the DAP
walk. Journal of Research in Childhood Education, 13(2), 216-330.
doi:10.1080/02568549909594742
Meisels, S. J., Bickel, D. D., Nicholson, J., Xue, Y., & Atkins-Burnett, S. (2001). Trusting
teachers’ judgments: A validity study of a curriculum-embedded performance assessment
in kindergarten to grade 3. American Educational Research Journal, 38(1), 73-
95. doi:10.3102/00028312038001073
Miller, E., & Almon, J. (2009). Crisis in the kindergarten: Why children need to play in school.
Retrieved from Alliance for Childhood website:
http://www.allianceforchildhood.org/sites/allianceforchildhood.org/files/file/kindergarten
_report.pdf
Morton, B. A., & Dalton, B. (2007). Changes in instructional hours in four subjects by public
school teachers of Grades 1 through 4 (Stats in brief, NCES 2007-305). Retrieved from
the National Center for Education Statistics website:
http://nces.ed.gov/pubs2007/2007305.pdf
NAEYC/NCTM (2010). Early childhood mathematics: Promoting good beginnings. Retrieved
from the National Association for the Education of Young Children website:
https://www.naeyc.org/files/naeyc/file/positions/psmath.pdf
Najarian, M., Pollack, J. M., Sorongon, A. G., & Hausken, E. G. (2009). Early Childhood
Longitudinal Study, Kindergarten class of 1998–99 (ECLS-K): Psychometric report for
the eighth grade. Retrieved from the National Center for Education Statistics website:
http://nces.ed.gov/pubs2009/2009002.pdf
128
National Institute of Child Health and Human Development. (2000). Report of the National
Reading Panel. Teaching children to read: an evidence-based assessment of the scientific
research literature on reading and its implications for reading instruction. Retrieved
from the National Reading Panel website:
http://nationalreadingpanel.org/Publications/summary.htm
National Commission on Excellence in Education. (1983). A nation at risk: The imperative for
educational reform. Retrieved from the U.S. Department of Education website:
http://www2.ed.gov/pubs/NatAtRisk/index.html
Pascal, C. E. (2009). With our best future in mind: Implementing early learning in Ontario:
Report to the Premier by the Special Advisor on Early Learning. Retrieved from
Government of Ontario website: http://www.ontario.ca/document/our-best-future-mind-
implementing-early-learning-ontario
Piaget, J. (1964). Part I: Cognitive development in children: Piaget development and learning.
Journal of Research in Science Teaching, 2(3), 176-186. doi:10.1002/tea.3660020306
Piaget, J. (1973). Main trends in psychology. London, England: Allen and Unwin.
Pruitt, R. (2011). Stay true or start new: Dichotomy in first year kindergarten teacher
experiences. Curriculum and Teaching Dialogue, 13(1-2). Retrieved from
https://www.questia.com/library/journal/1G1-284325108/stay-true-or-start-new-
dichotomy-in-first-year-kindergarten
Ray, K., & Smith, M. C. (2010). The kindergarten child: What teachers and administrators need
to know to promote academic success in all children. Early Childhood Education
Journal, 38(1), 5–18. doi:10.1007/s10643-010-0383-3
Robins, J. M. (1999). Marginal structural models versus structural nested models as tools for
causal inference. In M. E. Halloran & D. Berry (Eds.), Statistical models in epidemiology,
the environment, and clinical trials (pp. 95–134). New York, NY: Springer.
129
Rosenbaum, P. R. (1987). The role of a second control group in an observational
study. Statistical Science, 2(3), 292–316.
Rosenbaum, P. R., & Rubin, D. B. (1983). The central role of the propensity score in
observational studies for causal effects. Biometrika, 70, 41–55.
doi:10.1093/biomet/70.1.41
Rosenbaum, P. R., & Rubin, D. B. (1984). Reducing bias in observational studies using
subclassification on the propensity score. Journal of the American Statistical Association,
79, 516–524. doi:10.1080/01621459.1984.10478078
Rousseau, J. J.(1979). Emile, or, on education (A. D. Bloom, Trans.). New York, NY: Basic
Books. [Original work published 1762]
Rowan, B., Correnti, R., & Miller, R. (2002). What large-scale, survey research tells us about
teacher effects on student achievement: Insights from the Prospects study of elementary
schools. Teachers College Record, 104, 1525-1567.
Rubin, D. (1978). Bayesian inference for causal effects: The role of randomization. The Annals
of Statistics, 6, 34–58.
Rubin, J. S. (1989). The Froebel-Wright kindergarten connection: A new perspective. Journal of
the Society of Architectural Historians, 48(1), 24–37. doi:10.2307/990404
Russell, J. L. (2011). From child’s garden to academic press: The role of shifting institutional
logics in redefining kindergarten education. American Educational Research Journal,
48(2), 236–267. doi:10.3102/0002831210372135
Scheerens, J., & Hendriks, M. (2014). State of the art of time effectiveness. In J. Scheerens (Ed.),
Effectiveness of time investments in education (pp. 7–29). doi:10.1007/978-3-319-00924-
7_2
Schweinhart, L. J., Montie, J., Xiang, Z., Barnett, W. S., Belfield, C. R., & Nores, M. (2005).
Lifetime effects: The High/Scope Perry Preschool study through age 40. Retrieved from
130
High/Scope® Educational Research Foundation website:
http://www.highscope.org/file/Research/PerryProject/specialsummary_rev2011_02_2.pdf
Schweinhart, L. J., & Weikart, D. P. (1997). The High/Scope preschool curriculum comparison
study through age 23. Early Childhood Research Quarterly, 12(2), 117-143.
doi:10.1016/S0885-2006(97)90009-0
Schweinhart, L. L., Weikart, D. P., & Larner, M. B. (1986). Consequences of three preschool
curriculum models through age 15. Early Childhood Research Quarterly, 1(1), 15-45.
doi:10.1016/0885-2006(86)90005-0
Sherman, C. W., & Mueller, D. P. (1996, June). Developmentally appropriate practice and
student achievement in inner-city elementary schools. Paper presented at Head Start’s
Third National Research Conference. Washington, DC. Retrieved from
http://files.eric.ed.gov/fulltext/ED401354.pdf
Skinner, B. F. (1972). Beyond freedom and dignity. New York, NY: Bantam Books.
Smith, L. (2002). Piaget’s model. In U. Goswami (Ed.), Blackwell handbook of childhood
cognitive development (pp. 394-411). Malden, MA: Blackwell.
Smith, G., & James, T. (1975). The effects of preschool education: Some American and British
evidence. Oxford Review of Education, 1(3), 223-240. doi:10.1080/0305498750010305
Stipek, D. (2002). Motivation to learn: From theory to practice (4th
ed.). Needham Heights, MA:
Allyn & Bacon.
Stipek, D. , & Byler, P. (1997). Early childhood education teachers: Do they practice what they
preach? Early Childhood Research Quarterly, 12(3), 305-325. doi:10.1016/S0885-
2006(97)90005-3
Stipek, D., & Byler, P. (2004). The early childhood classroom observation measure. Early
Childhood Research Quarterly, 19, 375–397. doi:10.1016/j.ecresq.2004.07.007
131
Stipek, D., Daniels, D., Galluzzo, D., & Milburn, S. (1992). Characterizing early childhood
education programs for poor and middle-class children. Early Childhood Research
Quarterly, 7(1), 1-19. doi:10.1016/0885-2006(92)90015-Q
Stipek, D., Feiler, R., Daniels, D., & Milburn, S. (1995). Effects of different instructional
approaches on young children’s achievement and motivation. Child Development, 66(1),
209–223. doi:10.2307/1131201
Stone, S. J. (1995). Integrating play into the curriculum. Childhood Education, 72(2), 104–107.
doi:10.1080/00094056.1996.10521856
Tyre, P. (2006). The new first grade: Too much too soon? Retrieved from
http://www.bethtfiloh.com/ftpimages/230/misc/misc_35033.pdf
U. S. Department of Health and Human Services, Administration for Children and Families,
Administration on Children, Youth and Families, Children’s Bureau. (2010). Child
maltreatment. Retrieved from http://www.acf.hhs.gov/programs/cb/resource/child-
maltreatment-2010
Van Horn, M. L., & Ramey, S. L. (2003). The effects of developmentally appropriate practices
on academic outcomes among former Head Start students and classmates, Grades 1-3.
American Educational Research Journal, 40(4), 961–990.
doi:10.3102/00028312040004961
Vartuli, S. (1999). How early childhood teacher beliefs vary across grade level. Early Childhood
Research Quarterly, 14(4), 489-514. doi:10.1016/S0885-2006(99)00026-5
Votruba-Drzal, E., Li-Grining, C. P., & Maldonado-Carreño, C. (2008). A developmental
perspective on full- versus part-day kindergarten and children’s academic trajectories
through fifth grade. Child Development, 79(4), 957–978. doi:10.1111/j.1467-
8624.2008.01170.x
Vygotsky, L. S. (1978). Mind and society: The development of higher mental processes.
Cambridge, MA: Harvard University.
132
Walberg, H. J., Niemiec, R. P., & Frederick, W. C. (1994). Productive curriculum time. Peabody
Journal of Education, 69(3), 86-100. doi:10.1080/01619569409538779
Walsh, D. J. (1991). Extending the discourse on developmental appropriateness. Early Education
and Development, 2, 109-119. doi:10.1207/s15566935eed0202_3
Walston, J., & West, J. (2004). Full-day and half-day kindergarten in the United States:
Findings from the Early Childhood Longitudinal Study, Kindergarten class of 1998-99.
Retrieved from US Department of Education, Institute of Education Sciences, National
Center for Education Statistics website:
https://nces.ed.gov/pubsearch/pubsinfo.asp?pubid=2004078
Watson, J. B. (1913). Psychology as the behaviorist views it. Psychological Review, 20(2), 158-
177. doi:10.1037/h0074428
Weber E. (1984). Ideas influencing early childhood education: A theoretical analysis. New
York, NY: Teachers College.
Weikart, D. P., Epstein, A. S., Schweinhart, L. J., & Bond, J. T. (1978). The Ypsilanti Preschool
Curriculum Demonstration Project: Preschool years and longitudinal results
(Monographs of the High/Scope Educational Research Foundation, 4). Ypsilanti, MI:
High/Scope.
Williams, L. (1994). Developmentally appropriate practice and cultural values: A case in point.
In B. L. Mallory & R. S. New (Eds.), Diversity and developmentally appropriate
practice: Challenges for early childhood education (pp. 155-165). New York, NY:
Teachers College.
Winfield, L. A. (1991). Resilience, schooling, and development in African-American youth: A
conceptual framework. Education and Urban Society, 24(1), 5-14.
doi:10.1177/0013124591024001001
Workman, E. (2013). Kindergarten policy characteristics. Retrieved from the Education
Commission of the States website: http://www.ecs.org/clearinghouse/01/06/80/10680.pdf
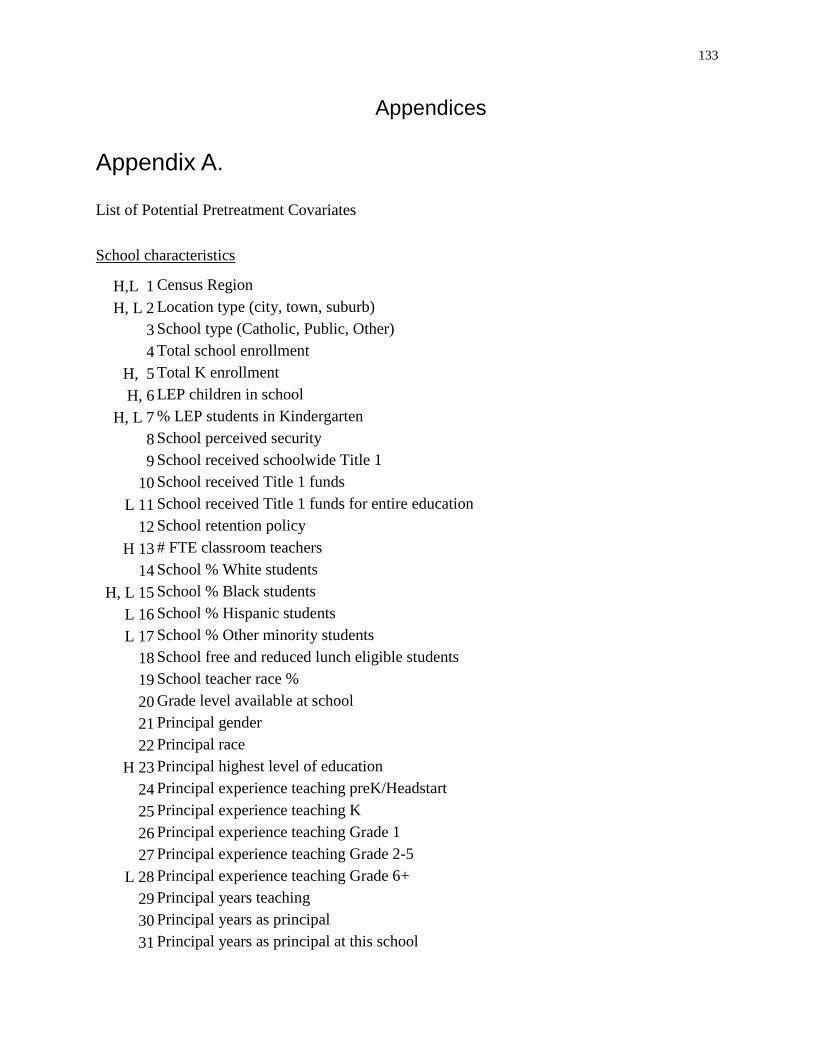
133
Appendices
Appendix A.
List of Potential Pretreatment Covariates
School characteristics
H,L 1 Census Region
H, L 2 Location type (city, town, suburb)
3 School type (Catholic, Public, Other)
4 Total school enrollment
H, 5 Total K enrollment
H, 6 LEP children in school
H, L 7 % LEP students in Kindergarten
8 School perceived security
9 School received schoolwide Title 1
10 School received Title 1 funds
L 11 School received Title 1 funds for entire education
12 School retention policy
H 13 # FTE classroom teachers
14 School % White students
H, L 15 School % Black students
L 16 School % Hispanic students
L 17 School % Other minority students
18 School free and reduced lunch eligible students
19 School teacher race %
20 Grade level available at school
21 Principal gender
22 Principal race
H 23 Principal highest level of education
24 Principal experience teaching preK/Headstart
25 Principal experience teaching K
26 Principal experience teaching Grade 1
27 Principal experience teaching Grade 2-5
L 28 Principal experience teaching Grade 6+
29 Principal years teaching
30 Principal years as principal
31 Principal years as principal at this school

134
32 Principal years teaching art or music
33 Principal years teaching bilingual ed
34 Principal years teaching ESL
35 Principal years teaching phys ed
36 Principal years teaching spec ed.
37 Principal courses in math pedagogy
38 Principal courses in reading pedagogy
L 39 Principal courses in science pedagogy
40 Principal courses in spec education
Teacher characteristics
41 Preschool read/math good for school (teacher belief, didactic)
42 Have child know alphabet before k (teacher belief, didactic)
43 Child should learn reading in k (teacher belief, didactic)
44 Parents should read to and play math games with child (teacher belief, developmental)
45 Classroom teacher gender L 46 Classroom teacher race 47 Classroom teacher age L 48 Classroom teacher certification type 49 Classroom teacher highest education level achieved H 50 Classroom teacher experience teaching pre-K 51 Classroom teacher experience teaching K 52 Classroom teacher experience teaching Grade 1 53 Classroom teacher experience teaching Grade 2-5 54 Classroom teacher experience 6+ Grade 55 Classroom teacher experience teaching at this school 56 Classroom teacher experience teaching ESL 57 Classroom teacher experience teaching Bilingual ed 58 Classroom teacher experience teaching art or music 59 Classroom teacher experience teaching Phys ed. 60 Classroom teacher experience teaching Spec ed. H, L 61 Classroom teacher # Early Ed courses H 62 Classroom teacher # Elementary ed courses H, L 63 Classroom teacher child development courses 64 Classroom teacher ESL college courses 65 Classroom teacher math pedagogy courses H 66 Classroom teacher reading pedagogy courses L 67 Classroom teacher science pedagogy courses 68 Classroom teacher spec ed courses
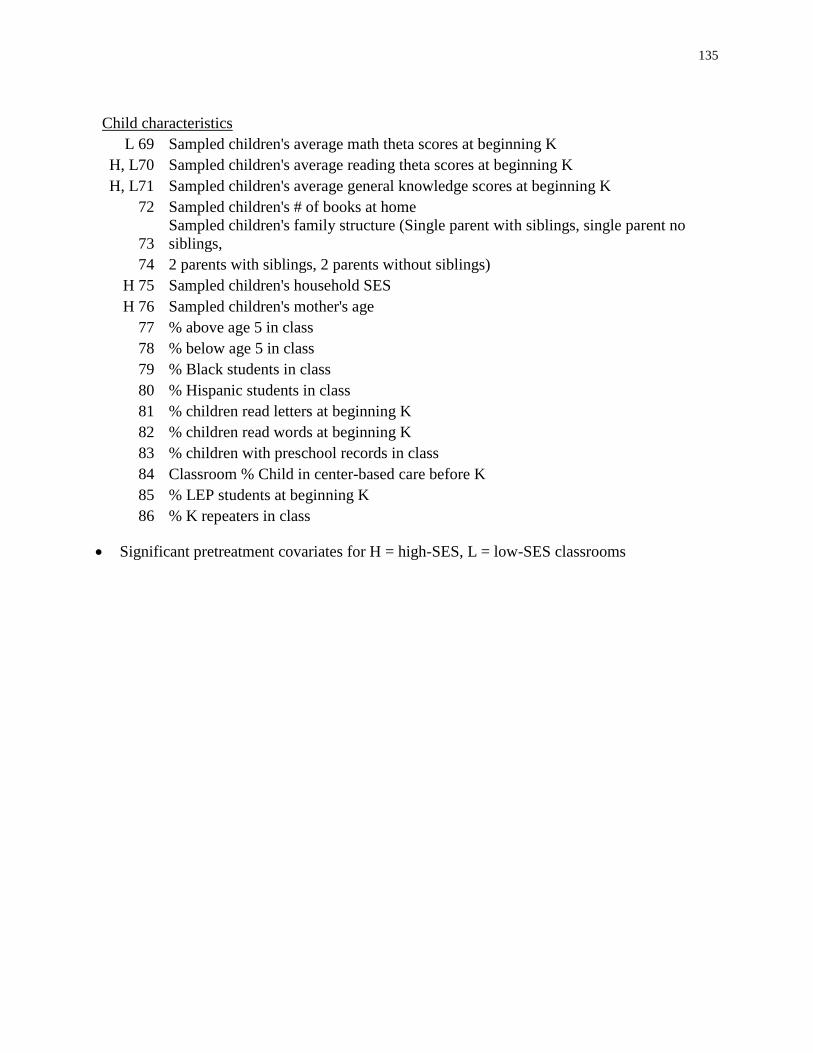
135
Child characteristics
L 69 Sampled children's average math theta scores at beginning K
H, L70 Sampled children's average reading theta scores at beginning K
H, L71 Sampled children's average general knowledge scores at beginning K
72 Sampled children's # of books at home
73
Sampled children's family structure (Single parent with siblings, single parent no
siblings,
74 2 parents with siblings, 2 parents without siblings)
H 75 Sampled children's household SES
H 76 Sampled children's mother's age
77 % above age 5 in class
78 % below age 5 in class
79 % Black students in class
80 % Hispanic students in class
81 % children read letters at beginning K
82 % children read words at beginning K
83 % children with preschool records in class
84 Classroom % Child in center-based care before K
85 % LEP students at beginning K
86 % K repeaters in class
Significant pretreatment covariates for H = high-SES, L = low-SES classrooms
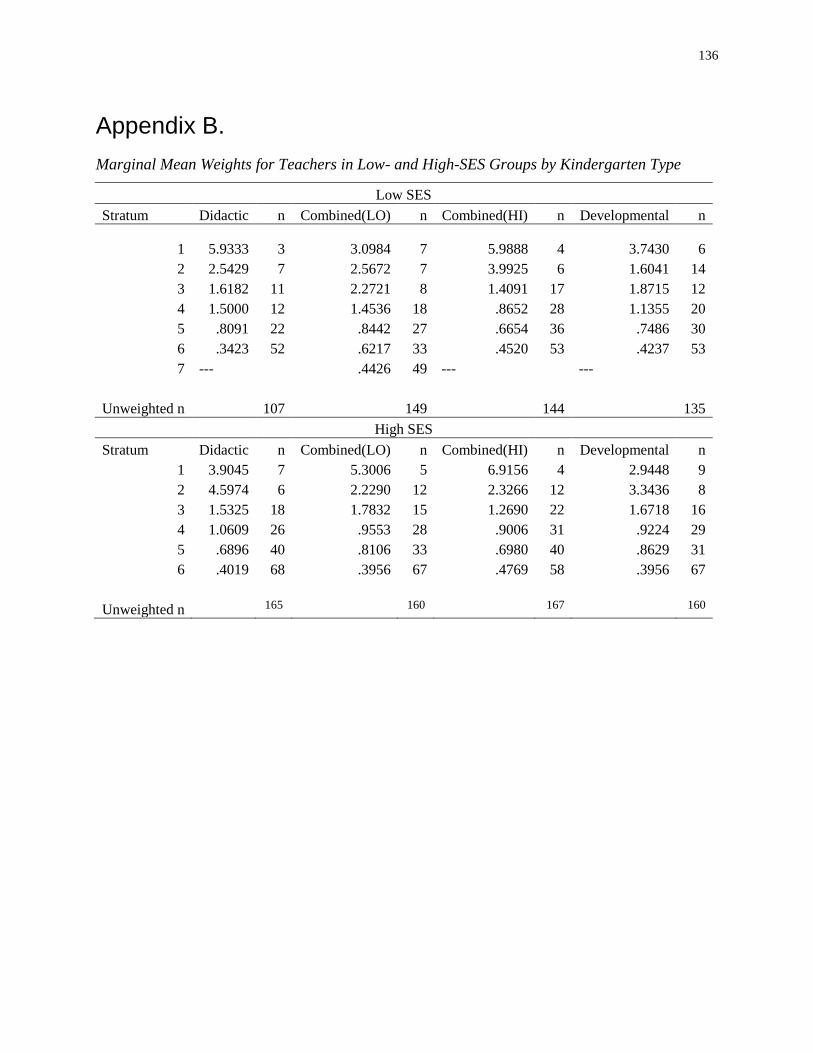
136
Appendix B.
Marginal Mean Weights for Teachers in Low- and High-SES Groups by Kindergarten Type
Low SES
Stratum Didactic n Combined(LO) n Combined(HI) n Developmental n
1 5.9333 3 3.0984 7 5.9888 4 3.7430 6
2 2.5429 7 2.5672 7 3.9925 6 1.6041 14
3 1.6182 11 2.2721 8 1.4091 17 1.8715 12
4 1.5000 12 1.4536 18 .8652 28 1.1355 20
5 .8091 22 .8442 27 .6654 36 .7486 30
6 .3423 52 .6217 33 .4520 53 .4237 53
7 ---
.4426 49 ---
---
Unweighted n 107 149 144 135
High SES
Stratum Didactic n Combined(LO) n Combined(HI) n Developmental n
1 3.9045 7 5.3006 5 6.9156 4 2.9448 9
2 4.5974 6 2.2290 12 2.3266 12 3.3436 8
3 1.5325 18 1.7832 15 1.2690 22 1.6718 16
4 1.0609 26 .9553 28 .9006 31 .9224 29
5 .6896 40 .8106 33 .6980 40 .8629 31
6 .4019 68 .3956 67 .4769 58 .3956 67
Unweighted n 165 160 167 160
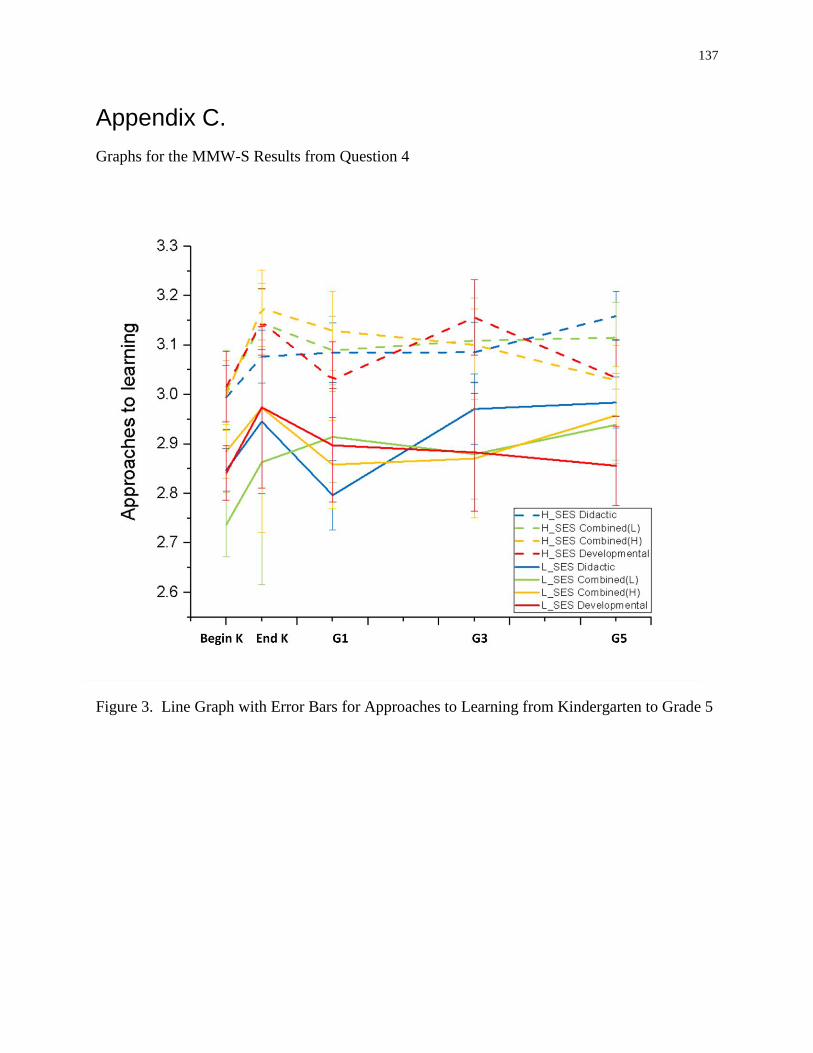
137
Appendix C.
Graphs for the MMW-S Results from Question 4
Figure 3. Line Graph with Error Bars for Approaches to Learning from Kindergarten to Grade 5
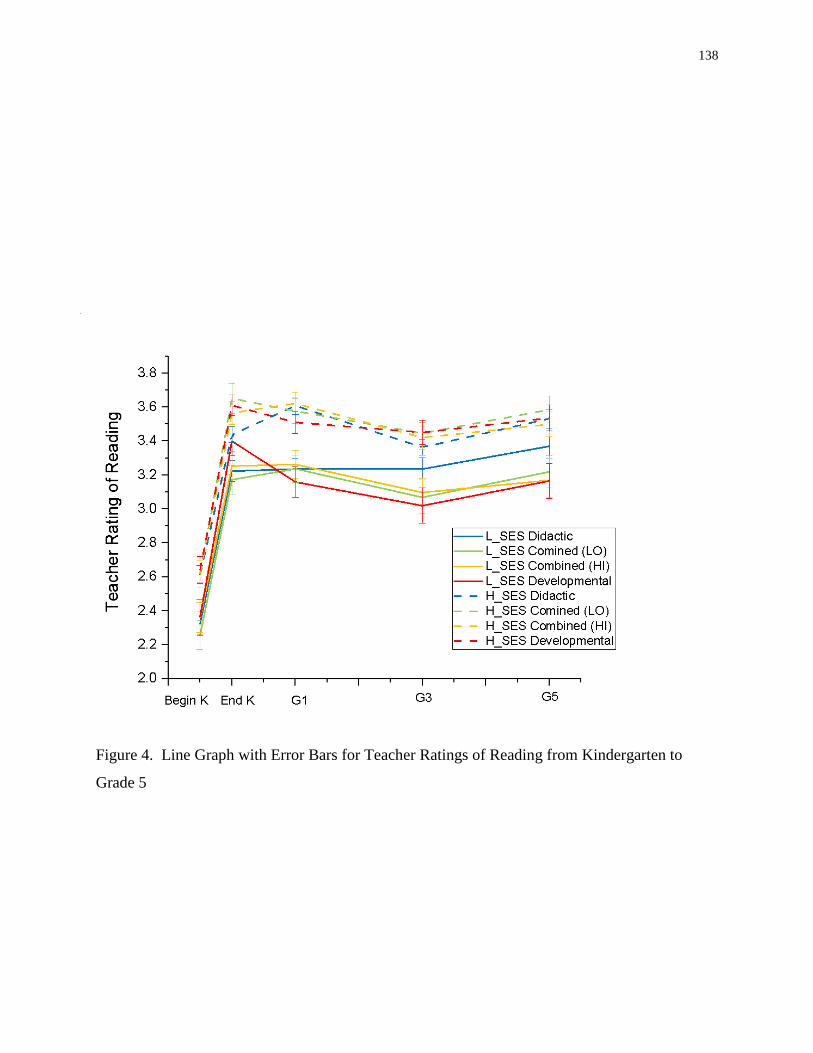
138
Figure 4. Line Graph with Error Bars for Teacher Ratings of Reading from Kindergarten to
Grade 5
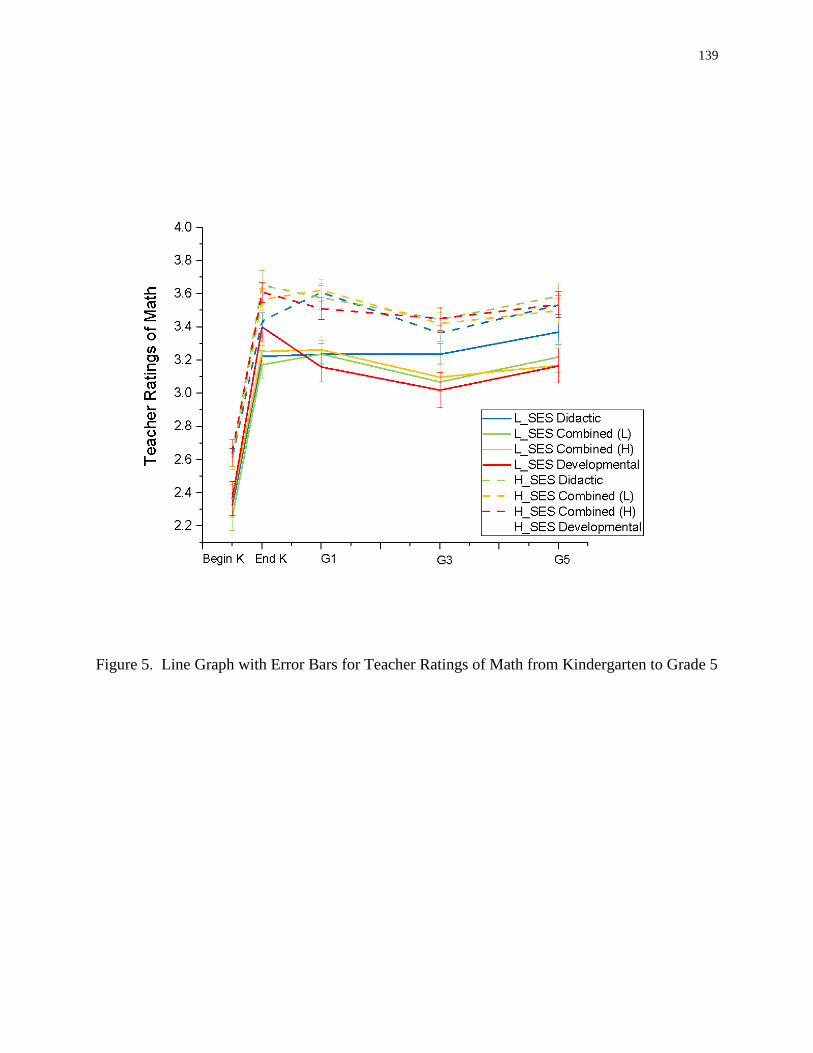
139
Figure 5. Line Graph with Error Bars for Teacher Ratings of Math from Kindergarten to Grade 5
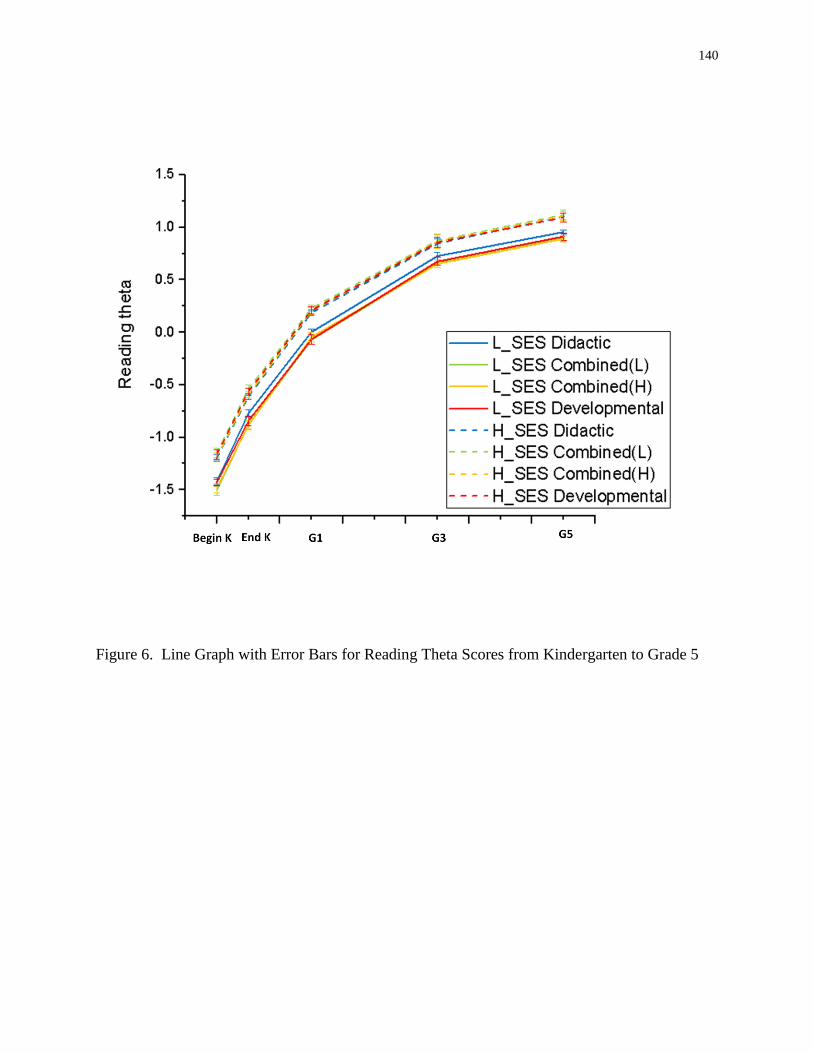
140
Figure 6. Line Graph with Error Bars for Reading Theta Scores from Kindergarten to Grade 5
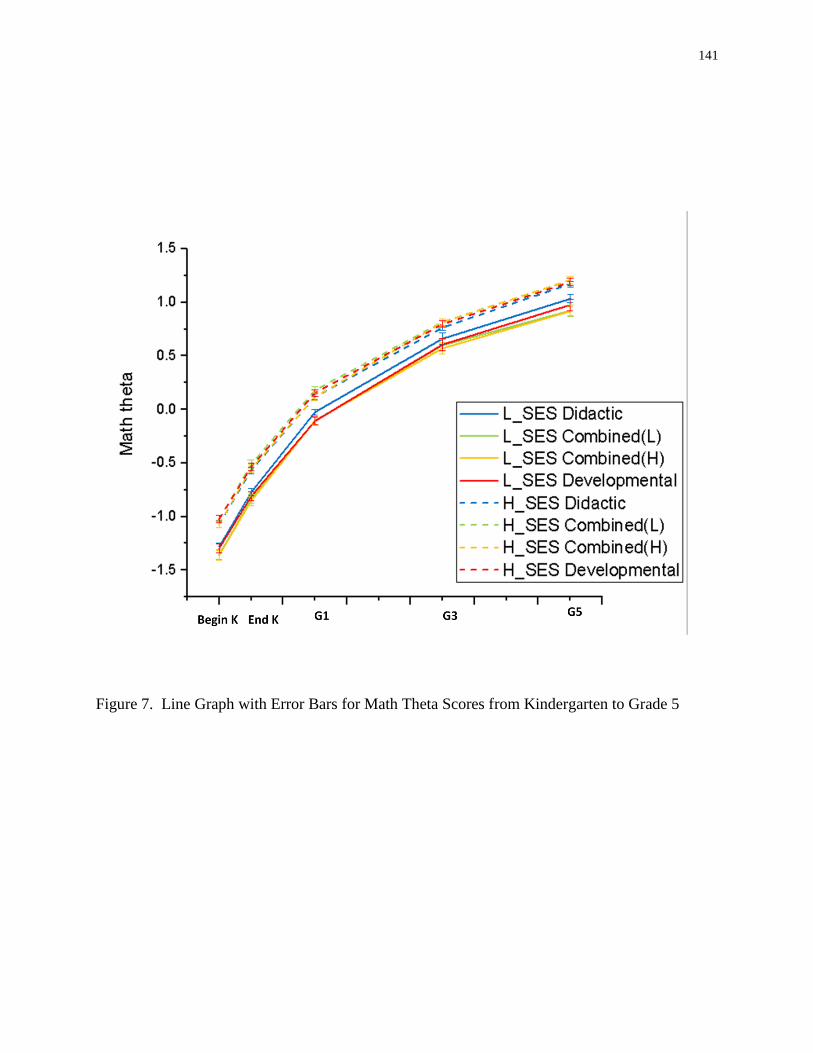
141
Figure 7. Line Graph with Error Bars for Math Theta Scores from Kindergarten to Grade 5